transit asset management (tam) pilot program · pas 55 and iso 55000 in addition to map-21, there...
TRANSCRIPT

Transit Asset Management (TAM) Pilot Program
FTA-2011-004-TPM Volume 1 – Asset Inventory and Condition Assessment Guide
September 2013TBG091712092129MKE


Table of Contents
Section Page
1 Introduction...................................................................................................................................... 1-1 1.1 RTA and the Transit Service Boards................................................................................................. 1-1 1.2 TAM Description and FTA Grant ...................................................................................................... 1-2 1.3 MAP-21 and NTD Reporting Requirements..................................................................................... 1-2 1.4 PAS 55 and ISO 55000...................................................................................................................... 1-3 1.5 Purpose from an Agency Perspective.............................................................................................. 1-3
2 Asset Management in RTA Region ..................................................................................................... 2-1 2.1 Transit Asset Management System ................................................................................................. 2-1 2.2 Evolution of Asset Management in the RTA Region........................................................................ 2-2
2.2.1 2000’s and Earlier: �apital Needs List................................................................................. 2-2 2.2.2 2009: Baseline Assessment using Age-Based Quintiles...................................................... 2-3 2.2.3 2011: Repeatable Asset Condition Update Process ........................................................... 2-4
2.3 RT!’s �apital Optimization Support Tool ........................................................................................ 2-6
3 “How To” Guide To �uild and Update an !sset Inventory ................................................................... 3-1 3.1 Uses of an Inventory........................................................................................................................ 3-1 3.2 Inventory Development................................................................................................................... 3-2 3.3 Asset Hierarchy................................................................................................................................ 3-2 3.4 Asset Inventory Fields...................................................................................................................... 3-7 3.5 Data Collection ................................................................................................................................ 3-7
3.5.1 Resources............................................................................................................................ 3-7 3.5.2 Populating the Inventory.................................................................................................... 3-7 3.5.3 Life Cycle and Cost Assumptions ........................................................................................ 3-8
3.6 Quality Checks ............................................................................................................................... 3-10 3.7 Data Sharing................................................................................................................................... 3-12 3.8 Continuous Improvements ............................................................................................................ 3-13 3.9 Inventory Update Schedule ........................................................................................................... 3-13
4 “How To Guide to” �onduct a �ondition !ssessment ......................................................................... 4-1 4.1 FTA Condition Assessment Philosophy............................................................................................ 4-1 4.2 Approaches to Condition Assessment............................................................................................. 4-2
4.2.1 Age-Based Quintiles............................................................................................................ 4-2 4.2.2 Decay Curves ...................................................................................................................... 4-3 4.2.3 Sampling Observations ....................................................................................................... 4-5
4.3 SGR Monitoring and Performance Measures.................................................................................. 4-5 4.4 Recommendations for Given Situation............................................................................................ 4-6 4.5 Decay Curve Calibration Process ..................................................................................................... 4-7
5 “How to Guide to” �onduct Sampling of !ssets.................................................................................. 5-1 5.1 What Is Sampling And Why Is It Meaningful? ................................................................................. 5-1 5.2 Setting Up a Sampling Plan.............................................................................................................. 5-1 5.3 Condition Assessment Criteria and Tools ........................................................................................ 5-3
5.3.1 Condition Rating Checklists ................................................................................................ 5-3 5.3.2 Condition Rating Definitions............................................................................................... 5-3 5.3.3 Composite Scoring.............................................................................................................. 5-5
5.4 Executing the Sampling Site Visits ................................................................................................... 5-6 5.5 Integration of Sampling Data into Inventory................................................................................... 5-6
INVENTORY AND CONDITION ASSESSMENT “HOW TO” GUIDE i

CONTENTS
Appendix A: Glossary and Abbreviations ................................................................................................... A-1
Appendix B: Sample Data Field Definitions................................................................................................ B-1
Appendix C: Major Useful Life Assumptions .............................................................................................. C-1
Appendix D: Condition Rating Definitions.................................................................................................. D-1
Appendix E: Assessment Forms .................................................................................................................E-1
Tables Table 1: Representative Service Board Resources and Transit Service Provided (2012) ..........................................1-1 Table 2: Example of Asset Inventory Hierarchy.........................................................................................................3-2 Table 3: Example of FTA TERM Classifications for Bus Maintenance Facilities .........................................................3-4 Table 4: Definitions of Soft and Contingency Costs for the RTA ...............................................................................3-9 Table 5: Inventory Quality Validation Approaches..................................................................................................3-10 Table 6: Inventory Data Issues.................................................................................................................................3-11 Table 7: Inventory Statistics for RTA........................................................................................................................3-13 Table 8: Condition Rating Levels................................................................................................................................4-1 Table 9: Condition Approaches and Application .......................................................................................................4-2 Table 10: Number of Data Points for a Given Asset Type .........................................................................................4-9 Table 11: Sample Condition Rating Checklist ............................................................................................................5-4 Table 12: Sample Condition Rating Definitions .........................................................................................................5-5
Figures
Figure 1: RTA Transit Asset Management Drivers, Processes and Asset Lifecycle ....................................................2-1 Figure 2: TAM Elements at RTA .................................................................................................................................2-2 Figure 3: Relationship between the Asset Condition Assessment and COST Processes ...........................................2-6 Figure 4: Asset Inventory Development Steps...........................................................................................................3-2 Figure 5: Four Level TERM Asset Inventory ...............................................................................................................3-3 Figure 6: RTA Example of Annual Updates Following Baseline Assessment ...........................................................3-14 Figure 7: Age-Based Condition Rating Scale (Stepwise condition rating based on remaining useful life) ................4-3 Figure 8: Example of Age-Based Quintiles Condition Output....................................................................................4-3 Figure 9: Asset Decay Curve Example........................................................................................................................4-4 Figure 10: Replacement Needs versus Asset Conditions...........................................................................................4-5 Figure 11: Condition Assessment Approaches in Support of Overall Maintenance Strategy ...................................4-7 Figure 12: Decay Curve for Motor Bus (40 ft)............................................................................................................4-8 Figure 13: Impact of Preventive Maintenance on Asset Decay Curve.......................................................................4-9 Figure 14: On-Site Sampling - Examples ....................................................................................................................5-1 Figure 15: Asset Sampling Delivery Process ..............................................................................................................5-2
ASSET INVENTORY AND CONDITION ASSESSMENT GUIDE ii
1 Introduction 1.1 RTA and the Transit Service Boards The Regional Transportation Authority of Northeastern Illinois (RTA) is the oversight, funding, and regional planning agency for the three transit operators (also known as Service Boards) that serve Northeastern Illinois:
Chicago Transit Authority (CTA) –nation's second largest public transportation system. The CTA service area covers the City of Chicago and 40 surrounding communities. Through its bus and rail systems, it provides more than 80 percent of the public transit trips in the six-county Chicago metropolitan area (Cook, DuPage, Will, Lake, Kane, and McHenry counties) either with direct service or connecting service to Metra and Pace.
Metra – commuter rail agency. Metra serves more than 100 communities in the six counties with 241 stations on 11 lines running from �hicago’s downtown;
Pace – suburban bus and regional paratransit. Pace is the suburban transit provider for the Chicago area. Pace serves riders with fixed bus routes, vanpools, and Dial-a-Ride programs covering 3,500 square miles spread over six counties and 284 municipalities. Pace is also the ADA paratransit provider for the region.
The RTA was created in 1974 by approval of a referendum by the residents RTA Mission of the six counties (Cook, DuPage, Will, Lake, Kane, and McHenry
The RTA will ensure financially counties). The RTA is a special-purpose unit of local government and a sound, comprehensive, coordinated municipal corporation of the State of Illinois. The three Service Boards -public transportation for the
each led by a Board of Directors - individually handle their respective Northeastern Illinois region.
transit operations and fare responsibilities.
The RTA regional system is the third largest in the country, covers approximately 7,200 route miles, and provides more than two million daily rides; The RT!’s combined assets include approximately 7,000 revenue vehicles, 380 rail stations, over 350 bus routes, and 60 maintenance facilities. With some of the nation’s oldest transit assets, the RTA also has significant reinvestment needs to attain and maintain a state of good repair (SGR).
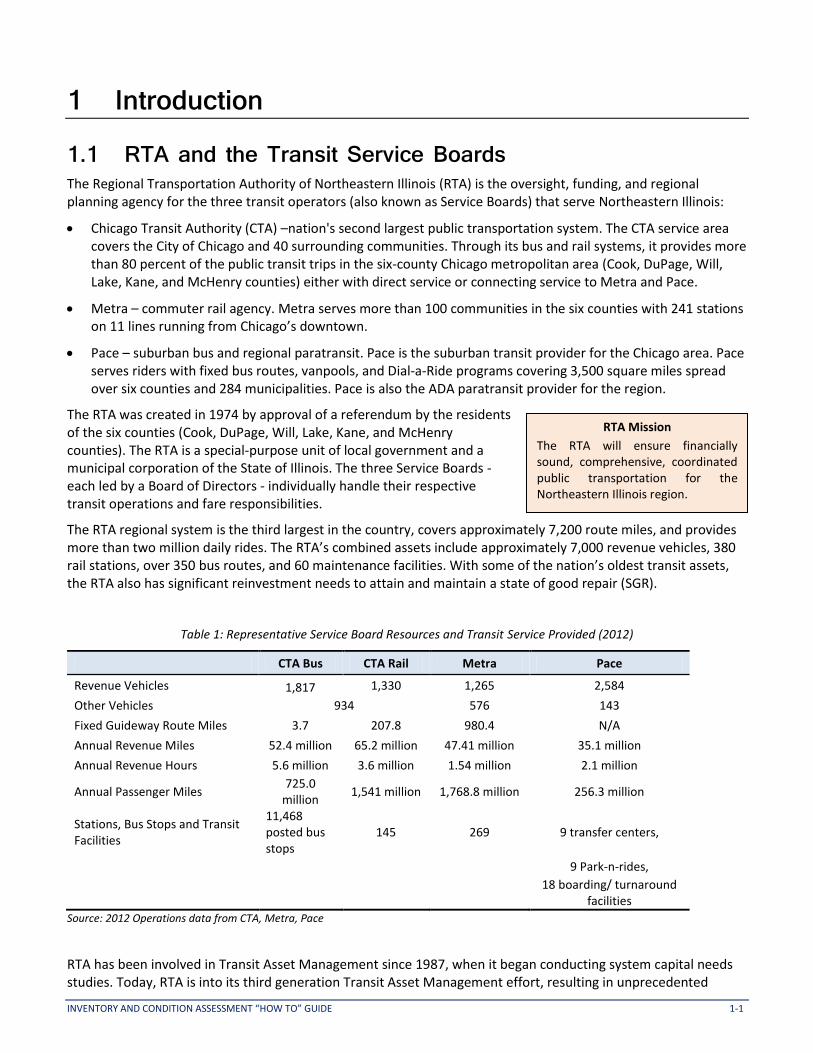
Table 1: Representative Service Board Resources and Transit Service Provided (2012)
CTA Bus CTA Rail Metra Pace
Revenue Vehicles 1,817 1,330 1,265 2,584
Other Vehicles 934 576 143
Fixed Guideway Route Miles 3.7 207.8 980.4 N/A
Annual Revenue Miles 52.4 million 65.2 million 47.41 million 35.1 million
Annual Revenue Hours 5.6 million 3.6 million 1.54 million 2.1 million
725.0 Annual Passenger Miles 1,541 million 1,768.8 million 256.3 million
million 11,468
Stations, Bus Stops and Transit posted bus 145 269 9 transfer centers,
Facilities stops
9 Park-n-rides,
18 boarding/ turnaround facilities
Source: 2012 Operations data from CTA, Metra, Pace
RTA has been involved in Transit Asset Management since 1987, when it began conducting system capital needs studies. Today, RTA is into its third generation Transit Asset Management effort, resulting in unprecedented
INVENTORY AND CONDITION ASSESSMENT “HOW TO” GUIDE 1-1

CHAPTER 1: INTRODUCTION
knowledge of its current backlog, condition of assets, and ability to forecast future replacement and rehabilitation needs.
In 2006, the RTA, along with the CTA, Metra and Pace, and its partners for Transit, launched a strategic planning project coined “Moving �eyond �ongestion” (M��); !mong other things, M�� allowed the RT! and the Service Boards to address critical questions about the condition and adequacy of the public transportation system, as well as the external factors, such as growing congestion. This strategic plan effectively launched the third generation of Transit Asset Management for the RTA and the Service Boards, several years before the Moving Ahead for Progress in the 21st Century (MAP-21) legislation came to fruition.
RT!’s current strategic plan for 2012-2016 is called “the Way Forward”; The strategic priority initiatives contained therein aim to focus on a state of good repair, reducing expenses, and increasing efficiencies.
1.2 TAM Description and FTA Grant In 2011, the RTA received an $800,000 Transit Asset Management (TAM) Pilot Project grant from the Federal Transit Administration (FTA). This pilot project includes TAM improvements that build off existing RTA TAM processes already underway, namely the Capital Asset Condition Assessment, Capital Optimization Support Tool (COST), and management approaches already in use. The objectives of RT!’s T!M grant include:
Document RT!’s existing policies; goals and objectives; performance targets and evaluation processes; and inventory/condition data collection, management, and reporting processes such that other local and regional operators can benefit from RT!’s experience;
Advance the T!M “state-of-the-art” capabilities in the areas of estimated capital investment needs and investment prioritization; and
Develop asset-to-project groupings using the analytical foundation provided by RT!’s existing project screening and prioritization process and FT!’s existing Transit Economic Requirements Model (TERM) model as a foundation for tool development.
The TAM Pilot Project is roughly a 25 month process for RTA. The TAM deliverables are documented in two volumes, which include:
Volume 1 – Asset Inventory and Condition Assessment Guide (this report)
Volume 2 – Capital Optimization Support Tool
This document presents the first “how to” guide on developing an asset inventory and conducting condition assessments. The intent is that this document will be helpful to other operators or funding agencies conducting similar tasks. The supplementary work papers are contained in Volume 2.
1.3 MAP-21 and NTD Reporting Requirements The 2012 legislation Federal Moving Ahead for Progress in the 21st Century Act
“Grantees are now required to (MAP-21) requires the FTA to establish a national transit asset management establish and use an asset system that includes: management system to develop
capital asset inventories and (1) A definition of state of good repair (SGR) with performance measures condition assessments and report
(2) A requirement that grantees develop transit asset management plans on the condition of their system as a whole”
(3) Reporting requirements for asset inventory and condition assessments – Administrator Rogoff
(4) Analytical process or decision support tools
(5) Technical assistance on asset management for grantees
ASSET INVENTORY AND CONDITION ASSESSMENT GUIDE 1-2

CHAPTER 1: INTRODUCTION
As of September 2013, the FTA has just issued the draft rulemaking concerning the legislation. The actual rulemaking is will be issued subsequent to the comment period.
The grantees will be expected to submit an annual report that outlines progress during the fiscal year towards the performance targets established for the past fiscal year and identifies performance targets for the next fiscal year. The grantees will have three months after the final rule to establish TAM performance targets in relation with the FTA measures.
In addition, MAP-21 establishes new National Transit Database (NTD) reporting requirements for grantees. It is anticipated that the grantees will have to provide data on operating and asset condition, replacement costs, and information on transit asset inventory and condition assessment. Because inventories, condition assessments, and decision support tools are explicitly cited in the legislation as new requirements, guidance documents such as this one and others funded by FTA take on new significance.
1.4 PAS 55 and ISO 55000 In addition to MAP-21, there are two other standards which may affect transit agency adoption and implementation of asset management systems. These are PAS 55 and ISO 55000.
The Institute Asset Management (IAM) led the development of Publicly Available Specification (PAS) 55 in 2004. The standard contains a specification for the optimized management of physical infrastructure assets, as well as guidelines to apply the standard. The standard is applicable to a wide range of infrastructure, including water, power, manufacturing, road, air and rail transport systems.
The International Standards Organization (ISO) has adopted PAS 55 as the basis for development of a new ISO 55000) series of international standards. The standards have an expected date of publication of 2014. When complete, the series will include three standards:
- ISO 55000 provides an overview of asset management and the standard terms and definitions
- ISO 55001 is the requirements specification for an integrated, effective management system for assets
- ISO 55002 provides guidance for implementation of the system
1.5 Purpose from an Agency Perspective For the purpose of this document, an agency is interpreted to be either a transit
Though the RTA is a operating agency, or a regional transit funding agency. Findings and
regional funding agency, recommendations are applicable to both types of agencies. this document is
applicable to individual The RTA has been involved in transit asset management 25 years now. RT!’s efforts transit agencies. are transparent and result in increasingly reliable levels of asset information.
Through the FTA TAM Pilot Project grant, the RTA has been able to significantly enhance several of its asset management processes, as well as document the practice for the benefit of others. The RTA created this document as the first of a two volume “how to” guide series to identify lessons learned and empirical experience; The RTA hopes that this condition assessment guide will help other agencies in two primary ways:
By providing a set of asset inventory development foundational elements for agencies who might be embarking on the development of their asset management inventories for the first time, or wishing to update and refine their inventories; and
ASSET INVENTORY AND CONDITION ASSESSMENT GUIDE 1-3

CHAPTER 1: INTRODUCTION
By explaining the main approaches, trade-offs involved, issues/options and steps involved for agencies wanting to conduct asset condition assessments and sampling.
ASSET INVENTORY AND CONDITION ASSESSMENT GUIDE 1-4

2 Asset Management in RTA Region 2.1 Transit Asset Management System The Transit Asset Management (TAM) System in place at RTA today is a product of a significant evolution that includes, among others:
Individual Service Board capital planning processes
RTA Strategic Plan – Moving Beyond Congestion (2006)
TAM-related State Legislation requirements (e.g., Public Act 95-0708, 2008)
Joint efforts between RTA and the Service Boards over the past 25+ years and unprecedented levels of collaboration in the last 5 years
The drivers, programs and processes that guide RT!’s Transit !sset Management System follow the typical transportation asset management cycle, from procuring new assets; to delivering assets and service performance; conducting condition assessments; and asset re-capitalization. The drivers and processes follow the asset lifecycle. They are illustrated in the boxes as illustrated in Figure 1 below.
Figure 1: RTA Transit Asset Management Drivers, Processes and Asset Lifecycle
RTA andService Boards,Moving Beyond
Congestion
StrategicPlanning
Vision andGoals
RTAPerformance
Targets
RTA andService Boards,
Capital AssetDatabase
RTARegional
PerformanceMeasures
RTASub-RegionalPerformance
Measures
RTA CapitalAsset Database
Condition Assessment
RTAAsset
ConditionRating
RTA Service Boards10 Year
Capital NeedAssessment
Multi YearNeeds Analysis(Asset Based)
MulticriteriaInvestmentPrioritization
Process
Asset toProject Mapping
ASSET RECAPITALIZATION/INVESTMENTASSET CONDITION ASSESSMENT
ASSETS DELIVERY AND SERVICE PERFORMANCEPROCUREMENT OF NEW ASSETS
Narrowing this to TAM-specific activities that need to be pursued on an ongoing basis, RT!’s T!M system is composed of the following three elements (Figure 2):
An ongoing regional transit asset inventory and condition assessment program – that is, a thorough understanding (database) of the RT!’s total asset base and characteristics, including condition;
A State of Good Repair (SGR) needs assessment process based on the inventory – that is, a means to project detailed and total needs based on inventory data and condition information, dollar-wise and time-wise such that the system stays in a State of Good Repair.
A project screening and prioritization capital development process, which uses the goals and objectives set in the RTA Strategic Plan to achieve optimum outcomes and links to an ongoing performance measurement program.
INVENTORY AND CONDITION ASSESSMENT “HOW TO” GUIDE 2-1

CHAPTER 2: ASSET MANAGEMENT IN RTA REGION
Figure 2: TAM Elements at RTA
Project
Screening
and
Prioritization
SGR
Needs
Assessment
Regional Asset Inventory
and Condition Assessment
Goals /
Objectives
Strengthening the nexus between each of these three elements is vitally important because each activity provides critical knowledge for the next. “�onnecting the dots” spans the spectrum from tactical information (e.g., actual asset condition) all the way to strategic decision making. RTA has worked with the Service Boards to gradually adopt best practices not only to strengthen the quality of each of the elements, but as new tools and techniques become available, to connect these elements in a manner that supports the RTA Strategic Plan.
The RTA, in conjunction with the three Service Boards, is continuing to develop a more systematic and integrated approach to TAM, including concurrent implementation of its Capital Asset Condition Assessment program and customization of its Capital Optimization Support Tool. This includes greater emphasis on performance measures.
The following section provides a more detailed history of the evolution of Asset Management in the RTA region.
2.2 Evolution of Asset Management in the RTA Region As mentioned in the previous chapter, RTA is currently in its third-generation TAM effort. This section retraces the history of asset management development at RTA.
2.2.1 2000’s and Earlier: Capital Needs List In 1987, the RT! completed a detailed examination of the transit system’s capital needs list; This effort developed the first comprehensive inventory of capital assets and an age-based estimate of capital renewal requirements, known as the RTA Bedrock Investment Program (BIP). BIP was a spreadsheet-based software tool to estimate both deferred and future capital needs for the Service Boards. The results of this analysis focused on the first Strategic Plan and served as a basis for legislative initiatives to increase the level of capital funding. BIP pioneered the development of the asset inventory based needs analysis on which FT!’s TERM was later founded.
In 1995, the RTA created the Transit Capital Asset Model (CAM) to (1) update the original asset inventory, (2) incorporate asset condition information from the extensive engineering assessments of CTA rail infrastructure, and (3) improve the model’s utility for the RT! and the Service �oards’ capital planning staff; This represented RT!’s second generation !sset Management development; CAM estimated current and future capital renewal needs and supported evaluation of the impact of various funding levels and renewal strategies on system conditions over time; �!M was developed in tandem with FT!’s Transit Economics Requirements Model (TERM) model, with many of the same capabilities.
In 2000, the RTA developed the Regional Transportation Asset Management System (RTAMS), a transportation information retrieval system; The system improved access to the region’s enormous transportation data resources being gathered by the RTA, its Service Boards, and other regional transportation and planning agencies.
ASSET INVENTORY AND CONDITION ASSESSMENT GUIDE 2-2

CHAPTER 2: ASSET MANAGEMENT IN RTA REGION
In July 2006, the RTA, along with the Service Boards and its Partners for Transit, launched Moving Beyond Congestion (MBC), a strategic planning initiative meant to raise awareness about the need to maintain, enhance, and expand transit service as well as to solicit input from key stakeholders and the general public. MBC provided the foundation for the subsequent funding and reform legislation enacted in 2008 and 2009. The legislation mandated that the RTA provide more effective financial oversight, regional planning, and coordination among the three operating Service Boards. In addition, the RTA is now required to prepare a Strategic Plan at least every five years consistent with the Chicago Metropolitan !gency for Planning’s Comprehensive Plan. This process involves a multilayered approach to determine which capital projects become programmed in the five year Capital Plan and Annual Budgets. This consists of a screening process that groups potential projects into related types of investments (e.g., preservation, expansion, or enhancement); prioritizes projects based on customer impacts, mission criticality, ridership impacts, and benefit-cost analysis; and evaluates additional criteria, such as project readiness, to determine the actual programming.
Efforts to complete MBC Strategic Plan included the development of the RTA Performance Measures. It established performance standards and measurements regarding the adequacy, efficiency, and coordination of public transportation services in the region, and the implementation of the goals and objectives in the Strategic Plan. RTA is required to develop performance measures to inform the public about the extent to which the provision of public transportation in the metropolitan region meets the goals, objectives, and standards for the RTA, the Service Boards, and the broader community of stakeholders and to reflect the adequacy and efficiency of public transportation services. In July of 2008, the RTA Board adopted Ordinance No. 2008-46 endorsing the work done by the RTA and Service Board task force on the regional performance measures and directed the Executive Director to begin collecting data and to report to the Board and publish the results for the eventual inclusion in the future comprehensive amendment to the strategic plan.
2.2.2 2009: Baseline Assessment using Age-Based Quintiles In 2008, the RTA initiated its third generation of Asset Management development – a condition assessment of the existing capital assets for each of the region’s three Service �oards: �T!, Metra, and Pace; These three agencies are diverse transit systems representing large to very large, newer and old systems, and most importantly, all competing for regional dollars that would ultimately only partially fund backlogs. While the challenges were significant, the Service Boards worked well together to undertake and complete the assessment in a cost-effective and timely manner. Some features of the process are described in greater detail below but, in short, the process included the following steps:
Established an Inventory Assessment Team
Reviewed other agency procedures
Defined/Categorized Assets (e.g.; Track & Structures, Signals/Communications/Fare Collection, Stations/Garages/Facilities, Rolling Stock)
Determined useful life and establish asset age quintile of each asset
Created asset inventory templates to include asset type, origination date, quantity, unit value/replacement cost and condition and populate the Inventory tables
Observed/sampled specific assets to verify condition based on asset age
Based on asset unit value/replacement cost, determined backlog and normal reinvestment over a given, agreed-upon period of ten years.
Initially, Service Boards collected data for each asset type, including description, location, quantity, age, replacement cost, and useful life. Condition was added based on age-based quintile calculations using a 5 to 1 scale (first, second, third and fourth quarters of useful life plus “past” useful life); In addition, the effort created a relational database for recording, maintaining, and reporting asset information. Representatives from the Service Boards assisted in all aspects of this process including: the design and development of the inventory tables, the condition ratings system based on useful life and industry standards, the definition of “State of Good Repair (SGR)”, the sampling plan and sampling data; !sset Information Teams were
ASSET INVENTORY AND CONDITION ASSESSMENT GUIDE 2-3

CHAPTER 2: ASSET MANAGEMENT IN RTA REGION
formed to design and develop the industry framework. Each Asset Information Team consisted of members representing the RTA, the Service Board and the consultant team. For discussion purposes at the Asset Information Team meetings, assets were grouped into five asset types:
Track and Structures
Electrical/Subway Equipment
Signals/Communications/Fare Collection
Stations/Garages/Facilities
Rolling Stock
The effort provided the RTA with a plan for capital asset condition assessment and established administrative criteria for the capital replacement, rehabilitation, and maintenance of assets. In 2010, the RTA published the initial report on the capital asset condition assessment (referred to as the Baseline Assessment). The report summarized the results of the 18-month collaborative effort to assess the general condition of the region’s capital assets as of December 31, 2009 and to determine valuation, backlog, and capital needs over 10 years. The initial 10-year capital needs assessment was based on cost components for backlog, normal replacement, and capital maintenance.
During the Baseline Assessment, the RTA and Service Boards determined that an asset’s age could act as the primary “predictor” of an asset’s condition; This approach reflected the best approach possible among the Service Boards while taking into consideration the limited resources of each Service Board and the level of effort required to undertake the overall assessment. While availability of in-depth information and data was unavailable for each asset for the Service Boards, sufficient data was collected, and satisfactory age estimates were established for nearly all assets.
During the process of compiling data for the age-based inventory tables, a number of asset groups were FT!’s Transit Economic Requirements Model (TERM)
selected for an extremely limited on-site sampling TERM is a national level transit capital investment needs
effort. The sampling, representing less than 1% of each analysis tool. The FTA developed TERM to assess both the
asset class, was meant to test the degree of consistency size of the nation’s state of good repair backlog and the level of investment required to address both the backlog between asset age and the condition of assets in actual and normal (ongoing) reinvestment needs. The FTA then field conditions. For the most part, though not all cases, reports those needs to Congress via the Conditions and
the results of the limited sampling did generally confirm Performance Report. The RTA benefits from TERM in
the condition rating process based on asset age. several ways:
Condition measures and the related asset curves used to assess RTA’s regional transit asset conditions were 2.2.3 2011: Repeatable Asset developed for use in TERM. Condition Update Process The hierarchy of asset types used to develop the inventory framework for the assessment of regional In 2011, the RTA started a 5-year effort to annually investments needs was derived from TERM. update the Baseline Assessment. The process used in
RT!’s �apital Optimization Support Tool was initially the Capital Asset Condition Assessment Updates developed as a modified and customized version of
(referred to as the Condition Assessment Updates) TERM. While COST continues to benefit from
closely aligns to that used by the FTA and other industry advances in TERM’s design, the reverse is also true peers. As part of the conversion of the separate (TERM continues to benefit from development inventories, individual asset line items were assigned to advances of COST). the detailed asset type codes and related asset
While TERM is used by the FTA for a national level of inventory hierarchy utilized by the FT!’s TERM. Use of
analysis of SGR and 20-year projections of reinvestment this TERM-based asset type mapping ensures that asset needs, TERM Lite is a local version of TERM designed for documentation and the assessment of the RTA and transit agencies to forecast and prioritize local and Service Board reinvestment needs is consistent with regional capital needs. forthcoming FTA asset reporting requirements and
ASSET INVENTORY AND CONDITION ASSESSMENT GUIDE 2-4

CHAPTER 2: ASSET MANAGEMENT IN RTA REGION
emerging industry asset reporting standards.
Using FT!’s TERM asset inventory hierarchy enables the RT! to apply the FT!’s asset decay curves based on national data. The FT! has developed “generic” transit asset decay curves for major asset types using condition data collected from transit agencies nationwide. These curves predict asset physical condition as a function of age, maintenance history, and other factors on a common 5 to 1 rating scale. Sources for this information can be found at http://www.fhwa.dot.gov/policy/2002cpr/appc.htm.
The decay curve approach to estimate asset condition represents a shift from the prior approach used in the Baseline Assessment, which relied purely on age-based useful life quintiles (i.e., first quintile for first quarter of asset life, second quintile for second quarter of asset life, and so forth up to fifth quintile for assets exceeding their life). Using the decay curve approach, asset condition is estimated on an empirically derived continuum of physical condition, as opposed to age, to help develop a regional distribution of asset conditions and prioritize asset replacement.
Similar to the Baseline Assessment, on-site samplings of actual transit asset conditions were completed to assess the region’s transit assets as a part of this Condition Assessment Update. The objective of these condition assessments (still ongoing) is to both validate and eventually recalibrate FT!’s decay curves to better reflect the asset deterioration characteristics of transit assets in the Chicago region. By recalibrating the curves to reflect the local operating environment, the RTA can improve the accuracy of its condition assessments.
The Update assessment process features a continuation of the close partnership between the RTA and the three Service Boards. An Asset Management Committee was formed at the beginning of the Update largely made up of the same members that had participated in the Baseline Assessments. Each Service Board assigns participation; generally the cadre of participants represents capital planning, finance, and operations. The Committee generally meets each month either at the RTA offices or at the Service Board offices to discuss ongoing issues, the results of current research topics, and the status of current Update and needs modeling efforts.
Meanwhile, RTA, working with the Service Boards, developed the current strategic plan for 2012-2016 called “the Way Forward”; The strategic priority initiatives contained therein aim to focus on a state of good repair, reducing expenses, and increasing efficiencies. Transit Asset Management supports all five key strategic priorities, which are:
Strategic capital investments
Economies of scale
Maximize use of the system
Enhanced customer experience
Coordinated government affairs, marketing and outreach
The RTA has completed its 2012 Capital Asset Condition Assessment Update report; The document is intended to serve as RT!’s annual snapshot of conditions and needs, an annual repeatable process.
ASSET INVENTORY AND CONDITION ASSESSMENT GUIDE 2-5
CHAPTER 2: ASSET MANAGEMENT IN RTA REGION
2.3 RTA’s Capital Optimization Support Tool The RT!’s new Capital Optimization Support Tool (COST) provides the RTA and the Service �oards an improved ability to both assess the region’s capital reinvestment needs and then prioritize those needs subject to the region’s long-term strategic objectives. In April 2011, the RTA and the Service Boards initiated development of COST. This decision support tool uses asset inventory data collected through the Condition Assessment Update process to assess and prioritize transit capital investment needs subject to regional funding capacity and long-term strategic objectives.
COST provides a unique perspective and understanding – particularly as they relate to long-term reinvestment needs – that other types of analyses cannot. For example, detailed onsite engineering condition assessments provide an excellent understanding of reinvestment needs and asset conditions as they exist today and how those conditions will impact near term reinvestment actions (e.g., as outlined in a capital improvement plan). However, condition assessments only provide a snapshot of needs and conditions as they exist at a specific point in time (today) and do so only for those assets included in the assessment. In contrast, COST is specifically designed to assess reinvestment needs and project asset conditions for all capital assets, and it does so over an extended time horizon of ten, twenty years or longer.
While currently focused solely on the assessment of regional reinvestment needs (i.e., preservation of the existing stock of transit assets), moving forward, COST will help the region identify an optimal balance between replacing aging infrastructure (maintain); improving the throughput, reliability, and safety of existing services (enhance); and adding new capacity to improve system performance (expand) – all within the confines of limited financial resources. At a more detailed level, COST will assist the RTA and the region to establish priorities within each of these types of needs (e.g., prioritizing between different asset replacement projects).
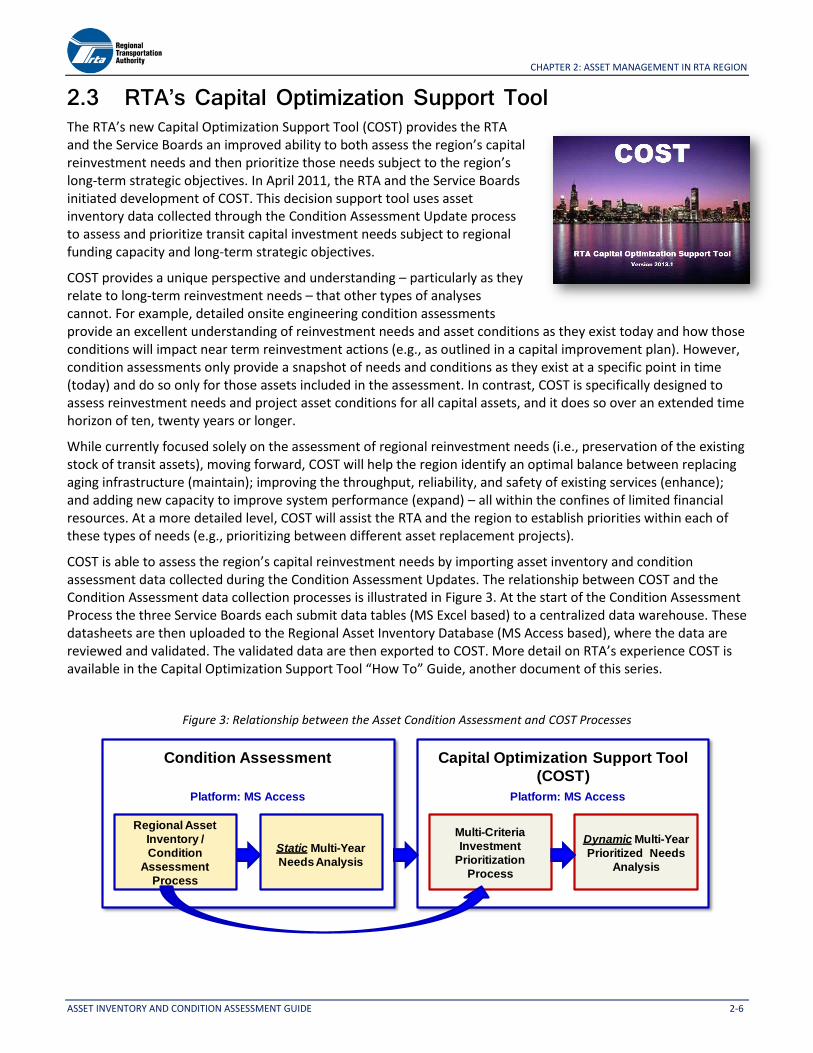
COST is able to assess the region’s capital reinvestment needs by importing asset inventory and condition assessment data collected during the Condition Assessment Updates. The relationship between COST and the Condition Assessment data collection processes is illustrated in Figure 3. At the start of the Condition Assessment Process the three Service Boards each submit data tables (MS Excel based) to a centralized data warehouse. These datasheets are then uploaded to the Regional Asset Inventory Database (MS Access based), where the data are reviewed and validated. The validated data are then exported to COST. More detail on RT!’s experience COST is available in the Capital Optimization Support Tool “How To” Guide, another document of this series.
Figure 3: Relationship between the Asset Condition Assessment and COST Processes
Multi-Criteria
Investment
Prioritization
Process
Dynamic Multi-Year
Prioritized Needs
Analysis
Capital Optimization Support Tool
(COST)
Platform: MS Access
Static Multi-Year
Needs Analysis
Regional Asset
Inventory /
Condition
Assessment
Process
Condition Assessment
Platform: MS Access
ASSET INVENTORY AND CONDITION ASSESSMENT GUIDE 2-6

3 “How To” Guide To Build and Update an Asset Inventory 3.1 Uses of an Inventory Asset inventories are critical for transit agencies in measuring SGR and forecasting reinvestment needs. With the recent Federal MAP-21 legislation, asset inventories are required for recipients of Federal funding support.
In practice, asset inventories mean different things to different users of the information within transit agencies. It is critical to appreciate this reality when building or refining an asset inventory. Four perspectives are presented.
From an accounting perspective, an asset inventory, registry, or ledger represents the official record of a business's current assets, including property owned. Typically, the financial accounting system would record a description of the asset, the purchase value, year of acquisition, number of units, and in-service status. Agencies must also comply with regulatory standards, such as GASB 34. Financial accounting systems also contain assumptions regarding depreciation. Often the financial accounting inventory level of detail is high-level and may not lend itself well to TAM as defined in this report. For instance, with new construction, an entire extension with multiple assets could be identified as a single record.
From a maintenance perspective, assets are what need to be maintained or replaced. The level of information varies significantly from asset to asset, depending on replacement practices (i.e., whether an asset is replaced at the component, assembly, or sub-assembly level) and other asset data. Asset data may require less granularity if handled by an outside contractor. Maintenance employees’ main tools include information contained on a work order, often accessible through a computerized maintenance management system. A detailed asset inventory, though not a day-to-day tool, is nonetheless a useful reference for maintenance personnel, particularly if integrated with the work order system.
From a capital planning perspective, the asset inventory represents the universe of the assets to be managed over time regardless of “owner”. Capital budgets are typically one and two year budgets, while capital plans typically span five or more years. Capital planning is interested in knowing when assets need to be replaced or rehabilitated, and how much investment will be required each year. Capital planning is also interested in knowing how asset replacement needs are to be converted into specific projects. More robust inventories and condition assessments help better plan capital reinvestment needs over an extended time horizon, including estimating and smoothing out spikes in the reinvestment program.
From a risk management perspective, the asset inventory is of interest to identify potential risks to public safety and reliability caused by overdue maintenance and capital replacement. Asset managers sometimes develop risk registers for this purpose. Lately, attention is being placed on mitigating global climate change impacts by flagging assets in susceptible areas.
An asset inventory is a living register. Every year, as new assets are purchased and brought into revenue service, or as ageing assets are retired, the inventory will change and should be updated accordingly.
Governmental Accounting Standards Board 34
(GASB 34)
GASB 34, issued in 1999, established new financial reporting standards for state, local, and special-purpose governments, such as transit agencies. Related to asset management, GASB 34 changed the way that state and local governments offer financial information to the public by requiring governments to use accrual accounting and report the value of their capital assets, including depreciation, in their annual reports. Accrual accounting measures not just current assets and liabilities but also long-term assets and liabilities (such as capital assets, including infrastructure, and general obligation debt). It also reports all revenues and all costs of providing services each year, not just those received or paid in the current year or soon after year-end.
Source: http://www.gasb.org/st/summary/gstsm34.html
INVENTORY AND CONDITION ASSESSMENT “HOW TO” GUIDE 3-1

CHAPTER 3: “HOW TO” GUIDE TO �UILD AND UPDATE AN ASSET INVENTORY
3.2 Inventory Development The foundation of the condition assessment process is a detailed asset inventory that documents the transit assets. Establishing the inventory database structure is important in order to ensure data collection consistency. In developing an inventory, it is critical to assess the objective of the inventory, its structure or hierarchy, the level of disaggregation needed, the condition rating scale and definitions, and compliance with regulatory (e.g. MAP-21 and GASB 34) and regional reporting requirements. Participation of staff from various departments and/or operators in the development process of the asset inventory improves consistency and leverages knowledge to inform the inventory framework.
As part of the Baseline Assessment, the RTA and its Service Boards established a comprehensive Regional Asset Inventory Database representing all asset categories of public transportation capital assets. It provided a forum for representatives from the Service Boards to assist in all aspects of the process including the design and development of the inventory tables, the condition ratings system based on useful life and industry standards, the definition of SGR, condition rating process, a sampling plan, and sampling data. The Condition Assessment Update maintained this inventory framework with some improvements.
The inventory development process can be summarized by a half dozen key steps summarized in Figure 4, below. Each is further detailed in this section.
Figure 4: Asset Inventory Development Steps
Establish Asset Hierarchy
Determine Asset Inventory Fields
Collect Data
Establish Lifecycle and Cost Assumptions
Perform Quality Checks
Continuous ImprovementUpdates
3.3 Asset Hierarchy RT!’s asset inventory is in fact three asset inventories, one for each Service Board. Each uses a hierarchical asset inventory structure that grouped all of the regions’ transit assets into five categories and related sub-categories, as appropriate and selected by the Service Board. These structures were chosen to be consistent with FT!’s practice. The first two levels of that structure are presented in Table 2.
Table 2: Example of Asset Inventory Hierarchy
Category Sub-Category
Facilities Buildings Equipment Storage Yard
Guideway Elements Track Structures Trackwork
Stations Bus Rail
ASSET INVENTORY AND CONDITION ASSESSMENT GUIDE 3-2

CHAPTER 3: “HOW TO” GUIDE TO �UILD AND UPDATE AN ASSET INVENTORY
Category Sub-Category
Systems Communications Traction Power ITS & Security Revenue Collection Train Control Utilities
Vehicles Revenue Vehicles Non-Revenue Vehicles
Ideally, the inventory hierarchy will be consistent with the Enterprise !sset Management’s hierarchy; This way, the information can be aggregated and disaggregated to suit the purpose.
Category Sub-Category Component Elements Sub-Element
(e.g., …) (e.g., …) (e.g., …) (e.g., …) (e.g., …)
Aggregate Disaggregate
It is important to note that there can be several overlapping inventory structures; the key if there are multiple structures is there be a crossover to the data can be aggregated and disaggregated for planning and reporting needs. In the case of RTA, there are essentially two sets of inventory structures: the one maintained by the Service �oards, and the one which the �apital Optimization Support Tool (�OST), which is close to FT!’s TERM Lite structure. Each Service Board structure was mapped to the COST structure so that capital reinvestment needs can be readily estimated. An example of the COST/TERM four level asset inventory is presented below in Figure 5.
Figure 5: Four Level TERM Asset Inventory
Guideway Elements
Facilities
Systems
Stations
Vehicles
Guideway Direct Fixation
Ballasted
Embedded
Special
Trackwork
Tangent
Curve
Station Tangent
Station Curve
Category Sub-Category Element Sub-Element
Using sub-categories, components, elements and sub-elements enables rolling up and grouping assets into higher level categories, while at the same time allowing for the inventorying of individual assets and their components. This ability to aggregate and disaggregate asset data is important since components may be in different condition and have different life cycle needs. Recording asset data down to the element level enables an agency to track the condition of its assets at the sub-category, component, and element level. This disaggregation also makes on-site sampling more straightforward.
Determining the correct level of disaggregation depends on the level of detail needed. Using the inventory for reporting would not require the same level of detail as would be required for using the inventory for capital and maintenance planning. Since different components of an asset may have different useful lives and could require intermediate replacement, capital and maintenance planning requires a more robust inventory with disaggregated data.
ASSET INVENTORY AND CONDITION ASSESSMENT GUIDE 3-3

CHAPTER 3: “HOW TO” GUIDE TO �UILD AND UPDATE AN ASSET INVENTORY
Over time, the inventory structure will evolve as more detailed information becomes available, and the process become more sophisticated. The hierarchical structure should be able to accommodate these changes.
Establishing the asset inventory hierarchy structure lays the foundation to document detailed transit assets; FT!’s hierarchy defines an asset by category, sub-category, element, and sub-element. For each unique asset, FTA assigns a five-digit detailed type code, as illustrated in Table 3; Many transit agencies have followed FT!’s lead and adopted FT!’s inventory structure or a similar “parent-child” structure. To enable integration between an inventory and TERM, it is recommended that an inventory includes a field that maps an inventory asset back to a TERM code. Note that an agency may itemize an asset that is not included in the TERM asset classifications.
What is the “Right” Level of Detail for an !sset
Inventory?
This is a common challenge. There are trade-offs involved in the level of detail selected and the level of effort to both produce the initial inventory and then to maintain it over time.
The level of detail should be commensurate with the decision support need requirements. By selecting a flexible hierarchical structure, an agency can start with a higher level inventory and gradually add granularity as data availability and needs arise.
One example with RTA was facilities, where initially facilities were reported at the highest level (i.e., the entire maintenance facility); then components were introduced.
Table 3: Example of FTA TERM Classifications for Bus Maintenance Facilities
Type Category Sub-Category Element Sub-Element
21200 Facilities Buildings Maintenance -
21210 Facilities Buildings Maintenance Bus
21211 Facilities Buildings Maintenance Bus Stratum 1 < 200 Vehicles
21212 Facilities Buildings Maintenance Bus Stratum 1 200 to 300 Vehicles
21213 Facilities Buildings Maintenance Bus Stratum 1 > 300 Vehicles
21214 Facilities Buildings Maintenance Bus Stratum 2 < 200 Vehicles
21215 Facilities Buildings Maintenance Bus Stratum 2 200 to 300 Vehicles
21216 Facilities Buildings Maintenance Bus Stratum 3 < 200 Vehicles
21217 Facilities Buildings Maintenance Bus Stratum 3 200 to 300 Vehicles
21218 Facilities Buildings Maintenance Bus Stratum 4 < 200 Vehicles
21219 Facilities Buildings Maintenance Bus Stratum 4 200 to 300 Vehicles
! complete set of FT!’s TERM asset classification structure is located at www;fta;dot;gov/documents/Thursday_PM_-_Gates_-_TERM_Light;pdf
ASSET INVENTORY AND CONDITION ASSESSMENT GUIDE 3-4

CHAPTER 3: “HOW TO” GUIDE TO �UILD AND UPDATE AN ASSET INVENTORY
Overcoming Challenges in Inventory Hierarchies – Case Study
The RTA has had to overcome challenges in reconciling the inventory hierarchy structures developed by individual Service Boards with the inventory structure used in the Capital Optimization Support Tool (COST).
When the Service Boards developed their Baseline Inventory as part of the Baseline Assessment, they adopted a two-tier inventory structure as follows (see CTA example below):
With update efforts, Service Boards wished to retain their original “RT! asset type” designation (i;e;, “�TS1 -Track Structures”). This structure is not exactly the same as the four level COST model structure, which has caused confusion and apparent errors in reconciling the two.
ASSET INVENTORY AND CONDITION ASSESSMENT GUIDE 3-5

CHAPTER 3: “HOW TO” GUIDE TO �UILD AND UPDATE AN ASSET INVENTORY
Overcoming Challenges in Inventory Hierarchies – Case Study Continued
In order for COST to work, all assets must be assigned a TERM asset type, otherwise the model would not be able to recognize the asset and include it in the projections.
Guideway Elements
Facilities
Systems
Stations
Vehicles
Guideway Direct Fixation
Ballasted
Embedded
Special
Trackwork
Tangent
Curve
Station Tangent
Station Curve
Category Sub-Category Element Sub-Element
Two Level “RTA” Hierarchy Four Level TERM Hierarchy
The asset type assignment determines how COST will:
– Assign prioritization scores – Rehab the asset (including number and cost of rehabs) – Permit asset replacement (or not) – Apply soft-cost and contingency factors – Map assets to projects.
In the case of RTA, mixing the two asset structures has led to some confusion, where multiple RTA asset types can belong to the same TERM category or sub-category, and conversely, multiple TERM elements and sub-elements can belong to the same RTA asset type.
This issue can easily occur for individual transit agencies, where the Enterprise Asset Management structure is not fully aligned with the structure of the capital asset prioritization tool. The best solution is first to appreciate the differences, then to harmonize the two, and providing ample documentation. Harmonizing two different structures is not very hard to do. The three options are:
(1) Alter the COST type listing by making it more region specific
(2) Apply TERM/FTA codes to the main structure
(3) A combination of the first two options.
ASSET INVENTORY AND CONDITION ASSESSMENT GUIDE 3-6

CHAPTER 3: “HOW TO” GUIDE TO �UILD AND UPDATE AN ASSET INVENTORY
3.4 Asset Inventory Fields Establishing the inventory framework requires identifying the needed inventory fields. Each agency will have different needs and requirements and, therefore, must develop its own inventory fields. Critical fields, such as record identification number, name, description, quantity, useful life, replacement cost, and location identifiers, enable the tracking and inventory of assets. Note that location may require the use of multiple fields as the way to identify an asset’s location varies by type. For example, signs may use a line and a milepost; whereas, a maintenance building may have a postal address.
Depending on the use of the inventory, other fields can store additional information, such as usage, maintenance regimen, serial number, and manufacturer. These additional fields are helpful for capital planning and projections for both age-based quintile and asset decay curve approaches; !ppendix � lists sample fields in RT!’s database. While the list is extensive, not all fields were initially populated. Over time, it is anticipated that more fields will be filled in as well as added as more data becomes available.
Several agencies are grappling with integrating GIS information with their asset inventories. GIS can be helpful to integrate track drawings; aerials and other location specific information. Tradeoffs include set-up and maintenance costs.
The asset inventory should also be designed to retain historical data. The design of the RT!’s inventory includes a data field to track the update status (“add” for new assets, “delete” for retirements, and “modify” for updates/changes) and enable the database to retain current and past asset data.
3.5 Data Collection Once the fields of the inventory are established, population of the inventory can begin. Completing an inventory requires compiling data from various resources. In many cases, existing data will be fragmented between different existing systems and resources. Reconciling these resources can sometimes be difficult. An agency may prefer to start anew and link the new inventory back to its financial accounting system, for instance, a posteriori.
When developing a plan for an inventory, the departments and roles of their staff should be established at the onset. Depending on staffing availability, inventories may be compiled by interns, engineers, field staff, or consultants.
3.5.1 Resources An enterprise asset management (EAM) system, if available and populated, provides the best starting point to develop a list of assets. However, smaller agencies are less likely to have an EAM system. In its absence, a maintenance management system, financial accounting system, or asset ledger can provide information for the inventory but not to the same level of detail as from an EAM system.
3.5.2 Populating the Inventory EAM, financial accounting, and maintenance management systems can help populate the initial inventory database. The usefulness of these management systems depends on their purpose and completeness. For example, financial accounting systems record the number of units purchased, but they may not track installation date, location, or the number of units in operation. The industry is rife with examples of onsite surveys revealing surprises when it comes to checking the official record of assets.
In the absence of complete data, an agency needs to rely more on input from staff and on-site inventories. Asset managers/owners can provide specific information for given asset categories or sub-categories that they manage
Sample Asset Inventory Fields
The RT!’s !sset Inventory Database has over 40 fields. Critical fields include:
Record identification number
Name
Description
Quantity
Useful life
Replacement cost
Location identifiers
Depending on an agency’s needs, additional optional fields may include:
Usage
Maintenance regimen
Serial number
Manufacturer
Appendix B lists fields used by RTA in its Condition Assessment Update.
ASSET INVENTORY AND CONDITION ASSESSMENT GUIDE 3-7

The RT!’s !sset Inventory Database has over 40 fields. Critical fields include:
Record identification number
Name
Description
CHAPTER 3: “HOW TO” GUIDE TO �UILD AND UPDATE AN ASSET INVENTORY
and maintain. They also may have useful supporting documentation of assets. Examples include MMS data for Vehicles; facilities maintenance spreadsheets for Facilities; maintenance contract databases for elevators/escalators, and so forth.
In the worst case, an on-site inventory may be required. For surveying in the field, smaller agencies may inventory their assets by recording the inventory on a clipboard and entering the data manually into Excel. Agencies with more sophisticated information technology (IT) systems may use a laptop or tablet to record assets that allows them to import these entries directly into the inventory database.
Populating and improving an inventory requires time and effort. Over time, the inventory will gradually become more complete and detailed with updates. See Section 3.8: Continuous Improvements and Section 3.9: Inventory Update Schedule, for additional discussion.
3.5.3 Life Cycle and Cost Assumptions Regional and national data can help define assumptions for useful life and develop rehabilitation, replacement, soft, and contingency costs in order to populate data fields in an inventory. FTA has invested heavily in developing national estimates based on empirical information as part of TERM. Since local factors influence useful life and costs, an agency should modify these assumptions to be compatible with its local experience and operating environment.
3.5.3.1 Useful Life Useful life is one of the biggest drivers of capital reinvestment. A useful life value must be attached for all assets in the inventory.
Assets may deteriorate more or less rapidly depending on the operating environment, weather, as well as maintenance history. Adjusting useful life and the number of rehabilitations to reflect the local operating environment and actual maintenance performed will improve the accuracy of forecasting reinvestment needs.
RTA used the TERM life cycle assumptions as a baseline in developing regional assumptions. Through consensus building sessions with the three Service Boards, RTA modified the useful life assumptions based on regional experience (e.g., adjusting the useful life of maintenance facility to 60 years). Appendix C lists useful life and number of rehabilitations per life cycle for each of the three Service Boards.
3.5.3.2 Replacement Costs Determining replacement costs is challenging because prices vary geographically and over time. Procurement history for an agency can serve as a data point in determining asset replacement costs. By documenting the year of validity for a replacement cost, an agency can apply inflation to determine how much the replacement is expected to cost at the time of expenditure.
In the case of RTA, the replacement costs were primarily Service Board driven.
The current state-of-the-practice separates replacement costs from soft and contingency costs. By excluding soft and contingency costs, an agency can use their own like replacement costs or use FT!’s database of standard replacement costs for the vast majority of assets in TERM. Agencies can then apply standardized soft and contingency costs applicable to the local environment to the TERM replacement costs. For example, urban areas may have higher soft and contingency costs. Costs also vary by type of asset. Typically, infrastructure components have higher soft and contingency rates than for rolling stock (vehicles) and equipment.
Soft and Contingency Cost Estimating Resources
Soft Costs:
Estimating Soft Costs for Major Public Transportation Fixed Guideway Projects1
describes soft costs and provides a new methodology to estimate soft costs based on historical projects.
Contingency Costs:
Cost Contingencies, Development Basis, and Project Application2 present various cost and schedule contingency approaches that have been applied successfully to major transit projects and other public infrastructure projects.
1Transit Cooperative Research Program Report 138, Transportation Research Board, 2010
2Transportation Research Record: Journal of the Transportation Research Board, Transportation Research Board of the National Academies, Issue 2111, Pages 109-124, 2009
ASSET INVENTORY AND CONDITION ASSESSMENT GUIDE 3-8

CHAPTER 3: “HOW TO” GUIDE TO BUILD AND UPDATE AN ASSET INVENTORY
Based on regional experience and peer review, RTA established soft and contingency rates for the region, as listed in Table 4.
Table 4: Definitions of Soft and Contingency Costs for the RTA
Soft Cost Definition
The majority of soft costs are expended in the planning, engineering, and project management efforts. These services include in-house agency staff, government related support staff, and occasionally consultants. Project start-up expenses are also included in this category. Project financing cost and “other” expenses (reconciliation and unaccountable costs) comprise the full range of project development capital costs (FTA definition).
Soft Cost Factors Applied
Rail and Bus Infrastructure Components: Additional 22.7% of total base cost including miscellaneous costs related to development of passenger services.
Rail and Bus Rolling Stock and Equipment: Additional 15% of total base cost including miscellaneous costs related to development of passenger services.
Contingency Cost Definition
Contingency costs are budgeted for unforeseen emergencies or design shortfalls typically identified after a project commences. The contingency is included in the budget so the project can proceed with minimal interruption for changes or cost overruns.
Contingency Cost Factors Applied
Rail and Bus Infrastructure Components: Additional 20% of total base cost including miscellaneous costs related to development of passenger services.
Rail and Bus Rolling Stock and Equipment: Additional 15% of total base cost including miscellaneous costs related to development of passenger services.
Soft and Contingency Cost Conclusions
RTA and the Service Boards have conducted research regarding soft and contingency costs as part of an ongoing effort to continuously improve the accuracy of capital need estimates. The following conclusions are offered:
“The devil is in the details” in seeking to establish reliable and standardized soft and contingency assumptions for transit capital assets; academic research on this topic is in its infancy.
Several cost estimating resources are identified in the prior text box.
Based on the research conducted, there is a wide range of soft costs reports (7 to 22 percent of replacement value), as well as contingency costs (11 to 32 percent). Reasons include local conditions; cost of doing business; impact of commodity price swings such as steel and cement; and other factors.
It is helpful to examine peer soft and contingency costs; however the recommended approach is to base the development of asset class soft and contingency costs on a survey of local empirical data, and update those over time.
ASSET INVENTORY AND CONDITION ASSESSMENT GUIDE 3-9

CHAPTER 3: “HOW TO” GUIDE TO �UILD AND UPDATE AN ASSET INVENTORY
3.6 Quality Checks Several steps can be taken to improve data accuracy, comprehensiveness, and consistency of an inventory. A series of logical and statistical checks can identify different kinds of issues with accuracy, consistency, quality, and gaps in asset entries in order to expose problematic data. Table 5 lists a few quality validation approaches. The goal of these checks is to examine both factual and structural issues with the inventory database (i.e., identify data issues and any problems with the database structure itself). These approaches primarily rely on data sorting, visual inspection of the data, input from asset managers/owners, and comparison with other data sources. Based on the results of logical and statistical checks, an asset manager/owner for a specific asset category or sub-category can provide valuable input and help identify any missing assets or inconsistent values/attributes. Follow-up on-site surveys may be needed to help supplement and verify inventory data.
Table 5: Inventory Quality Validation Approaches
Validation Approach Steps
Basic Validation Sort data to identify key missing attributes for each asset; validate consistency of each asset’s basic attributes; and verify each asset’s description with asset category used in the asset inventory category structure.
Approach includes checking the consistency of the unit measurement with the asset quantity, class, and unit costs as well as reviewing assets line-by-line to ensure that assets were classified correctly and were not placed under the wrong classification. For instance, making sure that the replacement cost is for a unit and not for the entire system (fare collection, radios).
Trickledown Comparisons Examine each asset profile to ensure cost and quantity subtotals are reasonable/realistic and that key sub-categories, components, or elements are not missing; verify that asset totals match totals for related categories with logical/expected proportions (e.g., catenary lines and railway track should occur in roughly equal lengths).
Approach is most likely to identify unreported assets. A high proportion of total replacement costs in one category may indicate an overestimation of replacement costs in that category or an underreporting of assets and/or replacement costs in other categories.
Expected Assets Identify gaps in assets and/or miscategorizations of vehicles, stations, and guideways by checking that the inventory is in basic agreement with National Transit Database (NTD) data.
Approach uses a checklist to verify the inventory against NTD data at an entry-by-entry basis.
NTD collects data on the number and types of revenue vehicles, facilities, and stations, and on the number of elevators and escalators at stations whose primary purpose is to provide passenger accessibility to stations. NTD also collects data on transit way mileage including miles of track (at grad, elevated on structure or fill, open cut, and subway), and number of grade crossings.
Outlier Analysis Check for inconsistent inputs, such as costs, quantities, and useful life that do not align with industry standards, other data, or operations.
Approach sorts assets first by cost and focuses on higher value items and assets without replacement costs since these will have an amplified effect on the total expected capital investment needs. Subsequent reviews can sort assets by quantities and useful life to identify additional outliers.
ASSET INVENTORY AND CONDITION ASSESSMENT GUIDE 3-10

CHAPTER 3: “HOW TO” GUIDE TO �UILD AND UPDATE AN ASSET INVENTORY
Validation Approach Steps
Modal Tests (Only Applicable to Agencies with Multiple Operators)
Cross tabulate asset quantities and replacement costs to compare asset profiles and distributions for similar operators to identify unusual categories and distributions of quantities and replacement cost totals; miscategorizations of assets; and unusual ratios, asset totals, and asset replacement cost subtotals.
Approach can use ratios of annual operating expenses to total capital replacement costs and total capital replacement costs per service hour or passenger to help identify outlier values.
Approach generally summarizes asset categories down to the element level to highlight whether operators created their own classifications or did not use existing asset classifications.
The quality checks listed above will likely identify a few inventory data issues. Table 6 lists causes of five primary types of data issues and recommendations to avoid or resolve them.
Table 6: Inventory Data Issues
Data Issue Description/Cause/Recommendation
Ambiguous Data Description: Insufficient data available to classify an asset and/or its attributes properly.
Cause: Ambiguous data can arise for several reasons. Staff may provide inconsistent information because they reported an asset under the wrong classification. This may be caused by staff having a different interpretation of the asset classification definition. It may also be unclear what information or units should be entered into certain fields.
Recommendation: The reporting form used to develop the inventory should be as detailed as possible and a guide should provide the detailed instructions necessary to complete the inventory reporting forms and define asset classifications.
Miscategorized Data Description: This primarily to “new assets” that are added to an existing inventory. The issue occurs when the new asset is introduced under a new asset class different than an existing one.
Cause: In most cases, miscategorization arises when staff populating/updating the inventory do not fully understand the asset classification system. One example that occurred for RTA was with the RTA asset classification. RTA class 21401 is Bus Terminals (under Facilities). RTA class 42051 is Station Code (Under Stations). In this example, a decision was made to classify passenger facing facilities as “Stations” as guiding principle; The correct classification code was therefore 42051.
Recommendation: Instruction on how to classify assets and update the inventory should be as detailed as possible and anticipate this type of issue.
ASSET INVENTORY AND CONDITION ASSESSMENT GUIDE 3-11

CHAPTER 3: “HOW TO” GUIDE TO �UILD AND UPDATE AN ASSET INVENTORY
Data Issue Description/Cause/Recommendation
Inaccurate Data Description: Inventory data incorrectly reported; units for inventory data do not agree (e.g. units for an asset do not agree with costs).
Cause: Inaccurate data is caused less by the reporting process than by input errors or issues with the primary data sources. These issues often pertain to unusual reported costs and will most likely require follow up.
Recommendation: Providing precise instructions and definitions can address confusion or misunderstanding that can lead to inaccurate data. In addition, providing additional documentation and descriptions of the asset in the notes and encouraging staff to report and document the unit costs increases the information available to help resolve issues and can improve the accuracy of reported asset costs.
Missing Data Description: Assets not included in the inventory; blank entries.
Cause: Assets are not included in the inventory because they are not reported or do not appear in resources used to generate the inventory. Smaller agencies sometimes report a narrower range of assets in their inventory because they are shared with other levels of government, or services are contracted.
Recommendation: Missing data is a difficult issue to address, but not all missing data is critical. The structure of the asset reporting worksheet should get staff to examine the capital asset holdings comprehensively. A data validation process that compares asset profiles helps identify and respond to missing data.
Double Counting of Assets Description: Redundant assets in the inventory database; double cost counting.
Cause: Double counting stems from staff’s lack of understanding of individual standard asset classifications and inconsistencies between unit costs and quantities. Double counting of assets may occur if staff classifies an asset under multiple categories, creating multiple database entries for the same asset. Double counting of costs can arise when asset definitions are not sufficiently clear and when the asset cost basis is unclear (e.g., the replacement cost of an entire system is inputted as a unit cost).
Recommendation: These pitfalls underscore the value of encouraging staff to report additional asset descriptions in the asset description and notes. Redundant entries can be hard to prevent and usually will not be detected without using a data validation process, but once identified, they can just be deleted. Having unique or project-based asset identification numbers to tie assets back to project, accounting, or other databases can also facilitate the identification of redundant assets.
Inconsistent Inventory Data Across Operators (Only Applicable to Agencies with Multiple Operators)
Description: Different data for identical or similar assets in the inventory.
Cause: Different operators may have different assumptions (e.g., replacement costs or useful life) for a wide variety of reasons (e.g., historic, policy, or recent practices).
Recommendation: It depends on the situation, but generally, it is recommended to seek consistency across operators. Group discussions can help facilitate consensus.
3.7 Data Sharing The distribution of information depends on the purpose of the inventory. Preparation of an inventory may be required under external requirements and regulations. Under MAP-21, transit agencies that receive federal support must create an asset management system and report condition of their assets in their inventory.
ASSET INVENTORY AND CONDITION ASSESSMENT GUIDE 3-12

CHAPTER 3: “HOW TO” GUIDE TO �UILD AND UPDATE AN ASSET INVENTORY
Meanwhile, local, regional, or state governments may also require agencies to provide an inventory and condition assessment of their assets. In the case of the RTA, each of the three Service Boards must submit their inventories as part of the regional planning and funding process.
Inventory data may also be used for various internal activities. These activities may include capital planning, preparation of grant applications, operations planning, and IT integration with EAM, financial, and maintenance systems. Establishing a system for data sharing internally is not only important in populating the inventory but also distributing the results for maximum agency benefit.
In the Chicago region the RTA set up a project SharePoint site to be able to have a common platform for sharing asset inventory (and condition data) with each of the Service Boards. In addition to having the latest inventories posted, the RTA also publishes annual updates upon request.
3.8 Continuous Improvements Continual maintenance and updates of the inventory is essential to ensure the reliability of the data and forecasts. With each update, new information will become available. There will be opportunities for refinements to the database and process. New data tables for new or unreported assets will be created. Newly installed or unreported assets will be added to the inventory. Previously empty fields will be filled with data points. New fields for the data tables may be inserted. Understanding this fluidity is important in designing the flexibility of the inventory framework.
Through experience, the inventory framework will evolve and expand. It is important to incorporate flexibility into the inventory to accommodate these changes. After the Baseline Assessment, the RTA and Service Boards offered suggestions to improve and expand the inventory framework for the Condition Assessment Update, such as:
Using a data dictionary to provide consistent interpretation/application of terms in the inventory tables (see Appendix B)
Adding a level of disaggregation where needed or where supported by data
!dding several new fields including “level of usage” and “maintenance regimen;”
Over time, the level of detail available will continue to increase. In the Chicago example, for the 2011 Condition Assessment Update, the Service Boards submitted data tables for asset information that were not available in 2009 Baseline Assessment. The Update also disaggregated some assets to provide more detail. Overall, for the 2011 Condition Assessment Update, the Service Boards reported over 14,500 assets, a 26% increase from 2009 Baseline Assessment. Table 7 summarizes the inventory statistics for the Baseline Assessment and the Condition Assessment Update and shows the difference between the two reports.
Table 7: Inventory Statistics for RTA
2010 Baseline Assessment
2012 Condition Assessment Update Difference
Data Tables 80 121 51%
Individual Assets Reported 11,574 14,556 26%
Total Data Points 671,292 855,210 27%
3.9 Inventory Update Schedule Developing a schedule for updates ensures that forecasts are based on up-to-date information on current assets as well as new or overhauled assets; Since an inventory provides a snapshot of an agency’s assets in time, inventory updates are necessary to provide up-to-date information. Over time, new assets will be placed into revenue service. Major overhauls will be conducted. Older assets will be retired. The inventory should not just add new assets and remove retired assets. It should capture historical data by retaining retired assets to assist with
ASSET INVENTORY AND CONDITION ASSESSMENT GUIDE 3-13

CHAPTER 3: “HOW TO” GUIDE TO �UILD AND UPDATE AN ASSET INVENTORY
the further calibration of forecasts. Scheduled updates also help an agency comply with regulatory requirements. For example, MAP-21 requires a grantee to provide an annual report on its performance towards reaching its Asset Management Plan as well as asset condition information for the National Transit Database.
An agency conducting condition assessments as part of the inventory update should incorporate a condition sampling plan. Identifying sampling needs enables an agency to budget for data collection and helps ensure that with time an agency will have a statistically significant sample. The RTA has made it a policy decision and priority to update the inventory annually, as shown in Figure 6, by providing annual funding for Condition Assessment Updates. In addition to meeting the FT!’s requirements to provide an inventory and report asset condition annually, the RT!’s approach will enable RT! to have an up-to-date understanding of its asset needs for capital planning. In addition, since the Condition Assessment Updates include on-site sampling of assets, over time, the RT!’s database will become more complete, improving accuracy of the inventory and projections;
Figure 6: RTA Example of Annual Updates Following Baseline Assessment
Year 1 Year 2 Year 3 Year 5
2009-10
Year 4
4/11 6/12 6/13
2012
Assessment
6/14
2014
Assessment
Baseline
Assessment
2013
Assessment
6/15
2015
Assessment
6/16
2016
Assessment
Currently, the RTA is on a cycle to produce draft assessments in April for the previous calendar year (e.g., April 2013 for the �alendar Year ending December 31, 2012); It’s been the RT!’s experience that finalizing these reports takes a few more months to incorporate all of the outstanding comments. The goal is that as the process becomes more standardized, the assessment update can be completed more quickly.
ASSET INVENTORY AND CONDITION ASSESSMENT GUIDE 3-14

4 “How To Guide to” Conduct a Condition Assessment 4.1 FTA Condition Assessment Philosophy FTA established the most commonly used condition rating process as part of its TERM documentation for condition assessments. The FT!’s five-level condition rating process (Table 8) defines condition ratings for each level and a methodology for estimating the condition of individual assets based on asset type, age, and other factors. Working on a scale from 1 (worn) through 5 (excellent), rating values are the primary means by which TERM evaluates an asset’s current and future rehabilitation and replacement needs; FT! defines a 2;5 or higher as the rating at which an asset is in SGR. By adopting the FT!’s five point condition rating levels, an agency can ensure compatibility of its condition assessment with MAP-21 and FT!’s information requests as well as with FT!’s asset decay curves used in TERM Lite; �onsistency of an agency’s assessment rating system with FT!’s condition rating levels becomes especially important when an agency plans to use TERM Lite to forecast its capital reinvestment needs based on an asset’s life cycle;
Building on the TERM asset conditions, the RTA developed base asset descriptions for its Baseline Assessment and �ondition !ssessment Update; With some exceptions, the RT! and the Service �oards have largely adopted FT!’s five point condition rating scale, thus ensuring consistency with FTA and compliance with MAP-21 condition assessment requirements. For the original Baseline Assessment, the RTA utilized a five-level, age-based quintile condition rating system comparable to that used by FTA. Since the RT! has adopted FT!’s decay curve condition estimation approach, RTA is now using the FT!’s five-level condition rating levels.
Table 8: Condition Rating Levels
Condition RTA Definition (2009-10) Condition RTA Definition (2011-present)
Excellent 5
Asset is in the first quarter of its useful life
Excellent 4.8 to 5.0
New asset No visible defects
Good 4
Asset in the first half of its useful life Good
4.0 to 4.7
Asset showing minimal signs of wear Some (slightly) defective or
deteriorated component(s)
Adequate 3
Asset has not exceeded three quarters of its life
Adequate 3.0 to 3.9
Asset has reached its mid-life (condition 3.5)
Some moderately defective or deteriorated component(s)
Marginal 2 Asset is in the last quarter of its life
Marginal 2.0 to 2.9
Asset reaching or just past the end of its useful life (typically reached between condition 2.75 and 2.5)
Increasing number of defective or deteriorated component(s) and increasing maintenance needs
Past its Useful
Life 1
Asset has exceeded its useful life and is not in SGR. These assets are considered to backlog and have not been replaced or rehabilitated due to a lack of funding
Worn 1.0 to 1.9
Asset is past its useful life and should be prioritized for repair or replacement
INVENTORY AND CONDITION ASSESSMENT “HOW TO” GUIDE 4-1

CHAPTER 4: “HOW TO GUIDE TO” �ONDUCT A CONDITION ASSESSMENT
4.2 Approaches to Condition Assessment There are three approaches to measuring asset condition: (1) straight age-based, linear condition projection; (2) decay curves condition estimation; and (3) physical site visits via sampling or other methods. Each approach is briefly described in Table 9. As part of the Condition Assessment Update, the RTA transitioned from an age-based quintile approach to an asset condition decay curve approach that is supplemented by sampling observations of assets to assist in validating condition estimates.
Table 9: Condition Approaches and Application
Condition Approaches Methodology RTA Experience
1. Age Quintiles
2. Asset Condition Decay Curves
3. Sampling Observations
Asset useful life divided into Basis for condition used during five quintiles Baseline Assessment
Estimated asset condition FTA-developed curves used to based on asset type specific estimate asset conditions for decay curve Condition Assessment Update
Physical observation by Process initiated. Will be used in condition experts, then future to validate/recalibrate rated by using a scale FTA decay curves
4.2.1 Age-Based Quintiles In the absence of more detailed information and resources, an asset’s age can act as the primary “predictor” of an asset’s condition; !ccording FT!’s October 2008 report, Transit State of Good Repair: Beginning the Dialogue, “physical asset condition assessment is the best way to measure SGR for individual assets and on an agency-wide basis; !sset age is a second best proxy;”
For the Baseline Assessment, the RTA utilized a five point, age-based quintile condition rating system as illustrated in Figure 7 (i.e., first quintile for first quarter of asset life, second quintile for second quarter of asset life, and so forth up to fifth quintile for assets exceeding their life). This approach reflected the best approach possible among the Service Boards at that time, while taking into consideration the limited resources of each Service Board and the level of effort required for the overall assessment. While in-depth information and data was not available for each asset for the Service Boards, sufficient data was collected and satisfactory age estimates were established for nearly all assets.
ASSET INVENTORY AND CONDITION ASSESSMENT GUIDE 4-2

CHAPTER 4: “HOW TO GUIDE TO” �ONDUCT A CONDITION ASSESSMENT
Figure 7: Age-Based Condition Rating Scale (Stepwise condition rating based on remaining useful life)
1st
quintile
2nd
quintile
3rd
quintile
4th
quintile
As
se
t C
on
dit
ion
Ra
tin
g
Normalized Asset Lifecycle
Asset life expires
(Lifecycle = 100%)
5th
quintileGeneric profile; stepwise degrade
For consistency with FT!’s five point condition rating scale, RT!’s asset condition ratings were broken into five categories on a 1-to-5 scale with 1 representing an asset “past its useful life” and 5 representing a relatively new asset in “excellent” condition; For the purposes of the �aseline !ssessment, the SGR was defined as a condition rating of 3, or “adequate with no backlog;” In effect, anything rated 3 or higher is in a SGR; !nything rated lower than 3 begins to take on “marginal” aspects and is in its last quarter of the asset’s useful life; Figure 8 below illustrates the capture and graphical representation of condition rating data.
Figure 8: Example of Age-Based Quintiles Condition Output
4.2.2 Decay Curves Decay curves based on on-site asset condition samplings can also be used to predict an asset’s condition; The FTA has developed generic transit asset decay curves for major asset types using condition data collected from transit agencies nationwide. These curves predict asset physical condition as a function of age, maintenance history, and other factors on a common 5-to-1 rating scale. Figure 9 illustrates a typical decay curve for a 40-foot bus based on
ASSET INVENTORY AND CONDITION ASSESSMENT GUIDE 4-3

CHAPTER 4: “HOW TO GUIDE TO” �ONDUCT A CONDITION ASSESSMENT
nationwide empirical data; The “best fit” curves in red (there are three curves based on the level of preventive maintenance) predict the expected physical deterioration of a 40-foot bus over time.
The decay curve exhibits a steep decline in the first three to four years of bus life, followed by a long period of slower gradual decline. Note that for an average preventative maintenance regimen, the best fit spline intersects a standard 12 year bus life at a physical condition rating of 2.6. It takes an additional 1.5 years – 13.5 year bus life – for the bus to reach a condition rating of 2.5.
Figure 9: Asset Decay Curve Example
The decay curve approach to estimate asset condition represents a shift from the prior approach utilized by the RTA, which relied purely on age-based useful life quintiles. Using the decay curve approach, asset condition is estimated on an empirically derived continuum of physical condition, as opposed to age. There are several advantages to using decay curves:
Provide more accurate predictions and distributions instead of using a life cycle proxy; Provide an asset class-specific rating prediction; Are consistent with on-site (field) observation condition rating criteria definitions; and Have no impact on asset backlog and investment needs estimates.
This ability to predict asset condition and distributions on a continuum enables an agency to make more informed capital planning decisions and prioritize reinvestments needs. As shown in Figure 10, when an asset exceeds its useful life in the age quintile approach (shown on the left side of the figure), it is no longer considered in SGR and is due for replacement, entering the backlog. Similarly, for the asset decay curve approach (shown on the right), once an asset reaches 100% of its useful life, it is added to the backlog as illustrated by the blue asterisk. However, since the decay curve approach provides a continuum of physical condition, an agency can prioritize the order of asset replacements based on asset condition.
ASSET INVENTORY AND CONDITION ASSESSMENT GUIDE 4-4

CHAPTER 4: “HOW TO GUIDE TO” �ONDUCT A CONDITION ASSESSMENT
Figure 10: Replacement Needs versus Asset Conditions
4.2.3 Sampling Observations On-site sampling tests the degree of consistency between predicted condition and the actual condition of an asset. Sampling requires physical observations by condition assessor of assets that are then rated by using a scale. Sampling is valuable for both age-based quintile and decay curve approaches.
The RTA conducted on-site sampling for both the Baseline Assessment and the 2011 Condition Assessment Update. For the most part, though not all cases, the results of the limited sampling confirmed the condition rating process used. Sampling is addressed in detail in the next section of the report.
4.3 SGR Monitoring and Performance Measures At the time of this writing, there are various definitions and opinions of State of Good Repair (SGR) but no single, industry-wide accepted definition. In fact, the FTA has been in the process of facilitating a dialogue with the industry to help develop a single definition.
The drive to both define SGR and quantify SGR needs is unlikely to go away soon. Condition assessments can help an agency monitor SGR and comply with regulatory requirements. The RTA and the Service Boards established their own definition of SGR for the purpose of its �ondition !ssessment Updates; Under the RT!’s definition, assets are in SGR if they are replaced once they reach useful life; all rehabs are performed; and capital maintenance is up to date. Note this definition does not tie directly to the physical condition of the asset; it is a based on up-to-date maintenance practices and capital replacement intervals.
In regards to this definition, two performance measures can help an agency monitor SGR related to condition assessments: condition rating and remaining years of useful life. Both of these measures have been defined in great detail in this “how to” guide; �eyond these measures, there are a number of other performance measures that can help an agency manage SGR. Examples include:
Regional backlog projections (per year)
Required funding to attain specific investment targets
Percent of replaceable assets exceeding useful life
SGR Backlog ratio
Current and projected asset age distribution (i.e., showing the percent of useful life consumed)
Clearly there are multiple measures to document an agency’s status with respect to asset management and State of Good Repair.
ASSET INVENTORY AND CONDITION ASSESSMENT GUIDE 4-5

CHAPTER 4: “HOW TO GUIDE TO” �ONDUCT A CONDITION ASSESSMENT
The RTA first reported regional performance measures in 2009 with the release of the 2007 Regional Report Card, which aggregates performance data from CTA, Metra, and Pace to describe system-wide performance. In late 2010, the RTA enhanced its performance measurement program by publishing its first Sub-Regional Performance Measures Report, which describes performance at the Service Board and mode levels. The data for the RTA performance measure reports come mostly from the National Transit Database, with several elements reported by each Service Board, and are updated annually. RTA has also refined the Regional and Sub-Regional reports so that they track comparative measures for RTA versus regional and sub-regional peer agencies. RTA intends to integrate SGR measures into the report over time.
In 2013, the RTA has developed definitions as well a performance measure for State of Good Repair.
Asset Level SGR Definition An asset is in a state of good repair (SGR) if (i) its age does not exceed its expected useful life and (ii) all rehabilitation and annual capital maintenance activities are up to date. Under these circumstances, an asset has no deferred capital reinvestment needs and, by definition, has an estimated condition score of 2.5 or higher (RTA/TERM Lite decay curves are defined such that assets attain their useful life and a condition score of 2.5 concurrently). If an asset has undergone a major life extending rehabilitation, it can exceed its expected useful life and still be in SGR. Non-attainment of SGR does not imply an asset is unfit for service or unsafe but it may increase the likelihood of sub-optimal performance (i.e. reliability and availability performance may decrease).
Mode, Service Board, or Regional Level (Aggregate) SGR Definition A transit mode, Service Board or the region is considered to be in SGR if each of its component assets is in SGR (as defined above). Mode, Service Board and regional level SGR represents an ideal state and is not attainable in practice as (i) rehabilitation and replacement needs arise continuously and (ii) mode, Service Board and regional level budgets are generally insufficient to meet these continuous needs. As such, a more realistic view of SGR at an aggregate level is based on the region’s target/tolerance for achieving reinvestment goals – such as halving the current SGR backlog over a certain timeframe or not allowing the SGR backlog to grow beyond current levels.
In order to measure SGR, RTA further developed a performance measure called “Percent of !ssets in SGR”; Definition of the Measure: The degree of attainment of SGR for a group of assets is evaluated as the total level of reinvestment required to replace all assets that exceed their useful life and address all outstanding rehabilitation and annual capital maintenance needs divided by the total replacement value of those assets.
Measurement of SGR applies to the aggregate level (e.g., asset class) and would not normally be calculated on an asset level. The RTA SGR measure is financially weighted (i.e., it is weighted by replacement value). RTA formally began presenting this measure to the RTA Board in September, 2013. Both RTA system-wide and Service Board performance measure results were presented.
4.4 Recommendations for Given Situation The suitable condition assessment approach depends on the agency’s policy objectives as part of a broader capital planning and strategic maintenance program, its prior experience with surveys and condition assessments and other factors. An agency must also take into consideration regulatory requirements in developing its condition assessment approach (e.g., MAP-21 requires agencies to report on asset condition in addition to creating an asset management system).
There are several approaches possible to predict asset condition as discussed in this chapter. An agency must decide for itself which approach is most appropriate given its needs and resources. The more sophisticated approaches can use robust analytical tools integrated with the agency’s Enterprise Asset Management (EAM) system, with additional on-site observation for validation and refinement.
ASSET INVENTORY AND CONDITION ASSESSMENT GUIDE 4-6
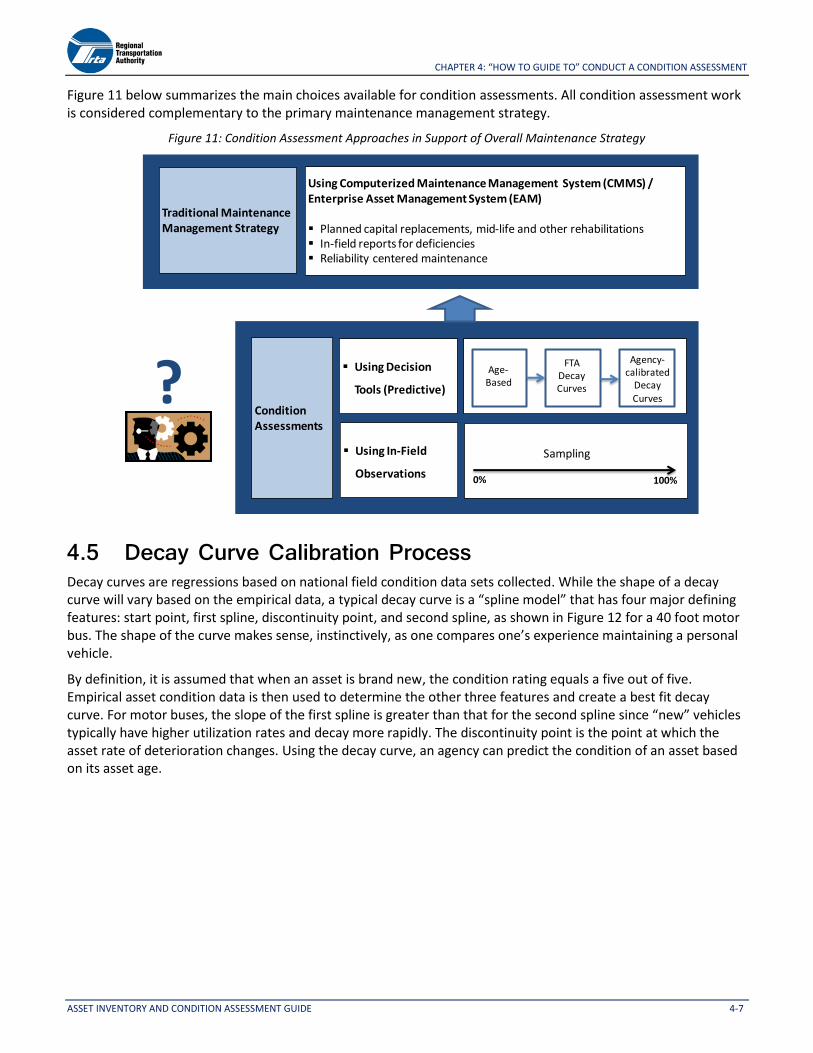
CHAPTER 4: “HOW TO GUIDE TO” �ONDUCT A CONDITION ASSESSMENT
Figure 11 below summarizes the main choices available for condition assessments. All condition assessment work is considered complementary to the primary maintenance management strategy.
Figure 11: Condition Assessment Approaches in Support of Overall Maintenance Strategy
Traditional MaintenanceManagement Strategy
Using Computerized Maintenance Management System (CMMS) / Enterprise Asset Management System (EAM)
Planned capital replacements, mid-life and other rehabilitations In-field reports for deficiencies Reliability centered maintenance
ConditionAssessments
Using Decision
Tools (Predictive)
Using In-Field
Observations
Sampling
0% 100%
Age-Based
FTA Decay Curves
Agency-calibrated
Decay Curves?
4.5 Decay Curve Calibration Process Decay curves are regressions based on national field condition data sets collected. While the shape of a decay curve will vary based on the empirical data, a typical decay curve is a “spline model” that has four major defining features: start point, first spline, discontinuity point, and second spline, as shown in Figure 12 for a 40 foot motor bus. The shape of the curve makes sense, instinctively, as one compares one’s experience maintaining a personal vehicle.
By definition, it is assumed that when an asset is brand new, the condition rating equals a five out of five. Empirical asset condition data is then used to determine the other three features and create a best fit decay curve. For motor buses, the slope of the first spline is greater than that for the second spline since “new” vehicles typically have higher utilization rates and decay more rapidly. The discontinuity point is the point at which the asset rate of deterioration changes. Using the decay curve, an agency can predict the condition of an asset based on its asset age.
ASSET INVENTORY AND CONDITION ASSESSMENT GUIDE 4-7
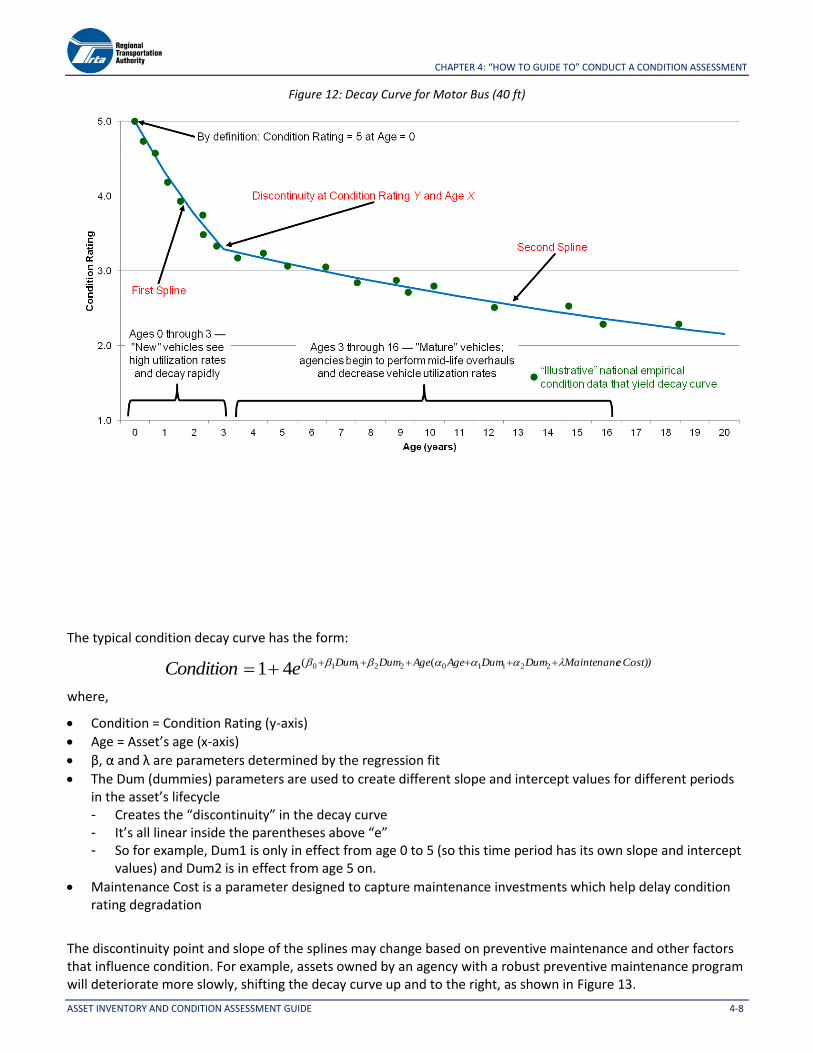
CHAPTER 4: “HOW TO GUIDE TO” �ONDUCT A CONDITION ASSESSMENT
Figure 12: Decay Curve for Motor Bus (40 ft)
The typical condition decay curve has the form:
Cost)) eMaintenancDumDumAgeAgeDumDumeCondition
2211022110 ((
41
where,
Condition = Condition Rating (y-axis) !ge = !sset’s age (x-axis) β, α and λ are parameters determined by the regression fit The Dum (dummies) parameters are used to create different slope and intercept values for different periods in the asset’s lifecycle - �reates the “discontinuity” in the decay curve - It’s all linear inside the parentheses above “e” - So for example, Dum1 is only in effect from age 0 to 5 (so this time period has its own slope and intercept
values) and Dum2 is in effect from age 5 on.
Maintenance Cost is a parameter designed to capture maintenance investments which help delay condition rating degradation
The discontinuity point and slope of the splines may change based on preventive maintenance and other factors that influence condition. For example, assets owned by an agency with a robust preventive maintenance program will deteriorate more slowly, shifting the decay curve up and to the right, as shown in Figure 13.
ASSET INVENTORY AND CONDITION ASSESSMENT GUIDE 4-8
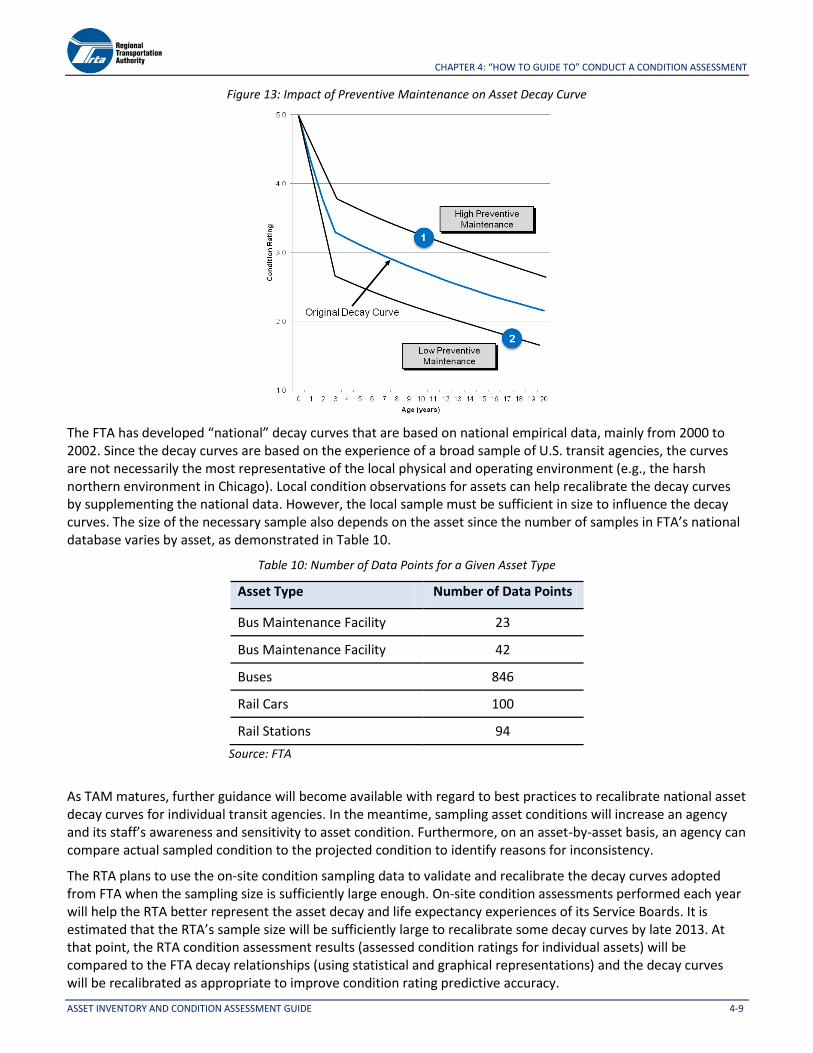
CHAPTER 4: “HOW TO GUIDE TO” �ONDUCT A CONDITION ASSESSMENT
Figure 13: Impact of Preventive Maintenance on Asset Decay Curve
The FTA has developed “national” decay curves that are based on national empirical data, mainly from 2000 to 2002. Since the decay curves are based on the experience of a broad sample of U.S. transit agencies, the curves are not necessarily the most representative of the local physical and operating environment (e.g., the harsh northern environment in Chicago). Local condition observations for assets can help recalibrate the decay curves by supplementing the national data. However, the local sample must be sufficient in size to influence the decay curves. The size of the necessary sample also depends on the asset since the number of samples in FT!’s national database varies by asset, as demonstrated in Table 10.
Table 10: Number of Data Points for a Given Asset Type
Asset Type Number of Data Points
Bus Maintenance Facility 23
Bus Maintenance Facility 42
Buses 846
Rail Cars 100
Rail Stations 94
Source: FTA
As TAM matures, further guidance will become available with regard to best practices to recalibrate national asset decay curves for individual transit agencies. In the meantime, sampling asset conditions will increase an agency and its staff’s awareness and sensitivity to asset condition; Furthermore, on an asset-by-asset basis, an agency can compare actual sampled condition to the projected condition to identify reasons for inconsistency.
The RTA plans to use the on-site condition sampling data to validate and recalibrate the decay curves adopted from FTA when the sampling size is sufficiently large enough. On-site condition assessments performed each year will help the RTA better represent the asset decay and life expectancy experiences of its Service Boards. It is estimated that the RT!’s sample size will be sufficiently large to recalibrate some decay curves by late 2013. At that point, the RTA condition assessment results (assessed condition ratings for individual assets) will be compared to the FTA decay relationships (using statistical and graphical representations) and the decay curves will be recalibrated as appropriate to improve condition rating predictive accuracy.
ASSET INVENTORY AND CONDITION ASSESSMENT GUIDE 4-9

5 “How to Guide to” Conduct Sampling of Assets 5.1 What Is Sampling And Why Is It Meaningful? On-site sampling of actual transit asset conditions enables an agency
Objectives of Sampling to validate and refine the asset inventory data, but more Validate asset detail in the inventory. importantly support the agency’s capital planning and maintenance Determine a defensible asset condition management strategy. If the agency does not have or does not use
rating, based on a standard scale. decision support tools to predict or project asset condition, then on-
Use field observations as input to site sampling and reporting is the only manner to report actual asset
recalibrate decay curve to account for condition. With decision support tools in place and in regular use, local conditions. sampling provides a valuable source of information to validate and Identify complex assets that need to refine condition data, informs important capital replacement timing be disaggregated into components and decisions and provides a snapshot in time. elements in future updates.
The RTA and its Service Boards conducted on-site sampling ranging from 1 percent to 70 percent of assets (depending on asset type) during the first two years of the condition update efforts. The sampling was conducted as a team effort with RTA, Service Board, and consultant staff working side by side. Figure 14 shows example assets sampled by the RTA.
Figure 14: On-Site Sampling - Examples
Rail Car Maintenance Facility Roof
Revenue Bus Station Signage Grade Crossing
It should be noted that on-site sampling, while performed by knowledgeable staff, usually engineers or architects with many years of experience, is not intended to address legal or regulatory requirements. For this reason, the staff involved are referred to as condition assessors, not inspectors.
5.2 Setting Up a Sampling Plan A sampling plan should provide statistically reliable results while cost effectively assessing asset condition through on-site observations. The plan should balance the constraints of fieldwork and weigh the sampling towards higher-value assets while ensuring an even sampling of the different asset categories.
INVENTORY AND CONDITION ASSESSMENT “HOW TO” GUIDE 5-1

CHAPTER 5: “HOW TO GUIDE TO” �ONDUCT SAMPLING OF ASSETS
Following the baseline assessment which tended to focus on assets nearing the end of their useful lives, the RTA and the Service �oards decided against a “worst first” approach to sampling, opting instead for a balanced selection of assets regardless of condition.
To ensure consistency and reliable results, several items of the sampling plan need to be finalized, before deploying condition assessors to the field to observe the assets. Figure 15 provides an overview of various steps used by the RTA to conduct sampling.
Figure 15: Asset Sampling Delivery Process
Step 1 entails developing the condition rating checklists and definitions to support the asset inventory. Condition checklists for each asset include required observation fields. Established condition rating definitions for each component and element of an asset sub-category can be used to define the condition scores and improve consistency across multiple condition assessors.
Step 2 requires developing a detailed sampling plan and schedule. If multiple transit operators are involved, the size, objectives, and resources of the various agencies should be considered in developing a sampling plan. Planned projects can also influence the development of a list of assets to be examined. As an example, the �T!’s effort to replace its fare collection equipment with a new open system architecture system was considered in determining which assets were to be examined. Additionally, the agency should determine the strategy regarding taking photos (e.g. document only assets below a particular condition threshold or document a representative set of conditions).
Step 3 involves scheduling condition assessors for field examinations. Special attention needs to be paid to safety (i.e., safety related training) and insurance requirements, such as for right-of-way rail observations. This step also identifies any obstacles to inspecting specific assets that must be resolved before conducting the on-site assessments.
Step 4 represents the actual deployment of resources to the field to observe and document asset conditions. Teams should have the expertise necessary to quickly gather required asset data. Assigning a team to complete assessments for similar asset categories improves consistency across an asset category or sub-category. The
ASSET INVENTORY AND CONDITION ASSESSMENT GUIDE 5-2

CHAPTER 5: “HOW TO GUIDE TO” �ONDUCT SAMPLING OF ASSETS
knowledge of agency staff – in the case of the RTA project, Service Board personnel responsible for operating and maintaining the assets – was essential in successful completion of the overall sampling effort.
5.3 Condition Assessment Criteria and Tools In regard to data collection approaches, condition assessors may use more simple methods (e.g., documenting condition using a clipboard, paper, and pen) or more sophisticated IT solutions (e.g., entering condition onto laptops or tablets, such that information can be imported directly into the inventory).
Several tools can be used to assist condition assessors in conducting a condition assessment. Establishing an asset registry, checklist, and rating definitions along with providing training can help ensure that the appropriate assets are inventoried at the correct level of detail and that the condition ratings are consistent across condition assessors.
5.3.1 Condition Rating Checklists Condition rating checklists identify the required information for the assessors to collect. They represent a straightforward input sheet. The RTA developed condition rating checklists for the selected sample of assets. Checklist data can be collected manually or via the use of tablets.
A sample checklist for bus garages, shown in Table 11, identifies the asset classes (sub-category) and their components and elements for evaluation. The level of detail on the forms corresponds to the specific component condition level definitions developed by the FTA for development of its asset decay curves, which are based on on-site asset conditions of a sample of U.S. transit properties.
5.3.2 Condition Rating Definitions Establishing precise definitions for rating assets improves consistency and enables condition assessors to more accurately classify condition. Condition assessors must have an effective understanding of what these condition ratings imply before attempting to apply these ratings in the field.
As discussed in Section 4.1: FTA Condition Assessment Philosophy, the RTA developed its condition assessment rating structure and definitions based to a large extent on TERM documentation for condition assessments. The base asset descriptions are based on a five-level condition rating process with a scale from 1 (worn) through 5 (excellent). However, the RTA tailored the rating definitions slightly to increase the applicability to the Chicago transit region. Furthermore, the actual asset condition rating descriptions used in the underlying condition inspections vary across assets. These differences reflect the application of the base descriptions to the specific design, technology, and decay characteristics of the various assets. Rating definitions were also developed for assets not included in TERM definitions and for components of disaggregated assets. Table 12 defines the condition ratings for a bus maintenance facility garage roof.
ASSET INVENTORY AND CONDITION ASSESSMENT GUIDE 5-3

CHAPTER 5: “HOW TO GUIDE TO” �ONDUCT SAMPLING OF ASSETS
Table 11: Sample Condition Rating Checklist
BUS MAINTENANCE FACILITY (BUS GARAGE) ASSESSMENT FORM
Facility Name: Date: / /
Facility Capacity (# of Buses): Assessed by:
Age: Yrs. Gross Area: Sq. Ft. Date of last Facility Renovation:
ASSET CONDITION RATINGS: 1 = WORN, 2 = MARGINAL, 3 = FAIR, 4 = GOOD, 5 = EXCELLENT
ASSET CLASS COMMENT LAST RENOV. PHOTO CONDITION
Site (sidewalks, landscaping/grounds, fences, roadways/driveways, lighting)
1 2 3 4 5
Building (exterior - walls, windows, stairs, doors, interior - flooring, walls, ceiling, stairs)
1 2 3 4 5
Roof (roofing system, gutters/drains, skylight)
1 2 3 4 5
Heat/Ventilation (capacity/reliability, ventilation/air conditioning)
1 2 3 4 5
Mechanical/Plumbing Systems (floor drains, plumbing fixtures, fire protection system)
1 2 3 4 5
Electrical System (wiring, panels, convenience outlets and switches)
1 2 3 4 5
Industrial /Wastewater Treatment System (sand; interception; oil/water separation, water treatment equipment)
1 2 3 4 5
Building Equipment (elevators, air compressors/sump pumps/ejectors)
1 2 3 4 5
Cranes 1 2 3 4 5
Hoists 1 2 3 4 5
Lifts 1 2 3 4 5
Storage Areas 1 2 3 4 5
Buswasher 1 2 3 4 5
Other 1 2 3 4 5
ACTIVITIES PERFORMED AT THIS FACILITY: Preventive Maintenance Normal Running Repairs Engine Re-Builds Road Call Repairs
Transmission Replacement Normal Body Work Component Re-builds
Normal Running Repairs Heavy Body Work Normal Bus Servicing
ASSET INVENTORY AND CONDITION ASSESSMENT GUIDE 5-4

CHAPTER 5: “HOW TO GUIDE TO” �ONDUCT SAMPLING OF ASSETS
Table 12: Sample Condition Rating Definitions
Facilities: Bus Maintenance Facilities (Garages)
Component Element Condition 1 Condition 2 Condition 3 Condition 4 Condition 5
Roof Summary Significant deterioration; over 30 years old; leaks, patches and broken parts; poor drainage
Signs of deterioration; over 20 years old; minor leaks; drainage problems; strong consideration for replacement
Minor signs of deterioration; 1-20 years old; no leaks; drainage functional
No signs of wear or deterioration; 5-10 years old
New; under warranty; rehabilitated or renovated
Roofing Significant Signs of Minor signs of No signs or New; under System deterioration;
several roof leaks, numerous patches; over 39 years old; rotting roof deck
deterioration; minor leaks; water ponding; greater than 20 years old
deterioration; no leaks; 10-20 years old; minor repairs
wear or deterioration; 5-10 years old
warranty; rehabilitated or renovated
Gutters, Gutters missing Some gutters Gutters and All gutters and New; under Drain in part, leaking, and drains not drains drains in good warranty; System defective or
broken supports, incorrect pitch; roof drainage system not functioning as designed
functioning functional; only minor defects
condition and good working order
rehabilitated or renovated
Skylights Leaking; cloudy glazing; boarded over
Minor leaks, thermally inefficient
No water leaks No water or air leaks; thermally efficient
New; under warranty
5.3.3 Composite Scoring Using the scores of individual components and elements, the on-site condition data can be aggregated into a single, overall condition score for an asset. Since the condition assessments were conducted at the component level, and the inventory data in many cases were aggregated at the asset sub-category level, RTA developed weighting factors to calculate an aggregated asset-level condition based on the percent value of each component/element. For example, the replacement cost for a revenue bus’s components were used to calculate the weighting factors for the interior, the exterior, engine compartment, and chassis components of the bus. These same percentages would then be applied to the individual component/element condition scores to derive a single aggregated asset condition score, as shown in Figure 16. The RTA used this approach for all major assets with disaggregated components/elements.
ASSET INVENTORY AND CONDITION ASSESSMENT GUIDE 5-5

CHAPTER 5: “HOW TO GUIDE TO” �ONDUCT SAMPLING OF ASSETS
Figure 16: Asset Composite Scoring Process
5.4 Executing the Sampling Site Visits The policies and procedures for executing the sampling work should be established by each agency. They will vary based on an agency’s asset modes (e;g;, bus, heavy rail) and resources.
The on-site sampling schedule developed in Step 3 of Figure 12 will provide an overview of the on-site inspections. However, additional coordination will be necessary based on required assessor qualifications and staffing availability. If a contractor team is conducting the assessment work, coordination is needed between the contractor team and agency staff.
During the initial sampling visits, clarification questions will likely arise about how to classify the condition of an asset. On-site team training for the first day provides an opportunity to address questions and improve consistency across how condition assessors administer the ratings.
RTA found that for the level of detail required in the condition assessments, one condition assessor staff person was sufficient for all asset types. The degree to which the assessor needed to be accompanied on site varied widely. For park-and-rides, stations, and some structures, one contractor staff could survey the facility without agency staff oversight. In some cases, to minimize the agency staff time, combined visits were scheduled (e.g., vehicles and maintenance facilities).
5.5 Integration of Sampling Data into Inventory The last step in sampling is importing the condition rating sampling data into the inventory database. Sampled condition ratings require a different field than the projected condition rating fields for assets, which is based on age or on decay curves if available. The date of sampling (month-day-year) should be captured as well. The process to import the data varies based on the IT capabilities of an agency and can range from manual data entry to importing of data recorded on laptops or tablets.
Agencies need to determine for themselves how to utilize the condition rating data collected. Logical next steps and potential uses of the information include:
Adding to the inventory for Operations, populating CMMS/EAM
Preparing condition rating reports by asset class; presenting to management
Integrating into condition rating database to calibrate decay curves, if applicable
Updating condition projections and capital replacement program
Supporting ad-hoc requests
Using as input for project prioritization.
ASSET INVENTORY AND CONDITION ASSESSMENT GUIDE 5-6

Appendix A: Glossary and Abbreviations
ACM Annual Capital Maintenance – Ongoing minor capital investments as required to maintain a state of good repair over the next 10-year period.
Asset Decay Curves
FTA has developed “generic” transit asset decay curves for major asset types using data collected from transit agencies nationwide. An asset decay curve joins age with physical condition so the curve itself becomes the predictor of the asset’s physical condition.
Asset Types Categories of assets making up each Service Board asset inventory. The Capital Decision Prioritization Support Tool uses five main categories of assets: Guideway; Stations; Facilities; Systems and Vehicles.
Backlog Deferred investments in asset rehabilitation, replacement, and annual capital maintenance.
Condition Rating Levels Rating levels established by RTA and the Service Boards for purposes of categorizing physical condition of assets. The five levels are: excellent, good, adequate, fair, and worn.
Contingency Costs
Contingency costs are budgeted for unforeseen emergencies or design shortfalls typically identified after a project commences. The contingency is included in the budget to minimize interruptions due to changes or cost overruns.
Capital Optimization Support Tool / COST
Capital Optimization Support Tool - Decision support tool developed by RTA with support from the Service Boards to assess and prioritize transit capital investment needs within the parameters of regional funding and the region’s long-term strategic objectives.
Facilities The Facilities category includes all assets related to maintenance and administrative facilities (but excluding systems within the facilities). Facilities represent one of five main COST asset types.
FTA Federal Transit Administration
Guideway Guideway includes all assets related to the guideway including track, track or Bus Rapid Transit (BRT) guideway, and associated structures. Guideway is one of five main COST asset types.
MAP-21 Moving Ahead for Progress in the 21st Century, the 2012 Transportation Legislation bill
Normal Reinvestment Normal replacement, plus scheduled rehabilitation work and Annual Capital Maintenance
Normal Replacement
Ongoing replacement of existing assets as they reach the end of their expected useful life. Normal replacement does not include deferred replacement needs, only those needs for assets that will reach the end of their useful life over the next ten year period.
Rehabilitation Ongoing rehabilitation needs for existing assets. Rehabilitation does not include deferred rehabilitation needs, only those rehabilitation activities that will arise over the next ten year period as required to maintain a state of good repair.
RTA Regional Transportation Authority of Northeastern Illinois
ASSET INVENTORY AND CONDITION ASSESSMENT GUIDE A-1

“HOW TO GUIDE TO” �ONDUCT SAMPLING OF ASSETS
SGR
State of Good Repair – Federally-led, collaborative initiative to comprehensively articulate the problem, to define a commonly adopted definition of “state of good repair”, and to identify strategies, technical assistance briefs, peer to peer exchanges, and best practices aimed at achieving such a state industry-wide (FTA, Transit State of Good Repair, Beginning the Dialogue, October 2008). For the RT!’s �ondition !ssessment Updates, SGR is used primarily as a major assumption for determining capital needs – that is, assets are replaced once they reach useful life, all rehabs are performed and capital maintenance is up to date.
Stations
Stations represent customer facing facilities, and include assets such as passenger stations, transfer terminals, and park and rides. Station assets exclude systems assets already accounted for under Systems. Stations represent one of five main COST asset types.
Soft Costs
The majority of soft costs are expended in the planning, engineering, and project management efforts. These services include in-house agency staff, government related support staff, and the occasionally consultants. Project start-up expenses are also included in this category; Project financing cost and “other” expenses (reconciliation and unaccountable costs) comprise the full range of project development capital costs (FTA definition).
Systems Systems include all infrastructure support categories, such as communications, train control, traction power, and fare collection systems. Systems represent one of five main COST asset types.
TAM Transit Asset Management
TERM Transit Economics Requirements Model – FTA-led program, which is FT!’s capital needs analysis tool. TERM Lite represents a local/regional version of TERM.
Useful Life Expected life of a particular asset (e.g., 12 years for a transit bus). Expected useful lives for individual assets are driven by several factors, including historical performance, manufacturer recommendations, and policy.
Unconstrained Needs Financially unconstrained. Unconstrained needs scenarios are typically the first run to establish total asset management needs in order to fully measure the combination of upcoming needs as well as any existing backlog.
Vehicles Vehicles include both revenue vehicles and non-revenue vehicles. Vehicles represent one of five main COST asset types.
ASSET INVENTORY AND CONDITION ASSESSMENT GUIDE A-2

Appendix B: Sample Data Field Definitions The data field definitions on the pages that follow are examples of typical fields collected in building an asset inventory. The table provides suggested unites, as well as examples and potential values.
For additional information, please contact Mr. John Goodworth, Division Manager, RTA, [email protected]
ASSET INVENTORY AND CONDITION ASSESSMENT GUIDE B-1

“HOW TO GUIDE TO” �ONDUCT SAMPLING OF ASSETS
FIELD NAME DEFINITION UNITS EXAMPLE POSSIBLE VALUES
Record ID Internal unique database record ID number, automatically assigned by Access
- - -
Update Status Please indicate the type of change for any revision you make to the existing data. The choices are "add" (for new assets), "delete" (for retirements) or "modify" (for updates/changes). Please note that assets acquired between January 1 2010 and December 31, 2011 are considered New Assets so the choice "add" should be identified.
N/A add add, delete, modify: old, modify: new
Service Board The Service Board reporting on the asset. N/A PACE CTA, METRA, PACE
FTA Asset Type Code
Mapping to the FTA TERM Asset Structure N/A 10210 5 Digit Numeric
SB Asset Number The asset identification number the Service Board uses to track the asset. This field could correspond to the Service Board Financial Accounting asset number, or some other internal reference number.
N/A 722ACG16 78
Alphanumeric
Quantity The number of assets included in this record (row). Each 1 Integer, minimum of 1
Area The number of square feet in a parking lot, station platform, maintenance facility, yard or bus turn-around.
Square Feet
1425 Integer
Line The overall route designation. N/A Blue; 82; UP-N
Rail line or route number
Branch The designation for a part of a line. N/A Douglas Text
Start The distance measurement for the start of a linear asset, such as a milepost or surveying distance for a rail line.
Milepost or feet
11.29; 42+04
Decimal number or stationing number
End The distance measurement for the end of a linear asset, such as a milepost or surveying distance for a rail line.
Milepost or feet
11.29; 42+04
Decimal number or stationing number
Length The difference between the End and Start measurements, in whole feet. Feet 423 Integer
Track Number The operator's designation for the rail track associated with the asset at a location, where there is more than one track and the track number is needed to identify the asset in question.
N/A 2 Integer, minimum of 1
Location Name The name of the asset location, such as a station, garage, storage facility or maintenance facility.
N/A Noyes Text
Location Address The street address, city and zip of the asset location. N/A 837 Noyes, Evanston 60201
Alphanumeric
Design Life The number of years the asset can be expected to be used before wearing out and needing to be replaced (sometimes also referred to as "useful life").
Years 20 Integer, minimum of 1
In Service Year The year the asset was purchased and/or put into service. 4-Digit Year Number
1944; 2003 Four-digit year number
ASSET INVENTORY AND CONDITION ASSESSMENT GUIDE B-2

“HOW TO GUIDE TO” �ONDUCT SAMPLING OF ASSETS
Remaining Life
FIELD NAME DEFINITION
The difference between the design life and the number of years since the asset was put into service (this is automatically calculated, unless it is overridden with a different value due to rehab activity). Field has already been updated for 2012.
Years
UNITS
12
EXAMPLE
Calculated integer = Design Life -(CurrentYear -InServiceYear)
POSSIBLE VALUES
Usage A qualitative assessment of the usage level of the asset, such as the traffic level or impact placed on a rail line. Heavily used assets are expected to decay more rapidly than lightly used assets.
N/A Heavy Light, Medium, Heavy
Maintenance Regimen
A qualitative assessment of the amount of maintenance the asset typically performed on the asset. A low maintenance regime means no to minimal maintenance; a medium maintenance regime means standard preventive maintenance activities were performed on the asset; a high maintenance regime means the Service Board performed "above and beyond" normally expected preventive maintenance on the asset.
N/A High Low, Medium, High
Year Major Renovation
The year in which the last major renovation, rehab or overhaul of the asset took place.
N/A 2008 Four-digit year number
Number of Rehabs per Life
The number of renovations, rehabs or major overhauls the asset requires in order to achieve its full design life (many assets have 1 major overhaul during its life; many systems assets are simply replaced when they reach the end of their useful life).
N/A 1 Integer
Rehabilitation Cost The cost of the rehabilitation (of thousands of dollars) of an individual item in the asset row, in $2011.
Thousands of Dollars
15 Dollars, in thousands (000's)
Mode
Serial Number
Mode most corresponding to the assets TERM designation (Bus, Rail, Paratransit. Specific definitions are: MB (motor bus); HR (heavy rail); CR (Commuter Rail); DR (Demand Response); VP (Vanpool); SY (systemwide asset, covering multiple modes)
The manufacturer-assigned serial number or VIN for the asset item. N/A
N/A
N/A HR
RCI290196
MB, HR, CR, DR, VP, SY
Alphanumeric
Model
Manufacturer
The manufacturer-assigned model name of the asset item.
The name of the company that made the item.
N/A Crown Victoria
Ford Text
Text
Description A short description of the asset, to help identify what differentiates it from other items in the same category.
N/A Nordco Spike Driver w/Gauger
Text
Owner
Design Headway
Reverse Signals
Track Type
The owner of the asset, which is generally the service board. Other owners can be a corporation (e.g., BNSF owns track that Metra uses or a real estate company owns the land for a bus turn-around) or by a municipality (such as a station or parking lot).
The system design headway for a cab signal, in seconds.
Whether or not the cab signal system has reverse signals.
Whether the track is straight (tangent) or curved (curved).
N/A
Seconds
N/A
N/A
METRA, Riverside Plaza Inc.
90
Y Y, N
tangent tangent, curved
Text
Integer
ASSET INVENTORY AND CONDITION ASSESSMENT GUIDE B-3

“HOW TO GUIDE TO” �ONDUCT SAMPLING OF ASSETS
FIELD NAME DEFINITION UNITS EXAMPLE POSSIBLE VALUES
Number Of Spans The number of spans of a bridge or track support structure that are included in the single asset.
N/A 3 Integer
Number Of Tracks The number of tracks that are included in the single asset. N/A 4 Integer
Number of Tie Replacement
Estimate of number of ties that need to be replaced each year (Metra field only)
N/A 1200 Integer
Number of Grade Crossings to Rehab
The number of grade crossings that are scheduled to be rehabilitated during the year in question.
N/A 10 Integer
Bus Length The length of the model of bus, in feet. Feet 49 Integer
Replacement Cost Each
The replacement cost (in thousands of dollars) of an individual item in the asset row, in $2011.
Thousands of Dollars
29.5 Dollars, in thousands (000's)
Replacement Cost Total
The replacement cost (in thousands of dollars) of all items in an asset row where the quantity is greater than 1, in $2011.
Thousands of Dollars
295 Dollars, in thousands (000's)
Annual Capital Maintenance Cost
The cost associated with keeping an asset in a state of good repair, annualized, and in $2011. Capital maintenance costs are typically significant and anticipated and are associated with keeping the asset in service for the full term of its useful life. Capital maintenance costs are characterized by replacement or rehabilitation of asset components, but not replacement of the entire asset. Examples of typical capital maintenance costs are bus overhauls (CTA, Pace), rail car overhauls (CTA, Metra), structure component replacement such as flange angles, foundations or connection angles (CTA, Metra).
Thousands of Dollars
30 Dollars, in thousands (000's)
Condition Rating (Age Based)
Age-based condition rating for the asset(s), based on 2009 Baseline Assessment and updated to December 2011. 5: Excellent; 4: Good; 3: Adequate; 2: Marginal; 1: Past Its Useful Life.
N/A 3 1, 2, 3, 4, 5
Condition Rating (Decay Curve)
Decay-curve condition rating based on TERM Decay curves for each asset.
Soft Cost % The majority of soft costs are expended in the planning, engineering, and project management efforts. These services include in-house agency staff, government related support staff, and the use of consultants for particular tasks. Project start-up and initiation expenses are also included in this cost category. Project financing cost and an "other" expense line item, which includes any reconciliations and unaccountable costs, comprise the full range of project development capital costs. (Federal Transit Administration definition)
N/A 12.5 Decimal percent, to 1 decimal place
Contingency % These costs are budgeted for unforeseen emergencies or design shortfalls typically identified after a project commences. The contingency is included in the budget so the project can proceed with minimal interruption for changes or cost overruns
N/A 20.0 Decimal percent, to 1 decimal place
ASSET INVENTORY AND CONDITION ASSESSMENT GUIDE B-4

“HOW TO GUIDE TO” �ONDUCT SAMPLING OF ASSETS
FIELD NAME DEFINITION UNITS EXAMPLE POSSIBLE VALUES
Comments Any additional comments needed to describe the asset or clarify its condition rating.
N/A All of these fare boxes will need to be replaced in 4 years when a new fare card system is introduced.
Text
ASSET INVENTORY AND CONDITION ASSESSMENT GUIDE B-5

Appendix C: Major Useful Life Assumptions
Useful Life Assumptions, CTA RTAAssetType Code Category Sub-Category Element Sub-Element UsefulLife Rehabs
Track Structures 10112 Guideway Elements Guideway At Grade Ballast HR 80 0
Track Structures 10322 Guideway Elements Guideway Elevated Structure Steel Viaducts HR 80 0
Track Structures 10402 Guideway Elements Guideway Elevated Fill HR 80 0
Track Structures 10512 Guideway Elements Guideway Underground Tunnel HR 80 0
Track Structures 10602 Guideway Elements Guideway Retained Cut HR 80 0
Rail 11000 Guideway Elements Trackwork - - 30 0
Rail 11101 Guideway Elements Trackwork Direct Fixation Tangent 40 0
Rail 11102 Guideway Elements Trackwork Direct Fixation Curve 25 0
Rail 11201 Guideway Elements Trackwork Ballasted Tangent 40 0
Rail 11202 Guideway Elements Trackwork Ballasted Curve 25 0
Grade Crossings 11303 Guideway Elements Trackwork Embedded At-Grade Crossings 20 0
Special Trackwork 11400 Guideway Elements Trackwork Special - 40 0
Bus Turnaround 13201 Guideway Elements Bus Guideway Turnaround CTA 20 5
Other Major Facilities 21100 Facilities Buildings Administration - 60 1
Railcar Maint Shops 21152 Facilities Buildings Administration CTA Admin Building - 2 floor 60 5
Other Major Facilities 21251 Facilities Buildings Maintenance CTA -- Interior Bus 60 5
Bus Garages 21251 Facilities Buildings Maintenance CTA -- Interior Bus 60 5
Other Major Facilities 21254 Facilities Buildings Maintenance CTA -- Rail 60 5
Railcar Maint Shops 21254 Facilities Buildings Maintenance CTA -- Rail 60 5
Other Major Facilities 21255 Facilities Buildings Maintenance CTA -- Warehouse 60 5
Yard 22212 Facilities Storage Yard Rail HR 50 1
Work Equipment Misc 23300 Facilities Equipment Maintenance - 20 0
Other Major Facilities 25000 Facilities Central Control - - 60 1
Cab Signals 31102 Systems Train Control Wayside Train Control HR 25 0
Grade Crossings 31402 Systems Train Control Roadway Crossings HR 25 0
Interlockings 31500 Systems Train Control Interlockings - 40 0
Substations 32202 Systems Electrification Substations HR 30 0
SCADA RTUs 32210 Systems Electrification Substations SCADA RTUs 7 0
ROW Traction Power 32400 Systems Electrification Contact Rail Contact Rail/Chairs/Anchor/Incline 20 0
ROW Traction Power 32400 Systems Electrification Contact Rail Contact Rail/Chairs/Anchor/Incline 25 0
Substation Distribution 32501 Systems Electrification Power Cable Substations 30 0
Subway Electrical Serv 32600 Systems Electrification Building Electrical Systems 25 0
Cable Plant Fiber 33101 Systems Communications Cable - 20 0
Fiber Optic BB 33102 Systems Communications Cable Nodes 10 0
Public Address Audio 33200 Systems Communications PA Systems - 10 0
Bus Rail Radio Systems 33700 Systems Communications Base Radio Stations - 15 0
SCCTV Cameras 33900 Systems Security/Surv Equipment - 15 0
CCTV Stations 33900 Systems Security/Surv Equipment - 5 0
Vault Operations 34002 Systems Central Revenue Collection - HR 10 0
Subway Illumination 36101 Systems Utilities Lighting Subway 20 0
Subway Pumps 36204 Systems Utilities Sump Pumps Subway 30 0
Subway Fans - no updates 36302 Systems Utilities Fan Plants Subway 25 0
GPS OnBoard Bus 37004 Systems ITS GPS - 10 0
Stations 41051 Stations Rail CTA At-Grade 60 5
Stations 41052 Stations Rail CTA At-Grade Median 60 5
Stations 41053 Stations Rail CTA Elevated 60 5
Stations 41054 Stations Rail CTA Subway 60 5
Station Parking 41601 Stations Rail Parking Garage 20 5
Station Parking 41602 Stations Rail Parking Lot 20 1
Public Address VMS 41901 Stations Rail Signage & Graphics Electronic 10 0
Rail Revenue Cars 51601 Vehicles Revenue Vehicles Heavy Rail HR 25 3
Buses 51903 Vehicles Revenue Vehicles Motor Bus BA 12 1
NonRevenue Vehicles 53001 Vehicles Non-Revenue Vehicles Car - 5 0
Work Trucks 53002 Vehicles Non-Revenue Vehicles Truck - 10 0
NonRevenue Vehicles 53002 Vehicles Non-Revenue Vehicles Truck - 5 0
Work Equipment Trailers 53003 Vehicles Non-Revenue Vehicles Special - 15 0
RailborneWork Equipment 53003 Vehicles Non-Revenue Vehicles Special - 20 0
ASSET INVENTORY AND CONDITION ASSESSMENT GUIDE C-1

Useful Life Assumptions, Metra RTAAssetType Code Category Sub-Category Element Sub-Element UsefulLife Rehabs
Rail Bridges NCS 10330 Guideway Elements Guideway Elevated Structure Bridge 80 0
Rail Bridges - MD-N 10330 Guideway Elements Guideway Elevated Structure Bridge 80 0
Rail Bridges-MD-Main 10330 Guideway Elements Guideway Elevated Structure Bridge 80 0
Rail Bridges-MD-W 10330 Guideway Elements Guideway Elevated Structure Bridge 80 0
Rail Bridges -SWS 10330 Guideway Elements Guideway Elevated Structure Bridge 80 0
Rail Bridges_UP-W 10330 Guideway Elements Guideway Elevated Structure Bridge 80 0
Rail Bridges_UP-NW 10330 Guideway Elements Guideway Elevated Structure Bridge 80 0
Rail Bridges_UP-N 10330 Guideway Elements Guideway Elevated Structure Bridge 80 0
Rail Bridges_RI 10330 Guideway Elements Guideway Elevated Structure Bridge 80 0
Rail Bridges_ME 10330 Guideway Elements Guideway Elevated Structure Bridge 80 0
Rail Bridges_HC 10330 Guideway Elements Guideway Elevated Structure Bridge 80 0
Rail Bridges_BNSF 10330 Guideway Elements Guideway Elevated Structure Bridge 80 0
Rail 11200 Guideway Elements Trackwork Ballasted - 70 0
Grade Crossing Track 11303 Guideway Elements Trackwork Embedded At-Grade Crossings 12 0
Special Trackwork 11400 Guideway Elements Trackwork Special - 70 0
Ties 11601 Guideway Elements Trackwork Ties Wood 28 0
Ties 11601 Guideway Elements Trackwork Ties Wood 32 0
Maint & Yard Facilities 21154 Facilities Buildings Administration Metra Admin Building - 15 floor 60 5
Maint & Yard Facilities 21257 Facilities Buildings Maintenance Metra -- Rail 60 5
Work Equipment 23311 Facilities Equipment Maintenance Rail CR 10 0
Work Equipment 23311 Facilities Equipment Maintenance Rail CR 20 0
Maint & Yard Facilities 23403 Facilities Equipment Maintenance Train Washer 60 0
Maint & Yard Facilities 25000 Facilities Central Control - - 60 1
BNSF Signals 31111 Systems Train Control Wayside Train Control Signals & Train Stops CR 40 0
Metra Signals 31111 Systems Train Control Wayside Train Control Signals & Train Stops CR 40 0
UP Signals 31111 Systems Train Control Wayside Train Control Signals & Train Stops CR 40 0
CN (NCS) Signals 31111 Systems Train Control Wayside Train Control Signals & Train Stops CR 40 0
CN (HC) Signals 31111 Systems Train Control Wayside Train Control Signals & Train Stops CR 40 0
BNSF Grade Xing Signal 31401 Systems Train Control Roadway Crossings CR 40 0
CN(NCS) Grade Xing Sig 31401 Systems Train Control Roadway Crossings CR 40 0
CN (HC) Grade Xing Sig 31401 Systems Train Control Roadway Crossings CR 40 0
Metra Grade Xing Sig 31401 Systems Train Control Roadway Crossings CR 40 0
UP Grade Xing Signals 31401 Systems Train Control Roadway Crossings CR 40 0
BNSF Interlockings 31500 Systems Train Control Interlockings - 40 0
UP Interlockings 31500 Systems Train Control Interlockings - 40 0
CN Interlockings 31500 Systems Train Control Interlockings - 40 0
CN (NCS) Interlockings 31500 Systems Train Control Interlockings - 40 0
Metra Interlockings 31500 Systems Train Control Interlockings - 40 0
Substations 32201 Systems Electrification Substations CR 30 0
Traction Power 32501 Systems Electrification Power Cable Substations 40 0
Catenary & Strct 32700 Systems Electrification Overhead Catenary - 40 0
Catenary & Strct 32706 Systems Electrification Overhead Catenary Poles and Foundation 80 0
Cable Plant 33101 Systems Communications Cable - 20 0
Fiber Optic BB Net 33102 Systems Communications Cable Nodes 10 0
Public Address Systems 33200 Systems Communications PA Systems - 10 0
Telephone Systems 33400 Systems Communications PBX - 10 0
Telephone Systems 33401 Systems Communications Phone System - 10 0
Wireless Telephones 33401 Systems Communications Phone System - 5 0
Radio Systems 33500 Systems Communications Radio - 15 0
Radio Systems 33700 Systems Communications Base Radio Stations - 15 0
Microwave 33701 Systems Communications Base Radio Stations - 15 0
Radio Systems 33800 Systems Communications Mobile Radios - 15 0
CCTV Vending 33900 Systems Security/Surv Equipment - 10 0
CCTV Homeland Security 33900 Systems Security/Surv Equipment - 10 0
Fare Collection 34001 Systems Central Revenue Collection - CR 40 0
Fare Collection 34001 Systems Central Revenue Collection - CR 20 0
Fare Collection 34001 Systems Central Revenue Collection - CR 7 0
Fare Collection 35001 Systems Revenue Collection CR Other Fare Equipment 40 0
Fare Collection 35001 Systems Revenue Collection CR Universal Fare Card 15 0
Fare Collection 35111 Systems Revenue Collection In-Station System CR 10 0
Fare Collection 35115 Systems Revenue Collection In-Station TVMs 15 0
Fare Collection 35201 Systems Revenue Collection On-Vehicle Fareboxes 10 0
Train Stations 41056 Stations Rail Metra At-Grade w Building 60 5
Train Stations 41059 Stations Rail Metra Downtown Terminal 60 5
Station Parking 41601 Stations Rail Parking Garage 60 5
Station Parking 41602 Stations Rail Parking Lot 20 1
Locomotives 51301 Vehicles Revenue Vehicles Commuter Rail RL 30 1
Coaches 51302 Vehicles Revenue Vehicles Commuter Rail RP 50 1
EMUs 51303 Vehicles Revenue Vehicles Commuter Rail RS 35 1
EMUs 51303 Vehicles Revenue Vehicles Commuter Rail RS 50 1
NonRevenue Vehicles 53000 Vehicles Non-Revenue Vehicles Work vehicles - 10 0
NonRevenue Vehicles 53000 Vehicles Non-Revenue Vehicles Autos and vans - 5 0
ASSET INVENTORY AND CONDITION ASSESSMENT GUIDE C-2

Useful Life Assumptions, Pace RTAAssetType Code Category Sub-Category Element Sub-Element UsefulLife Rehabs
Garages - Site Work 21153 Facilities Buildings Administration Pace Admin Building - 2 floor 60 5
ADA Facilities 21153 Facilities Buildings Administration Pace Admin Building - 2 floor 50 5
ADA Facilities 21258 Facilities Buildings Maintenance Pace -- Bus - Small 50 5
Garages - Site Work 21258 Facilities Buildings Maintenance Pace -- Bus - Small 60 5
Infrastructure Support 21258 Facilities Buildings Maintenance Pace -- Bus - Small 20 5
Garages - Site Work 21259 Facilities Buildings Maintenance Pace -- Bus - Large 60 5
Radio Systems City 33500 Systems Communications Radio - 20 0
Radio Systems Buses 33500 Systems Communications Radio - 10 0
Radio Systems Sub Para 33500 Systems Communications Radio - 10 0
CTS 33900 Systems Security/Surv Equipment - 4 0
Suburb Event Recorders 33900 Systems Security/Surv Equipment - 5 0
Suburb Road Recorders 33900 Systems Security/Surv Equipment - 5 0
Paratransit Event Rec 33900 Systems Security/Surv Equipment - 20 0
Vanpool Drivecam 33901 Systems Security/Surv Equipment Bus On-Board Video - 20 0
Fare Collection 34000 Systems Central Revenue Collection - - 5 0
Fare Collection Paratransit 35201 Systems Revenue Collection On-Vehicle Fareboxes 7 0
Fare Collection 35201 Systems Revenue Collection On-Vehicle Fareboxes 5 0
ITS IBS Systems 37000 Systems ITS - - 12 0
AVL Systems 37002 Systems ITS AVL - 2 0
AVL Systems 37002 Systems ITS AVL - 5 0
ADA Call Center-other 37003 Systems ITS CAD - 20 0
Bus Terminal 42051 Stations Motor Bus - Pace Bus Terminal 15 1
ADA Pass Facilities 42052 Stations Motor Bus - Pace Bus Park & Ride 10 1
Bus Pass Pavement 42052 Stations Motor Bus - Pace Bus Park & Ride 10 1
Paratransit 51407 Vehicles Revenue Vehicles Demand Response VN 4 0
ADA Rolling Stock 51407 Vehicles Revenue Vehicles Demand Response VN 4 0
Suburb Rolling Stock 51903 Vehicles Revenue Vehicles Motor Bus BA 12 1
Suburb Rolling Stock 51906 Vehicles Revenue Vehicles Motor Bus BD 12 0
Suburb Rolling Stock 51912 Vehicles Revenue Vehicles Motor Bus OTR 12 0
Vanpool 52302 Vehicles Revenue Vehicles Vanpool VN 4 0
ADA Rolling Stock 52501 Vehicles Revenue Vehicles Rural AO 4 0
ADA Rolling Stock 52520 Vehicles Revenue Vehicles Rural - 4 0
Non-Revenue Vehicles 53000 Vehicles Non-Revenue Vehicles Autos and vans - 5 0
Non-Revenue Vehicles 53000 Vehicles Non-Revenue Vehicles Small Trucks - 7 0
Non-Revenue Vehicles 53000 Vehicles Non-Revenue Vehicles Work vehicles - 10 0
ASSET INVENTORY AND CONDITION ASSESSMENT GUIDE C-3

Appendix D: Condition Rating Definitions In order to have a consistent scoring approach, the RTA developed condition rating for all major asset types. The table on the following pages illustrates the condition rating definitions applicable to heavy rail vehicles. When assessors conduct field visits, there is a consistent definition for each condition (1 through 5).
For additional information, please contact Mr. John Goodworth, Division Manager, RTA, [email protected]
ASSET INVENTORY AND CONDITION ASSESSMENT GUIDE D-1

Vehicles, Heavy Rail Vehicles Component Element Condition 1 Condition 2 Condition 3 Condition 4 Condition 5
Summary Major damage; Structural or safety concerns
Deteriorating reliability; structure OK, frequent or major repairs
Minor repairs Preventative maintenance
New; performance acceptable
Car Assembly
Car Body Body panels damaged; roof leaks; paint peeling; attachments, floors and walls damaged; structural concerns
Scratches and dents; paint yellowing; seats patched or dirty; floors, walls and structure generally OK
Light scratches, minor dents & chips; seating worn
Preventative maintenance
New; performance acceptable
Doors Poor reliability; safety concerns
Deteriorating reliability; frequent or major repairs
Minor repairs Preventative maintenance
New; performance acceptable
Electric Wiring corroded or insulation deteriorated beyond repair; converters, lighting or current collectors severely deteriorated, unreliable and unserviceable
Deteriorating reliability; frequent or major repairs
Minor repairs Preventative maintenance
New; performance acceptable
Summary Poor reliability; safety concerns
Deteriorating reliability; frequent or major repairs
Minor repairs Preventative maintenance
New; performance acceptable
Truck Assembly
Couplers Poor reliability; safety concerns
Deteriorating reliability; frequent or major repairs
Minor repairs New; performance acceptable
Trucks Poor reliability; safety concerns; excessive wear; structural deficiencies
Deteriorating reliability; frequent or major repairs
Minor repairs Preventative maintenance
New; performance acceptable
Summary Poor reliability; safety concerns
Deteriorating reliability; frequent or major repairs
Minor repairs Preventative maintenance
New; performance acceptable
Propulsion / Control
Propulsion Poor reliability; safety concerns
Deteriorating reliability; frequent or major repairs
Minor repairs Preventative maintenance
New; performance acceptable
ATC (if used)
Poor reliability; safety concerns; obsolete
Deteriorating reliability; frequent or major repairs
Minor repairs Preventative maintenance
New; performance acceptable
Air & Brakes Poor reliability; safety concerns
Deteriorating reliability; frequent or major repairs
Minor repairs Preventative maintenance
New; performance acceptable
HVAC Poor reliability Deteriorating reliability; frequent or major repairs
Minor repairs Preventative maintenance
New; performance acceptable
ATC/PTC Poor reliability; safety concerns
Deteriorating reliability; frequent or major repairs
Minor repairs Preventative maintenance
New; performance acceptable
ASSET INVENTORY AND CONDITION ASSESSMENT GUIDE D-2

Vehicles, Motor Bus Vehicles Equipment Condition 1 Condition 2 Condition 3 Condition 4 Condition 5
Interior Parts broken or missing, not functional.
Visible leakage, switches or hinges frozen, non-critical parts broken or loose
Corroded or dirty but repairable with cleaning, painting or adjusting
Clean and mechanically sound but age apparent
Like new condition, clean and tight
Exterior Heavy corrosion or damage, holes evident, access doors loose, parts worn beyond reasonable service limits
Corrosion evident, hinges or latches frozen, major cosmetic damage, some non-critical parts broken
Minor corrosion or scrapes present but could be repaired with cleaning priming and painting, minor cosmetic damage, parts heavily worn but serviceable
Condition generally good, may need painting
Like new condition, clean and tight
Engine Heavy corrosion, holes evident, major leaks, parts broken or missing, not functioning
Corrosion and cracking evident, heavy leakage, some mountings broken, damaged cables and belts, heavy wear, broken or missing parts
Minor corrosion or cracking present but repairable, minor leakage, worn cables and belts.
Generally clean, mechanically sound, wear visible, minimal leakage
Like new condition, clean and tight Compartment
Chassis / Under- Heavy corrosion, holes and cracking, massive leaks, parts broken or missing, not functioning
Corrosion and cracking evident, heavy leakage, some mountings broken, damaged hoses, heavy wear, broken or missing parts
Minor corrosion or cracking present but repairable, minor leakage, worn hoses and bushings, some components require adjustment
Generally clean, mechanically sound, visible wear, minimal leakage
Like new condition, clean and tight structure
ASSET INVENTORY AND CONDITION ASSESSMENT GUIDE D-3

Appendix E: Assessment Forms The RTA developed assessment forms for all major asset types. The example that follows is for a CTA rail car. Note RTA developed separate assessment forms for CTA and Metra rail cars, due to the differences in the fleets.
For additional information, please contact Mr. John Goodworth, Division Manager, RTA, [email protected]
ASSET INVENTORY AND CONDITION ASSESSMENT GUIDE E-1

REVENUE VEHICLE (CTA RAIL CAR) ASSESSMENT FORM
Vehicle Identification – Fleet: Vehicle Identification – Vehicle Number:
Date: / / 2013
Assessed by:
Accompanied by:
Vehicle Age: Yrs Mid-Life Overhaul: :
ASSET CONDITION RATINGS: 1 = WORN, 2 = MARGINAL, 3 = FAIR, 4 = GOOD, 5 = EXCELLENT RAIL CAR
COMMENTS LAST
REHAB. PHOTO CONDITION
Car Body Assembly – Summary
1 2 3 4 5
Car Body Exterior 1 2 3 4 5
Door Panels 1 2 3 4 5
Interior (floor, seats, interior panels) 1 2 3 4 5
Vehicle Systems – Summary 1 2 3 4 5
Couplers 1 2 3 4 5
Trucks 1 2 3 4 5
Propulsion / Control 1 2 3 4 5
Auxiliary Electrical System 1 2 3 4 5
ATC 1 2 3 4 5
Operator’s �ab 1 2 3 4 5
HVAC 1 2 3 4 5
Door Operators 1 2 3 4 5
PA/Communications/Run Signs 1 2 3 4 5
Other 1 2 3 4 5
ASSET INVENTORY AND CONDITION ASSESSMENT GUIDE E-2

Transit Asset Management (TAM) Pilot Program
FTA-2011-004-TPM Volume 2 – Capital Optimization Support Tool
September 2013TBG091712092129MKE

INTRODUCTION
This is Volume 2 for the Regional Transportation Authority (RTA)’s Transit Asset Management (TAM) Pilot Project grant from the Federal Transit Administration (FTA). Volume 2 consists of three separate reports included herein, as follows:
Part 1 – RTA Capital Optimization Support Tool (COST) Model “How To” Guide
Part 2 – Multi-Criteria Investment Prioritization Process “How To” Guide
Part 3 – !sset to Project Mapping “How To” Guide
Each report has its own table of contents. Volume 1: Asset Inventory and Condition Assessment Guide is a separate deliverable.
VOLUME 2

Volume 2, Part 1
RTA COST Model “How To” Guide Pilot Product #4: Capital Prioritization Decision Support Tool
Prepared for
Regional Transportation Authority of Northeastern Illinois
September 2013


Table of Contents
1. Introduction .......................................................................................................................1-1 1.1 FTA TAM Grant.................................................................................................................1-1 1.2 RT!’s Capital Decision Prioritization Support Tool ..........................................................1-1 1.3 Definition of Terms ..........................................................................................................1-2
2. Background – RT!’s �apital Optimization Support Tool ........................................................2-1 2.1 RT!’s !sset Management Practices: Past and Present ...................................................2-1 2.2 RT!’s �apital Optimization Support Tool.........................................................................2-2 2.3 COST Development and TERM Lite..................................................................................2-8
3. “How to” 'uide to Opening, Saving and Sharing �OST .........................................................3-1 3.1 Computer Requirements (MS Access) .............................................................................3-1 3.2 3.2 Primer on Saving Access Data Records and Files .......................................................3-1 3.3 Compact and Repair (Damaged and Growing Files) ........................................................3-1 3.4 Sharing Files .....................................................................................................................3-2
4. “How to” 'uide to Navigate �OST .......................................................................................4-1 4.1 Opening the Tool .............................................................................................................4-1 4.2 Main Menu.......................................................................................................................4-1 4.3 Input Forms......................................................................................................................4-2 4.4 Tool Output......................................................................................................................4-4
5. “How to” 'uide to Populate and Maintain �OST..................................................................5-1 5.1 Loading and Modifying Asset Inventory Records ............................................................5-1 5.2 Existing vs. Expansion Assets ...........................................................................................5-5 5.3 Defining Life-Cycle Cost Profiles ......................................................................................5-6 5.4 Ridership by Location Table and Codes ...........................................................................5-8
6. “How to” 'uide to �uild !nalysis Scenarios .........................................................................6-1 6.1 Budget Constraints ..........................................................................................................6-1 6.2 Inflation............................................................................................................................6-4 6.3 Prioritization Adjustments: Calibration and Scenario Analysis (SGR Investments).........6-5 6.4 Investment “Override”.....................................................................................................6-7 6.5 Including Expansion and Enhancement Assets................................................................6-8 6.6 Applications of COST........................................................................................................6-9 6.7 Summary – How to Define a Scenario ...........................................................................6-11
7. “How to” 'uide to Run �OST...............................................................................................7-1 7.1 Running the Model ..........................................................................................................7-1 7.2 Saving Scenarios...............................................................................................................7-2
8. “How to” 'uide to Work with Output..................................................................................8-1 8.1 Reports.............................................................................................................................8-1 8.2 Excel Export......................................................................................................................8-4 8.3 Detailed Run Results ........................................................................................................8-5

Appendix A: Glossary and Abbreviations.................................................................................... A-1
Appendix B: Asset Types in COST ............................................................................................... B-1

CHAPTER 1 INTRODUCTION
1. Introduction 1.1 FTA TAM Grant In 2011, the Regional Transportation Authority of Northeastern Illinois (RTA) received an $800,000 Transit Asset Management (TAM) Pilot Project grant from the Federal Transit Administration (FTA). This pilot project includes TAM improvements that build off existing RTA TAM processes already in progress, namely the Capital Asset Condition Assessment, Capital Decision Prioritization Support Tool (now called the �apital Optimization Support Tool, �OST or “the Tool”), and management approaches already in use. The objectives of RT!’s T!M grant include:
Document RT!’s existing policies; goals and objectives; performance targets and evaluation processes; and inventory/condition data collection, management, and reporting processes such that other local and regional operators can benefit from RT!’s experience
Advance the T!M “state-of-the-art” capabilities in the areas of estimated capital investment needs and investment prioritization
Develop asset-to-project groupings using the analytical foundation provided by RT!’s existing project screening and prioritization process and FT!’s Transit Economic Requirements Model (TERM) model as a foundation for tool development.
The TAM Pilot Project is an 18 month process for RTA, which is documented in two volumes and the four work papers:
Volume 1: Asset Inventory and Condition Assessment Guide
Volume 2: Part 1 – RTA COST Model “How To” Guide, Pilot Product #4: �apital Prioritization Decision Support Tool
Volume 2: Part 2 – Multi-�riteria Investment Prioritization Process “How To” Guide, Pilot Product #2: Multi-Criteria Investment Prioritization Process
Volume 2: Part 3 – !sset to Project Mapping “How To” Guide, Pilot Product #3: !sset-to-Capital Project Numbering Convention.
This document presents the “how to” guide on development and application of RT!’s COST. This document is intended to be helpful to other operators or funding agencies developing and applying similar decision support tools.
1.2 RTA’s Capital Decision Prioritization Support Tool This “How to” Guide provides a detailed description of RT!’s COST, focusing on the required steps to populate, run, and maintain the Tool.
Overview of Tool: !s background, RT!’s COST is an MS Access based analysis model (based on FT!’s TERM Lite Model) designed to perform the following analyses for RTA and its three Service Boards; the Chicago Transit Authority (CTA), Metra and Pace:
1. Assess current size of state of good repair (SGR) backlog. 2. Assess (estimate) current asset conditions. 3. Conduct assessment of 20-year unconstrained capital reinvestment needs. 4. Assess the impact of constrained reinvestment on:
a. SGR backlog
RTA CAPITAL COST OPTIMIZATION TOOL GUIDE 1-1

CHAPTER 1 INTRODUCTION
b. Asset Conditions c. Proportion of assets in SGR
5. Prioritize reinvestment (rehab and replacement) needs based on five investment criteria (asset condition, number of riders impacted and impact of investments on each of the following: reliability, safety, and O&M costs). Includes the prioritization of reinvestment needs for expansion assets assumed to be acquired during the period of analysis.
6. Prioritize investment in expansion/enhancement assets (as proposed by RTA and its Service Boards) based on investment cost per rider impacted.
7. Assess the impact of expansion/enhancement investments on: a. SGR backlog b. Asset Conditions c. Proportion of assets in SGR.
COST’s ability to assess the impact of constrained funding on the RT! region’s future SGR backlog and asset conditions is dependent on its ability to prioritize between multiple SGR investment alternatives (i.e., given that funding is insufficient to address all needs, what needs should we address first?). Development of a reliable SGR prioritization routine was therefore critical to providing COST with the ability to conduct meaningful analyses of the expected impacts of constrained funding on the future SGR backlog and future asset conditions. Much of the prioritization capability developed by RTA for COST has already been adopted and incorporated into FT!’s TERM Lite model; Similarly, the Tool’s ability to select between expansion and enhancement investments when funding is limited required development of a prioritization process for these investment types.
In addition to supporting “what-if” analysis of the potential future impacts of constrained funding, COST’s ability to prioritize reinvestment needs was also intended to help support the identification and prioritization of actual reinvestment projects. Specifically, RTA and its Service Boards can use the tool as an independent and objective review of the list of SGR investment projects identified by Service Board staff through more traditional engineering and project selection processes. In this role, COST (and its prioritization routine) acts as an “alternative perspective”, potentially identifying reinvestment opportunities and prioritizations that RTA may not have otherwise considered.
Document Overview: The intention of this Guide is to instruct users on the steps required to fully utilize RT!’s COST, including the steps required to populate the tool with data, develop and run “what-if” scenarios and access and export output data. Specifically, this Guide considers each of the following:
Chapter 2: �ackground on RT!’s �apital Optimization Support Tool Chapter 3: Opening, Saving and Existing COST Chapter 4: Populating and Maintaining the Tool Chapter 5: Building Analysis Scenarios Chapter 6: Running the Model Chapter 7: Working with Output.
1.3 Definition of Terms Following are definitions of key terms as used by this Guide:
Needs Analysis: In the context of COST, needs analysis refers to the process of determining the level of investment required to attain specific investment objectives and also with how those investment dollars are allocated to different uses (e.g., between various asset types). In general, needs analysis falls into two broad categories:
RTA CAPITAL COST OPTIMIZATION TOOL GUIDE 1-2

CHAPTER 1 INTRODUCTION
o Unconstrained needs: The level of investment required to address all outstanding and future needs, irrespective of actual or expected funding availability.
o Constrained Needs: As the name suggests, under constrained needs analysis, there is insufficient funding to address all needs. This analysis shows the level of investment required to attain more realistic investment objectives (e.g., maintain the size of the current investment backlog, or eliminate the backlog over 20 years).
Reinvestment in Existing Assets (SGR) vs. Investment in New Expansion or Enhancement Assets: COST is designed to assess and prioritize investment needs for both existing and expansion assets. In general, these investment types fall into the following categories:
o Reinvestment in Existing Assets: Refers to SGR (i.e., rehab and replace) investments in assets that are currently in service (i.e., existing assets).
o Investment in expansion assets: Refers to the planned/proposed future purchase of new assets that either: (i) expand existing service capacity (e.g., fleet expansion), (ii) adds a new service (e.g., New Starts) or (iii) enhance existing service (e.g., new technologies such as real-time arrival information).
Scenario Analysis: In the context of COST, scenario analysis refers to the process of identifying specific investment objectives and then assessing the investment needs associated with attaining that scenario. Examples include:
o Maintain historic funding levels o Maintain the current backlog o Eliminate the backlog over a set time period (e.g., 20 years).
Prioritization: For this Guide, prioritization is the process of identifying a preferred or optimal order for reinvestment events. Implicit in this statement is the assumption that:
o Funding is insufficient to address all needs. Hence prioritization is required to determine which assets should be addressed first (and which assets have needs that may not be addressed)
o Investment needs can be ranked. In other words, there are good analytic or other bases on which to rank investment needs – from highest to lowest—to determine in which outstanding needs are most effectively addressed (and potentially leaving some needs unaddressed).
Asset Condition and Decay: Asset condition refers here to the estimated physical condition of a transit asset. Specifically, COST includes a set of embedded asset decay curves that predict the current and future physical condition of a transit asset based on its type, age and other factors (e.g., use and maintenance history). COST uses these condition relationships to prioritize reinvestment needs (in part) based each asset’s predicted physical condition (both currently and in the future). COST also uses these same asset decay curves to generate current and future distributions of asset conditions.
The following definitions for State of Good Repair (SGR) separate the asset level from aggregate level.
Asset Level SGR: An asset is in a state of good repair (SGR) if (i) its age does not exceed its expected useful life and (ii) all rehabilitation and annual capital maintenance activities are up to date. Under these circumstances, an asset has no deferred capital reinvestment needs and, by definition, has an estimated condition score of 2.5 or higher (RTA/TERM Lite decay curves are defined such that assets attain their useful life and a condition score of 2.5 concurrently). If an asset has undergone a major life extending rehabilitation, it can exceed its expected useful life and still be in SGR. Non-attainment of SGR does not imply an asset is unfit for service or unsafe
RTA CAPITAL COST OPTIMIZATION TOOL GUIDE 1-3

CHAPTER 1 INTRODUCTION
but it may increase the likelihood of sub-optimal performance (i.e. reliability and availability performance may decrease).
Mode, Service Board, or Regional Level (Aggregate) SGR: A transit mode, Service Board or the region is considered to be in SGR if each of its component assets is in SGR (as defined above). Mode, Service Board and regional level SGR represents an ideal state and is not attainable in practice as (i) rehabilitation and replacement needs arise continuously and (ii) mode, Service Board and regional level budgets are generally insufficient to meet these continuous needs. As such, a more realistic view of SGR at an aggregate level is based on the region’s target/tolerance for achieving reinvestment goals – such as halving the current SGR backlog over a certain timeframe or not allowing the SGR backlog to grow beyond current levels.
RTA CAPITAL COST OPTIMIZATION TOOL GUIDE 1-4

CHAPTER 2 BACKGROUND – RT!’S �!PIT!L OPTIMIZATION SUPPORT TOOL
2. Background – RTA’s Capital Optimization Support Tool This chapter provides background on RT!’s capital planning processes including
RT!’s asset management practices: past and present COST Overview
COST Development and Relation to TERM Lite.
2.1 RTA’s Asset Management Practices: Past and Present The Regional Transportation Authority (RTA) is responsible for planning, funding and oversight of all public transportation in Northeastern Illinois. As such, the RTA allocates funding to three Service Boards: CTA, Metra commuter rail and Pace suburban bus. The RTA network serves the third largest US transit market, with nine million in population and two million daily rides. The RT!’s combined assets include approximately 7,000 revenue vehicles, 380 rail stations, over 350 bus routes, and 60 maintenance facilities. With some of the nation’s oldest transit assets the RTA also has significant reinvestment needs, including an estimated $24.6 billion over the next ten years to attain and maintain a SGR, which is more than three times higher than the projected funding during the same time period.
Asset Management at RTA: RTA’s current TAM system consists of:
1. an ongoing regional transit asset inventory/condition assessment program 2. an SGR needs assessment process founded on that inventory 3. a project screening and prioritized capital plan development process, that begins with the goals
and objectives set in the Strategic Plan and links to an ongoing performance measurement program.
These latter tools moved the RTA beyond the preexisting Transit Capital Asset Model (CAM) to a more integrated prioritization based routine compatible with FTA’s TERM model.
RT!’s T!M History: In 1987, the RTA completed a detailed examination of the transit system’s capital needs as part of the studies which led to the RT!’s first Strategic Plan. This effort developed the first comprehensive inventory of capital assets and an age-based estimate of capital renewal requirements, known as the RTA Bedrock Investment Program (BIP). The BIP was a spreadsheet-based software tool used to estimate both deferred and future capital needs for the Service Boards. The results of this analysis focused the first Strategic Plan and served as a basis for legislative initiatives to increase the level of capital funding. The BIP pioneered the development of the asset inventory based needs analysis, on which FT!’s TERM was later founded;
The RTA created CAM in 1995 to:
update the original asset inventory
incorporate asset condition information from the extensive engineering assessments of CTA rail infrastructure
improve the model’s utility for the RTA and the Service Board capital planning staff.
CAM estimated current and future capital renewal needs and supported evaluation of the impact of various funding levels and renewal strategies on system conditions over time. CAM was a second generation asset needs analysis tool developed in tandem with FT!’s TERM model (with many of the same capabilities).
RTA CAPITAL COST OPTIMIZATION TOOL GUIDE 2-1

CHAPTER 2 BACKGROUND – RT!’S �!PIT!L OPTIMIZATION SUPPORT TOOL
The Regional Transportation Asset Management System (RTAMS) is a transportation information retrieval system developed by the RT!; The system’s goal is to improve access to the region's enormous transportation data resources being gathered by the RTA, its Service Boards and other regional transportation and planning agencies. RTAMS has followed an evolutionary development path since the initial pilot project proposal was presented to the RTA Board in August 2000.
After successful completion of the pilot, RTAMS has been used by RTA staff since the summer of 2001 with incremental improvements to the system deployed each year. Each increment added new content, enhanced usability and improved functionality. Improvements have been driven by user feedback and the addition of content partners. Developmental highlights included:
site redesign and external access to CTA, Metra, and Pace in the fall of 2002
transformation from an interactive mapping application to a full Web site giving access to other transportation and planning agencies and municipal officials in 2003
addition of planning studies and the Illinois State Toll Highway Authority as a content partner in 2004
performance and capacity improvements and website launched to the general public in 2005.
RTAMS is now a live interactive web-site.
Strategic Plan – Moving Beyond Congestion (MBC): In July of 2006, the RTA, along with CTA, Metra, and Pace, and its Partners for Transit (business, government, civic and religious organizations that have joined the RTA in their commitment to transit and the MBC initiative) launched MBC, a strategic planning project meant to raise awareness about the need to maintain, enhance and expand transit service, and to solicit input from key stakeholders and the general public. The !uthority’s strategic plan included the further goals of enhancing coordination, integrating information, and improving system access and ease of use. One of the purposes of the Strategic Plan was to provide a long-range plan to guide the region in achieving a world-class public transportation system which is the keystone to growing business opportunities, a thriving job market, clean air and livable communities over the coming decades. Furthermore, the Strategic Plan allowed the RTA and the Service Boards to address critical questions about the condition and adequacy of the public transportation system, as well as the external forces and factors, such as growing traffic congestion.
TAM Related Legislation Requirements: The strategic planning work provided the foundation for the subsequent funding and Illinois reform legislation enacted in January 2008 as P.A. 95-0708. The legislation mandates the RTA to provide more effective financial oversight, regional planning, and coordination among the three operating Service Boards. In enhancing the role of the RTA, the legislation makes the Strategic Plan the cornerstone of all the RTA planning, financial and oversight activities going forward.
2.2 RTA’s Capital Optimization Support Tool In April 2011, RTA initiated development of the Capital Decision Prioritization Support Tool (now Capital Cost Optimization Tool or COST). COST is an MS Access based database and model that houses a comprehensive inventory of all major capital assets owned and operated by RT!’s three Service �oards; COST also includes asset type specific life expectancies and life cycle reinvestment rules used to allow the tool to asses or predict each of the following:
Current size of SGR backlog
20-year unconstrained capital reinvestment needs
The impact of constrained reinvestment on: o SGR backlog
RTA CAPITAL COST OPTIMIZATION TOOL GUIDE 2-2

CHAPTER 2 BACKGROUND – RT!’S �!PIT!L OPTIMIZATION SUPPORT TOOL
o Asset Conditions o Proportion of assets in SGR
Prioritize reinvestment (rehab and replacement) needs Prioritize proposed expansion and enhancement investments Assess the impact of expansion/enhancement investments on:
o SGR backlog o Asset Conditions o Proportion of assets in SGR.
Need for SGR Investment Prioritization: COST’s ability to assess the impact of constrained funding on the RT! region’s future SGR backlog and asset conditions is dependent on its ability to prioritize between multiple SGR investments (i.e., rehab and replacement of existing assets). More specifically, when funding is not sufficient to address all SGR investment needs (i.e., funding is constrained), then the Tool requires rules to determine which needs are addressed and which needs will enter the SGR backlog. The prioritization rules allow the Tool to rank SGR investment needs from highest to lowest priority. For each year of a constrained model run then, COST reorders investment needs from highest to lowest priority and then invests in these needs from highest to lowest until the available funding capacity for that year is exhausted. This process is repeated for each year of COST’s 20-year forecast period.
Need for Expansion/Enhancement Investment Prioritization: Similarly, COST also requires the ability to prioritize between investments in additional assets, including those that either expand service capacity/add new services (expansion investments) or those that enhance the quality of existing services (enhancement investments). As with the SGR reinvestment prioritization, the expansion/enhancement investment prioritization ranks these investments from highest to lowest, based on cost and number of riders that benefit, and then invests in these needs until the available funding capacity is exhausted.
Prioritization - SGR Backlog Management: As described to this point, COST’s prioritization routine is used as a means to allocate funding between competing needs for the primary purpose of assessing the impact of alternative reinvestment priorities on the size and composition of the region’s SGR backlog and long-term reinvestment needs. As different reinvestment priorities will lead to some asset needs being addressed and others entering the SGR backlog, adjusting these priorities and their weights allow an analyst to use COST to examine the desirability of alternative investment prioritization weights with respect to the SGR backlog. COST can then help identify a preferred mix of investment priorities that can be used to guide actual reinvestment priorities within the region.
Prioritization - Capital Programming: COST’s prioritization capabilities can also provide a more direct input to the region’s investment prioritization process; Specifically, RT! and the Service �oards can
RTA CAPITAL COST OPTIMIZATION TOOL GUIDE 2-3

CHAPTER 2 BACKGROUND – RT!’S �!PIT!L OPTIMIZATION SUPPORT TOOL
compare COST’s selected reinvestment priorities, for specific asset types and locations, with the reinvestment priorities identified through more traditional engineering and project planning methods (e.g., as documented in the CIP and capital budgets). In this role, COST provides an independent, objective and alternative review of the region’s reinvestment plans. This comparison can then be used to help further refine and prioritize those plans, potentially leading to improved investment decisions.
COST and The Multi-Criteria SGR Investment Prioritization Process: RT!’s objective in developing the multi-criteria prioritization process for SGR investments was to equip COST with the two types of prioritization capabilities described above, i.e.:
Analyze the impact of alternative reinvestment priorities on future SGR backlog needs and
Support the prioritization of actual reinvestment actions (through comparison of Tool investment selections with engineering based project selections)
Hence, all of the prioritization development actions described in this Guide and in more detail in the Multi-�riteria Investment Prioritization Process “How To” Guide have been conducted with the purpose of providing RT!’s COST with these two capabilities.
For each year of a 20-year model run, COST first identifies which of the region’s assets require some reinvestment action (e.g., rehab or replacement) to attain SGR. Next, the Tool assigns prioritization scores to each of these assets and the tool will reinvest in the highest scoring assets until the expected amount of reinvestment funding for that year are exhausted. Using this prioritization, COST then determines for each year, what assets undergo reinvestment actions, what assets enter the SGR backlog, and what projects the funded investment actions imply.
A higher level conceptual overview of COST’s SGR reinvestment needs and prioritization analysis is found in Figure 2-1; This representation emphasizes the Tool’s reliance on the asset inventory data obtained from RT!’s annual asset inventory and condition assessment update process; Figure 2-1 also highlights the simulation process used for each year of the 20-year period of analysis to:
1. assess needs for each analysis year 2. score and rank all potential investment actions and 3. undertake the highest ranked investment actions subject to expected funding capacity.
These prioritized annual needs are then used to help develop a 10-year regional investment plan.
RTA CAPITAL COST OPTIMIZATION TOOL GUIDE 2-4

CHAPTER 2 BACKGROUND – RT!’S �!PIT!L OPTIMIZATION SUPPORT TOOL
Figure 2-1: COST – SGR Needs Forecasting and Prioritization Tool Combined
Input OutputIterate From Year 1 to Year 20…
Condition Assessment RTA Prioritization Tool
Reinvest Subject to Funding• What can we
afford?
Asset Inventory
• What are asset conditions?
20-Yr SGR Plan
• Prioritized• Constrained• Allocated
Score / Rank Investments
• What has priority?
Assess SGR Needs
• What needs to be done?
Repeat for next year
Figure 2-2 provides an overview of the five investment criteria used to score and rank all potential SGR reinvestment actions – including asset condition, number of riders impacted, and the contribution of reinvestment actions to each of service reliability, rider and agency staff safety and security, and finally O&M cost reduction. The weight placed on each criterion is variable within COST and hence can be varied to reflect agency policies or to conduct sensitivity analyses. The process used to score each SGR reinvestment criterion is highlighted in Figure 2-3 (refer to the “How to” Guide for Multi-Criteria Prioritization for a more in-depth explanation).
Figure 2-2: COST – SGR Investment Prioritization Criteria and Scoring
Multi-Criteria Decision Analysis (MCDA) Based ApproachAsset
ConditionScore:
Declining condition yields
higher points score
Riders Impacted
Score: Based on number of
riders served by asset location
Service Reliability
Score:Reduced risk of service failures /
disruptions
Safety / Security
Score: Reduced risk of injuries,
fatalities, property damage
O&M CostsScore: Impact on Operating & Maintenance
costs
Weighted Average Total Investment Score:(Converted to 100 Point Scale)
X% X% X% X% X%
RTA CAPITAL COST OPTIMIZATION TOOL GUIDE 2-5

CHAPTER 2 BACKGROUND – RT!’S �!PIT!L OPTIMIZATION SUPPORT TOOL
Figure 2-3: Approach to Scoring by SGR Investment Criterion
Criterion Approach Dynamic or Static? Illustration
Condition • Decay curve based condition estimate– Age based 1 to 5 scale • Dynamic
O&M CostImpact • Fixed score by asset type • Static
Reliability and Safety/ Security
• Combination of:– Fixed score by asset type– Dynamic score by asset age
• Mixed
Riders Impacted
• Logarithmic score based on share of total agency riders impacted– Scale ensures all assets obtain score
• NA
Scoring is “dynamic” throughout the 20-year period covered by each model run for some criteria. Specifically, COST assesses each asset’s condition at the start of each analysis year (including the start or “backlog year”). This evaluation is then used to score and rank potential SGR investments with respect to asset condition, reliability and safety/security (with scoring for reliability and safety/security driven in part by condition). Due to this constant re-evaluation, the scoring for all assets is constantly changing (i.e;, is “dynamic”) throughout the 20-years of each model run.
Expansion/Enhancement Asset Acquisition Prioritization: At the time of writing, the process used to prioritize the initial acquisition of expansion and enhancement assets is significantly simpler than that used to prioritize reinvestment actions for either existing assets or expansion/enhancement assets (following their acquisition). Specifically, the acquisition of expansion and enhancement investments (identified as “Expansion” assets in the asset inventory) is based on a single investment criterion, “Riders impacted per dollar invested” (i;e;, number of riders benefiting from the expansion/enhancement investment divided by the investment cost). The higher the value of this ratio, the higher the asset’s prioritization score. Note that unlike the prioritization scores for reinvestment actions, the acquisition prioritization scores for expansion/enhancement investments are not confined to a set scoring range of 1 to 100.
Note that the single “Riders impacted per dollar invested” investment criterion only applies to the acquisition of expansion/enhancement assets. Following their acquisition, reinvestment needs for expansion/enhancement investments are prioritized using the same five-criteria scoring and compete for the same investment funds as “existing” assets;
Finally, it is important to emphasize that the acquisition of new assets and reinvestment in existing assets are prioritized entirely separately from one-another and also utilize different budget amounts. Expansion asset acquisition is funded from a different budget than asset reinvestments – and these budgets cannot be shared within COST.
RTA CAPITAL COST OPTIMIZATION TOOL GUIDE 2-6

CHAPTER 2 BACKGROUND – RT!’S �!PIT!L OPTIMIZATION SUPPORT TOOL
COST Output: RTA’s COST provides output results in three different formats. These include:
Reports: Printable MS Word or PDF reports on current and future reinvestment needs, the SGR backlog, asset conditions and other SGR measures (users can also access the query data underlying each report)
Excel Exports: Charted analysis results exported to Excel (for use in presentations, reports and further analyses)
Raw Data: Detailed, asset level investment needs, SGR backlog and condition analysis. Provides users with access to the detailed data behind the output reports and Excel exports
Figures 2-4 and 2-5 below provide examples of the analyses generated by COST. Figure 2-4 presents a sample forecast showing the impact of constrained investment expenditures on the future SGR backlog, asset conditions and percent of assets exceeding their useful life. Figure 2-5 provides examples of both (1) average prioritization investment scores by asset type and (2) detailed, raw investment scores for individual transit assets.
Figure 2-4: COST Projects Future Investment Needs, Backlog and Asset Conditions
$0.0
$5.0
$10.0
$15.0
$20.0
$25.0
SG
RB
20
13
20
14
20
15
20
16
20
17
20
18
20
19
20
20
20
21
20
22
20
23
20
24
20
25
20
26
20
27
20
28
20
29
20
30
20
31
20
32
20
33
20
34
20
35
20
36
20
37
20
38
20
39
20
40
$B
illi
on
sSGR Backlog by Category
Systems
Facilities
Stations
Guideway Elements
Vehicles
0%
5%
10%
15%
20%
25%
30%
35%
20
10
20
10
20
11
20
12
20
13
20
14
20
15
20
16
20
17
20
18
20
19
20
20
20
21
20
22
20
23
20
24
20
25
20
26
20
27
20
28
20
29
20
30
20
31
20
32
20
33
20
34
20
35
20
36
20
37
20
38
20
39
20
40
We
igh
te
d A
ve
rag
e A
sse
t A
ge
Percent of Assets Over AgeAll Assets
Replaceable Assets
Non-Replaceable Assets
$0.0
$1.0
$2.0
$3.0
$4.0
$5.0
$6.0
$7.0
20
13
20
14
20
15
20
16
20
17
20
18
20
19
20
20
20
21
20
22
20
23
20
24
20
25
20
26
20
27
20
28
20
29
20
30
20
31
20
32
20
33
20
34
20
35
20
36
20
37
20
38
20
39
20
40
Bil
lio
ns o
f $
YO
E
Investment Expenditures by Category
Systems
Facilities
Stations
Guideway Elements
Vehicles
Average Annual Normal Replacement ($0.8B)
0%
5%
10%
15%
20%
25%
30%
Pe
rce
nt
of
To
tal
Re
pla
cem
en
t V
alu
e
Assets in Marginal or Poor Condition (Excludes Unreplaceable Assets)
Marginal
Poor
RTA CAPITAL COST OPTIMIZATION TOOL GUIDE 2-7

CHAPTER 2 BACKGROUND – RT!’S �!PIT!L OPTIMIZATION SUPPORT TOOL
Figure 2-5: SGR Investment Prioritization Scoring – Grouped by Asset Type and by Individual Asset
0 10 20 30 40 50 60 70 80 90
Train Control
Revenue Vehicles
Utilities
Major Shops
Electrification
Guideway Structures
Trackwork
Communications
Storage Yard
ITS
Revenue Collection
Maintenance Buildings
Non-Revenue Vehicles
Stations
Central Revenue Collection
Average Prioritization Scores Summary for Assets Requiring Reinvestment
Condition Reliability Safety Security Impacted Riders Cost Impact
Average Score by Asset Type
Asset Record Level Scoring
2.3 COST Development and TERM Lite Prior to initiating development of COST, the RTA identified and evaluated alternative approaches to assessing and prioritizing the region’s capital reinvestment needs; Following this evaluation, the RTA, working in concert with the region’s three Service �oards, selected FT!’s TERM as the starting point for development of the Capital Decision Prioritization Support Tool (now COST). Specifically, RTA and the Service Boards made the decision to build COST using the existing TERM framework as a starting point. !s development proceeded, TERM would be adapted or “customized” as needed to meet RT!’s specific needs. In particular, TERM’s pre-existing investment benefit-cost analysis was removed and a multi-criteria investment prioritization routine substituted in its place. Many of RT!’s Tool development actions have focused on the development, implementation, testing and improvement of this prioritization capability.
!s with all other aspects of RT!’s regional condition assessment process and related efforts, RT! and the Service Boards have worked closely and cooperatively to ensure the design, development and implementation of COST that best addresses the needs of the region; Moreover, it is RT!’s hope and intention that the completed Tool is of value to other potential industry users.
RTA CAPITAL COST OPTIMIZATION TOOL GUIDE 2-8

er
CHAPTER 3 “HOW TO GUIDE TO” OPENING, SAVING AND SHARING COST
3. “How to” Guide to Opening, Saving and Sharing COST This chapter provides background on how to open COST and how MS Access saves work while the Tool is open. This chapter also discusses how to maintain the MS Access file (separate from maintaining the records within it) and how to save copies of COST (for version control, scenario control and file sharing). The chapter starts with consideration of the computer requirements to run COST.
3.1 Computer Requirements (MS Access) RTA’s COST was designed to run using MS Access 2007. Given the presence of differing versions of MS Access as used by RTA and Service Board staff, the MS Access 2007 version of the Tool can also been run using MS Access 2010 (32 bit version) and special, 2003 versions have also been developed as required.
Therefore, to run COST, users must have a PC laptop or desktop loaded with MS Access 2007 or later (32 bit version). Use of MS Access 2003 is not recommended but RTA will accommodate RTA or Service Board users that require an MS Access 2003 version of the Tool. Note that COST may experience slow run times on PCs with smaller RAM.
3.2 3.2 Primer on Saving Access Data Records and Files Saving Records: As just noted, COST is based in MS Access. Therefore all Tool data, including asset inventory records and model input parameters, are stored in data tables. It is important for new users not familiar with MS Access (or other database software packages) to note that Access saves all changes to asset records as soon as the user leaves that asset record. Hence, unlike MS Excel, where the user can make changes to an existing file and then choose not to save those changes (e.g., when exiting the file), MS !ccess will save all changes as they are made and these changes cannot then be “undone”; Concerned users are therefore advised to save “Read-Only” copies of COST to ensure prior record and parameter settings can be retrieved if needed.
Saving Copies of the Tool: The entire COST model– including all data tables, forms, reports, code and queries – is stored in a single MS Access file. Moreover, the tool is only designed to maintain the output for a single analysis scenario. Given these properties, the user should be advised that:
Users can make as many copies of the tool as desired
Users should save/archive copies of prior Tool runs/scenarios they may want to retain for future analysis/reference
A good Tool scenario/version naming system is highly recommended.
3.3 Compact and Repair (Damaged and Growing Files) COST is designed to run a “compact and repair” routine whenever the user exits MS Access after using the Tool. This routine eliminates temporary data files that can accumulate as users run different scenarios using the tool. The presence of these temporary data files manifests itself in the form of an increasing file size for the Tool (with the file size increasing each time the Tool is run).
The user may want to run the MS !ccess “compact and repair” utility (or just close and reopen the file) if they suspect the file size is becoming very large or the Tool does not appear to be performing properly (as can happen when the file becomes too large or damaged). To run the utility, click the MS Office
RTA CAPITAL COST OPTIMIZATION TOOL GUIDE 3-1

CHAPTER 3 “HOW TO GUIDE TO” OPENING, SAVING AND SHARING COST
symbol in the upper left-hand corner and select “Manage” from the drop down menu and then “Compact and Repair Database”.
3.4 Sharing Files Users can share MS Access files as they do any other file type. Given that MS Access files can easily exceed e-mail attachment size limits, users may need to “Zip” the file prior to e-mailing (note: MS Access files tend to compress to roughly 25 percent of their un-compressed size).
RTA CAPITAL COST OPTIMIZATION TOOL GUIDE 3-2

CHAPTER 4 “HOW TO GUIDE TO” N!VIGATE COST
4. “How to” Guide to Navigate COST This chapter provides a brief overview of how to navigate COST’s Main Menu and data input forms; It begins with a description of how to open COST. Note that this chapter does not provide descriptions of how to develop or run scenarios – it is solely focused on how to find your way around the Tool.
4.1 Opening the Tool COST file is opened like any other file for a PC application. Just, locate the file name for the version of the Tool you want to open and double click the file name; Note that the user needs to click the “Open” button on the “Microsoft Office !ccess Security Notice” for the Tool to open properly. Other considerations include the following:
Zipped Files: If stored in a Zip file, extract COST before opening it. Zip files are read only and the Tool will need read/write capability, so it must be saved to a folder outside of the Zip folder before use.
Server Files: If stored in a server, copy COST to your desktop/lap top before opening it. COST needs to make significant use of RAM capacity and movement of the file data back and forth between the server and your PC will result in poor run times.
4.2 Main Menu COST’s Main Menu is the starting point for inputting data, setting up Tool analysis scenarios, running scenarios, and reviewing and analyzing scenario results. As illustrated in Figure 4-1 below, the Main Menu is segmented into three key functional areas:
Model Setup: The upper-third of the menu provides access to all the settings and data required to develop analysis scenarios and run the Tool. This includes access to COST’s prioritization settings, budget constraints, asset inventory data, asset life cycle cost assumptions, ridership by location data and cost inflation settings.
Run Model: The middle-third of the menu provides display information on the status of the model when completing a 20-year run; It is also the location of the “Run Model” button, which activates an actual model run.
Model Output: The bottom-third of the menu provides access to all output results for a completed model run. This includes several pre-defined analysis reports (on prioritized investment needs and SGR backlog and condition forecasts), an export to Excel of pre-defined charts of output results and finally a detailed, and an asset level query of all analysis results.
RTA CAPITAL COST OPTIMIZATION TOOL GUIDE 4-1

CHAPTER 4 “HOW TO GUIDE TO” N!VIGATE COST
Figure 4-1: COST – Main Menu
1. Model Setup
2. Run Model
3. Model Output
4.3 Input Forms Clicking on the Scenario Settings and Input Data buttons found in the Setup section of the Main Menu provides access to two sets of data input forms. These forms allow the user to define analysis scenarios and revise the Tools asset inventory data, life cycle cost assumptions and other parameters. Specifically, these forms include the following.
Scenario Settings: The primary forms used to set up analysis scenarios. Input forms include: o Prioritization Criteria Settings: Parameters to control the weights placed on each of the Tool’s
five reinvestment criteria. This form also allows users to directly adjust the scoring for the O&M cost impact, reliability and safety/security criteria.
o Expenditure (Budget) Constraints: Independently controls the level of funding available for: Existing Assets: Reinvestment in existing assets (includes rehabilitation and replacement of
expansion assets) Expansion Assets: Acquisition of expansion assets – including assets for new services and
new assets that enhance quality of existing services
Input Data: Forms used to update Tool input data including: o Asset Inventory Records: including existing and proposed future asset acquisitions o Life Cycle Cost profiles: timing and cost of asset rehabs and replacement by asset type o Ridership by location: used for prioritization scoring o Inflation rate: for reinvestment costs forecast in projection years
RTA CAPITAL COST OPTIMIZATION TOOL GUIDE 4-2
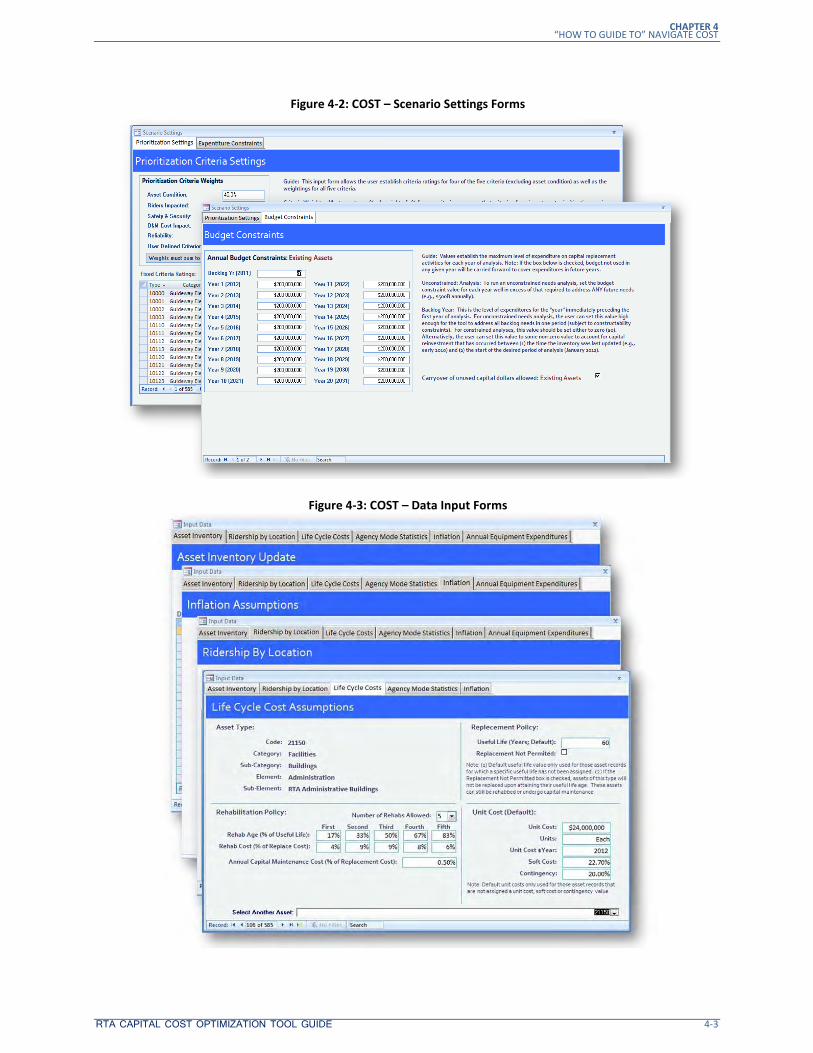
CHAPTER 4 “HOW TO GUIDE TO” N!VIGATE COST
Figure 4-2: COST – Scenario Settings Forms
Figure 4-3: COST – Data Input Forms
RTA CAPITAL COST OPTIMIZATION TOOL GUIDE 4-3

CHAPTER 4 “HOW TO GUIDE TO” N!VIGATE COST
4.4 Tool Output As noted the Tool output is accessed through the buttons located on the bottom third of COST’s Main Menu. The Tool provides three different types of output:
Reports: Twelve different predefined and formatted reports relating to prioritized needs, SGR backlog, and condition forecasts. Users can either access the reports themselves or the data underlying the reports (for further analysis in MS Excel or another environment).
Excel Export: COST can export pre-defined charts and graphs of current and expected future values for investment needs, the SGR backlog and asset conditions to MS Excel – allowing users to copy and paste these charts and graphs into reports and/or presentations
Raw Output Data: A query presenting the detailed output results at the asset level (including current and expected future values for investment needs, the SGR backlog and asset conditions). The raw output data is the data source used to populate the Reports and Excel Export charts. COST will export the complete, unprocessed output results to a table that can be copied to Excel for further analysis.
Figure 4-4: COST – Printing Reports
Figure 4-5: COST – Excel Export Example
$-
$100.00
$200.00
$300.00
$400.00
$500.00
$600.00
$700.00
$800.00
2011 2012 2013 2014 2015 2016 2017 2018 2019 2020 2021 2022 2023 2024 2025 2026 2027 2028 2029 2030 2031
Investment Expenditures by Existing Verus Expansion Assets
Expansion Assets - Rehab & Replace
Expansion Assets - Acquisition
Existing Assets - Rehab & Replace
RTA CAPITAL COST OPTIMIZATION TOOL GUIDE 4-4

CHAPTER 5 “HOW TO GUIDE TO” POPULATE AND MAINTAIN COST
5. “How to” Guide to Populate and Maintain COST This chapter describes the steps required to populate COST with asset inventory data and also how to set-up, adjust and/or maintain all other model input parameters (excluding those for defining scenarios, which are coved in the next section). The focus in this section is on the data input forms accessed by the Input Data button located in the upper right of the Main Menu.
5.1 Loading and Modifying Asset Inventory Records Overview
This section describes the steps required to enter asset inventory data into COST and then how to adjust and maintain the data once entered. Note that the data entry description provided here is different than that actually followed by RTA (where inventory data are imported into the tool from a regional asset inventory database using an MS Access based import method). Much of the actual asset data entry description that follows is intended to support potential Tool users other than RTA and its Service Boards.
Tool Asset Inventory Data Table and Fields
All asset inventory data – including records for both existing transit assets (i.e., those currently in service) and expansion assets (i.e., proposed or planned asset acquisitions) – are maintained within a single data table in RT!’s COST (tbl06AssetInventory). To populate this table, the user should first develop an Excel workbook (or database data table) that lists all assets to be entered into the Tool in a format (including data types) that is consistent with the format of COST’s asset inventory data table. Once complete, these predefined data records can then simply be copied and pasted (or imported) into the Asset Inventory table. A complete listing of COST’s asset inventory table fields is presented below in Figure 5-1. It is important to note that many of the fields (more than half) are solely for documentation purposes and are not required fields for the Tool to operate.
Figure 5-1: COST – Inventory Data Fields
Field Name Description Required Field? Notes Data Type
Asset ID Unique Asset ID No Integer
Agency ID Code Agency ID Code Yes Non RTA agencies can use "9999"
Integer
Transit System Agency Name Yes Text
LocID Ridership Location Code Yes User can define Integer
Line Rail line or bus garage/division name Yes Text
Branch Rail branch YesNo Reference field Text
Location_Address Address of asset location No Reference field Text
AssetName Name of Asset No Reference field Text
Station_Start Starting milepost marker for guideway assets
No Reference field Integer
Station_End Ending milepost marker for guideway assets
No Reference field Integer
TypeDesc Asset description field No Reference field Text
Comments Asset comment No Reference field Text
Mode Code NTD mode code Yes CR, HR, LR, MB, DR Text
RTA CAPITAL COST OPTIMIZATION TOOL GUIDE 5-1

CHAPTER 5 “HOW TO GUIDE TO” POPULATE AND MAINTAIN COST
Field Name Description Required Field? Notes Data Type
RTAAssetType RTA specified asset type name Recommended Non RTA agencies can use there own asset type names
Text
Asset Type Code TERM Asset Type Code Yes Integer
Category TERM Asset Category Yes Text
Sub-Category TERM Asset Sub-category Yes Text
Element TERM Asset Element Yes Text
Sub-Element TERM Asset Sub-element Yes Text
Quantity Unit quantity Yes Double
Units Type of units (e.g., each, sq feet, miles, spaces)
Recommended Text
Date Built Date asset was built / entered service life Yes Integer
Rehabed Has asset been rehabbed: False or True Yes True/False
CostYr Dollar year replacement costs are denominated in
Yes e.g., $2012 Integer
Agency_SoftCost
Contingency
Unit Replacement Cost
Current Dollars Total Cost
Total Replacement Cost
Override
Condition Rating
Assumed soft-cost factor
Assumed contingency cost factor
Unit replacement cost denominated in "CostYr" dollars
Total replacement cost denominated in "CostYr" dollars
Total replacement cost denominated in model start year dollars
When checked, Tool will prioritize asset for immediate replacement, regardless of asset age
Observed, actual condition rating for asset
Yes
Yes
Yes
Yes
No
Recommended
No
Will be added to replacement cost
Will be added to replacement cost
Tool will autopulated this when model is run
Default value is "False"
Percent
Percent
Dollar
Dollar
Dollar
True/False
Double
Data Date Date the asset record was last updated Recommended Integer
Data Source Source of asset data Recommended Text
Agency_UsefulLife
Notes
DelayReplaceAge
Existing_Expansion
ExpansionProject_Name
SoureRecID
Expected useful life of asset
Additional details on asset (type, history, special considerations)
Allows user to specify an asset replacement age that differs from Useful life
Identifies whether asset currently exists or is a proposed expansion asset
Name of Expansion project -- all project assets must have the same name
Unique Asset ID from underlying RTA regional asset inventory
Highly Recommended
No
No
Yes
No
No
Tool will utilize default value if not populated
Useful for forced scheduling of asset replacement (e.g., based on planned procurement)
Recommended for expansion projects
Integer
Text
Integer
Text
Text
Integer
Asset Optional asset description field No Text
UpdateStatus Update status of asset record No Text
SBAssetNumber Service Board Unique asset ID (RTA Specific)
No Integer
Length Asset length No Integer
TrackNumber Number of tracks on rail segment No Integer
LocationName Location name No Text
Area Service region / area No Integer
YearMajorRenovation Year of last major asset rehab Recommended Integer
MaintenanceRegime Relative level of annual asset maintenance
Recommended High, medium low Text
RTA CAPITAL COST OPTIMIZATION TOOL GUIDE 5-2

CHAPTER 5 “HOW TO GUIDE TO” POPULATE AND MAINTAIN COST
Field Name Description Required Field? Notes Data Type
NumberOfRehabs Number of past rehabs Recommended Integer
Usage Relative level of annual asset use Recommended High, medium low Text
RemainingLife Estimated remaining asset useful life Recommended Integer
SerialNumber Asset serial number No Text
Manufacturer Asset manufacturer No Text
Model Asset model No Text
Description Asset description No Text
BudgetGroup Asset budget group (RTA specific identifier)
No Text
Owner Asset owner No Text
DesignHeadway Asset / corridor design headway No Integer
ReverseSignals Reverse Signals? No Yes/no; Signal specific Yes/no
TrackType Type of track No Track specific Text
NumberOfSpans Number of bridge spans No Bridge specific Integer
NumberOfTracks Number of tracks No Track specific Integer
TieReplacement Tie replacement assumptions No Tie specific Text
GradeCrossingRehabNumber Number of past rehabs for grade crossings
No Grade crossing specific Integer
BusLength Length of bus No Bus specific Integer
ConditionRatingCurve Decay curve used for Condition Rating No Text
ConditionRatingSampling Sampled asset condition No Integer
SourceFileName Source of asset data No Integer
SourceFileWorkSheet Source of asset data: worksheet name No Text
SourceFileRow Source of asset data: worksheet row No Integer
RehabCost Cost to rehab asset No Dollar
CapitalMaintenanceCost Cost for annual capital maintenance No Dollar
SamplingYear Year asset condition was sampled No Integer
Data Status Update status of asset record No Text
Asset Type Codes
A key field to populate in COST is the “Asset Type Code”; This code is used to assign individual asset records to specific asset types, including specific life cycle cost assumptions for each asset type. The listing of asset types is founded on the asset types developed by FTA for TERM but asset types can be added, deleted, or modified by the user. These asset type codes correspond to a hierarchy which groups assets into five key categories – guideway, facilities, systems, stations and vehicles – and a detailed breakout of sub-categories, elements and sub-elements. The full listing of asset types used by COST (subject to change) is provided in Appendix B.
RTA CAPITAL COST OPTIMIZATION TOOL GUIDE 5-3

CHAPTER 5 “HOW TO GUIDE TO” POPULATE AND MAINTAIN COST
Ridership Location Codes
In addition to assigning asset type codes to each asset record, the user must assign a “Ridership Location” code to each asset record (LocID). This must be done for ALL asset types regardless of whether that asset actually serves riders or not. However, in contrast to the Asset Types codes, which are pre-defined (though alterable), the user must set-up and maintain the ridership by location table, including assignment of asset location codes, and then make the correct assignment of those ridership location codes to each asset identified in COST’s !sset Inventory; A more complete description of the purpose, development and maintenance of the ridership by location codes and related table is provided below in the section titled “Ridership by Location Table and �odes”;
Asset Costs, Quantities and Useful Life
COST includes a number of fields related to asset cost. The user must carefully consider how best to populate those fields given their available data.
Unit Costs: Users should enter a unit cost value for all asset records (in the “Unit Replacement Cost” field, i;e;, cost for “like replacement” of an item) as well as a related quantity value (in the “Quantity” field for the number of units). If the user fails to enter a unit cost value, the Tool will locate a default unit cost pre-populated in the Tool. It is not recommended that users take advantage of these pre-populated costs but rather that they enter their own unit costs that reflect their agency’s specific experience. Regardless, the user must enter a value in the quantity field (which the tool will use to estimate a total replacement cost – with no adjustment for soft-costs and contingencies as of yet).
Current Dollars Total Cost and Total Replacement Cost: The user can choose to leave this un-populated and COST will then use the unit cost and quantity values to populate these two fields. The “Current Dollars Total Cost” field contains the total cost of assets in that record expressed in “CostYr” dollars (i;e;, whatever year value is stored in the CostYr field for that asset record). In contrast, “Total Replacement Cost” is the same asset value but now expressed in the dollars as of the “Start Year” entered on COST’s Main Menu. Once again, the user does not need to worry about populating either of these fields. COST will populate these fields each time the Tool is run.
Soft-Costs and Contingencies: The “Agency_SoftCost” field allows the user to add a soft-cost amount to each asset’s replacement value; Note that this amount is added “over-and-above” the amount recorded in the unit cost/total cost fields. If the user does not want any soft-costs added to the unit cost values (e.g., if soft-costs are already embedded in the unit cost value), just enter 0% into this field. Similarly, users can also enter a percent amount for cost contingencies in the “�ontingency” field (again, just enter 0% if no contingency amount is desired).
Cost Year: Finally, the user must enter a value into the “CostYr” field to designate the year in which the unit costs are denominated. For example, if the unit costs for a vehicle type were based on actual procurement costs for that type in 2011, enter “2011” into the CostYr field.
Override Field
COST’s “override” field is intended to provide a means of ensuring that problem assets are highly prioritized for replacement by COST’s prioritization routine; Specifically, checking this box for any asset will ensure that this asset obtains a very high prioritization score for replacement (likely in the first period of the analysis – assuming sufficient funds are available). Note that COST will simulate the replacement of any asset for which this box is checked in the inventory table, regardless of the asset’s
RTA CAPITAL COST OPTIMIZATION TOOL GUIDE 5-4

CHAPTER 5 “HOW TO GUIDE TO” POPULATE AND MAINTAIN COST
age; The intention is to provide a means of ensuring “accelerated retirement” for problem assets, including those that need to be replaced well before they have attained their expected useful life (e.g., a bus damaged in an accident or a facility destroyed in a fire).
Copying and Pasting from Excel
Experienced COST users will become familiar with the Tool’s “!sset Inventory Update” form, which is accessed via the “Input Data” button on the Tool’s Main Menu; While this form does provide a potential means of entering asset inventory data into the tool, it is recommended that users enter data directly into the Tool’s asset inventory table (to help ensure all desired fields are fully populated). As this initial data population step requires working “outside” of �OST’s graphical user interface, it is recommended that this activity be performed by staff familiar with MS Access or similar database products.
Copying Asset Data from a Spreadsheet: The following easy steps assume the user has pre-populated the asset inventory information into a spreadsheet and that this data will then be copied (or imported) into COST. The steps are:
1. Open the Excel file containing the pre-populated asset inventory data, then 2. Highlight all of the populated asset records (do NOT highlight any rows with column/field
names) and then 3. Click Excel’s copy icon (or “�trl-�” or right click and select “�opy”); This action will place all of
the asset record data in Excel onto your computer’s clip board;
Pasting Data into the Tool: Next: 4. Open COST and then hit the “F11” key on your keyboard; This action will provide access to
COST’s underlying tables, queries and forms. 5. Locate the “tbl06AssetInventory” table and open it (double click). If this table already has data
in it and you want to delete that data, simply highlight the records you wish to delete and hit the “Delete” key on your keyboard;
6. You are now ready to paste data into the Tool. To do this, locate the last record in the tbl06AssetInventory table, (if there is no data in the table this will be the only record), which is empty and is marked on the left with a “” symbol; Now, highlight this blank record by clicking on the “” symbol;
7. Finally, right click and select “paste” from the menu above (or hit “�trl-V”) to paste the data from your clip board into the inventory table.
The table is now populated with the asset records developed in Excel and ready for use.
Potential Problems: Users will experience error messages when pasting from Excel to the tbl06AssetInventory table if some field values are not of the proper type (e.g., the user tried to copy text into a numeric field). To help prevent this from happening, the user may wish to first enter a small number of test records to ensure all data types are correct before entering the full data set. Similarly, the user may still want to enter data into the tbl06AssetInventory table in “batches” (i;e;, 100 records at a time) if data entry and data type errors continue to be of issue. This practice is helpful in identifying any specific asset records that suffer from data type issues.
5.2 Existing vs. Expansion Assets COST is designed to prioritize and invest in both existing assets (i.e., assets already in service) and planned asset expansions and enhancements. The expansion and enhancement assets include prioritization for both the initial asset acquisition (funded using an independent
RTA CAPITAL COST OPTIMIZATION TOOL GUIDE 5-5

CHAPTER 5 “HOW TO GUIDE TO” POPULATE AND MAINTAIN COST
expansion/enhancement asset budget) and for SGR reinvestments following their acquisition (prioritized and funded using the same prioritization process and budget constraint as used for existing assets).
For COST to be able to distinguish between and properly analyze existing assets vs. expansion assets, the user must properly populate the following fields:
Existing_Expansion: Enter “Existing” for assets that have already been acquired and which currently support transit service. Alternatively, existing assets will all have a date built value that is less than or equal to today’s year; Enter “Expansion” for planned investments in new, expansion or enhancement assets (such as additional fleet vehicles, assets associated with new expansion services such as New Starts procurement or for new technologies). Note expansion assets refer to future planned or programmed acquisitions that expand the transit agency’s asset holdings.
ExpansionProject_Name: Intended for expansion investments, enter the name of the expansion project (if there is one). This allows users to track and group multiple expansion assets associated with a single project.
Date Built: The “Date Built” values for expansion projects must exceed the value of the “Start Year” entered by the user on COST’s Main Menu (Setup section). Date built values that are less than the Start Year value will lead to calculation errors when the Tool processes expansion asset records.
Beyond these three fields, there is no difference between expansion and existing assets in how the inventory table data fields should be populated. Note, however, that the user must still populate ridership records for expansion assets in the Ridership By Location table (or select existing ridership locations) – see the discussion of the Ridership By Location table as it relates to expansion assets below.
5.3 Defining Life-Cycle Cost Profiles COST provides a great deal of flexibility in defining the life-cycle cost profiles of all asset types recognized by the tool. Specifically, the life-cycle cost profile determines the cost and timing of all asset reinvestment events – including asset rehabilitation, replacement and an additional expenditure type known as “annual capital maintenance” seen in Figure 5-2.
RTA CAPITAL COST OPTIMIZATION TOOL GUIDE 5-6

CHAPTER 5 “HOW TO GUIDE TO” POPULATE AND MAINTAIN COST
Figure 5-2: COST – Life Cycle Cost Assumptions Form
To enter or modify the asset life cycle cost profile for an individual asset type, go to COST’s Main Menu, click the Input Data button and select the “Life �ycle �osts” tab (Figure 5-2). Next, locate the asset type you wish to modify by clicking the drop-down box at the base of this form, scrolling through the list of asset types and selecting the desired type. The data presented in this form defines the cost and timing of life-cycle events including asset rehabilitation, replacement and annual capital maintenance. Note that values on the right-hand side of the form – including asset useful life, unit costs, soft-costs and contingencies are all default values. Hence as long as the user populates the related fields in the inventory records (i.e., for useful life, unit costs, soft-costs and contingencies) these default values will never be used. If the user keeps the related fields in the asset inventory fields unpopulated, then COST will use these default values.
In contrast, the values stored in the fields in the lower-left panel of this form are not default values and will apply to all assets of that type. To understand and potentially modify these values note the following:
Number of Rehabs Allowed: This setting determines the number of rehabs the tool will “perform” for each asset type over a full asset life-cycle. The user can choose any number from zero (0) to five (5) rehabs per asset.
Rehab Age: This setting determines the timing of each rehab as a percent of the asset’s useful life (the Tool will ultimately round this value to a specific age). For example, if an asset is given a useful life of 20 years, and the user enters a value of “50%” for one of these rehabs, the tool will assume all assets of this type and useful life will require a rehab at 10 years of age (20 x 0.50).
Rehab Cost: Similarly, this setting determines the cost of each rehab as a percent of the asset’s replacement value. For example, if an asset is given a replacement value of $100,000 and the user
RTA CAPITAL COST OPTIMIZATION TOOL GUIDE 5-7

CHAPTER 5 “HOW TO GUIDE TO” POPULATE AND MAINTAIN COST
enters a value of “25%” for the cost of a rehab, the tool will assume all assets of this type and replacement cost will require a rehab of value $25,000 ($100,000 x 0.25).
Annual Capital Maintenance: Finally, an annual capital maintenance setting greater than zero allows the user to ensure that a small amount of reinvestment occurs for assets of that type every year of the 20-year analysis period. Hence, if the value of an asset is $100,000 and the user enters a value of “0;25%” for annual capital maintenance COST will assume all assets of this type and replacement cost will require an annual investment amount of $250 ($100,000 x 0.0025). Annual capital maintenance is intended to help address reinvestment needs that are small on average but recurring in nature.
5.4 Ridership by Location Table and Codes The last key data table for the user to populate is the Ridership by Location table (tbl20LocationRidership). The ultimate purpose of this table is support investment prioritization based on the number of riders served by an asset – including expansion assets. In principle, investment prioritization should favor reinvestment in assets that serve large numbers of riders over assets serving fewer riders. All else being equal the former will tend to generate greater investment benefits. The Ridership by Location table supports this prioritization by developing a list of potential asset locations (e.g., station names or route segments) and location codes, and then assigning annual ridership levels to those locations (note that vehicle fleets are treated as a “location”); Records in the asset inventory are then assigned a location code (LocID) from the Ridership by Location table, thus linking individual assets to numbers of riders served by that asset. For special guidance on how to complete the Ridership by Location table for expansion assets, please refer to the end of this section.
Figure 5-3: COST – Ridership by Location Form
While users can enter and revise ridership by location in the “Ridership by Location” form (accessed via the Input Data button on COST’s Main Manu) first time users for an agency adopting RT!’s COST will need to directly populate the underlying tbl20LocationRidership table. To do so, hit the “F11” key on
RTA CAPITAL COST OPTIMIZATION TOOL GUIDE 5-8

CHAPTER 5 “HOW TO GUIDE TO” POPULATE AND MAINTAIN COST
your keyboard, then locate and open the tbl20LocationRidership table. The user next needs to develop a listing of asset locations and corresponding location IDs, codes and descriptive data. There is no standard for doing this and each agency must develop a listing that best suits their agency and available data. Here are a few guidelines:
All assets MUST be assigned an asset location ID (LocID) – so work out a listing of locations such that all assets can be assigned a location (and annual ridership level). Options include location by:
o Rail line or branch o Station/passenger facility o Bus division/depot/maintenance facility/service area o Vehicle fleet o Mode (best for assets that serve an entire mode) o System (best for assets that serve all agency modes)
All locations will need to be assigned an annual ridership level – so the list of asset locations must be designed around the available data on annual of ridership by location (e.g., by station or rail line).
Figure 5-4: COST – Ridership by Location Table Data Fields
Field Name Description Required Field? Notes Data Type
LocID Unique Location ID Yes Integer
Used by RTA to generate list
LocCode Alternate Location ID No of locations -- Can be the project name for expansion
Text
projects
UnlinkedTrips Number of annual unlinked trips Yes Integer
AgencyID Transit agency NTD ID No Integer
ServiceBoard Name of transit agency No Text
Mode Mode type No FTA model codes Text
LocType Branch, station, facility, vehicle No Background info Text
LocName Location name No Can be the project name for expansion projects
Text
LocNotes Notes on location No Can be the project name for expansion projects
Text
DataDate Date table was last updated No Year
Once the user has completed development and population of the Ridership by Location table, it is critical that each record in the asset inventory table (tbl06AssetInventory) be assigned one of the location ID values (LocID). This value is required to link these two tables together and any missing values will result in assets be excluded from ALL tool needs and prioritization calculations.
Special Guidance for Expansion Assets: As with existing assets, all expansion assets must be assigned to a valid Location ID from the Ridership by Location table (tbl20LocationRidership). Otherwise the needs for these assets will not be captured in the tool’s output. Moreover, given that expansion assets are prioritized based on the number of riders served by the expansion/enhancement asset divided by the investment cost (i.e., riders per dollar invested or number of impacted riders/investment cost), it is equally important that the number of impacted riders be assigned as accurately as possible. For this reason, it is highly recommended that users create a new Ridership by Location table record (in the Ridership by Location form) if an expansion asset does not correspond to a pre-existing ridership location already included in the Ridership by Location table.
RTA CAPITAL COST OPTIMIZATION TOOL GUIDE 5-9

CHAPTER 5 “HOW TO GUIDE TO” POPULATE AND MAINTAIN COST
To add a new ridership location record for an expansion asset (or group of expansion assets from the same project) the user should:
1. Open the Ridership By Location tab found on the Input Data Form (accessed via the Main Menu).
2. Locate the agency and mode name corresponding to a new asset (e.g., expansion buses would be added to the Motor Bus mode).
3. Populate the (New) record located at the bottom of the displayed table (marked with a “”): a. MS Access will auto populate the Location ID (LocID) field (take note of this auto-
generated number) b. Enter location type as “Expansion” c. Enter the expansion project name in the Location Code, Location Name and Location
Field Notes fields. d. Enter the number of annual riders expected to be impacted by the expansion
investment in the Annual Riders field. 4. Note the value of the auto-generated number in the LocID field and assign this value to all of the
associated expansion asset records in the Asset Inventory. You can do this in the Asset Inventory Update tab. Example: Support the auto-generated LocID value for an expansion asset project is “999”; The user should note this value, go to the Asset Inventory Update tab and locate all of the expansion project asset records, and then assign “999” to the Location ID field for each of the expansion asset records for that project.
RTA CAPITAL COST OPTIMIZATION TOOL GUIDE 5-10

CHAPTER 6 “HOW TO GUIDE TO” �UILD ANALYSIS SCENARIOS
6. “How to” Guide to Build Analysis Scenarios This chapter describes how to develop and enter analysis scenarios into RTA’s COST. Types of scenarios include:
Unconstrained needs: Level of investment to address all outstanding and future needs assuming funding is unlimited
Constrained Needs: o Impact of continuing to reinvest at current/recent rates o Impact of increases or decreases to current/recent reinvestment rates o Level of investment to attain specific investment targets (e.g., maintain backlog, eliminate backlog in 10, 15, or 20 years<)
Alternative priorities - Impact of changes to investment priorities on: o Composition of expenditures o Composition of backlog o Size of backlog
Forced early retirement of problem assets (“Override”) Impact of asset expansion on the backlog and reinvestment needs
6.1 Budget Constraints Most analysis scenarios are designed to assess the 20-year investment needs and/or investment impacts associated with specific a dollar level or rate of reinvestment. These scenarios can be grouped into two types:
Unconstrained: An “unconstrained” needs analysis assumes that funding is unlimited now and in all future years. This analysis scenario is then used to assesses the level of investment needed to address all outstanding reinvestment needs (i.e., eliminate any existing SGR backlog) as well as all future needs over the 20-year period of model analysis. This analysis scenario will also demonstrate the impact of eliminating the backlog and addressing all reinvestment needs – including the impact on asset conditions and the share of assets exceeding their useful life. Note that COST’s prioritization routine is irrelevant to the unconstrained needs scenario – given that funding is unlimited, there is no need to prioritize how it is spent.
Constrained: In contrast, a “constrained” needs analysis assumes that funding is limited over the 20-year period of analysis – such that funding is insufficient to address all outstanding and future needs. Whereas there is only one “outcome” (i;e;, set of future needs and condition impacts) under the unconstrained scenario, there are essentially an infinite number of potential “constrained needs” scenarios – each reflecting a different level of funding and investment prioritization.
Two Budget Constraints The current version of COST utilizes two separate budget constraints.
Expansion Assets Budget: The Expansion Assets budget constraint represents funds that can only be used for the acquisition of expansion assets or new enhancement assets (but not enhancements to existing assets). These funds cannot be used for reinvestment actions, including the rehab/replacement of expansion assets following their acquisition.
Existing Assets Budget: The Existing Assets budget constraint represents funds that can only be used for the rehab and replacement of assets existing at the start of model run and for
RTA CAPITAL COST OPTIMIZATION TOOL GUIDE 6-1

CHAPTER 6 “HOW TO GUIDE TO” �UILD ANALYSIS SCENARIOS
expansion and enhancement assets following their acquisition. These funds cannot be used for expansion asset acquisition.
Entering Budget Constraints
COST allows users to easily enter and alter 20-year funding level profiles for analysis scenarios (with separate budgets for existing and expansion assets as noted above). To enter a funding level profile, first click the “Scenario Settings” button on the Tool’s “Main Menu” and then select the “�udget �onstraint” tab (see Figure 6-1). Use the record selector buttons at the bottom of the form (or the “Page Down” and “Page Up” keys) to scroll between the Existing !sset and Expansion !ssets budget input forms.
Figure 6-1: COST – Budget Constraint Form
Next, enter an annual level of investment dollars for both the Existing Assets and Expansion Assets budgets for each year for the 20-year analysis period and also for the “backlog” year (see below). No Expansion assets budget amount is required if your inventory has no expansion assets. The entered amounts now set annual limits on the level of reinvestment for each forecast year – the Tool cannot reinvest more in any given year than is entered for that year (unless there are “carry over” funds – see below). The following notes will help users determine what amounts to enter:
Financially Unconstrained Model Runs: To run the Tool unconstrained, enter very high funding amounts (i.e, $500B) for each projection year. This will ensure that the level of funding is more than enough to address all outstanding reinvestment needs in all years of the projection period.
– For unconstrained runs, the prioritization scores are calculated but are irrelevant (as all needs are addressed)
Constrained Run Scenarios: Setting the constraint to lower levels (low enough that all needs are not addressed in each projection year) allows the user to assess the impacts of alternative funding availability on investment priorities, the SGR backlog and future asset conditions. Examples of constrained funding scenarios include the level of funding to:
RTA CAPITAL COST OPTIMIZATION TOOL GUIDE 6-2

CHAPTER 6 “HOW TO GUIDE TO” �UILD ANALYSIS SCENARIOS
– Eliminate backlog over a fixed time period (e.g., 10-years) – Maintain current SGR backlog – Maintain the historical annual reinvestment rate
To identify the annual level of funding required to attain specific investment targets (e.g., maintain the current SGR backlog), the user will need to enter and test multiple values until they identify an average annual funding level (or pattern of expenditures – funding does not have to be at the same level in all future years) that reasonably attains the desired target. Given that reinvestment needs are inherently “lumpy”, multiple solutions may be possible;
Setting the Expenditure Amount for Backlog Year (Year 0): The expenditure constraint value for year 0 (backlog year) should be set to zero ($0) for most constrained reinvestment scenarios
– Otherwise, this reinvestment will reduce backlog needs – Users may want to enter some amount for the backlog year (year 0) to capture
reinvestment actions that occurred between (1) the time the asset data were collected and (2) the start of year 1 analysis (but the tool, not the user will determine how these funds were invested in year 0)
Carryover of Unused Funds
For some (typically higher funding level) constrained needs scenarios, it is possible that the level of investment funds for some years will be more than that required to address all outstanding needs up to that point – thus leaving some investment funds for that year “unspent”; The user has two options of how to address these unspent funding amounts. The first is to just assume that all funding dollars must be spent in that year and hence are “use or lose” dollars for that year;
The second option is to assume that unused dollars can be “carried over” and applied to needs in a future time period. If the user wants unused funds to be applied to future time periods, then the “�arryover of unused capital allowed” box on the �udget �onstraint form must be checked (Figure 6-2). If funds are assumed to be devoted to non-reinvestment uses if not used, then the “�arryover of unused capital allowed” box should remain unchecked; Note that the Existing Asset budget and the Expansion !sset budgets have their own, independent “Carryover of unused capital allowed” checkboxes – so you must (un)check both if that is your intended outcome.
RTA CAPITAL COST OPTIMIZATION TOOL GUIDE 6-3

CHAPTER 6 “HOW TO GUIDE TO” �UILD ANALYSIS SCENARIOS
Figure 6-2: COST – �udget �onstraint &orm “�arryover” �heckbox
Carry over unused funds:• Check this box to carry over unused
(or remaining) funds to the next year
Figure 6-3 below provides examples of several types of constrained and unconstrained funding scenarios that can be developed using COST’s �udget �onstraint form;
Figure 6-3: COST – SGR (Existing Asset) Budget Constraint Funding Scenarios
Scenario Purpose / Value How to DefineMaintain Current Spending
• What is the impact on the SGR backlog and prioritization of continuing to reinvest at the current (historical) rate?
• Enter $0 for year 0• For years 1 to 20 enter avg. level of Service
Board reinvestment for past 5 to 10 years• Can adjust for inflation
MaintainBacklog
• What level of investment will maintainthe current size of the backlog (either in dollar terms or as a percent of all asset holdings)?
• User must enter test values for years 1 to 20 (enter same value for each year) and run the model multiple times until value of backlog in year 20 = value in year 0.
SGR in 20 Years
• What level of annual reinvestment is required to eliminate the SGR backlog in 20 years?
• User must enter test values for years 1 to 20 (e.g., enter same value for each year) and run the model multiple times until value of SGR backlog = $0 in year 20.
Un-constrained
• What would avg. annual reinvestment be if there was no backlog?
• Investment must be higher than this to reduce the backlog
• Enter a very high level of investment (e.g., $500B) for years 0 (backlog year) through year 20
“Planned” or “Budgeted”
• Enter year by year funding amounts that are both (1) financially sustainable and (2) correspond with timing of known major reinvestment needs
• Output will show impact of plan on future SGR backlog and help prioritize needs
6.2 Inflation COST allows the user to inflate investment needs across all 20-years of the projection period using a single inflation rate. The inflation rate cannot be controlled by asset type or projection year. To enter
RTA CAPITAL COST OPTIMIZATION TOOL GUIDE 6-4

CHAPTER 6 “HOW TO GUIDE TO” �UILD ANALYSIS SCENARIOS
an inflation rate, first click the “Input Data” button on the Tool’s “Main Menu” and then select the “Inflation” tab (see Figure 6-4). The user now has the following options:
Inflation Assumption:
– Constant year dollars: Denominated in “start year” dollars – based on start year value entered on the Main Menu (select “�onstant �urrent Year Dollars” from drop down menu)
– Year of Expenditure: $YOE with annual inflation rate determined by the User Rate entered in the form (select “Year of Expenditure Dollars” from drop down menu)
User Rate: User input inflation rate to apply to all forecast years
Sensitivity Factor: “Sensitivity factor” that can be used to increase (decrease) the cost of all assets by the same percent amount (e.g., entering 110% will increase all costs, in all periods, by 10%).
If the user wishes to control the inflation rate by asset type or projection year it is advised that this be done outside of the model. Specifically, run the analysis with 0% inflation, export the relevant needs output to Excel (see Chapter 8) and then inflate all costs as desired (starting from the start year dollars).
Figure 6-4: COST – Inflation Form
3. Sensitivity factor used to increase/decrease all costs by the same percent amount • Used to assess sensitivity of results to future costs• Entering 200% would double all costs
2. When selecting $YOE, enter assumed inflation rate here:• Single rate applies to all forecast years• This rate is only applied to future year reinvestment costs, does
not impact budget constraint or other measures
1. Select base inflation assumption from drop down list:• Constant dollars (in ”Start Year” dollars)• $YOE
6.3 Prioritization Adjustments: Calibration and Scenario Analysis (SGR Investments) The next option for scenario development is to adjust COST’s SGR investment prioritization settings. While the SGR prioritization settings (including criteria weights and scoring) may more properly be considered a tool calibration issue (i;e;, the prioritization settings to best match the organization’s strategic objectives and priorities), varying these settings provides valuable information on the impact of changes in priorities on the composition of asset expenditures, mix of assets in the backlog and even the
RTA CAPITAL COST OPTIMIZATION TOOL GUIDE 6-5

CHAPTER 6 “HOW TO GUIDE TO” �UILD ANALYSIS SCENARIOS
size of the backlog. Following is a description of how to adjust the prioritization settings. It is then up to the user to determine how best to (1) calibrate these settings to set up a preferred “baseline” (representing the agency’s priorities and also providing a point of comparison for other settings) and then (2) to modify these settings to assess the impact on needs and the backlog.
SGR Investment Prioritization Overview
COST’s SGR investment prioritization routine impacts the order in which the Tool addresses reinvestment needs when the level of available funding is constrained. Specifically, COST scores each investment option against the five different investment criteria. These individual criteria scores are then summed to a total score, with differing user-defined weights applied to each criterion. COST then uses these total scores to (1) rank each investment needs in each investment period and then to (2) address the highest ranked needs in each investment period until no reinvestment funds remain in that period. As the prioritization impacts the order in which assets are replaced it therefore also impacts what needs get added to the backlog and can also impact the size of the backlog itself.
Figure 6-5: COST – SGR Investment Prioritization Criteria Settings Form
Adjusting the SGR Investment Prioritization Settings
Users have two options to adjust SGR investment prioritization settings: the criteria weights and the fixed prioritization scores for some asset types (see Figure 6-5). It is recommended that users keep the fixed scoring consistent (once established) and only vary the scoring weights for purposes of scenario development.
Prioritization Criteria Weights: Altering the prioritization score weights is straightforward. From the Tool’s Main Menu, click the “Scenario Settings” button and select the “Prioritization Settings” tab; The prioritization criteria weights are found in the upper left-hand corner of the form. To alter these weights, the user merely needs to adjust the percent weight values to obtain the desired balance across all criteria while ensuring these values total to 100%. Obviously, increasing the weight placed on any criterion will increase that criterion’s influence
RTA CAPITAL COST OPTIMIZATION TOOL GUIDE 6-6

CHAPTER 6 “HOW TO GUIDE TO” �UILD ANALYSIS SCENARIOS
on the overall prioritization scores. While each criteria represents a different outcome (e.g., more reliable vs. more safe service) it should be noted that there tends to be a high correlation between asset reliability, safety and O&M cost impact scores. For this reason, it is typically best to utilize scoring weights that place a high emphasis on asset condition and then with lesser amounts on asset reliability, safety and O&M cost impacts – this will help ensure a more balanced mix of reinvestment actions over a 20-year analysis period.
Fixed Scoring: The lower panel of the Prioritization Criteria Settings Form allows the user to determine how each asset type is scored with respect to the asset reliability, safety and O&M cost impact criteria. Specifically, it is intended that the user assign an integer value, from 1 to 5, to each asset type identified in this table (and for each of the asset reliability, safety and O&M cost impact criterion). For example, for the reliability criterion, the user should assign a value of 1 if reinvesting in an asset type has very little or no impact on service reliability. In contrast, the user should assign a 5 if reinvestment in an asset type can potentially generate significant improvements in service reliability. The same should be done for asset reliability, safety and O&M cost impacts. Each of these criterion is also scored as the product of its fixed score, as just described, and its asset condition score (which increases from 1 at early asset age to 5 for very old assets). Hence, the true score for the reliability, safety and security impact criterion is a mix of the fixed scoring and asset condition.
Note: It is preferable that the fixed scoring be calibrated once, based on input from a mix of agency representatives, and only altered infrequently.
6.4 Investment “Override” COST’s “Override” function provides a quick and easy way to force the replacement of problem assets – regardless of whether that asset has attained its full expected useful life or not. Specifically, when used this function alters the age of the “overridden” asset to 300% (three times) its expected useful life; �y doing so, the prioritization routine “believes” the asset to be extremely old and hence assigns high prioritization scores for asset condition, reliability, safety and O&M cost impact. This in turn assures that the asset receives high priority for replacement (but does not absolutely guarantee replacement if the asset type is subject to low static scoring). The Override function should only be used for highly problematic assets. Examples include vehicles damaged in accidents or a station damaged in a fire or otherwise no longer fit for service.
To use the Override function, the user must first locate the record of the asset to be “overridden” in the inventory; One option is to access the !sset Inventory tab of the “Input Data” form (button located on the Main Menu). From the Asset Inventory tab, locate the agency and mode responsible for the asset (using the record selectors at the base of the form). Once the agency and mode are selected, scroll through the field names in the form table and apply filters to help narrow the number of records displayed. Finally, once the record has been identified, scroll through the field names until you have found the “Override” field; Now just check the “Override” field check box for those assets.
RTA CAPITAL COST OPTIMIZATION TOOL GUIDE 6-7

CHAPTER 6 “HOW TO GUIDE TO” �UILD ANALYSIS SCENARIOS
Figure 6-6: COST – Asset Inventory Form – Override Field
Override Field:• Click the check box to accelerate
replacement of “problem” assets
6.5 Including Expansion and Enhancement Assets Including expansion and enhancement investments in a model run requires completion of the following steps:
1. Add Expansion/Enhancement Records to Asset Inventory: Ensure that you have added expansion asset records to the asset inventory and that each new asset record has a corresponding Ridership by Location record entered into the Ridership by Location table (see Chapter 5 for detailed explanations on how to do so.
2. Add Budget Amounts to Expansion Asset Budget Table: Add or modify the available Expansion Asset budget amount as described above in Chapter 6.
3. Uncheck the “Exclude Expansion !ssets” check box located on COST’s Main Menu
Then run the COST model as usual. Note that the addition of a significant level of expansion and enhancement asset investment – especially expansion assets with useful lives shorter than 20 years – can lead to significant changes in the size of the projected SGR backlog. Pre-existing assets must now compete with expansion assets for the same limited capital reinvestment funding over 20 years.
RTA CAPITAL COST OPTIMIZATION TOOL GUIDE 6-8

CHAPTER 6 “HOW TO GUIDE TO” �UILD ANALYSIS SCENARIOS
6.6 Applications of COST RT!’s �OST tool is designed to carry out a range of analyses related to assessing current reinvestment needs and the expected condition and SGR backlog impacts of various rates of future capital reinvestment; This section provides sample applications of �OST, focused on RT!’s own intended uses of the tool.
Standard Model Run Scenarios
For most model analyses, RTA users alter the level funding available to COST to assess the impact of those variations in funding on future asset conditions, on the size of the future backlog and on other related metrics. Based on prior experience, these runs represent variations of the analysis scenarios outlined below in Figure 6-7. These scenarios are comparable to those used by FTA and other agencies when conducing SGR needs analysis.
Figure 6-7: Standard Model Run Scenarios
Scenario Purpose / Value How to DefineMaintain Current Spending
• What is the impact on the SGR backlog and prioritization of continuing to reinvest at the current (historical) rate?
• Enter $0 for year 0• For years 1 to 20 enter avg. level of Service
Board reinvestment for past 5 to 10 years• Can adjust for inflation
MaintainBacklog
• What level of investment will maintainthe current size of the backlog (either in dollar terms or as a percent of all asset holdings)?
• User must enter test values for years 1 to 20 (enter same value for each year) and run the model multiple times until value of backlog in year 20 = value in year 0.
SGR in 20 Years
• What level of annual reinvestment is required to eliminate the SGR backlog in 20 years?
• User must enter test values for years 1 to 20 (e.g., enter same value for each year) and run the model multiple times until value of SGR backlog = $0 in year 20.
Un-constrained
• What would avg. annual reinvestment be if there was no backlog?
• Investment must be higher than this to reduce the backlog
• Enter a very high level of investment (e.g., $500B) for years 0 (backlog year) through year 20
“Planned” or “Budgeted”
• Enter year by year funding amounts that are both (1) financially sustainable and (2) correspond with timing of known major reinvestment needs
• Output will show impact of plan on future SGR backlog and help prioritize needs
Budget Related Applications of COST
An additional and for RTA primary application of COST is the review of the annual capital budgets submitted to RTA by its Service Boards. As noted above, RTA is responsible for funding and oversight of all public transportation in Northeastern Illinois. Hence, each year RT!’s three Service �oards submit their capital plans for the following year, which RTA must then reviews and approve. Within this process, RTA uses COST’s prioritization capability to take an “independent look” at the Service Boards capital budget proposals to help assure that the mix of investments in the proposed capital budgets is consistent with the region’s preferred mix of investment priorities (as determined by �OST’s prioritization scoring). Differences between the Service Board and COST generated investments priorities are used to help determine whether to (1) reconsider the Service �oard’s proposed investment decisions and/or (2) reconsider and potentially recalibrate and improve �OST’s investment prioritization;
RTA CAPITAL COST OPTIMIZATION TOOL GUIDE 6-9

CHAPTER 6 “HOW TO GUIDE TO” �UILD ANALYSIS SCENARIOS
A conceptual overview of the approach to comparing budget proposals with �OST’s prioritization of needs, along with an example, is presented below in Figure 6-8. In general, the steps used to compare budget proposals with �OST’s prioritized needs are to:
1. Group budget proposal investment amounts by asset category 2. Run COST financially constrained using the same total budget amount as is assumed in the
regional investment budgets – then group the Tool’s resulting prioritized needs into the same five asset categories
3. Given the same total budget amount, compare the allocation of budget amounts by asset categories as specified in the budget proposals with that determined by �OST’s prioritization process. How closely aligned are the budgeted and Tool prioritized needs?
4. Understand and address differences between the budget proposal and COST allocations. Did COST identify any specific needs not included in the budget proposals? Alternatively, were there needs the Tool was not aware of but should have been (implying the need for a Tool or data improvement).
Figure 6-8: General Approach to Budget Proposal and COST Prioritization Comparisons
Tool Allocations (Based on proposed budget total, but tool allocation by category)
Guideway and Trackwork Facilities Systems Stations Vehicles Total
Budget Proposals ($ amounts by asset category)
Guideway and Trackwork Facilities Systems Stations Vehicles Total
=Total $ amounts are equal(but distributions are different)
2012-2016 Capital Plan RTA
RTA CAPITAL COST OPTIMIZATION TOOL GUIDE 6-10

CHAPTER 6 “HOW TO GUIDE TO” �UILD ANALYSIS SCENARIOS
6.7 Summary – How to Define a Scenario Finally, Figures 6-9 and 6-10 below provide a summary of the options available to users to define analysis scenarios. Note that some of these options were not specifically addressed in the preceding chapter, such as changing the useful life of an asset (e.g., changing the life of a bus from 12 to 15 years) to assess the impact on overall needs.
Figure 6-9: How to Define a Scenario - Frequently Used Scenario Controls
Scenario Control(Location)
Description & Use Example Uses
Frequently Used Scenario ControlsExpenditure Constraints(Scenario SettingsForm)
• User controls level of expenditures for projection years 0 through 20
• Used to assess impact of varying rates of reinvestment on conditions, prioritization and the SGR backlog
• Sample scenarios include:̶ Unconstrained needs̶ Maintain current spending̶ Level of funding to attain SGR
Prioritization Settings(Scenario SettingsForm)
• While typically held fixed, user can change investment scoring to assess impact on priority rankings, composition of reinvestment activities, and SGR backlog
• User can alter:̶ Criteria weights (simple adjustment)̶ Fixed criteria scoring (detailed
change)
Inflation(Input Data Form)
• Sets assumed rate of inflation for analysis period from year 0 to 20 –same rate applied across all years
• “Sensitivity” factor allows user to simultaneously adjust all projection costs up or down by the same set amount (default value is 100%)
• User can select:̶ Current year dollars – in Start Year
dollars as input on Main Menu̶ Year of Expenditure – based on user
entered rate
Figure 6-10: How to Define a Scenario – Less Frequently Used Scenario Controls
Scenario Control(Location)
Description & Use Example Uses
Less Frequently Used Scenario Controls (these controls used more to define investment policies)Asset Useful Life(Asset Inventory Update Tab: Input Data Form)
• User can alter the useful life values of individual assets
• Extending asset useful lives will lower long-term needs as assets require less frequent replacement
• e.g., change the useful life of “twelveyear) buses to 14 years
Override(Asset Inventory Update Tab: Input Data Form)
• Clicking the override box for any asset will automatically assign an effective age of 1.5 times the asset’s expected useful life (regardless of actual age)
• Control used to accelerate replacement of problem assets
• Use of this feature does not ensure a highest possible prioritization score
• Rather, ensures a high age based score for that specific asset’s type and location (i.e., assets of other types and locations may still score higher)
Life Cycle Costs(Input Data Form)
• User can alter number, timing and cost of rehabs
• Also controls cost of annual capital maintenance
• User can assess impact on needs of increasing/reducing number and/or cost of rehabs (note: will not impact condition measures)
Useful Life Factor(Main Menu)
• When set to values other than 100%, assets will be kept in service longer or shorter than their expected useful lives
• This single factor allies to all assets
• Note: Useful life values are not altered (hence, if factor is set to 110%, assets will be kept in service until 110% of their expected useful life but will be overage one they exceed 100% of useful life)
RTA CAPITAL COST OPTIMIZATION TOOL GUIDE 6-11

CHAPTER 7 “HOW TO GUIDE TO” RUN COST
7. “How to” Guide to Run COST This chapter provides a brief description of how to run RTA’s COST model as well as how to save copies of scenarios for future reference and distribution.
7.1 Running the Model To run COST just go to the Main Menu and click the “Run Model” button after setting up any relevant scenario parameters (Figure 7-1). Clicking this button will bring up a warning asking the user if they wish to continue with this action – as doing so will erase any previous analysis results in the model. If the user clicks “yes”, the Tool will proceed with the model run; !s the Tool proceeds through the run, it will display the status of the model run at all times including (1) the actions the model is performing, (2) the forecast year it is performing those actions for and (3) the current record count. Note that the Tool passes through all records multiple times to complete a run (Figure 7-2). The time to complete a full run is dependent on the number of asset records in the inventory and the speed of the computer. For most datasets of up to 4,000 records or more it should not take more than a few minutes for the model to run, even on a slower machine.
Figure 7-1: Main Menu – Running COST
To run the model, click the “Run Model” button: • Running the model will delete all results from the prior model run• Tool will provide “are you sure” warning before proceeding with run• Users can maintain as many copies of tool as desired (e.g., to maintain run results for
prior scenarios)
Warning will allow user to abort run if button clicked unintentionally:• Click “No” if run unintended and
“Yes” to continue…
RTA CAPITAL COST OPTIMIZATION TOOL GUIDE 7-1

CHAPTER 7 “HOW TO GUIDE TO” RUN COST
Figure 7-2: Running COST – Run Model Display
Run Status: What is the model currently doing? • Collecting asset level parameter scores• Sorting potential asset investment actions by asset score• Undertaking highest priority actions for which sufficient funding is available
Current record counter:• Based on sorted needs list
Replacement year:• Current forecast year (numbered 0 to 20)
Should the user encounter unexpected problems during the model run (particularly after the model has been run many times in a row), it may be worthwhile to close and open the Tool and then use the “compact and repair utility”; MS Access files tend to increase in size over time, particularly during analysis, if the compact and repair utility is not run on occasion. Therefore, it is recommended that the user run the compact and repair utility after every three to five model runs to ensure the file size remains manageable and to maintain optimal run performance.
7.2 Saving Scenarios COST is only designed to house the output results for one analysis scenario at a time. Therefore, should the user want to save the results of a specific scenario, the user should save a copy of the model with the desired scenario run, and then create another copy (copies) of the Tool for other scenarios.
It is helpful to note here that MS Access files, including COST file, can typically be zipped to a fraction of their normal size. This property can be very helpful both to (1) save storage space when storing multiple copies of the Tool and (2) zip and e-mail copies of COST to other co-workers. (Note that COST will likely become too large to e-mail unzipped when fully populated with both input and output data.)
RTA CAPITAL COST OPTIMIZATION TOOL GUIDE 7-2

CHAPTER 8 “HOW TO GUIDE TO” WORK WITH OUTPUT
8. “How to” Guide to Work with Output As noted in Chapter 4.5, COST provides three options for obtaining output data once a model run is complete. This chapter describes each of these output options, which are all accessed from the bottom section of the Tool’s Main Menu (Figure 8-1).
Figure 8-1: Model Concept – How does the Tool’s Needs !nalysis Work?
Click Print Reports to: • View / print reports
Click “Raw Model Output” to view un-processed output data:• Data can be copied and then pasted
in Excel
Enter basic description of model scenario (optional):• Limited to 255 characters
Click Excel Export to: • Export report data to
Excel for charting and further analysis
8.1 Reports At the time of writing, COST generates twelve (12) different reports (see Figure 8-2). Most reports present analysis of current and projected future values for the following:
Prioritized expenditures
SGR Backlog
Asset Conditions
Percent of assets exceeding their useful life
Year-by-year investment prioritization scores by asset type
In addition, the Tool also generates some informational reports that document when the asset records were last updated, assumed replacement values (default values only, not asset specific values) and a listing of all asset types recognized by COST.
It is important to note that (1) all reports can be converted to pdf format and then saved, printed or e-mailed to others and (2) the Tool allows the user to generate a table containing the data behind each report and then copy and paste that data into Excel to support further analysis.
RTA CAPITAL COST OPTIMIZATION TOOL GUIDE 8-1

CHAPTER 8 “HOW TO GUIDE TO” WORK WITH OUTPUT
Figure 8-2: Model Output – Sample Report
Reports are accessed by clicking the “Reports” button found on the lower panel of the Main Menu (Figure 8-3). Clicking this button will open a pop-up form listing all of the reports. Scroll through and then select your desired report by clicking on its name (see report listing in Figure 8-4). At this point the user can either (1) click the “Report” button on the pop-up form – this action will open the report for viewing or (2) click the “Data (Read Only)” button to view the data underlying the selected report; If the “Report” button is selected the user now has the option to either view/print the report as is or to export the report to PDF (in Print Preview mode, click “PDF” in the Data section of the MS !ccess Menu) or MS Word format.
RTA CAPITAL COST OPTIMIZATION TOOL GUIDE 8-2

CHAPTER 8 “HOW TO GUIDE TO” WORK WITH OUTPUT
Figure 8-3: Model Output – Accessing the Reports
1. Click Print Reports button
2. Select a report from the pop-up list
3. Click the Report button to view the report or…
4. Click the Data button to view the data behind the
reports• Note: Level of detail often
significantly higher for data than for the reports
Figure 8-4: Model Output – Description of Tool Reports
Report Type ContentAsset Inventory Record Ages • Input Data • Analysis of the age of the tools’ asset records
Asset Inventory Replacement Value • Inventory • Total replacement value of all• Grouped by mode and asset category
Asset Types • Input Data • Asset types recognized by the database• Data tab provides detail on asset life-cycle cost assumptions
Average Annual Expenditures Forecast
• Needs forecast
• Average annual level of dollar investment needs over 20-years of model run (based on scenario inputs)
Condition Distribution Forecast • Condition • Forecast of percent of assets in excellent, good, fair, marginal and poor condition
Expenditures Forecast • Needs forecast
• Forecast of prioritized annual investment needs (based on scenario inputs)
Over Age Asset Forecast • Condition • Forecast of percent of assets that exceed their useful life (based on scenario inputs)
Priority Scores: Backlog Investments by Asset Record (Detail)
• Prioritization scores
• Record level prioritization scores for investments to reduce current backlog (year 0)
Priority Scores: Backlog Investments by Asset Type by Location
• Prioritization scores
• Prioritization scores for investments to reduce current backlog (year 0) grouped by asset type and location
Priority Scores: Backlog Investment by Asset Type (Base 100)
• Prioritization scores
• Prioritization scores for investments to reduce current backlog (year 0) grouped only by asset type
Priority Scores: Summary Scores By Asset Type for Next 10 Years
• Prioritization scores
• Prioritization scores grouped only by asset type for projection years 0 to 20
SGR Backlog Forecast • Backlog • Projection of SGR backlog for years 0 through 20 (based on scenario inputs)
Copying Report Data to Excel: As noted above, the user has the option of viewing the data used to populate each report and can also copy and paste that data into Excel. First, click the Reports button on the Main Menu and then selecte the desired report and click the “Data (Read Only)” button; This action
RTA CAPITAL COST OPTIMIZATION TOOL GUIDE 8-3

CHAPTER 8 “HOW TO GUIDE TO” WORK WITH OUTPUT
will run a query to display the data behind the selected report, which will appear as a table (see Figure8-5). To copy this data to Excel, click the upper-left hand corner of this table (or highlight all table rows) and then click the copy icon on the MS !ccess menu (or hit “�trl-�”); Next, open a new Excel worksheet and click the “Paste” icon on the menu (or “�trl-V”).
Figure 8-5: Model Output – Accessing Reports Data
8.2 Excel Export COST also allows the user to export scenario analyses directly to Excel as a set of pre-defined Excel charts (one-chart per worksheet). COST currently exports 7 different charts to Excel similar to the content included in the reports above.
Sample Excel export charts are presented below in Figure 8-7. To access the Excel Export charts, first click the “Excel Export” button at the bottom of the Main Menu (Figure 8-6). This action will launch a macro that will take roughly a minute to run. When complete, the macro will have opened a new Excel file (called “�ook 1”) that includes multiple worksheets, each showing a different output chart; These charts can then be modified and saved as desired. Charts can also be copied to a report or presentation.
Figure 8-6: Model Output – Accessing Excel Exports
Clicking the Excel Export Button initiates the export of “ready to use” tables and charts. The status of exports is displayed here
RTA CAPITAL COST OPTIMIZATION TOOL GUIDE 8-4

CHAPTER 8 “HOW TO GUIDE TO” WORK WITH OUTPUT
Figure 8-7: Model Output – Sample Excel Exports
$0.0
$5.0
$10.0
$15.0
$20.0
$25.0
SG
RB
20
13
20
14
20
15
20
16
20
17
20
18
20
19
20
20
20
21
20
22
20
23
20
24
20
25
20
26
20
27
20
28
20
29
20
30
20
31
20
32
20
33
20
34
20
35
20
36
20
37
20
38
20
39
20
40
$B
illi
on
s
SGR Backlog by Category
Systems
Facilities
Stations
Guideway Elements
Vehicles
Capacity Constrained Fleet Replacement
0%
5%
10%
15%
20%
25%
30%
35%
SG
RB
20
13
20
14
20
15
20
16
20
17
20
18
20
19
20
20
20
21
20
22
20
23
20
24
20
25
20
26
20
27
20
28
20
29
20
30
20
31
20
32
20
33
20
34
20
35
20
36
20
37
20
38
20
39
20
40
We
igh
te
d A
ve
rag
e A
sse
t A
ge
Percent of Assets Over Age
All Assets
Replaceable Assets
Non-Replaceable Assets
$0.0
$1.0
$2.0
$3.0
$4.0
$5.0
$6.0
$7.02
01
3
20
14
20
15
20
16
20
17
20
18
20
19
20
20
20
21
20
22
20
23
20
24
20
25
20
26
20
27
20
28
20
29
20
30
20
31
20
32
20
33
20
34
20
35
20
36
20
37
20
38
20
39
20
40
Bil
lio
ns o
f $
YO
E
Investment Needs by Category
Systems
Facilities
Stations
Guideway Elements
Vehicles
Average Annual Normal Replacement ($1.5B)
Backlog ($6.0B)
0%
5%
10%
15%
20%
25%
30%
Pe
rce
nt
of
To
tal
Re
pla
cem
en
t V
alu
e
Assets in Marginal or Poor Condition (Excludes Unreplaceable Assets)
Marginal
Poor
8.3 Detailed Run Results Finally, COST also provides direct access to a complete listing of all model run output results, in a single table. Specifically, this table provides a comprehensive listing of all analysis results for each individual asset record identified in the Tool’s !sset Inventory table and for each of the 20-years of analysis. Hence, for each asset, this output table lists the following for all 20-years of analysis:
Prioritized investment needs
SGR backlog
Asset age
Asset condition
Prioritization score
Investment action (including no action for years with no investment needs)
To access the data, just click the “Raw Output Data” button at the bottom of the Main Menu (Figure 8-8). Note that this output table is the source of data for all of the summary Reports and Excel Export charts described above.
RTA CAPITAL COST OPTIMIZATION TOOL GUIDE 8-5

CHAPTER 8 “HOW TO GUIDE TO” WORK WITH OUTPUT
Figure 8-8: Model Output – Accessing Raw Output Data
1. Click Raw Output Data button
2. Detailed needs analysis for each asset record including year-by-year projection of: • Investment needs• Backlog projection• Investment Actions• Prioritization scores
RTA CAPITAL COST OPTIMIZATION TOOL GUIDE 8-6

APPENDIX A: GLOSSARY AND ABBREVIATIONS
Appendix A: Glossary and Abbreviations
Prioritization: For this guide, prioritization is the process of identifying a preferred or optimal order in which reinvestment events should occur. Implicit in this statement is the assumption that:
o Funding is insufficient to address all needs. Hence prioritization is required to determine which assets should be addressed first (and which assets have needs that may not be addressed).
o Investment needs can be ranked. In other words, there are good analytic or other bases on which to ranked investment needs – from highest to lowest—to determine in which outstanding needs are most effectively addressed (and potentially leaving some needs unaddressed).
Prioritization Criteria: Prioritization criteria provide the basis for determining the priority of individual investments. In general, investments are made with the expectation that the completed investment will yield improvements to one or more aspects of agency operations (e.g., improvements to reliability, efficiency, safety, rider comfort or other characteristic). Within a prioritization routine, the most desirable or important of these types of investment outcomes are referred to as “investment criteria”; Investments that perform best with respect to these criteria (i.e., tend to be provide the best mix of desired outcomes) are assigned the highest priority. Investments that perform poorly may receive a low priority ranking.
Prioritization Criteria Scores: From the viewpoint of this guide (and RT!’s COST), prioritization criteria should be quantifiable so investments can be assigned a numeric score reflecting their potential contribution to the desired outcome associated with that criterion (e.g., contribution to SGR). Note that numeric criteria scores facilitate objective comparisons between investment options. Given that different criteria may naturally be associated with specific unit quantities (e.g., condition rating for SGR and dollar values for impacts to operating costs), these score need to be converted to a common basis if the intention is to generate a multi-criteria prioritization score.
Multi-Criteria Investment Prioritization (criteria weighting): Multi-criteria investment prioritization refers to the process of evaluating and prioritizing investment options based on each investment’s performance against a mix of multiple investment criteria; In the context of this guide and RT!’s COST, multi-criteria investment prioritization implies the (1) all criteria are individual scored on a common scale (e.g., running from 1 to 5) and (2) these criteria scores are combined into a weighted average score, with the weight placed on each criterion reflecting the relative importance of that criterion.
Needs Analysis: In the context of COST, needs analysis refers to the process of determining the level of investment required to attain specific investment objectives and also with how those investment dollars are allocated to different uses (e.g., between various asset types). In general, needs analysis falls into two broad categories:
o Unconstrained needs: The level of investment required to address all outstanding and future needs, irrespective of actual or expected funding availability
o Constrained Needs: The level of investment required to attain more realistic investment objectives (e.g., maintain the size of the current investment backlog, or eliminate the backlog over 20 years). As the name suggests, under constrained needs analysis, there is insufficient funding to address all needs.
RTA CAPITAL COST OPTIMIZATION TOOL GUIDE A-1

APPENDIX A: GLOSSARY AND ABBREVIATIONS
Reinvestment in Existing Assets (SGR) vs. Investment in New Expansion or Enhancement Assets: COST is designed to assess and prioritize investment needs for both existing and expansion assets. In general, these investment types falls into the following categories:
o Reinvestment in Existing Assets: Refers to SGR (i.e., rehab and replace) investments in assets that are currently in service (i.e., existing assets).
o Investment in expansion assets: Refers to the planned/proposed future purchase of new assets that either: (i) expand existing service capacity (e.g., fleet expansion), (ii) adds a new service (e.g., New Starts) or (iii) enhances existing service (e.g., new technologies such as real-time arrival information).
Scenario Analysis: In the context of COST, scenario analysis refers to the process of identifying specific investment objectives and then assessing the investment needs associated with attaining that scenario. Examples include:
o Maintain historic funding levels o Maintain the current backlog o Eliminate the backlog over a set time period (e.g., 20 years).
Asset Condition and Decay: Asset condition refers here to the estimated physical condition of a transit asset. Specifically, COST includes a set of embedded asset decay curves that predict the current and future physical condition of a transit asset based on its type, age and other factors (e.g. , use and maintenance history). COST uses these condition relationships to prioritize reinvestment needs (in part) based each asset’s predicted physical condition (both currently and into the future depending on needs and funding availability). COST also uses these same asset decay curves to generate current and future distributions of asset conditions.
The following definitions for State of Good Repair (SGR) separate the asset level from aggregate level.
Asset Level SGR: An asset is in a state of good repair (SGR) if (i) its age does not exceed its expected useful life and (ii) all rehabilitation and annual capital maintenance activities are up to date. Under these circumstances, an asset has no deferred capital reinvestment needs and, by definition, has an estimated condition score of 2.5 or higher (RTA/TERM Lite decay curves are defined such that assets attain their useful life and a condition score of 2.5 concurrently). If an asset has undergone a major life extending rehabilitation, it can exceed its expected useful life and still be in SGR. Non-attainment of SGR does not imply an asset is unfit for service or unsafe but it may increase the likelihood of sub-optimal performance (i.e. reliability and availability performance may decrease).
Mode, Service Board, or Regional Level (Aggregate) SGR: A transit mode, Service Board or the region is considered to be in SGR if each of its component assets is in SGR (as defined above). Mode, Service Board and regional level SGR represents an ideal state and is not attainable in practice as (i) rehabilitation and replacement needs arise continuously and (ii) mode, Service Board and regional level budgets are generally insufficient to meet these continuous needs. As such, a more realistic view of SGR at an aggregate level is based on the region’s target/tolerance for achieving reinvestment goals – such as halving the current SGR backlog over a certain timeframe or not allowing the SGR backlog to grow beyond current levels.
RTA CAPITAL COST OPTIMIZATION TOOL GUIDE A-2

APPENDIX B: ASSET TYPES IN COST
Appendix B: Asset Types in COST Type Category Sub-Category Element Sub-Element
10000 Guideway Elements Guideway - -10110 Guideway Elements Guideway At Grade Exclusive -10120 Guideway Elements Guideway At Grade Exclusive Expressway 10200 Guideway Elements Guideway At Grade-In-Street -10205 Guideway Elements Guideway At Grade-In-Street Ductbank 10206 Guideway Elements Guideway At Grade-In-Street Manhole 10210 Guideway Elements Guideway At Grade-In-Street Grade Crossing 10211 Guideway Elements Guideway At Grade-In-Street Grade Crossing - Panelled 10212 Guideway Elements Guideway At Grade-In-Street Grade Crossing - Embedded 10310 Guideway Elements Guideway Elevated Structure -10320 Guideway Elements Guideway Elevated Structure Steel Viaducts 10330 Guideway Elements Guideway Elevated Structure Bridge 10340 Guideway Elements Guideway Elevated Structure Foot Walk 10400 Guideway Elements Guideway Elevated Fill -10500 Guideway Elements Guideway Underground -10510 Guideway Elements Guideway Underground Tunnel 10515 Guideway Elements Guideway Underground Tube 10520 Guideway Elements Guideway Underground Cut & Cover 10550 Guideway Elements Guideway Underground Foot Walk 10600 Guideway Elements Guideway Retained Cut -10601 Guideway Elements Guideway Retained Cut Box Culvert 11000 Guideway Elements Trackwork - -11110 Guideway Elements Trackwork Direct Fixation -11111 Guideway Elements Trackwork Direct Fixation Tangent 11112 Guideway Elements Trackwork Direct Fixation Curve 11113 Guideway Elements Trackwork Direct Fixation Guarded 11114 Guideway Elements Trackwork Direct Fixation Platform 11151 Guideway Elements Trackwork Open Deck Tangent 11152 Guideway Elements Trackwork Open Deck Curve 11153 Guideway Elements Trackwork Open Deck Guarded 11154 Guideway Elements Trackwork Open Deck Platform 11200 Guideway Elements Trackwork Ballasted -11210 Guideway Elements Trackwork Ballasted Tangent 11211 Guideway Elements Trackwork Ballasted Tangent - Concrete Tie 11212 Guideway Elements Trackwork Ballasted Tangent - Wood Tie 11220 Guideway Elements Trackwork Ballasted Curve 11221 Guideway Elements Trackwork Ballasted Curve - Concrete Tie 11222 Guideway Elements Trackwork Ballasted Curve - Wood Tie 11230 Guideway Elements Trackwork Ballasted Guarded 11240 Guideway Elements Trackwork Ballasted Platform 11300 Guideway Elements Trackwork Embedded -11310 Guideway Elements Trackwork Embedded Tangent 11320 Guideway Elements Trackwork Embedded Curve 11330 Guideway Elements Trackwork Embedded At-Grade Crossings 11400 Guideway Elements Trackwork Special -11401 Guideway Elements Trackwork Special Diamond Crossover 11402 Guideway Elements Trackwork Special Diamond Crossover -- Direct
Fixation 11403 Guideway Elements Trackwork Special Diamond Crossover --
Ballasted 11404 Guideway Elements Trackwork Special Single Crossover
RTA CAPITAL COST OPTIMIZATION TOOL GUIDE B-1

APPENDIX B: ASSET TYPES IN COST
Type Category Sub-Category Element Sub-Element
11405 Guideway Elements Trackwork Special Single Crossover -- Direct Fixation
11406 Guideway Elements Trackwork Special Single Crossover --Ballasted 11407 Guideway Elements Trackwork Special Turnout 11408 Guideway Elements Trackwork Special Turnout -- Direct Fixation 11409 Guideway Elements Trackwork Special Turnout -- Ballasted 11410 Guideway Elements Trackwork Special Turntable 11500 Guideway Elements Trackwork Yard -11600 Guideway Elements Trackwork Ties -11601 Guideway Elements Trackwork Ties Wood 11602 Guideway Elements Trackwork Ties Concrete 12000 Guideway Elements Special Structures - -12100 Guideway Elements Special Structures Fencing -12200 Guideway Elements Special Structures Retaining Walls -13000 Guideway Elements Bus Guideway - -13100 Guideway Elements Bus Guideway At Grade -13200 Guideway Elements Bus Guideway Turnaround -13201 Guideway Elements Bus Guideway Turnaround CTA 13300 Guideway Elements Bus Guideway Elevated Fill -13400 Guideway Elements Bus Guideway Elevated Structure -13450 Guideway Elements Bus Guideway Elevated Structure Bridges 13500 Guideway Elements Bus Guideway Subway -20000 Facilities - - -21000 Facilities Buildings - -21100 Facilities Buildings Administration -21101 Facilities Buildings Administration Large Administration Buildings 21200 Facilities Buildings Maintenance -21210 Facilities Buildings Maintenance Bus 21211 Facilities Buildings Maintenance CTA -- Interior Bus 21212 Facilities Buildings Maintenance CTA -- Exterior Bus 21215 Facilities Buildings Maintenance Pace -- Bus - Small 21216 Facilities Buildings Maintenance Pace -- Bus - Large 21220 Facilities Buildings Maintenance Rail 21221 Facilities Buildings Maintenance CTA -- Rail 21225 Facilities Buildings Maintenance Metra -- Rail 21230 Facilities Buildings Maintenance Utility building 21231 Facilities Buildings Maintenance CTA -- Warehouse 21240 Facilities Buildings Heavy Maintenance -21241 Facilities Buildings Heavy Maintenance Rail 21242 Facilities Buildings Heavy Maintenance Bus 21250 Facilities Storage Yard - -21251 Facilities Storage Yard Rail -21252 Facilities Storage Yard Bus Park 21260 Facilities Buildings Bus Turnaround -
Facility 21500 Facilities Buildings Building Components -21501 Facilities Buildings Building Components Electrical 21502 Facilities Buildings Building Components Fire Alarm 21503 Facilities Buildings Building Components Plumbing 21504 Facilities Buildings Building Components Drainage 21505 Facilities Buildings Building Components HVAC 21506 Facilities Buildings Building Components Boiler 21507 Facilities Buildings Building Components Roof 21508 Facilities Buildings Building Components Exterior
RTA CAPITAL COST OPTIMIZATION TOOL GUIDE B-2

APPENDIX B: ASSET TYPES IN COST
Type Category Sub-Category Element Sub-Element
21509 Facilities Buildings Building Components Access and Parking
21511 Facilities Buildings Building Components Built-in Equipment and Specialties
21512 Facilities Buildings Building Components Generators 21513 Facilities Buildings Building Components Interior 21514 Facilities Buildings Building Components Fencing 21515 Facilities Buildings Building Components Other 22211 Facilities Buildings Administration CTA Admin Building - 15 floor
22231 Facilities Buildings Administration Pace Admin Building - 2 floor 23000 Facilities Equipment - -23100 Facilities Equipment Office -23101 Facilities Equipment Office Software 23102 Facilities Equipment Office Hardware -- computers,
printers, copiers 23200 Facilities Equipment Office Furniture 23400 Facilities Equipment Maintenance -23420 Facilities Equipment Maintenance Pollution Treatment 23421 Facilities Equipment Maintenance Bus Washer 23422 Facilities Equipment Maintenance Train Washer 23423 Facilities Equipment Maintenance Vehicle Paint booth 23424 Facilities Equipment Maintenance Fuel Island 23425 Facilities Equipment Maintenance Fuel Tank 23426 Facilities Equipment Maintenance Dynamometers 23427 Facilities Equipment Maintenance Lifts - Portable 23428 Facilities Equipment Maintenance Lifts - Fixed 23429 Facilities Equipment Maintenance Lifts - Fixed: In Floor 23430 Facilities Equipment Maintenance Lifts - Fixed: Parallelogram 23431 Facilities Equipment Maintenance Wheel truing machines 23432 Facilities Equipment Maintenance Wheel presses 23433 Facilities Equipment Maintenance Turntables, Truck 23434 Facilities Equipment Maintenance Brake Lathe 23435 Facilities Equipment Maintenance Air Compressor 23436 Facilities Equipment Maintenance Cart 23437 Facilities Equipment Maintenance Hoist 23438 Facilities Equipment Maintenance Scrubber, Sprayer 23439 Facilities Equipment Maintenance Misc Equip 25000 Facilities Central Control Building Only -30000 Systems - - -31000 Systems Train Control - -31200 Systems Train Control Wayside Train Control -31201 Systems Train Control Wayside Train Control Automatic Transfer Panel 31202 Systems Train Control Wayside Train Control Battery Equip 31203 Systems Train Control Wayside Train Control Bonds
31206 Systems Train Control Wayside Train Control Logical Controller 31207 Systems Train Control Wayside Train Control Marker Coil 31208 Systems Train Control Wayside Train Control Power Supplies
21510 Facilities Buildings Building Components Elevators and Conveying Systems
22212 Facilities Buildings Administration CTA Admin Building - 2 floor 22221 Facilities Buildings Administration Metra Admin Building - 15
floor
31204 Systems Train Control Wayside Train Control Control Panel (local) 31205 Systems Train Control Wayside Train Control Intrusion Detection Warning
System
RTA CAPITAL COST OPTIMIZATION TOOL GUIDE B-3

APPENDIX B: ASSET TYPES IN COST
Type Category Sub-Category Element Sub-Element
31209 Systems Train Control Wayside Train Control Power Supplies-UPS 31210 Systems Train Control Wayside Train Control Receiver 31211 Systems Train Control Wayside Train Control Relays 31212 Systems Train Control Wayside Train Control Relay Cabinet 31213 Systems Train Control Wayside Train Control Relay House (Bungalow) 31214 Systems Train Control Wayside Train Control Repeater Signal 31215 Systems Train Control Wayside Train Control RTU 31216 Systems Train Control Wayside Train Control Signals 31217 Systems Train Control Wayside Train Control Signal Bridge 31218 Systems Train Control Wayside Train Control STAP (Station Processor) 31219 Systems Train Control Wayside Train Control TPSS Feeds 31220 Systems Train Control Wayside Train Control Track Circuit 31221 Systems Train Control Wayside Train Control Train Control Cable 31222 Systems Train Control Wayside Train Control Train Stop 31223 Systems Train Control Wayside Train Control Programmed Station Stop
System 31224 Systems Train Control Wayside Train Control Other 31300 Systems Train Control Centralized Train -
Control 31301 Systems Train Control Centralized Train Control Room (central)
Control 31302 Systems Train Control Centralized Train Logical Controller
Control 31303 Systems Train Control Centralized Train Power Supplies
Control 31304 Systems Train Control Centralized Train Receiver
Control 31400 Systems Train Control Roadway Crossings -31411 Systems Train Control Roadway Crossings Crossing Gate Arm 31412 Systems Train Control Roadway Traffic -
Signals 31500 Systems Train Control Commuunications -31501 Systems Train Control Commuunications Data Transmission Unit 31502 Systems Train Control Commuunications Train Wayside Comm 31503 Systems Train Control Commuunications Transmitter 31700 Systems Train Control Onboard Train Control
(cab signaling) 31701 Systems Train Control Onboard Train Control Onboard Compter Systems
(cab signaling) 31702 Systems Train Control Onboard Train Control Receiver
(cab signaling) 31800 Systems Train Control Interlocking -31801 Systems Train Control Interlocking Switch Machine 31802 Systems Train Control Interlocking Switch Machine - Manual
Ballasted 31803 Systems Train Control Interlocking Switch Machine - Motorized
Ballasted 31804 Systems Train Control Interlocking Switch Machine - Manual
Embedded 31805 Systems Train Control Interlocking Switch Machine - Motorized
Embedded 31806 Systems Train Control Interlocking Switch Heaters 32000 Systems Electrification - -32200 Systems Electrification Substations -
RTA CAPITAL COST OPTIMIZATION TOOL GUIDE B-4

APPENDIX B: ASSET TYPES IN COST
Type Category Sub-Category Element Sub-Element
32204 Systems Electrification Substations AC Switchgear 32205 Systems Electrification Substations DC Switchgear 32206 Systems Electrification Substations Rectifier 32207 Systems Electrification Substations Building 32208 Systems Electrification Substations Battery 32209 Systems Electrification Substations Charger 32210 Systems Electrification Substations SCADA RTUs 32211 Systems Electrification Substations Transformer 32212 Systems Electrification Substations Generator 32213 Systems Electrification Substations High Tension Towers 32214 Systems Electrification Substations Building Electrical 32215 Systems Electrification Substations Fire Alarm 32216 Systems Electrification Substations Plumbing 32217 Systems Electrification Substations Drainage 32218 Systems Electrification Substations HVAC 32219 Systems Electrification Substations Roof 32220 Systems Electrification Substations Exterior 32221 Systems Electrification Substations Access 32222 Systems Electrification Substations Elevators and Conveying
Systems 32223 Systems Electrification
32300 Systems Electrification 32400 Systems Electrification
32404 Systems Electrification 32405 Systems Electrification 32406 Systems Electrification 32407 Systems Electrification 32408 Systems Electrification 32700 Systems Electrification 32701 Systems Electrification 32702 Systems Electrification 32703 Systems Electrification 32704 Systems Electrification 32705 Systems Electrification 32706 Systems Electrification 32707 Systems Electrification 32708 Systems Electrification 32709 Systems Electrification 32800 Systems Electrification 32801 Systems Electrification 32802 Systems Electrification 32902 Systems Electrification 32903 Systems Electrification 32904 Systems Electrification 33000 Systems Communications 33100 Systems Communications
33101 Systems Communications
33102 Systems Communications
33103 Systems Communications
RTA CAPITAL COST OPTIMIZATION TOOL GUIDE
Substations
Breaker House Contact Rail
Contact Rail Contact Rail Contact Rail Contact Rail Contact Rail Overhead Catenary Overhead Catenary Overhead Catenary Overhead Catenary Overhead Catenary Overhead Catenary Overhead Catenary Overhead Catenary Overhead Catenary Overhead Catenary Power Cable Power Cable Power Cable Bridge Signal Load C-Case -Cable Transmission System (CTS) Cable Transmission System (CTS) Cable Transmission System (CTS) Cable Transmission
Built-in Equipment and Specialties -Contact Rail, Chairs, Anchor and Incline Protection Boards 3rd Rail Disconnect Switches Short Tie Extension Brackets Reactors Heaters -Trolley Wire Decorative Street lighting Ductbank Feed Span (+ and -) Manhole Poles and Foundation Pulleys Pole Grounding Tangent Span -Substation feed Contact Rail feed Electrical System ----
Fiber Optic Cable Transmission System (FOCS) Cable
Nodes
B-5

APPENDIX B: ASSET TYPES IN COST
Type Category Sub-Category Element Sub-Element
System (CTS) 33104 Systems Communications Cable Transmission MIS/IT/Network Systems
System (CTS) 33200 Systems Communications Passenger -
Communications Systems
33201 Systems Communications Passenger Public Address (PA) Communications Systems
33202 Systems Communications Passenger Transit Passenger Information Communications Systems (TPIS) Systems
33203 Systems Communications Passenger Variable Message Signs (VMS) Communications Systems
33204 Systems Communications Passenger On-board vehicle Communications Systems
33205 Systems Communications Passenger Station Passenger Emergency Communications (Blue Light) Phones Systems
33300 Systems Communications Safety and Security -33301 Systems Communications Safety and Security On-Vehicle Video Systems 33302 Systems Communications Safety and Security Emergency Location System 33303 Systems Communications Safety and Security Emergency Management
Panel (EMP) 33304 Systems Communications Safety and Security Fire & Emergency
Management System (F&EM) 33305 Systems Communications Safety and Security Fire Management Panel 33306 Systems Communications Safety and Security Gas Monitoring System 33307 Systems Communications Safety and Security Gas fire suppression system 33308 Systems Communications Safety and Security Intrusion Detection System
(IDS) 33309 Systems Communications Safety and Security Seismic Monitoring System 33310 Systems Communications Safety and Security CCTV 33311 Systems Communications Safety and Security CCTV -- Fixed 33312 Systems Communications Safety and Security CCTV -- On-board vehicle 33400 Systems Communications Phone System -33401 Systems Communications Phone System Private Branch Exchange (PBX) 33402 Systems Communications Phone System Telephones 33403 Systems Communications Phone System Fax 33500 Systems Communications Radio -33501 Systems Communications Radio Bus Radio 33502 Systems Communications Radio Base Radio Stations 33503 Systems Communications Radio Radio Antenna 33504 Systems Communications Radio Mobile Radios 33505 Systems Communications Radio Mobile Radios, Handpack 33506 Systems Communications Radio Transmitter 33800 Systems Communications SCADA -33801 Systems Communications SCADA Programmable Logic
Controller (PLC) 33802 Systems Communications SCADA RTU 33803 Systems Communications SCADA Rectifier 33804 Systems Communications SCADA AIM
RTA CAPITAL COST OPTIMIZATION TOOL GUIDE B-6

APPENDIX B: ASSET TYPES IN COST
Type Category Sub-Category Element Sub-Element
33805 Systems Communications SCADA ATC 33806 Systems Communications SCADA IDS 33807 Systems Communications SCADA TRACS 33810 Systems Communications SCADA Other 33850 Systems Communications Communications Huts Hut 33851 Systems Communications Communications Huts Room 34000 Systems Central Revenue - -
Collection 34100 Systems Central Revenue Coin Counters -
Collection 34104 Systems Central Revenue Bill Counters -
Collection 34105 Systems Central Revenue Vault -
Collection 35000 Systems Revenue - -
Collection 35100 Systems Revenue In-Station -
Collection 35104 Systems Revenue In-Station Turnstiles
Collection 35110 Systems Revenue In-Station System
Collection 35115 Systems Revenue In-Station TVMs
Collection 35116 Systems Revenue In-Station Encoding Machine
Collection 35117 Systems Revenue In-Station Parking Meters
Collection 35118 Systems Revenue In-Station Change Machines
Collection 35120 Systems Revenue In-Station Fare Control System
Collection 35130 Systems Revenue In-Station Passenger Counters
Collection 35200 Systems Revenue On-Vehicle -
Collection 35201 Systems Revenue On-Vehicle Fareboxes
Collection 36000 Systems Utilities - -36100 Systems Utilities Lighting -36101 Systems Utilities Lighting Subway 36102 Systems Utilities Lighting Yard 36200 Systems Utilities Drainage -36201 Systems Utilities Drainage Subway 36202 Systems Utilities Pump Rooms Subway 36203 Systems Utilities Deep Wells Subway 36204 Systems Utilities Sump Pumps Subway 36205 Systems Utilities Sump Pump Discharge Subway
Pipes 36206 Systems Utilities Fire Protection Subway
Plumbing 36301 Systems Utilities Ventilation - Fans Subway 36302 Systems Utilities Ventilation - Control Subway
Systems
RTA CAPITAL COST OPTIMIZATION TOOL GUIDE B-7

APPENDIX B: ASSET TYPES IN COST
Type Category Sub-Category Element Sub-Element
36303 Systems Utilities Compressed Air Pipes Subway 36304 Systems Utilities Air Conditioning/HVAC Subway 36400 Systems Utilities Emergency Exits Subway 36401 Systems Utilities Emergency Exits Tunnel Handrail 37000 Systems ITS - -37001 Systems ITS APC -37002 Systems ITS AVL -37003 Systems ITS CAD -37004 Systems ITS GPS -40000 Stations - - -40051 Stations Rail CTA At-Grade 40052 Stations Rail CTA At-Grade Median 40053 Stations Rail CTA Elevated 40054 Stations Rail CTA Subway 40056 Stations Rail Metra At-Grade w Building 40057 Stations Rail Metra At-Grade w Historic Building 40058 Stations Rail Metra At-Grade w Shelter 40059 Stations Rail Metra Downtown Terminal 40060 Stations Motor Bus - RTA Bus Passenger Facility 40061 Stations Motor Bus - Pace Bus Terminal 40062 Stations Motor Bus - Pace Bus Park & Ride 41010 Stations At-Grade - -41011 Stations At-Grade Motor Bus -41020 Stations Elevated - -41021 Stations Elevated Motor Bus -41030 Stations Subway - -41031 Stations Subway Motor Bus -41040 Stations Transit Center - -41050 Stations Shelter Motor Bus -41060 Stations Ferry Terminal - -44000 Stations Building - -44100 Stations Building At-Grade -44200 Stations Building Elevated -44300 Stations Building Subway -44400 Stations Building Components -44411 Stations Building Components Building Electrical 44412 Stations Building Components Lighting 44413 Stations Building Components Fire Alarm 44414 Stations Building Components Plumbing 44415 Stations Building Components Drainage 44416 Stations Building Components HVAC 44417 Stations Building Components Roof 44418 Stations Building Components Exterior 44419 Stations Building Components Station Attendant Booth 44420 Stations Building Components Interior
44422 Stations Building Components Emergency backup system: Generator
44423 Stations Building Components Other 45000 Stations Platform - -45400 Stations Platform - -45410 Stations Platform Surface -45411 Stations Platform Surface Concrete, asphalt, tile
44421 Stations Building Components Emergency backup system: UPS
RTA CAPITAL COST OPTIMIZATION TOOL GUIDE B-8

APPENDIX B: ASSET TYPES IN COST
Type Category Sub-Category Element Sub-Element
45412 Stations Platform Surface Wood 45413 Stations Platform Ferry Dock -45420 Stations Platform Shelters -45430 Stations Platform Canopy -45440 Stations Platform Signage & Graphics -45441 Stations Platform Signage & Graphics Electronic 45442 Stations Platform Signage & Graphics Static 45450 Stations Platform Lighting -46000 Stations Access - -46100 Stations Access Roadway -46110 Stations Access Roadway Auto 46120 Stations Access Roadway Bus 46200 Stations Access Parking -46210 Stations Access Parking Garage 46220 Stations Access Parking Lot 46230 Stations Access Parking & Equipment -46300 Stations Access Pedestrian -46310 Stations Access Pedestrian Elevators 46320 Stations Access Pedestrian Escalators 46330 Stations Access Pedestrian Pedestrian bridge 46340 Stations Access Pedestrian Pedestrian tunnel 46350 Stations Access Pedestrian Bike Lockers 50000 Vehicles - - -51000 Vehicles Revenue Vehicles - -55000 Vehicles Revenue Vehicles Bus -55100 Vehicles Revenue Vehicles Bus Articulated bus 55110 Vehicles Revenue Vehicles Bus Articulated bus -- CNG 55120 Vehicles Revenue Vehicles Bus Articulated bus -- Diesel 55130 Vehicles Revenue Vehicles Bus Articulated bus -- Hybrid 55200 Vehicles Revenue Vehicles Bus Large Bus (40 ft) 55210 Vehicles Revenue Vehicles Bus Large Bus (40 ft) -- CNG 55220 Vehicles Revenue Vehicles Bus Large Bus (40 ft) -- Diesel 55230 Vehicles Revenue Vehicles Bus Large Bus (40 ft) -- Hybrid 55300 Vehicles Revenue Vehicles Bus Medium Bus (35 ft) 55310 Vehicles Revenue Vehicles Bus Medium Bus (35 ft) -- CNG 55320 Vehicles Revenue Vehicles Bus Medium Bus (35 ft) -- Diesel 55330 Vehicles Revenue Vehicles Bus Medium Bus (35 ft) -- Hybrid 55400 Vehicles Revenue Vehicles Bus Small Bus (<30 ft) 55410 Vehicles Revenue Vehicles Bus Small Bus (<30 ft) -- CNG 55420 Vehicles Revenue Vehicles Bus Small Bus (<30 ft) -- Diesel 55430 Vehicles Revenue Vehicles Bus Small Bus (<30 ft) -- Hybrid 55500 Vehicles Revenue Vehicles Bus Over-the-Road Coach 55700 Vehicles Revenue Vehicles Bus School bus 55800 Vehicles Revenue Vehicles Bus Trolleybus 55900 Vehicles Revenue Vehicles Bus Double Decker bus 56100 Vehicles Revenue Vehicles Rail AGT 56200 Vehicles Revenue Vehicles Rail Cable Car 56300 Vehicles Revenue Vehicles Rail Commuter Rail
56330 Vehicles Revenue Vehicles Rail Commuter Rail: Self-Propelled Coaches
56400 Vehicles Revenue Vehicles Rail Heavy Rail
56310 Vehicles Revenue Vehicles Rail Commuter Rail: Locomotive 56320 Vehicles Revenue Vehicles Rail Commuter Rail: Passenger
Coaches
RTA CAPITAL COST OPTIMIZATION TOOL GUIDE B-9

- -
APPENDIX B: ASSET TYPES IN COST
Type Category Sub-Category Element Sub-Element
56500 Vehicles Revenue Vehicles 56510 Vehicles Revenue Vehicles 56520 Vehicles Revenue Vehicles 56530 Vehicles Revenue Vehicles 57000 Vehicles Revenue Vehicles
57100 Vehicles Revenue Vehicles
57200 Vehicles Revenue Vehicles
57300 Vehicles Revenue Vehicles
57400 Vehicles Revenue Vehicles
57500 Vehicles Revenue Vehicles
57600 Vehicles Revenue Vehicles
57700 Vehicles Revenue Vehicles
57810 Vehicles Revenue Vehicles
57820 Vehicles Revenue Vehicles
57830
58000 58100 58200 58300 58400 59000
59100 Vehicles Non-Revenue Vehicles
59200 Vehicles Non-Revenue Vehicles
59300 Vehicles Non-Revenue Vehicles
59400 Vehicles Non-Revenue Vehicles
Rail Light Rail Rail Light Rail -- LRV Rail Light Rail -- Historic Streetcar Rail Light Rail -- Monorail Small bus, paratransit, vans and autos Small bus, paratransit, vans and autos Small bus, paratransit, vans and autos Small bus, paratransit, vans and autos Small bus, paratransit, vans and autos Small bus, paratransit, vans and autos Small bus, paratransit, vans and autos Small bus, paratransit, vans and autos Small bus, paratransit, vans and autos Small bus, paratransit, vans and autos Small bus, paratransit, vans and autos
-
Automobile
Heavy Duty (22 passengers or more) Super Medium-Duty (22-pass)
Medium-Duty (14-pass)
Light-Duty (12-pass)
Mini-Van
Van
Taxicab sedan
Taxicab station wagon
Taxicab van Vehicles
Vehicles Vehicles Vehicles Vehicles Vehicles Vehicles
Revenue Vehicles
Revenue Vehicles Revenue Vehicles Revenue Vehicles Revenue Vehicles Revenue Vehicles Non-Revenue Vehicles
Other -Other Aerial Tramway Other Ferry Boat Other Inclined Plane Other Jitney
Car -
Truck -
Special -
Locomotive, Switch -
RTA CAPITAL COST OPTIMIZATION TOOL GUIDE B-10

Volume 2, Part 2
Criteria Investment Prioritization Process “How To” Guide
Pilot Product #2: Multi-Criteria Investment Prioritization Process
Prepared for
Regional Transportation Authority of Northeastern Illinois
September 2013


Table of Contents
1. Introduction ..................................................................................................................... 1-1 1.1 RTA and Its Transit Service Boards ................................................................................ 1-1 1.2 FTA TAM Grant............................................................................................................... 1-2 1.3 RT!’s Multi-Criteria Prioritization Process..................................................................... 1-2 1.4 Definition of Terms ........................................................................................................ 1-4
2. Background – RTA Capital Planning and Prioritization Process............................................ 2-1 2.1 RT!’s �apital Plan Development Process ...................................................................... 2-1 2.2 Role of Prioritization in RTA Capital Planning Process................................................... 2-1 2.3 RT!’s �OST ..................................................................................................................... 2-2 2.4 Development of �OST’s Prioritization �riteria Metrics – Overview .............................. 2-3
3. “How to” Guide to Select Prioritization �riteria.................................................................. 3-1 3.1 Prioritization Criteria Workshops .................................................................................. 3-1 3.2 Principles of Criteria Selection....................................................................................... 3-1 3.3 Criteria Evaluated for Selection ..................................................................................... 3-3 3.4 Narrowing the List.......................................................................................................... 3-5 3.5 Reinvestment, Expansion and Enhancement ................................................................ 3-7
4. “How to” Guide to Develop �riteria Measures ................................................................... 4-1 4.1 Criteria Scoring Measure Identification......................................................................... 4-1 4.2 Criteria Scoring Measure Quantification ....................................................................... 4-3
5. “How to” Guide to !ggregating �riteria into a Single Prioritization Score............................ 5-1 5.1 RT!’s !pproach to �riteria Score !ggregation .............................................................. 5-1 5.2 Selecting Criteria Weights.............................................................................................. 5-2 5.3 Sample Scoring Results .................................................................................................. 5-5
6. Other Issues...................................................................................................................... 6-1 6.1 RT! !pplications of �OST’s Prioritization Routine ........................................................ 6-1 6.2 Compatibility with TERM Lite ........................................................................................ 6-2
Appendix A: Glossary and Abbreviations...................................................................................A-1
MULTI-CRITERIA INVESTMENT PRIORITIZATION PROCESS “HOW TO” GUIDE i

MULTI-CRITERIA INVESTMENT PRIORITIZATION PROCESS “HOW TO” GUIDE ii

CHAPTER 1 INTRODUCTION
1. Introduction 1.1 RTA and Its Transit Service Boards The Regional Transportation Authority of Northeastern Illinois (RTA) is the oversight, funding, and regional planning agency for the three transit operators (also known as Service Boards) that serve Northeastern Illinois:
Chicago Transit Authority (CTA) – the nation's second largest public transportation system. The CTA service area covers the City of Chicago and 40 surrounding communities. Through its bus and rail systems, it provides more than 80 percent of public transit trips in the six-county Chicago metropolitan area (Cook, DuPage, Will, Lake, Kane, and McHenry counties) either with direct service or connecting service to Metra and Pace.
Metra – commuter rail agency. Metra serves more than 100 communities in the six counties with 241 stations on 11 lines running from �hicago’s downtown;
Pace – suburban bus and regional paratransit. Pace is the suburban transit provider for the Chicago area. Pace serves riders with fixed bus routes, vanpools, and Dial-a-Ride programs covering 3,500 square miles spread over six counties and 284 municipalities. Pace is also the ADA paratransit provider for the region.
The RTA was created in 1974 through approval of a referendum by the residents of the six counties (Cook, DuPage, Will, Lake, Kane, and McHenry counties). The RTA is a special-purpose unit of local government and a municipal corporation of the State of Illinois. The three Service Boards - each led by a Board of Directors - individually handle their respective transit operations and fare responsibilities.
The RTA regional system is the third largest in the country, covers approximately 7,200 route miles, and provides more than two million daily rides; The RT!’s combined assets include approximately 7,000 revenue vehicles, 380 rail stations, over 350 bus routes, and 60 maintenance facilities. With some of the nation’s oldest transit assets, the RTA also has significant reinvestment needs to attain and maintain a state of good repair (SGR).
Table 1: Representative Service Board Resources and Transit Service Provided (2012)
CTA Bus CTA Rail Metra Pace
Revenue Vehicles 1,817 1,330 1,265 2,584
Other Vehicles 934 576 143
Fixed Guideway Route Miles 3.7 207.8 980.4 N/A
Annual Revenue Miles 52.4 million 65.2 million 47.41 million 35.1 million
Annual Revenue Hours 5.6 million 3.6 million 1.54 million 2.1 million
Annual Passenger Miles 725.0
million 1,541 million 1,768.8 million 256.3 million
Stations, Bus Stops and Transit Facilities
11,468 posted bus 145 269 9 transfer centers, stops
9 Park-n-rides,
18 boarding/ turnaround facilities
Source: 2012 Operations data from CTA, Metra, Pace
MULTI-CRITERIA INVESTMENT PRIORITIZATION PROCESS “HOW TO” GUIDE 1-1

CHAPTER 1 INTRODUCTION
1.2 FTA TAM Grant In 2011, the RTA received an $800,000 Transit Asset Management (TAM) Pilot Project grant from the Federal Transit Administration (FTA). This pilot project includes TAM improvements that build off existing RTA TAM processes already in progress, namely the Capital Asset Condition Assessment, Capital Decision Prioritization Support Tool (now called the Capital Optimization Support Tool, COST), and management approaches already in use. The objectives of RT!’s T!M grant include:
Document RT!’s existing policies; goals and objectives; performance targets and evaluation processes; and inventory/condition data collection, management, and reporting processes such that other local and regional operators can benefit from RT!’s experience;
Advance the T!M “state-of-the-art” capabilities in the areas of estimated capital investment needs and investment prioritization; and
Develop asset-to-project groupings using the analytical foundation provided by RT!’s existing project screening and prioritization process and FT!’s Transit Economic Requirements Model (TERM) model.
The TAM Pilot Project is an 18 month process for RTA, which is documented in two volumes and the four work papers:
Volume 1: Asset Inventory and Condition Assessment Guide
Volume 2: Part 1 – RT! �OST Model “How To” Guide, Pilot Product #4: �apital Prioritization Decision Support Tool
Volume 2: Part 2 – Multi-�riteria Investment Prioritization Process “How To” Guide, Pilot Product #2: Multi-Criteria Investment Prioritization Process
Volume 2: Part 3 – !sset to Project Mapping “How To” Guide, Pilot Product #3: !sset-to-Capital Project Numbering Convention.
This document presents the second “how to” Guide on development and application of automated, multi-criteria investment prioritization processes. This document is intended to be helpful to other operators or funding agencies developing and applying similar multi-criteria investment prioritization processes.
1.3 RTA’s Multi-Criteria Prioritization Process This “How to” Guide provides a detailed description of the steps taken by RTA to develop the investment prioritization routine used by RT!’s Capital Optimization Support Tool (COST). As background, RT!’s COST is an MS Access based tool (based on FT!’s TERM Lite Model) designed to perform the following analyses for RTA and its three Service Boards:
1. Assess current size of SGR backlog. 2. Assess (estimate) current asset conditions. 3. Conduct assessment of 20-year unconstrained capital reinvestment needs. 4. Assess the impact of constrained reinvestment on:
a. SGR backlog b. Asset Conditions c. Proportion of assets in SGR
5. Prioritize reinvestment (rehab and replacement) needs based on five investment criteria (asset condition, number of riders impacted and impact of investments on each of the following: reliability, safety, and O&M costs). Includes the prioritization of reinvestment needs for expansion assets assumed to be acquired during the period of analysis.
MULTI-CRITERIA INVESTMENT PRIORITIZATION PROCESS “HOW TO” GUIDE 1-2

CHAPTER 1 INTRODUCTION
6. Prioritize investment in expansion/enhancement assets (as proposed by RTA and its Service Boards) based on investment cost per rider impacted.
7. Assess the impact of expansion/ enhancement investments on: a. SGR backlog b. Asset Conditions c. Proportion of assets in SGR.
COST’s ability to assess the impact of constrained funding on the RT! region’s future SGR backlog and asset conditions is dependent on its ability to prioritize between multiple SGR investment alternatives (i.e., given that funding is insufficient to address all needs, what needs should be addressed first?). Development of a reliable prioritization routine was therefore critical to providing COST with the ability to conduct meaningful analyses of the expected impacts of constrained funding. Note that much of the prioritization capability developed by RTA for COST has already been adopted and incorporated into FT!’s TERM Lite model;
In addition to supporting “what-if” analysis of the potential future impacts of constrained funding, COST’s ability to prioritize reinvestment needs was also intended to help support the identification and prioritization of actual reinvestment projects. Specifically, RTA and its Service Boards can therefore use the tool as an independent, objective review of the list of SGR investment projects identified by Service Board staff through traditional engineering processes. In this role, COST (and its prioritization routine) acts as a “devil’s advocate”, potentially identifying investment opportunities and prioritizations that RT! may not have otherwise considered.
Approaches to Prioritization: This Guide is meant to provide value to other transit operators and funding agencies seeking to develop or refine their own prioritization processes. To this end it is helpful to first be aware of the many approaches that can be taken to prioritization (and their related purposes) and the multi-criteria process developed by RTA represents a specific approach and purpose. It is important that all of the approaches to prioritization presented below are complementary to one another (as they all address different aspects of prioritization):
Analysis Tool-Based Prioritization: RTA’s COST falls into this general category. COST is an automated process that assesses the current and future reinvestment needs for an inventory of transit assets; The prioritization “routine” is therefore also fully automated and hence requires clear rules for prioritizing needs based on information recorded in thousands of asset records. This type of prioritization is best suited for (1) mid- to long-term “what if” analyses and (2) mid-to high-level evaluations of actual reinvestment plans (i.e., have actual plans identified all needs and might these needs be prioritized differently).
Facilitated, “Pair wise comparison” Prioritization: Briefly, in this approach agency staff work together to establish which prioritization factors (criteria) are most important to the agency and how those factors should be weighted (note that this is actually also part of the development steps for COST’s prioritization routine); This approach then assigns prioritization scores to proposed investment projects (i.e., how well does each project support each of the identified criteria?) and assigns each project a priority ranking, from highest to lowest, based on the prioritization score. Note that this approach is typically based on actual, identified projects (as opposed to COST which works with an inventory of assets). Some industry observers suggest that this approach is best applied after the projects have been well developed for the sake of reliably scoring against the selected prioritization criteria, and have already been identified for inclusion in the Capital Improvement Program. Here prioritization helps determine the ordering
MULTI-CRITERIA INVESTMENT PRIORITIZATION PROCESS “HOW TO” GUIDE 1-3

CHAPTER 1 INTRODUCTION
of these projects and to determine which projects will “just need to wait” when funding is limited.
Detailed Project Review Process: Under this approach, traditional engineering processes are used to identify reinvestment needs and then an intensive analysis of each project is conducted to assess:
o How does this project contribute to agency SGR/ service performance? o What is the Net Present Value? o What is the impact on agency capital and Operations and Maintenance (O&M) costs? o Acquisition, operation, maintenance and disposal requirements? o Detailed assessment of contribution to agency prioritization criteria/strategic or TAM
goals?
In contrast to the first two approaches, this analysis is very detailed for some projects (less so for less expensive, smaller projects). The results of this analysis can help feed the first two approaches.
Once again, these three approaches are all considered to be mutually supportive of one another.
Document Overview: The intention of this Guide is to provide a detailed review of the specific process used by RTA to develop the prioritization routine utilized in RT!’s COST. Specifically, this Guide considers each of the following:
Chapter 2: RT!’s �apital Planning Process Chapter 3: Identification of Preferred investment criteria Chapter 4: Development of measures to score each criterion Chapter 5: Aggregating Criteria into a Single Prioritization Score
1.4 Definition of Terms The following are definitions of key terms used in this Guide:
Prioritization: For this Guide, prioritization is the process of identifying a preferred or optimal order for reinvestment events. Implicit in this statement is the assumption that:
o Funding is insufficient to address all needs. Hence prioritization is required to determine which assets should be addressed first (and which assets may not be addressed).
o Investment needs can be ranked. In other words, there are good analytic or other bases that can be used to rank investment needs – from highest to lowest—to determine which outstanding needs are most effectively addressed.
Prioritization Criteria: Prioritization criteria provide the basis for determining the priority of individual investments. In general, investments are made with the expectation that the completed investment will yield improvements to one or more aspects of agency operations (e.g., improvements to reliability, efficiency, safety, rider comfort or other characteristic). Within a prioritization routine, the most desirable or important of these types of investment outcomes are referred to as “investment criteria”; Investments that perform best with respect to these criteria (i.e., tend to be provide the best mix of desired outcomes) are assigned the highest priority. Investments that perform poorly may receive a low priority ranking.
Prioritization Criteria Scores: For the purposes of this Guide, prioritization criteria should be quantifiable so investments can be assigned a numeric score that reflects their potential
MULTI-CRITERIA INVESTMENT PRIORITIZATION PROCESS “HOW TO” GUIDE 1-4

CHAPTER 1 INTRODUCTION
contribution to the desired outcome associated with that criterion (e.g., contribution to SGR). Note that numeric criteria scores facilitate objective comparisons between investment options. Given that different criteria may naturally be associated with specific unit quantities (e.g., condition rating for SGR and dollar values for operating costs), these score need to be converted to a common basis if the intention is to generate a multi-criteria prioritization score.
Multi-Criteria Investment Prioritization (criteria weighting): Multi-criteria investment prioritization refers to the process of evaluating and prioritizing investment options based on each investment’s performance against a mix of investment criteria. In the context of this Guide and RT!’s COST, multi-criteria investment prioritization implies that (1) all criteria are individually scored on a common scale (e.g., running from 1 to 5) and (2) these criteria scores are combined into a weighted average score, with the weight placed on each criterion reflecting its relative importance.
The following definitions for State of Good Repair (SGR) separate the asset level from aggregate level.
Asset Level SGR: An asset is in a state of good repair (SGR) if (i) its age does not exceed its expected useful life and (ii) all rehabilitation and annual capital maintenance activities are up to date. Under these circumstances, an asset has no deferred capital reinvestment needs and, by definition, has an estimated condition score of 2.5 or higher (RTA/TERM Lite decay curves are defined such that assets attain their useful life and a condition score of 2.5 concurrently). If an asset has undergone a major life extending rehabilitation, it can exceed its expected useful life and still be in SGR. Non-attainment of SGR does not imply an asset is unfit for service or unsafe but it may increase the likelihood of sub-optimal performance (i.e. reliability and availability performance may decrease).
Mode, Service Board, or Regional Level (Aggregate) SGR: A transit mode, Service Board or the region is considered to be in SGR if each of its component assets is in SGR (as defined above). Mode, Service Board and regional level SGR represents an ideal state and is not attainable in practice as (i) rehabilitation and replacement needs arise continuously and (ii) mode, Service Board and regional level budgets are generally insufficient to meet these continuous needs. As such, a more realistic view of SGR at an aggregate level is based on the region’s target/tolerance for achieving reinvestment goals – such as halving the current SGR backlog over a certain timeframe or not allowing the SGR backlog to grow beyond current levels.
Reinvestment in existing assets versus Investment in New Expansion or Enhancement Assets: COST is designed to assess and prioritize investment needs for both existing and expansion assets. In general, these investment types fall into the following categories:
o Reinvestment in Existing Assets: Refers to rehabilitation and replacement or SGR investments in assets that are currently in service
o Investment in expansion assets: Refers to the planned/proposed future purchase of new assets that either: (i) expand existing service capacity (e.g., fleet expansion), (ii) adds a new service (e.g., New Starts) or (iii) enhances existing service (e.g., new technologies such as real-time arrival information).
The prioritization criteria discussed in this Guide generally refer to reinvestment choices, as the capability to prioritize new acquisitions, or expansion assets, is being developed in COST though not as part of the TAM grant itself.
MULTI-CRITERIA INVESTMENT PRIORITIZATION PROCESS “HOW TO” GUIDE 1-5

CHAPTER 2 BACKGROUND RTA CAPITAL PLANNING AND PRIORITIZATION PROCESS
2. Background – RTA Capital Planning and Prioritization Process This chapter provides background on RT!’s capital planning and prioritization processes including:
Overview of regional capital budget development processes
RT!’s preexisting prioritization processes RT!’s COST
Overview of COST’s prioritization process
2.1 RTA’s Capital Plan Development Process In 2006, the RTA, along with the Service Boards developed a Strategic Plan to raise awareness of the need to maintain, enhance and expand transit service in the region. The !uthority’s Strategic Plan included further goals of enhancing coordination, integrating information, and improving system access and ease of use. One of the purposes of the Strategic Plan was to provide a long-range plan to guide the region in achieving a world-class public transportation system that is the keystone to growing business opportunities, a thriving job market, clean air and livable communities over the coming decades. This work provided the foundation for the subsequent funding and reform legislation enacted in January 2008 as P.A. 95-0708. The legislation mandates the RTA to provide more effective financial oversight, regional planning, and coordination among the three operating Service Boards. In enhancing the role of the RTA, the legislation makes the Strategic Plan the cornerstone of all RTA planning, financial and oversight activities. The update to the Strategic Plan established a capital evaluation process for budget development; and established 10-year financial plan requirements and how they guide decision making. To deliver the financial portion of the plan, the RTA created the Capital Program Oversight Prioritization Process Task Force, with the participation of the three Service Boards.
In July of 2008, the RTA Board adopted Ordinance No. 2008-46 endorsing the work done by the RTA and the Service Boards Capital Program Oversight Prioritization Process Task Force and adopting the processes developed on an interim basis for capital evaluation in the 2009 budget development (see pages 7-3 and 7-4). This process, which became a permanent requirement of budget development, employs a multi-layered configuration to determine which capital projects become programmed in the five-year capital plan and annual budgets. This consists of a screening process that groups potential projects into related types of investments (e.g., preservation, expansion or enhancement) followed by a prioritization process that scores each proposed investment based on its customer impacts, mission criticality, ridership impacts and a benefit-cost test, and finally a programming process that overlays another set of criteria, such as project readiness, to determine the actual programming of the prioritized projects.
2.2 Role of Prioritization in RTA Capital Planning Process In 2010 the RTA engaged in the development of the Capital Optimization Support Tool (COST) and completed the Asset Condition Assessment (new Transit Asset Management Initiatives) to report the region’s capital backlog and 10-year capital needs. Subsequently the RTA updated the report in 2012 and is currently working on the 2013 update report. The RTA will incorporate the new TAM initiatives in a holistic manner that will utilize reports from COST that use quality data and well defined objectives and criteria for the update of capital planning and annual budgeting processes. This will help to transparently collaborate in the determination of budgetary needs resulting in the optimal allocation and subsequent greater straightforwardness in the obtaining of funding for required projects to obtain and maintain a SGR.
MULTI-CRITERIA INVESTMENT PRIORITIZATION PROCESS “HOW TO” GUIDE 2-1

CHAPTER 2 BACKGROUND RTA CAPITAL PLANNING AND PRIORITIZATION PROCESS
Currently, the RTA collects data from the Service Boards regarding potential capital projects to be included in the RT!’s �apital Program; The RTA requests the Service Boards to provide certain information for each individual proposed project to be included in the Capital Program.
The proposed projects should fall into one of three categories: maintenance, enhancement and expansion. The project scope should include a complete description of the project including all significant elements; project justification including specific goal and purpose, quantifiable impacts on operating and cost or service reliability as well as ridership increases and State of Good Repair (SGR) progress. The Service Boards should include in the Capital Program a general discussion regarding SGR achievement for major system components within each Asset Category.
The RTA requires the Service Boards to use COST to assist them in this analysis. The Service Boards provide a parallel comparative analysis component report from COST to justify the proposed capital project.
2.3 RTA’s COST In April 2011, RTA initiated development of the Capital Decision Prioritization Support Tool (now COST). COST is an MS Access based database and model that houses a comprehensive inventory of all major capital assets owned and operated by RT!’s three Service �oards: �T!, Metra and Pace. COST also includes asset type specific life expectancies and life cycle reinvestment rules which are used to allow the tool to assess or predict each of the following:
Current size of SGR backlog
20-year unconstrained capital reinvestment needs
The impact of constrained reinvestment on: o SGR backlog o Asset Conditions o Proportion of assets in SGR.
Need for Prioritization: COST’s ability to assess the impact of constrained funding on the RT! region’s future SGR backlog and asset conditions is dependent on its ability to prioritize between multiple investments. More specifically, when funding is not sufficient to address all investment needs (i.e., funding is constrained), then the Tool requires rules to determine which needs are addressed and which needs will enter the backlog. The prioritization rules allow the Tool to rank investment needs from highest to lowest priority. For each year of constrained funding then, COST reorders investment needs from highest to lowest priority and then invests in these needs from highest to lowest until the available funding capacity for that year is exhausted. This process is repeated for each year of COST’s 20-year forecast period.
Prioritization - Backlog Management: As described to this point, COST’s prioritization routine is used as a means to allocate funding between competing needs for the purpose of assessing the impact of alternative reinvestment priorities on the size and composition of the region’s SGR backlog. As different reinvestment priorities will lead to some asset needs being address and others entering the SGR backlog, adjusting these priorities and their weights allow an analyst to use COST to examine the desirability of alternative investment prioritization weights with respect to the SGR backlog. COST can then help identify a preferred mix of priorities that can be used to guide actual reinvestment priorities within the region.
MULTI-CRITERIA INVESTMENT PRIORITIZATION PROCESS “HOW TO” GUIDE 2-2

CHAPTER 2 BACKGROUND RTA CAPITAL PLANNING AND PRIORITIZATION PROCESS
Prioritization - Capital Programming: Note however that COST’s prioritization capabilities can also provide a more direct input to the region’s investment prioritization process; Specifically, RT! and the Service Boards can compare COST’s selected reinvestment priorities, for specific asset types and locations, with the reinvestment priorities identified through traditional engineering methods (e.g., as documented in the CIP and capital budgets). In this role, COST provides an independent, objective and alternative review of the region’s engineering-based reinvestment plans. This comparison can help further refine and prioritize those plans, potentially leading to improved investment decisions.
COST and the TAM Multi-Criteria Investment Prioritization Process: RT!’s objective in developing the multi-criteria investment prioritization process was to equip COST with the two types of prioritization capabilities described above:
Ability to analyze the impact of alternative investment priorities on future backlog needs and
Support the prioritization of actual investments (through comparison for COST investment selections with engineering-based project selections)
Hence, all of the prioritization development actions described in this Guide have been conducted with the purpose of providing RT!’s COST with these two capabilities.
A conceptual representation of the role of prioritization within RT!’s COST is depicted below in Figure 2-1 with example prioritization criteria.
Figure 2-1: Role of Prioritization within RTA’s �OST
Preliminary Screen
Required Life-Cycle Event (i.e., rehab / replace)?
Service Board Assets
Assets
Prioritization
Asset Condition Reliability Safety Rider Impacts ROI
FundedNeeds
Program
Restricted Funding Commitment to
Ongoing Projects
Prioritized Needs
Assets Not in SGR
Projects
Group into Projects
By Location By Asset Type
For each year of a 20-year model run, COST first identifies which of the region’s assets require some reinvestment action (e.g., rehab or replacement) to attain SGR. Next, the Tool assigns prioritization scores to each of these assets and will reinvest in the highest scoring assets until the expected amount of reinvestment funding for that year is exhausted. Using this prioritization, COST then determines for each year, what assets undergo reinvestment actions, what assets do not (and enter the SGR backlog) and what projects result from the investment actions.
2.4 Development of COST’s Prioritization Criteria Metrics – Overview The remaining sections of this report describe:
MULTI-CRITERIA INVESTMENT PRIORITIZATION PROCESS “HOW TO” GUIDE 2-3

CHAPTER 2 BACKGROUND RTA CAPITAL PLANNING AND PRIORITIZATION PROCESS
The identification and development of the prioritization metrics now embedded in RT!’s COST and
The application of those prioritization metrics, both within the tool (for analysis purposes) and in support of actual investment planning.
This includes discussion of the:
Processes used to identify the region’s preferred prioritization criteria
Translation of those criteria into quantifiable metrics
The analytic processes used to weight each criterion and
How these measures are used by COST itself.
Finally, this Guide explains how RTA plans to apply the tool for needs analysis and budget development support purposes.
MULTI-CRITERIA INVESTMENT PRIORITIZATION PROCESS “HOW TO” GUIDE 2-4
CHAPTER 3 “HOW TO GUIDE TO” SELECT PRIORITIZATION CRITERIA
3. “How to” Guide to Select Prioritization Criteria This chapter provides background on the processes used by RTA to select a preferred set of regional investment criteria. Given that the RTA remains focused on SGR related investments, this discussion is similarly focused on prioritization criteria relating to reinvestment (i.e., rehabilitation and replacement) in existing assets. This chapter does, however, have some high level discussion of investment criteria for investments that enhance or expand the region’s transit services;
Specifically, this chapter describes each of the following:
Prioritization Selection Workshops
Selecting criteria that match agency TAM goals
Can criteria be quantified?
Selecting criteria based on investment types: SGR, enhancement and expansion investments.
Note that this chapter is focused solely on the region’s approach to selecting the preferred criteria.
3.1 Prioritization Criteria Workshops A key objective for RTA in developing COST, the Tool’s prioritization capabilities and the related regional condition assessment process is to ensure regional consensus on how these and other regional capital planning issues are addressed. To help build this consensus with respect to prioritization criteria selection and measurement, RTA convened a series of Prioritization Criteria Workshops in early 2011. The express purpose of the workshops was to select and develop the region’s prioritization criteria. The workshops were attended by select capital planning and engineering staff from RTA and each of its three Service Boards. Members of the RTA workshops are hence referred to as “working group”; Note that many of the workshop participants were also members of a Capital Working Group that meets regularly to address other issues relating to regional capital investment needs. The workshops were facilitated by consultant staff from CH2M HILL, that were also tasked with overall development of COST. The remaining sections of this chapter review the basic approach and steps taken to identify the region’s preferred investment prioritization criteria.
3.2 Principles of Criteria Selection Prior to reviewing and considering specific investment criteria, the Prioritization Criteria Workshop participants first agreed on the principles for criteria selection as outlined in Figure 3-1. These principles breakout into the following groups:
Reflect Regional Strategic Goals: The selected criteria should be consistent with the region’s strategic goals – including those relating to SGR, service performance, safety, service expansion, etc. – as outlined in the agency’s strategy and policy documents and mission statement. The criteria should, of course, also align with any adopted Transit Asset Management (TAM) policies. While the RT! and its Service �oards have yet to adopt formal T!M policies, attaining a regional “state of good repair” is nonetheless a clear and primary reinvestment objective, and hence needs to be reflected in criteria selection.
MULTI-CRITERIA INVESTMENT PRIORITIZATION PROCESS “HOW TO” GUIDE 3-1

CHAPTER 3 “HOW TO GUIDE TO” SELECT PRIORITIZATION CRITERIA
Figure 3-1: Criteria Selection Principles
Scoring of Assets
Reflect Regional Goals
• Promote desired Maintainoutcomes (e.g., SGR)
• Be consistent with strategic objectives
Avoid Duplication in Criteria
• Goal for criteria selection should be:
• Mutually exclusive
• Collectively exhaustive
Limit Number of Criteria
• 3 to 5• Too many criteria
can make results difficult to interpret
Be Quantifiable Scoring Metrics
• Tool requires numeric values to score and rank
• Binary: “yes / no” • Integer rankings• Continuous
valued functions
Rely on Readily Available Data
• Condition assessment
• RTAMS / sub-regional measures
• Service Board reports
• User input
Be Asset Based
• Primary data source is asset based Condition Assessment
• Needs will be prioritized at the asset level
Criteria (e.g., “Promote SGR”)
Avoid Duplication: A recognized principle to prioritization criteria selection is to ensure that the selected criteria are:
Mutually Exclusive: No two criteria rate an investment on essentially the same measure. A simple example of two non-mutually exclusive criteria would be (1) asset age as a proportion of useful life and (2) asset condition. Given that asset condition is generally (though not always) closely correlated with proportion of asset age consumed, these two criteria carry much of the same “information” on the need to reinvest in any given asset; Therefore, including both measures in a prioritization evaluation would tend to reinforce much of the same information while adding little new information on the state of the asset. It is better to stick with the most comprehensive criterion among those that are correlated (e.g., asset condition in the example above). In practice it can be challenging to avoid some overlap between prioritization criteria as many types of transit investment activities (e.g., fleet replacements) tend to always perform well with respect to many seemingly unrelated criteria (e.g., impacts on condition, reliability, safety, operating costs) while other investment types (e.g., maintenance equipment replacement) have little impact on the same criteria.
Collectively Exhaustive: In a perfect world, the selected investment criteria would also cover all factors the agency considers important to prioritization. This is generally not feasible in practice as the number of “important factors” may prove to be extensive (too many criteria to monitor) and some investment factors may not be measured with sufficient reliability (e;g;, “rider comfort”); In this regard RT! opted to focus on a limited set of criteria that together provide a wide, if not fully comprehensive, coverage of prioritization factors.
Limit the Number of Criteria: Scoring investments using numerous investment criteria can make it difficult to interpret why some investments score better than others and whether investments with very similar scores are really equally desirable; Participants in RT!’s �riteria workshops agreed it would be best to limit the number of criteria to a relatively short list – thus sacrificing some comprehensiveness in favor of more understandable, and hence more credible, prioritization results.
Quantifiable: !s already noted, RT!’s ultimate goal with the criteria selection process was to have COST assign a numeric prioritization score (and weighting) to all regional transit asset reinvestment needs. This prioritization score assesses how reinvestment in a specific asset (e.g., replacement of a bus fleet) is expected to satisfy a mix of preferred investment criteria. Given that this overall
MULTI-CRITERIA INVESTMENT PRIORITIZATION PROCESS “HOW TO” GUIDE 3-2

CHAPTER 3 “HOW TO GUIDE TO” SELECT PRIORITIZATION CRITERIA
prioritization score is numeric, it follows that each of the component criteria within that score must also be assigned a numeric value. In other words, all of the selected criteria must be quantifiable. While this requirement does not mean that the underlying criteria cannot be qualitative in nature, it does mean that the group selecting the preferred criteria must come to terms with (1) how qualitative criteria might be quantified in such a way that (2) the resulting prioritization scoring for those qualitative criteria will be considered credible when compared to naturally quantitative measures; ! good example here is “rider comfort”: how can rider comfort be quantified such that the quality of this measure is credibly comparable to more measurable criteria like number riders impacted by an investment?
Rely on Readily Available Data: The prioritization scoring within RT!’s COST was to be fully automated due to the number of asset records (i.e. the Tool assigns prioritization scores based on information on the individual assets documented in the region’s asset inventory). Therefore the scoring must rely on that same asset data and other existing data sources that can be tied to those assets. RTA must also be able to update and rerun the prioritization routines on a repeatable basis, well into the future. Moreover, the RTA and the Service Boards did not wish to develop and maintain new primary data collection processes to support this prioritization scoring. Hence, the scoring process needed to rely on existing data sources.
Given that RT!’s current asset inventory (as of this writing) includes close to twelve thousand asset records, there is very little to no opportunity to fine tune the prioritization scoring for individual assets. Hence, prioritization routine must be fully automated and the data used to run the prioritization routine must be available for all asset types included in the inventory.
Asset Based: RT!’s asset inventory houses data on and evaluates the life cycle needs of individual transit assets. Hence the current prioritization routine and the criteria are also focused primarily on the reinvestment needs of individual transit assets. Therefore, the tool does not technically evaluate the investment needs of “projects”, where projects may represent the bundled reinvestment needs for multiple assets. While the tool increasingly has the capability to bundle related assets into projects, this is done primarily to help RT! and the Service �oards “recognize” potential investment projects, not as a means of prioritizing actual, programmable projects.
Override: On occasion, it should be expected that the reinvestment needs for individual assets will not be well represented by the selected investment criteria. To help address this issue, RTA and the Service �oards identified the need to be able to “override” the automated prioritization scoring to ensure that some asset reinvestment needs attain high investment priority, despite their calculated scoring against the selected criteria. This function permits early replacement of assets that have failed well before the end of their useful life, or to address a special government mandate.
3.3 Criteria Evaluated for Selection Having agreed on the principles for selecting a preferred set of criteria, the Workshop next assembled a detailed listing of the potential investment criteria to choose from. Once again, this list is intended to focus on prioritizing investments related to the rehabilitation or replacement of existing assets (and not investments to expand capacity or to acquire new technologies to enhance service). This list was assembled from a variety of sources:
MULTI-CRITERIA INVESTMENT PRIORITIZATION PROCESS “HOW TO” GUIDE 3-3

CHAPTER 3 “HOW TO GUIDE TO” SELECT PRIORITIZATION CRITERIA
RTA and Service Board Policy and Mission Statement documents: RTA and Service Board strategy, policy and mission statement documents were reviewed to identify potential investment criteria
RTA and its Service Boards: Prioritization criteria currently or recently used by RTA and its Service Boards
Peer Agencies: Prioritization approaches and criteria used by peer transit operators
Other Transportation Sectors and Sources: Criteria used by US state DOTs (highways) and in other countries (e.g., Great Britain, Australia, EU)
Other Industries: Common prioritization criteria used for asset management purposes in other industries such as wastewater and utilities
Based on these reviews, RT!’s �riteria Workshop participants identified a list of thirteen potential investment criteria from which three to five preferred criteria would be selected. This listing is presented below in Figure 3-2. As a first pass through this list, the participants were asked to rate each of these thirteen potential criteria as being:
Figure 3-2: List of Potential Investment Criteria – For Rehab and Replace Investments
Potential Investment Criteria Critical
Valuable but Not Critical
Low Value / Not Relevant
SGR/Asset Condition
Cost effectiveness/benefit-cost
Reliability
Safety
Security
O&M Cost Impact
Environmental
Transit Oriented Development (TOD)
Regulatory Requirements/Mandates
Riders Impacted
Ridership Gain
Employee Impacts
Technology
Critical: Criterion is key to effective prioritization and must be included in the final listing of preferred criteria (“must have”).
Valuable but Not Critical: �riterion is valuable but not critical to investment prioritization (“nice to have”);
Low Value / Not Relevant: Criterion is of low (or no) importance or relevance to reinvestment prioritization for rehab-replace investments.
For RT!, the assignment of potential criterion as being “�ritical”, “Valuable but Not Critical”, or “Low Value / Not Relevant” was attained through open discussion between RTA and Service Board Workshop participants. This process did yield general (but not complete) consensuses on which criteria were considered preferred. The first pass through the list also resulted in the selection nine preferred criteria, thus exceeding the target range of three to five final criteria (see checked boxes in Figure 3-2). Steps taken to reduce this list are described in the next section.
MULTI-CRITERIA INVESTMENT PRIORITIZATION PROCESS “HOW TO” GUIDE 3-4

CHAPTER 3 “HOW TO GUIDE TO” SELECT PRIORITIZATION CRITERIA
Of the remaining criterion, two were considered valuable but environmental impacts of reinvestment were considered to be primarily situation dependent and not easy to automate in COST and ridership gains from SGR investments are difficult to measure credibly. Two other criteria – Transit Oriented Development and technology impacts – were considered not sufficiently relevant to reinvestment projects (these criteria are considered better suited to prioritization of enhancement and expansion investments).
3.4 Narrowing the List The working group next adopted two approaches to reducing the resulting list of nine preferred investment criteria to a more manageable list of five at the most:
Criteria Correlation Assessment: Evaluate correlations between criteria to determine if sufficient correlation exists between pairs of criteria to remove some criteria from this list
Other Solutions: Consider approaches to combining criteria and or adopting other strategies to prioritize some criteria without directly including them in the final list of criteria.
Criteria Correlation Assessment: The results of the criteria correlation assessment are presented below in Figure 3-3. Based on this assessment, participants determined to do the following:
Select Riders Impacted and Drop Cost Effectiveness: There is significant correlation between the number of riders impacted by a reinvestment action and the cost effectiveness of that action (i.e., cost of action divided by number of riders impacted). Moreover, cost effectiveness measures for piecemeal reinvestment actions (i.e., where only a portion of a full transportation system is replaced) can yield problematic prioritization results. For example, replacement of an inexpensive radio that supports service to a modest number of riders can yield a very low cost per rider value whereas replacement of an important rail bridge that is very expensive but important to a very high number of riders will likely yield a higher cost per rider value. But is it really less cost effective? In practice this approach will favor low cost items (like radios) at the expense of higher cost but critical items (like bridges). In general, the cost effectiveness measure is better suited to replacement or initial acquisition of complete transportation systems (as with New Starts projects) and not for individual asset replacements modeled in RT!’s COST. For this reason, number of riders impacted was selected over cost-effectiveness.
Figure 3-3: Correlations between Potential Criteria
Criteria
SGR (Condition) Safety Security Reliability Cost
EffectiveRider
ImpactsRidership
GainOperating
Cost Investments to:SGR (Condition) Improve asset condition
Safety High Reduce likelihood of accidents
Security Low Moderate Reduce likelihood of assault, theft, vandalism
Reliability High High Low Improve service reliability
Cost Effective Moderate Cost per rider / employee impacted
Riders Impacted High Moderate Moderate High High Number of riders
impacted
Regulatory ? ? ? ? ? ? Attract new riders / maintain existing
Operating Cost Moderate Low LowReduce O&M costs
Employee Impacts Low High Moderate Moderate Moderate Employee comfort,
safety and productivity
Employee Impacts: This criterion was intended to capture the impacts of reinvestment on the safety, productivity and general work environment of transit agency staff (e.g., vehicle operators, maintenance and operations staff). The working group determined that while this
MULTI-CRITERIA INVESTMENT PRIORITIZATION PROCESS “HOW TO” GUIDE 3-5

CHAPTER 3 “HOW TO GUIDE TO” SELECT PRIORITIZATION CRITERIA
consideration was very important, the impacts of reinvestment on the transit staff safety, productivity and general work environment were actually fairly well to very well correlated with other criteria (specifically, safety & security, and O&M cost impacts) and hence did not warrant a separate measure.
No Other Changes Based on Correlation Analysis: While it was determined that several of the preferred criteria were moderately to highly correlated with one another, the working group also determined these criteria were sufficiently different from one another that they should not be eliminated or combined. For example, it was agreed that investment actions that tend to favor reliability also frequently favor safety and O&M cost improvements (e.g., replacement of an aging fleet). Yet, these three criteria are each focused on different investment outcomes and there are times or asset types when they are not well aligned.
Other Solutions to Address Preferred Criteria: The objective under this approach was to consider methods of combining criteria and/or adopting other strategies to prioritize some criteria without directly including them in the final list.
Safety/Security: The working group made the decision to combine safety and security into a single prioritization criterion. This was done given (1) the common association of these two criterion and (2) the eventual solution used to score these two criterion supported their combination (as discussed in the next chapter; the decision to group these two criteria actually occurred after the Criteria Workshops were completed and RTA had initiated criteria scoring).
Regulatory Requirements/Mandates and Environmental: Ensuring that the prioritization process takes regulatory requirements, state and federal mandates and environmental impacts into consideration was also considered to be critical. However, implementation of these criteria within an automated COST was also considered to be problematic as these types of issues tend to be very situation specific (e.g., they may apply to some assets of a given type and not others, or may apply to one reinvestment cycle and not follow-on cycles, etc.). Moreover, the nature of new regulations and mandates frequently require that the regulation/mandate be addressed in the short - to medium-term – implying that the impacted assets should be assigned a very high overall replacement priority, regardless of current age or condition. Therefore, to address these related criteria and also to aid with similar situation specific high prioritization assignments (e.g., early replacement of failed assets), the working group developed a prioritization “override”; Specifically, the override is a “yes/no” value that COST users assign to assets that need to be replaced as soon as possible based on safety, regulatory, and/or failure prior to expected end of useful life considerations. COST sets all assets to “no” as a default; When assets are assigned an override value of “yes” by the user (e.g., to replace existing train control with positive train control, as required for commuter rail operators), those assets are assigned a very high, overall prioritization score (regardless of how the assets score based on the five automated criteria).
MULTI-CRITERIA INVESTMENT PRIORITIZATION PROCESS “HOW TO” GUIDE 3-6

CHAPTER 3 “HOW TO GUIDE TO” SELECT PRIORITIZATION CRITERIA
The final list of preferred criteria as selected by RTA for rehab and replacement investments is identified below in Figure 3-4.
Figure 3-4: RT!’s Selected Investment �riteria
Investment Criteria
SGR
Reliability
Safety & Security
O&M Cost Impact
Riders Impacted
Assesses Impact of Reinvestment Action on…
Improvement to asset condition
Improvement to service reliability
Reduced likelihood of accidents, assaults, robbery or vandalism
Reduction in O&M costs
Number of riders impacted by asset rehab/replacement
3.5 Reinvestment, Expansion and Enhancement !s noted above, it is intended that RT!’s COST will ultimately be capable of prioritizing service enhancement and expansion investments (e.g., New Starts projects), in addition to the rehabilitation and replacement of exiting assets. With its own funds, the RTA has developed a preliminary view of how to approach prioritization of these differing types of investments going forward based on their strategic and TAM goals. The key takeaway from that work is that different types of investment criteria are appropriate for different types of investments. For example, SGR investments do not tend to generate significant ridership increases while expansion investments, by definition, do increase ridership.
MULTI-CRITERIA INVESTMENT PRIORITIZATION PROCESS “HOW TO” GUIDE 3-7

CHAPTER 4 “HOW TO GUIDE TO” DEVELOP CRITERIA MEASURES
4. “How to” Guide to Develop Criteria Measures The preceding chapter focused on the selection of a preferred set of five prioritization criteria for SGR related investments that are automated in COST. In contrast, this chapter focuses on the identification and development of actual measures for the selected criteria. Consistent with the selection process, the identification of preferred criteria measures was ultimately conducted in a workshop setting with members of the same group of RTA, Service Board and consultant staff participating (working group).
4.1 Criteria Scoring Measure Identification The first step in implementing the preferred criteria was to identify specific measures used to assess how different investments will score with respect to each of the five criteria (SGR, reliability, safety and security, rider impacts and O&M cost impacts). The list of scoring options for these five criteria, including each metric’s pros and cons, is presented below in Figure 4-1. The final selections made by the working group participants are identified by a check mark. For agencies working to develop their own prioritization criteria, the primary “takeaways” from Figure 4-1 are the following:
Developers should consider a range of potential measures for each criterion
The selected metric should both (1) provide a credible measure for that criteria and (2) be supported by available data sources.
Figure 4-1: Criteria Scoring Measure Identification
Scoring Method Pros Cons Ongoing Data Requirements
Final ?
SGR
Asset Condition: FT!’s 5 to 1 decay curves
• Increasing score as assets age
• Consistent by asset type
• Asset age
• Utilization (opt)
Asset Condition: Condition Assessment Age Quintile “buckets”
• Easy to implement/
• understand
• No change in score once asset exceeds useful life
• Asset age
Override: Allow user to predetermine condition values for some assets
• Addresses assets with premature replacement needs
• User input for specific assets
Reliability
�inary: “Yes / No” (by asset type)
• Easy to implement/
• understand • Yes/no too coarse
Fixed Ranking Scale: e.g., 1 to 5 (by asset type)
• Easy to implement/
• understand • Invariant with asset
condition
Dynamic: Driven by condition (Reliability declines as condition declines)
• Better reflects relationship of condition and reliability
• Actual relationship not known
• Condition inputs • Relationship
Dynamic: Driven by age (Reliability declines as age
• Relationship between vehicle age and MDBF
• Actual relationship not known for non-
• Age inputs
• Relationship
MULTI-CRITERIA INVESTMENT PRIORITIZATION PROCESS “HOW TO” GUIDE 4-1

CHAPTER 4 “HOW TO GUIDE TO” DEVELOP CRITERIA MEASURES
Scoring Method Pros Cons Ongoing Data Requirements
Final ?
increases) somewhat known vehicle asset types
Safety & Security
�inary: “Yes / No” (by asset type)
• Easy to implement/ understand
• Yes/no too coarse
Fixed Ranking Scale: e.g., 1 to 5 (by asset type)
• Easy to implement/ understand
• Invariant with asset condition
Riders Impacted
Count: Count of riders serviced by each asset
• Easy to understand
• How many riders per admin/maintenance facility?
• Large magnitude differences in riders serving different assets
• Matching assets to number of riders utilizing those assets (by division, rail line, station)
Fixed Ranking Scale: e.g., 1 to 5 integer based scale based on differing volumes of riders
• Easy to understand • Big jumps between
levels
• Matching assets to number of riders utilizing those assets (by division, rail line, station)
Logarithmic Ranking Scale: e.g., 1 to 5 continuous based scale on differing volumes of riders
• Easy to understand • What’s a five and what’s a one?
• Matching assets to number of riders utilizing those assets (by division, rail line, station)
O&M Cost Impacts
Binary: “Yes/No” (by asset type)
• Easy to implement/ understand
• Yes/no too coarse • Binary: “Yes/No” (by
asset type)
Fixed Ranking Scale: e.g., 1 to 5 (by asset type)
• Easy to implement/ understand
• Invariant with asset condition
• Fixed Ranking Scale: e.g., 1 to 5 (by asset type)
Dynamic: Driven by condition: • O&M costs increase as
condition declines
• Better reflects relationship of condition and reliability
• Actual relationship not known
• O&M costs increase as condition declines
TBD
There are a number of common approaches used to develop the metrics for the preferred set of criteria listed in Figure 4-1:
Binary (yes/no) Scores: In some instances, investment criteria can be scored as being either “yes” or “no” meaning that they either contribute to the desired outcome associated with that criterion or they do not; While this “yes”/“no” situation does not apply to any of the five criteria selected by RTA, it does apply to the override function used to bypass the prioritization score. For example, if a set of assets need to be replaced immediately due to a government mandate,
MULTI-CRITERIA INVESTMENT PRIORITIZATION PROCESS “HOW TO” GUIDE 4-2

CHAPTER 4 “HOW TO GUIDE TO” DEVELOP CRITERIA MEASURES
applying the RT! override for these assets effectively says “yes” these impacted assets attain the override priority score and “no”, all non-impacted assets do not.
1 to 5 scales: Each of the five criteria selected by RTA have been scored on a common 1 to 5 scale; While this scale is not associated with any specific units (e;g;, “feet” or “dollars”), the scores for the individual criteria ultimately have been derived from unit quantities associated with those criteria (e.g., condition ratings for the SGR score and number of riders for the riders impacted score).
Fixed Scoring vs. Dynamic Scoring: RT!’s approach to scoring for some criteria is driven at least in part by asset type. The logic being that investment in some asset types tends to yield more of the desired outcome than does investment in other asset types. For example, replacing aging bus vehicles tends to yield better impacts to service reliability than does replacement of bus shelters. Under fixed scoring based on asset type, each asset type is assigned a specific score from the 1 to 5 scale (e.g., in the example above 5 for buses and 1 for bus stops), regardless of any other contributing factors. In contrast, RTA adopted scoring measures for the reliability, safety and security criteria that are a mix of (1) fixed scoring by asset type and (2) dynamic scoring to reflect the estimated physical condition of the asset (see Figure 4-2). Hence for the example above, replacing aging buses will always yield a better impact on service reliability than bus shelter replacements, but replacing a 16 year old bus will yield a better reliability return than will replacing a 12 year old bus. Hence, the criteria score is “dynamic” as it will continually change with the age of the asset. Eventually, O&M cost impacts will also have a mixed prioritization score
4.2 Criteria Scoring Measure Quantification The final step in developing criteria measures was to identify the specific approach to quantifying the score for each criterion. This section considers the development of metrics individually:
SGR/Condition
Reliability
Safety and Security
O&M Cost Impact
Riders Impacted
State of Good Repair/Condition RTA and the working group members quickly identified FT!’s decay curves as the preferred approach for assigning SGR criteria scores; FT!’s decay curves were considered to offer the following benefits:
Based on a 5 (like new / excellent) through 1 (poor) condition scale common to all asset types, so wide differences in asset useful life across asset types are addressed by a common scale
MULTI-CRITERIA INVESTMENT PRIORITIZATION PROCESS “HOW TO” GUIDE 4-3

CHAPTER 4 “HOW TO GUIDE TO” DEVELOP CRITERIA MEASURES
Available for all transit asset types
Decay curves predict condition as function of age for all assets and include asset utilization and other factors for some assets
Age and other required factors are already recorded in RT!’s asset database
Dynamic: decay curves allow the condition/SGR measure to be reevaluated continuously over every year of COST’s twenty-year model run as actual assessments of current condition today, will not work to assess replacement prioritization of a given asset 5, 10 or 15 years into the future, when the condition of that asset will have changed significantly
No need to conduct expensive on-site condition assessments for all transit assets
Decay curves reflect the actual decay experiences of US transit assets
Figure 4-2: FTA Decay Curves Allow COST to Continuously Update Condition Estimates via Dynamic Scoring
Adjustment to 1 to 5 Scale: !s noted above, FT!’s condition scale runs from 5 through 1 – hence higher values reflect better condition than lower values; Note, however, that RT!’s approach for prioritization scoring called for higher priority assets to attain the highest value of priority scores (hence, where asset reinvestment is concerned, lower condition assets should receive higher value scores). To address this issue, and strictly for the purpose for prioritization scoring, COST developers simply “inverted” the 5 to 1 FTA condition scale to a 1 to 5 score for use in COST’s prioritization (see Figure 4-3).
MULTI-CRITERIA INVESTMENT PRIORITIZATION PROCESS “HOW TO” GUIDE 4-4

CHAPTER 4 “HOW TO GUIDE TO” DEVELOP CRITERIA MEASURES
Figure 4-3: Inversion of FTA Condition Scale to Obtain Condition Scores
Reliability and Safety & Security A common approach was taken to developing prioritization scores for two criteria: reliability and safety & security. At the time of writing, O&M cost impacts are assigned a fixed score only, but the same methodology of mixed scoring for O&M costs is under development. For each of these criteria, the criteria score is a mix of a fixed and a dynamic component score as already outlined above (see Fixed Scoring vs. Dynamic Scoring):
Fixed Scoring by Asset Type: For each of these three criteria, each asset type was assigned a fixed score from 1 to 5 based on whether reinvestment in that asset type yield negligible (1) through measureable (5) impacts on the criterion in question. For example, for revenue vehicles RT! assigned a “5” for each of these three criteria as replacement of aging fleet vehicles can be expected to provide good returns on service reliability, reduced likelihood of safety problems, and reductions to maintenance costs. In contrast, replacement of aging bus shelters received “1”s for reliability and O&M cost impacts and a “2” for safety & security as it is not anticipated that these replacements provide much or any return with respect to these criteria. As a practical matter, these fixed criteria scores can be easily altered within RT!’s COST (see Figure 4-4 below).
Dynamic scoring component to capture Condition: In addition to fixed component of prioritization scoring based on asset type, scores for these three criteria are also driven by estimated asset condition. Specifically, it is assumed that as asset condition declines, the likelihood of safety issues tends to increase and O&M costs increase, while reliability declines. To capture this effect, the fixed scores are multiplied by each individual asset’s current condition
MULTI-CRITERIA INVESTMENT PRIORITIZATION PROCESS “HOW TO” GUIDE 4-5

CHAPTER 4 “HOW TO GUIDE TO” DEVELOP CRITERIA MEASURES
score to come up with a combined prioritization score that takes into account both asset type and asset condition (as depicted below in Figure 4-5).
Figure 4-4: Fixed Component of Reliability, Safety and Security and O&M Cost Impact Scores in COST
Current design allows user to set the fixed component of the
Reliability, Safety & Security, and O&M Cost criteria scores
by asset type (on a scale of 1 to 5)
Figure 4-5: Combining Fixed Asset Type and Dynamic Condition Scores for Full Reliability Score
Note from Figure 4-5 that under this combined fixed asset type scoring and condition-based dynamic scoring approach:
Scores Increase with Age: Reliability, Safety and Security and O&M impact scores continually rise as assets age, even after the asset attains and exceeds its expected useful life
Fixed Score is Ceiling Score: This increase in scoring cannot exceed the fixed score value
Developing the Fixed Scores: As with most other aspects of COST criteria development, the fixed scores described above and illustrated in Figure 4-4, were developed in workshop settings. Specifically, each Service Board developed their own, internal scoring for the full range of transit asset types owned and operated by their agency. The results of these Service Board specific scores were then presented and
MULTI-CRITERIA INVESTMENT PRIORITIZATION PROCESS “HOW TO” GUIDE 4-6

CHAPTER 4 “HOW TO GUIDE TO” DEVELOP CRITERIA MEASURES
discussed in a group meeting, including participants from each Service Board and RTA, leading to a group consensus on the region’s preferred fixed scoring values to be used by COST. Note that each Service Board has the flexibility to alter these asset type specific scores when using COST for internal analyses. When making these fixed score assignments, workshop participants were provided with the scoring guidance outlined below in Figure 4-6. Considerable care was taken to avoid over scoring of any individual asset types.
Figure 4-6: Fixed Scoring Guidance – Reliability
Fixed Score
5
4
3
2
1
Rating
Very High
High
Medium
Low
Very Low
Description
Reinvestment has a significant and measureable impact on reliability at the system-wide or mode-wide level
Reinvestment has a significant impact on reliability (intermediate between rating 3 and 5)
Reinvestment has material/measureable impact on reliability at the asset type level
Reinvestment has minor impact on reliability (intermediate between rating 1 and 3)
Reinvestment has little to no impact on reliability
Criteria Definition Summaries: The final definitions of reliability, Safety and security and O&M cost impacts are presented in Figure 4-7 below.
Figure 4-7: Summary Criteria Definitions: Reliability, Safety and Security, and O&M Cost Impacts
Safety & Security
Investment Criteria
Reliability
O&M Cost Impact increases revenues
Degree to which reinvestment contributes to improved safety (reduced injuries and fatalities) or improved security (reduced assaults, theft or vandalism)
Events are higher cost/lower probability
Definition
Degree to which reinvestment contributes to improved service reliability (i.e., reduced service failures)
Failure events are lower cost/higher probability
Degree to which reinvestment reduces operating and maintenance costs or
Riders Impacted “Riders impacted” is the last of the five investment criteria adopted by RT!; The riders impacted criterion is defined in terms of the share of passengers of a given mode that are impacted by a reinvestment activity. The greater the number of riders impacted by a reinvestment action, the higher the overall investment benefit.
A key challenge for this metric is the very wide range of riders served by different asset types. The magnitude of this range is evident in Figure 4-8. Based on this analysis, RTA opted for a logarithmic based scoring for the Riders Impacted criterion – also on a 1 to 5 scale.
MULTI-CRITERIA INVESTMENT PRIORITIZATION PROCESS “HOW TO” GUIDE 4-7

CHAPTER 4 “HOW TO GUIDE TO” DEVELOP CRITERIA MEASURES
Figure 4-8: Shares of Mode Riders Served by Asset Type
0.0%
0.1%
1.0%
10.0%
100.0%
Rail Line Division Station Vehicle
Pe
rce
nt
of T
ota
l Mo
de
Rid
ers
pe
r A
sse
t (L
oga
rith
mic
Sca
le)
Percent of Total RidersService Board Averages by Mode
CTA Rail
CTA Bus
Metra Rail
Pace Bus
Pace Demand Response
MULTI-CRITERIA INVESTMENT PRIORITIZATION PROCESS “HOW TO” GUIDE 4-8

CHAPTER 5 “HOW TO GUIDE TO” !GGREGATING CRITERIA INTO A SINGLE PRIORITIZATION SCORE
5. “How to” Guide to Aggregating Criteria into a Single Prioritization Score This chapter describes RT!’s approach to aggregating the scores for the individual investment criteria – including SGR, reliability, safety and security, O&M cost impact and riders impacted – into a combined, multi-criteria prioritization score. Specifically this chapter considers:
RT!’s !pproach to Criteria Score Aggregation
Selecting Criteria Weights
Sample Scoring Results
5.1 RTA’s Approach to Criteria Score Aggregation Having developed prioritization scores for each of the five investment criteria (including conversion of those scores to a common 1 to 5 scale), the RTA Criteria Workshop participants next considered options for grouping individual criterion scores into a single, overall prioritization score. A basic requirement for the aggregation process was to ensure that each criterion could receive its own weighting in the combined score, adjustable within COST, to reflect the relative importance of each criterion to RTA and the Service Boards.
After briefly considering a number of potential approaches to criteria aggregation, most of which involved sophisticated mathematical formulas, the RTA working group quickly settled on the simple weighted average approach outlined in Figure 5-1.
Figure 5-1: Criteria Scoring Aggregation
Asset Condition
Score: Declining condition yields
higher points score
Source: Condition assessment, FTA
Asset Decay Curves
Riders Impacted
Score: Number of riders impacted by
investment
Source: Service Board ridership
reports
Reliability
Score: Dynamic scoring based on
asset type & condition
Source: Assigned by asset type
Safety
Score: Dynamic scoring based on
asset type & condition
Source: Assigned by asset type
O&M Cost Impact
Score: Assigned based on O&M cost savings per dollar
invested
Source: Assigned by asset type
Weighted Average Total Investment Score: 100 Points maximum
20% 20% 20% 20% 20%
Individual Criteria Scores
Criteria Weights
(Illustrative)
Final Score
This choice offered the following benefits:
Easy to calculate
Easy to explain
Easy to understand.
Note that even with a relatively limited set of five investment criteria, the outcomes of different prioritization scores can be difficult to understand if embedded in complex (or even multiplicative based) aggregation formulas. Use of the simple weighted average approach ensured that scoring outcomes – including those resulting from adjustments to scoring weights – can be easily understood and explained.
Base 100 Scores: While the individual investments criteria scores are all based on a 1 to 5 scale, RTA made the decision to convert the weighted average score to a 100 point scale. The reason for this was simple: a 100 point scale makes it easier to visually compare differences in the overall prioritization
MULTI-CRITERIA INVESTMENT PRIORITIZATION PROCESS “HOW TO” GUIDE 5-1

CHAPTER 5 “HOW TO GUIDE TO” !GGREGATING CRITERIA INTO A SINGLE PRIORITIZATION SCORE
scores of assets. The process used to combine the individual criteria scores into a total, base 100 score is presented below and consists of the following steps:
1. Multiply each criteria score by its criteria weight (selection of weights discussed below) 2. Multiply the product from step 1 by 20 – to convert from base 5 to base 100 3. Sum across all criteria.
Figure 5-2: Conversion of Individual Criteria Scores to Combined, Base 100 Prioritization Score
Criteria Score (1 to 5)
Criteria Weight
Convert to Base 100
Base 100 Score
SGR / Condition 3.75 x 20% x 20 = 15.00
Reliability 2.62 x 20% x 20 = 10.48
Safety 3.11 x 20% x 20 = 12.44
Riders Impacted 4 x 20% x 20 = 16.00
O&M Cost Impact 1 x 20% x 20 = 4.00
Total 100% = 57.92
User input
5.2 Selecting Criteria Weights Establishing criteria weights is, in many respects, one of most challenging aspects of developing any prioritization process. This is particularly true for any prioritization processes driven by a mathematical investment selection process, as is the case with the RTA’s COST. The key sources of these challenges are:
Investment selections can be sensitive to criteria weights: While minor changes to weights will not yield significant differences in investment selections, more significant weighting adjustments can lead to very different investment rankings across the same group of assets. These differences have repercussions not just in the short-term, but also in the long-term – as different prioritization weightings can have a significant impact on both the composition and even the size of the SGR backlog.
To represent policy, prioritization weightings should have “official recognition”: The challenge here is that senior agency staff and Board members may have firm ideas on what the agency’s reinvestment policies (and hence priority weightings) should be – “safety is always the highest priority” – but may not be fully aware of the actual investment outcomes the prioritization process will generate when those weights are based on an a priori concept of “what’s most important”; For example, placing too high a weight on safety may lead to a very safe but not terribly reliable or efficient system.
Based on these two observations, prioritization weights for these types of mathematically based prioritization process should be developed through a trial and error process – where weights are adjusted to attain a preferred mix of investment outcomes (e.g., a tolerable mix of asset types in the
MULTI-CRITERIA INVESTMENT PRIORITIZATION PROCESS “HOW TO” GUIDE 5-2

CHAPTER 5 “HOW TO GUIDE TO” !GGREGATING CRITERIA INTO A SINGLE PRIORITIZATION SCORE
future SGR backlog); The mix should represent the agency’s key policy directives but perhaps not interpret those directives so literally or restrictively that the analysis tool generates outcomes that are counter to what is truly preferred.
How did RTA Develop the Initial Prioritization Weights?: The prioritization weights currently used by RTA were established based on technical analysis of how changes to prioritization weights leads to different mixes of investment outcomes. Specifically, RT!’s initial prioritization weights were developed using the following three-step process:
1. Unconstrained Needs by Asset Type: !ssess the region’s total, unconstrained twenty-year needs by asset type (using RTA’s COST). This is the total, financially unconstrained level of investment required to attain and maintain SGR for all asset types.
2. Constrained and Prioritized Needs: Run COST multiple times with a constrained funding amount where each run:
a. Uses the RT!’s historical rate of reinvestment (on the order of $600 million annually) b. Uses a different set of prioritization weights
3. Compare Outcomes and Select Preferred Weighting: Determine the proportion of each asset type’s unconstrained needs (from 1) that were addressed by each run from step 2. As recent regional funding levels are not sufficient to address all reinvestment needs, some asset types will fare better (and others worse) under alternative prioritization weightings. The preferred weighting, then, is the one that addresses the most desirable mix of outstanding needs.
In practice, step 3 can lead to very hard choices as for many transit agencies there is not sufficient funding capacity to address all outstanding needs – implying that while the SGR investment backlog may decline for some asset types it must inevitably increase for others. The preferred mix then (provided by the preferred criteria weighting), thus generates a “best of all possible worlds” but not necessarily a perfect or even desirable investment outcome (sometimes referred to as the “least undesirable outcome”).
But which asset types should prioritization favor? And is it possible to assign priority weights such that while the backlogs for some assets may be projected to increase, those asset types still receive some reinvestment funding?
RTA first chose nine different approaches to test for weighting, shown in Figure 5-3. These ranged from equal weightings on each criterion to weightings that placed high emphasis on one individual criterion. Analyses of these initial weightings then led to tests of more mixed and “hybrid” criteria weightings – with the investment characteristics of each weighting being thoroughly evaluated.
MULTI-CRITERIA INVESTMENT PRIORITIZATION PROCESS “HOW TO” GUIDE 5-3

CHAPTER 5 “HOW TO GUIDE TO” !GGREGATING CRITERIA INTO A SINGLE PRIORITIZATION SCORE
Figure 5-3: Criteria Weightings Tested
Scenario Equal Weights
Worst First
SGRFirst
ReliabilityFirst
Safety First
RidersFirst
O&M CostFirst
SGR and Riders
SGR Focus + Riders
Condition 20% 100% 60% 10% 10% 10% 10% 35% 45%
Reliability 20% 0% 10% 60% 10% 10% 10% 10% 10%
Safety / Security 20% 0% 10% 10% 60% 10% 10% 10% 10%
Riders Impacted 20% 0% 10% 10% 10% 60% 10% 35% 25%
Cost Impact 20% 0% 10% 10% 10% 10% 60% 10% 10%
The investment outcomes generated by a sample of these weightings is presented in Figure 5-4 (step 3 from above). Specifically, Figure 5-4 shows the proportion of unconstrained needs addressed under each alternative criteria weighting. Note here that each mix of criteria generates a different distribution of addressed needs – with different weightings favoring different asset types. The first option tested was equal weights for each criterion which, upon review, was considered undesirable as this option left some asset type needs fully unaddressed. The “Riders First” weightings suffered the same issue.
In contrast, the “Worst First” option – which placed a 100% weight on asset condition and zero weights on all other criteria – was believed to reinvest too heavily in assets that do not directly support rider services, thus reducing available reinvestment dollars for key assets required to support service reliability, safety and efficiency; In the end, the “SGR First” option was found to offer a good mix between these initial options; Specifically, “SGR First” placed a high weight on investments that improved asset condition, and ensured that all asset types obtained at least some reinvestment funding. It also recognized that some asset types are more critical to service reliability, safety, efficiency and high ridership corridors (such that these asset types were generally more favored by reinvestment).
Note once again that the preferred weights identified by this process were solely the result of a technical analysis of how changes to criteria weights yield investment outcomes with differing characteristics. Hence, while the current weights represent reasonable mixes of standard criteria they do not represent an adopted or approved policy. At the same time, the analysis in Figure 5-4 also makes it clear that any process that assigns priority weights solely on the basis of a priori opinions of what’s important – without reference to the expected outcomes – may not yield the best possible outcome. Rather, there is significant value to assessing the outcome resulting from a range of potential priority policies, and then adopting the policy most likely to yield the most desirable investment outcome.
MULTI-CRITERIA INVESTMENT PRIORITIZATION PROCESS “HOW TO” GUIDE 5-4

0% 20% 40% 60% 80% 100%
Vehicles: Rail
Vehicles: Bus
Vehicles: Agency
Systems: Rail
Systems: Bus
Systems: Agency
Stations: Rail
Guideway: Rail
Facilities: Rail
Facilities: Bus
Equal Weights
0% 20% 40% 60% 80% 100%
Vehicles: Rail
Vehicles: Bus
Vehicles: Agency
Systems: Rail
Systems: Bus
Systems: Agency
Stations: Rail
Guideway: Rail
Facilities: Rail
Facilities: Bus
Worst First
0% 20% 40% 60% 80% 100%
Vehicles: Rail
Vehicles: Bus
Vehicles: Agency
Systems: Rail
Systems: Bus
Systems: Agency
Stations: Rail
Guideway: Rail
Facilities: Rail
Facilities: Bus
SGR First
0% 20% 40% 60% 80% 100%
Vehicles: Rail
Vehicles: Bus
Vehicles: Agency
Systems: Rail
Systems: Bus
Systems: Agency
Stations: Rail
Guideway: Rail
Facilities: Rail
Facilities: Bus
Riders First
0% 20% 40% 60% 80% 100%
Vehicles: Rail
Vehicles: Bus
Vehicles: Agency
Systems: Rail
Systems: Bus
Systems: Agency
Stations: Rail
Guideway: Rail
Facilities: Rail
Facilities: Bus
SGR and Riders First
0% 20% 40% 60% 80% 100%
Vehicles: Rail
Vehicles: Bus
Vehicles: Agency
Systems: Rail
Systems: Bus
Systems: Agency
Stations: Rail
Guideway: Rail
Facilities: Rail
Facilities: Bus
SGR Focus, Plus Riders
CHAPTER 5 “HOW TO GUIDE TO” !GGREGATING CRITERIA INTO A SINGLE PRIORITIZATION SCORE
Figure 5-4: Percent of Unconstrained Needs Addressed Under Alternative Criteria Weightings
5.3 Sample Scoring Results The analysis above provides a sense of the investment outcomes from differing prioritization criteria weightings but not of the actual prioritization scores themselves. To help provide a better sense of the scoring outcomes, Figures 5-5 through 5-8 present average prioritization scores by asset type for RT!’s regional transit assets, as of the end of 2011—with each figure using one of the alternative criteria weighting options. It is important to emphasize that these are average prioritization values and hence represent the mean values for a range of individual prioritization scores. Asset types are presented in the same order in each figure to facilitate comparisons between each of the criteria weighting options.
Comparison of these four charts highlights the impact of altering the criteria weights on the prioritization scoring for each asset type. Alternatively, the charts help develop an understanding of how some asset types provide a greater contribution to some types of investment benefits than others (as determined of course by the scoring process developed in Chapter 4).
MULTI-CRITERIA INVESTMENT PRIORITIZATION PROCESS “HOW TO” GUIDE 5-5

CHAPTER 5 “HOW TO GUIDE TO” !GGREGATING CRITERIA INTO A SINGLE PRIORITIZATION SCORE
Figure 5-5: Average Prioritization Scores by Asset Type – Equal Weighting
Figure 5-6: Average Prioritization Scores by Asset Type – Worst First
MULTI-CRITERIA INVESTMENT PRIORITIZATION PROCESS “HOW TO” GUIDE 5-6

CHAPTER 5 “HOW TO GUIDE TO” !GGREGATING CRITERIA INTO A SINGLE PRIORITIZATION SCORE
Figure 5-7: Average Prioritization Scores by Asset Type – SGR First
Figure 5-8: Average Prioritization Scores by Asset Type – Safety First
MULTI-CRITERIA INVESTMENT PRIORITIZATION PROCESS “HOW TO” GUIDE 5-7

CHAPTER 6 OTHER ISSUES
6. Other Issues 6.1 RTA Applications of COST’s Prioritization Routine One of RT!’s primary interests in developing COST was to be able to use the Tool’s prioritization capability take an independent look at the capital budget proposals developed by the region’s Service Boards. Specifically, the tool could help to both (1) assure that the projects in the proposed capital budgets addressed the mix of preferred investment priorities and (2) Service Boards could also use the Tool as one source of input to help identify what they should include in their capital budgets.
A conceptual overview of the approach to comparing budget proposals with COST’s prioritization of needs is presented below in Figure 6-1. In general, the steps used to compare budget proposals with �OST’s prioritized needs are to:
1. Group budget proposal investment amounts by asset category 2. Run COST constrained using the same total budget amount as is assumed in the regional
investment budgets – then group the Tool’s resulting prioritized needs into the same five asset categories
3. Given the same total budget amount, compare the allocation of budget amounts by asset categories as specified in the budget proposals with that determined by COST’s prioritization process. How closely aligned are the budgeted and Tool prioritized needs?
4. Understand and address differences between the budget proposal and COST allocations. Did COST identify any specific needs not included in the budget proposals? Alternatively, were there needs the Tool was not aware of but should have been (implying the need for a Tool or data improvement).
Figure 6-1: General Approach to Budget Proposal and COST Prioritization Comparisons
Tool Allocations (Based on proposed budget total, but tool allocation by category)
Guideway and Trackwork Facilities Systems Stations Vehicles Total
Budget Proposals ($ amounts by asset category)
Guideway and Trackwork Facilities Systems Stations Vehicles Total
=Total $ amounts are equal(but distributions are different)
MULTI-CRITERIA INVESTMENT PRIORITIZATION PROCESS “HOW TO” GUIDE 6-1

CHAPTER 6 OTHER ISSUES
Finally, Figure 6-2 below presents an example comparison of the budget proposal and COST prioritization allocations by asset type.
Figure 6-2: Illustrative Comparison of Budget Proposal and COST Prioritization Allocations
6.2 Compatibility with TERM Lite Another primary RTA objective in developing COST and its prioritization routine was to support the industry as a whole in advancing these approaches. Publication of this Guide represents one aspect of that intended industry support. Another was to also help support TERM Lite development. RTA’s COST was developed using the TERM and TERM Lite models as a starting point. Hence:
The mechanisms and analyses used by the prioritization were built off the analytical capabilities pre-existing in TERM and
The prioritization routine currently embedded in TERM Lite represents an adopted and slightly modified version of RTA’s COST prioritization routine
Hence, the prioritization routines developed by RTA for its COST have largely been embedded in TERM Lite.
MULTI-CRITERIA INVESTMENT PRIORITIZATION PROCESS “HOW TO” GUIDE 6-2

APPENDIX A: GLOSSARY AND ABBREVIATIONS
Appendix A: Glossary and Abbreviations
Prioritization: For this Guide, prioritization is the process of identifying a preferred or optimal order in which reinvestment events should occur. Implicit in this statement is the assumption that:
o Funding is insufficient to address all needs. Hence prioritization is required to determine which assets should be addressed first (and which assets have needs that may not be addressed).
o Investment needs can be ranked. In other words, there are good analytic or other bases on which to ranked investment needs – from highest to lowest—to determine in which outstanding needs are most effectively addressed (and potentially leaving some needs unaddressed).
Prioritization Criteria: Prioritization criteria provide the basis for determining the priority of individual investments. In general, investments are made with the expectation that the completed investment will yield improvements to one or more aspects of agency operations (e.g., improvements to reliability, efficiency, safety, rider comfort or other characteristic). Within a prioritization routine, the most desirable or important of these types of investment outcomes are referred to as “investment criteria”; Investments that perform best with respect to these criteria (i.e., tend to be provide the best mix of desired outcomes) are assigned the highest priority. Investments that perform poorly may receive a low priority ranking.
Prioritization Criteria Scores: From the viewpoint of this Guide (and RT!’s COST), prioritization criteria should be quantifiable so investments can be assigned a numeric score reflecting their potential contribution to the desired outcome associated with that criterion (e.g., contribution to SGR). Note that numeric criteria scores facilitate objective comparisons between investment options. Given that different criteria may naturally be associated with specific unit quantities (e.g., condition rating for SGR and dollar values for impacts to operating costs), these score need to be converted to a common basis if the intention is to generate a multi-criteria prioritization score.
Multi-Criteria Investment Prioritization (criteria weighting): Multi-criteria investment prioritization refers to the process of evaluating and prioritizing investment options based on each investment’s performance against a mix of multiple investment criteria; In the context of this Guide and RT!’s COST, multi-criteria investment prioritization implies the (1) all criteria are individual scored on a common scale (e.g., running from 1 to 5) and (2) these criteria scores are combined into a weighted average score, with the weight placed on each criterion reflecting the relative importance of that criterion.
The following definitions for State of Good Repair (SGR) separate the asset level from aggregate level.
Asset Level SGR: An asset is in a state of good repair (SGR) if (i) its age does not exceed its expected useful life and (ii) all rehabilitation and annual capital maintenance activities are up to date. Under these circumstances, an asset has no deferred capital reinvestment needs and, by definition, has an estimated condition score of 2.5 or higher (RTA/TERM Lite decay curves are defined such that assets attain their useful life and a condition score of 2.5 concurrently). If an asset has undergone a major life extending rehabilitation, it can exceed its expected useful life and still be in SGR. Non-attainment of SGR does not imply an asset is unfit for service or unsafe
MULTI-CRITERIA INVESTMENT PRIORITIZATION PROCESS “HOW TO” GUIDE A-1

APPENDIX A: GLOSSARY AND ABBREVIATIONS
but it may increase the likelihood of sub-optimal performance (i.e. reliability and availability performance may decrease).
Mode, Service Board, or Regional Level (Aggregate) SGR: A transit mode, Service Board or the region is considered to be in SGR if each of its component assets is in SGR (as defined above). Mode, Service Board and regional level SGR represents an ideal state and is not attainable in practice as (i) rehabilitation and replacement needs arise continuously and (ii) mode, Service Board and regional level budgets are generally insufficient to meet these continuous needs. As such, a more realistic view of SGR at an aggregate level is based on the region’s target/tolerance for achieving reinvestment goals – such as halving the current SGR backlog over a certain timeframe or not allowing the SGR backlog to grow beyond current levels.
Reinvestment in existing assets versus Investment in New Expansion or Enhancement Assets: COST is designed to assess and prioritize investment needs for both existing and expansion assets. In general, these investment types fall into the following categories:
o Reinvestment in Existing Assets: Refers to rehabilitation and replacement or SGR investments in assets that are currently in service
o Investment in expansion assets: Refers to the planned/proposed future purchase of new assets that either: (i) expand existing service capacity (e.g., fleet expansion), (ii) adds a new service (e.g., New Starts) or (iii) enhances existing service (e.g., new technologies such as real-time arrival information).
The prioritization criteria discussed in this Guide generally refer to reinvestment choices, as the capability to prioritize new acquisitions, or expansion assets, is being developed in COST.
MULTI-CRITERIA INVESTMENT PRIORITIZATION PROCESS “HOW TO” GUIDE A-2

APPENDIX A: GLOSSARY AND ABBREVIATIONS
MULTI-CRITERIA INVESTMENT PRIORITIZATION PROCESS “HOW TO” GUIDE A-3

APPENDIX A: GLOSSARY AND ABBREVIATIONS
RTA
CAPITAL PLAN DEVELOPMENT PROCESS
CRITERIA GLOSSARY
Note: All criteria are not necessarily applicable to all projects.
SCREEN – The process of using criteria to sort proposed capital projects into the MBC categories of Maintain/Enhance/Expand.
CAPACITY IMPROVEMENT – Addition of another dimension or improvement to existing capacity.
CONGESTION RELIEF – Alleviation or elimination of traffic congestion in measureable terms, most notably through the impact of getting people to switch from automobiles to public transportation.
NEW TECHNOLOGIES – Implementation of specific technologies that improve operations and/or service, which is also distinct from implementation of technological advances as part of maintenance or replacement of existing assets.
OPERATIONAL EFFICIENCIES – Modifications, improvements, and/or repairs of existing infrastructure as well as additions of new infrastructure that results in operational savings.
REGULATORY – Modifications, improvements, and/or repairs of existing infrastructure as well as additions of new infrastructure that is necessary to address legal requirements such as those imposed by Federal Railroad Administration (FRA), Americans with Disabilities Act (ADA), etc.
SAFETY & SECURITY – Changes, improvements, and/or repairs of existing infrastructure as well as additions of new infrastructure that is necessary to address the safety and security of people and property.
SOGR – State of Good Repair. Regular replacement, rehabilitation and maintenance based on the life cycle of the infrastructure asset.
TRANSIT ALTERNATIVES – Additions to the current transit system that provide for mobility options.
PRIORITIZE –The process that utilizes criteria to organize proposed capital projects by level of importance.
MISSION CRITICAL – Projects which are required based on safety, regulatory, and state of good repair conditions for continued operations.
COST/BENEFIT ANALYSIS – The application of various tests that compare the quantification of the costs to benefits of proposed capital projects and include business principles such as Net Present Value and Life-Cycle Costing.
CUSTOMER IMPACT – An outcome that directly affects the rider and/or their behavior.
ENVIRONMENTAL IMPACTS - Outcomes that affect the broader sense of environment including environmental justice as well as air quality.
RIDERSHIP GAIN – A measurable increase in ridership.
TOD – Transit Oriented Development. Development that occurs near transit facilities, particularly rail, which encourages the use of public transportation through characteristics such as density and mixed use.
PROGRAM – The process that utilizes criteria to organize proposed capital projects by factors that determine practicability.
COMMUNITY INPUT – Participation from stakeholders, including public officials, citizens, and special interest groups, that takes place through the public hearing process or other forums to provide observations, comments and recommendations.
PROJECT READINESS – The stage in which a project is currently in with regards to plans, schedule, manpower or other resources that would allow for its immediate implementation.
COMMITMENTS TO ONGOING PROJECTS - Projects that are currently underway in some capacity, but need additional resources for completion.
RESTRICTED FUNDING – Funding, such as earmarks or designations that can only be used for a specific project or type of project.
MULTI-CRITERIA INVESTMENT PRIORITIZATION PROCESS “HOW TO” GUIDE A-4

Volume 2, Part 3:
RTA Asset-to-Project Mapping “How To” Guide
Pilot Product #3: Asset-to-Capital Project Numbering Convention
Prepared for
Regional Transportation Authority of Northeastern Illinois
September 2013

RT! Decision Tool “How To Guide” 3/8/13 Regional Transportation Authority 2

Table of Contents
1. Introduction .......................................................................................................................1-1 1.1 FTA TAM Grant.................................................................................................................1-1 1.2 Overview – Asset-to-Project Mapping.............................................................................1-1 1.3 Define Terms....................................................................................................................1-3
2. Approach to Asset-to-Project Mapping................................................................................2-1 2.1 Approach to Asset-to-Project Mapping ...........................................................................2-1 2.2 Types of Mappings...........................................................................................................2-3 2.3 Calibration and Recalibration ..........................................................................................2-8 2.4 Asset-to-Project Mapping Output: Reports ..................................................................2-11 2.5 Mapping Data Requirements.........................................................................................2-13
3. “How to” Guide to Prioritize Mapped Projects .....................................................................3-1 3.1 Asset-Level Prioritization Scores......................................................................................3-1 3.2 Aggregation of Asset Prioritization Scores (RTA Approach) ............................................3-2 3.3 Project Scoring .................................................................................................................3-3
4. “How to” Guide to !pply Project Mapping Results ...............................................................4-1 4.1 RTA Budget Support: Independent Validation of Proposed Investments .......................4-1 4.2 Direct Project Identification.............................................................................................4-1
Appendix A: Glossary and Abbreviations.................................................................................... A-1
ASSET-TO-PROJE�T M!PPING “HOW TO” GUIDE i

ASSET-TO-PROJE�T M!PPING “HOW TO” GUIDE ii

CHAPTER 1 INTRODUCTION
1. Introduction 1.1 FTA TAM Grant In 2011, the Regional Transportation Authority of Northeastern Illinois (RTA) received an $800,000 Transit Asset Management (TAM) Pilot Project grant from the Federal Transit Administration (FTA). This pilot project includes TAM improvements that build on existing RTA TAM processes already in progress, namely the Capital Asset Condition Assessment, Capital Decision Prioritization Support Tool (now called the Capital Optimization Support Tool, COST), and management approaches already in use. The objectives of RT!’s T!M grant include:
Document RT!’s existing policies; goals and objectives; performance targets and evaluation processes; and inventory/condition data collection, management, and reporting processes such that other local and regional operators can benefit from RT!’s experience;
Advance the T!M “state-of-the-art” capabilities in the areas of estimated capital reinvestment needs and investment prioritization; and
Develop asset-to-project groupings using the analytical foundation provided by RT!’s existing project screening and prioritization process and FT!’s Transit Economic Requirements Model (TERM) model as a foundation for tool development.
The TAM Pilot Project is an 18 month process for RTA, which is documented in two volumes and the four work papers:
Volume 1: Asset Inventory and Condition Assessment Guide
Volume 2: Part 1 – RT! �OST Model “How To” Guide, Pilot Product #4: �apital Prioritization Decision Support Tool
Volume 2: Part 2 – Multi-�riteria Investment Prioritization Process “How To” Guide, Pilot Product #2: Multi-Criteria Investment Prioritization Process
Volume 2: Part 3 – !sset to Project Mapping “How To” Guide, Pilot Product #3: !sset-to-Capital Project Numbering Convention.
This document presents the third “how to” guide on development and application of processes to bundle asset level data into potential investment projects. This document is intended to be helpful to other operators or funding agencies developing and applying similar asset to project mapping processes.
1.2 Overview – Asset-to-Project Mapping In 2008 RTA and its three Service Boards – the Chicago Transit Authority (CTA), Metra and Pace – initiated development of a comprehensive regional transit asset inventory. The inventory was subsequently updated in 2011 and annually since then. This inventory was developed for the purpose of assessing long-term capital reinvestment needs for all transit assets serving metropolitan Chicago and its suburbs. Since that time, RTA has institutionalized this process – and now conducts an annual update of both the regional asset inventory data and the assessment of reinvestment needs, which relies on that data. Moreover, RTA and the Service Boards have also jointly developed COST, which provides the ability to analyze and prioritize capital reinvestment needs using data from the regional transit asset inventory.
ASSET-TO-PROJE�T M!PPING “HOW TO” GUIDE 1-1

CHAPTER 1 INTRODUCTION
Projects vs. Assets: Prior to the asset-to-project mapping initiative, all regional needs analyses were performed on an “asset level” basis; In other words, all prior analyses determined regional investment needs by (1) independently assessing the 20-year reinvestment needs of individual transit assets (e.g., the timing and cost of rehab and replacement actions for each individual station, track segment, etc.) and then (2) summing these individual asset needs to the asset type, Service Board and finally regional levels. While this process provides a reasonable assessment of total, long-term reinvestment needs it provides only a gross approximation of actual reinvestment practices. Specifically, rather than planning for the reinvestment needs of individual assets, the region’s Service �oards more typically group related asset needs into reinvestment projects. The Service Boards then focus on the planning, prioritization, programming and eventual execution of these projects – which typically address the coincident reinvestment needs of multiple related assets. Examples here would be the replacement of related components of a maintenance facility (e.g., coordinated replacement of a roof and HVAC equipment housed on the roof) or the upgrade of multiple components of a rail segment (e.g., rail, ties, drainage and perhaps traction power components and even civil structures).
Objective and Approach: The object of the asset-to-project mapping initiative is to develop analytic approaches to grouping reinvestment needs for related assets into “investment bundles” that more closely resemble the types of projects that the Service Boards actually plan. Note that the intent here is not to develop actual reinvestment projects based on the asset level data housed in the asset inventory. Rather, the intent is to group related asset level reinvestment needs, as identified by RT!’s COST, such that these related needs are easily recognized (and prioritized). These related needs can then help support the identification, development and prioritization of actual reinvestment projects. Hence, rather than identifying projects, the asset-to-project mapping can be more accurately described as identifying “patterns of related asset reinvestment needs.”
To be considered “related”, asset reinvestment needs:
Must be roughly coincident (needs occur over roughly the same time period)
Must offer potential cost efficiency from being bundled together (i.e. simultaneous replacement of assets located on a shut-down rail segment)
May be (but do not have to be) located in the same geographic area or facility.
The actual strategies used to identify related needs are discussed in greater detail in subsequent chapters.
Challenges: The ability to identify and group assets into meaningful representations of projects is ultimately limited by the level of asset detail. Consider the example of maintenance facilities. In the real world, a transit agency might reasonably group coincident roof replacement needs for several agency buildings; However, doing so would require that the region’s asset inventory maintain asset data at the facility roof level of detail. At present this is not the case, though there are future expectations to attain this level of detail. Hence while grouping roof reinvestment needs at multiple sites into a single reinvestment project may offer potential investment efficiencies (planning, contracting, etc.), the current level of asset detail is not sufficient to support identification of coincident roofing needs as a potential project in COST.
Asset-to-Project Mapping and RT!’s COST: The Asset-to-project mapping process is being developed as a sub-routine to RT!’s COST. Specifically, COST is designed to assess the long-term (20-year) reinvestment needs of all individual assets identified in the region’s asset inventory, including both
ASSET-TO-PROJE�T M!PPING “HOW TO” GUIDE 1-2

CHAPTER 1 INTRODUCTION
deferred “state of good repair” (SGR) reinvestment needs as well as future SGR reinvestment needs. COST also prioritizes each of these individual asset reinvestment needs based on a set of five investment criteria:
1. Asset condition 2. Number of riders impacted 3. The investment’s contribution to service reliability 4. The investment’s contribution to safety and security 5. The investment’s contribution to O&M cost savings.
Following the completion of these analyses, COST then runs the asset-to-project mapping sub-routine to:
Group the needs for related assets into projects (as described in subsequent chapters)
Prioritize each project (based on a weighted average prioritization score of the project’s individual asset components).
A detailed description of COST and its capabilities is provided in a separate “How-to” guide; For the purpose of this overview, RT!’s COST is an MS Access based analysis model (based on FT!’s TERM Lite Model) designed to perform the following analyses for RTA and its three Service Boards:
1. Assess current size of SGR backlog. 2. Assess (estimate) current asset conditions. 3. Conduct assessment of 20-year unconstrained capital reinvestment needs. 4. Assess the impact of constrained reinvestment on:
a. SGR backlog b. Asset Conditions c. Proportion of assets in SGR
5. Prioritize reinvestment (rehab and replacement) needs based on the five investment criteria listed above. Includes the prioritization of reinvestment needs for expansion assets assumed to be acquired during the period of analysis.
6. Prioritize investment in expansion/enhancement assets (as proposed by RTA and its Service Boards) based on investment cost per rider impacted.
7. Assess the impact of expansion/enhancement investments on: a. SGR backlog b. Asset Conditions c. Proportion of assets in SGR
Document Overview: This Guide covers each of the following: Chapter 2: Approach to Asset-to-Project Mapping Chapter 3: Prioritization of Mapped Projects Chapter 4: Application of Mapping Results
1.3 Define Terms Following are definitions of key terms as used by this Guide:
Needs Analysis: In the context of COST, needs analysis refers to the process of determining the level of investment required to attain specific investment objectives and also with how those investment dollars are allocated to different uses (e.g., between various asset types). In general, needs analysis falls into two broad categories:
ASSET-TO-PROJE�T M!PPING “HOW TO” GUIDE 1-3

CHAPTER 1 INTRODUCTION
o Unconstrained needs: The level of investment required to address all outstanding and future needs, irrespective of actual or expected funding availability
o Constrained Needs: As the name suggests, under constrained needs analysis, there is insufficient funding to address all needs. This analysis shows the level of investment required to attain more realistic investment objectives (e.g., maintain the size of the current investment backlog, or eliminate the backlog over 20 years).
Reinvestment in Existing Assets (SGR) vs. Investment in New Expansion or Enhancement Assets: COST is designed to assess and prioritize investment needs for both existing and expansion assets. In general, these investment types fall into the following categories:
o Reinvestment in Existing Assets: Refers to SGR (i.e., rehab and replace) investments in assets that are currently in service (i.e., existing assets).
o Investment in expansion assets: Refers to the planned/proposed future purchase of new assets that either: (i) expand existing service capacity (e.g., fleet expansion), (ii) adds a new service (e.g., New Starts) or (iii) enhance existing service (e.g., new technologies such as real-time arrival information).
Scenario Analysis: In the context of COST, scenario analysis refers to the process of identifying specific investment objectives and then assessing the investment needs associated with attaining that scenario. Examples include:
o Maintain historic funding levels o Maintain the current backlog o Eliminate the backlog over a set time period (e.g., 20 years)
Prioritization: For this guide, prioritization is the process of identifying a preferred or optimal order for reinvestment events. Implicit in this statement is the assumption that:
o Funding is insufficient to address all needs. Hence prioritization is required to determine which assets should be addressed first (and which assets have needs that may not be addressed).
o Investment needs can be ranked. In other words, there are good analytic or other bases on which to rank investment needs – from highest to lowest—to determine in which outstanding needs are most effectively addressed (and potentially leaving some needs unaddressed).
Asset Condition and Decay: Asset condition refers here to the estimated physical condition of a transit asset. Specifically, COST includes a set of embedded asset decay curves that predict the current and future physical condition of a transit asset based on its type, age and other factors (e.g. , use and maintenance history). COST uses these condition relationships to prioritize reinvestment needs (in part) based each asset’s predicted physical condition (both currently and in the future). COST also uses these same asset decay curves to generate current and future distributions of asset conditions.
The following definitions for State of Good Repair (SGR) separate the asset level from aggregate level.
Asset Level SGR: An asset is in a state of good repair (SGR) if (i) its age does not exceed its expected useful life and (ii) all rehabilitation and annual capital maintenance activities are up to date. Under these circumstances, an asset has no deferred capital reinvestment needs and, by definition, has an estimated condition score of 2.5 or higher (RTA/TERM Lite decay curves are defined such that assets attain their useful life and a condition score of 2.5 concurrently). If an
ASSET-TO-PROJE�T M!PPING “HOW TO” GUIDE 1-4

CHAPTER 1 INTRODUCTION
asset has undergone a major life extending rehabilitation, it can exceed its expected useful life and still be in SGR. Non-attainment of SGR does not imply an asset is unfit for service or unsafe but it may increase the likelihood of sub-optimal performance (i.e. reliability and availability performance may decrease).
Mode, Service Board, or Regional Level (Aggregate) SGR: A transit mode, Service Board or the region is considered to be in SGR if each of its component assets is in SGR (as defined above). Mode, Service Board and regional level SGR represents an ideal state and is not attainable in practice as (i) rehabilitation and replacement needs arise continuously and (ii) mode, Service Board and regional level budgets are generally insufficient to meet these continuous needs. As such, a more realistic view of SGR at an aggregate level is based on the region’s target/tolerance for achieving reinvestment goals – such as halving the current SGR backlog over a certain timeframe or not allowing the SGR backlog to grow beyond current levels.
ASSET-TO-PROJE�T M!PPING “HOW TO” GUIDE 1-5

Preliminary Screen
Required Life-Cycle Event (i.e., rehab / replace)?
Service Board Assets
Assets
Prioritization
Asset Condition Reliability Safety Rider Impacts O&M Cost Impacts
FundedNeeds
Program
Restricted Funding Commitment to
Ongoing Projects
Prioritized Needs
Assets Not in SGR
Projects
Group into Projects
By Location By Asset Type
Assets Projects
CHAPTER 2 DEVELOPING AN ASSET-TO-PROJECT MAPPING
2. Approach to Asset-to-Project Mapping This chapter describes each of the following:
Asset-to-project mapping methodology
Types of Mappings o Asset type based mappings o Location based mappings o Time based mappings (coincident needs)
Implementation and recalibration Asset to Project Mapping Reports Data requirements
2.1 Approach to Asset-to-Project Mapping As described in Chapter 1, the asset-to-project mapping process is designed to take the prioritized reinvestment needs for individual transit assets (as identified by RT!’s COST) and combine those needs into logical groupings that more closely resemble the actual reinvestment “projects” carried out by the region’s Service �oards. Once again, the intent is not to identify actual reinvestment projects but rather to identify “patterns of related asset investment needs” that the Service �oards can then use to help identify and prioritize actual reinvestment projects.
The relationship between �OST’s assessment of asset level reinvestment needs and the eventual mapping of those asset-level needs into potential investment projects is presented conceptually in Figure 2-1; Here, RT!’s COST first identifies those assets that require SGR investment actions (e.g., rehabilitation or replacement). The Tool then prioritizes those needs and, if funding is constrained, determines which needs are funded. The role of the asset-to-project mapping sub-routine then is to group the funded needs into potential (and logical) reinvestment projects.
Figure 2-1: Asset-to-Project Mapping – Combines Asset Level Needs into Investment Projects
ASSET-TO-PROJE�T M!PPING “HOW TO” GUIDE 2-1

CHAPTER 2 DEVELOPING AN ASSET-TO-PROJECT MAPPING
Project Mapping Guiding Principles: Prior to initiating development of asset-to-project mapping, RTA, the Service Boards and the CH2M HILL consultant team identified the following three guiding principles for methodology development:
I. Keep it Simple: • RT!’s COST already provides many types of analyses • Guiding principle was to make mapping “user friendly”
II. Ensure Asset-to-Project Mappings are: • Realistic/meaningful: mappings should represent logical groupings of assets types and
as much as possible reflect actual Service Board projects • Yield helpful insight to Service Boards: Mapping output should help Service Boards
identify potential reinvestment projects
III. COST is not intended for project planning/scheduling: • RT!’s COST is designed to help support decision making, not to be the sole basis for
actual reinvestment plans • It is not intended that the mappings yield a prioritized and scheduled list of executable
projects - just to identify patterns of related assets with coincident reinvestment needs
Related Assets: As noted, asset-to-project mapping is intended to identify “patterns of related asset investment needs”; In this context, assets are expected have the following in common to be considered “related” and thus suited for mapping into a common project:
Coincident Needs: Must be roughly coincident, meaning needs occur over roughly the same time period
Joint Investment Efficiencies: Must offer potential cost efficiency from being bundled together (i.e. simultaneous replacement of assets located on a shut-down rail segment)
Co-Located: Assets may be (but do not have to be) located in the same geographic area (e.g., at a common maintenance facility or located on the same rail line or segment). This requirement is better suited to some asset types than others (see next section)
The principle of coincident needs for related assets is presented conceptually in Figure 2-2. Specifically, this graphic shows the timing of reinvestment needs (under a constrained scenario) for a broad range of asset types that have been grouped into related asset categories. While a very simplified presentation, the graphic illustrates the patterns of reinvestment needs for each asset category (i.e. vehicles, systems, stations, etc). Service Board staff can then use this information, along with asset location and other data, to help identify and schedule future reinvestment projects.
ASSET-TO-PROJE�T M!PPING “HOW TO” GUIDE 2-2

CHAPTER 2 DEVELOPING AN ASSET-TO-PROJECT MAPPING
Figure 2-2: Coincident Needs by Asset Type
Station Projects?
Maintenance Facilities Project?
Track and Structures Project?
2.2 Types of Mappings Given the guiding principles and conceptual approach to grouping assets into projects as described above, the next step was to develop the actual mapping process. The solution adopted by RTA and its Service Boards utilizes what is essentially a two-step mapping process:
Project Group Assignment: Assign related asset types (i.e., assets types likely to be grouped together in an actual project) to a common project group name. Creation of project group names and assignment of asset types to those group names (called “Project Name” in the model) is entirely user defined and can be changed at any time.
Project Scope Assignment: Each project group name is assigned a project Scope which determines project size and geographic extent (with project scope ranging from agency-wide down to a specific location, such as a single building).
Hence, within this system, each type of asset identified in the region’s asset inventory (i.e. bus, trackwork, radio, etc) is first assigned to a Project Name and then that group itself is assigned a geographic Scope; Implementation of this solution relies heavily on �OST’s use of an asset types table that identifies all asset types use by the model (for Project Name assignments) and also on RT!’s use of hierarchical asset location data (i.e., mode, line/division, branch/facility and sub-branch/building), for project Scope assignments. A more detailed description of each of these mappings follows.
Project Group Assignment: The first step in developing a comprehensive asset-to-project mapping is to create Project Names for all expected project types and then to map all asset types to their logical Project Name (it is critical that all asset types be assigned to a Project Name). This mapping of Project Names to individual assets is illustrated in Figure 2-3. When the COST model is run, asset types are grouped by Project Name and the relevant Scope of the project.
ASSET-TO-PROJE�T M!PPING “HOW TO” GUIDE 2-3

CHAPTER 2 DEVELOPING AN ASSET-TO-PROJECT MAPPING
Figure 2-3: Illustrative Assignments of to RTA Asset Types to Project Group Names and Scopes
tblAssetToProject_GroupNamesProj Group Name Proj Group ScopeOffice Furniture & Equipment
Modewide
On-Vehicle Revenue Collection
Modewide
Passenger Communications Systems
Modewide
Phone System Modewide
Radio Modewide
Retained Cut Line/Region
Revenue Vehicles Modewide
Roadway Traffic Signals Line/Region
Safety and Security Modewide
SCADA Modewide
Signal Bridge Line/Region
Signals/Interlockings/Special Trackwork
Sub-Branch/Building
Special Structures Line/Region
Station Access Line/Region
Station Platform Line/Region
Station Signage & Graphics
Line/Region
Stations Line/Region
Storage Yards Modewide
Systems Line/Region
Trackwork Sub-Branch/Building
Underground Branch/Division
tbl05AssetTypeDataType Project Group Name Category Sub-
Category Element Sub-Element45000 Station Platform Stations Platform - -
45400 Station Platform Stations Platform - -
45410 Station Platform Stations Platform Surface -
45411 Station Platform Stations Platform Surface Concrete, asphalt, tile
45412 Station Platform Stations Platform Surface Wood
45413 Station Platform Stations Platform Ferry Dock -
45420 Station Platform Stations Platform Shelters -
45430 Station Platform Stations Platform Canopy -
45440 Station Signage & Graphics Stations Platform Signage & Graphics -
45441 Station Signage & Graphics Stations Platform Signage & Graphics Electronic
45442 Station Signage & Graphics Stations Platform Signage & Graphics Static
45450 Station Platform Stations Platform Lighting -
46000 Station Access Stations Access - -
46100 Station Access Stations Access Roadway -
46110 Station Access Stations Access Roadway Auto
46120 Station Access Stations Access Roadway Bus
46200 Station Access Stations Access Parking -
46210 Station Access Stations Access Parking Garage
46220 Station Access Stations Access Parking Lot
46230 Station Access Stations Access Parking & Equipment -
46300 Station Access Stations Access Pedestrian -
Project Names Table Asset Types Table
Project Scope Assignment: The next step is to provide all Project Names with a project Scope assignment. As noted above, the project scope determines the geographic extent for each project type. Project scopes can range anywhere from large area projects that would cover all related assets for an entire transit mode (e.g., replacement of all over age bus shelters) down to small scope projects, that would only cover select assets at a specific location, such as a building or rail yard. At present, projects can be assigned to one of four different project Scopes. These four Scopes – including their definitions and some illustrative examples of asset types best suited to each mapping type – are presented in Figure 2-4 and are illustrated graphically in Figures 2-5 through 2-9. This system of assigning assets to Project Names and then project groupings to Scopes provides the user with significant control in determining how COST presents potential projects.
Using the example above, this process allows COST to group all of the Electrification Distribution needs occurring on the CTA Blue Line over the same time period into a “project” while all of the same asset types on the Red Line will be grouped into a separate “project;”
ASSET-TO-PROJE�T M!PPING “HOW TO” GUIDE 2-4

-
-
CHAPTER 2 DEVELOPING AN ASSET-TO-PROJECT MAPPING
Figure 2-4: Asset-to-Project Mapping Scopes
II. Line/Region
III. Branch/Division
Mapping Scope
I. Mode wide
IV. Sub Branch/ Building/Yard
service region in the system
• Related assets serving the same rail branch or bus division/garage in the system
• Related assets serving same rail sub-
• Related assets serving same rail line or bus
Description
• Related assets serving the same mode, anywhere in the system
• Value to agency in replacing/or planning replacement concurrently
branch, building or yard in the system
same rail line
• Bus shelters within a bus Division’s service area
• Signals, interlockings and
• Bridges or stations on
Examples (Illustrative)
• HVAC at multiple locations
• Grade crossings • Subway fans
special trackwork • Building sub-components
Figure 2-5: Illustrative Scopes for Asset-to-Project Mapping Groupings
Mode-wideLine / Region
Branch/Division
Sub-Branch / Yard / Building
ASSET-TO-PROJE�T M!PPING “HOW TO” GUIDE 2-5

CHAPTER 2 DEVELOPING AN ASSET-TO-PROJECT MAPPING
Figure 2-6: Mapping Mode-wide – Assets of Same Type Anywhere in System
Figure 2-7: Mapping Line/Region – Related Assets Serving Same Rail Line/Bus Region
Examples of Mode-wide:
HVAC at multiple locations Grade crossings Subway fans
Data Requirements – Assets Tagged by:
Asset type Scope: Mode-wide
Examples of Type II:
Guideway Structures Stations Shelters
Data Requirements – Assets Tagged by:
Asset type Location (Line/Region) Scope: Line/Region
ASSET-TO-PROJE�T M!PPING “HOW TO” GUIDE 2-6

CHAPTER 2 DEVELOPING AN ASSET-TO-PROJECT MAPPING
Figure 2-8: Mapping Branch/Division – Related Assets Serving the Same Rail Branch/Bus Division
Figure 2-9: Mapping Sub-Branch/Building/Yard – Related Assets Serving Same Rail Sub-Branch or Facility
Examples of Type II:
Guideway Structures Stations Shelters
Data Requirements – Assets Tagged by:
Asset type
Location (Line/Region & Branch/Division)
Scope: Branch/Division
Examples of Type III:
Rail: Comprehensive overhaul of rail segment including: o Guideway structure/ballast o Rail, ties o Traction power o Train control
Bus: Overhaul of related bus facility components: o Roof and HVAC segment o Drainage and waste water
Data Requirements – Assets Tagged by:
Asset type
Location (Line/Region, Branch/Division & Sub-Branch/ Building/Yard)
Scope: Sub-Branch/Building/Yard
ASSET-TO-PROJE�T M!PPING “HOW TO” GUIDE 2-7

CHAPTER 2 DEVELOPING AN ASSET-TO-PROJECT MAPPING
2.3 Calibration and Recalibration Calibration: The original mappings of asset types to Project Names and then of Project Names to project Scopes was developed as a joint effort between RT!, the Service �oards and RT!’s consultant team. It is important to note that this initial calibration is likely to be modified over time as each Service Board applies the asset-to-project mapping capability to address their individual analysis needs. Moreover, it should also be noted that there are no universal standards for grouping assets into projects. Rather, all agencies tend to have their own practices and policies in this area. For example, some rail agencies may prefer to address all investment needs in a given rail corridor simultaneously (e.g., all structure, trackwork and systems needs) whereas other agencies may prefer to manage reinvestment in the different asset types on an asset-by-asset basis.
Recalibration: A key strength of the approach adopted by RTA is the ease with which any asset type can be assigned to a different asset-to-project mapping group or scope (Mode-wide, Line/Region, Branch/Division, or Sub-Branch/Building/Yard) by modifying the Project Name assignments using the Asset-to-Project Builder interface provided for Input Data. To access the Asset-to-Project Builder, users can click on the Input Data button on �OST’s Main Menu and the Asset-to-Project Mapping tab, see Figure 2-10 and Figure 2-11.
Figure 2-10: COST’s Main Menu
Click to Modify Input Data:• Inventory records• Inflation assumptions• Ridership by location• Life cycle cost assumptions• Asset-to-Project Mapping
ASSET-TO-PROJE�T M!PPING “HOW TO” GUIDE 2-8

CHAPTER 2 DEVELOPING AN ASSET-TO-PROJECT MAPPING
Figure 2-11: Asset-to-Project Builder Showing Current Assignments for Mapping
Users can review the current grouping of assets under Project Names by selecting the Project Name, sorted by asset type, from the drop down menu in the top left as seen in Figure 2-12; The “!ssets �urrently !ssigned to Project” will appear in the top list below the menu, along with the Scope and Primary Asset Category in the top right. The Primary Asset Category is assigned based on the type of asset needs primarily addressed by each project grouping and is used for reporting purposes only (see Section 2.4).
Figure 2-12: Asset-to-Project Builder Project List
ASSET-TO-PROJE�T M!PPING “HOW TO” GUIDE 2-9

CHAPTER 2 DEVELOPING AN ASSET-TO-PROJECT MAPPING
If a user wants to modify the grouping of an asset type to reflect their Service Board’s approach to project planning or to see the impact of various grouping approaches and Scopes they can also use this form to make modifications. There are three ways to recalibrate the Asset-to-Project groupings on this form.
1. To revise the assigned Scope of the project to a higher or lower level: The user can select an existing Project Name from the drop-down menu at the top left and then change the assigned Scope using the drop-down menu at the top right. For example, Elevators are grouped under one Project Name and assigned a Line/Region Scope. However if a Service Board addresses Elevators by Branch/Division, they can choose that option from the drop-down for the Elevators project.
2. To change the default grouping of assets under a Project Name: The user can select that project and add assets from the bottom list by selecting the tick box in the left column as seen below in Figure 2-13; The user then clicks the “!ssign Selected !ssets to Project” button to make the addition. It is important to note that a single asset type can only be assigned to one Project Name in COST. Therefore if the user selects an asset type in the far left column and clicks the “!ssign Selected !ssets to Project” button, �OST will remove that asset type from another project grouping and add it to the one currently listed on the form. Since all assets must be assigned to a Project Name, the only way to remove an asset from one project is to add it to a different one.
3. To create a new Project Name: Creating new Project Names is also possible on this form by clicking the “�reate New Project” button in the top left corner. The user will then type a new Project Name into the top right field and select a corresponding Scope and Primary Asset Category. Assets can be added to this new project as per the steps above. These assets will then be removed from their default project groupings.
Figure 2-13: Asset-to-Project Mapping Form
ASSET-TO-PROJE�T M!PPING “HOW TO” GUIDE 2-10

CHAPTER 2 DEVELOPING AN ASSET-TO-PROJECT MAPPING
�OST’s Asset-to-Project Mapping sub-routine groups individual assets with coincident needs after generating the 20-year needs profile, as seen in Figure 2-1. Therefore, if a user changes asset or Scope assignments or adds Project Names the model must be run again (by clicking the Run Model button on the Main Menu) to generate outputs based on these new groupings.
2.4 Asset-to-Project Mapping Output: Reports As noted above, the asset-to-project mapping process is intended to identify “patterns of related asset investment needs” and the data source for these “patterns” are the asset level needs analysis produced by COST. It is important to understand then, that the asset-to-project mapping process can most accurately be described as a “post processing” of COST’s needs analysis that groups related reinvestment needs into projects based on the four Scopes of mapping assignments discussed above.
The “project level” report is accessed by clicking the “Reports” button found on the lower panel of the Main Menu (Figure 2-14). Clicking this button will open a pop-up form listing all of the reports. Scroll through and then select the “Project Level �onstrained Needs” report. At this point the user can either (1) click the “Report” button on the pop-up form – this action will open the report for viewing or (2) click the “Data (Read Only)” button to view the data underlying the selected report; If the “Report” button is selected the user will be viewing the report in “report” form and has the choice to select the Print Preview form using the View menu seen in Figure 2-15. The report can then be printed or exported to PDF (in Print Preview mode, click “PDF” in the Data section of the MS !ccess Menu) or MS Word format.
Figure 2-14: Model Output – Accessing the Report
ASSET-TO-PROJE�T M!PPING “HOW TO” GUIDE 2-11

CHAPTER 2 DEVELOPING AN ASSET-TO-PROJECT MAPPING
Figure 2-15: Changing Views of the Project Level Needs Report
!n example of a “project level” (vs. asset level) needs report is presented below in Figure 2-16. This report groups Project Names by Service Board, Mode and Primary Asset Category. It also shows the Scope of the project and the relevant location information. Based on this report, the user might identify coincident reinvestment needs for traction power on the Forest Park branch of the Blue line as a potential reinvestment project. The level of need in each “project” is shown in total and annually over ten years with darker color values indicating higher reinvestment needs.
Figure 2-16: Project Level Needs Report
In addition, the report includes an interactive button related to each “project” which allows the user to view all of the individual assets included in a “project;” This feature is only available in “Report View” and will not function in “Print Preview;” When clicked the button brings up a query with the individual asset details related to that “project”, including the timing of reinvestment needs for each asset and its value (if any) in the SGR backlog from year to year – illustrated in Figure 2-17. Timing of investments and backlog changes can be seen by scrolling to the right in the query.
ASSET-TO-PROJE�T M!PPING “HOW TO” GUIDE 2-12

-
-
CHAPTER 2 DEVELOPING AN ASSET-TO-PROJECT MAPPING
Figure 2-17: Project Level Needs Report with Asset Detail Query
Impact of Changes to COST Scenario Definitions on Asset-to-Project Mappings: It is important to note that the timing of asset replacement needs produced by COST and the subsequent grouping of those asset needs to the project level is driven by the scenario assumptions used for the underlying COST model run. In particular, adjustments to COST’s budget constraint values (assuming funding levels are less than required to address all needs) or to the investment prioritization criteria weights, will lead to changes in the composition and timing of proposed asset replacements and their related asset-to-project mappings. To view project level needs without budget constraint impacts, the user should run an “Unconstrained” scenario – described in Volume 2: Part 1 RTA COST Model “How To” Guide.
2.5 Mapping Data Requirements Prior to initiating a COST model run the following additional information must be added to asset records to facilitate asset-to-project mapping. The Location fields seen below are included in the Asset Inventory form for Input Data, and are captured in the annual inventory update for RT!’s assessment of needs. Project Names are linked to the inventory by asset types, and can be added or changed as described above in Section 2.3. All asset types must be assigned to a Project Name in order to be captured in the Asset-to-Project mapping reports.
Figure 2-18: Data Requirements by Asset-to-Project Mapping Scopes
Mapping Scope Location Requirements Project Name
I. Mode wide • Not required Required for assigning asset
types
II. Line/Region • Line/Region Required for assigning asset
types
III. Branch/Division • Line/Region • Branch/Division
Required for assigning asset types
IV. Sub Branch/ Building/Yard
• Line/Region • Branch/Division • Sub-Branch/Building/Yard
Required for assigning asset types
ASSET-TO-PROJE�T M!PPING “HOW TO” GUIDE 2-13

CHAPTER 3 “HOW TO GUIDE TO” PRIORITIZE M!PPED PROJE�TS
3. “How to” Guide to Prioritize Mapped Projects This chapter briefly describes the prioritization routine built into COST which can be used to support project prioritization based on the project groupings described above. For a more detailed description of the multi-criteria prioritization process embedded in COST, refer to Volume 2: Part 2 Criteria Investment Prioritization Process “How To” Guide.
Specifically this chapter considers:
RT!’s approach to asset-level multi-criteria scoring
Aggregation of asset-level scoring to project-level scoring
Application of project-level scoring
3.1 Asset-Level Prioritization Scores As noted above, the asset-to-project mapping sub-routine identifies patterns of coincident asset investment needs as a “post processing” of �OST’s needs analysis; Thus any prioritization of projects is based on the prioritization scoring of the individual assets grouped within that project. This section provides the background on the criteria and aggregation method used by COST to determine the prioritization score of each asset in a constrained scenario. With unconstrained funding, prioritization scoring is not relevant for funding decisions in COST.
Figure 3-1 provides an overview of the five investment criteria used to score and rank all potential SGR reinvestment actions – including asset condition, number of riders impacted, and the contribution of reinvestment actions to each of service reliability, rider and agency staff safety and security, and finally O&M cost reduction. The weight placed on each criterion is variable within COST and hence can be varied to reflect agency policies or to conduct sensitivity analysis. The process used to score each SGR reinvestment criterion is highlighted in Figure 3-2.
Figure 3-1: COST – SGR Investment Prioritization Criteria and Scoring
Multi-Criteria Decision Analysis (MCDA) Based ApproachAsset
ConditionScore:
Declining condition yields
higher points score
Riders Impacted
Score: Based on number of
riders served by asset location
Service Reliability
Score:Reduced risk of service failures /
disruptions
Safety / Security
Score: Reduced risk of injuries,
fatalities, property damage
O&M CostsScore: Impact on Operating & Maintenance
costs
Weighted Average Total Investment Score:(Converted to 100 Point Scale)
X% X% X% X% X%
ASSET-TO-PROJE�T M!PPING “HOW TO” GUIDE 3-1

CHAPTER 3 “HOW TO GUIDE TO” PRIORITIZE M!PPED PROJE�TS
Figure 3-2: Approach to Scoring by SGR Investment Criterion
Criterion Approach Dynamic or Static? Illustration
Condition • Decay curve based condition estimate– Age based 1 to 5 scale • Dynamic
O&M CostImpact • Fixed score by asset type • Static
Reliability and Safety/ Security
• Combination of:– Fixed score by asset type– Dynamic score by asset age
• Mixed
Riders Impacted
• Logarithmic score based on share of total agency riders impacted– Scale ensures all assets obtain score
• NA
Scoring is “dynamic” throughout the 20-year period covered by each model run for some criteria. Specifically, �OST assesses each asset’s condition at the start of each analysis year (including the start or “backlog year”); This evaluation is then used to score and rank potential SGR investments with respect to asset condition, reliability and safety/security (with scoring for reliability and safety/security driven in part by condition). Due to this constant re-evaluation, the scoring for all assets is constantly changing (i;e;, is “dynamic”) throughout the 20-years of each model run.
With constrained funding COST will determine which assets to reinvest in based on the highest priority scores in any given year of the model run. Those assets which do not score highly enough for reinvestment but require replacement or rehabilitation will enter the SGR backlog. If funding is constrained enough to delay the timing of a normal reinvestment need (i.e. scheduled replacement or rehabilitation), this prioritization routine will determine when an individual asset receives reinvestment actions (i.e. what year the need will appear on the project level output report).
3.2 Aggregation of Asset Prioritization Scores (RTA Approach) Even though prioritization scoring is dynamic for each asset and changes in each year of the model run, the asset-to-project mapping process only identifies projects that have been funded by COST (i.e., investments with sufficiently high priority scores that can be funded subject to the user entered budget constraint). Therefore COST calculates project-level priority scores using the highest priority score of an asset for the first ten years of needs analysis (including the backlog year). This maximum priority score for each asset is then weighted by the total investment costs of the asset over the 10-year needs analysis, which is then used for asset-to-project mapping so it can be aggregated with the other assets in the same project. The project-level priority score is then the sum of all the weighted maximum prioritization scores for the assets in the project, divided by the total 10-year cost for all project investments.
ASSET-TO-PROJE�T M!PPING “HOW TO” GUIDE 3-2

CHAPTER 3 “HOW TO GUIDE TO” PRIORITIZE M!PPED PROJE�TS
Using this methodology, assets with high prioritization scores but low total investment costs and assets with low prioritization scores but high total investment costs will contribute a similar amount to the score of a project. The priority score for a project containing two such assets would be as follows:
Priority Variable Calculation Asset 1 Asset 2
A 10-Year Max Prioritization Score 50 80
B Total 10-Year Needs (millions) $60 $40
C Weighted Priority for each Asset (AxB) 3000 3200
D Total 10-Year Project Needs (millions) (B+B) $ 100
E Sum of Weighted Priorities (C+C) 6200
Project Priority Score (E/D) 62
3.3 Project Scoring The methodology described above for aggregating individual asset prioritization scores results in a single priority score for each Project Grouping Name and Project Scope combination listed in the asset-to-project mapping output report, as seen below in Figure 3-3. This score represents a weighted average of the maximum prioritization scores for all of the assets included in the project grouping. These project priority scores allow for easy comparison across project groups, particularly if budget constraints increase over time. In this example the project with the highest priority score is Maintenance Buildings. This project also has the highest total investment needs over the 10-year analysis period.
Figure 3-3: Example Project Priority Scores
With asset-to-project mapping, the individual asset prioritization scores determine the timing of investments in a constrained scenario, along with the regular timing of reinvestment needs. The aggregated project-level scores also allow for comparison of prioritization of assets between projects.
ASSET-TO-PROJE�T M!PPING “HOW TO” GUIDE 3-3

CHAPTER 4 “HOW TO GUIDE TO” !PPLY PROJE�T M!PPING RESULTS
4. “How to” Guide to Apply Project Mapping Results This chapter describes potential applications of the asset-to-project mapping outputs. Specifically it describes use of the project-level report in the budgeting process and for potential Service Board project identification.
4.1 RTA Budget Support: Independent Validation of Proposed Investments For RTA a primary application of COST is the review of the annual capital budgets submitted to RTA by its Service Boards. RTA is responsible for funding and oversight of all public transportation in Northeastern Illinois. Hence, each year RT!’s three Service �oards submit their capital plans for the following year, which RTA must then review and approve; Within this process, RT! uses �OST’s prioritization capability to take an “independent look” at the Service �oards capital budget proposals to help assure that the mix of investments in the proposed capital budgets is consistent with the region’s preferred mix of investment priorities (as determined by �OST’s prioritization scoring);
The asset-to-project mapping process described above provides RTA and the Service Boards with an additional tool for comparison of capital plans for specific projects. While the sub-routine is not meant to provide project planning, it does identify coincident needs which may or may not be addressed in the proposed capital budgets. Differences between the proposed budgets and COST generated projects can then be used to help determine whether to (1) reconsider the Service �oard’s proposed investment decisions and/or (2) reconsider and potentially recalibrate and improve �OST’s investment prioritization or asset-to-project mapping project groupings or scopes.
4.2 Direct Project Identification In addition to providing an independent view of priority investment decisions, COST also provides a longer-term view of capital planning. As seen in Figure 4-1, the timeframe for �OST’s analysis is longer than those generally used for transit capital improvement plans (CIPs) and even the capital projects pipeline. As such, the longer-term view that COST provides can be used to help identify future investment projects that are not yet on the planning horizon.
In addition to providing project identification beyond the horizon of capital budgets, the project groupings developed in the asset-to-project mapping process can be used to identify potential projects that may not surface during the normal capital planning process. For example, by grouping assets of a similar type and similar location a project may eventuate in COST which a Service Board did not identify through their own internal processes; These new “projects” can then be discussed for potential inclusion in future plans if they provide the efficiencies expected in their groupings.
ASSET-TO-PROJE�T M!PPING “HOW TO” GUIDE 4-1

CHAPTER 4 “HOW TO GUIDE TO” !PPLY PROJE�T M!PPING RESULTS
Figure 4-1: Example Continuum of Capital Planning in Transit
ASSET-TO-PROJE�T M!PPING “HOW TO” GUIDE 4-2

APPENDIX A: GLOSSARY AND ABBREVIATIONS
Appendix A: Glossary and Abbreviations
Prioritization: For this guide, prioritization is the process of identifying a preferred or optimal order in which reinvestment events should occur. Implicit in this statement is the assumption that:
o Funding is insufficient to address all needs. Hence prioritization is required to determine which assets should be addressed first (and which assets have needs that may not be addressed).
o Investment needs can be ranked. In other words, there are good analytic or other bases on which to ranked investment needs – from highest to lowest—to determine in which outstanding needs are most effectively addressed (and potentially leaving some needs unaddressed).
Prioritization Criteria: Prioritization criteria provide the basis for determining the priority of individual investments. In general, investments are made with the expectation that the completed investment will yield improvements to one or more aspects of agency operations (e.g., improvements to reliability, efficiency, safety, rider comfort or other characteristic). Within a prioritization routine, the most desirable or important of these types of investment outcomes are referred to as “investment criteria”; Investments that perform best with respect to these criteria (i.e., tend to be provide the best mix of desired outcomes) are assigned the highest priority. Investments that perform poorly may receive a low priority ranking.
Prioritization Criteria Scores: From the viewpoint of this guide (and RT!’s Decision Tool), prioritization criteria should be quantifiable so investments can be assigned a numeric score reflecting their potential contribution to the desired outcome associated with that criterion (e.g., contribution to SGR). Note that numeric criteria scores facilitate objective comparisons between investment options. Given that different criteria may naturally be associated with specific unit quantities (e.g., condition rating for SGR and dollar values for impacts to operating costs), these score need to be converted to a common basis if the intention is to generate a multi-criteria prioritization score.
Multi-Criteria Investment Prioritization (criteria weighting): Multi-criteria investment prioritization refers to the process of evaluating and prioritizing investment options based on each investment’s performance against a mix of multiple investment criteria. In the context of this guide and RT!’s Decision Tool, multi-criteria investment prioritization implies the (1) all criteria are individual scored on a common scale (e.g., running from 1 to 5) and (2) these criteria scores are combined into a weighted average score, with the weight placed on each criterion reflecting the relative importance of that criterion.
Needs Analysis: In the context of COST, needs analysis refers to the process of determining the level of investment required to attain specific investment objectives and also with how those investment dollars are allocated to different uses (e.g., between various asset types). In general, needs analysis falls into two broad categories:
o Unconstrained needs: The level of investment required to address all outstanding and future needs, irrespective of actual or expected funding availability
o Constrained Needs: The level of investment required to attain more realistic investment objectives (e.g., maintain the size of the current investment backlog, or eliminate the
ASSET-TO-PROJECT MAPPING “HOW TO” GUIDE A-1

APPENDIX A: GLOSSARY AND ABBREVIATIONS
backlog over 20 years). As the name suggests, under constrained needs analysis, there is insufficient funding to address all needs.
Reinvestment in Existing Assets (SGR) vs. Investment in New Expansion or Enhancement Assets: COST is designed to assess and prioritize investment needs for both existing and expansion assets. In general, these investment types falls into the following categories:
o Reinvestment in Existing Assets: Refers to SGR (i.e., rehab and replace) investments in assets that are currently in service (i.e., existing assets).
o Investment in expansion assets: Refers to the planned/proposed future purchase of new assets that either: (i) expand existing service capacity (e.g., fleet expansion), (ii) adds a new service (e.g., New Starts) or (iii) enhances existing service (e.g., new technologies such as real-time arrival information).
Scenario Analysis: In the context of COST, scenario analysis refers to the process of identifying specific investment objectives and then assessing the investment needs associated with attaining that scenario. Examples include:
o Maintain historic funding levels o Maintain the current backlog o Eliminate the backlog over a set time period (e.g., 20 years)
Asset Condition and Decay: Asset condition refers here to the estimated physical condition of a transit asset. Specifically, COST includes a set of embedded asset decay curves that predict the current and future physical condition of a transit asset based on its type, age and other factors (e.g., use and maintenance history). COST uses these condition relationships to prioritize reinvestment needs (in part) based each asset’s predicted physical condition (both currently and into the future depending on needs and funding availability). COST also uses these same asset decay curves to generate current and future distributions of asset conditions.
The following definitions for State of Good Repair (SGR) separate the asset level from aggregate level.
Asset Level SGR: An asset is in a state of good repair (SGR) if (i) its age does not exceed its expected useful life and (ii) all rehabilitation and annual capital maintenance activities are up to date. Under these circumstances, an asset has no deferred capital reinvestment needs and, by definition, has an estimated condition score of 2.5 or higher (RTA/TERM Lite decay curves are defined such that assets attain their useful life and a condition score of 2.5 concurrently). If an asset has undergone a major life extending rehabilitation, it can exceed its expected useful life and still be in SGR. Non-attainment of SGR does not imply an asset is unfit for service or unsafe but it may increase the likelihood of sub-optimal performance (i.e. reliability and availability performance may decrease).
Mode, Service Board, or Regional Level (Aggregate) SGR: A transit mode, Service Board or the region is considered to be in SGR if each of its component assets is in SGR (as defined above). Mode, Service Board and regional level SGR represents an ideal state and is not attainable in practice as (i) rehabilitation and replacement needs arise continuously and (ii) mode, Service Board and regional level budgets are generally insufficient to meet these continuous needs. As such, a more realistic view of SGR at an aggregate level is based on the region’s target/tolerance for achieving reinvestment goals – such as halving the current SGR backlog over a certain timeframe or not allowing the SGR backlog to grow beyond current levels.
ASSET-TO-PROJECT MAPPING “HOW TO” GUIDE A-2