toward high-quality education in peru - isbn:...
TRANSCRIPT

THE WORLD BANK
Toward High-qualityEducation in PeruStandards, Accountability, andCapacity Building
A W O R L D B A N K C O U N T R Y S T U D Y
40557


A W O R L D B A N K C O U N T R Y S T U D Y
Toward High-quality Education in PeruStandards, Accountability, and Capacity Building
THE WORLD BANK
Washington, D.C.

Copyright © 2007The International Bank for Reconstruction and Development / The World Bank1818 H Street, N.W.Washington, D.C. 20433, U.S.A.All rights reservedManufactured in the United States of AmericaFirst Printing: May 2007
printed on recycled paper
1 2 3 4 5 10 09 08 07World Bank Country Studies are among the many reports originally prepared for internal use as part ofthe continuing analysis by the Bank of the economic and related conditions of its developing membercountries and to facilitate its dialogs with the governments. Some of the reports are published in thisseries with the least possible delay for the use of governments, and the academic, business, financial, anddevelopment communities. The manuscript of this paper therefore has not been prepared in accordancewith the procedures appropriate to formally-edited texts. Some sources cited in this paper may beinformal documents that are not readily available.
The findings, interpretations, and conclusions expressed herein are those of the author(s) and do notnecessarily reflect the views of the International Bank for Reconstruction and Development/The WorldBank and its affiliated organizations, or those of the Executive Directors of The World Bank or thegovernments they represent.
The World Bank does not guarantee the accuracy of the data included in this work. The boundaries,colors, denominations, and other information shown on any map in this work do not imply any judgmenton the part of The World Bank of the legal status of any territory or the endorsement or acceptance ofsuch boundaries.
The material in this publication is copyrighted. Copying and/or transmitting portions or all of thiswork without permission may be a violation of applicable law. The International Bank for Reconstructionand Development/The World Bank encourages dissemination of its work and will normally grant permissionpromptly to reproduce portions of the work.
For permission to photocopy or reprint any part of this work, please send a request with completeinformation to the Copyright Clearance Center, Inc., 222 Rosewood Drive, Danvers, MA 01923, USA,Tel: 978-750-8400, Fax: 978-750-4470, www.copyright.com.
All other queries on rights and licenses, including subsidiary rights, should be addressed to the Officeof the Publisher, The World Bank, 1818 H Street NW, Washington, DC 20433, USA, Fax: 202-522-2422,email: [email protected].
ISBN-10: 0-8213-7017-0 ISBN-13: 978-0-8213-7017-9eISBN: 978-0-8213-7018-6ISSN: 0253-2123 DOI: 10.1596/978-0-8213-7017-9
Library of Congress Cataloging-in-Publication.
Toward high-quality education in Peru : standards, accountability, and capacity building.
p. cm. — (A World Bank country study)Includes bibliographical references.ISBN-13: 978-0-8213-7017-9ISBN-10: 0-8213-7017-0ISBN-13: 978-0-8213-7018-6 (electronic)
1. Education—Peru. 2. Educational indicators—Peru. I. World Bank.LA596.T69 2007370.985—dc22
2007015903

Contents
Foreword
Acknowledgments
Acronyms and Abbreviations
Executive Summary
1. Overview of Current Indicators
Coverage
Learning and Quality
2. Educational Diagnostics and Recommendations
Stock of Peruvian Research on “What Works” in Schooling
Existing Stock of Policy Suggestions
Remaining Impediments
3. The Accountability-Triangle Approach
4. Education Finance
Patterns of Educational Expenditure
Education System Efficiency
Spending Incidence and Equity
Distribution of Results
Summary of Inequality of Benefits
Special Focus on Teacher Costs
Other Input Supplies
5. Why Don’t Some Peruvian Children Finish High School?
The Quantitative Evidence
Returns to Education
Qualitative Analysis of Dropout Motivations
Policy Implications
6. Reading in the Early Grades: A Case Study in the Use of Standards
Simple Reading Benchmarks
Aims, Method, and Sample
Basic Results
Some Causal Analysis Related to Standards and Support
iii
vii
ix
xi
xiii
1
1
3
9
9
17
21
23
25
25
28
35
43
52
53
58
61
62
65
68
70
73
74
76
77
83

7. School Management Issues
Behavior and Choice in Peru’s Public Schools
Direct Relationship Between Schools and Community: Fe y Alegríaand the “Directed Autonomy” Model
8. Progress and Paralysis on Intercultural and Bilingual Education:A Special Problem with Standards
The Issue
What Does it Take, and Is Peru Doing What it Takes?
A Special Issue Related to “Compact” and Accountability:Standards and Standardization in EIB
9. Participation and Decentralization: Little Effect, Some Potential
School Level
Levels Above the School
A Way Forward on Voice and Participation? Opportunitiesand Dangers in Decentralization
10. Policy Recommendations
Standards
Accountability
Support
Appendixes
A. Dogo
B. Classification and Frequency of Classroom Activities
Bibliography
LIST OF TABLES
1.1. Education System Coverage Data for Peru and Latin America as a Whole
2.1. Factors Associated with Improved Learning Results in Peru
2.2. Results on Determinants of Learning Based on 2001 National Evaluation
2.3. Results on Determinants of Learning Based on 2001 National Evaluation
2.4. Summary of Policy Recommendations in Some Key PeruvianLiterature and Literature on Peru
4.1. Calculation of Expenditure Benchmarks Suitable for Peru
4.2. Key Expenditure Patterns in Peru
4.3. Beneficiary Incidence by Quintile, 2003 (assuming equalspending per beneficiary)
4.4. Benefit Incidence by Quintile, 2003 (assuming unequalspending per beneficiary)
iv Contents
89
89
100
111
111
113
117
121
122
123
125
129
129
131
132
135
137
141
2
12
15
16
18
26
30
36
36

Contents v
4.5. Benefit or Beneficiary Incidence—International Medians in Various Years
4.6. Demographic and Public Private Choice of Families, by Income Quintile,as Determinants of Pro-poor Spending, 2003
4.7. Proportion of Youths Enrolled in School 2003
4.8. Benefits Represented by Public School Subsidy as a Proportion of Total Household Expenditure Across All Households (“Relative Incidence”), 2003
4.9. Per Student Spending and Poverty Levels by Region, 2003
4.10. Summary on Inequality of Various Educational Benefits
4.11. Pupil-Teacher Ratios in Peru and Average for Latin America
4.12. Teacher Salaries in Peru, 1999–2004
4.13. Textbook Provision in Peru: Selected Data
5.1. Quantitative Evidence on Dropping Out of School
5.2. Public and Private Returns to Education
6.1. Basic Sample Characteristics for School Reading Standards Survey
6.2. Basic Results
6.3. School-level Reading Factor Correlations
6.4. Relationship Between Reading and Comprehension
6.5. School-by-School and Type-by-Type Variation in Reading Ability
6.6. Reported Week of Textbook Arrival in the Classroom
6.7. Teacher Use of Classroom Time
7.1. Schools Chosen for Assessing School Effectiveness Factors
7.2. Tallies of Effectiveness Factors
7.3. Official and Fe y Alegría Curricular Statements Compared
8.1. Tasks or Requirements Needed to Successfully Implement EIBand Degree of Presence in Peru
8.2. Projects in Educación Intercultural Bilingüe in Peru
LIST OF FIGURES
1.1. Real and Predicted PISA Scor
1.2. Relationship Between Access and Learning Scores
1.3. Frequency Distribution PISA 2000 Reading Performance
1.4. Cumulative Frequency PISA 2000 Reading Performance
1.5. Economic versus Educational Inequality
3.1. Accountability Triangle
4.1. Impact of Spending on Enrollment
4.2. Learning Efficiency of Peru’s Education Expenditure
4.3. Efficiency Frontier for Primar
4.4. Efficiency Frontier for Secondary Education
36
37
38
39
40
52
55
55
59
63
68
78
78
79
80
81
86
86
92
95
104
113
116
es 3
4
5
6
7
24
29
33
y Education 33
34
4.5. Correlation Between Poverty and Spending Across Regions
4.6. Socioeconomic Index and Spanish Performance Across Schools
4.7. Socioeconomic Index and Mother Tongue Across Schools
4.8. Variation of Results Among the Poor versus the Less Poor,Controlling for Language
4.9. Nutritional Variability Among the Poor and Non-poor
4.10. Infrastructure, Supplies, and Learning Results
4.11. Socioeconomic Index and Quality of Input Supply
4.12. Socioeconomic Index and Infrastructure Supply
4.13. Learning Results and Pupil-Teacher Ratio
4.14. Learning Results Residuals and Pupil-Teacher Ratio
4.15. Socioeconomic Index and School Supplies
4.16. School Supplies and Learning
5.1. Age and School Enrollment by Income Group
5.2. Age and School Enrollment by Place of Residence
5.3. Age and School Enrollment by Gender
5.4. Grade-specific Enrollment Ratios by Place of Residence
5.5. Grade-specific Enrollment Ratios: Impact of Repetition
5.6. Grade-specific Enrollment Ratios by Gender
5.7. Returns to Education in Peru
5.8. Returns to Education Around the World
vi Contents
41
44
45
46
47
48
49
50
51
52
59
60
64
64
65
66
66
67
67
68

Foreword
One of the principal challenges in reducing poverty and accelerating development inPeru is improving the quality of education. This book is a contribution from the
World Bank to the debate over how to improve the quality of education. The country hashad major successes in education coverage at all levels, reaching higher levels than inneighboring countries and higher in comparison to some countries with higher incomelevels. However, every measure of quality has shown there is a large gap between theimpressive achievements in coverage and the little achieved in quality.
The book offers a diagnostic on the state of basic education in Peru and identifiesthe principal measures necessary to overcome the current stagnation in quality. It ana-lyzes the state of education in Peru based on international comparisons, with both LatinAmerican and other developing countries. The analysis includes a review of statistics oncoverage, quality and inequality as well as a careful analysis of public spending on edu-cation, examining the amount spent and how it is distributed and re-examining somefamiliar places in a new light. Peruvian specialists have done many good studies in recentyears and these are compared with each other and with the results of this book’s analy-sis to identify areas of consensus as well as the value added from this study. The book alsoincludes an analysis of less studied themes including a search for lessons learned in poorareas of Peru. This analysis includes a review of the administration system of the Fe yAlegria school system and a study of the administration patterns of well-regarded pub-lic schools. Finally, the book includes a study on the difficulties of bilingual educationthat are specific to Peru.
The book has three main recommendations that, to be successful, should be imple-mented sequentially. First, it is necessary to generate basic standards, quality goals, andquality measurement systems. Second, once quality can be measured a clear system ofaccountability should be implemented based on these standards and quality goals. Theclients will play a central role in these systems by demanding their rights to quality services;this will only become possible once there are standards and goals that clarify clients’ rights.Third, once there are standards and systems of accountability, investment is needed tostrengthen the institutional capacity of the providers. This investment will have to coverdifferent areas, and include training directly linked to pedagogical needs.
The book has been prepared by a team of World Bank officers and Peruvian consult-ants. Luis Crouch led the team and was the principal author of this book. This book is oneproduct in a multisectoral analysis financed by the World Bank and the UK government’sDepartment for International Development (DFID). The project, known as RECURSO,(which in Spanish stands for Bringing Accountability to Social Reform in Peru), was madeup of six teams that worked together in a conceptual framework that emphasized account-ability. The RECURSO project has presented its conclusions in various formats aimed atdifferent audiences, which are available to interested parties at www.bancomundial.org.pe/NuevoContratoSocial, and include:
■ A summary,■ Two videos aimed at parents and community leaders,
vii

■ A series of short radio programs in Spanish, Quechua, Aymará, and Asháninka,■ Various simplified pamphlets (on education, health, social assistance, and social
participation), and■ Various technical documents for reference.
Daniel CotlearSector Manager for Education, Health and Social ProtectionBolivia, Ecuador, Perú and VenezuelaLatin America and the CaribbeanThe World Bank
viii Foreword
ix
Acknowledgments
This document is the result of collaboration between the principal author, Luis Crouch,and the authors of the supporting studies, as well as other professionals. However, the
final conclusions and any errors are the responsibility of the principal author. Lorena Alcázarand Néstor Valdivia of GRADE provided the research and analysis on Fe y Alegría, effectiveschools, and school-leaving problems. Marcela Echegaray, Consuelo Pasco and JessycaSampe from TAREA provided the research and analysis on reading and the use ofstandards in the early grades of Peruvian education. Lilliam Hidalgo Collazos and IngridGuzmán Sota from TAREA carried out the research and provided the commentary onIntercultural Bilingual Education. Flavio Figallo from the Pontificia Universidad Católicadel Perú contributed the analysis of civil society participation. Pablo Lavado played aleading role in most of the numerical analysis and was the principal author of somesections such as the one on rates of return on education. Helen Abadzi of the World Bankprovided valuable comments and text on reading standards. Finally, all the members of theRECURSO team, led by Daniel Cotlear, contributed valuable feedback, opportunities forprofessional debate and mutual enrichment during the many hours of team meetings.
The study benefited from the revision and incisive commentaries of World Bank col-leagues including Bárbara Bruns, Ernesto Cuadra, Bob Prouty, and Kin Bing Wu (peerreviewers), and Ariel Fiszbein and Eduardo Velez; as well as World Bank personnel and con-sultants in Lima including John Newman, Betty M. Alvarado, Livia M. Benavides, LuisaYesquén, Sandra Arzubiaga, and Carmen Osorio.
Barbara Hunt, who has been observing the Peruvian education sector for a long time,contributed valuable comments as part of the external review.
Peruvian intellectuals, technicians, and political leaders whose feedback, support orchallenges made this a better product and whose comments were extremely valuable inshaping our perceptions included Santiago Cueto, Juan Fernando Vega, Nicolás Lynch,Manuel Bello, Manuel Iguíñiz, Sigfredo Chiroque, Martín Vegas, Patricia Salas O’Brien,Gloria Helfer, Mercedes Cabanillas, and Richard Webb. The technical teams for educationof several Peruvian political parties shared their ideas with us during the policy dialogue—we recognize and thank them for their time and interest.
Among other donor agencies, support and feedback were received from Mark Lewis(DFID), Fernando Bolaños (USAID) and Antonieta de Harwood (USAID/AED, Head ofthe AprenDes project), among others.
In the government we extend our gratitude to all who contributed data, gave their timefor interviews, and facilitated the process including Education Minister Javier Sota Nadaland the Vice Education Minister Idel Vexler, as well as Gustavo Cabrera, Giuliana Espinosa,Flormarina Guardia, Liliana Miranda, Luis Paz, Enrique Prochazka, and Patricia Valdiviafrom the Education Ministry.

xi
Acronyms and Abbreviations
APAFA Asociación de Padres de Familia—Parents’ AssociationCEI Consejo Educativo Institucional—School Governing CouncilCENAPAFA Central Nacional de APAFAs—National Parents’ AssociationCNE Consejo Nacional de Educación—Nacional Education CouncilCOPALE Consejo Participativo Local de Educación—Local Participatory
Education Council (Provincial Level)COPARE Consejo Participativo Regional de Educación—
Regional Participatory Education CouncilDRE Dirección Regional de Educación—Regional level school manage-
ment and supervision unitEIB Educación Intercultural Bilingüe—Intercultural and Bilingual EducationENAHO Encuesta Nacional de Hogares—National Household SurveyENDES Encuesta Demográfica y de Salud Familiar—National Demographic
and Family Health Survey (Peru’s version of the DHS or Demo-graphic Health Surveys)
FENAPAFA Federación Nacional de APAFAs—National Federation ofParents’ Associations
FyA Fe y AlegríaFONCODES Fondo de Cooperación para el Desarrollo Social—The National
Social Investment FundFORMABIAP Formación de Maestros Bilingües de la Amazonía Peruana—
Bilingual Teacher Training for the Peruvian AmazonLLECE Laboratorio Latinoamericano de Evaluación de la Calidad
Educativa—Latin American Laboratory for Evaluation ofEducation Quality
MINEDU Ministerio de Educación—Ministry of Education of PeruMRE “Most recent estimate”PEB Programa de Educación Bilingüe—Bilingual Education ProgramPEBIAN Programa de Educación Bilingüe Intercultural del Alto Napo—
Program for Bilingual Intercultural Education of the High NapoPEEB Programa de Educación Experimental Bilingüe—
Project for Experimental Bilingual EducationPIRLS Progress in International Reading StudyPISA Programme for International Student AssessmentTIMSS Trends in International Mathematics and Science StudySIAF Sistema Integrado de Administración Financiera—
Integrated Financial Administration SystemUGEL Unidad de Gestión Educativa Local—Provincial level school
management and supervision unit


xiii
Executive Summary
Current Situation
Peru has made great strides in educational coverage. Gross enrollment ratios at all school-ing levels are higher than (or, within measurement error, as high as) those in countries withsimilar per capita income in Latin America. Completion rates are high—nearly 100 per-cent in primary school, and around 65 percent in secondary. Although the gender balanceis not perfect, it is at about the same level as that found in the rest of Latin America. In truth,it has to be recognized that some of this enrollment takes place in schools where the qual-ity of infrastructure is less than optimal, and so one might question the nature of this cov-erage. Nonetheless, overall, coverage is high. Furthermore, most students who do not finishhigh school are constrained from finishing by economic (poverty, fees, the need to work),social (pregnancy or marriage, youths alienation and gang behavior), and educational qual-ity (school is not seen to be useful) problems, not by the unavailability of schools.
However, Peru has a quality problem, as proxied by levels of learning. It has partici-pated in two international comparisons of learning achievement, PISA and LLECE. OnPISA, Peru’s scores were the lowest in Latin America (about 20 percent behind the averageof Chile, Argentina, Brazil, and Mexico), and were far behind those of other middle-incomecountries with growing educational achievement, such as Thailand, with which Peru willhave to compete. Only about 5 percent of Peru’s students perform at the OECD average.Peru’s own national student assessments yield disappointing results, with only some 20 per-cent of students performing at the desired level. In our own simple reading assessment,again, only about 20 percent of students in grades 1 and 2 were performing at a reasonablelevel. It is important to keep in mind that Peru also has fairly low income per capita, a rel-atively high demographic burden, and relatively low levels of literacy in the parental andgrand-parental generations. Thus, the average level of student performance is not very sur-prising. More interesting is the fact that there is great inequality in performance in Peru,and that a significant gap exists between enrollment levels and performance. In mathemat-ics, for example, and taking both PISA and TIMSS, Peru’s internal inequality of results wasthe highest after South Africa. Furthermore, unlike in most countries, inequality in Perucannot be explained solely in economic terms. Other factors, such as linguistic or culturaldiscrimination or a lack of attention to pedagogical development for the poor, seem to beat work. Furthermore, inequality in learning achievement among the poor is higher thaninequality among the better-off. In fact, inequality among the poor themselves is half ashigh as inequality between the poor and the rich. There is neither micro nor macro evi-dence that low and highly variable quality among the poor is mostly due to resource con-straints. All this strongly suggests that the problem is a lack of standards and accountability,which is accompanied by a dearth of models for effective pedagogy and other forms ofsupport (for example, nutritional supplementation) for the poor. Finally, the contrastbetween achievement and enrollment in Peru is very high. In most countries with highenrollment ratios, achievement is also reasonably high. This is not so in Peru: there is agreat imbalance between enrollment levels and what youths actually learn. This mostlikely means that the labor market will have trouble absorbing many youths who are being

led to believe they are educated but who do not, in truth, know very much. The conse-quences for social cohesion and tranquility are impossible to predict but are unlikely tobe good.
The determinants of quality and learning appear to be the following, in order of pri-ority: quality of management and work effort, poverty, language of origin, and resourceprovision. The education sector can do much about the first and third factors. It canimprove management, quality and work effort levels. It can also address issues of appro-priate pedagogy for children whose first language is not Spanish. Poverty is harder toaddress with sectoral policies, evidently. It will require some cross-sectoral collaboration,as well as broad economic growth. It would also help if there were more pro-poor spend-ing of a transparent nature, especially on the resources that are known to make a differ-ence. But the most important addressable issue is the very poor quality of managementin the sector.
The issue of pedagogical models for the approximately one quarter of children whosemain home language is not Spanish is important but daunting. Results show that languageof origin is, after management and poverty, an important and independent determinant oflearning achievement. There have been some ten major efforts to improve bilingual edu-cation. Yet, very limited systemic evaluation has been conducted on these efforts, and assuch relatively little is known about how to handle this issue.
Spending on education in Peru, which is around 3 percent of GDP, is low in compar-ison with other countries. Although spending has been relatively efficient in generatingcoverage, it has not been efficient in generating quality. Peru is near the limit of what coun-tries can do to generate coverage via spending, but it is considerably below the limit, or eventhe average, of what countries can do to turn spending into learning achievement. Fur-thermore, spending patterns are inefficient: too much is spent on salaries, and not enoughon other forms of support. Salaries have been increased across the board in Peru over thelast few years, but there is no evident reciprocal commitment from teacher interest groupsto improve quality or to be evaluated (though there appears to be some recent change inthe right direction). Finally, there are no indicator or standards systems in use to allowmanagers to relate spending to quality or to allow individual users to know whether thesystem is delivering; in effect, there are few if any quality control systems and there is cer-tainly no management of value-for-money. Under these circumstances, it seems unwise toattempt to simply spend one’s way into quality.Yet, this seems to be the dominant tendencyin Peru. The key social pact in the education sector—created in the last few years—has onlyone numerical goal: spending. It does have some quality goals, but these are not numeri-cally specified and there is no general consensus on what they ought to be. Additionally, nocausal mechanism is posited, in these policies and plans, between spending increases andthe quality improvement that is hoped for. Finally, it is apparent that the relatively lowspending on education in Peru is not a matter of sectoral prioritization within the publicbudget but instead an issue of low fiscal effort. Thus, while Peru may ultimately have tospend more on education in order to improve quality, this spending is likely to be very dif-ficult to generate and also hard to manage properly under current conditions. Part of thelow fiscal effort is likely due to the fact that economic authorities and the taxpayers distrustthe public management of quality in service provision. Thus, a more fruitful way to proceedis likely to first require an improvement in quality control systems and quality managementsystems geared at generating confidence in the tax-paying public and in the economicauthorities that the spending can be well-managed.
xiv Executive Summary

Policy Recommendations
Given the diagnosis outlined above, the following policy recommendations come to the fore.
Standards
First, Peru needs to establish much clearer and more specific learning standards.1 Speci-ficity needs to refer to both the grade level and clarity of goals. For example, goals shouldexist at a minimum by grade, and ideally by semester. Goals should be stated in specificterms, such as measuring levels of comprehension, fluency, and specific numerical skills.Standards should be simple enough so that parents and teachers can understand them.Plenty of examples need to be created and distributed so that the actors can see the stan-dards embodied in materials. Reading materials of standardized grade or age appropriate-ness, suitable for take-home or pleasure reading, need to be created and distributed. Qualitygoals for secondary education could be embodied in a national secondary-school-leavingexam or certification. Peru also needs to establish service and process standards—meaningstandards of behavior (such as hours of effective and active learning per year) and forreporting to the clients—in a process of downward accountability of schools to commu-nities and of the Province-level School Management and Supervision Unit (Unidad deGestión Educativa Local, UGELs) to schools. Provision standards need to be developedwhereby, for example, funding formulas are developed for the national level to fund regionsand for regions to fund schools. Funding according to formulas is more transparent, equi-table and efficient than the current totally ad hoc funding (if the formulas are simple andtransparent). For example, formulas could be based quite simply on enrollment and poverty.Finally, clear and rigorous standards for teachers are needed as part of a strategy for upgrad-ing teacher quality significantly over time. Standards for both recruitment and professionalbehavior should be used, and can include the accreditation of teacher training approachesat colleges and universities. These standards should include subject-matter knowledge andcould be incorporated in the Carrera Pública Magisterial or its regulations.
The need to create standards is related to the need to develop a culture of evaluationin Peru. There is currently a pervasive fear in Peru’s education sector of anyone being
Executive Summary xv
1. Since the word “standards” is used throughout this document, it is important to offer some def-initions. First, in the context of learning, by “standards” we mean both a system of measurement or“metrics”, such as a way of measuring a student’s performance (e.g., words read correctly per minute),as well as a specific numerical goals to be achieved (e.g., being able to read 60 words per minute by theend of grade 2) or non-numerical skills to be learned (e.g., learning letter-sound recognition). Othersuch metrics and goals exist, of course. Second, in the context of management and funding processes,we refer to standardized ways of proceeding, such as funding via formulas, as well as specific goals suchas saying that each school should receive so many soles per child for purchasing learning materials. Hav-ing standardized ways for schools to report on budget use to parents is another example of a processstandard. Third, in the context of bilingual education, we refer to standardization of languages ofinstruction in order to discuss the limits to standardization. It would be possible to state, each time theword or concept is used, the exact meaning intended. However, given the pervasiveness of the use of theconcept, it would also be tedious. The expectation is that the context will make it clear enough. In anycase, what the appropriate notion of standard might be is open to discussion and interpretation. Forexample, while we believe we should recommend that children be able to correctly read 60 words perminute by the end of grade 2 (a standard as an actual goal), the policy dialogue process in Peru mightdetermine that for now it is wisest simply to get teachers to track students on this measurement and tryto improve it (a standard as a metric).
evaluated. This creates a vicious cycle. The fear of failure creates a fear of evaluation, butthe lack of evaluation condemns almost all efforts to failure, because there is no seriousway to detect when anything is going wrong. Failure and lack of evaluation against anykind of standard become mutual self-fulfilling prophecies and create an environment ofintense pessimism, fatalism, and non-accountability. The fear of evaluation and stan-dards has been turned into a virtue, and it has become popular to question evaluationand measurement as intellectually suspect, non-modern, regressive, or inequality-inducing.This pessimism, however, is most likely largely unjustified. It is shown in this study thatthere are many schools that perform well, and that high expectations are often met by highperformance. Having clear and reasonably high expectations is an important way to breakthe vicious cycle of pessimism and the games of blame-the-child or blame-society thatseem to be pervasive in Peru.
Accountability
Second, Peru needs to develop much clearer lines of accountability pressure and consumeror parental power. Without accountability pressure and rewards (“incentives”), agents willnot come to standard (and without standards, accountability pressure is unable to deter-mine what direction to seek). Given the situation of low accountability that has developedin Peru over the past decades, most teachers will not, for example, spend the hours of effortrequired to come to standard if they are not supervised and motivated by both communi-ties and bureaucracy, and if expectations are not made clear. Some will make the effortneeded and already do so, motivated by intrinsic professionalism and pride (as docu-mented in this report); most, however, neither make the effort now nor will do so in thefuture unless accountability patterns are changed. Parents should have more say in whathappens in schools, helping to decide on issues such as the use of school budgets and theselection of teachers and careers. Options such as giving parents a statutory majority onthe School Governing Council (Consejo Educativo Institucional, CEIs) and giving the CEIsmore power in determining teacher selection and teacher evaluation should be considered.Another alternative could be to give more power to the APAFAs to demand quality account-ability in various ways, including teacher appraisal. The right of parents to have their chil-dren learn to a certain standard should be strongly disseminated and discussed. Animportant tool of accountability will be to strongly encourage the less motivated and capa-ble teachers to leave the profession (or even find ways to dismiss them). This would increasethe turnover rate and would allow new teachers into the system, and if the latter have metknowledge standards, the quality of the profession would improve faster. Finally, more sys-temic and evaluated experimentation in outsourcing of education for the poor, such as theFyA model, should be carried out, though it would be naive to expect any miracles fromthis experimentation for reasons documented later in this report.
Support
Third, support needs to be improved so that actors can come to standard. Accountabilitypressure and the specification of standards are not enough if agents lack appropriate infor-mation and the ability to come to standard in the first place. Pressure without outlets will onlyfrustrate agents and clients. However, more teacher support and training of the traditionalvariety will not be useful. Teacher training, both in-service and pre-service, has tended to be
xvi Executive Summary

too generic, too theoretical and (in the case of in-service training) too episodic, preciselybecause there are no sufficiently clear learning standards. Instead, much more specific in-service training is needed—training that accompanies the teacher throughout the year andwhich is focused on orienting the teacher in the year-long process to help students achieveannual learning goals. In short, the training needs to be child-centered, not teacher-centered.Similarly, much more and better learning materials, in particular reading materials,libraries, stationery, and supplies are required. Both of these types of support will be expen-sive. Thus, general financial support is also needed; education expenditure as a share ofgross domestic product (GDP) will likely have to increase. However, this should not takeplace until standards and accountability systems are created and functioning. Most of thefirst tranches of any increased spending should be focused on the development and capac-ity building needed to implement these systems. Support itself needs to be standardized.For example, intergovernmental funding systems and school grants should be set in termsof simple formulas that are transparent and clear in their intent, perhaps with only twodrivers: enrollment and poverty.
Executive Summary xvii

This chapter lays out the main indicators characterizing Peru’s education system.Coverage, learning results, and equity are the focus.
Coverage
Looked at from any angle, Peru has achieved an impressive degree of education coverage.Table 1.1 shows the basic coverage data for the last few years in Peru and, where relevantor available, the most recent estimate for Latin America.
As can be seen, coverage in Peru is high compared to the rest of Latin America. Similarto other areas of Latin America with heavy indigenous presence, Peru is a little behind ongender equity. Even so, the gender equity index is 98 percent (and, at 94 percent for sec-ondary schooling, the situation is not much worse than in primary).
One can make more fine-tuned benchmarks than simply comparing to the median forLatin America. Most education coverage statistics are quite correlated—in internationalcomparisons—with income per capita, because educational development is part and par-cel (from both demand and supply sides) of overall social and economic development. Forexample, the correlation between the secondary net enrollment ratio and GDP per capitais 0.65 for Latin American countries.2 It is reasonable, therefore, to use GDP per capita asa way of fixing a reasonable level of expectation with regard to education indicators. Inalmost all cases, Peru’s coverage indicators are above the value one would expect based on
CHAPTER 1
Overview of Current Indicators
1
2. Secondary net enrollment ratio measured in 2000, GDP per capita in US$ in exchange rate termstaken at the geometric average of the 1990s. Secondary net enrollment ratio sourced from EDSTATS, GDPper capita from SIMA.

some measure of GDP per capita. Again, to use the net secondary enrollment rate as anexample, the expected value for Peru would have been 54 percent in 2000, but as shown inthe table above, the actual value was already 63 percent in 2000.3 Peru has had secondaryenrollment ratios (both net and gross) similar to, or higher than, those of countries withconsiderably higher per capita income, such as Mexico, Colombia, or Costa Rica.4 Similarly,
2 A World Bank Country Study
Table 1.1. Education System Coverage Data for Peru and Latin America as a Whole
LatinAmerica
PeruMost Recent
Available1998 1999 2000 2001 2002 2003 2004 Data
Gross Enrollment Ratios, public and private, not including adult education programs
Pre-primary 57% 57% 59% 60% 61% 60% 63% 58%
Primary 120% 121% 119% 118% 117% 116% 114% 110%
Secondary 82% 83% 86% 89% 90% 89% 90% 79%
Tertiary 29% 30% 30% 31% 32% 33% 33% 24%
Net Enrollment Ratios, public and private
Pre-primary NA NA NA NA NA NA NA NA
Primary 100% 100% 100% 100% 100% NA NA 93%
Secondary 61% 62% 63% 67% 67% NA NA 69%
Tertiary NA NA NA NA NA NA NA NA
Completion proxies (enrollment in terminal year minus repetition that year)
Primary 97% 101% 98% 97% 95% 98% NA 93%
Secondary 58% 59% 56% 61% 63% 66% NA NA
Shares of private enrollment in total enrollment
Primary 13% 12% 13% 13% 14% 14% 14% 15%
Secondary 16% 16% 16% 16% 16% 17% 16% 24%
Tertiary 42% 41% 40% 41% 41% 43% NA NA
Gender parity index (ratio of female gross enrollment ratio to male gross enrollment ratio)
Primary and 97% 97% 97% 97% 97% 97% 98% 101%secondarytogether
3. The expected value has to be calculated for 2000 because this is the last year for which a largeamount of data for the rest of Latin America is available, and the expectation is based on looking at datafor all of Latin America.
4. Costa Rican data available at http://www.mep.go.cr/CuadroEscolaridadHistorico.html on November6, 2004. Mexican data available through the interactive software Sistema para el Análisis de la EstadísticaEducativa, Secretaría de Educación Pública. Colombian data available at http://www.mineducacion.gov.co/index2.html on November 6, 2004.
Sources: For Peru, derived from Ministerio de Educación, Unidad de Estadística Educativa, Cifrasde la Educación 1998–2004. For Latin America, EDSTATS. Data for Latin America are the medians,across all countries, of the most recent available data for each single country, thus the group averages are not used.
Peru’s expected primary completion rate in 2000 would have been 88 percent, but Peruhad already achieved 98 percent completion by 2000. Finally, at around 66 percent (the2003 values are an estimate) secondary completion is very high, which is to be expectedgiven how high gross tertiary enrollment is.
Not only are the coverage values high, but many of the coverage indicators have grownsomewhat faster than for the rest of Latin America in the period 1990 to 2001 (the last yearfor which there are comprehensive data for the whole continent). As Table 1.1 shows, mostindicators have risen over the last few years. Progress has been maintained, except in areaswhere further upward movement is not reasonable, such as in the gross enrollment ratiofor primary schooling.
Learning and Quality
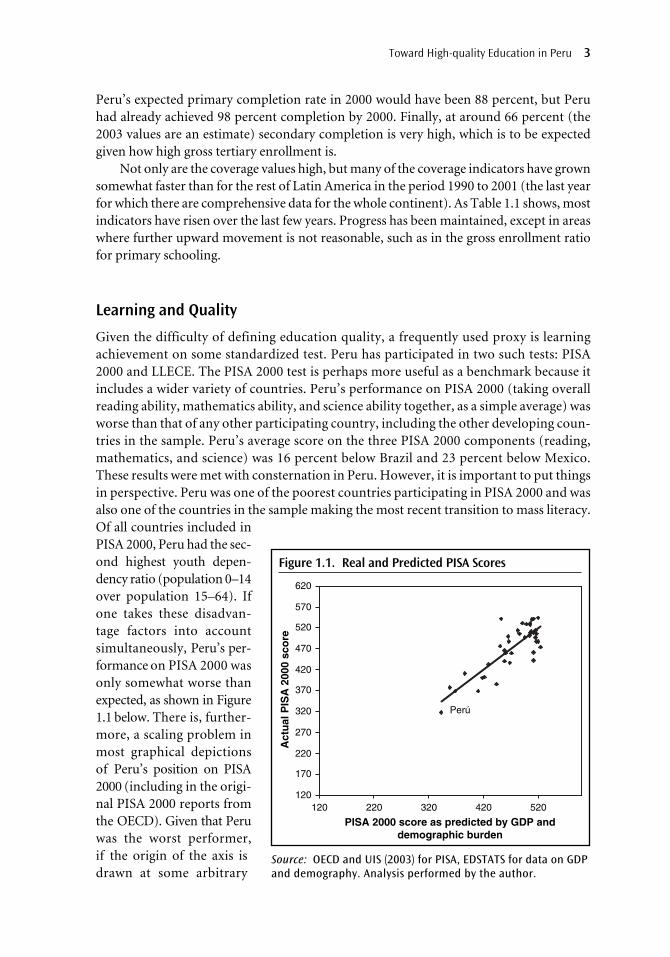
Given the difficulty of defining education quality, a frequently used proxy is learningachievement on some standardized test. Peru has participated in two such tests: PISA2000 and LLECE. The PISA 2000 test is perhaps more useful as a benchmark because itincludes a wider variety of countries. Peru’s performance on PISA 2000 (taking overallreading ability, mathematics ability, and science ability together, as a simple average) wasworse than that of any other participating country, including the other developing coun-tries in the sample. Peru’s average score on the three PISA 2000 components (reading,mathematics, and science) was 16 percent below Brazil and 23 percent below Mexico.These results were met with consternation in Peru. However, it is important to put thingsin perspective. Peru was one of the poorest countries participating in PISA 2000 and wasalso one of the countries in the sample making the most recent transition to mass literacy.Of all countries included inPISA 2000, Peru had the sec-ond highest youth depen-dency ratio (population 0–14over population 15–64). Ifone takes these disadvan-tage factors into accountsimultaneously, Peru’s per-formance on PISA 2000 wasonly somewhat worse thanexpected, as shown in Figure1.1 below. There is, further-more, a scaling problem inmost graphical depictionsof Peru’s position on PISA2000 (including in the origi-nal PISA 2000 reports fromthe OECD). Given that Peruwas the worst performer,if the origin of the axis isdrawn at some arbitrary
Toward High-quality Education in Peru 3
120
170
220
270
320
370
420
470
520
570
620
120 220 320 420 520
PISA 2000 score as predicted by GDP anddemographic burden
Act
ual
PIS
A 2
000
sco
re
Perú
Figure 1.1. Real and Predicted PISA Scores
Source: OECD and UIS (2003) for PISA, EDSTATS for data on GDPand demography. Analysis performed by the author.
point below Peru’s performance, then the gap between Peru’s performance and itsexpected performance, even controlling for various factors, appears very large. But this ispartly because the origin is arbitrary in most such depictions. In the figures below we haveused what we believe is a more reasonable origin.5 Thus, put into perspective, Peru’s aver-age performance is not as low as often thought. The real problems are elsewhere.
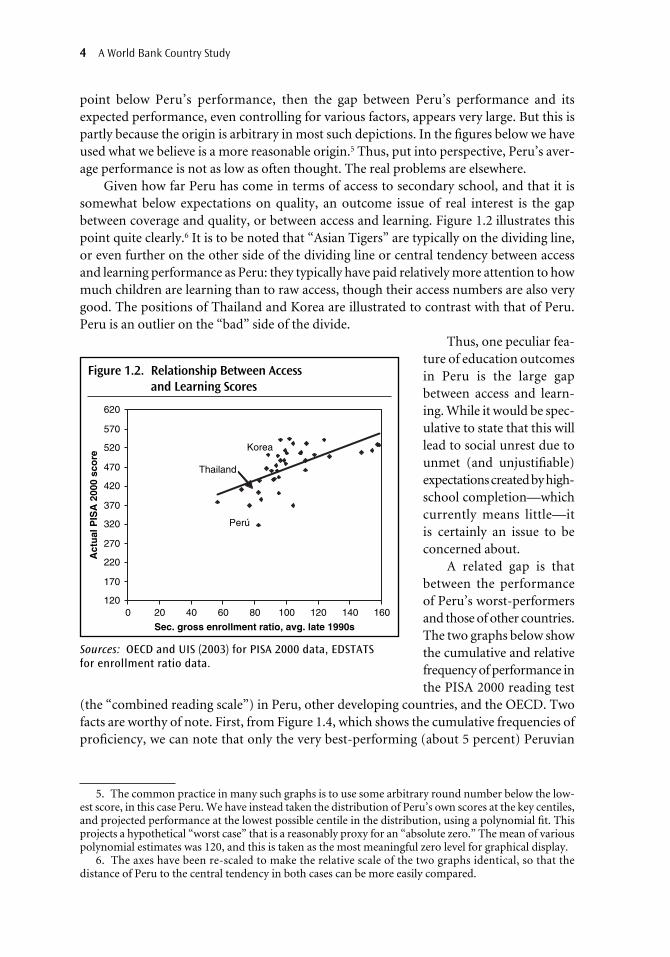
Given how far Peru has come in terms of access to secondary school, and that it issomewhat below expectations on quality, an outcome issue of real interest is the gapbetween coverage and quality, or between access and learning. Figure 1.2 illustrates thispoint quite clearly.6 It is to be noted that “Asian Tigers” are typically on the dividing line,or even further on the other side of the dividing line or central tendency between accessand learning performance as Peru: they typically have paid relatively more attention to howmuch children are learning than to raw access, though their access numbers are also verygood. The positions of Thailand and Korea are illustrated to contrast with that of Peru.Peru is an outlier on the “bad” side of the divide.
Thus, one peculiar fea-ture of education outcomesin Peru is the large gapbetween access and learn-ing. While it would be spec-ulative to state that this willlead to social unrest due tounmet (and unjustifiable)expectationscreatedbyhigh-school completion—whichcurrently means little—itis certainly an issue to beconcerned about.
A related gap is thatbetween the performanceof Peru’s worst-performersand those of other countries.The two graphs below showthe cumulative and relativefrequency of performance inthe PISA 2000 reading test
(the “combined reading scale”) in Peru, other developing countries, and the OECD. Twofacts are worthy of note. First, from Figure 1.4, which shows the cumulative frequencies ofproficiency, we can note that only the very best-performing (about 5 percent) Peruvian
4 A World Bank Country Study
120
170
220
270
320
370
420
470
520
570
620
0 20 40 60 80 100 120 140 160
Sec. gross enrollment ratio, avg. late 1990s
Act
ual
PIS
A 2
000
sco
re
Perú
Thailand
Korea
Figure 1.2. Relationship Between Access and Learning Scores
Sources: OECD and UIS (2003) for PISA 2000 data, EDSTATS for enrollment ratio data.
5. The common practice in many such graphs is to use some arbitrary round number below the low-est score, in this case Peru. We have instead taken the distribution of Peru’s own scores at the key centiles,and projected performance at the lowest possible centile in the distribution, using a polynomial fit. Thisprojects a hypothetical “worst case” that is a reasonably proxy for an “absolute zero.” The mean of variouspolynomial estimates was 120, and this is taken as the most meaningful zero level for graphical display.
6. The axes have been re-scaled to make the relative scale of the two graphs identical, so that thedistance of Peru to the central tendency in both cases can be more easily compared.

children perform in the range of the OECD average. But the most important issue is theunderperformance of Peru’s worst performers. More than half of Peruvian children are noteven at the first level of proficiency in reading ability. It is clear that countries that are devel-oping well educationally, and that have made well-recognized efforts to improve educa-tional quality, seem to have compressed the percentage of children at this level. This isvisible in the shape of both the cumulative and simple (Figure 1.3 frequency distributions.Thailand stands out as a good performer and, in Latin America, Mexico does as well.
Toward High-quality Education in Peru 5
0
10
20
30
40
50
60
<1 1 2 3 4 5
Per
cen
tag
es o
f le
arn
ers
PISA 2000 reading proficiency levels
Mexico
Peru
Thailand
Indonesia
Brazil
OECD total
OECD Average
Figure 1.3. Frequency Distribution PISA 2000 Reading Performance
Source: Graphed from OECD and UIS (2003).
Finally, of all countries in PISA 2000, Peru had the highest ratio of variance to averageperformance, taking mathematical literacy as the key index this time. Either this ratio, orthe ratio of performance at the 95th to performance at the 5th percentiles, can be taken asindices of educational inequality. We use the latter. As noted, Peru had the worst ratio foreducational inequality in the PISA 2000 sample. If one adds data for other countries fromother international mathematical tests, namely the TIMSS 1999 and 2003 (for a total of some14 developing countries, depending on how one counts), Peru’s performance on PISA2000 shows more inequality than any other country’s performance on any of these threeinternational tests, with the exception of South Africa’s performance on either TIMSS.Moreover, this index of educational inequality is, in most countries, fairly well correlatedwith the Gini coefficient of income inequality. Peru, however, is an outlier, as Figure 1.5shows: the level of educational inequality in Peru (at least by this measure) is considerablyabove what its level of income inequality in the 1990s would have predicted. It is possiblethat Peru is not an outlier. Perhaps Peru, along with a few other countries, is on a differentline determined by third factors not captured in this graphic. The other near-outlier country

on the chart is Israel (half as far above the line as Peru and at a Gini coefficient of about 35).Another country that would be an outlier (but whose data is from TIMSS rather than PISAso it is not graphed) is South Africa, with an educational inequality index, on this variable,of approximately 4.2, but a Gini coefficient of around 60. These facts (Peru, Israel to somedegree, and South Africa being outliers) suggest that there may indeed be some countriesfor which a special relationship is needed: there is, perhaps, a third dimension in Figure 1.5and Peru may lie on a well-fitted line in that dimension. This emphasizes the point that thereis something social or curricular about Peru’s educational inequality that goes beyond thesorts of generic economic inequalities normally associated with Gini coefficients. (An alter-native but equivalent interpretation is that sociological and cultural inequalities in Peru arenot well correlated with economic inequalities.) The thought that one may be in the com-pany of South Africa should be a sobering realization, given this country’s past and presentethnic divisions and tensions.
In summary, Peru has done well in expanding education coverage. Coverage levels arehigh compared to the rest of Latin America, and compared to what one would expect basedon GDP per capita. Not all children finish secondary school; only about 65 percent do. Thisnumber might be considered relatively high by Latin American standards, and is high rel-ative to the low quality of the education Peruvian students receive. Nonetheless, the issueof why students do not finish is of interest and is covered in Chapter 5. Peruvian childrenlearn somewhat less than one would predict given the country’s level of per capita GDPand its demographic burden. There is also a very large gap between coverage and learning.Peru has a definite problem in that it is producing large numbers of high-school graduateswith very poor cognitive skills. When countries produce as many secondary school grad-uates as Peru does, the cognitive skills of these graduates should be much higher than they
6 A World Bank Country Study
0
10
20
30
40
50
60
70
80
90
100
<1 1 2 3 4 5PISA 2000 reading proficiency levels
Cu
mu
lati
ve p
erce
nta
ges
of
lear
ner
s
Mexico
Peru
Thailand
Indonesia
Brazil
OECD total
OECD Average
Figure 1.4. Cumulative Frequency PISA 2000 Reading Performance
Source: Graphed OECD and UIS (2003).

currently are in Peru. The gap between numbers and skills may create a crisis of expecta-tions. In a related manner, there is a large gap between the percentage of children at verylow levels of proficiency in Peru and the percentages seen at the same level in other coun-tries (or, alternatively, the gap between those who learn the most in Peru and those wholearn the least is very large if one considers how low the average levels of learning are). Fur-thermore, this high level of educational inequality is not explainable in terms of Peru’soverall economic inequality. These are the outcome problems Peru has to contend with.The possible determinants of these problems are discussed in the following chapters.
Toward High-quality Education in Peru 7
0
0.5
1
1.5
2
2.5
3
3.5
4
4.5
0 10 20 30 40 50 60 70Gini coefficient from PISA database
Rat
io m
ath
emat
ical
lite
racc
y 95
th
vs.
5th
per
cen
tile
s P
ISA
200
0
Perú
Figure 1.5. Economic versus Educational Inequality
Source: Graphed from data in OECD and UIS (2003).


The previous chapter has argued that the remaining problems in Peru’s educationsector are largely related to learning achievement, and in particular to the low andextremely variable levels of learning achievement among the poor.
This chapter will argue that there is no shortage of lists of clear recommendationsabout how to improve the education system in Peru. There is also no dearth of researchstudies upon which to base policy recommendations. The strong implication is that basicknowledge about “what to do” is not, in general terms, much of a constraint to improve-ment. The chapter will then suggest that there are two real constraints. First, a lack of will-ingness to do what the research suggests should be done and second, a certain absence ofknowledge on how to do what needs to be done.
Stock of Peruvian Research on “What Works” in Schooling
A good stock of policy prescriptions already exists in Peru, as will be seen below. Thisstock of policy recommendations is not based on mere opinion. In the last decade thePeruvian literature on the factors associated with improved learning has grown quickly.The capacity of the education system, or of intellectuals vaguely associated with the edu-cation system, to diagnose itself is far greater than the system’s actual capacity to use thesediagnoses (through policy and administrative change), perhaps to a degree unusual inLatin America (see Table 2.1).
This literature is of high quality, and its conclusions are fairly firm—it is possible todiscern a common thread of explicit or implicit policy suggestions coming out of the
CHAPTER 2
Educational Diagnosticsand Recommendations
9

research. This section discusses the main findings. It does not pretend to cover the entirePeruvian literature on this subject, as many of the findings echo each other.7
The basic factors identified in this literature fall into four broad groups:
1. Poverty as such, but also a lack of attention to the needs of particular sub-populations,in particular the poor, and specifically the poor of non-Spanish-speaking origin.This lack of attention seems to have two dimensions. First, lack of appropriate cul-tural and pedagogical models that are proven to boost learning among the poorand those whose mother tongue is not Spanish. Second, the fact that the problemsof poor quality of teaching, and lack of standards and accountability, are worstamong the poor.
2. Poor quality of teachers, poor quality of teaching. These quality problems appear tobe fundamental, and appear to be related to basic lack of skills among teachers. Theseissues appear difficult to correct with traditional “teacher-training” methods, andmost likely have to do with teacher selection and motivation. As will be seen in latersections, added to this is an over-ambitious and conceptually complex curriculumthat is probably too difficult for teachers in rural areas to apply, at least with the cur-rently meager levels of problem-specific support (as opposed to superficial, genericin-service training).
3. Poor time-on-task, low coverage of the curriculum, low effort, all due to a lack ofstandards and standard enforcement, or a lack of accountability.
4. Lack of parental involvement, low accountability to parents, low ability of parentsto pressure schools on quality issues, partly due to a lack of standards.
Somewhat absent are strong research results that suggest scarcity of resources (aside fromscarcity of skilled teachers working devotedly) is a major problem. Some studies, along withour own analysis (shown below), do suggest a minor role for resources. As is shown in otherchapters of this report, if one looks at the school level, it is not clear that the poor are under-resourced, relatively speaking, in terms of the most expensive factors, such as the pupil-teacher ratio; it is clear, however, that they under-resourced in terms of capable teachers. It isalso shown that learning results are much more poorly distributed than, say, raw teacherresources (the pupil-teacher ratio). The apparent lack of relationship between raw resourcesand learning results may have two causes. First, in some cases there may indeed be no rela-tionship. This is likely the case with teacher costs, because teacher costs, in the current com-pensation scheme in Peru, do not reward teacher quality. Second, studies of the type shownbelow rely on variation in order to estimate effects. If all schools get more or less the same
10 A World Bank Country Study
7. In general, results in Table 2.2 and Table 2.3 are reported only if they are statistically significant atthe 5 percent level or better, and if they tend to show up in more than one subject matter and in more thanjust one or two model specifications. Factors tending to appear only in one study, or in one subject, or inone model specification, are not reported. In cases where there are several variables that have a signifi-cance level worse than 5 percent, but better than 10 percent, and are most likely highly correlated witheach other, we suspect multi-collinearity and report the factor in any case (e.g., if father’s education,socioeconomic status, expectations that the student will complete secondary school, and expectations thatthe student will attend university all appear with low significance, we assume all of these largely refer tosocioeconomic status and report the latter). None of these analyses carry out a cost-effectiveness analysisof the identified factors.

amount of supplies (for example, if all schools get the basic textbooks, or if none do) then itis difficult to identify an impact from the presence or lack of textbooks. This does not meanthat textbooks are unimportant, it simply means that their importance is hard to ascertainfrom quantitative studies of this sort. In short, while much research exists, it is important totake the results cautiously, particularly on the resource issue.
The resource issue raises one additional problem or puzzle. Poverty and socioeco-nomic status (SES) matters a great deal in determining learning results. In some studies,and in our own re-analysis of the data (shown below), poverty and general SES mattermore than anything else in explaining learning results. Why, then, do public resources,which could be considered a way of making up for poverty or lack of private resources,seem not to matter as much? Aside from the possibilities already mentioned immediatelyabove, the answer to this is unfortunately not clear, but we hypothesize it has to do withthe fact that even private spending among the poor is not very efficient because consumersare underinformed or misinformed by their schools, whereas private spending among thebetter off is more efficient because this group finds ways to get reasonably standardized ser-vices and manages to establish comparative information about schools even if the govern-ment does not provide it (perhaps the fact that the less poor are more urban helps establishinformal performance information and more competition between schools, as urban schoolsare much less able to establish a monopoly over their students). This issue is explored insubsequent chapters.
In order to summarize as many of these variables as is possible in one single source, andto give a direct flavor of what the research tends to show, we analyzed what is probably themost complete data set on schooling results and their determinants, the 2001 national eval-uation results for 4th grades primary and secondary for Spanish (“comunicación integral”)and Mathematics (“lógico-matemática”). This was done using Hierarchical Linear Model-ing (HLM). A summary of the results is presented in Table 2.2 and in Table 2.3.8 For vari-ables whose p-value is less than 0.01 and whose standardized coefficient is greater than 0.05,we also classified the variables into just four broad groupings to make the results more intel-ligible. These classifications are shown. Finally, we then counted the number of times thebroad groupings show up as correlates of learning in the four sets of results (mathematicsand Spanish, in 4th grade primary and in 4th grade secondary). This final count provides agood snapshot of the broad issues that appear to be shaping learning results, at least accord-ing to this one instrument. Furthermore, these results are fully consistent with the review ofexisting literature already discussed above. The broad factors are:
1. Poverty and socioeconomic issues: 13 cases2. School and classroom management, pedagogy, having norms and standards: 10 cases3. Ethnic and gender disadvantage (above and beyond poverty): 5 cases4. Resources and resource use: 3 cases
Toward High-quality Education in Peru 11
8. Variables that apply at the pupil level are symbolized with a (P), since we have not followed the tra-ditional practice of segregating the school vs. student-level variables in the presentation. In this table, theresults were first sorted by level of significance. Then, in order to be as rigorous as possible, variables whosep-value is less than 0.01 were sorted by the size of the standardized coefficient, that is, the “substantive”level of significance. Thus, variables with standardized coefficients greater than 0.05 and p-value less than0.01 are sorted by the size of the standardized coefficient, whereas variables with p-value not less than 0.01are simply sorted by the p-value.

12A W
orld Bank Country Study
Sources of evidence and range ofFactor Discussion application of the research Possible policy implications
Table 2.1. Factors Associated with Improved Learning Results in Peru
Coverage of the curriculum.
Use of materials pro-vided by Ministry, lack of materials other than textbooks.
Gender.
Date school opens
Coverage is very low but low cover-age does not appear very relatedto poor achievement in a fewstudies, perhaps because highercoverage with poor quality doesnot add to achievement.
Materials are distributed but under-used. Coverage (percent of mate-rials used) is associated withachievement. In addition materi-als arrive late. Learning materialsare reported to be not veryusable or used. Other suppliesand stationery are not supplied.
Being male is associated withhigher achievement, all otherthings being controlled for, par-ticularly in mathematics.
Positively associated with achieve-ment. Most likely a proxy foroverall good management andtime on task.
Cueto, Ramírez, León, and Pain (2003); 6thgrade mathematics, Lima. Multivariateanalysis.
Equipo de Análisis de la Unidad de Mediciónde la Calidad Educativa (2004). Multivari-ate analysis.
Galindo (2002). Multivariate analysis.
Cueto, Ramírez, León, and Pain (2003); 6thgrade mathematics, Lima. Multivariateanalysis.
Data from the present report suggest thatstudents do not recognize text from thereading materials and the materials arelate. Based on non-random but “represen-tative” quantitative sample and field visits.
Hunt (2001). Expert opinion based on non-random sample, non-quantitative samples.
Cueto, Ramírez, and León (2003). Languageand mathematics, Lima and Ayacucho,3rd and 4th grades. Multivariate analysis.
Cueto, Ramírez, León, and Pain (2003); 6thgrade mathematics, Lima. Multivariateanalysis.
Benavides (2002). Multivariate, large sample.
Equipo de Análisis de la Unidad de Mediciónde la Calidad Educativa (2004). Multivari-ate analysis.
Cueto and Secada (2001). Multivariateanalysis.
Poor teacher preparation for certainareas, poor accountability andsupervision.
Review and assess use and appropri-ateness of materials, reform andredesign materials.
Pedagogical practices might discrimi-nate against girls. Cultural expecta-tions may also play a role.
Policies on time-on-task (campaignfor 1000 hours of effective instruc-tion) exist but are weakly enforced.
Toward H
igh-quality Education in Peru13
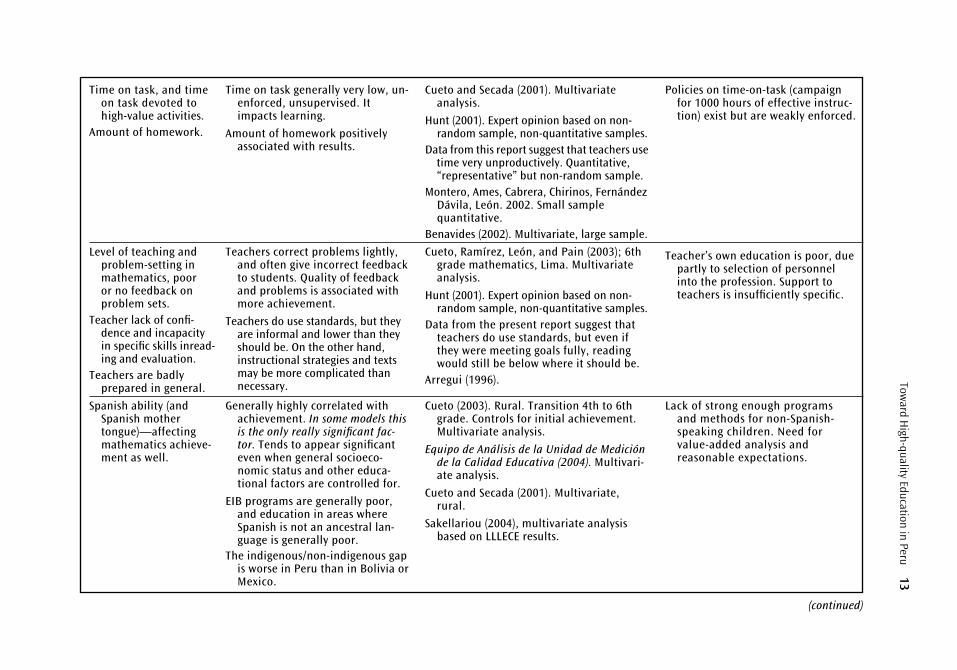
Time on task, and time on task devoted to high-value activities.
Amount of homework.
Level of teaching and problem-setting in mathematics, poor or no feedback on problem sets.
Teacher lack of confi-dence and incapacityin specific skills inread-ing and evaluation.
Teachers are badly prepared in general.
Spanish ability (and Spanish mother tongue)—affectingmathematics achieve-ment as well.
Time on task generally very low, un-enforced, unsupervised. Itimpacts learning.
Amount of homework positivelyassociated with results.
Teachers correct problems lightly,and often give incorrect feedbackto students. Quality of feedbackand problems is associated withmore achievement.
Teachers do use standards, but theyare informal and lower than theyshould be. On the other hand,instructional strategies and textsmay be more complicated thannecessary.
Generally highly correlated withachievement. In some models thisis the only really significant fac-tor. Tends to appear significanteven when general socioeco-nomic status and other educa-tional factors are controlled for.
EIB programs are generally poor,and education in areas whereSpanish is not an ancestral lan-guage is generally poor.
The indigenous/non-indigenous gapis worse in Peru than in Bolivia orMexico.
Cueto and Secada (2001). Multivariateanalysis.
Hunt (2001). Expert opinion based on non-random sample, non-quantitative samples.
Data from this report suggest that teachers use time very unproductively. Quantitative,“representative” but non-random sample.
Montero, Ames, Cabrera, Chirinos, FernándezDávila, León. 2002. Small samplequantitative.
Benavides (2002). Multivariate, large sample.
Cueto, Ramírez, León, and Pain (2003); 6thgrade mathematics, Lima. Multivariateanalysis.
Hunt (2001). Expert opinion based on non-random sample, non-quantitative samples.
Data from the present report suggest thatteachers do use standards, but even ifthey were meeting goals fully, readingwould still be below where it should be.
Arregui (1996).
Cueto (2003). Rural. Transition 4th to 6thgrade. Controls for initial achievement.Multivariate analysis.
Equipo de Análisis de la Unidad de Mediciónde la Calidad Educativa (2004). Multivari-ate analysis.
Cueto and Secada (2001). Multivariate,rural.
Sakellariou (2004), multivariate analysisbased on LLLECE results.
Policies on time-on-task (campaignfor 1000 hours of effective instruc-tion) exist but are weakly enforced.
Teacher’s own education is poor, duepartly to selection of personnelinto the profession. Support toteachers is insufficiently specific.
Lack of strong enough programsand methods for non-Spanish-speaking children. Need forvalue-added analysis andreasonable expectations.
(continued)

14A W
orld Bank Country Study
Table 2.1. Factors Associated with Improved Learning Results in Peru (Continued )
Sources of evidence and range ofFactor Discussion application of the research Possible policy implications
Socioeconomic status of family.
Cultural capital in the home (e.g., number of books).
Child labor.
Level/quality of teacher training.
Resources such as school libraries, reading materialsat home, etc.
Parental involvement in homework.
Often quite correlated with achieve-ment. Probably co-linear withSpanish ability or language spokenat home, but often has significanceindependent of the latter.
In some studies this is the mostimportant measurable factor indriving student learning.
Associated with increasedachievement.
Negatively associated with achieve-ment even when socioeconomicstatus is controlled for.
Somewhat associated with achieve-ment. Could be a proxy for overallgeneral knowledge and status ofteachers.
Some impact from these factors isfound, as would be expected. Manyof these factors probably have aneffect, but the statistical significanceis masked by the presence of otherfactors that are correlated, such associoeconomic status of the family.
Could be a proxy for parental involve-ment in general.
Cueto, Ramírez, and León (2003). Languageand mathematics, Lima and Ayacucho,3rd and 4th grades. Multivariate analysis.
Benavides (2002). Multivariate, large sample.
Data analysis for this report in Table 2.2and Table 2.3.
Benavides (2002). Multivariate, large sample.
Equipo de Análisis de la Unidad de Mediciónde la Calidad Educativa (2004). Multivari-ate analysis.
Cueto (2003). Rural. Transition 4th to 6thgrade. Controls for initial achievement.Multivariate analysis.
Benavides (2002). Multivariate, large sample.
Evidence in analysis carried out for thisreport as presented in Table 2.2 and inTable 2.3.
Equipo de Análisis de la Unidad deMedición de la Calidad Educativa (2004).Multivariate analysis.
Lack of compensatory mechanismsand resource targeting. Need forvalue-added analysis and reason-able expectations.
Lack of compensatory programs andresource targeting. Need for value-added analysis and reasonableexpectations.
Lack of compensatory mechanismsand resource targeting. Need forvalue-added analysis and reason-able expectations.
Teacher recruitment and retention.
Unclear. Conclusion should not bethat material inputs do not matter,but that total resources, as opposedto specific resources, are a factorof secondary importance comparedto the management of thoseresources.
Parental involvement in the past hasgenerally been postulated as involv-ing only assistance with infrastruc-ture. Need for value-added analysisand reasonable expectations.

Toward H
igh-quality Education in Peru15
Spanish (Comunicación Integral ) 4th Grade Primary Mathematics (Lógico-Matemática) 4th Grade Primary
Std Coeff, Broad Std Coeff,
Broad Grouping Variable Sig Grouping Variable Sig
SES
SES
SES
Resources
Ethnic/Gender
Management
Management
SES
Management
Resources
SES
Percent variation explained
Table 2.2. Results on Determinants of Learning Based on 2001 National Evaluation
Socioecon index school
Rural
Socioecon index pupils (P)
School infrastructure index
School in bilingual area
Public School
Curriculum Coverage
Whether pupil works Mon-Fri (P)
Time spent by teacher preparing classes as% of total time worked
School materials index
Mother’s education (P)
Total teaching experience
Number of training courses taken byteacher per year
Percent repeaters
Father’s education (P)
Frequency of use of books in classroom bythe teacher
Teaching experience at school
Student’s first language is Spanish (P)
Parental satisfaction
Expectation student will finish secondaryschool (P)
0.259***
−0.138***
0.116***
0.116**
−0.102***
−0.089**
0.086***
−0.084***
0.064***
0.057**
0.052**
0.04*
0.006*
−0.052*
0.036*
0.034
−0.033
0.036
0.052
0.023
59%
SES
Management
SES
Ethnic/Gender
SES
Ethnic or Gender
Management
Ethnic/Gender
Management
Percent variation explained
Socioecon index school
Parental satisfaction
Socioecon index pupils (P)
School in bilingual area
Whether pupil works Mon-Fri (P)
Gender (P)
School starts year on time
Student’s first language is Spanish (P)
Time spent by teacher preparing classes as % oftotal time worked
Teacher experience at school
Father’s education (P)
Expectation student will continue to tertiary (P)
Percent curriculum covered
Percent repeaters
Month school received books
Complimentary curriculum
Public School
School infrastructure index
Expectation student will finish secondary (P)
Number of books in the household (P)
Number of math tests
Number of siblings (P)
0.387***
0.106**
0.088**
−0.078**
−0.073***
0.072***
0.064**
0.054**
0.053**
0.048***
0.047**
0.037*
0.049*
−0.076*
−0.055*
0.052*
−0.057*
0.082*
0.028*
0.03
0.044−0.021
67%

Spanish (Comunicación Integral) 4th Grade Secondary Mathematics (Lógico-Matemática) 4th Grade Secondary
Std Coeff, Broad Std Coeff,Broad Grouping Variable Sig Grouping Variable Sig
SES
SES
Resources
Management
Percent variation explained
Table 2.3. Results on Determinants of Learning Based on 2001 National Evaluation
Socioecon index school
Expectation student will continue totertiary (P)
School materials index
Public School
Pupil works weekends (P)
Number of books in the household (P)
Curriculum Coverage
Student’s first language is Spanish (P)
Time pupil spends getting to school (P)
Gender (P)
Age (P)
Student works Monday-Friday (P)
Father’s education (P)
School starts year on time
Complimentary curriculum
Coast
Parental satisfaction
Rural
0.499***
0.219***
0.065**
−0.063**
−0.042***
0.039***
0.037**
0.026**
0.026***
0.026**
−0.025**
−0.02**
0.021*
0.035*
0.03*
−0.032*
0.03
−0.025
49%
SES
Student
Ethnic/gender
Management
SES
SES
Management
Management
Percent variation explained
Socioecon index school
Whether student likes Mathematics (P)
Gender (P)
Public School
Coast
Expectation student will continue to tertiary (P)
Percentage of developed curricula competencies
Management of curricula contents (in percentages)
Number of books in the household (P)
Age (P)
Teacher experience
Father’s education (P)
Parental satisfaction
Student’s first language is Spanish (P)
No. of training courses taken by teacher since 1998
Parents help with homework (P)
School infrastructure index
Student works weekends (P)
Mother’s education (P)
0.356***
0.141***
0.1***
−0.089**
−0.083***
0.075***
0.069***
0.053**
0.048***
−0.022**
0.047*
0.022*
0.049*
0.017*
0.034
0.037
−0.042
−0.013
−0.014
45%
16A W
orld Bank Country Study

It should be noted that poverty is far and away the most important determinant inalmost all cases. In almost every case, it has the highest statistical or substantive significance.
The data source used, unlike those used in other studies such as Cueto and Secada(2001), Cueto, Ramírez, León, and Pain (2003), or Hunt (2001), does not allow a fine-grained look at issues related to the quality of instruction. Even so, issues of standards andschool and classroom management appear high on this list. It is likely that if these factorshad been taken into account in this survey, then issues related to school and classroommanagement and pedagogy would appear higher on this list.
It is likely that all these factors interact. For example, the lack of norms and standards(such as poor time on task) is probably worse among the poor. Similarly, the lack of provenpedagogical models is worse for those whose mother language is not Spanish. Thus, thedisadvantages are cumulative, and it is easy to understand why children who are poor,whose mother language is not Spanish, and whose teachers are not very devoted and donot know how to use an effective pedagogy, are not learning much. Later chapters will doc-ument these issues in much more detail.
Existing Stock of Policy Suggestions
The Peruvian education system responds to policy suggestions, albeit incompletely, witha considerable lag, and more in certain areas than in others. For example, in the past fewyears there has been considerable progress in certain areas. Quality measurement, as prox-ied by learning achievement, albeit on a sample basis, has been implanted. (Though itsfunding tends to be dependent on outside influences.) General management informationsystems, such as enrollment counts and basic indicators, have greatly improved. Similarly,there have been improvements in payroll management, clean-up of ghost teachers, andsome rationalization of teacher supply so that it matches enrollment-based needs. Theseare responses to obvious need and to policy recommendations made in the early throughlate 1990s.
There are many current lists of policy suggestions, including quite a few that have notyet been taken up. These vary from those produced by Peruvian and individual foreignexpert analysis and opinion, to those based on international organizations’ analyses, tothose derived from consensus-building and large-scale consultation exercises within Peru.Most of these converge on a fairly consistent set of recommendations. Just in the 1990s and2000s, one can cite World Bank (2001), Alcázar (2004), Hunt (2001), PREAL (2003),Francke (2004), Rodríguez (2004), Rivero (2004), Vega (2004), and, Foro del AcuerdoNacional (2004) as examples of sets of policy suggestions. Table 2.4 is laid out so as toemphasize the range of agreement of all the various diagnostics and sets of recommenda-tions. In the table, the fact that a symbol does not appear under an author’s name does notimply the author does not support the idea; it simply implies that he or she does not dis-cuss it—some of the papers do not present comprehensive lists of what the author thinksought to be done to improve the system. In some cases (see for example, Cruz, Espinosa,Montané, and Rodríguez 2002), the authors do not lay out recommendations as such onthe topic in question, but their description of a problem is so pointed and specific that itcan be taken as an implicit recommendation. Finally, in a few cases, the interpretation ofthe authors’ recommendations is not clear. This is symbolized with a question mark.
Toward High-quality Education in Peru 17

18A W
orld Bank Country Study
Cruz,Espinosa,
Foro Montané,Acuerdo and World
Alcázar Hunt PREAL Nacional Francke Rodríguez Vega Bank RiveroIssue (2004) (2001) (2003) (2004) (2004) (2002) (2004) (2001) (2004)
Establish more detailed andclearer performanceexpectations and standards. ✓ ✓ ✓ ✓ ✓ ✓
Increase capacity to demandand use standardized achievement testing, perhaps universalizetesting in somegrades,some recommenddissemination ofschool-wiseinformation. ✓ ✓ ✓ ✓ (?) ✓ ✓
Make schools and teachers more accountable toparents and/or principals,including input intoteacher evaluation byparents and principals. ✓ ✓ ✓ ✓ ✓
Increase spending on education. ✓ ✓ ✓ ✓
Target spending toward thepoor, create more targetedprograms, not just targetedspending. ✓ ✓ ✓ ✓ ✓
Clarify and finalize powers and functions under decentralization, including school autonomy, with fully specified responsibilities. ✓ ✓ ✓ ✓
Table 2.4. Summary of Policy Recommendations in Some Key Peruvian Literature and Literature on Peru

Toward H
igh-quality Education in Peru19
Improve teacher pay (in some cases stated thus, in other cases stated only in relationto performance or specificskills). ✓ (?) ✓ ✓ ✓ ✓
Simplify teacher reward system, make it more based on some measure of performance, including school-level evaluations. ✓ ✓ ✓ ✓ ✓
Rationalize and accreditpre-service teacher training, make it more selective. ✓ ✓ ✓ ✓
Increase coverage of pre-primary schooling. ✓ ✓ ✓
Evaluate existing and past pilot projects and initiatives,and force accountability to absorb lesson that work and reject those that do not. ✓ ✓
Simplify and clarify organization of the sector. Re-orient it so it serves the pedagogical functions. ✓ ✓
Ensure communitarian or administrative systems to guarantee attendance of teachers and students. ✓ ✓
Take steps to ensure continuity of policies and perhaps of Ministers. ✓
Social mobilization around learning, specifically reading ✓
(continued)

20A W
orld Bank Country Study
Cruz,Espinosa,
Foro Montané,Acuerdo and World
Alcázar Hunt PREAL Nacional Francke Rodríguez Vega Bank RiveroIssue (2004) (2001) (2003) (2004) (2004) (2002) (2004) (2001) (2004)
Table 2.4. Summary of Policy Recommendations in Some Key Peruvian Literature and Literature on Peru (Continued )
Focus in particular on early literacy throughexpectations and programs. ✓
Establish better methods andtools, including morereliable and standardizedapproaches, for educationin non-Spanish-speakingareas. ✓ ✓
Clarify formulas for resourceallocation to sub-national entities. ✓
Ensure competitive selectionand evaluation of sector managers. ✓
Develop more specific, problem-oriented teacher support, instead of generic in-service training. ✓

The most important conclusion to be derived from the analysis of the table below isthat perhaps half of the recommendations have to do with accountability. This is not sur-prising given the research results discussed above. The rest have to do with support. How-ever, both effective support and accountability require standards, and accountabilityrequires the existence of measurement. Support also requires standards, given that it oughtto be directed at helping actors perform to standard. Without standards it is difficult to saywhat the training and support should be about, and whether it has achieved anything.Thus, a close analysis of, and reflection on, the recommendations imply, as a foundation,a focus on: a) developing standards, b) improving mechanisms to hold service providersaccountable for meeting standards, and c) improved support to help providers come tostandard. A few recommendations, such as increased expenditure, or more emphasis onearly childhood education, do not relate to either accountability or standards.
It is also important to note where there tends to be a lack of consensus. The more offi-cial documents tend to relatively underemphasize issues of standards, and tend to empha-size resource provision, narrower curricular and support matters, and more ambitiousstyles of pedagogy (for example, integration of areas of knowledge, critical thinking aboutlearning itself, as themes in the curriculum). Almost all of the more official recommenda-tions as to policy actions are purely qualitative or directional, and do not represent quan-titative goals, except, pointedly, those that refer to more funding (for example, Foro delAcuerdo Nacional 2004, which sets a quantitative spending goal, but is silent on any quan-titative results that could be delivered for this spending). Analysts coming from think tanksand academic environments, on the other hand, tend to emphasize some form of standardsor accountability.
An important point to note with regard to Table 2.4 is that there is some disagreementbetween the best research and the policy recommendations. For example, the issue of specificsupport to teachers (how to teach to standards) to accompany improved or more spe-cific standards tends to receive clear and strong attention from only one of the policy-recommendation authors as shown in the table, whereas the same issue receives quite a bitof attention from authors writing up research or empirical findings (Table 2.3 above).
Remaining Impediments
The evidence presented in the previous two sections suggests that at this point the mainconstraint to improved education results in Peru is not more research and more policyanalysis—at least not along the lines already carried out. There is already a large stock ofresearch-based suggestions. There is also a reserve of pilot projects and experiments. In theEIB area alone, for example, there are at least ten projects from which more could belearned, or could have been learned had these projects been more thoroughly evaluated(see Chapter 8).
There are some remaining knowledge problems, and a major policy problem.First, it is true that there are some lacunae in knowledge. There seem to be three main
types of knowledge lacking. First, as already noted, little of the research and few of the policyprescriptions have anything to say about the cost-effectiveness of various proposed inter-ventions. Knowledge of the factors that affect learning, and hence important policy pre-scriptions, do exist. But these have not been ranked in terms of potential cost-effectiveness
Toward High-quality Education in Peru 21

based on Peruvian research. It would be a time-consuming task, though not scientificallydemanding, to carry out some type of meta-analysis of the various “production function”studies that have been done, attach benefits to the impacts, assess the cost of the proposedchanges, and propose some prioritization.
Second, few of the studies focus on the management and institutional economic issuesthat will have to be resolved if the problems are to be confronted. That is, most of the “pro-duction function” studies identified above (including our own analysis of the 2001 nationalevaluation results) tend to identify the “what” issues. However, there is little analysis of themanagerial and policy issues that are blocking action on the “what” issues, which is par-ticularly disturbing if those “what” issues appear so clear. The “how” is relatively under-researched, though a few analysts such as Hunt (2001) have looked into the issue. Asbackground for this report, some research on institutional management or “how” issueswas done at the school or classroom level. This area of work needs to be further developedin Peru, though it is not clear that a whole new industry, similar to that which has emergedon the “what” issues, needs to develop. A few well-done studies at two levels (classroomand school, and system) will go a long way.
Third, there are few truly successful and well-evaluated experiments that put the keypolicy recommendations to work and show unmistakable, large-scale, systemic improve-ments in learning achievement. It is known that there are schools that produce good resultseven though their clientele is poor. There have been a few donor or NGO projects that haveproduced improved results in a few schools. However, few (none that could be found forthis report) projects have had large measured impacts on student achievement in a wholesystem or sub-system (a whole district or province). Thus, there are few credible modelsof systemic interventions that truly work in driving cognitive development among the poor.
The most significant problem that remains is coming to clear policy agreements on thedeterminants of learning and implementing solutions over an extended period. Comingto agreement on standards, management, accountability, and the needed spending, andthen developing stable management teams (from the Ministerial level down to the schoolprincipal level) to lead the implementation effort over many years, appears to be, thus far,less attainable than producing knowledge. The following chapter suggests some reasons forthese kinds of failures.
22 A World Bank Country Study

Previous chapters have explained that at this point in time, Peru’s main problem inthe education sector is quality, and more specifically, providing quality educationto the poor. Chapter 2 also noted that there is no shortage of technical suggestions
and solutions. It seems, therefore, that the problems that remain are problems of “polit-ical will”, or accountability. This report takes as its point of departure an accountabilityframework that proposes that for any social system (education in this case) to work wellthere has to be a well-defined and well-exercised framework of mutual accountabilitiesbetween three (or four, depending on how one counts) sets of actors, as set out in Figure3.1. The figure is sometimes referred to as “the accountability triangle.” The accountabil-ity framework used in this section is an elaboration of the framework used in variousrecent World Bank reports (see Fiszbein 2004; World Bank 2003).
The three key sets of actors are: a) the State (including its regional or subnational man-ifestations), which includes politicians and policymakers in both the legislative and exec-utive branches, b) the service providers (which could be subdivided further into organizationssuch the ministerial bureaucracy, regional bureaucracies such as DREs and UGELs), andthe actual service providers such as schools, and c) the citizens or clients of the system.
The relationships between political actors and service providers (the right leg of thetriangle) are often referred to as “compact”. The relationships at the base of the triangle arerelationships of “local participation,” “local voice,” or “consumer choice.” And the rela-tionships in the left leg of the triangle are called “voice” relationships. (Sometimes “national”or “aggregated” voice to distinguish it from the participatory voice relationship at the baseof the triangle.)
In Peru, many of these relationships work imperfectly at best, and in some cases hardlywork at all, as the rest of this report and other reports in the RECURSO series document.Due to lack of space and time, two relationships are emphasized in this report: the bottom
CHAPTER 3
The Accountability-TriangleApproach
23

of the triangle, and the right side of the triangle. Voice issues, those on the left hand side ofthe triangle, are covered, but more lightly. In any case, the rest of this report does not focuson taking each side of the triangle in turn; in fact, the report is not organized specificallyaround the triangle. Instead, the various issues are treated in more traditionally “topical”chapters. For example, “compact” issues having to do with funding and with standards aredealt with in Chapter 4 and in Chapter 6; issues of accountability to parents and commu-nity are dealt with in Chapter 7, Chapter 8 and more explicitly in Chapter 9; and so forth.
24 A World Bank Country Study
Figure 3.1. Accountability Triangle
Politicians andpolicy-makers (which maybe at sub-national level aswell as national), includingexecutive and legislative
Policy implementers(Minisry, DREs, UGELs)
Actual service providers(schools)
Expectations of performance,policy-setting, laws
Informationon deliveryagainst expectation
Citizens, and, morespecifically, parents at
schools
Norms and standards,specific goals,resources, promotionand pay progression,support in coming to standard
Informationon performanceto standards
Governance, watchfulness, choiceover providers, including opinion onteacher performance and progression
Service provided (children educated),information on service provision
Direct voice,taxes,votes
Feedbackon progress
Patterns of Educational Expenditure
Financing of the education sector, and of schools in general, is a key part of the “compact”between the state’s politicians, policymakers, and service providers. Previous sections haveexplored the provision of education services, noting that Peru has done very well in provid-ing widespread access to education. It has been noted here that while Peru’s average level ofquality provision is not much below what one would expect, the quality of provision isnonetheless much lower than that of countries with which Peru would like to compete. Fur-thermore, it has been argued that there is a gap between mass access and the quality of thataccess: the ratio of access to quality is higher than the international average. Finally, it hasalso been noted that there is a problem with the fact that quality is highly variable particu-larly given its relatively (though not unexpectedly) low level. The predictability of learningoutcomes, particularly among the poor, is very low, even considering their poverty. Thissection and the next suggests that there is something to the spending patterns—and themanagement of that spending—that helps account for these results. This section looks atthe patterns of expenditure by type of expenditure, and the next section focuses on patternsof expenditure by the income level and socioeconomic status of the recipients.
In discussing spending patterns, it is useful to have some “macro” or systemic bench-marks or goals. These are not easily established in the abstract or via reference only to localstudies; international comparisons are most useful in this case. Table 4.1 sets out someinternational benchmarks for the key expenditure parameters. Two types of benchmarksare used. First, the average for Latin America as a whole is presented. This is useful, butsince Latin America as a whole is not necessarily a set of countries to be emulated, a set ofthree Latin American countries (Chile, Cuba, and Mexico) with the best performances inLatin American in the PISA or LLECE assessments is selected for comparison. Finally, a set
CHAPTER 4
Education Finance
25

TertiaryPrimary Secondary Expen-Expen- Expen- diture Source diture diture Per for Current Source
Per Pupil/ Per Pupil/ Student/ Previous Expenditure/ Personnel/ Trend from for SourceComparison GDP Per GDP Per GDP Per Three Total Total 1970s to Bench- forPoint Capita Year Capita Year Capita Year Columns Expenditure Years Source Cost 1990s Year mark Trend
Latin Americatotal
Chile
Cuba
Mexico
Average of above three
Finland
Korea
UnitedKingdom
Thailand
Table 4.1. Calculation of Expenditure Benchmarks Suitable for Peru
Mostrecentfor eachcountry
2000
2000
1999
1996
2000
2000
1999
Mostrecent
2000
2000
1999
1996
2000
2000
1999
Mostrecentpossiblefor eachcountry
2000
2000
1999
1996
2000
2000
1999
EDSTATS
EDSTATS
EDSTATS
EDSTATS
EDSTATS
EDSTATS
EDSTATS
EDSTATS
1970sto2001
1970sto2001
1970sto2001
1970sto2001
1970sto2001
1970sto2001
1970sto2001
1
2
3
4
5
6
7
12%
14%
33%
12%
20%
22%
18%
14%
17%
15%
15%
43%
14%
24%
26%
17%
13%
15%
44%
19%
96%
45%
53%
43%
8%
32%
26%
87% recently,92% his-torically
85% recently,94% his-torically
NA
97% recently,71% his-torically
92%
79%
93%
82%
70%
52%
53%
88%
64%
59%
55%
66%
72%
−0.4 per-centagepoints/year
−0.3 per-centagepoints/year
0.6 per-centagepoints/year
NA
0.2 per-centagepoints/year
−0.8 per-centagepoints/year
−2 per-centagepoints/year
−0.3 per-centagepoints/year
Projected2001
2001
2002
2001
2001
2001
2001
Projected2001
16
17
18
19
20
21
22
8
9
10
11
12
13
14
15

Average of above four
Appropriateapproximatebenchmark orgoal for Peru
18%
16%
18%
16%
27%
31%
87%
87%–89%
63%
65%–70% −0.2 to −0.3 per-centagepoints/year
Sources:1 Calculated and projected from IMF data sourced from EDSTATS at http://sima.worldbank.org/edstats/drbe.asp and for historical series, UNESCO at
http://www.uis.unesco.org/pagesen/DBExpTCC.asp2 Calculated from http://www.oecd.org/dataoecd/62/17/33671056.xls and http://www.oecd.org/dataoecd/62/20/33670986.xls and for historical series, UNESCO at
http://www.uis.unesco.org/pagesen/DBExpTCC.asp3 Calculated from http://www.oecd.org/dataoecd/62/17/33671056.xls and http://www.oecd.org/dataoecd/62/20/33670986.xls and for historical series, UNESCO at
http://www.uis.unesco.org/pagesen/DBExpTCC.asp4 Calculated and projected from http://www.oecd.org/dataoecd/62/17/33671056.xls and http://www.oecd.org/dataoecd/62/20/33670986.xls and for historical series, UNESCO at
http://www.uis.unesco.org/pagesen/DBExpTCC.asp5 Calculated and projected from http://www.oecd.org/dataoecd/62/17/33671056.xls and http://www.oecd.org/dataoecd/62/20/33670986.xls and for historical series, UNESCO at
http://www.uis.unesco.org/pagesen/DBExpTCC.asp6 Calculated and projected from http://www.oecd.org/dataoecd/62/17/33671056.xls and http://www.oecd.org/dataoecd/62/20/33670986.xls and for historical series, UNESCO at
http://www.uis.unesco.org/pagesen/DBExpTCC.asp7 Calculated and projected from IMF data sourced from EDSTATS at http://sima.worldbank.org/edstats/drbe.asp and for historical series, UNESCO at
http://www.uis.unesco.org/pagesen/DBExpTCC.asp8 Calculated from UNESCO historical data at http://www.uis.unesco.org/pagesen/DBExpLevel.asp and http://www.uis.unesco.org/pagesen/DBExpPurpose.asp9 Calculated from http://www.oecd.org/dataoecd/62/17/33671056.xls and http://www.oecd.org/dataoecd/62/20/33670986.xls
10 Ministry of Finance http://www.mfp.cu/educacion.htm11 Calculated from http://www.oecd.org/dataoecd/62/17/33671056.xls and http://www.oecd.org/dataoecd/62/20/33670986.xls12 Calculated from http://www.oecd.org/dataoecd/62/17/33671056.xls and http://www.oecd.org/dataoecd/62/20/33670986.xls13 Calculated and projected from http://www.oecd.org/dataoecd/62/17/33671056.xls and http://www.oecd.org/dataoecd/62/20/33670986.xls14 Calculated from http://www.oecd.org/dataoecd/62/17/33671056.xls and http://www.oecd.org/dataoecd/62/20/33670986.xls15 Calculated from UNESCO historical data at http://www.uis.unesco.org/pagesen/DBExpLevel.asp and http://www.uis.unesco.org/pagesen/DBExpPurpose.asp16 Calculated from UNESCO historical data at http://www.uis.unesco.org/pagesen/DBExpLevel.asp and http://www.uis.unesco.org/pagesen/DBExpPurpose.asp17 Calculated from UNESCO historical data at http://www.uis.unesco.org/pagesen/DBExpLevel.asp and http://www.uis.unesco.org/pagesen/DBExpPurpose.asp plus OECDhttp://www.oecd.org/dataoecd/62/17/33671056.xls and http://www.oecd.org/dataoecd/62/20/33670986.xls18 Calculated from UNESCO historical data at http://www.uis.unesco.org/pagesen/DBExpLevel.asp and http://www.uis.unesco.org/pagesen/DBExpPurpose.asp plus OECDhttp://www.oecd.org/dataoecd/62/17/33671056.xls and http://www.oecd.org/dataoecd/62/20/33670986.xls19 Calculated from UNESCO historical data at http://www.uis.unesco.org/pagesen/DBExpLevel.asp and http://www.uis.unesco.org/pagesen/DBExpPurpose.asp plus OECDhttp://www.oecd.org/dataoecd/62/17/33671056.xls and http://www.oecd.org/dataoecd/62/20/33670986.xls20 Calculated from UNESCO historical data at http://www.uis.unesco.org/pagesen/DBExpLevel.asp and http://www.uis.unesco.org/pagesen/DBExpPurpose.asp plus OECDhttp://www.oecd.org/dataoecd/62/17/33671056.xls and http://www.oecd.org/dataoecd/62/20/33670986.xls21 Calculated from UNESCO historical data at http://www.uis.unesco.org/pagesen/DBExpLevel.asp and http://www.uis.unesco.org/pagesen/DBExpPurpose.asp plus OECDhttp://www.oecd.org/dataoecd/62/17/33671056.xls and http://www.oecd.org/dataoecd/62/20/33670986.xls22 Calculated from UNESCO historical data at http://www.uis.unesco.org/pagesen/DBExpLevel.asp and http://www.uis.unesco.org/pagesen/DBExpPurpose.asp
of countries from elsewhere in the world is chosen. This set contains a variety of situations.Two (the United Kingdom and Finland) are developed countries with good educationalperformance. One, Korea, recently gained status as a largely developed country, and isknown to have placed a great deal of emphasis on education. Another, Thailand, is still adeveloping country, but its educational performance has improved significantly in the lastfew decades and it performs well on international comparisons.
This set of countries provides some parameters for some of the key spending propor-tions to be discussed below:
1. The proportion of personnel expenditure to total (current and capital) expendi-ture. This is a remarkably firm parameter across the comparators proposed, and areasonable goal or benchmark for a system ought to be in the range of 65 to 70 per-cent. (This assumes the payout of pensions to retired teachers and administratorsis not counted as expenditure of the education sector itself.)
2. Most importantly, countries that appear to be making substantial progress havedecreased this proportion over time, at a rate that suggests a benchmark of some0.2 to 0.3 percentage points per year. An interesting exception is Cuba, whichincreased the proportion of total expenditure devoted to personnel, but note thatthis increase came from an extremely low proportion of around 40 percent.
3. The proportion of current expenditure to total expenditure. This is a somewhatmore variable parameter, but a benchmark of 87 to 89 percent appears recom-mendable. The values for already highly-developed societies such as the UnitedKingdom and Finland seem less relevant in this case, because these societies do notneed to engage in as much infrastructure expansion as Peru does, or as Peru hashad to in the recent past.
4. Per pupil spending on primary, secondary, and tertiary education as a proportionof GDP per capita are useful benchmarks not only of adequacy but also of balancebetween the sub-sectors. These benchmarks are proposed at around 14, 17, and40 percent of GDP per capita, noting the approximately 3 to 1 ratio between ter-tiary, on the one hand, and primary and secondary expenditure per student, on theother. The percentage spent on each sub-sector (without taking into accountenrollment, and without reference to GDP per capita) is not as useful a benchmark,because it depends so much on enrollment patterns. (The optimality of enrollmentpatterns is a different matter and can be benchmarked.)
5. Finally, note that public spending on education as a percentage of GDP is notexplicitly benchmarked, but its level in Peru is analyzed below.
Education System Efficiency
As noted, Peru spends about 3 percent of its GDP to support education through publicexpenditure. This proportion is not benchmarked, as its value is relatively meaningless with-out reference to what is “produced” in exchange for the expenditure. Figure 4.1 provides agraphic analysis of what is “produced”, in terms of enrollment, with this public expenditure.
Table 4.2 below shows the allocation of resources for Peru by input or item as well asby sub-sector. The share of the total expenditure to GDP, as well as per student expenditure
28 A World Bank Country Study

as a proportion of GDP, is also shown. This table captures the essence of the spending pat-terns to be analyzed. From these data, and from a comparison against key benchmarks notedabove, a few facts stand out:
1. Personnel expenditure is much too high and, even worse, is going in the wrong direc-tion. A reasonable goal or benchmark is somewhere in the range of 65 to 70 percent,but Peru is now at 75 percent. A goal should be to reduce this by some 0.3 percent-age points per year, as soon as possible.
2. Partly because of this, total current expenditure is going up as well, from 86 per-cent of total expenditure a few years ago to 93 percent in 2004 and 90 percent in2005. A goal should be to come back down to 86 percent as soon as possible.
3. The ratios of spending per student as a proportion of GDP per capita are fairly low,but the proportions among these ratios are approximately right.
4. Education expenditure as a proportion of GDP is essentially static at about 3 per-cent of GDP. If one were to add expenditure on pensions of retired employees, thisproportion would increase, but this practice is not common in other countries. Theshare of public education expenditure on GDP is not explicitly benchmarked.Instead, a comparative analysis is carried out below.
Toward High-quality Education in Peru 29
Figure 4.1. Impact of Spending on Enrollment
0.0
20.0
40.0
60.0
80.0
100.0
120.0
140.0
0 42 6 8 10 12
Pubic expenditure on education as a percentage of GDP, late1990s-2001
Co
mb
ined
pri
mar
y, s
eco
nd
ary,
an
d t
erti
ary
enro
llmen
tra
tio
, lat
e 19
90s-
2001
Perú
Sources: Graphed from EDSTATS data.

Table 4.2. Key Expenditure Patterns in Peru
Executed expenditure by in current soles 1999 2000 2001 2002 2003 2004 2005
Pre-primary 455,362,385 447,844,586 424,879,367 511,391,632 552,244,738 577,005,100 591,656,097
Primary 1,908,927,546 1,954,677,866 1,858,705,124 2,027,035,600 2,177,134,136 2,508,777,484 2,581,453,819
Secondary 1,307,764,908 1,400,018,509 1,453,401,116 1,657,277,423 1,822,417,565 2,146,553,419 2,330,576,939
Post-secondary 910,965,662 952,391,760 961,446,990 1,042,729,074 1,165,158,687 1,341,661,558 1,453,697,980
Others 587,758,159 602,581,653 696,310,071 756,058,920 867,134,251 913,605,108 1,057,625,248Total 5,170,778,661 5,357,514,373 5,394,742,667 5,994,492,649 6,584,089,378 7,487,602,670 8,015,010,084
Numbers of students in public institutions 1999 2000 2001 2002 2003 2004 2005
Pre-primary 899,625 929,400 934,150 937,846 913,257 922,379 919,369
Primary 3,795,118 3,761,516 3,725,495 3,683,949 3,627,104 3,571,721 3,589,997
Secondary 1,913,790 1,972,424 2,057,807 2,099,412 2,106,977 2,142,044 2,130,472
Post-secondary 531,491 556,725 554,131 583,979 601,209 589,570 593,411Total 7,140,024 7,220,065 7,271,583 7,305,186 7,248,547 7,225,714 7,233,249
Nominal expenditure per student, current soles 1999 2000 2001 2002 2003 2004 2005
Pre-primary 506 482 455 545 605 626 644
Primary 503 520 499 550 600 702 719
Secondary 683 710 706 789 865 1,002 1,094Post-secondary 1,714 1,711 1,735 1,786 1,938 2,276 2,450
Expenditure per capita as percentage of GDP per capita 1999 2000 2001 2002 2003 2004 2005
Pre-primary 7.4% 6.7% 6.4% 7.3% 7.8% 7.4% 7.1%
Primary 7.4% 7.3% 7.0% 7.4% 7.7% 8.3% 7.9%
Secondary 10.0% 9.9% 9.9% 10.6% 11.1% 11.8% 12.0%Post-secondary 25.2% 23.9% 24.3% 24.0% 24.9% 26.8% 26.9%
Executed expenditure, by item, current soles 1999 2000 2001 2002 2003 2004 2005
Wages and Salaries 3,668,638,604 3,875,095,524 4,047,762,965 4,619,170,622 5,016,534,904 5,534,229,011 6,027,665,971
Goods and Services 684,779,282 769,227,072 816,852,375 830,727,653 890,734,279 992,464,713 988,000,869

Other Current Expenditures 104,303,674 110,369,944 113,102,198 136,795,539 207,623,147 427,319,637 166,592,942
Total Current Expenditure 4,457,721,560 4,754,692,539 4,977,717,537 5,586,693,814 6,114,892,330 6,954,013,360 7,182,259,782
Investment 644,191,083 527,186,228 346,866,719 334,004,558 350,149,572 389,782,653 645,221,065
Financial investment 10,549,462 13,015,401 14,417,068 12,247,522 20,031,363 20,989,688 14,769,305
Debt amortization 0 277,804 861,240 1,923,213 724,661 988,506 1,065,033
Interests repayment 864,134 768,942 1,122,557 890,343 543,446 355,445 132,670
Other Capital Expenditures 57,452,423 61,573,458 53,757,546 58,733,200 97,748,005 121,473,017 171,562,228
Total Capital Expenditure 713,057,102 602,821,834 417,025,130 407,798,835 469,197,048 533,589,309 832,750,301
Grand Total 5,170,778,661 5,357,514,373 5,394,742,667 5,994,492,649 6,584,089,378 7,487,602,670 8,015,010,084
Key ratios 1999 2000 2001 2002 2003 2004 2005
Wages and salaries expenditure as a 71% 72% 75% 77% 76% 74% 75%percentage of total expenditure
Current expenditure as percentage 86% 89% 92% 93% 93% 93% 90%of total expenditure
Total public education expenditure 3.0% 2.9% 2.9% 3.0% 3.1% 3.2% 3.2%as percentage of GDP
Rates of growth 1999–2005
Nominal salary spending 8.6%
Current spending 8.3%
Total spending 7.6%
CPI 2.5%
Total enrollment 0.2%
Real salary spending per student 6.0%
Real current spending per student 5.6%
Real total spending per student 4.7%
Source: SIAF and Ministerio de Educación, Cifras de la Educación 1998–2004.GDP: Central Bank and INEI, http://www.bcrp.gob.pe/Espanol/WEstadistica/cuadros/mensuales/Nota_2000/ncua_052.xlsPopulation: INEI projections.1. Only functional expenditure

In more general terms, aside from the issue of benchmarks, it should be noted thatgrowth in spending in Peru is now almost totally driven by growth in spending per studentas opposed to growth in enrollment. Enrollment is growing at only 0.2 percent per year,yet total real expenditure is growing at 5.0 percent per year (7.6 percent nominal growthminus 2.5 percent inflation). And this is largely driven by salary pressure. Salary costgrowth is the driver in the system and, as will be seen, is in turn partly driven by decreasesin the pupil-teacher ratio below levels that appear justified, but mostly driven by increasesin salary levels.
Figure 4.1 shows a freehand curve that depicts the approximate “limit” of productionpossibilities as derived from a simple cross-national analysis. It shows Peru to be fairly closeto this “frontier.” In other words, Peru has been a fairly efficient producer of enrollmentor coverage. A more formal analysis carried out by Herrera and Pang took, as input vari-ables, per capita expenditure in primary and secondary education and, as output variables,the net primary and secondary enrollment rates, average years of education, primary andsecondary completion rates, and the literacy rate. According to their results, Peru does rel-atively well with respect to other countries. In short, Peru’s institutions know how to turnresources into enrollment, and do it quite well.
This is not the case for quality, however. Peru is not an efficient spender on quality orlearning. Thus, it is unlikely that quality could be efficiently improved simply by spendingmore, by buying more inputs—expenditure and resources do not appear to be the bind-ing constraint to further improvements in learning, based either on macro analysis asshown in Figure 4.2 (below) or on the micro analysis previously shown in Chapter 2.
This analysis suggests that Peru is about 30 percent away from the central trend, or thatits inefficiency in producing learning achievement is about 30 percent. More detailed analy-sis of the efficiency with which learning is produced, using not international comparisonbut micro data (from the 2001 National Assessment) from Peru itself, shows similar results.9
A micro analysis by school level was done for this study taking as an output variable the aver-age score in Spanish (“comunicación integral”) and Mathematics (“lógico-matemática”)and as input variables those that were the most significant in the estimation of the produc-tion function.10 For primary education, the inefficiency level is 25 percent. In other words,in terms of learning results, the primary education sector could perhaps produce as muchas 25 percent more under the same socioeconomic conditions it already faces and the samelevel of inputs as currently used, if management were tighter and the system could produceto standard.
32 A World Bank Country Study
9. The work of Pablo Lavado in this section is acknowledged with gratitude.10. The estimate of the frontier was based on classical Data Envelope Analysis (DEA). This type of
analysis is not robust to outliers—on the contrary, it is highly sensitive to outliers. (However, it has cer-tain advantages that warrant its use.) Outliers could be due to poor data, or to practices that are truly non-replicable by other schools or “production units.” Thus how outliers are dealt with seems important. Ourjudgment was that practices that result in efficiency levels greater than two standard deviations from themean were likely non-replicable and invalid as a way of estimating the average inefficiency of the rest ofthe observations. In order to establish this, we: 1) carried out several OLS estimates of the impact of eachof the input on each of the output variables; 2) took the each observation’s residual, for each one of theregressions, and compared them to the standard deviation of the residuals for that regression; and 3)finally, we excluded those observations which showed a residual greater than two standard deviations onany regression. In the analysis, the vertical axis is the combination of mathematics and Spanish results,and the horizontal axis is an index of a combination of inputs and socioeconomic conditions.

Toward High-quality Education in Peru 33
Figure 4.2. Learning Efficiency of Peru’s Education Expenditure
0
100
200
300
400
500
600
700
PIS
A-e
qu
ival
ent
gra
des
in T
IMS
S a
nd
PIS
A
Perú
0 42 6 8 10
Pubic Expenditure on Education as a Proportion of GDP in1990s
Source: Author’s analysis of PISA 2000 and TIMSS 1999 and 2003 data and EDSTATS for publicexpenditure data.
Figure 4.3. Efficiency Frontier for Primary Education
375
425
475
525
575
625
675
725
775
825
40 50 60 70 80
Source: Calculated and graphed from National Assessment 2001 data.
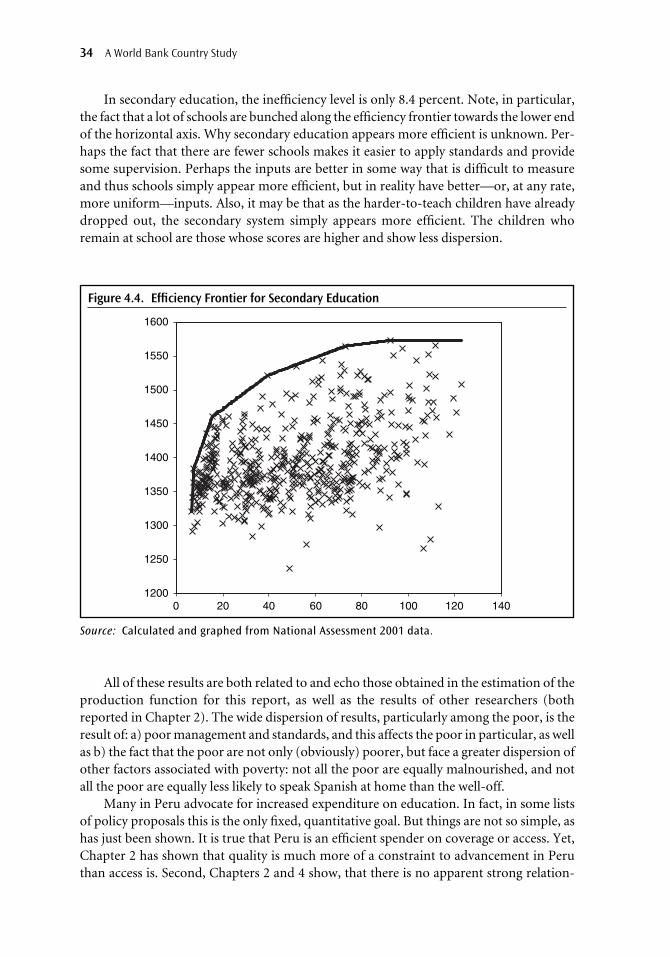
In secondary education, the inefficiency level is only 8.4 percent. Note, in particular,the fact that a lot of schools are bunched along the efficiency frontier towards the lower endof the horizontal axis. Why secondary education appears more efficient is unknown. Per-haps the fact that there are fewer schools makes it easier to apply standards and providesome supervision. Perhaps the inputs are better in some way that is difficult to measureand thus schools simply appear more efficient, but in reality have better—or, at any rate,more uniform—inputs. Also, it may be that as the harder-to-teach children have alreadydropped out, the secondary system simply appears more efficient. The children whoremain at school are those whose scores are higher and show less dispersion.
34 A World Bank Country Study
Figure 4.4. Efficiency Frontier for Secondary Education
1200
1250
1300
1350
1400
1450
1500
1550
1600
0 20 40 60 80 100 120 140
Source: Calculated and graphed from National Assessment 2001 data.
All of these results are both related to and echo those obtained in the estimation of theproduction function for this report, as well as the results of other researchers (bothreported in Chapter 2). The wide dispersion of results, particularly among the poor, is theresult of: a) poor management and standards, and this affects the poor in particular, as wellas b) the fact that the poor are not only (obviously) poorer, but face a greater dispersion ofother factors associated with poverty: not all the poor are equally malnourished, and notall the poor are equally less likely to speak Spanish at home than the well-off.
Many in Peru advocate for increased expenditure on education. In fact, in some listsof policy proposals this is the only fixed, quantitative goal. But things are not so simple, ashas just been shown. It is true that Peru is an efficient spender on coverage or access. Yet,Chapter 2 has shown that quality is much more of a constraint to advancement in Peruthan access is. Second, Chapters 2 and 4 show, that there is no apparent strong relation-

ship between spending and quality in Peru at either the macro or school level. As has beennoted above, costs from salaries and personnel-related benefits are squeezing the budget.Yet, lower pupil-teacher ratios in Peru are not associated with increased learning. Thus, agreat deal of expenditure is accounted for by the provision of teachers in a manner thatdoes not seem to make much difference to achievement levels. For all these reasons, and asdiscussed in the Policy Recommendations, this report advocates that before there is muchmore expenditure on the sector, the sector needs to take administrative measures that putit closer to the efficiency frontier in terms of learning.
Spending Incidence and Equity
Incidence of Public Expenditure by Income Group
Elsewhere in this report (Chapter 1) it has been noted that Peru’s worst performing learn-ers perform much worse than the worst-performing learners of other middle-incomecountries participating in PISA 2000; additionally, they perform much worse, relativelyspeaking, than Peru’s best-performing students. It is also shown, in Chapter 2, that thispoor performance is strongly associated with, though not entirely determined by, thepoverty of students’ families. Another possible cause of particularly poor results amongthe poor could be that education inputs are distributed so as not to favor the poor. In anycase, education spending represents an important public benefit and is a significant sourceof current transfers to the poor; as such, its distribution is a fundamental issue. This sec-tion explores the incidence of spending across income groupings.
Public spending on education, in the basic levels, is favorable to the poor, as shown bythe data in Table 4.3 and in Table 4.4. The poor (the first two quintiles) benefit more thanother groups from public spending (see Total row), but particularly benefit in the basiclevels (pre-primary, primary, and secondary). The data on benefits shown below have beencalculated first assuming equal expenditure per beneficiary across quintiles (Table 4.3),and then using per capita spending levels that vary by Departamento, which are thenmapped to quintiles (Table 4.4).11 The former is therefore simply equivalent to the distri-bution of beneficiaries of public education by quintile. Presenting the data in this manner(one version assuming equal per capita expenditure across quintiles, the other assumingvarying per capita expenditure) is relatively uncommon in these sorts of calculations. Mostbenefit-incidence calculations for other countries assume equal spending per pupil and arethus really a calculation of beneficiary incidence, not of benefit incidence. If spending perstudent—even within the public sector—is negatively correlated with the poverty of stu-dents, then this traditional incidence analysis over-states the progressiveness of spending.We can see from Table 4.3 and Table 4.4 that, using either definition, public educationspending in Peru appears quite pro-poor compared with spending in other countries (datafor other countries shown in Table 4.5). Naturally, the data on actual benefit incidence
Toward High-quality Education in Peru 35
11. This is possible because data on per student spending disaggregated by Departamento are avail-able, and each family in the ENAHO 2003 (Fourth Quarter) can be associated with a Departamento. Thisimplicitly assumes that every family in the Departamento receives the Departamento-wide per studentspending. This is clearly a simplification, but it is better than assuming nation-wide equality of per stu-dent spending.

12. Because the original medians calculated from the data do not add up to 100 percent, even thoughthe underlying data do, the medians have been re-normed to add up to 100 percent. The deviation of thesums of medians across quintiles from 100 percent was usually only one or two percent, thus re-normingdoes not change things very much. Countries included in the sample are: Armenia, Côte d’Ivoire, Ecuador,Ghana, Guinea, Guyana, Indonesia, Jamaica, Kazakhstan, Kenya, Kyrgyz Republic, Madagascar, Malawi,Morocco, Nepal, Nicaragua, Pakistan, Panama, Peru 1994, Romania, South Africa, Tanzania, Uganda,Uruguay, and Vietnam.
Table 4.3. Beneficiary Incidence by Quintile, 2003 (assuming equal spending per beneficiary)
Income quintiles grouped by household income
Education Level I II III IV V
Pre-Primary 24.3% 22.5% 24.2% 19.3% 9.8%
Primary 33.4% 27.2% 21.0% 13.3% 5.1%
Secondary 19.4% 24.4% 27.1% 20.3% 8.9%
Non univ. tertiary 4.5% 19.2% 31.2% 27.2% 17.9%
Undergraduate university 1.4% 4.7% 13.5% 33.5% 46.8%
Graduate 0.0% 0.0% 0.0% 15.2% 84.8%
Total post-secondary 2.6% 10.1% 19.9% 30.7% 36.7%
Total 25.8% 24.5% 23.1% 17.4% 9.2%
Sources: Beneficiaries: ENAHO 2003-IV Term; Pre-tertiary Benefits: Public Budget NationalBureau, Ministry of Economics and Finance. Tertiary Benefits: Sistema Integrado de Adminis-tración Financiera, Ministry of Economics and Finance.
Table 4.4. Benefit Incidence by Quintile, 2003 (assuming unequal spending per beneficiary)
Income quintiles grouped by household income
Education Level I II III IV V
Pre-Primary 19.6% 20.9% 25.6% 23.7% 10.2%
Primary 31.8% 26.8% 21.9% 14.0% 5.5%
Secondary 18.2% 24.1% 27.3% 20.8% 9.5%
Non univ. tertiary 3.7% 16.5% 33.3% 27.5% 19.0%
Undergraduate university 1.1% 5.5% 13.4% 31.3% 48.7%
Graduate 0.0% 0.0% 0.0% 16.9% 83.1%
Total post-secondary 1.6% 7.4% 16.8% 30.1% 44.1%
Total 19.4% 20.9% 22.7% 20.7% 16.2%
Sources: Beneficiaries: Computed from ENAHO 2003-IV Term; Pre-tertiary Benefits: Public BudgetNational Bureau, Ministry of Economics and Finance. Tertiary Benefits: Sistema Integrado deAdministración Financiera, Ministry of Economics and Finance.
Table 4.5. Benefit or Beneficiary Incidence—International Medians in Various Years12
Income quintiles
Education Level I II III IV V
Primary 20.7% 22.8% 21.3% 20.2% 15.0%
Secondary 10.7% 16.1% 20.6% 24.5% 28.1%
Tertiary 3.5% 7.4% 14.8% 25.2% 49.1%
Total 14.7% 17.5% 19.6% 21.4% 26.8%
Source: Calculated from EDSTATS data.

(Table 4.3), as opposed to beneficiary incidence (Table 4.4), shows less progressivenessbecause per pupil spending in poor Departamentos is lower than spending in the richerDepartamentos.
However, because education is not a targeted program, the poor’s disproportionatelylarge benefit (that is, the progressiveness of education spending) is largely a matter ofdefault, as the better-off have fewer children and also self-select out of the public system.13
The progressiveness of public spending on education is not the result of either active pol-icy choice or management. Primary education serves as an example. The poorest quintilereceives a proportion of the public spending which is 6 times higher than that received bythe richest quintile (30 percent as opposed to 5 percent, approximately—see Table 4.4).But, as shown in Table 4.6, this is because families in the richest quintile have one third asmany children of primary school age as the families in the poorest quintile, and becauseone half of them choose to send their children to private schools, whereas essentially noneof the poorest attend private school. In general, the apparent progressiveness of public allo-cation to education is determined by three factors: the degree to which the poor have morechildren than the rich, the degree to which they choose or are able to enroll them in school,and the degree to which they choose or are able to enroll them in private schools. (It shouldbe noted that the proportion of the overall population attending private schools is aboutthe same in Peru as in the rest of Latin America, or perhaps slightly less at the secondarylevel.) The impact of these three types of determinants is analyzed below, starting with theproportion of youths who attend school by income quintile.
Toward High-quality Education in Peru 37
13. In one important sense the fact that the benefits of primary education are distributed in a moreprogressive manner than the benefits of secondary education is a result of policy, namely the policy ofensuring universal coverage first at the primary level and placing more primary than secondary schoolsin rural locations. However, this fact does little to explain why spending on primary education is so pro-poor—this has more to do with private choice than with public policy.
14. There are some anomalies in this table that require further research. For example, it is not clearwhy quintile V households would have half as many children per household of secondary school age asquintile-I households, but more children of post-secondary school age than quintile-I families. The pos-sibility that this could be the result of the definition of household, and the possibility that older childrenmay be working, may form their own households and may have higher per person income than that ofthe family from which they originated was investigated but the hypothesis was rejected.
Table 4.6. Demographic and Public Private Choice of Families, by Income Quintile, as Determinants of Pro-poor Spending, 2003
Numbers of children per household Proportion of children attending in the appropriate age groups private schooling
Income quintiles Income quintiles
School Level I V I V
Pre-primary 0.414 0.2 0% 60%
Primary 0.9 0.3 1% 49%
Secondary 0.7 0.3 2% 51%
Post-secondary 0.4 0.5 0% 60%
Total 2.4 1.3 1% 55%
Source: Computed from ENAHO 2003-IV Term.

It is clear then that one of the main reasons why, say, the distribution of secondaryschooling expenditure is not as progressive as that of primary spending is that poorer fam-ilies choose, or are able, to send their children to secondary school only about half as fre-quently as rich families.
The other two components, or determinants of progressiveness, are presented inTable 4.6. As noted, at the primary level, the rich have about one third as many childrenper household as the poor; the propensity of the rich to send their children to school isthe same as that of the poor, but half of the rich children attend private schooling. Thus,rich families’ benefit from public spending is only one-sixth as high as the benefit receivedby the poor. At the secondary level spending is not nearly as favorable to the poor, largelybecause the poor enroll with only one half the frequency attributable to the rich.
Thus, in effect, the relatively pro-poor nature of public spending on basic educationis somewhat of an illusion. This may result in policy “surprises.” One policy “surprise” thatcould arise is that, if the quality of public education were to improve, public schoolingwould tend to automatically become less favorable to the poor, as the relatively better-offwould tend to opt back into public schooling. If quality improved strictly through policychanges, rather than through increases in per student spending, the fact that the public sec-tor would suddenly have more clients, and more of them would be well off, would meanthat costs would go up, and these costs would be less pro-poor. If the increases in qualityalso required increases in per student spending, the fiscal impact would be greater. It maybe thought that fiscal pressure of this nature could simply be resisted. But greater upper-middle class participation in public schooling (if the quality of public schooling were toincrease) would tend to mean more public support for public spending on education, asthe upper middle class speaks with a disproportionate voice. This is hardly an argumentagainst increasing the quality of public education. Yet, it does suggest that it is odd to con-sider current spending patterns to be pro-poor in any really meaningful sense.
The notion that public spending benefits the poor disproportionately as a result of pri-vate choices, rather than because of policy decisions, suggests a need to analyze spendingwithin the public sector in more detail. This analysis is carried out below, after the relativeincidence of spending has been analyzed.
38 A World Bank Country Study
Table 4.7. Proportion of Youths Enrolled in School 200315
Income quintiles grouped by household income
Education level I II III IV V
Pre-Primary 0.37 0.46 0.59 0.74 0.81
Primary 1.14 1.14 1.03 1.05 0.99
Secondary 0.54 0.77 1.02 1.01 0.99
Post-secondary 0.03 0.15 0.28 0.47 0.87
Total 0.66 0.73 0.78 0.82 0.92
Source: Computed from ENAHO 2003-IV Term.
15. The proportions can be greater than one because the denominator refers to children in the appro-priate age group, whereas the numerator refers to all children. This keeps the data consistent with the grossenrollment ratio data presented in the section on outcomes elsewhere in this report.

The public transfers to poor families that are implicit in access to public education arevery large. Table 4.8 shows the size of the transfer, by income quintile, relative to total fam-ily consumption. The size of the total transfers to all families in each income quintile isshown relative to the total consumption of all households in those quintiles, not simplythose with children in public schools.
Toward High-quality Education in Peru 39
Table 4.8. Benefits Represented by Public School Subsidy as a Proportion of TotalHousehold Expenditure Across All Households (“Relative Incidence”), 2003
Income quintiles
Education level I II III IV V
Pre-Primary 1.9% 1.1% 0.9% 0.6% 0.1%
Primary 14.5% 6.8% 3.8% 1.7% 0.3%
Secondary 7.1% 5.2% 4.0% 2.1% 0.4%
Total tertiary 0.5% 1.2% 1.8% 2.3% 1.4%
Total 24.0% 14.3% 10.6% 6.6% 2.2%
Sources: Beneficiaries: ENAHO 2003-IV Term; Pre-tertiary Benefits: Public Budget NationalBureau, Ministry of Economics and Finance. Tertiary Benefits: Sistema Integrado de Adminis-tración Financiera, Ministry of Economics and Finance.
Two points in particular are worth noting in Table 4.8. The impact of primary schoolsubsidies on the poorest households is very large. Education thus probably represents themost significant in-kind subsidy for the poor—perhaps more important than any othertype of public spending. The fact that education represents such a large transfer to the poorhighlights the importance of “getting management right.” If this transfer is under-deliveringactual education and learning to the poor, relative to its potential and its cost, then thewaste of both this potential and cost is very large.
The high degree of benefit to the poor relative to their total expenditure is a productof two facts: first, that public spending on education is very large relative to any other formof expenditure and to total national income (compared to other social expenditure in Peru,not compared to the same ratio in other countries), and second, that at the primary levelthis expenditure is so disproportionately (six to one) favorably distributed to the poor.
A second important point to note in Table 4.8 is that though the richest quintile cap-tures the largest proportion of the subsidy represented by tertiary education (as shown inTable 4.4), the relative importance of this subsidy is highest for quintile IV and is actuallyhigher for quintile III than for quintile V. In this sense, the higher education subsidy is moreof a middle-class (in the quantitative sense of being in the middle, not in the sociologicalsense of having a “modern” lifestyle and level of consumption) subsidy than a rich-familysubsidy. This is the result of three factors. First, the probability that a child in quintile IIIwould attend a tertiary institution is reasonably high—though still lower—when comparedto the same probability for a child in quintile V, but the probability that the institution willbe public is much higher in quintile III than in quintile V. Thus, the product of these twoprobabilities, namely the probability that a child in quintile III or IV will attend a univer-sity, and that this university will be public, is quite high. Also, of course, the income perfamily in quintile III is much lower than for in quintile V. These three factors mean thatthe relative incidence of spending on tertiary education favors quintiles III and IV. Public

university subsidies are much more important to the middle class than to the upper-income or lower-income quintiles. This, of course, explains their political popularity.
Correlations Between Spending and Poverty Within the Public Sector
It was noted above that the relatively pro-poor nature of public spending on education is toa large degree a matter of private choice rather than public policy. Public spending on edu-cation might not be actively targeted or preferential to the poor. Instead, richer families sim-ply have less children, and opt to send them to private schools because the quality of publicschools is seen as mediocre. This section explores the issue of whether spending within publiceducation itself favors or disfavors the poor. That is, the section assesses whether spending inpublic education favors the poorer among those who attend public schools.
It has been noted, using fairly aggregate data, that spending for various levels of edu-cation is negatively correlated with measures of poverty in Peru. Table 4.9 shows per stu-
40 A World Bank Country Study
Table 4.9. Per Student Spending and Poverty Levels by Region, 2003
Region Primary Secondary Poverty headcount
Amazonas 639 993 61%
Ancash 713 1,194 54%
Apurimac 633 821 68%
Arequipa 776 1,081 42%
Ayacucho 695 948 65%
Cajamarca 618 890 73%
Callao 526 880 41%
Cusco 550 697 56%
Huancavelica 622 943 82%
Huánuco 533 779 78%
Ica 682 916 26%
Junín 596 890 51%
La Libertad 568 893 50%
Lambayeque 514 784 49%
Lima 631 947 37%
Loreto 626 872 66%
Madre de Dios 795 1,014 21%
Moquegua 1,178 1,437 39%
Pasco 645 1,065 61%
Piura 548 766 60%
Puno 722 933 57%
San Martín 653 905 29%
Tacna 776 1,324 25%
Tumbes 1,081 1,739 55%
Ucayali 506 846 61%
Sources: Spending: Public Budget National Bureau, Ministry of Economics and Finance, Students:School Census 2003, Ministry of Education, Poverty: ENAHO 2003/2004, Annual Sample.
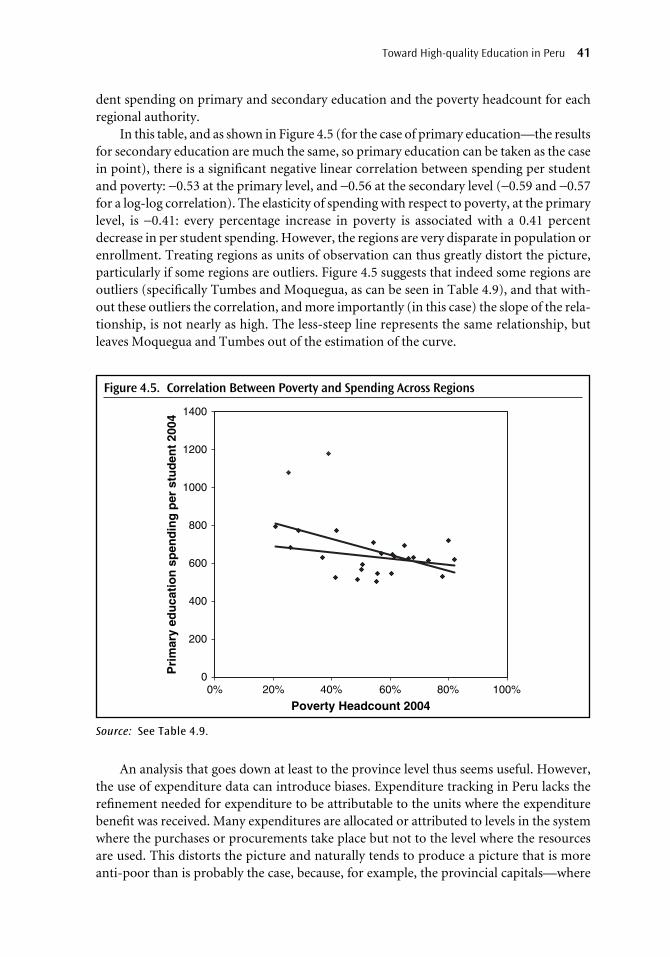
dent spending on primary and secondary education and the poverty headcount for eachregional authority.
In this table, and as shown in Figure 4.5 (for the case of primary education—the resultsfor secondary education are much the same, so primary education can be taken as the casein point), there is a significant negative linear correlation between spending per studentand poverty: −0.53 at the primary level, and −0.56 at the secondary level (−0.59 and −0.57for a log-log correlation). The elasticity of spending with respect to poverty, at the primarylevel, is −0.41: every percentage increase in poverty is associated with a 0.41 percentdecrease in per student spending. However, the regions are very disparate in population orenrollment. Treating regions as units of observation can thus greatly distort the picture,particularly if some regions are outliers. Figure 4.5 suggests that indeed some regions areoutliers (specifically Tumbes and Moquegua, as can be seen in Table 4.9), and that with-out these outliers the correlation, and more importantly (in this case) the slope of the rela-tionship, is not nearly as high. The less-steep line represents the same relationship, butleaves Moquegua and Tumbes out of the estimation of the curve.
Toward High-quality Education in Peru 41
Figure 4.5. Correlation Between Poverty and Spending Across Regions
0
200
400
600
800
1000
1200
1400
0% 20% 40% 60% 80% 100%
Poverty Headcount 2004
Pri
mar
y ed
uca
tio
n s
pen
din
g p
er s
tud
ent
2004
Source: See Table 4.9.
An analysis that goes down at least to the province level thus seems useful. However,the use of expenditure data can introduce biases. Expenditure tracking in Peru lacks therefinement needed for expenditure to be attributable to the units where the expenditurebenefit was received. Many expenditures are allocated or attributed to levels in the systemwhere the purchases or procurements take place but not to the level where the resourcesare used. This distorts the picture and naturally tends to produce a picture that is moreanti-poor than is probably the case, because, for example, the provincial capitals—where

purchases are made and the apparent benefits registered—tend to be less poor than theoutlying areas. A simple expedient is to analyze not expenditure but instead the pupil-teacher ratio as reported at school level. Another simple expedient is to analyze the corre-lation between, say, quality of infrastructure and schooling inputs with the socioeconomiclevel of the parents at schools. Both of these analyses were carried out.
Because teachers are paid very uniformly in Peru, and since teaching costs representsuch a large proportion of total education costs, analyzing the distribution of the pupil-teacher ratio by provincial poverty levels is a fairly good proxy for analyzing total expen-diture by poverty level. In this analysis, official data on pupils and teachers from theMinistry of Education, and poverty data from FONCODES, were used.16 This database,then, has both region and province level data. Data at the regional level confirm that for,say, primary education, there is a positive correlation of 0.32 between poverty and thepupil-teacher ratio (hence the poor get less resources), but when the analysis is done at theprovince level, the linear correlation between poverty and the pupil-teacher ratio is only0.23. The elasticity is now 0.17: every increase in poverty of 1 percent is associated with a0.17 percent increase in the pupil-teacher ratio. However, if one controls for the popula-tion density of the provinces, the elasticity of the pupil-teacher ratio with respect to povertyincreases from 0.17 to 0.25.17 That is, for areas of equal population density, the poor get ahigher pupil-teacher ratio, which translates into a smaller allocation of teachers.
A further analysis was performed using the data from the 2001 National Evaluation(the periodic sample-based learning achievement evaluation).18 This allows for school-levelcomparisons, but only on a sample basis. At this level, the relationship between povertyand pupil-teacher ratios disappears, or, in fact, becomes significantly pro-poor. Unfortu-nately, using school-level data, it is impossible to tell whether this relationship disappearsif one controls for population density. It is possible that, if population density and povertyare well correlated (they are somewhat correlated at the provincial level, it is possible thatat the school level they would be even more correlated), the lower pupil-teacher ratioobserved in poorer schools is due more to low density than to poverty. The fact remains,however, that the distribution of teachers is progressive even within the public sector: theimplicit concentration coefficient in the distribution of teachers is negative 0.25: the poordo seem to get a disproportionate number of the teachers.
The correlations between the index of socioeconomic status of the parents and theindices of school infrastructure and of supply availability were found to be 0.81 and 0.66respectively: the richer the parents, the better the infrastructure and supplies. It is not pos-sible to calculate a particularly meaningful elasticity or concentration coefficient for these
42 A World Bank Country Study
16. Ministerio de Educación, Unidad de Estadística Educativa, Cifras de la Educación 1998–2003 usingthe province-level data, and FONCODES district-wise poverty map with data aggregated up to provin-cial level.
17. It is important to take density into account because density is an important predictor of the pupil-teacher ratio, and density and poverty are negatively correlated, with a correlation of −0.23. The moredensely populated an area, the less poor it tends to be.
18. The analysis was done at the school level, using the variables infra_1, infrau_1, and nse4ps_1,which measure, respectively, the quality of school infrastructure, access to schooling resources, and theparents’ socioeconomic status. In addition, the size of the tested class was used as a proxy for the school-level pupil-teacher ratio. The data in the file on mathematics achievement in the 4th grade of primaryschool were used.

relationships because they are based on indices that take on values below and above 0, andwhose absolute value is not clear.19 Taking a reasonable additive displacement to the indices,the Gini coefficient seems to be somewhere between 0.10 and 0.15. This is much moreunequal than the distribution of teachers, but more equal than the distribution of income.
Distribution of Results
The ultimate benefit from education is, of course, not the spending or inputs that are trans-ferred to the poor, but the increase in life chances and labor market options that the poorderive from improved human capital. The latter is unfortunately difficult to evaluate withcurrent data. However, an intermediate proxy is the distribution of learning results. Thedata on learning results are quite telling. To see this, the 4th grade primary mathematics(“lógico-matemática”) in the National Assessment 2001 results were used because essen-tially all children are in school in the 4th grade. This makes it possible to unambiguouslycalculate the distribution of results in a manner that parallels calculations related to, say,the distribution of income or total family expenditure. In later grades some children haveabandoned the system, which makes it difficult to know what the distribution of results,by income group, might mean; it would tend to overstate the equality of distribution oflikely life-chances (to the degree life-chances are determined by schooling results), sinceonly those remaining in school are being evaluated.
There are two important distributional aspects related to the results. First, there is thenature and curvature of the bivariate relationship between results and poverty or social dis-advantage. Second, there is the degree to which the distribution of results is comparativelyequalizing or not.
The results on the relationship between poverty and learning are shown in Figure 4.6.20
The variable used to denote learning is the Spanish (“comunicación integral”) results, butan analysis using mathematics (“lógico-matemática”) shows exactly the same results.
Three points are worth noting. First, the overall relationship is perhaps slightly non-linear, as can be seen from the shape of the results that are grouped below socioeconomicindex level 2 versus the rest of the results in Figure 4.6. Learning in Peru (at least in this keyassessment) appears to respond somewhat more steeply to the first improvements in socio-economic status than to subsequent improvements. To the degree that public expenditure
Toward High-quality Education in Peru 43
19. It should be noted that while the elasticity and concentration coefficients are ambiguous becausethe scales of the indices are arbitrary, span 0, and have means close to zero, the correlation coefficient, onthe other hand, being invariant to scale, is unambiguous, and there is a clear and high linear correlationbetween socioeconomic status and public benefits from school infrastructure and access to supplies. Thedistribution of infrastructure and supplies is poverty-enhancing rather than poverty-fighting.
20. The scale for the vertical axis was set at the minimum and the maximum of the individual studenttest scores in order to create a better sense of an absolute minimum and maximum. The scaling methodused for the learning scores, in the National Assessment 2001, does not have a theoretical minimum ormaximum at some unambiguous and simple set of points such as 0 and 100. Setting the minimum at 0therefore minimizes the range of differences observed in a graphical approach. On the other hand, settingthe minimum at the minimum of the school-level results exaggerates the differences because there arefew, if any, schools in which all students would have performed as badly as theoretically possible. Takingthe scores of the worst- and best-performing individual students as the bottom and top ends of the scaleseems logical and appropriate for a graphical depiction of the problem.
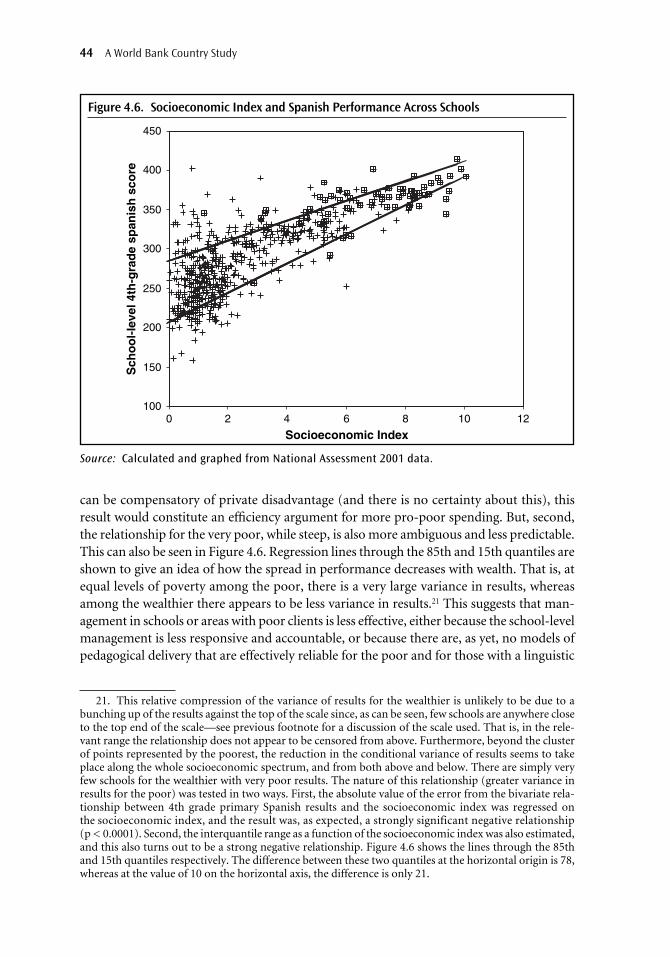
can be compensatory of private disadvantage (and there is no certainty about this), thisresult would constitute an efficiency argument for more pro-poor spending. But, second,the relationship for the very poor, while steep, is also more ambiguous and less predictable.This can also be seen in Figure 4.6. Regression lines through the 85th and 15th quantiles areshown to give an idea of how the spread in performance decreases with wealth. That is, atequal levels of poverty among the poor, there is a very large variance in results, whereasamong the wealthier there appears to be less variance in results.21 This suggests that man-agement in schools or areas with poor clients is less effective, either because the school-levelmanagement is less responsive and accountable, or because there are, as yet, no models ofpedagogical delivery that are effectively reliable for the poor and for those with a linguistic
44 A World Bank Country Study
Figure 4.6. Socioeconomic Index and Spanish Performance Across Schools
100
150
200
250
300
350
400
450
0 42 6 8 10 12
Socioeconomic Index
Sch
oo
l-le
vel 4
th-g
rad
e sp
anis
h s
core
Source: Calculated and graphed from National Assessment 2001 data.
21. This relative compression of the variance of results for the wealthier is unlikely to be due to abunching up of the results against the top of the scale since, as can be seen, few schools are anywhere closeto the top end of the scale—see previous footnote for a discussion of the scale used. That is, in the rele-vant range the relationship does not appear to be censored from above. Furthermore, beyond the clusterof points represented by the poorest, the reduction in the conditional variance of results seems to takeplace along the whole socioeconomic spectrum, and from both above and below. There are simply veryfew schools for the wealthier with very poor results. The nature of this relationship (greater variance inresults for the poor) was tested in two ways. First, the absolute value of the error from the bivariate rela-tionship between 4th grade primary Spanish results and the socioeconomic index was regressed on the socioeconomic index, and the result was, as expected, a strongly significant negative relationship(p < 0.0001). Second, the interquantile range as a function of the socioeconomic index was also estimated,and this also turns out to be a strong negative relationship. Figure 4.6 shows the lines through the 85thand 15th quantiles respectively. The difference between these two quantiles at the horizontal origin is 78,whereas at the value of 10 on the horizontal axis, the difference is only 21.

Toward High-quality Education in Peru 45
disadvantage. (Or else that poor schools are less predictably provided—and not simply lessprovided—with inputs than wealthier ones. But this is not the case. While the poor doindeed get less input, the variance in input supply to the poor is no greater than the variancein input supply to the less poor. This issue is dealt with below and elsewhere in this report.)The important point to note is that there are sources of inequality of results that are notpoverty-related, and yet these sources of inequality seem to operate more powerfully pre-cisely among the poor. In other words, it seems as if the poor are more subject than the less-poor to the inequality introduced by loose management, loose accountability, and theunreliability of the pedagogical models used.
Figure 4.7. Socioeconomic Index and Mother Tongue Across Schools
0
0.2
0.4
0.6
0.8
1
1.2
0 2 4 6 8 10 12
Socioeconomic Index
Sch
oo
l-le
vel p
erce
nta
ge
of
pu
pils
wh
osp
eak
Sp
anis
h a
t h
om
e
Source: Calculated and graphed from National Assessment 2001 data.
There are two other sources of variation among the poor that account for some of thevariation in results.
First, the language spoken at home. While many of the poor come from a non-Spanishspeaking environment, only a few of the better-off come from such environments. This isclearly shown in Figure 4.7. Thus, the larger variability in schooling results among the pooris partly due to larger variability of linguistic origin among the poor. Educational packagesfor the poor need to be sensitive to linguistic variability. A great deal of attention is paid tothis in Chapter 8.
However, a reasonable question is whether the greater variation in home languageamong the poor is behind the greater variation of results among the poor. To see whetherthis might be the case, one can take the residuals of a regression of learning results on homelanguage, and then see whether those residuals still show greater variance among the poorthan among the rich. The results are shown in Figure 4.8.

In fact, if one controls for home language there is still a great deal of variation among thepoor. The relatively higher variability among the poor than among the less poor is in fact 60 percent greater after controlling for home language. The way to interpret this is as follows.There is greater variability of results among poor people of equally non-Spanish origin thanamong less-poor people of equally non-Spanish origin. This again suggests that the issue isnot just the lack of good pedagogical models for the bilingual or for those whose home lan-guage is not Spanish but that—and completely aside from issues of home language—the poorare subject to greater variability of educational standards than the rich in terms of manage-ment and capable pedagogy. Luck counts for more in, for example, finding a good andresponsible teacher, if one is poor than if one is rich. The poor have not only worse teachers,but they have teachers whose behavior or quality is also much less consistent (including lessconsistently bad).
Second, there is the issue of nutrition. Not all of the poor are equally malnourished.While the poor are typically less well nourished than the non-poor, there is greater nour-ishment variability among the poor than among the non-poor, as Figure 4.9 shows. Povertyis hardly a good indicator of nutritional need. In fact, the top of the nourishment distrib-ution is essentially flat, and the relationship between socioeconomic status and nutritionis somewhat like a right triangle, in which many of the poor are as well-nourished as thewell-off but few of the well-off are malnourished. Note that, unfortunately, no strong data-base could be found with both nutritional or anthropometric data and learning results data
46 A World Bank Country Study
Figure 4.8. Variation of Results Among the Poor versus the Less Poor, After Controlling for Home Language
-150
-100
-50
0
50
100
150
0 2 4 6 8 10 12
Socioeconomic index
Res
idu
als
of
reg
ress
ion
of
Sp
anis
h r
esu
lts
on
ho
me
lan
gu
age
Source: Calculated and graphed from National Assessment 2001 data.

on the same children. Thus, the direct impact of nutrition on learning could not be estab-lished, and there is not much in the Peruvian literature on this issue. Nonetheless, theresults are telling. Improving the educational results among the poor, and picking up thelower end of the distribution, likely means being able to improve nutrition as well as edu-cational standards. However, by the time children reach school most of the nutritionaldamage is done. Thus, unless some creative way is found to use schools to reach the poorbefore they are even in school, ensuring as such that the nutrition of future young schol-ars can be improved via the education system, the problem is likely to remain more inter-sectoral than educational. In any case, to propose that teachers should be made responsiblefor the nutritional status of children in the 0–5 age range in their villages would require con-siderable further analysis.
Toward High-quality Education in Peru 47
Figure 4.9. Nutritional Variability among the Poor and Non-poor
Source: Calculated from the Encuesta Demográfica y de Salud Familiar (ENDES) 2000. The indica-tor used was height-for-age in terms of standard deviations from the international benchmarkmean, as expressed as basis points.
Unfortunately, it was impossible to see whether the observed phenomenon of greaterlearning variation among the poor remains once one takes into account the greater nutritionalvariation for the same group because the large student achievement databases do notinclude data on nutritional status. As should be noted from the analysis just carried out onlanguage, the mere fact that there is greater variability in nutritional status among the poor(just as there is greater variability in home language among the poor) cannot be taken asindicative that if one corrects for nutrition, the greater variability in learning results amongthe poor will disappear.

A third point to note is that the results of public and private schools seem about equallysensitive to poverty, including the problem of greater heterogeneity of results among thepoor. This last point is merely suggestive, as there are not enough data points for privateschools to make this a safe conclusion. Figure 4.6, above, shows private schools with a squaresymbol imposed on the symbol for all schools. This demonstrates essentially the same pat-terns of relationship between socioeconomic status and achievement for private schools asfor public schools.
It is unlikely that the variance of results among the poor is simply due to a variance ofinput provision among the same group since the variance of results as driven by input pro-vision is itself also greater at low levels of input provision, and since the variance in input sup-ply to the poorer is not higher—if anything it is lower—than variance in input supply to theless poor. Figure 4.10 shows greater variance in learning at low levels of input provision thanat higher levels of input provision: the same pattern seen in response to socioeconomic sta-tus. This is shown both for infrastructure and general supplies in the same figure.
48 A World Bank Country Study
Figure 4.10. Infrastructure, Supplies, and Learning Results
120
170
220
270
320
370
420
470
0 1 2 3 4 5 6 7 8Infrastructure and supplies indices
Sp
anis
h r
esu
lts,
4th
gra
de
pri
mar
y
Infrastructure
Supplies
Source: Calculated and graphed from National Assessment 2001 data.
Figure 4.11 and Figure 4.12 make the point that input supply to the poor appears tobe no more variable than input supply to the rich—on the contrary, while the poor areworse-supplied than the rich, they are more predictably badly supplied than the rich arewell-supplied. As shown by the quantile regression lines in Figure 4.11 and Figure 4.12,there is actually less variability among the poor in the supply of, say, infrastructure, pre-

cisely because they are the recipients of uniformly bad infrastructure.22 Thus, greater vari-ability of results among the poor seems unlikely to be caused mainly by greater variabilityin input supply to the poor, even if poorer results among the poor are partly caused by lessinput supply. As has been seen, variance in results among the poor is very large. Instead,the explanation seems to be that the poor receive the worst management and are subjectedto untested as well as inappropriate pedagogical methods (for their culture and needs),which produce highly variable results instead of simply uniformly bad results amongst thegroup in question.
The second aspect of the relationship between poverty and results is the distribution ofresults by income group, or the concentration coefficient of the results. For this result, weused data from the results of the National Assessment 2001 for 4th grade Spanish (“comu-nicación integral”). To calculate the concentration coefficient of results distribution across
Toward High-quality Education in Peru 49
22. The quantile regressions are non-linear (quadratic) in Figure 4.11 to capture the fact that the gen-eral relationship, and its conditional variance, seem to be non-linear. The regressions are through the 85thand 15th quantiles (25th in Figure 4.12). Whether the variance ultimately begins to decrease toward thevery top of the income distribution (after widening for the less-poor in general) is difficult to say and prob-ably not very important. This analysis is carried out with all schools (public and private). An analysis wasalso carried out with only public schools and the basic results are not different.
Figure 4.11. Socioeconomic Index and Quality of Input Supply
0
1
2
3
4
5
6
0 2 4 6 8 10
Socioeconomic Index
Ind
ex o
f Q
ual
ity
of
Sch
oo
l In
fras
tru
ctu
re
Source: Graphed from data in the National Assessment 2001.

50 A World Bank Country Study
Figure 4.12. Socioeconomic Index and Infrastructure Supply
0
1
2
3
4
5
6
7
8
9
0 2 4 6 8 10
Socioeconomic Index
Gen
eral
inp
ut
sup
ply
ind
ex
Source: Graphed from data in the National Assessment 2001.
schools, they were ranked according to the socioeconomic index of the families of the chil-dren in the schools. To make the results comparable to the concept of “income,” the lowestvalue in the results was reset to zero, and all the other values were reset by subtracting thelowest value. The resulting concentration coefficient was 0.12. It should be noted that thisis not the “pure” inequality of the results themselves (that is, the results were not used torank the students—socioeconomic status was). Instead, this is the concentration coefficientof the results incidence by socioeconomic group. It is also to be noted that the ranking cri-terion was the socioeconomic status as provided by the National Assessment. In any case,the result is that learning achievement in Peru is distributed somewhat unequally but muchmore equally than income or private expenditure on education.
This section has shown that poverty is strongly predictive of learning results, but thatthis relationship weakens considerably among the poor. It has also argued that the distrib-ution of results should matter more—as a social goal—than the distribution of inputs. Ithas shown that the distribution of the most expensive input, namely teachers, seems tofavor the poor if the analysis is done at a sufficiently micro level (though most likely, judg-ing from the evidence at the province level, this is not so much because they are poor butbecause those who are poorest happen to live in areas that are sparsely populated, andhence it is difficult to achieve a high pupil-teacher ratio). In this respect, it is logical to beconcerned with whether the distribution of teachers at least helps to achieve results. Sinceteachers represent such a high proportion of total costs, if the pupil-teacher ratio is not pre-

dictive of learning results,then, in general, resourcesare not likely to explainresults. Along these lines,tracking the pupil-teacherratio as a matter of costwould make sense but notbecause it is an importantcorrelate of quality.
Figure 4.13 and Fig-ure 4.14 show the correla-tion between results and thepupil-teacher ratio, using4th grade primary Spanishresults as a case in point. Thefirst figure shows the rela-tionship between the pupil-teacher ratio and the actualresults. It shows essentiallyno relationship (or indeeda counter-intuitive relationship: the higher the pupil-teacher ratio, the better the results)between the pupil-teacher ratio and the results (r = 0.32). However, this may be due to theinfluence of other factors. As noted, lower pupil-teacher ratios are associated with poverty(probably because poverty is associated with low population density). If lower pupil-teacher ratios exert a positive influence on results holding poverty constant, but povertyexerts a negative influence, then the impact of the pupil-teacher ratio, if one does not holdpoverty constant, would be very weak or actually positive (if poverty exerts a very stronginfluence, and the poor have much lower pupil-teacher ratios). To assess this, the secondfigure shows the impact of the pupil-teacher ratio on the residuals of a regression that con-trols for all other likely factors.23 This shows no relationship (r = −0.01). This lack of rela-tionship is a particular concern in light of the result, discussed elsewhere in this report,showing that teacher expenditure is crowding out most other forms of expenditure in thesector. In sum, it appears as if a great deal of cost goes towards an input that shows littlecorrelation with learning results.
We thus have a situation where poverty is generally predictive of results, and whereresults are therefore regressively distributed. Furthermore, we have observed large varia-tions in results among the poor for factors that have little to do with poverty itself. We haveshown that there is little relationship between the key input, the pupil-teacher ratio, andresults. Thus, it seems a safe conclusion that the variability in results among the poor ismore related to management—in a broad sense (accountability, existence of effective andreliable instructional models and standards, etc.)—than to anything else.
Toward High-quality Education in Peru 51
Figure 4.13. Learning Results and Pupil-Teacher Ratio
120
170
220
270
320
370
420
470
0 20 40 60 80
Pupil-teacher ratio
Lea
rnin
g o
utc
om
es ,
4th
gra
de
pri
mar
y sp
anis
h
23. The model used was a school (or, in fact, classroom) level model using poverty, children’s mothertongue, whether the region is bilingual, private vs. public ownership of the school, whether the childrenwork during the week, and how well the teachers prepare for class. This model has considerable explana-tory power (R2 = 0.73).

Summary of Inequalityof Benefits
The following table sum-marizes various conceptsof distribution of benefits,focusing on primary educa-tion as an important case inpoint.
Education spendinglooks most pro-poor if oneconsiders the distributionof students attending pub-lic education across incomequintiles, which implicitlyassumes equal spendingper student (row 1). If onerelaxes this assumption andallows for unequal spendingper student in public edu-cation, then spending seems
52 A World Bank Country Study
Table 4.10. Summary on Inequality of Various Educational Benefits
Concept Concentration coefficient
1. Distribution of beneficiaries attending public −0.28schools, in primary education, across all income quintiles (assumes equal per student spending across quintiles.)
2. Distribution of public spending (“benefits”) −0.26on public schools in primary education across all income quintiles (allows spending to vary by quintile.)
3. Distribution of pupil-teacher ratio within −0.26public primary schools.
4. Distribution of pupil-teacher ratio (including −0.14public and private primary schools).
5. Distribution of infrastructure and supplies to 0.10–0.15 or as high as 0.34 for beneficiaries within primary public education. specific inputs, such as electricity
in public schools.
6. Distribution of learning results in Spanish, 0.124th grade primary, across all (public and private) schools.
7. Total private spending on education (private 0.55spending in public and private schools on uniforms, books, PTA fees, instructional fees, etc.).
8. Distribution of total household expenditure. 0.45–0.50
Source: Calculated by the authors as explained in the text.
Figure 4.14. Learning Results Residuals and Pupil-Teacher Ratio
-100
-50
0
50
100
150
0 20 40 60 80
Pupil-teacher ratio
Lea
rnin
g o
utc
om
e re
sid
ual
s fr
om
oth
er f
acto
rs,
4th
gra
de
pri
mar
y sp
anis
h
Source: Calculated and graphed from National Assessment2001 data.

a little less pro-poor (row 2). The distribution of teachers in the sector as a whole (henceteachers paid for with public and private funds, in public and private schools) is progressive(row 4), but less so than the distribution of public benefits. The distribution of teacherswithin the public sector is about the same as the distribution of expenditure across incomequintiles (row 3). The distribution of infrastructural and supply inputs is anti-poor (row 5).The distribution of learning results in the society (row 6, taking both public and privateschools) is much more unequal than the distribution of resources under any definition(except perhaps for infrastructure resources). The distribution of private spending on edu-cation is the most unequal distribution (row 7) in the table. This distribution might go a longway towards explaining why the distribution of results is more unequal than the distributionof public resources: private expenditure on education is considerable, and very unequallydistributed (in fact, more unequal than total private expenditure). The distribution of resultsis much more equal than the distribution of total private family expenditure (rows 8 and 6),which mirrors the distribution of income (the distribution of income is probably somewhatmore unequal than the distribution of expenditure, but income data in the household surveysused in this study are not as reliable as expenditure data). In this sense, and in spite of theproductivity and distribution problems in the sector, it should be noted that the sector’sresults are still equalizing (to the degree that learning results may be somewhat predictiveof future income). However, given the large variance in results among the poor, it is alsoclear that the situation could be improved—education could in principle be made somewhatmore equalizing. It is true that better distribution of resources is a constraint to better results,in principle, because (to the degree publicly-provided resources can compensate for poverty)results improve with reductions in poverty. Yet, if one attempted to use fiscal or resourcetransfers as a sort of “income replacement” (given the association between poverty andresults), it should be noted that particularly among the poor, the response of results to socio-economic status is unpredictable: the variance of results among the poor, for any givenlevel of socioeconomic status, is higher than for higher levels of socioeconomic status. Thissuggests that the sequencing of reform should be to improve management (understoodbroadly to include not only more accountability for results and standards, but also the devel-opment and spread of pedagogical and other support models that are predictably effective atimproving learning among the poor) of schools, particularly where the poor are the clients,and then increase spending among the poor in ways that can (partially) compensate fortheir poverty either through redistribution or through improved overall spending.
As a methodological conclusion, finally, the gap between the −0.28 in the first row, andthe 0.12 in the sixth row is notable and suggests that standard incidence analysis could bequite misleading, if what one cares about is learning. Primary education provision, writlarge (looking across the public and private sectors) and considering learning itself, is muchless equalizing than traditional “benefit” analysis (where “benefit” is taken to be proxiedby spending) would normally lead one to believe.
Special Focus on Teacher Costs
Labor costs in Peruvian education are generally recognized as crowding out other inputs.This is covered in previous sections of this report, where it is shown just how quickly salarycosts are increasing as a share of total expenditure. This section assesses the sources of this
Toward High-quality Education in Peru 53

54 A World Bank Country Study
pressure, and whether the pressure is in some sense justified with respect to some bench-marks. Two sources of pressure are considered: the pupil-teacher ratio, which drives thetotal number of teachers (assuming enrollment growth is low, which, as has been notedpreviously, is the case) and the cost per teacher. This section also assesses to what degreethere has been some protection for some other key inputs, specifically textbooks.
Pupil-teacher Ratio Decrease as a Source of Pressure
Table 4.11 shows the basic data on the pupil-teacher ratio in Peru and in the rest of LatinAmerica. A few factors stand out. First, in terms of the average level and the rate of change,Peru is close to the median for Latin America—though lower for secondary education. Almostall countries tend to lower their pupil-teacher ratios over time as they grow economically(and partly as a result of social pressures and expectations, not only because a lower ratiobecomes more affordable with growth). Peru and Latin America in general are no exception,and Peru is not outside the norm for Latin America. However, if one considers the fact thatPeru’s GDP per capita is considerably lower than that for Latin America as a whole (whichwould suggest a higher pupil-teacher ratio), then Peru’s pupil-teacher ratios seem a littlelower than is justified.24 Using a GDP-driven norm, Peru’s expected pupil-teacher ratio, atthe primary level, would be about 26.4 in the year 2000 and 20.6 at the secondary level.25
This is a little higher than the actual values in 2000 for primary and considerably higherthan the actual value for secondary, though some of this could be due to measurement orreporting errors. (Ratios tend to be over-reported in international data, whereas Peru’sratios (below) are from the country’s own sources.) It seems a safe conclusion that the pres-sure on non-salary expenditure does come partially from too low a pupil-teacher ratio. Thisis particularly the case if one considers that lowering the pupil-teacher ratio is by no means anecessary condition for education success, as much research and the experience of East Asiain the 1970s and 1980s demonstrates (though population densities there are much higher thanin Latin America, which makes high pupil-teacher ratios administratively feasible). Note thatnone of Peru’s own research, as reported in Chapter 2, suggests that lowering the pupil-teacherratio has a positive impact on learning, much less a cost-effective impact. And it is particularlystriking when one notes, as is made clear elsewhere in this report, that low pupil-teacher ratiosare at not at all correlated with greater achievement in Peruvian education.
However, in explaining the current dynamics of pressure on the budget, the rate ofchange in the pupil-teacher ratio, rather than its level compared to the rest of Latin Amer-ica, is the most important issue. Table 4.11 shows that this ratio has been decreasing overthe past few years at a rate fairly consistent with that of the rest of Latin America, in spiteof the fact that the ratio is already fairly low in Peru.
24. The Latin America-wide correlation between the primary pupil-teacher ratio and (the logarithmof) GDP per capita is 0.6. At the secondary level it is 0.42.
25. It might be argued that an important determinant of the pupil-teacher ratio is population den-sity, and that, because Peru has a lower population density than other Latin American countries, it is rea-sonable to expect a lower pupil-teacher ratio. However, the Latin America-wide correlation between thepupil-teacher ratio and population density is only −0.12. In any case, if one includes population densityin an equation to drive an expectation of pupil-teacher ratios, the expected value for Peru does not change.The expected value is still a little higher than the actual value: Peru’s pupil-teacher ratios are thus a littlelower than expected.

Toward High-quality Education in Peru 55
Table 4.11. Pupil Teacher Ratios in Peru and Average for Latin America
1998 1999 2000 2001 2002 2003 LA MRE
Primary urban 24.5 24.3 23.6 23.5 23.1 22.4 NA
Secondary urban 17.7 17.9 17.3 17.3 17.4 16.8 NA
Primary rural 26.9 27.0 26.3 25.9 24.9 24.4 NA
Secondary rural 14.0 14.3 14.4 14.8 14.8 15.0 NA
Primary total 25.4 25.3 24.6 24.4 23.7 23.1 23.9
Secondary total 17.1 17.2 16.8 16.8 16.9 16.4 19.2
Yearly decrease, primary, −1.9% −1.8%average 1998–2003
Yearly decrease, secondary −0.7% NA
Yearly decrease, total −1.7% NA
Sources:Peruvian data: Ministerio de Educación, Unidad de Estadística Educativa, Cifras de la Educación1998–2003. Latin America data: EDSTATS.Note:Secondary pupil-teacher data for Latin America as a whole are available for too short a period topermit estimation of a trend.
The sources of pressures on teacher numbers can be summarized as follows: studentnumbers (in primary and secondary—the bulk of the students) have been growing at 0.9 per-cent, and the number of teachers has been growing at 2.6 percent. The resultant pupil-teacherratio has therefore been growing at −1.7 percent. As a source of pressure on the numbers ofteachers, then, growth in enrollment is one-third of the pressure, and growth in the pupil-teacher ratio is two-thirds of the pressure.
Recent Salary Increases as a Source of Pressure
The second overall source of pressure on costs is teacher salaries. Table 4.12 shows the evo-lution of teacher salaries over the last few years.
Table 4.12. Teacher Salaries in Peru, 1999–2004
Year Total monthly Pay Increase Date of increase
1999 (year-start) 730.33 108.26 April 1999
2000 (year-start) 838.59 None NA
2001 838.59 None NA
2002 838.59 None NA
2003 (year-end) 938.59 100 May 2003
2004 (year-end) 1053.59 70, then 45 May, August 2003
Percent increase 2004/1999 (year-start) 7.6%
Percent increase 2004/1999 (year-end) 4.7%
Note: Uses level III teacher working 30 hours as a case in point.Source: Ministry of Education, Secretaría de Planificación Estratégica.

56 A World Bank Country Study
Because the increases often take place sometime after the start of the year (in 2004 theytook place in May and August), it is difficult to know when to calculate a year-on-year per-centage increase. Taking both of the calculations reported in Table 4.12 (7.6 percent and4.7 percent), we get an average of 6.1 percent. In a previous section we noted that, calcu-lating on the basis of whole fiscal years, the growth in the labor bill has been 8.6 percent. Thiscan now be de-composed into approximately 6.1 percent for salary increases, and 2.6 percentfor increases in numbers of teachers.
Taking all of these pressures into account, the total pressure on the salary bill can bedecomposed (in round numbers) as follows:
■ 70 percent due to salary increases■ 30 percent due to increases in teacher numbers, of which
● 20 percent is due to improvements (decreases) in the pupil-teacher ratio● 10 percent is due to the growth in enrollments.
It seems fairly clear that further reductions in the pupil-teacher ratio should be care-fully resisted. Note, however, that this has been only 20 percent of the pressure on totalsalary costs. Further increases in salaries need to be justified by way of a more thoroughassessment of whether salaries are too low relative to various norms. In any case, increasesshould be tied to accountability measures.
Is the Absolute Level of Teacher Salaries Low in Peru?
Whether the pressure from increases in teacher salaries is justified in Peru is related towhether salaries are low, or have been low in the recent past. Evidently, if salaries are “toolow,” then some upward pressure, for some time, is justified. Unfortunately the evidenceon this issue, for Peru as well as for the rest of Latin America, is not very good.
A relatively simple strategy is to compare teacher salaries, or total teacher compensa-tion, to GDP per capita. The OECD has carried out such comparisons (OECD 2005). InPeru, teachers at the top of the salary scale earn the same as GDP per capita: the ratio ofteacher salaries to GDP per capita is 1.0. In Latin America as a whole, this ratio is 1.35.However, this refers to a 20-hour teaching load and most teachers in Peru work more thanthis, so the comparison is not satisfying.
It has become common in Peru to decry the fact that teachers some decades ago earnedmuch better salaries (the peak was 1966—see Díaz and Saavedra 2000); they were consid-ered to be of a higher social class than is the case today. It is clear that relative salaries havedropped in Peru when compared with previous decades. Yet, this phenomenon is actuallyfairly typical of development. In very poor African countries, the ratio of teacher earningsto GDP per capita is often as high as 5.0 or even more. In poor countries, teachers are anelite. As development proceeds, teachers tend to originate, more and more, from the mid-dle of the social spectrum. The same OECD data show that in developing countries as awhole, teacher salaries as a ratio of GDP per capita are at 1.96, whereas for developed coun-tries they are at 1.33. Data compiled by Carnoy and Welmond (no date) show a clear neg-ative relationship between GDP per capita and the ratio of teacher costs to GDP per capita(t-value = 7.8). This relationship is non-linear: as countries move from low-income tomiddle-income status, teacher salaries relative to GDP per capita drop extremely quickly,
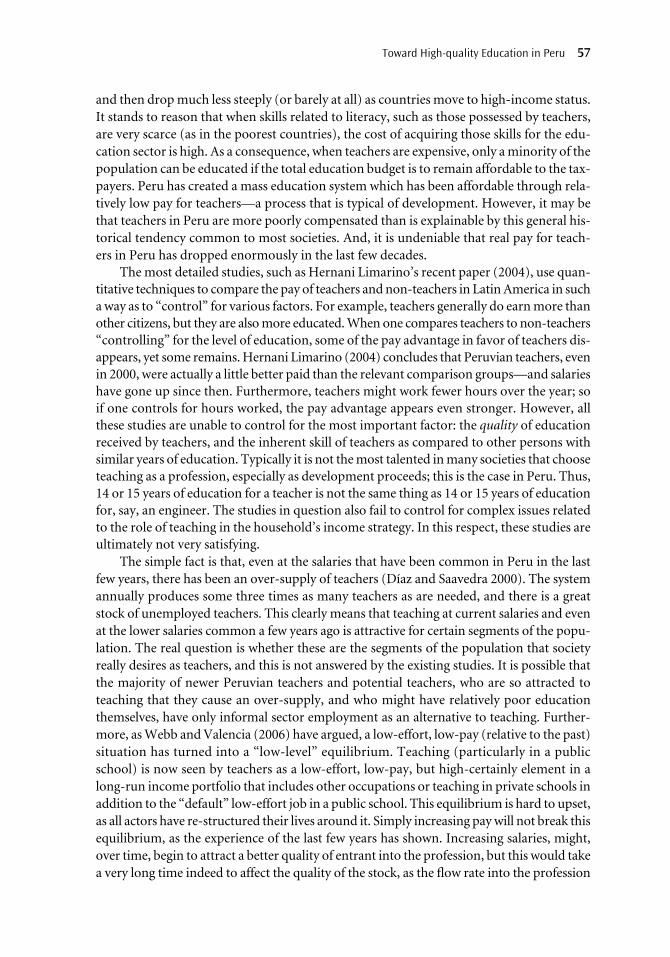
and then drop much less steeply (or barely at all) as countries move to high-income status.It stands to reason that when skills related to literacy, such as those possessed by teachers,are very scarce (as in the poorest countries), the cost of acquiring those skills for the edu-cation sector is high. As a consequence, when teachers are expensive, only a minority of thepopulation can be educated if the total education budget is to remain affordable to the tax-payers. Peru has created a mass education system which has been affordable through rela-tively low pay for teachers—a process that is typical of development. However, it may bethat teachers in Peru are more poorly compensated than is explainable by this general his-torical tendency common to most societies. And, it is undeniable that real pay for teach-ers in Peru has dropped enormously in the last few decades.
The most detailed studies, such as Hernani Limarino’s recent paper (2004), use quan-titative techniques to compare the pay of teachers and non-teachers in Latin America in sucha way as to “control” for various factors. For example, teachers generally do earn more thanother citizens, but they are also more educated. When one compares teachers to non-teachers“controlling” for the level of education, some of the pay advantage in favor of teachers dis-appears, yet some remains. Hernani Limarino (2004) concludes that Peruvian teachers, evenin 2000, were actually a little better paid than the relevant comparison groups—and salarieshave gone up since then. Furthermore, teachers might work fewer hours over the year; soif one controls for hours worked, the pay advantage appears even stronger. However, allthese studies are unable to control for the most important factor: the quality of educationreceived by teachers, and the inherent skill of teachers as compared to other persons withsimilar years of education. Typically it is not the most talented in many societies that chooseteaching as a profession, especially as development proceeds; this is the case in Peru. Thus,14 or 15 years of education for a teacher is not the same thing as 14 or 15 years of educationfor, say, an engineer. The studies in question also fail to control for complex issues relatedto the role of teaching in the household’s income strategy. In this respect, these studies areultimately not very satisfying.
The simple fact is that, even at the salaries that have been common in Peru in the lastfew years, there has been an over-supply of teachers (Díaz and Saavedra 2000). The systemannually produces some three times as many teachers as are needed, and there is a greatstock of unemployed teachers. This clearly means that teaching at current salaries and evenat the lower salaries common a few years ago is attractive for certain segments of the popu-lation. The real question is whether these are the segments of the population that societyreally desires as teachers, and this is not answered by the existing studies. It is possible thatthe majority of newer Peruvian teachers and potential teachers, who are so attracted toteaching that they cause an over-supply, and who might have relatively poor educationthemselves, have only informal sector employment as an alternative to teaching. Further-more, as Webb and Valencia (2006) have argued, a low-effort, low-pay (relative to the past)situation has turned into a “low-level” equilibrium. Teaching (particularly in a publicschool) is now seen by teachers as a low-effort, low-pay, but high-certainly element in along-run income portfolio that includes other occupations or teaching in private schools inaddition to the “default” low-effort job in a public school. This equilibrium is hard to upset,as all actors have re-structured their lives around it. Simply increasing pay will not break thisequilibrium, as the experience of the last few years has shown. Increasing salaries, might,over time, begin to attract a better quality of entrant into the profession, but this would takea very long time indeed to affect the quality of the stock, as the flow rate into the profession
Toward High-quality Education in Peru 57

is extremely low and would tend to become even lower with across-the-board salaryincreases. Thus, improved salaries are a worthwhile policy option only if the system is ableto administratively distinguish and keep good as opposed to poor candidates via selectionby testing, rewards linked to real skill and performance, and other means. There is no pointin generating a nominal over-supply if this oversupply cannot be used to drive up thequality of actual entrants into the profession as well as that of those who remain in it. Yetthe teacher unions, and to some degree the political classes, have often been resistant to suchselection measures (even though individual teachers may favor selection and merit-paymeasures—see Rivero 2002). Furthermore, as noted above, salaries have increased inrecent times. For all these reasons further salary increases should be resisted until betterselection and career progression methods are devised and firmly implanted—methodsthat do in fact select individuals with more skill and devotion to enter and stay in theprofession.
Other Input Supplies
In a previous section it was noted that salaries as a proportion of total expenditure haveincreased from 71 percent of total expenditure in 1999 to 75 percent in 2005. This is a sig-nificant change. The biggest compensatory change, making room for the increase insalaries as a proportion of spending, has been a significant decline in investment and inother capital expenditures. Financial investment, debt amortization, and interest repay-ment have in any case been a small part of capital expenditure, and have not, as a propor-tion, changed much. As can be seen in the previous section, expenditure on goods andservices has generally not suffered—it has been maintained at about 12 or 13 percent oftotal expenditure. More specifically, provision of items such as textbooks has been pro-tected, and, as Table 4.13 shows, provision has been maintained.
Unlike teachers, whose cost takes up so much of the budget and shows little or no rela-tionship to learning, the provision or access to other materials does show some relationshipto measured learning. As noted in many other sections, the relationship is weakest with lowlevels of provision: there tend to be fewer materials in poor areas, and in those areas the pro-vision of materials is less predictably associated with learning results. Figure 4.15 and Fig-ure 4.16 make these two points: first, poorer schools do have less supplies—and supplies domake a difference (they make a difference in a multivariate context as well)—but they makea less predictable difference among the poor, which means that supplies can and should bemaintained, and if possible, should be more focused on the poor; second, management, par-ticularly in schools in poor areas, needs to be tightened up so as to increase the predictabil-ity with which supplies lead to improved performance.26 Nonetheless, while managementcan be improved, it is important to insist on continuing to provide these sorts of inputs sincethey are among the few that seem to have a fairly clear relationship to learning.
58 A World Bank Country Study
26. Both figures use the data from the 2001 National Assessment, namely the socioeconomic index ofstudents, the index of supplies or inputs at school (other than infrastructure) and the results in 4th gradeprimary Spanish. The correlation was established with the overall index of educational resources, not withbooks as such. Note also that there is no distinction made here between publicly-provided inputs andthose obtained by a school with its own resources.

Toward High-quality Education in Peru 59
Table 4.13. Textbook Provision in Peru: Selected Data
Purchased, per child inprimary school Availability at UGEL level Availability per child
1999 1.65 0.83
2000 1.79 0.90
2001 2.23 1.11
2002 2.10 1.05
2003 1.75 1.76 0.88
2004 2.23 1.11
Notes:Column 1 is the number of textbooks in Spanish (“Comunicación Integral”) and Mathematics(“Lógico-Matemática”) purchased by the Ministry, divided by the total number of studentsenrolled.Column 2 is the number of textbooks per child in the same two subjects at UGEL levelColumn 3 is the result of dividing column 1 or 2 by 2, since in principle children are to receivetwo texts.Sources:Column 1: Consejo Nacional de Educación, MAPEI Information DatabaseColumn 2: From Presentation by JP Silva, October 5, 2004, “Sistema de Seguimiento del GastoPúblico” at Workshop on Protected Social Programs, Lima, Perú, October 5, 2004.Column 3: From Presentation by JP Silva, October 5, 2004, “Sistema de Seguimiento del GastoPúblico” at Workshop on Protected Social Programs, Lima, Perú, October 5, 2004.
Figure 4.15. Socioeconomic Index and School Supplies
0
2
4
6
8
10
12
321 4 5 6 7 8 9 10 11
Socio-economic status
Sch
oo
ls s
up
plie
s in
dex
r=0.66
Source: Calculated and graphed from National Assessment 2001 data.
60 A World Bank Country Study
Figure 4.16. School Supplies and Learning
120
170
220
270
320
370
420
470
0 1 2 3 4 5 6 7 8
Supplies index
Sp
anis
h r
esu
lts,
4th
gra
de
pri
mar
y
Source: Calculated and graphed from National Assessment 2001 data.
It has been noted that about 65 percent of Peruvian children finish high school. Hence,the cumulative dropout rate is about 35 percent. Whether this can be considered aproblem is a matter of perspective. By Latin American standards, this cumulative
dropout rate is fairly low—that is, Peru has a high secondary school completion rate. Notonly that, but using a world-wide perspective (i.e., comparing to countries such as Koreaor Thailand), Peru is much further behind on learning achievement at the secondary levelthan it is on high-school completion. This was also demonstrated above. Peru’s educa-tion system is heavily unbalanced toward access and completion in comparison to that ofother countries, and biased against actual learning. Nonetheless, policy authorities maywish to address the dropout issue. In that case, it is important to ascertain why youthsdrop out. The main policy conclusion of this Chapter is that, at least at the current mar-gin, the accessibility of secondary schools does not appear to be the problem. Hence,building schools, as a main policy action, is not a recommended means to address thedropout problem. Most likely, demand stimulation measures, such as conditional cashtransfers, would be needed. This is not to say schools are currently under-utilized or thatthe pattern of distribution of infrastructure of acceptable quality is equitable. It may be thatschool building in the past has actually been fairly well reactive, in an endogenous sense,to existing local demand. In this case, schools could be more or less well utilized and yetnot be a constraint to further enrollment, meaning there is an equilibrium. Furthermore,
CHAPTER 5
Why Don’t Some PeruvianChildren Finish High School?27
61
27. This section is based on the author’s interpretation of “Análisis de la deserción escolar en el Perú:evidencias a partir de encuestas y de técnicas cualitativas,” by Lorena Alcázar and Néstor Valdivia ofGRADE. The work of Pablo Lavado on estimating rates of return to education was also particularly valu-able in this section.

it is clear that the quality of infrastructure for the poor is worse than for the better off, asdescribed above. Both of these facts suggest that while one should not be cavalier aboutinfrastructure in general, quantity of infrastructure does not seem to be the main con-straint to further enrollment, or greater retention. This section documents the reasonsthat do seem to be associated with dropping out behavior in Peru.
The Quantitative Evidence
The numerical evidence, based on surveys, is clear. Table 5.1, which uses two indepen-dent surveys, makes it clear that the distance to school—or lack of school availability—as a factor contributing to drop-out behavior is a distant fourth reason (among a set offour main reasons) and does not amount to more than about 5 percent of the dropouts,even in rural areas. Economic reasons in general are far and away the most importantreason for dropping out. Among women specifically, and taking a broader age group,family reasons are about as important as economic reasons. There are some differencesbetween urban and rural areas—in urban areas dropouts are more likely to find work,or to state that they dropped out in order to work. In rural areas school non-availabilityis a more important factor, but the problem still does not amount to more than 5 per-cent of the dropouts. To put things in perspective, out of a typical cohort of, say, 16 or17 year-olds, around 35 percent are not finishing high school, and of these about 3 per-cent claim to have dropped out because there is no school nearby. Thus, having nonearby school is a problem that seems to affect only some 1 percent of any given cohortof youths. In the rural areas the problem is worse. 70 percent of children do not finishhigh school. Yet even here, only 5 percent claim to drop out due to lack of schooling facil-ities, suggesting that lack of schooling infrastructure affects only some 3.5 percent ofrural youths.
If one assumes that “economic reasons” refer to a combination of inability to payschool fees, availability of work or need to work, as well as other factors related to povertysuch as the need to help around the house, it seems that poverty is, generically, the keydeterminant of dropping out behavior. The policy implication appears straightforward:either generic poverty-fighting, or some form of conditional cash-transfer mechanismwould be needed to deal with the dropout problem.
Other reasons are important. Family and health issues (including pregnancy) are thesecond most important cause of dropping out, particularly among females. School qualityand relevance, as the third most important factor, are responsible for a large proportion ofdropping out behavior.
Aside from direct questions regarding reasons for dropping out, it is possible to indi-rectly ascertain the correlates of dropping out behavior. The following three graphs, usingdata from the 2004 ENAHO, show three possible correlates of dropping out behavior:income or socioeconomic status, place of residence, and gender, in that order. The ratio ofenrolled population to total population, by age, is taken as an index of dropout behavior.The graphs make it very clear that income and place of residence are important correlatesof dropping out behavior, whereas gender is not.
It is also possible to look at similar data by grade, rather than age. One can take enroll-ment in any grade, minus repetition in that grade (if available), divided by the population
62 A World Bank Country Study

Toward High-quality Education in Peru 63
Table 5.1. Quantitative Evidence on School Dropping Out
Explicit reasons for dropping out, as provided by dropouts (respondentsaged 6–25 who where not in school andhad not finished secondary school)
Rural Urban Total
1. Military service 0.5 0.5 0.5
2. Working 10.6 24.9 16.1
3. No adult learning 0.6 0.3 0.5center nearby
4. No school nearby 4.4 0.2 2.8
5. Not interested or 12.5 12.3 12.4don’t like school
6. Illness 3.7 5.7 4.5
7. Economic 37.1 33.4 35.7problems
8. Family problems 18.2 9.9 15.1
9. Low grades or 1 0.9 1school failure
10. House work 9.6 9.1 9.5
11. Others 1.9 2.6 2.2
Summary reasons
Economic (2, 7, 10) 57.3 67.4 61.3
School quality/ 13.5 13.2 13.4appropriateness/interest (5, 9)
Family problems 21.9 15.6 19.6and health (6, 8)
No schooling 5 0.5 3.3facilities (3, 4)
Reasons for dropping out,women 15–49 not in school
Rural Urban Total
1. Pregnant 10.1 13.8 12
2. Got married 7.4 5.3 8
3. Needed to take 4.7 3.7 4care of children
4. Family needed 19.2 2.9 3help
5. Could not afford 15.8 20.4 20school fees
6. Illness 2.4 2.0
7. Needed to earn 9.7 26.1 17money
8. Graduated/felt 2.6 8.3 6sufficientlyeducated
9. Failed entrance 0.9 2.2 2exams
10. Did not like 14.2 6.1 10school
11. School or teachers 6.1 0.7 2unavailable
12. Other or NA 6.8 8.6 11
Summary reasons
Economic (5, 7) 25.5 46.5 37.0
School quality/ 17.7 16.7 18.0relevance(8, 9, 10)
Pregnancy and other 41.5 25.7 27.0family reasons(1, 2, 3, 4)
No schooling 6.1 0.7 2.0nearby (10)
Source: ENAHO 2003 (National HouseholdSurvey).
Source: ENDES 2000 (Demographic and FamilyHealth Survey).
of the nominally-appropriate age, as an index of dropping out behavior. Unfortunately,ENAHO data on enrollment by grade do not seem very trustworthy (there are odd anddifficult-to-explain discontinuities in the data), and do not indicate whether the student isa repeater or not. Instead, Ministry of Education data are used. A small disadvantage withthese data is that the denominator of the index is from a projected source (demographicprojections from INEI) that is different from the source of the numerator (Ministry of Edu-cation management information systems). Nonetheless, the data are useful and confirm
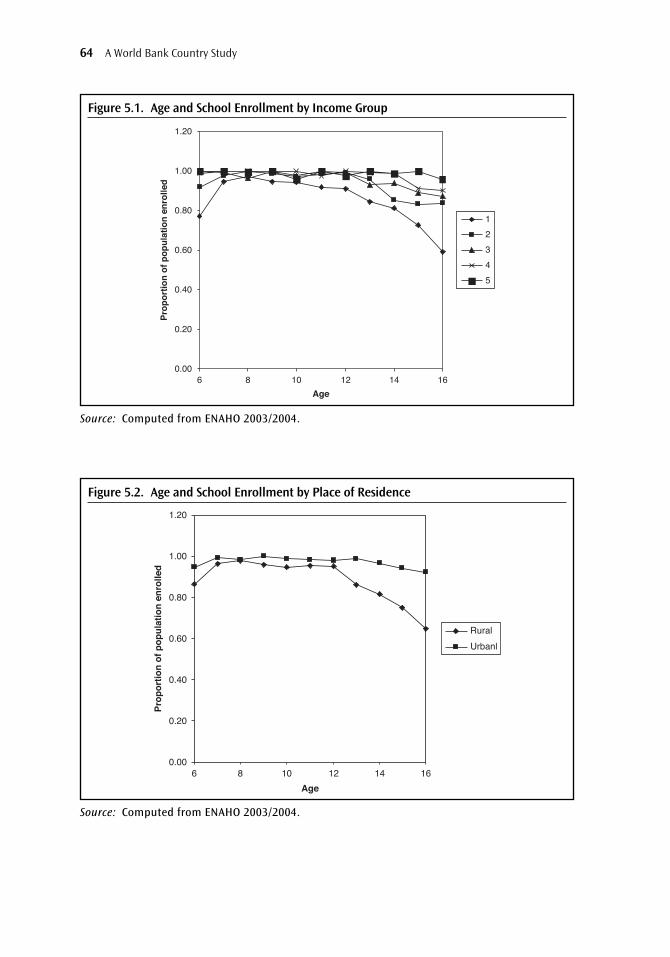
64 A World Bank Country Study
Figure 5.1. Age and School Enrollment by Income Group
0.00
0.20
0.40
0.60
0.80
1.00
1.20
6 8 10 12 14 16
Age
Proportion
of population
enrolled
1
2
3
4
5
Source: Computed from ENAHO 2003/2004.
Figure 5.2. Age and School Enrollment by Place of Residence
0.00
0.20
0.40
0.60
0.80
1.00
1.20
6 8 10 12 14 16
Age
Proportion
of population
enrolled
Rural
Urbanl
Source: Computed from ENAHO 2003/2004.

the ENAHO age-based patterns shown above. The following three graphics show the databy place of residence (without correcting for repetition because repetition by place of res-idence is not easily available) for the country as a whole (with and without repetition cor-rection) and by gender (with repetition correction). Aside from the fact that the dataconfirm that place of residence (and presumably income) is a much more important cor-relate of dropping out than gender, the graphs incidentally also show the great importanceof repetition in inflating enrollment figures, particularly in the early grades, and specifi-cally in the rural areas. While there is a sudden dropoff in the enrollment patterns betweengrades 6 and 7 (last of primary and first of secondary), it is interesting that even after con-trolling for repetition there is a tendency for enrollment in rural areas to drop off contin-uously throughout the grade career, rather than showing a truly large dropoff between theend of primary and the beginning of secondary. This, together with the fact that repetitionis so high, strongly suggests a quality problem that results in an over-age phenomenon asan important co-determinant of eventual dropping out. This then creates a demand sideproblem as an explanation of dropping out, as already noted above.
Returns to Education
One possible reason why youths drop out of schools is that they see low returns to educa-tion. But results calculated for this report, as well as results reported in other research, sug-gest that returns to education in Peru are reasonably high. The rate of return to one moreyear of education across the entire grade spectrum of the school system was estimated for
Toward High-quality Education in Peru 65
Figure 5.3. Age and School Enrollment by Gender
0.00
0.20
0.40
0.60
0.80
1.00
1.20
6 8 10 12 14 16
Male
Female
Source: Computed from ENAHO 2003/2004.

66 A World Bank Country Study
Figure 5.4. Grade-specific Enrollment Ratios by Place of Residence
0
0.2
0.4
0.6
0.8
1
1.2
1.4
1.6
1.8
1 4 87 96532 10 11
Grade
Proportion
of nomimal
population
enrolled
Urban
Rural
Source: Ministerio de Educación, Unidad de Estadística Educativa, Cifras de la Educación 1998–2003.
Figure 5.5. Grade Specific Enrollment Ratios: Impact of Repetition
Total
Total w.o. rep.
0
0.2
0.4
0.6
0.8
1
1.2
1.4
1.6
1.8
1 4 87 96532 10 11
Grade
Proportion
of nomimal
population
enrolled
Source: Ministerio de Educación, Unidad de Estadística Educativa, Cifras de la Educación 1998–2003.

this report using a simple Mincer model, as 11 percent (ENNIV 2000).28 Using ENAHO2003–2004 data, the rate of return for the whole country is also 11 percent (Table 5.2). Whileit is difficult to establish a strong trend over longer periods, the results from previous yearsstrongly suggest that at the very least the returns have not been decreasing. This is shown inFigure 5.7. Figure 5.8 showsthat returns in Peru are onthe high side of the interna-tional norm.
To understand thesephenomena in more detail,both private and social ratesof return were estimatedby level of education. Threestrategies were used: i) thefirst involved estimatingthe parameters from a sim-ple Mincer model, ii) thesecond required adding theinteractions of age and edu-cation levels to the simple
Toward High-quality Education in Peru 67
28. This estimation was done without data for the Amazon region and for the urban sector only. Italso includes only salaried workers in the public and private sectors who work more than 10 hours perweek. The ENAHO survey covers all workers and gives the same results.
Figure 5.6. Grade-specific Enrollment Ratios by Gender
0
0.2
0.4
0.6
0.8
1
1.2
1 2 3 4 5 6 7 8 9 10 11
Grade
Pro
p o
f p
op
ula
tio
n e
nro
lled
Male
Female
Source: Ministerio de Educación, Unidad de Estadística Educativa, Cifras de la Educación 1998–2003.
Figure 5.7. Returns to Education in Peru
7
7.5
8
8.5
9
9.5
10
10.5
11
11.5
12
1985 1991 1994 1997 2000
Source: Calculated and graphed from Saavedra and Maruyama(1999) and ENNIV data.
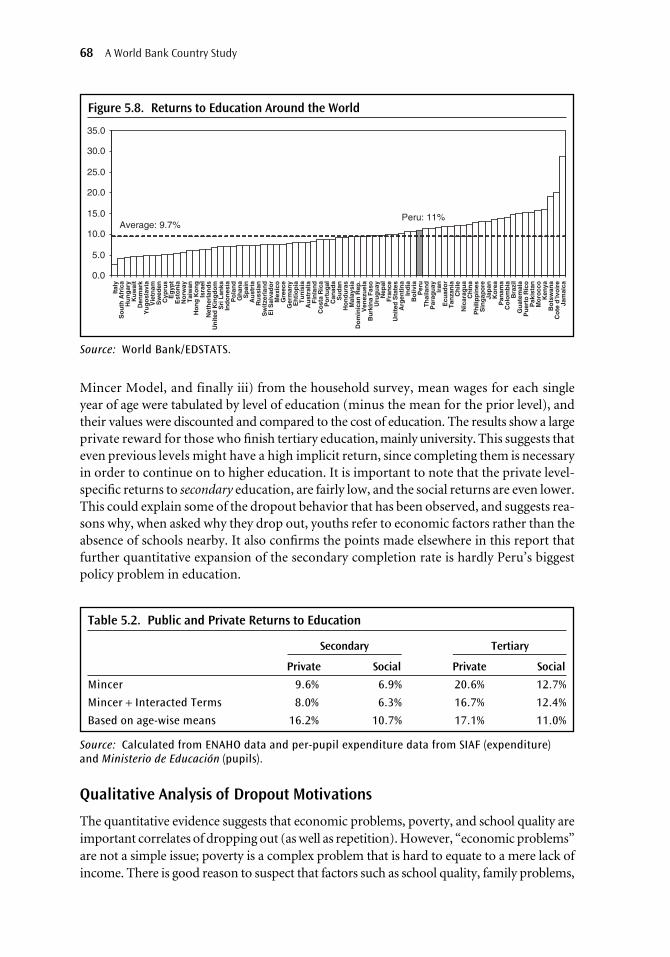
Mincer Model, and finally iii) from the household survey, mean wages for each singleyear of age were tabulated by level of education (minus the mean for the prior level), andtheir values were discounted and compared to the cost of education. The results show a largeprivate reward for those who finish tertiary education, mainly university. This suggests thateven previous levels might have a high implicit return, since completing them is necessaryin order to continue on to higher education. It is important to note that the private level-specific returns to secondary education, are fairly low, and the social returns are even lower.This could explain some of the dropout behavior that has been observed, and suggests rea-sons why, when asked why they drop out, youths refer to economic factors rather than theabsence of schools nearby. It also confirms the points made elsewhere in this report thatfurther quantitative expansion of the secondary completion rate is hardly Peru’s biggestpolicy problem in education.
68 A World Bank Country Study
Table 5.2. Public and Private Returns to Education
Secondary Tertiary
Private Social Private Social
Mincer 9.6% 6.9% 20.6% 12.7%
Mincer + Interacted Terms 8.0% 6.3% 16.7% 12.4%
Based on age-wise means 16.2% 10.7% 17.1% 11.0%
Source: Calculated from ENAHO data and per-pupil expenditure data from SIAF (expenditure)and Ministerio de Educación (pupils).
Figure 5.8. Returns to Education Around the World
0.0
5.0
10.0
15.0
20.0
25.0
30.0
35.0
Peru: 11%Average: 9.7%
Ital
yS
ou
th A
fric
aH
un
gar
yK
uw
ait
Den
mar
kY
ug
osl
avia
Vie
tnam
Sw
eden
Cyp
rus
Eg
ypt
Est
on
iaN
orw
ayT
aiw
anH
on
g K
on
gIs
rael
Net
her
lan
ds
Un
ited
Kin
gd
om
Sri
Lan
kaIn
do
nes
iaP
ola
nd
Gh
ana
Sp
ain
Au
stri
aR
uss
ian
Sw
itze
rlan
dE
l Sal
vad
or
Mex
ico
Gre
ece
Ger
man
yE
hti
op
iaT
un
isia
Au
stra
liaF
inla
nd
Co
sta
Ric
aP
ort
ug
alC
anad
aS
ud
anH
on
du
ras
Mal
aysi
aD
om
inic
an R
ep.
Ven
ezu
ela
Bu
rkin
a F
aso
Uru
gu
ayN
epal
Fra
nce
Un
ited
Sta
tes
Arg
enti
na
Ind
iaB
oliv
iaP
eru
Th
aila
nd
Par
agu
ayIr
anE
cuad
or
Tan
zan
iaC
hile
Nic
arag
ua
Ch
ina
Ph
ilip
pin
esS
ing
apo
reJa
pan
Ko
rea
Pan
ama
Co
lom
bia
Bra
zil
Gu
atem
ala
Pu
erto
Ric
oP
akis
tan
Mo
rocc
oK
enya
Bo
tsw
ana
Co
te d
’lvo
ire
Jam
aica
Source: World Bank/EDSTATS.
Qualitative Analysis of Dropout Motivations
The quantitative evidence suggests that economic problems, poverty, and school quality areimportant correlates of dropping out (as well as repetition). However, “economic problems”are not a simple issue; poverty is a complex problem that is hard to equate to a mere lack ofincome. There is good reason to suspect that factors such as school quality, family problems,

and economic factors all work together and reinforce each other in complex ways. Further-more, respondents may be conditioned to give certain answers in response to simple ques-tions in surveys. Finally, dropout behavior may be affected by collective motivations difficultto capture in a survey that, by definition, approaches the problem from the perspective of theindividual. Surveys of this nature fail to ask questions whose response may be: “I droppedout because all my friends were dropping out.” For this reason, qualitative research was car-ried out on the social dynamics behind dropout behavior as a means of ascertaining moreprofound and complex causes, especially around possible collective motivations that implya “fashion” for dropping out among certain groups of youths.
To assess these deeper issues, focus groups were held with six groups of approximatelysix or seven youths per group, in three peri-urban and three rural areas (the only areaswhere significant numbers of dropouts really exist). In addition to qualitative data, somequantitative data were also gathered, though the latter of course represent only a very smalland non-random sample. Some of the quantitative estimates nuance the quantitative dataalready shown above. A few issues are striking.
First, only some 40 percent of these youths lived with both parents, and another 40 per-cent lived with no parents at all. There is clearly a social and not merely an economicproblem—or, rather, the social and the economic are not easily distinguishable. This con-firms prior results found by Cueto (2003) and Alexander, Entwisle and Horsey (1997).
Second, the “economic” issue is not so simple. Most (97 percent) of the youths who wereworking claimed that work did not actually impede them from attending school. Thus, again,what appears as an “economic” problem is not so simple. Working might have resulted inlower academic achievement, however, and this in turn might have contributed to droppingout. The economic and the educational combine—schools may not know how to cope withyouths who work. Most of the youths who worked also noted that they would have preferredsome form of education that is more closely related to work, and that if this were offered theymight go back to school. It is hard to gauge whether this is a conditioned response or wish-ful thinking, as opposed to revealing a real likelihood of re-enrolling if the right form of edu-cation were available. Finally, the youths who were working seldom devoted any of theirincome to educational or other “constructive” activities. Some of the income was turned overto their families for what are presumably “real needs”, but much of the earned income seemsto be devoted to entertainment or consumption items hard to associate with “real need”.
Third, a notable feature of the lives of the dropouts was extreme general instability of liv-ing conditions, particularly in rural areas. A large proportion of these individuals had attendedmore than one school prior to dropping out. Many had lived in both urban and rural areas. Alarge number had lost a parent recently, often due to divorce or separation. Many have engagedin petty criminality, associated with gangs, and had discipline problems at school. Quite a fewof the dropouts attended schools where dropping out and general indiscipline are known tobe a problem. These schools, of course, are the opposite of the effective schools discussed else-where in this study. Finally, home life for many of the dropouts lacked direction and warmth.Many dropouts claimed that caregivers had not really tried to stop them from dropping out.
Fourth, a striking finding was the large number of youths who commented on theirpoor “moral” or “ethical” experience at school. Abuse and corruption (for example,bribery in return for grades, emotional abuse) at the hands of teachers was a common com-plaint. This was not often cited as a sufficient reason for dropping out, but it often cameup as a collateral factor when youths were queried regarding their general satisfaction with
Toward High-quality Education in Peru 69

schooling. This is not only interesting as a comment on the correlates of dropping out, butas a comment on the education system as such.
Fifth, on the whole (and this went against some of the hypotheses of the study) there isnot an anti-school or anti-education culture among the dropouts. At least in terms of theoverall discourse, even dropouts claim to value education, and do seem to believe educationcan lead to better jobs. Thus, there seems to be no sense of a collective culture of dis-appointment with the quality of education, and there seems to be no overall perception thatschooling is of such low quality as to be useless in the labor force. This is confirmed by thequantitative results. The study had hypothesized that at the group level, as opposed to the indi-vidual level, there might be a “fashionable” trend to perceive schooling as unnecessary. Thisgenerally appears not to be the case, with a few exceptions. On the contrary, dropping out isgenerally perceived by youths as a form of failure. Speaking for themselves, some dropouts(12 percent) do confirm a lack of interest in schooling as an important factor in dropping out.It is also clear that dropouts seek each other out, lending credibility to the assertion that thereis indeed a “culture” of dropouts. But being a dropout is not glamorous, even among thedropouts themselves. The dropouts did claim that among other youths, such as perhapsgang members, dropping out might be seen as glamorous or schooling as unnecessary. Indeed,in the focus groups with youths who were more clearly engaged in petty criminality and whoare involved in gangs or gang-like behavior, there is an anti-education culture and a de-glamorization of schooling. However, these youths seemed to be a relatively small minority.
Sixth, the notion of a dropout “decision” is wrong. Dropouts do not actually “decide,”in some simplistic behavioral sense, to drop out. Most drift in and out of school, have per-formance problems, might get into disciplinary trouble, face very bad teachers, have poorattendance, and eventually drift away from school. In this sense, again, economic and edu-cational factors mix and cause each other. The dropout might become disillusioned withschool, get a part time job, start earning money and be able to afford status-increasinggoods, and start underperforming at school in a spiraling cycle that eventually leads to thecomplete abandonment of studies. Many of the dropouts, at the time of the interviews,actually entertained hopes of returning to school, though in the judgment of interviewersand focus group leaders, this hope was more wishful thinking than a true hope or expec-tation. Interestingly, when asked whether school authorities had ever attempted to preventtheir drift toward dropping out, only a few of the youths claimed that anyone at school hadshown any concern. A methodological implication is that attempting to study dropoutbehavior using only quantitative models based on the notion of a binary “decision” wouldgreatly under-estimate the complexity of the problem.
Seventh, the qualitative study confirms not only that pregnancy and family problems arethe most common causes of dropping out among females, but that these problems also pre-vent girls from even hoping to ever return to school. While boys seemed to at least entertainthe hope or possibility of returning to school, girls were much more fatalistic and appearedresigned to their fate, meaning that they tended to see having a child and taking on the bur-dens associated with being a mother as a largely irreversible phenomenon. In this sense, pro-grams aimed at dropouts would probably have to contain stronger incentives for females.
Policy Implications
The most clear policy implication is that, at least at the current margin, building schoolsor adding classrooms is not likely an effective way to ensure enrollment. Other policies are
70 A World Bank Country Study

most likely needed. Attention should be paid, however, to the possibility that if other poli-cies succeed, especially in rural areas, a need to create places in schools (by building schools,or adding classrooms and teachers) might indeed arise. Ascertaining the degree to whichthis might become a problem would require a level of operational analysis, using detaileddatabases and simulations, that was beyond the scope of this study.
Other policies would thus be called for. Given that poverty factors are the most impor-tant determinant of dropout behavior, and that poverty is worst in rural areas, in theseareas—and particularly in poor rural areas—a policy of conditional cash transfers, whichperhaps contemplates a degree of selectivity for girls, might be called for. However, it hasbeen noted in previous chapters that the quality of education is also a concern: Peru alreadyhas an imbalance between access or enrollment and levels of learning; more access andmore enrollment would actually increase that imbalance. Furthermore, in this chapter it isalso noted that concerns with quality or the relevance of schooling are the third most com-mon reason for dropping out. Because, as was revealed in the qualitative work, motivationsare usually quite complex, it is possible that the quality of learning might appear as a moretightly binding constraint if poverty issues were alleviated via a conditional cash transfersystem. That is, it should not be assumed that a conditional cash transfer approach could,if it were powerful enough, get rid of all the economic motivations the quantitative analy-sis documents. Other factors might become binding. Thus, it seems important to addresspoverty and quality (or interest) issues simultaneously. One idea of potential interest forPeru would be to create some type of cash transfer system conditional on school achieve-ment. One idea worth considering would be a one-time, lump-sum, poverty-targeted pay-ment to those who graduate from secondary school, or, even more interestingly, those whograduate with a “pass” on a secondary-school leaving exam. This would allow the intro-duction of a secondary-school leaving exam on a voluntary basis at first. Introducing asecondary-school leaving exam might be an important general quality control tool that isunrelated to the dropout issue. Tying such an exam, initially, to a voluntary conditionalcash transfer program would be a less controversial way to introduce the notion to society.Care would have to be taken in the design of such an approach, in order to prevent vari-ous possible perverse incentives and possible unfairness. It should be possible to create, forexample, a substantial prize for last-year students in secondary schools in poor areas whosit for a voluntary exam and achieve the three highest marks in their school, for example.This would remove much of the possible anti-poor bias of a prize system of this kind. It isalso likely that the system would act as an incentive for students and parents to demandmore accountability from their teachers, reducing teacher shirking.
In urban areas, it seems that other approaches may be called for, although moreresearch would of course be required. Many youths admitted that the level or type of workthey do is not really an impediment to further schooling, and most explained that if school-ing were more directly useful or interesting, and more related to work, they might considerfurther study. Thus, it seems as if forms of training that have more direct labor market rel-evance would be called for. This should not be read as a call for traditional vocational andtechnical education. Approaches that “voucherize” or somehow subsidize some forms ofless formal training, or formal training by private providers (and that also certify this typeof training in order to create market information both for trainees and employers), wouldbe worth analyzing in some detail.
Toward High-quality Education in Peru 71


As noted above, Peru has a minor access and dropout problem, but a major qualityproblem. The dropout problem was covered in the previous chapter. This chapterturns to education quality, as proxied by poor academic results.
A possible reason for poor results, and for high variance in results, particularly amongthe poor (a peculiarity much discussed in previous chapters), is a lack of standards of learn-ing and the subsequent application of the same. A lack of standards makes it difficult toprogram, extract accountability, and design support.
This chapter looks at the issue of standards by first assessing performance on a simpleearly-literacy task, and then by determining whether teachers appear to be using some stan-dards around early-literacy issues, whether these standards seem to be effective, and ifteachers are not using standards or the standards are ineffective, what are the underlyingreasons. Similarly, there was a desire to see, if there happen to be some standards (forexample, because teachers are following standards that they have received from theMinistry, or they have inherited some standards from their training), whether or not thereare support systems aimed at helping teachers deliver to standard.
While the chapter focuses on literacy in the early grades, there is no presumption thatthis is the only problem. However, it is presumed that the problem of early literacy acqui-sition is perhaps the most important problem, and certainly a symptomatic problem,because it is probably the easiest area around which to establish standards. If there has beenno standard-setting at this level, the problems created by a lack of standards will ripple
CHAPTER 6
Reading in the Early Grades A Case Study on the Use of Standards29
73
29. This section benefited from, and is partially based on, the contribution of the consultancy research“Uso de Estándares Educacionales en el Perú,” by Marcela Echegaray, Consuelo Pasco, and Jessyca Sampeof TAREA. It also benefits from written input by Helen Abadzi of the World Bank.

through the entire system, and because the system has been unable to deal with this rela-tively easy task, the failure also symbolizes a generalized inability to set and apply standards.
A tangential motivation for the analysis carried out for this chapter was also to test howmuch information a well-organized person from, say, a UGEL could get out of a half dayvisit to a school. The idea here was to see how much quality control (not support) aroundpedagogical issues a well-organized and concerned UGEL could provide in a half-day visit.
Simple Reading Benchmarks
Reading speed and comprehension were tested as a way to get a fast idea of early literacyacquisition as a proxy for quality of instruction. Methods of introductory reading instruc-tion have been the subject of heated debates, but in recent years many thoughtful readingspecialists have converged on what is often called a “balanced” approach to the teaching ofearly literacy. For example, the National Reading Council in the United States recommendsthat early literacy instruction include the following components in addition to writing: lan-guage and vocabulary development, phonemic awareness, phonics, fluency and compre-hension. In this study a measure of oral reading fluency, together with three simplecomprehension questions, were used as a proxy for more in-depth reading assessments.
Reading has a strong biological component that has only recently been sufficientlyunderstood. Text comprehension not only depends on correct decoding and vocabularyknowledge, but also on the ability to hold an entire message in short-term memory (orworking memory) and process it (Passolunghi, Cornoldi, and de Libero 1999).
As many educators know, the verbal working memory buffer can only hold about 7 itemsfor about 12 seconds (see Reisberg 2001 for a review). If these items are words, then in veryrough terms, about 7 words can be kept in memory and processed for 12 seconds at the most.This implies that to be functionally literate, people must be able to read a sentence ofabout 7 words in about 12 seconds. This frequency amounts very roughly to one word per1–1.5 seconds or 60–75 words per minute.30 To overcome this limited 12-second working-memory span, the brain tends to create larger chunks of letters and words and then processthese very quickly and automatically. Brain imaging studies show that an express, instant wordrecognition pathway (in the left occipito-temporal region) becomes activated in the brain aspeople acquire reading fluency (Shaywitz 2003). Automatic behaviors usually persist, sopeople who become fluent and automatic readers do not normally lapse into illiteracy.
Thus, reading involves a paradox. Slower readers must make more effort to read, andmust muster more attention and take more time. If they do not read a sentence in about12 seconds, their working memory gets erased, and by the end of the sentence they haveforgotten the beginning. It is easy to run out of patience and give up. Children who readhaltingly are probably functionally illiterate. They may puzzle out some sentences, but theycannot read or understand the volumes of text needed to learn the curricula.
To activate the instant recognition pathway, practice is needed in consistently pairingsounds with letters. The amount of practice depends on the script and spelling of a lan-
74 A World Bank Country Study
30. Reading accuracy is needed along with speed. Small mistakes significantly reduce comprehensionbecause the brain must re-compute the message and thus clutter the working memory. A 5 percent inac-curacy rate in reading is associated with comprehension test scores of only 75 percent.

guage. Most European languages are spelled regularly, and there is close correspondencebetween sounds and letters. When taught through phonics and in reasonably good schools,children read common words automatically and quite accurately by the end of grade 1. Forexample, Italian children achieve near perfect mastery of coding skills around the middleor close to the end of the first grade (Harris and Hatano 1999). Spanish is as phonemicallysimple as Italian. Thus, reasonably fast reading speeds should be expected by the end ofgrade 1, and certainly by grade 2. More complex transformations require more practiceand faster reading for comprehension. A Portuguese-speaking child reading os mesmos, agente, bom dia must understand the meaning at least partly and decide within millisecondswhen to pronounce an o as u, d as g, or t as ch. English and French have complexities thatrequire substantially more exposure to achieve fluent reading. Comprehension in turnfacilitates the development of even more fluent reading because people identify lettersinside words they know faster than if the letters are seen alone (a phenomenon called the‘word superiority effect’; see Abadzi 2004 for a detailed discussion).
Various countries are starting to focus on reading speed as a simple and practicalbenchmark in early education. In the United States, proposed reading norms are 30–70words per minute for grade 1 (oral), 60–100 words per minute for grade 2 (silent), 90–120words per minute for grade 3, 110–140 words for grade 4, 140–170 for grade 5, and160–190 words per minute for grade 6 (Barr and others 2002). These data are also avail-able for developing countries. To start with, there are two examples from Chile. First, inthe teacher-to-teacher network (red maestros-de-maestros) program of the Ministry ofEducation (a program where expert teachers, who receive an incentive in pay after theyhave been certified as experts, reach out to less expert teachers), the importance of read-ing speed or fluency for comprehension is acknowledged, and goals are set for grades 1and 2 at 30 and 70 words per minute.31 As stated on the website, “if children are to com-prehend texts, they have to acquire speed in reading. The reading mechanism has to bedominated (automatized). Reading speed can only be achieved one way: by reading.” Sec-ond, the Chilean NGO Educando Juntos has proposed goals around 34 and 64 for grades1 and 2 respectively, though it is a little hard to discern this from its literature.32 There isone example from Cuba. In the context of psychological evaluation of children, Cubanexpert José Pérez Villar (Pérez Villar 1996) suggests 30 words per minute at the end ofgrade 1 as a reading speed for a “normal” child, based on simple diagnostic techniques hehas developed. It is interesting to compare these possible goals or benchmarks for LatinAmerica with actual achieved levels in Spain, the most developed Spanish-speaking coun-try. There, reported actual averages (not goals) in first and second grades have been foundat about 50–55 and about 75, respectively (Equipo de Orientación Educativa de Marbella2003) in one study.33 Thus, the levels stated as possible goals or benchmarks for LatinAmerica are somewhat below what appears to be actually achieved in at least one casestudy from Spain. In the United States, using low-income (relative to U.S. standards)
Toward High-quality Education in Peru 75
31. Sourced at http://www.rmm.cl/index_sub.php?id_contenido=1128&id_seccion=310&id_portal=75on 13 February 2005.
32. Sourced at http://www.educandojuntos.cl/ on 13 February 2005. Requires drilling down to“Recursos Pedagógicos”, “Evaluaciones Estandarizadas”, and “Evaluación de la velocidad lectora.”
33. The children studied in this case were largely “middle-class” Spanish children, in public schools,typically having had pre-primary schooling of some sort (Personal Communication, Rafael Espada,Equipo de Orientación Educativa de Marbella, February 19, 2005).
Spanish-speaking readers of Spanish, the ability to read Spanish at only 30–60 words perminute in Grades 1 and 2 has been taken as an index of disadvantage and potential inabil-ity to transition into reading English proficiently, and students in this range have beenused to test improvement of Spanish reading strategies (see de la Colina, Parker, Has-brouck, and Lara-Alecio 2001). These at-risk students were typically reading at about35 words per minute in grade 1, and around 60 in grade 2.34 Thus, levels perhaps con-sidered to signal at-risk status in reading Spanish for children in bilingual programs in theUnited States, are similar to the targets or benchmarks for Latin America. And achieve-ment in Peru is considerably below what might be the target for Latin America, as will beseen below. It is to be noted that second-generation Hispanic children in the UnitedStates, even if considered at-risk in the U.S. context, are likely to be much more advan-taged than an average Peruvian child—not to mention a relatively poor one—in anabsolute sense. So, one would expect much better performance for at-risk Hispanic chil-dren in the United States than for children in the bottom half of the income distributionof Peru. These sorts of benchmarks can therefore only be taken as a very general indica-tion, and more work needs to be done before firmer ones can emerge. Note though thatthe analysis in the third section below, which looks at the natural variation within Peruitself as a possible way to establish goals, suggests essentially the same goals that theinternational literature suggests. Nonetheless, given how modest the standards for LatinAmerica are, they are a good place to begin.
Aims, Method, and Sample
To assess reading ability in children, we decided to concentrate on a simple test of readingspeed and comprehension. Children in grades 1 and 2 were tested at the very end of theschool year, with only one or two weeks left in the year. A text selected from an area towardsthe end of the basic, official (and very widely distributed, with coverage being essentially100 percent) grade 1 language textbook was chosen, and modified somewhat for simplic-ity and cultural appropriateness to poor schools. The same passage was used for grades 1and 2 to see whether there was gain in reading ability. The fact that the children may haveseen the text before was not judged to “contaminate” the results since there was littlechance that the children would have memorized the text, as the nature of the reading taskhad not been pre-announced, and in any case this was not a high-stakes issue. On the con-trary, there was a desire to see whether the children recognized the text, to establish a roughidea of curriculum coverage and textbook use. The text is shown in Appendix A. Similartexts in Quechua (an indigenous language spoken by relatively large numbers of citizens)and Awuajun (an Amazon area language spoken by relatively small numbers of citizens)were produced, again based on official language textbooks, to be used in schools whereinstruction is (at least in theory) being carried out in these languages. Children were askedto read aloud and were given three simple comprehension questions (also reproduced inAppendix A). The speed was measured, as detailed below. The text length was kept at60 words, so that for a rather good reader the reading test would take about 1 minute.35
Children were allowed to finish; they were not cut off at 1 minute.
76 A World Bank Country Study
34. Incidentally, the cited study finds that rigorous interventions in reading are capable of quickly andsignificantly increasing reading speed and comprehension—in a matter of weeks.

In addition to assessing children’s reading speed, teachers and principals were queriedat each school on goal-setting, standards, processes of pedagogical support available toteachers, and similar issues. Two teachers per school, as well as the principal, were typicallyinterviewed. When possible, one or two parents at the school were interviewed to look intoissues of parental involvement and accountability. (This was done on an opportunisticbasis.) Finally, classroom observations were also carried out. The idea was basically to seehow much information regarding basic abilities, as well as management, and pedagogi-cal issues, could be gotten out of a school in a half-day visit by a single researcher, andto see how much use could be made of the information gathered. The “model” orhypothesis for this approach was to see how much could be done in the time an inspec-tor or advisor might have to visit a school, in a reasonably tightly-managed but resource-constrained system. It was felt that a visit requiring half of a person-day is an appropriatemodel. This report summarizes and exemplifies what can be done with the informationthus derived. (Not all the information is used due to a lack of space and because some ofit lacks relevance.)
Twenty-two schools were chosen to be representative of various geographical and cul-tural groupings in the country (coast, mountains, and jungle areas, urban and rural) asopposed to utilizing a true random sample, though care was taken to prevent obvious biases(such as convenience, or special project influence) from entering into the sampling. How-ever, in order to develop a sense of what could be done in reputedly “good” schools, a few“good” public schools, as well as “good” private schools catering to poor communities, werechosen. Schools were chosen from districts in the poorest two out of five classification groupsin the FONCODES (the national social development fund) poverty map, except in thecapital city Lima, where it was difficult to find schools in the poorest two classifications,so schools in districts belonging to the third classification were used. One factor thatbiases the results in a favorable direction (better cognitive development) is that in orderto control costs, schools that would have required more than, say, a day of travel timefrom the nearest form of motorized or boat transportation, were not chosen. Nonethe-less, the sample did include highly rural schools that could be reached only by canoe, orafter many hours’ walk, for example. But the very remotest schools, that would haverequired a whole day’s walk, for example, were not included. Table 6.1 shows the distri-bution of schools by area and type.
In each school, five children were chosen at random from grades 1 and 2. In total, 245 children were tested. Each child’s reading was recorded on a very small, portable, dig-ital recorder (approximately the size and weight of a small cell phone).
Basic Results
The most basic results are presented in Table 6.2.In this table, “could read” means to be able to literally recognize at least one word
(from the first few) in the reading text. Hence, “could not read” implicitly means not
Toward High-quality Education in Peru 77
35. In languages with compound words, the actual words in the reading were kept much lower than60, counting the concepts embedded in the long, compound words as if they were words. It is also to benoted that even taking this adjustment into account, the use of compound words could reduce readingspeed. Nonetheless, it should not account for children’s inability to read a single word, which is what wefrequently found in these languages.

to be able to read a single word. The most impressive fact is, perhaps, that at the end ofgrade 1, 70 percent of the children in these schools (from the bottom half of the povertydistribution) simply could not read one word. One should note that many of these chil-dren have had some form of pre-primary education. Some 84 percent of the childrenwho were asked whether they had had pre-primary education responded “yes.” Many
78 A World Bank Country Study
PovertyClassification(1 is poorest, Number and
Department Province District 5 is least poor) Type of Schools
Rural jungle
San Martín Rioja Awajun 2 3 standard public schools
Loreto Loreto Nauta 1 3 standard public schools
Rural mountains
Ancash Yungay Yanama 1 3 standard public schools
Cusco Anta Ancahuasi 2 3 public bilingual schools
Urban coast
Lima Lima Pachacamac 3 3 standard public schools
Piura Piura La Arena 2 3 standard public schools
Reputationally “good” public schools (urban coast and rural mountains)
Lima Lima Puente Piedra 3 1 reputationally “good”public school
Cusco Anta Limatambo 2 1 reputationally “good”public school
Reputationally “good” private schools (urban coast and rural jungle)
Lima Lima Puente Piedra 3 1 reputationally “good”private school catering to poor children
San Martín Rioja Awajun 2 1 reputationally “good”private school catering to poor children
Table 6.1. Basic Sample Characteristics for School Reading Standards Survey
Reading Speed(imputing a Reading Speed
Number of reading speed of 0 (removing those whoChildren Percent Who for those who could not read
Evaluated Could Read could not read) from the sample)
Grade 1 109 30% 9 30
Grade 2 136 65% 29 45
Total 245 50% 20 41
Table 6.2. Basic Results
Source: Calculated by the authors from sample data.

did not respond, suggesting that perhaps they had not had pre-primary schooling, inwhich case the percentage would have to be taken as 55 percent—a large proportion inany case, and more consistent with official statistics suggesting that about 60 percent ofchildren receive pre-primary schooling. In other words, after approximately 1.5 yearsof schooling, 70 percent of the children in the bottom half of the society could not reada word. The reading, as noted, was from an area towards the end of the official grade 1language textbook, yet only some 5 percent of the children remembered having read thetext previously. (It is true, as noted, that the text was slightly modified, so this factshould not be taken as overly significant.) Finally, note that a reading speed of only 9 words per minute in grade 1 appears to be way below the relatively modest LatinAmerican standards of 30 words per minute. These results are not too dissimilar fromother results known for Peru. In the 2001 National Evaluation, only 34 percent of chil-dren in grade 4 were found to have “sufficient” reading comprehension (see Espinosaand Torreblanca 2003). Taking grade 2 children from our sample (since grade 2 is closerto grade 4), and putting the bar of “sufficient” at 60 words per minute (see section 2),we found only 22 percent of classrooms had children reading at that speed or above,but our sample is from the bottom half of the income distribution, so we would expecta number smaller than 34 percent. Other researchers have more casually noted that inmany rural schools children cannot read in grades 3 or 4 (López 2002). The table alsoshows that when children who could not read at all are removed from the sample, read-ing speed seems fairly high, but this would be an inappropriate characterization of thesystem as a whole.
An important point to be noted in Table 6.2, though, is that there is a very significant gainin reading between grades 1 and 2. Unfortunately, we did not take measurements on childrenin grades 3 and 4 (had we suspected the results in grades 1 and 2 would be so poor, we wouldhave taken measurements in later grades), so it is difficult to ascertain whether the gaincontinues. In any case, it would be reasonable to suppose so.
There are significant inter-correlations (at school level, i.e.,using data such as that in Table 6.5below) between these items andreading comprehension (measuredas the percentage of children whocould answer all three questions cor-rectly). This is noted in Table 6.3.
More intuitive insight into the relationship between reading speed and comprehen-sion can be gained from Table 6.4.
Schools that simply get children reading also get children to read fluently, and schools thatget children reading fluently also get children to comprehend. This may be partly due to somecausal relation (for example, reading speed directly contributes to comprehension), or simplybecause the factors that account for schools doing a good job with reading speed also accountfor schools doing a good job with comprehension. This suggests that, at least as a baseline diag-nostic, checking on reading speed is a reasonable thing to do. However, if no causal relationexists between speed and comprehension (though we have good reason to think one exists),this logic would not extend to either a policy prescription, namely a focus on speed at theexpense of other factors, or to a follow-up evaluation of reading projects. In the latter case, a
Toward High-quality Education in Peru 79
Percent reading and reading speed 0.86
Reading speed and reading comprehension 0.82
Percent reading and reading comprehension 0.69
Table 6.3. School-level Reading Factor Correlations
Source: Calculated by the authors from survey data.

diagnostic conducted in a country that had single-mindedly focused on reading speed, or anevaluation of a project that focused only on speed and not on comprehension, might be mis-leading. In other words, it is possible that the correlation observed between fluency and com-prehension in a “natural” or un-pressured setting could disappear in a setting where there wasexclusive or naive pressure put on fluency.
The large variability in results is confirmed. The summary or average results above areperhaps useful in raising awareness of the problem, but also tend to mask enormous dif-ferences. (And, one must not forget, the averages are not meant to be totally representa-tive, so the variability and the correlations are more interesting than the averages.) Indeed,exaggerating only a little, the system seems to produce results almost at random. Table 6.5shows results by broad type of school, and, within type, by specific school and grade. Intype 1, no children in grade 1 in the three schools evaluated could read at all. In grade 2,anywhere from 40 to 100 percent could read, and the reading speed went from a poor 13to a respectable 60. These were all schools of approximately the same sociological type. Intype 5 (regular urban public schools), we found one school where no children could readat all in grade 1, yet in another 100 percent could read. In type 9, rural public schools in theAmazon area, in one school 20 and 80 percent of children in grades 1 and 2 could read; inthe other school, 0 percent in either grade could read even one word. These schools werenot selected so as to maximize contrasts. It is hard to believe that, say, malnutrition orparental illiteracy could be so bad that not one of the children tested could read at least oneword, yet in another school nearby perhaps 80 percent could read. In all, we found that innine grade 1 classrooms, and in four grade 2 classrooms (out of approximately 22 evalu-ated), none of the children tested could read any words at all.
Finally, and related to the variation, it is to be noted that there are quite a few schoolsor classrooms that stand out for good performance, which suggests that the situation is notat all hopeless; when a teacher or a school is focused on skills, results can be achieved. InPeru, reading scores are much higher in some standard public schools that have had someNGO assistance, as long as the NGO assistance goes beyond generic management improve-ment and focuses on very specific classroom management and learning issues. Scores arealso high in some schools that have simply decided to apply themselves, and they can behigh in some high-quality private schools that serve children in poor areas. Schools orschool types 11, 12, and especially 7, are all good examples.
This variation raises important management and benchmarking possibilities. Pre-viosly, we discussed reading speed levels that might be considered useful as benchmarks.
80 A World Bank Country Study
Number of Children Comprehension (averageSpeed in Grades 1 and 2 percent correct answers)
Slow (4 to 24 words per minute) 40 26%
Average (25 to 49 words per minute) 39 53%
Fast (50 or more words per minute) 43 86%
Table 6.4. Relationship between Reading and Comprehension
Source: Calculated by the authors from survey data. Only children who could actually read areincluded in this calculation.

Toward High-quality Education in Peru 81
Children Percent ReadingType Grade Evaluated Reading Speed Comprehension36
1. Rural, public, Sierra, no NGO or 1 5 0 0 0
project help (3 schools) 2 5 60 32 33.3
1 5 0 0 0
2 5 100 60 20
1 4 0 0 0
2 5 40 13 50
2. Rural, public, bilingual education, 1 2 0 0 0
no NGO or project help (2 schools) 2 10 100 25 0
1 2 0 0 0
2 10 60 8 0
3. Rural, public, bilingual, has health 1 3 33 6 0
program and school library and 2 9 89 17 0
texts program
4. Rural, public, Sierra, considered 1 10 30 4 0
“good”, no NGO or project support 2 10 50 15 0
5. Urban, public, coast, no NGO or 1 5 80 26 50
project support (3 schools) 2 5 100 66 80
1 5 0 0 0
2 5 100 53 60
1 5 100 39 40
2 5 100 77 100
6. Public, urban poor, considered 1 5 80 23 0
“good”, receives NGO support 2 5 100 67 60
7. Private, urban poor, no NGO 1 5 100 54 60
support 2 5 100 96 80
8. Rural, public, jungle, receives 1 4 0 0 0
project help in bilingual education 2 5 0 0 0
9. Rural, public, jungle, no NGO or 1 5 20 4 0
project help (2 schools) 2 5 80 26 0
1 2 0 0 0
2 3 0 0 0
10. Public, urban poor, has some 1 5 0 0 0
NGO help in health and education 2 5 80 24 0
11. Public, urban poor, much NGO 1 5 80 14 0
and program help 2 5 100 52 80
Table 6.5. School-by-School and Type-by-Type Variation in Reading Ability
36. Percentage of children, out of those who could read, who could answer all three comprehensionquestions correctly.
(continued)

This was derived from other countries’ experience. One useful (and more easily legiti-mated) way to set benchmarks is simply via internal reference. The levels of readingspeed and comprehension achieved by the best-run schools that cater to the poor, and that have no extraordinary economic resources (though they may have had some specialpedagogical input) or engage in pupil selection, could be set as benchmarks. The fact thata school may have had pedagogical assistance should not work against its being used as abenchmark, unless that assistance really was substitutive of teacher effort or required extra-ordinary economic resources, because, in principle, once the tools and methods arediscovered and well-known, their adoption should not require constant NGO or donorhelp in all schools. Instead, Ministry, DRE, or UGEL systems of in-service training anddistrict—or province-level pedagogical support (as well as pre-service training in univer-sities and teacher training colleges) should, in principle, be able to take care of replication.If they fail to do so, this probably indicates a management and accountability problemrather than an issue of scientific know-how. In this regard, and using our analysis only as anexample rather than as a true, valid proposal, a reading speed of some 35 words per minutemight be proposed as a benchmark for, say, urban schools in grade 1 (the speeds in the best3 schools in our sample were 54, 39, and 26, in school types 7 and 5, schools 1 and 2 in thelatter), and 70–80 for grade 2 (speeds in the best three schools were 96, 77, and 67, in schooltypes 7, the third school in type 5, and type 6). Note that these benchmarks coincide fairlyneatly with those discussed above for Chile—the Chilean scores for grade 2 are a little lowerthan what is proposed here. These benchmarks are far below what is achieved by middle-class children in OECD countries, and at the level at which Spanish-speaking children read-ing Spanish might be judged to be at-risk in the United States. A less ambitious benchmarkmight be chosen, at least initially, for, say, bilingual schools in rural areas. However, thegoal should clearly be to reach the same standards in all schools once the models neededfor instruction in poorer and bilingual schools are fully developed, understood, and con-sensus has been reached.
82 A World Bank Country Study
Children Percent ReadingType Grade Evaluated Reading Speed Comprehension
Table 6.5. School-by-School and Type-by-Type Variation in Reading Ability (Continued )
12. Public urban poor, participate in 1 5 60 22 33
one Ministry special project (not a2 5 100 61 40
learning project)
13. Public bilingual school, jungle, 1 10 20 2 0
NGO help 2 10 30 3 0
14. Public bilingual, jungle, no NGO 1 10 0 0 0
or project help (2 schools) 2 10 0 0 0
1 2 0 0 0
2 4 0 0 0
15. Private school, jungle, no NGO or 1 5 20 1 0
Project help 2 5 80 43 50
Source: Calculated by the authors from survey data.

Some Causal Analysis Related to Standards and Support
The method followed and the sample size do not allow for a traditional multivariate analysis.However, by focusing on a few powerful and simple indicators of school processes, one canform some idea of the problems at hand with a particular emphasis on aspects relative toreading and writing. What are some possible causes of both the variability and the appar-ently low levels of reading? Our analysis attempted to look at some possible issues, thoughnot with the full depth that would be desirable in a more complete and expensive survey.Again, part of the purpose here was to see how much can be done with a fast and inexpen-sive process that could be duplicated by UGELs and DREs. A few issues stand out.
First, the basic curricular statement of the Ministry of Education does not have veryspecific goals, and in any case the goals are for the first cycle as a whole (pre-grade 1, grade 1,and grade 2). The statement does lay out the expectation that children should read at theend of grade 1 (Ministerio de Educación del Perú 2000). However, compared to other cur-ricular statements and guidance documents from other countries or other structureswithin Peru, the goals are rather general and the guidance seems vague, on the one hand,and over-ambitious on the other. For example, in a country where many children areapparently not learning to recognize words at all, even in grade 2 but certainly in grade 1,one of the curricular goals by the end of grade 2 is to get children to “reflect on the lin-guistic functioning of the texts and systematize their findings to improve their reading andtext production strategies” or “to realize that the meaning of the text is constructed whilereading, and that it is reconstructed each time it is read anew, because it can make way fornew information that modifies the initial meaning” (p.11, our translation). It is difficult toestimate what a poorly trained teacher is to make of such language, or how she is to makeuse of this guidance in teaching, as it is likely that some of the teachers are themselves inca-pable of “reflecting on the linguistic functioning of the texts.” One can compare the offi-cial curricular statement to that of FyA (a “chain” of religious schools that function withpublic support and cater to relatively poor children), for example. The latter providesmuch more specific guidance and the curricular statement has fairly clear links to an assess-ment strategy (and the explicit assessment strategy links back to the curriculum)—seeTable 7.3. Furthermore, the curricular statement of FyA is based largely on an empiricalanalysis of what is doable and what is done, based on many years of experience (see Alcázary Valdivia 2005). Similarly, the curricular guidance provided in Chile or South Africa isquite specific (Ministerio de Educación de Chile undated; Department of Education 2002).
The implicit recommendation here is not that Peru should deprive itself of lofty goalsand high-level thinking on the cognitive skills children should have, for example, in read-ing. Instead, the recommendation is that Peru urgently needs to go beyond lofty statementsand stop assuming that most teachers are capable of adapting these statements and settingtheir own standards. Peru needs to specify goals or standards that teachers and teachertrainers find useful as concrete goals and guidance. Thus, the high-level, abstract statementcan co-exist with high-quality documents where specific standards, that tie back to thebroader curriculum, are presented to the community. Other countries manage to do this,though it takes considerable leadership and consensus-building given that it is the attemptto get specific that brings out differences in points of view. No implication is intended herethat having a very specific and clear curricular statement will guarantee good results, sinceChile’s results are not as far above Peru’s as one would expect based on Chile’s income per
Toward High-quality Education in Peru 83

capita, spending levels, and history of literacy—and South Africa’s results are worse.Nonetheless, the point is that other countries are concerned with making their curricula asspecific as possible and manage to do so.
Second, one might think that teachers do not realize the importance of goals, and donot work with goals. But, interestingly, teachers are at least aware that they need goals orstandards. A total of 54 teachers in the 22 schools were surveyed. When asked, almost allteachers (94 percent) said they set specific goals. Whether they actually do, or respond inthis manner because they know this is expected, was impossible to tell without more intru-sive and thus much more expensive querying. In any case, this possibility does not matteras much as the fact that teachers are aware that specific goals are a good idea. That they mayactually be setting goals—rather than simply giving the “right” answer to the question—issuggested (but only suggested) by the fact that when asked how they set goals, and whatgoals they set, most gave reasonable and specific answers. For example, in answer to theunprompted question “what sorts of goals do you set?” only 28 percent were unable to pro-vide an answer. This may be a large proportion of teachers without goals in some absolutesense, but it is lower than we expected. Finally, most teachers are even able to specifyapproximately what percentage of children has met the goals, and they themselves realizethat they are largely not meeting goals (see below).
It is important to note in these answers that only 41 percent of teachers claim to settheir goals in reference to guidance from the Ministry or other education authorities—most use, instead, their own experience or that of trusted colleagues, partly because theyconsider that the curricular statement is too theoretical, and insufficiently based on teach-ers’ own experience. This is in spite of the fact that most claim to possess and to know thecurricular structure (70 and 69 percent respectively), though we were not able to verify thisresponse objectively (e.g., by asking them to show it, or testing them on it). A full 80 per-cent of teachers, and 95 percent of the principals, considered that the curricular structureis too hard to apply or is inappropriate; 73 percent of teachers considered that the cur-riculum was crafted largely by specialists without consulting teachers; and 80 percentresponded that in their view this is an inappropriate way to formulate a curricular state-ment. It is difficult or impossible to give objective credence to these opinions—they areindeed largely opinions. Thus, it is difficult to state objectively that the curriculum is indeed“too difficult to apply.” Nonetheless, while subjective, these opinions tend to create a sensethat the curricular guidance provided to teachers is not very workable or practical, and theydo suggest that the teachers’ frame of mind with respect to the curriculum is not very pos-itive. Taken in conjunction with a direct textual examination of the abstract and theoreti-cal language of the curriculum statement, and comparing it to that of other countries andof other structures in Peru, one does get the strong impression that the curricular state-ment in Peru, and the resulting guidance, is simply impractical.
Not only are teachers apparently aware that they need to set goals, but also seem toperceive that their students are not really achieving the goals they have set. According toteachers, only some 55 percent of children have achieved the goals set by teachers. Unfor-tunately we found a relatively low correlation between how well the children are doing onreading fluency and comprehension and their own teacher’s judgment as to whether chil-dren were meeting the goals: the correlation was only 0.25 to 0.30.
We have seen that teachers appear aware that goals are a good idea; they claim to havegoals and are even cognizant that they are largely not meeting goals. This all suggests that
84 A World Bank Country Study

it is not so much a lack of awareness of the importance of goals but instead other mattersthat are contributing to low achievement. These factors could refer to: a) lack of pressureand accountability to perform to goal, or b) lack of knowledge and support with regard tohow to set practical and detailed goals that would put Peru closer to a standard, and howto achieve the goals set. Contextual factors such as poverty and malnutrition could ofcourse also be a problem, but it has been shown (see Chapters 2 and 4) that there seem tobe plenty of schools in poor areas that perform much better than others. That is, perfor-mance varies significantly even holding poverty and other factors constant.
Because all our reports are based on teacher opinion, it is natural that teachers wouldnot focus on their own accountability in all these matters, and in a survey of teachers itwould be largely futile to attempt to assess this issue. Other reports suggest accountabilityfor performance and incentives to perform are extremely low in Peru, as is evidenced bylow time on task and curriculum coverage (Cueto, Ramírez, and León 2003; Cueto andSecada 2001). Reports of wasted time are rife in Peru, and what is particularly worrisomeis that there appears to be little awareness among teachers and principals that this is a prob-lem (personal communication Richard Webb on work carried out by Elizabeth Linos onAugust 19, 2005; personal communication Barbara Hunt on work carried out by PatriciaOliart on August 19, 2005). Excessive time for breaks, time wasted on forming lines to enterschool, schools making decisions about taking extra vacation, teachers spending time idlychatting with each other while the children are unattended and not on-task, and so forth,are common and seem to create little concern. The current official policy goal of 1000 hoursof effective instruction per year is clearly not being adequately enforced, and there are noefficient mechanisms in place for enforcement.
However, some of the factors related to the support issues were striking. For example,we attempted to assess whether teachers receive specific pedagogical support in response totheir own perceived—and reported—lack of goal achievement, as opposed to the sorts ofgeneric training that are quite common in most developing countries. The results were quiterevealing. Only 13 percent of teachers claimed that they had received support from outsidethe school. Some 72 percent of teachers responded that there is no specified mechanism forreporting on problems and requesting support. (This could simply mean that, though thereis a mechanism, the teachers are unfamiliar with it or report that they are unfamiliar withit. In any case, this is an important fact.) Again in terms of support, only 44 percent of schoolprincipals claim to have written goal statements for their teachers as guidance for learningachievement in the early grades. (We did not ask to see the goal statements, so this percent-age is probably optimistic.) The quality and orientation of pre-service training was judgedby 81 percent of principals to be inadequate for practical classroom work.
It is clear that input supply problems are also at work. Textbooks can be taken as a casein point, given that they are perhaps the most important input. Anecdotal evidence gath-ered by the researchers suggests that the Ministry’s textbooks are not as widely used as theycould be. (Further, note that only 5 percent of the children evaluated could recall ever hav-ing read the chosen passage, though one should note also that the passage had been alteredslightly.) Furthermore, while coverage was very good, the books arrive late. While 80 per-cent of teachers say they get enough books for all their children (and all teachers whoresponded got some books), they also report that textbooks reached them, on average, 9 weeks after the start of the school year. The distribution of the timing is shown in Table 6.6(the school year starts in early April). In a school year that contains approximately
Toward High-quality Education in Peru 85

36 weeks, this delay implies a loss of one-quarter of the school year. This is not a newproblem. When asked how late books havearrived—historically speaking—the claim isthat books traditionally arrive some sevenweeks after the start of the school year, onaverage. Textbooks are arguably the mostimportant input in education, after teachers.Thus, performance on this issue is probably agood proxy for overall managerial perfor-mance, and it appears sorely lacking (though,as the children actually do get texts, the situ-ation is better than that found in many othercountries).
Finally, use of classroom time seems quitepoor and below any reasonable standard.Table 6.7 shows the distribution of observa-tions of classroom time use. Two observationswere taken on each classroom at differenttimes of day, if possible. About half of class-room time is wasted on relatively low-valueactivities. (Detail as to what activities wereconsidered “high value” pedagogical activi-ties is shown in Appendix B.) If one adds thisto evidence of very low time-on-task fromother surveys (Cueto, Ramírez, and León 2003;
Cueto and Secada 2001), poor use of time seems an important factor in explaining poorresults, and is most likely due to lack of standards and lack of accountability pressure to
meet standards.In summary, though the research did
not really aim at rigorously establishing thecauses for poor performance, the analysisdoes suggest that either accountability orlack of support in establishing good normsand standards, rather than total ignoranceregarding the importance of goals andstandards, is an important issue. The
results also suggest that lack of specific support (for example, support that is responsive to aspecific, reported problem, via an established system) is indeed an important reason.(Generic support and capacity building appears to be less of a problem, as most teachers havebeen trained both in-service and pre-service. Yet, as suggested by the principals, the pre-service training, at least, does not prepare teachers for classroom work.)
An interesting point does come out of parent interviews (unfortunately only 27 par-ents were interviewed): most parents are quite happy with their children’s schooling. Fully89 percent of parents claim their children’s school is a good one. This does not appear tohave been a totally “socially expected” response. When queried as to why they thought the
86 A World Bank Country Study
Table 6.6. Week of Textbook Arrival inthe Classroom as Reportedby Teachers
Week of Arrival Percent
2nd in April 1.9
4th in April 7.4
1st in May 13.0
2nd in May 7.4
3rd in May 1.9
4th in May 5.6
1st in June 22.2
2nd in June 3.7
4th in June 3.7
1st in July 3.7
2nd in July 5.6
3rd in July 1.9
4th in July 1.9
1st in August 1.9
2nd in August 1.9
2nd in September 1.9
Don’t know/no answer 14.9
Source: Calculated by the authors fromsurvey data.
Table 6.7. Teacher Use of Classroom Time,from Classroom Observations
Low-value activities 48%
Medium-value activities 40%
High-value activities 12%
Source: Calculated by authors from survey data.

school was good, all of the queried parents were able to give a response, and of the 24responding positively, 9 stated the children were learning well. Furthermore, this is not aresult peculiar to our survey, or even to Peru. The 2001 National Evaluation, which has avery large and representative sample, found that, among parents of 4th graders, 80 percentor so (depending on the aspect) were happy or very happy with each of five aspects ofschooling. Worse, not only were parents happy in general, but the correlation between chil-dren’s measured achievement and parental satisfaction with (specifically) the academiclevel of the school was only 0.26. A similar lack of connection between the rating of themanagement performance of school managers and parental satisfaction with schools wasfound in Indonesia. Parents are not only generally happy (more than 80 percent are happywith school processes), but their satisfaction level is relatively uncorrelated with managers’ratings of managerial performance (for example, how long it takes to transfer a childbetween schools, how long textbook procurement takes) of various districts—these corre-lations are always less than 0.10 (World Bank 2004). Given that children do not seem to belearning very much, all this suggests parents have rather low expectations, probably due tothe lack of specific, simple, communicated achievement metrics or goals. In this respect, itis probably over-optimistic to expect parental input and pressure to lead to quality improve-ments in Peruvian education, unless standards are first created and popularized and theinformation on individual school performance against standard is disseminated to parents.
Toward High-quality Education in Peru 87


Behavior and Choice in Peru’s Public Schools
Introduction and Method
In many schooling systems, there are failures in the “long route” of accountability. (SeeChapter 3 for an explanation of this terminology and the concepts discussed in this para-graph.) These failures are associated with poor quality of schooling, particularly for the poor;this means that there are breakdowns in the accountability of the state to citizens, and par-ticularly to poor citizens (failures of “voice”) and failures in accountability of schools to thestate (failures of “compact” and management). In these situations, there is often no way forthe poor to express their desires so that these desires have consequences; as such, the gov-ernment can ignore the needs of the citizens, and particularly the needs of poor citizens.Even if government were solicitous of citizens’ needs, however, the response would be poor:there are no standards of service at all, or the standards are difficult to render operational,and there is little effective control of schools by the bureaucracy. In any case, whatever stan-dards do exist are not applied—absenteeism is rife, the curriculum is not applied, poorteachers are not supported, disciplined, or eventually dismissed. This is obviously aside frommaterial poverty, because in principle even a poor society can have administrative disciplineand can set and keep standards. Instead, in many poor but badly managed education systems
CHAPTER 7
School Management Issues37
89
37. This section is based on the author’s interpretation of “Escuelas de FyA en el Perú:
Análisis del modelo de gestión institucional y pedagógica y lecciones para la educaciónpública”, and “Prestigio institucional y eficacia escolar en colegios públicos: un estudio decasos en cuatro ciudades del Perú”, consultant reports prepared for this study by LorenaAlcázar and Néstor Valdivia, of GRADE.

one finds both unrealistic standards in theory, on the one hand, and very little actual appli-cation of any standards at all, on the other. When there are accountability failures in this “longroute” of accountability, a fairly common recommendation is for countries to strengthen the“short route” of accountability, both by increasing parental choice over service providers (a“voucherized” approach), and/or by improving direct parental influence via more powerfuland localized school councils (an “autonomy” or communitarian model). These are the mainrecommendations of a typical accountability-based approach, such as that promoted in theWorld Bank’s World Development Report 2004. This section explores the degree to whichthese methods are already at work in Peru, and whether they seem to have much impact. Ittherefore evaluates whether further “short route” accountability should be encouraged.
This section is based on the hypothesis that considerable choice already exists in Peru’surban areas because there is no effective school zoning and schools are reasonably accessiblevia public transport. Parents can and actually do choose which public schools their childrenmight attend. It was supposed that such parental choices are guided by reputation—thoughthe reputation might not necessarily refer to academic achievement, since parents value otheraspects of schooling, such as discipline for its own sake and the inculcation of moral valuesin their children, or may even pursue pure snob values.38 The section further took as its pointof departure that, if parents choose by reputation, and if defense of reputation requires cer-tain managerial behaviors, then choice would have behavioral consequences in school man-agement. Finally, it was supposed that these behavioral consequences would tend to beassociated with good academic results, or that these behaviors would at least correspond withbehaviors which the literature identifies as typical of “effective schools.” The policy implica-tion would not necessarily be that more “school choice” is the solution, but that the manage-rial choices and strategies employed by “schools of choice” would be of interest even to the“compact” aspects. Accordingly, there may be lessons for public sector reform that can bederived from how the “schools of choice” are managed.
To test these hypotheses, this section studied schools that had a good reputation to seewhether they in fact had good results or at least defended their reputation with certainbehaviors. Obversely, schools that appeared to have good results were studied to see if theyhad a good reputation, and, again, to see what behaviors were associated with the defense(or buildup in the case of younger schools) of this reputation. The reputation-defensebehaviors (if any were found) that appear to be common to these schools were comparedagainst the behaviors associated by the literature with “effectiveness.” Due to cost and timeconstraints, a large-sample quantitative study was not possible. Furthermore, there wasinterest in deeper insights into how the mechanics of reputation defense work. Themethodology employed was to select a few schools, and to conduct focus groups and inter-views with school leadership, teachers, and parents. Subsequently, some of the hypotheseswere confirmed and others were not—with the qualification that studies using this sort ofmethodology can hardly give unequivocal confirmation or refutation of hypotheses. The
90 A World Bank Country Study
38. Educators probably dismiss these issues in too facile a manner. Parents may seek school charac-teristics that appear to have only snob or “school spirit” values. But school spirit and identity may have aproductive value, as opposed to merely a consumption value, in furthering learning achievement. Thus,deriding parental choice based on school characteristics such as having an English name, or the distinc-tiveness of the school uniform, is probably unwise.

results are, in any case, perhaps even more interesting than if the hypotheses had beenuniformly and simply confirmed.
Only secondary schools in urban areas were studied. This was done not because the studysupposes these schools to be more important than others, but because it is typically only inurban secondary schools that choice factors operate strongly and without artificial stimula-tion. Again, since the policy implication is not necessarily to extend choice everywhere (inthe rural areas it may not make sense) but to use either parental pressure or compact mech-anisms to extend the behaviors associated with choice, this approach is sensible. The idea, forexample, might be to assess which behaviors “work” and then to create, in parents living inareas where no school choice is available, a sense that they have a right to schools where thesebehaviors are common; additionally, parents should be trained in procedures to demand,assess, and enforce such rights. Similarly local education offices (UGELs) would be trainedto teach schools how to respond to parental demands with appropriate behavior change.
The process for school selection took into account two factors: “reputation” or “pres-tige” and objective results. The reputation factors were established via an existing survey ofschool reputation (which unfortunately covered only Lima-Callao) and via interviews withlocal experts (such as at the UGEL level) in two other urban areas. Because there was anadditional interest in seeing whether reputation and results were correlated, schools werealso chosen on the basis of having good results in the 2001 mathematics assessment, definedin two ways: schools that were at or above the mean performance and whose actual perfor-mance was higher than its expected performance on the basis of inputs and socioeconomicprofile of students (where the expectations were ascertained via a simple OLS analysis).Because the 2001 national assessment is sample-based, one could not always ascertain theobjective results of schools with a good reputation; it was possible to determine objectiveachievement only if schools of reputation happened to fall into the sample assessment sam-ple. Thus, it was necessary to proceed from both directions. That is, in the end, schools thateither had a good reputation or good results, or both, were included.
On the basis of these factors, the urban secondary schools chosen are shown inTable 7.1.
Findings
Reputation matters, is known, and choice is exercised. The public can indeed identify andrank schools by reputation. In a Lima marketing survey, respondents were able to identifyand rank schools by perceived quality. In the analysis carried out for this report, in whichlocal reputation was assessed less scientifically, it was typically possible for respondents toidentify public schools that, in their view, stood out. Thus, public schools are not all thesame, at least in the public’s eye. Furthermore, schools that have a good reputation havewaiting lists and selection mechanisms. Parents from areas of the city other than where theschool is located do seek to enroll their children in schools with a good reputation. (How-ever, as will be seen below, reputation is often dependent on signals that may not havemuch to do with academic achievement. Thus, choice does not necessarily put positivepressure on learning.) The obverse is also true. There are schools known to have difficul-ties and known to be frequented by youths with behavior problems. It is explicitly recog-nized by youths and parents that this is not necessarily correlated with the poverty of theyouths: some schools are simply places where problematic and undisciplined youths tend
Toward High-quality Education in Peru 91
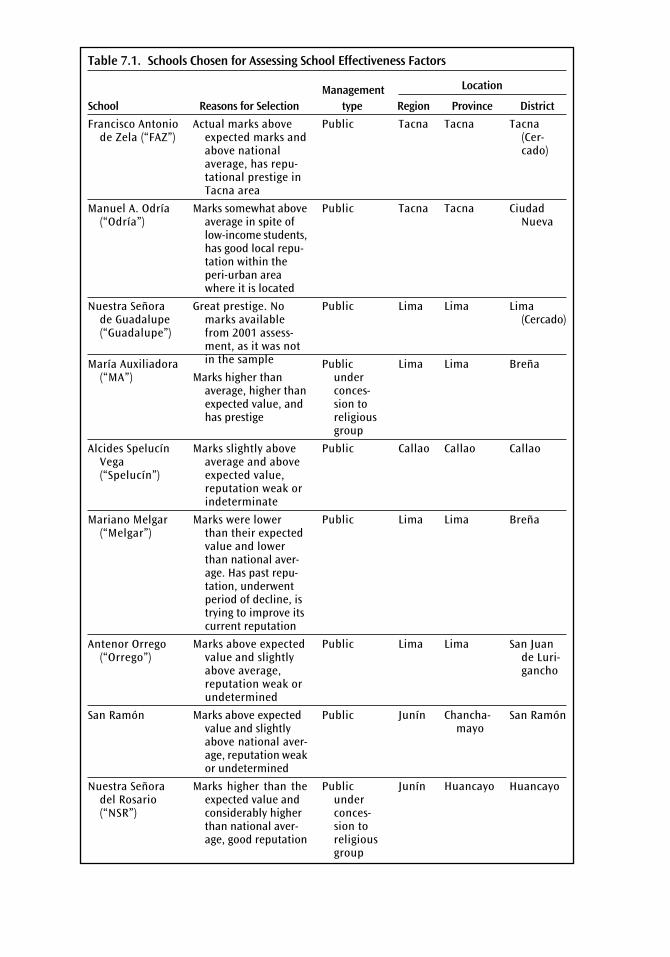
Table 7.1. Schools Chosen for Assessing School Effectiveness Factors
Management Location
School Reasons for Selection type Region Province District
Francisco Antoniode Zela (“FAZ”)
Manuel A. Odría(“Odría”)
Nuestra Señorade Guadalupe(“Guadalupe”)
María Auxiliadora(“MA”)
Alcides SpelucínVega(“Spelucín”)
Mariano Melgar(“Melgar”)
Antenor Orrego(“Orrego”)
San Ramón
Nuestra Señoradel Rosario(“NSR”)
Actual marks aboveexpected marks andabove nationalaverage, has repu-tational prestige inTacna area
Marks somewhat above average in spite of low-income students, has good local repu-tation within theperi-urban areawhere it is located
Great prestige. Nomarks availablefrom 2001 assess-ment, as it was notin the sample
Marks higher thanaverage, higher thanexpected value, andhas prestige
Marks slightly aboveaverage and aboveexpected value,reputation weak orindeterminate
Marks were lowerthan their expectedvalue and lowerthan national aver-age. Has past repu-tation, underwentperiod of decline, istrying to improve itscurrent reputation
Marks above expectedvalue and slightlyabove average,reputation weak orundetermined
Marks above expected value and slightly above national aver-age, reputation weakor undetermined
Marks higher than theexpected value and considerably higher than national aver-age, good reputation
Public
Public
Public
Publicunderconces-sion toreligiousgroup
Public
Public
Public
Public
Publicunderconces-sion toreligiousgroup
Tacna
Tacna
Lima
Lima
Callao
Lima
Lima
Junín
Junín
Tacna
Tacna
Lima
Lima
Callao
Lima
Lima
Chancha-mayo
Huancayo
Tacna(Cer-cado)
CiudadNueva
Lima(Cercado)
Breña
Callao
Breña
San Juande Luri-gancho
San Ramón
Huancayo

to congregate, where such problems are tolerated (causing a cumulative problem of dys-functionality), and there are other schools where indiscipline is not tolerated.39
Behavior affects reputation, but enhanced reputation is not always the main motivation foreffective behavior. We found that in the schools with both good results and good reputation,behaviors tend to be different (though not necessarily effective in academic terms—many ofthem have to do with extracurricular activities, as will be seen below), and are actually self-consciously different—teachers and parents were conscious that managerial and teachingbehaviors are different. However, only in some of the schools is the behavior consciouslyaimed at preserving or enhancing reputation. In some of the schools visited, and among someteachers in other schools, intrinsic pride, a sense of duty to community (and even abstractduty), and a sense of professionalism all lead to behaviors that enhance reputation, but thebehaviors are not engaged in because they lead to improved reputation. This was particularlytrue, as one would expect, in the schools under management by religious groups. It is con-sistent with the findings on FyA schools, reported in Chapter 7. In fact, in only one of the fourschools with many effectiveness-related behaviors (Odría), could one argue that the pursuitof an improved reputation was clearly a driver in promoting behavior (and it is not so clearthat these are behaviors that actually produce much better results—the point is, though, thatthere is reputation-seeking behavior). In the other three (Francisco Antonio de Zela, MaríaAuxiliadora, and Nuestra Señora del Rosario), some combination of religious and militaris-tic or national-pride factors seem to play a powerful role in generating pressure for effectivebehavior, though in one of them (Francisco Antonio de Zela) there is a combination of intrin-sic pride and behavior that specifically seeks to maintain reputation. In the case of intrinsicmotivation, the behaviors do generate a good reputation, and generate excess demand forplacement in the schools. In this sense, choice is exercised and is consistent with effective-ness. But the directions of the logic and causality in these important cases are the opposite ofthose that were hypothesized. The hypothesis was that choice is based on reputation, and thatthe need to defend reputation leads to effective behaviors. The reality appears considerablymore complex. Choice is affected by reputation, but reputation is only somewhat correlatedwith objective factors, and behavior was not in most cases prompted by the desire to createor defend reputation.
Behaviors that seem to be associated with effectiveness and reputation were fairly easy toidentify; they cluster, and many are in principle replicable. In order to assess presence ofimportant managerial and pedagogical behaviors in the schools, a more or less standard of“effectiveness” factors was chosen, via reference to what literature already exists in LatinAmerica on this issue (Báez de la Fe 1994; Muñoz Repiso and others 2000; Dávalos 1998;LLECE 2002; CIDE 2003). The following factors were tentatively identified:
1. Clear leadership from the school principal, focus of the principal on teachingquality, pedagogical leadership and support provided by the principal to teachers.
2. Space for de jure or de facto autonomy for the schools, particularly in manage-ment of personnel.
3. School’s mission and objectives are clear and widely shared.
Toward High-quality Education in Peru 93
39. The insight about dysfunctional schools was derived from the research into dropouts carried outfor this report. See Chapter 5.

4. School is orderly and secure. Norms, policies, and procedures are clearly estab-lished and known by all.
5. Discipline in development of school activities, use of positive reinforcementmechanisms for both teachers and students.
6. School is centered on teaching and learning. Time is optimized and time-on-taskis high. Emphasis on academics.
7. Stimulation of students is both intellectual and emotional. Teachers have highexpectations of all students.
8. Teachers actively support the learning of all students, and there are mechanismsto help those falling behind.
9. Classroom interactions between students and between students and teachers areharmonious.
10. There is an emphasis on basic skills (reading, writing, mathematics).11. There is a culture of evaluation and measurement. There is frequent control,
supervision, and feedback.12. There is team-work between teachers and school management. There is cooper-
ative planning and exchange of techniques between teachers. Supervision andsupport merge with each other, but both take place.
13. Relationship between the family and the schools is tight. Parents are committedto their children’s education.
These factors (though not in this order and regrouping some of them) and a few oth-ers were assessed in all schools to see which were present and which were not, and whetherthis was related to the reputation or the objective results. In addition, we added some fac-tors that are not identified in the literature. The more these factors were present, the morea school was judged to be effective (without reference to reputation or objective perfor-mance). As can be seen in Table 7.2 below, there was a break in the number of tallied behav-iors between the top four schools and the others. On this basis, four schools were judged tobe relatively more “effective” (more exactly, four schools had many more behaviors usuallyassociated with effectiveness) than five others. Schools were then sorted according to thenumber of behaviors present. In order to cluster or rank the behaviors, a contrast was thencreated between the behaviors present in the four most effective schools and the others. Thiscontrast is simply the probability that the behavior would be present in the four most effec-tive schools minus the probability that the behavior would be present in the less effectiveschools. Behaviors were then sorted according to this contrast. Thus, in the table below, bothschools and behaviors are sorted: the schools by effectiveness, and the behaviors by howmuch contrast there is between generally effective and less effective schools. In addition, theprobability of observing the observed distribution of behaviors in the four sampled “effec-tive” and five “non-effective” schools is also shown, if there was no behavioral differencebetween these types of schools in the population. The overlap between behaviors with a con-trast of 0.75 or larger, or p-value less than 0.01, is perfect. Because the sample is so small andnon-random, it seems wise to focus on behaviors or factors with a p-value less than 0.01,that is, to set the bar on statistical significance much higher than is normal.
A few items stand out, and a few more were somewhat surprising. Among the factorsthat stand out, the importance of standards and standards-based evaluation, broadlyunderstood, is confirmed. Elsewhere in this report the lack of clear standards in public
94 A World Bank Country Study

Toward H
igh-quality Education in Peru95
Table 7.2. Tallies of Effectiveness Factors
School
Effectiveness Factors FAZ MA NSR Odría Melgar San Ramón Guadalupe Orrego Spelucín Contrast p-value
1 Vision and objectives clear X X X X 1 0.0020and widely shared
2 Teaching and learning as X X X X 1 0.0020the key axis of school work
3 Culture of evaluation, X X X X X 0.8 0.0098monitoring, feedback
4 Teachers engage in X X X X X 0.8 0.0098team work
5 Motivation and sense X X X X X 0.8 0.0098of mission
6 Clear norms and organization X X X 0.75 0.0078
7 School environment orderly X X X 0.75 0.0078and disciplined
8 Support to students falling X X X 0.75 0.0078behind
9 Extra-curricular activities X X X 0.75 0.0078
10 Parental participation X X X X 0.55 0.0391
11 Autonomy in school X X 0.5 0.0117management
12 Teacher qualifications X X X X X X X 0.4 0.0195
13 Curricular or pedagogical X X X X X X X 0.4 0.0195innovativeness
14 Principal’s leadership X X X X X 0.35 0.0781
15 Infrastructure and materials X X X X X 0.35 0.0781
16 Emphasis on basic skills X X X 0.3 0.0586
Total factors present 14 14 14 11 5 4 3 3 0
Source: Elaborated by the authors from survey data.

schools is often discussed, and the presence of standards in FyA schools is contrasted. Wenow see something similar operating in the effective public schools. Factors 1, 2, 3, and 6could be said to refer to clarity of goals and goal-oriented behavior and measurement. Therelative unimportance of traditional inputs (teacher qualifications, infrastructure andmaterials) and of curricular or pedagogical innovativeness is to be noted. It has been notedelsewhere in this report that Peru’s educational climate is somewhat characterized byunsubstantiated “fashionable” approaches in curricular and pedagogical offerings, and thatteachers in the relatively effective FyA schools seem to be more comfortable with gradualas opposed to abrupt changes based on fashionable trends. The results presented here con-firm this impression.
A few items were surprising. First, the role of extra-curricular activities. In many casesextra-curricular activities provide academic enhancement and are, as such, an element thatdirectly creates academic effectiveness. Even when this is not the case, these activities are partof what parents seek in education; after all, education is not all about academic achievement.But the amount of extra-curricular activity that does not seem directly related to actually cre-ating effectiveness was surprising. Because there are few objective ways to assess and compareschools in Peru on an objective and purely academic basis (since there are no universal stan-dardized testing or public examinations as there were in the past), schools perhaps fill thisvacuum by participating in many extra-curricular activities that allow them to rank them-selves against each other. Marching in parades, athletic competitions, academic contests orolympiads, winning special projects organized by the Ministry of Education, the percentageof children that manage to enter universities, and the existence of gangs (on the negative side)are all examples of mechanisms whereby schools possibly judge each other and parents judgeschools. Some schools devote considerable effort to trying to look good on these aspects,many of which are extra-curricular and some of which have little to do with measurable aca-demic achievement. Thus, this is a “noisy” market. Or, perhaps, it is actually a fairly efficientmarket, but parents value things other than academic achievement—things such as disciplineand moral values for their own sake—to a degree that researchers and policymakers tend to“disapprove” of because they are not seen as directly productive of learning achievement. Itmay be that because researchers tend to “disapprove” of school products that are not directlyrelated to academic achievement, they tend to regard signaling with regard to those productsas market “noise” rather than information.
Second, the role of the principal. In Peru, the principal appears to be mainly an admin-istrative manager and not a pedagogical leader, even in some of the better schools. The roleof pedagogical leader falls on the Deputy Principal. In our analysis, schools could be rea-sonably effective if the principal—at the very least—did not stand in the way of the DeputyPrincipal and the teachers. In some cases, we found an effective principal but the schoolitself was not very effective. It is difficult to believe that Peruvian reality would contradictone of the most solid findings from the effectiveness literature. It is likely that where goodprincipals do not exist, in the Peruvian case other structures (Deputy Principals, the teach-ers themselves) have managed to rise to the occasion, and it may also be that the ineffec-tive schools are dysfunctional in ways that are much deeper than a principal could fix(gangs, political rivalries between teachers).
The relationships between effectiveness factors, prestige in the eyes of the public and the par-ents, and academic results, are not simple. Furthermore, the relationships between these factors aredynamic and have considerable lags. The correlation between the presence of effectiveness
96 A World Bank Country Study
behaviors and actual, measured academic achievement (in mathematics) was only 0.55.40 Fur-thermore, while there is some correlation between reputation and effectiveness behaviors, therelationship is certainly not a simple one. Schools such as Odría, which manages to do fairlywell even though it is relatively new and in an area of comparatively low socioeconomic sta-tus (for an urban school), has only a local reputation and modest but better-than-averagescores, and yet it displays a reasonably large number of effectiveness indicators. It is possiblethat over time scores and then reputation will both improve with a lag if the effectiveness fac-tors keep up. Guadalupe, on the other hand, has a much better reputation, but shows very feweffectiveness behaviors. (Unfortunately, objective performance indicators were not available.)It is a school that traditionally shaped much of Peru’s leadership, but has fallen behind. Simi-larly, Melgar is a large urban school with a respectable reputation derived from its distant past.Today this school shows neither many effectiveness behaviors nor good results and would notbe judged a good school by a professional evaluation even if the public still seems to think rea-sonably well of it. (In our analysis it was clear that there is an even more recent dynamism atthe school and a renewed willingness to deal with problems that apparently have underminedits effectiveness in the past—factionalism among teachers, drugs and gang problems, vio-lence). The case of Odría is an interesting one in that it seems that current effectiveness is fairlynew and is the result of a school turn-around that was motivated by a relatively recent crisisor breakdown of relationships between teachers and parents. This is consistent with researchon “improving schools” from Chile that suggests that in all of the “improving schools” thatwere studied, an external impact or crisis was always the motivation for a turn-around(Raczynski and Muñoz 2005). Finally, the issues noted in this paragraph need to be consid-ered in light of the finding reported above, namely that motivation for effective behaviorappears to be somewhat intrinsic and does not seek only to affect reputation, and that repu-tation ensues when behaviors are effective for intrinsic reasons.
It could be that the relatively complex and lagged relationship between all these fac-tors is partly the function of a lack of objective information about performance. As will beseen immediately below, many schools seem to relish having some standards against whichto measure themselves, and various forms of competition and score-setting tend to emergein Peruvian society given that the government does not provide metrics. It is possiblethat if society and market were more fully provided with performance information, therelationships between effectiveness behaviors, prestige, and results, would be clearer.This issue is important to managers, not just to researchers. The point is not to makethese relationships clearer so that educators, sociologists, and economists can under-stand things better. The point is that with more information the actors involved in thesystem would see the impact of their actions more clearly, and would thus have moreincentive to engage in effective behaviors. In conclusion, Peru is far from having an effec-tively informed educational market, given that information on the quality of supply isvery incomplete. Furthermore, there are many intrinsic-motivation and extra-marketfactors at work.
Good schools, or those trying to improve, seem to actually relish competition and objec-tive comparisons. Schools, or at least effective ones, seem to seek standards, and where
Toward High-quality Education in Peru 97
40. Though it should be recalled that at the bivariate level the correlation coefficient is the same thingas the standardized regression coefficient or “effect-size”. An “effect-size” of half of a standard deviation,or 0.55, is not small, seen in this light.

they do not exist or are not provided by the government, schools create some standardsor benchmarks or participate in benchmarks that are not officially recognized as such.Schools engage in a wide variety of competitive behaviors. The analysis carried out foundconsiderable competitive behavior in athletics, in academic “olympiads,” in competi-tively-awarded grants from the Ministry of Education, in school marching performancesin parades, in comparing university placements, and in other types of activities that allowschools to score themselves against each other on quite visible and fairly objective met-rics. Among Ministry officials and other educational leaders in Peru, there seems to be agreat fear of publishing universal information on school performance. Yet, it seems as ifschools actually feel a need to assess themselves and to know how they are doing relativeto others.
It was also clear that, at least in some cases, schools engage in these activities becausesucceeding at them serves an information function. Success creates prestige and sendssignals to parents. In other cases, schools engage in activities more out of an intrinsicmotivation to excel.
The fact that effectiveness factors are easy to identify but have complex relationships toactual academic achievement has important policy and management-development implica-tions. A managerial implication is that if—based on Peruvian research—more certainty canbe achieved on how the various complexities work together so that a more reliable list ofeffectiveness standards can be reached, it will then not be difficult to tell which schools arebehaving well. In effect, it is not difficult to evaluate schools and apply the standards. Thismeans that it is not, at least in principle, difficult to monitor and then manage to standards.But the fact that these relationships are complex implies that more research and observa-tion than was possible in the present report is needed.
Schools with better reputations do engage in selection behaviors. As is the case in FyA(see Chapter 7), schools with better reputations do engage in “cherry-picking” or “cream-skimming.” They attract children who are more motivated, better prepared, or have moreparental support—and are hence easier to teach than children in other schools. And thisimpacts on their results, which increases the reputation of the school, which in turn makesit even easier to “skim” the best out of other schools. There is, furthermore, a subtle inter-play between clarity of goals and mission and “skimming.” This sort of skimming is an infor-mation-intensive function. If the school’s goals are clear and well-known, and imply harderwork and more discipline, then more motivated parents and children will tend to self-selectinto those schools; thus, the schools will have to do less selection and will be in a position toclaim that they do not actively select. Thus, having clarity of goals, mission, and valuesis not only “productive” in that it leads to better results, but is also effective in facilitat-ing the selection of children with certain values into the schools by making it possible forthem to self-select. But this selection is not itself “productive”. Thus, some of the betterresults in the effective schools are simply due to the fact that they tend to have childrenthat are easier to teach, and some of the behaviors that are “effective” or “productive”also play a role in selection. Methodologically, this also means that it would be extremelydifficult to disentangle, in a statistical analysis, which aspects of goal-clarity are truly pro-ductive, and which are important because they allow for self-selection. In any case, oneclearly cannot improve an entire system on the basis of selection. Thus, caution is neededabout how much the whole system could improve if poorer schools were simply to “dowhat the good schools do.”
98 A World Bank Country Study

Policy Implications
A few implications stand out from the analysis carried out in this section.First, more management research of the sort conducted here should be carried out,
with larger samples and by mixing quantitative and qualitative techniques. While theresearch industry in Peru has produced many useful and interesting “production function”sorts of analyses (see Chapter 2), a shortcoming is that many of these studies have not yet beensupplemented by management and institutional analysis. “Production function” studies tendto focus on the importance of certain inputs, and for this reason they are quite valuable, butthey tend to neglect the importance of institutions (rules of the game) and management.
Second, given the importance of clarity of goals and coherence of institutional mis-sion, it seems reasonable to keep experimenting, perhaps using more rigorous evaluationmethodologies, with various forms of concessions and contract-based management, sim-ilar to that seen in the cases of María Auxiliadora and Nuestra Señora del Rosario. Again,realism suggests that, because these schools do engage in selection of students (or studentsself-select), and do not cater to the poorest segments in Peruvian society (nor the richest,by any means), one should expect possibly worse results than are currently obtained ifschools of a similar type do reach out to more average or harder-to-teach students, aswould be the case in a process of expansion. This should be taken into account in any eval-uation methodology. One possible and simple idea to make evaluation easier is that anyand all schools operating under concession should be included in the national learningassessments, by definition. That is, they would automatically enter into the sample.
Third, while more research should indeed be carried out as suggested above, the evi-dence from both secondary, urban “public schools of choice” as well as FyA, as well as theevidence from the weak standards application in early reading in a wide variety of schools,suggests that Peru’s public schools need to urgently work on a series of interlinkedimprovements, to include:
1. Much clearer and more detailed standards and expectations. These could beadjusted by socioeconomic background of students. But more standards and clearerexpectations are needed. Regardless of what other, more sophisticated, institutionalinnovations are promoted, without standards no innovations can work. Further-more, the greater the variety of experimental offerings that exists, the more pressingit becomes to have some form of standardized evaluation. This sort of assessment isimportant not just for “scientific” evaluation that devises solutions that arethen imposed on all, but to inform an evolutionary or “Schumpeterian”approach to improvement. Without some form of universal standards-based assess-ment it is impossible to judge, in real time, the results of the experimentation.
2. Within a framework of standards, more autonomy-with-accountability andmore insistence on service to communities (by giving communities more powerover schools) to allow schools to develop institutional character and mission.Currently schools do have plans, but they are weak and formulaic. At the sametime, it should be noted that giving communities more power over schools, inthe absence of standards and training of communities to use standards, isunlikely to yield much quality improvement.
3. More measurement and diffusion of measurement results, including the possibil-ity of universal testing in certain grades and the use of results to inform schools as
Toward High-quality Education in Peru 99

to how they compare to other schools, and what specific lacunae they have in theirinstructional strategy.
4. More focus on teaching and learning, with more effective time devoted to academicwork, and fewer fashion-led changes in curricular approach—less focus on curricu-lar and teaching innovation for the sake of innovation.
Direct Relationship Between Schools and Community: Fe y Alegría and the“Directed Autonomy” Model
Background and Method
The Fe y Alegría (FyA) system of Catholic-oriented schools provides a model of both effec-tive compact and of school autonomy oriented at direct service to the community. FyA isa “chain” of privately-run schools managed by the FyA system, but with considerable lev-els of public funding (most of the teaching force is paid for by the public sector). The aimof these schools is to reach poorer children with an education that is both academicallysolid and focused on certain values (Constance 2003). The FyA system is a useful case studyfor three reasons.
First, it is large enough to be considered a true system, even within Peru. As of the writ-ing of this document, the FyA system had 71,500 students, 3,200 teachers, 62 large schools,4 networks of rural schools with 97 additional schools, as well as a diversified set of tech-nical and vocational venues. This size means that FyA has a scope similar to what a decen-tralized province-level management body in Peru, the UGEL, would handle. Furthermore,Peru’s FyA is part of a large international movement. Thus, the lessons that emerge havesystemic value, not just school-level value.
Second, evaluations of performance regularly show results better than those in publicschools, even though: a) costs are about the same or not much higher, as the system usesteachers paid on the same salary scale as public school teachers, at about the same ratios,and b) the children attending are typically from the bottom two quintiles of the incomedistribution (Morales y Romero 1998, Alcázar y Cieza 2002).
Third, the FyA “approach” is nearly fifty years old (taking the approach to be the con-tinent-wide approach, not the Peru-specific approach); it has been built up over decadesand has stood the test of time. FyA schools started in 1955 in Venezuela, and have spreadgradually to much of Latin America (Constance 2003).
The main thesis in this section is that there are both “compact” (management and pol-icy) as well as “client orientation” (autonomy of operations and direct service to commu-nity) factors that, in terms of the overall accountability framework used in this report,make FyA schools work quite well. An important sub-thesis is that some of these factorsamount to a “zero-sum” game in that they would not be replicable to a whole system evenif the whole system were privately managed: they only work in a set of relatively goodschools that are part of a larger, mediocre system, be it publicly- or privately-managed, andwhere those schools that are relatively good can “cherry-pick” from the mediocrity aroundthem. For example, better teachers (such as those willing to work harder) will tend to beattracted to better, more demanding schools. In this sense, these schools work better notjust because they have better systems but because they have better inputs. In fact, the otherschools then get stuck with the worst teachers. Thus, a whole system cannot improve via
100 A World Bank Country Study

these sorts of zero-sum games because by definition a whole system cannot have “better”teachers than someone else. There is no someone else, so the system as a whole has theteachers it has. Thus, these are factors that are replicable but only to sub-systems. There isa second set of factors that are not replicable at all, at least not at the cost at which FyA pro-vides services, because they are in inherently limited supply. Finally, there is a third set offactors that is replicable to the scale of the whole country, either to a reformed public sys-tem or to a system based on private administration. This last set of factors is the most inter-esting, so we start with these. An exploration of the non-replicable factors might appearsomewhat academic, in that there might appear not to be any lessons to be learned. Nev-ertheless, it is important to at least touch upon these points so as to prevent excessive ornaive optimism about the lessons that FyA might contain for the public sector or for massreplication via private management.
The methodology followed in this section consisted of: a) a review and compilation ofthe empirical literature, particularly that which refers to the Peru FyA schools, for basicbackground and evaluation of results; b) review of FyA’s own documentation; c) focusgroups and key-informant interviews. With respect to the latter, three schools were visited,chosen from those that were not the oldest and were in relatively poorer areas. Though FyAgenerally establishes schools in poorer regions, since that is its mission, some of the regionsserved have developed over the years, and parents today in some of theses schools cannotbe said to be poor. At each school the director and sub-director were interviewed, and afocus group with teachers was carried out. In addition, officials from the head office wereinterviewed. All interviews were structured via questionnaires aimed at testing specifichypotheses and exploring specific questions. The basic hypothesis was that, as noted above,there are some factors associated with FyA’s success that are most likely replicable, andsome that are most likely not replicable. The interviews were aimed at ascertaining the pres-ence and relative importance of replicable versus non-replicable factors.
Replicable Factors that Account for Fe y Alegría Success
The analysis of FyA suggests that there are several factors that account for its success, andthat these factors could be replicated broadly; they are not “zero-sum” factors. These arediscussed below. In each case, we evaluate the probability that they could be replicated inthe public sector. If they are not replicable in the public sector, the implication is that fur-ther experimentation of non-public management but with public funding should beattempted. Each of the conclusions below is driven by our interviews and focus groups. Ina few cases there is a discussion of these factors in the literature. In general, however, ourhypotheses have not been explored in quite this way (an accountability orientation), sothere is not much literature.
A culture of action, reflection, and evaluation that is part and parcel of Jesuit tradition.The FyA system originates in the Society of Jesus. This Catholic order is well-known for anapproach to action based on one of the earliest “systems” of what would today be called“quality control feedback loops”, but which is deeper than that phrase implies. Theapproach involves a repeated sequence based on the concepts of context, experience, reflec-tion, action, and evaluation in a constant feedback loop (The International Centre forJesuit Education 1993; Kolvenbach 1986)—an approach that is applied both to individualimprovement of learners and teachers, and to system improvement as well. While the
Toward High-quality Education in Peru 101
Society of Jesus may indeed have been one of the first “Western” institutions to explicitlyapply this sort of evaluation loop, by now almost any “rational” and goal-oriented organi-zation that is effective is run in this fashion. The approach is thus replicable within the pub-lic sector of Peru, but would require continuity of leadership and resources for theoperation of such a system. Yet, these systems are not “natural.” On the contrary, theyrequire organizational effort and discipline. Thus, another requirement is the existence ofa strong motivation to even consider a system of this nature. In a religious order such asthe Society of Jesus, and by implication in FyA, this motivation is intrinsic. In a public ser-vice, the motivation has to be external and based on accountability to the public. The lat-ter is not currently operant in Peru’s public sector, but it could be generated over time.
Clear goals and sense of mission. A clear orientation around fundamental values of hardwork, achievable academic goals, practicality, and devotion to duty and community waswidely cited by those interviewed as keys to FyA’s success. The literature also highlights thisfactor (McMeekin, Latorre, and Zeledón 2001; Lazcano 2003; Reimers 1993). This is a verywell-known factor in the effective schools literature, so we do not emphasize it here.
Academic accountability appears to be fairly high, though pressure in this direction isnot obsessive. The Head Office applies achievement tests every two years. Unlike in thepublic sector, where results are not distributed to schools or used in any way for specific-school improvement, FyA distributes results of tests back to schools and teachers. How-ever, each school receives only its own results. In the public sector the test results are used(in theory more than in practice) to re-shape pedagogical and support approaches. Becausethe tests are sample-based, and are in any case not distributed to schools, the test resultscannot affect specific schools’ practices. No experiments have been carried out in using thetests to feed back quality information to public schools, even on a sample basis. In FyA, theresults are known to the schools. Problems and lacunae in pedagogical practice suggestedby the tests are discussed and solved. None of our informants seemed to have any greatconcerns with perverse incentives created by this practice, such as “teaching to the test.”FyA seems quite able to use these results with maturity. Whether this would be possible inthe public sector is unknown. In any case, because other forms of accountability in the pub-lic sector are so much weaker, it may be wise, if such universal testing were to exist in thepublic sector, to raise the stakes somewhat above the level one finds in FyA (for example,tell schools how well they do in comparison to other schools). FyA has very strong collec-tive and bureaucratic accountability and information mechanisms aside from the testing,so the test results themselves do not have to play a role in accountability; they are used moreas information in bureaucratic or “compact-based” quality control feedback loop.
Use of an accretion model rather than a discontinuous reform model. A corollary of thefirst factor above (a quality control feedback loop that operates constantly) is that FyA hasimproved its pedagogical and administrative systems gradually. There are relatively fewdiscontinuities such as “curricular reforms” that imply that a previous approach is to beradically substituted by a new one. According to interviews, a serious problem with pub-lic schools is the constant change of fashions and approaches. The FyA approach to peda-gogical and curricular models is, on the contrary, fairly stable and based on accretion. Anaccretion model is in principle replicable to the public sector, but is less likely there giventhat even in a well-managed public sector, bureaucratic fashions are almost inevitable dueto the pressure on each successive administration to prove it is taking action. Because theaverage tenure of Ministers of Education in Peru is eight months, schools tend to be sub-
102 A World Bank Country Study

ject to considerable changes in direction. In addition, there is a tendency in the public sec-tor’s curriculum to over-reach in terms of explicit pedagogical ambition. As a result, nocurricular (or other, but the problem is worst in curricular approaches) reform is ever com-plete, teachers are confused, too much is expected of teachers in theory (and too little inpractice), and it is difficult for teacher training systems to catch up to curricular fashion(assuming they faced the accountability pressure to do so, which is not often the case). Inreality, then, pedagogical change in the public sector is incremental anyway, given that thisis the only way that teachers can cope. In this case, however, “incremental” is synonymouswith “contradictory” and “confused.” In FyA the change seems to be gradual, rational, andfairly complete. Private management of public schools, or private management in general,would typically be able to sustain a gradual-improvement model more than the public sec-tor (in Peru, for now) could.
Specifics of curricular and pedagogical approach. While FyA has to use the basic public cur-ricular approach, FyA has refined the approach to make it more practical. In particular, thegovernment’s curricular approach, while having certain positive aspects, was seen as not pro-viding sufficiently clear guidance. Competencies and sub-competencies that were supposedto be achieved in the government curriculum were neither sufficiently well-specified norgrade-specific enough to fit what FyA teachers felt was appropriate. Finally, the curricularapproach in the public sector was not organically linked to a student evaluation approach.FyA worked on these aspects and linked their curriculum and specific competency statementsto means of evaluating whether students were achieving the competencies. In the govern-ment sector the curriculum, evaluation methods, and teacher training approaches continueto be disjointed and general. According to the FyA teachers interviewed, the adaptations theyhave made to the curricular approach make it easier to plan over the year. The curricularapproach, furthermore, can be adapted to each school, in that different specific abilities arestated, and different time frames to achieve them might be allowed, but it tends to retainspecificity, in that specific ability development goals exist and are tracked.
In this respect, it is interesting to compare the curricular specifications of the national,official curriculum with the further specification of the FyA approach, as in Table 7.3. Theofficial curriculum is, on one hand, ambitious and convoluted in a country where childrenare taking years to learn to read, and on the other hand, non-specific as to grade or level ofability. The FyA curricular statement is more modest yet more specific (for example, com-petencies are listed by grade).
Though even the table above is telling in the convoluted language (“constructs thecomprehension”), the official curricular statement is even more ambitious, and at the sametime vague, than the table above shows. For example, one of the skills children in the firstcycle are expected to achieve, in a country where many children in this cycle are not read-ing any words at all, is: “the ability to reflect on the linguistic functioning of the text . . .”and this is to be tracked by things such as whether the child “is acquiring consciousnessthat the meaning of the text is constructed as the text is read and is re-constructed, eachtime it is read anew, because it allows for new information to be added to the sense givenit initially” (MINEDU 2002). This mixture of high ambition combined with non-specificityis generally absent from FyA curricular materials.
Furthermore, as noted above, the Head Office constantly evaluates how the teachersare implementing the overall curricular approach, and makes modifications to it based onthese evaluations.
Toward High-quality Education in Peru 103

104 A World Bank Country Study
Table 7.3 Official and FyA Curricular Statements Compared
Official Curricular Statement: Abilities andAttitudes at the End of the 1st Cycle (1st and2nd grades), Given Jointly for the Whole Cycle41 FyA Curricular Statement, by Grade
� Constructs the comprehension of the textbeing read by:
� Anticipating the type of text and thepurpose of the writing, according tocontext (situation, motive circum-stances and the means whereby thetext arrives at his hands).
� Reads individually and silently; identi-fies signals and cues such as: title, sub-titles, shapes, known words.
� Formulates hypotheses (suppositions)about the meaning of the text.
� Tests his or her hypotheses against thoseof classmates and draws conclusions.
� Creates a synthesis on the meaning ofthe text.
� Confronts the constructed meaningwith the reading of the text, as carriedout by the teacher.
� Reads with pleasure self-selected texts:poems, stories, jokes, comic strips, etc.
� Reads diverse texts: stories, legends,poems, recipes, letters, cards, posters,news in line with his or her purposes andthe needs of the moment.
� Recognizes and can classify, according tofunction and profile, different types of textsuch as posters, recipes, cards,advertisements, etc.
� Can read and use double-entry tables ofuse in daily life (attendance charts,responsibility charts, achievement charts).
First grade
• Reads audibly.
• Pronunciation is adequate.
• Reads individually and in groups.
• Reads in groups following models for toneand rhythm.
• Respects exclamation and question marks.
• Does not sound out syllables.
• Reads short (3 paragraphs) texts fluently.
Second grade
• Adapts tone of voice according to audienceand type of text.
• Respects commas and periods.
• Does not sound out syllables.
• Does not change letters or words.
• Does not add or remove words.
• Does not skip paragraphs.
• Reads without difficulty words up to foursyllables.
• Reads short (3 to 5 paragraphs) texts fluently.
Sources: MINEDU (2000); Equipo Pedagógico Nacional de FyA (2003), our translation.
41. It should be noted that the official curricular statement does say that “It is expected that by theend of 1st Grade, children will be able to read and produce texts, and that in 2nd Grade they will consol-idate these skills”. But this is still relatively vague as to how to gauge these skills, and is found in a sectionon teaching methodology, not in the main section on expectations.
Finally, the Head Office also works as a sort of consulting group. Schools or teachersthat are having problems know they can request a consultation from the Head Office. Inother sections of this report we have documented that teachers in the public sector tend tofeel that there is little that a UGEL, for example, can offer by way of specific problem-solvinghelp in curricular and pedagogical matters. The fact that the Head Office is reachable whenthere are problems means that they tend to detect problems quickly, and feed the problemsback to the officials who develop and improve the pedagogical approach.

Having a curriculum with somewhat different progress and evaluation milestones gen-erates some problems for FyA, which have been resolved by generating tables of “equiva-lences” between their indicators and those in the more general public curriculum. The factthat FyA appears to go through this extra effort signals the value they attach to having theirown, more specific curriculum.
Having a well-specified curriculum is in principle replicable in the public sector. Othercountries such as Chile or South Africa have made significant progress in making curriculamore specific. South Africa is no less diverse than Peru, had a similarly complex curriculum,took stock of the problems this created within a few years of its creation, and changed itquickly. However, this willingness requires that the government be fairly strong and able tosteer very capable processes to generate consensus around specifics. Vagueness in the offi-cial curriculum appears to reflect both a particular pedagogical approach, as well as diffi-culty in reaching compromise around specifics. Achieving specific standards requires moretechnical skill, as well as more skill in driving consensus-building processes, than simplyleaving things unspecified. The policy implication on the government side is that more con-centrated application of time and talent to curricular improvement is still needed.
Financial autonomy. FyA schools are able to gather and use extra resources in very flex-ible ways (Swope and Latorre 1998; Romero and Cáceres 2001). These funds originate inboth the community of parents and the society at large. Because the management is trustedby parents (partly because of its religious orientation), the ability of management to usefunds in a discretionary and flexible way does not seem to create the sorts of problems thatare observed in public school APAFAs, where there are constant tensions over financialaccountability. This aspect would in principle be replicable in the public sector, if therewere reforms in how schools are funded, in how accountability is managed, and in howschool directors are trained to be accountable. However, while this might increase parentalhappiness with contributions, and thus might generate more financial inputs to the schoolsthat may in turn increase efficiency, it should be noted that FyA schools are able to attractcorporate and NGO resources precisely because they are islands of quality in a sea of medi-ocrity. If public schools improved sufficiently, FyA schools would not stand out, and wouldnot receive so many extra resources. On the other hand, based on our interviews, what mat-ters with FyA funding is not only the extra resources they receive, but perhaps just asimportantly the fact that these resources are sought and used in a very entrepreneurial fash-ion. As such, their impact, at the margin, is high. A similar autonomy-with-accountabilitymodel in public schools could generate the same kinds of flexibility if the regulations wereclear, accountability sufficiently strong, and parental training sufficiently deep.
Staffing autonomy. FyA schools have considerable leeway—in some countries morethan others—in selecting school leadership and teachers. In Peru, there is leeway in selec-tion of directors and teachers, but not as much as in Ecuador or Venezuela, where FyA hascomplete discretion in hiring and firing (Swope and Latorre 1998; Martiniello 2001).
The conclusion of the analysis is that the staffing autonomy results in better controland supervision as well as better on-the-job training, but does not seem to result in muchprivileged selection on observable variables. While a case study of this sort evidently can-not control for selection issues econometrically, the research specifically tried to assessobservable differences which might suggest that FyA schools are picking from a visibly bet-ter pool of applicants, simply by asking whether this selection takes place formally orappears to take place informally (for example, better grades at university). The conclusion
Toward High-quality Education in Peru 105

was that there are few, if any, such characteristics. One possible observable difference is thatFyA’s teachers tend to be younger, which goes along with a hypothesis that the systemshapes rather than cherry-picks teachers (Alcázar and Cieza 2002; Navarro 2002). In theinterviews with teachers, most of them said that when they joined FyA they did not sensethat they were in any way different from their peers who joined public schools, but thatthey had been shaped by the FyA approach into becoming better teachers. A training orshaping approach is replicable, whereas a cherry-picking approach is not.
To replicate these factors in the public sector the “teacher career” would have to bereformed in drastic ways (significant reforms were being proposed as of the writing of thisreport), so that the career and system of human resource management could shape teach-ers. The influence of schools (parents) and directors over teacher careers would have to beincreased. This would in turn require much more skilled school directors and parent com-mittees. The motivational factors found in FyA are unlikely to be at all replicable in thepublic sector.
A “head office” that sees its role as one of servicing autonomous units, the latter having themain “client interface.” Each FyA school creates its own pedagogical approach, subject tothe overall FyA approach, in order to serve the specific community where it is located. Fur-thermore, the FyA head office sees each school as the defender of the image of the system,and as its principal interface with the community. This creates pressure on each unit tointernalize its quality mission, and creates bottom-up demand from each school for theservices of the head office. It also puts pressure on the head office to provide services thatare practical and applicable, as opposed to control-oriented and theoretical (Swope andLatorre 1998; Romero and Cáceres 2001). This approach is in principle replicable in thepublic sector bureaucracy, though it would require drastic changes in orientation and eval-uation; accountability approaches would have to be turned around completely in manyrespects. For example, local education offices (UGELs) would have to learn to be account-able and of service to schools, and schools to communities. Furthermore, while in FyA thisapproach is intrinsic, in the public sector more extrinsic and hence bureaucratic or mar-ket-based approaches would be required. For example, each school could be made directlyaccountable to its community. The UGEL would then service the school, each schoolwould be required to evaluate the service of the UGEL, and schools’ evaluations would haveto be taken into account in the evaluation of the UGEL’s personnel and its directors’ con-tracts. This approach is allowable in the evolving Peruvian legislation, as this legislationtends towards school autonomy and parental rating of schools. But the vision is at thispoint very timid and incipient, and none of the necessary systems have been thought outadequately, much less implemented. Pilot experimentation with much tighter and bottom-up accountability is urgently needed.
Control tools are developed based on observed teacher and principal practice, tend to bepractical and approved-of by teachers and principals. The above is not meant to imply thatFyA lacks quality control tools and systems. On the contrary, each school must have stan-dardized tools such as a School Curricular Plan, an Institutional Development Plan, andInternal Regulations. There is a daily observational protocol (“ficha de observación” or“ficha de acompañamiento”42) used by the school director and sub-directors to monitor
106 A World Bank Country Study
42. The fact it is often called a “ficha de acompañamiento” (“support or accompaniment form”) isrevealing of the fact that in FyA control and support functions are well-orchestrated.
teacher work. However, these approaches and tools are based on observation of good prac-tice, and are typically approved by teachers and principals. Because they are based on prac-tice and are built-up over time based on observation of how they work, they tend to actuallywork; consequently, these tools and approaches tend to make life easier for those who haveto use them, so they use them. This approach is replicable to the public sector, but wouldrequire continuity of management and approaches. It is more easily replicable by privately-managed groups of schools in the sector, where continuity of management is more likely.Furthermore, the head office does not shy away from control functions. Visits and inspec-tions can be unannounced, but since their results tend to be practical and usable, they aregenerally not seen as an imposition. A system of random control and support inspectionsin the public sector is possible, but because: a) schools’ goals are vague and are not focusedon client service; and b) technical ability in the UGELs is very thin due to turnover and lackof technical training, inspection visits are unlikely to be focused on practical issues. Becauseinspections are likely to be impractical, they are likely to be resisted. However, this couldbe improved via obvious reforms in the public sector.
Well-paid management. FyA school directors receive double salaries: one from theMinistry and one from FyA itself. This is easily replicable in the public sector with relativelyminor reforms (Alcázar and Cieza 2002).
No factionalism. One of the factors most commonly mentioned by teachers and direc-tors in our interviews was the absence of factionalism within FyA schools. In the public sec-tor, (large) schools are riven by internal divisions and power struggles. Groups of teachersoppose the director, while the director is backed by other groups of teachers or barely sub-sists if most teachers are opposed to him. Accusations of corruption, power abuse, and legalprocesses against directors are extremely common, and turnover is high. In FyA schoolsteachers are united behind a common goal and under the clear leadership of the director.This sort of unity is in principle replicable to the public sector, but in practice it would bedifficult. Teamwork requires common goals; teams coalesce around clear and commongoals. In the public sector, this would require a much more thorough-going goal orienta-tion than currently exists, greater pressure to achieve the goals, and more capable andtrained directors willing to lead through superior capacity and self-confidence as opposedto authoritarianism. Goal- and standard-setting in Peru is very weak, as there is a failureof collective action in the specification of clear goals in the curriculum. Goal-seekingbehavior would also require that while directors win respect for superior knowledge andskill rather than authoritarianism, they do have unambiguous authority over teachers.Finally, improving team-work in schools would also require that the education sector notbe used by political parties for patronage and organization purposes. In this sense, reform-ing this aspect would require reforming the public sector as a whole—a very tall order.
Non-Replicable (or less replicable) Factors
FyA also relies on certain factors that are inherently non-replicable to any whole system,whether public or private. They are factors that are related to self-selection, active “cream-skimming” or “cherry-picking”, and the use of resources that are inherently in fixed sup-ply. These factors are of considerable importance, and they need to be noted in order toprevent excessive optimism about the sorts of changes that could be brought about viamore private management of the FyA type.
Toward High-quality Education in Peru 107

Some pre-existing community support. FyA generally operates where there is commu-nity support, and typically does not start with an obligation to provide a universal serviceregardless of the level of community support. The public sector, because of its “universal-ity” mandate, cannot do this, by definition. On the other hand FyA schools actively gener-ate community support. This aspect would be replicable, and is one of the factors shapingthe new education legislation in Peru.
Furthermore, in areas where there are existing FyA schools, there is some selection ofparents and students based on parental commitment to the school. This selection is accom-plished quite easily. To be an FyA parent simply requires much more participation, so onlythe more devoted parents tend to self-select into FyA. There is a rather daunting list of activ-ities that are required of parents. Thus, no explicit esoteric “participatoriness” evaluation hasto be given to parents; the ones who are daunted by these sorts of requirements would sim-ply tend to look elsewhere. Again, schools in the public sector could require (and generate)more participation from parents, but they would not get it as easily, because they would haveto work with average parents, whereas FyA, precisely because it is not the whole system, can“cherry-pick” parents who are pre-disposed to be active and support their children.
Nature of leadership. FyA school directors are often foreign and come from a religiousbackground. They have sometimes had experience managing large organizations, even largeeducational organizations, in developed countries. Their approach to management, and theirgeneral attitude, is thus quite modern and sophisticated. In addition, it is values-centered; itis conceived of as something more than “management.” This then represents a “factor of pro-duction” in FyA schools that is in inherently inelastic supply. On the other hand, not all oftheir ability is based on deep background issues, and some of this ability would in principlebe replicable in the public sector if school leaders were empowered to actually manage.Nonetheless, based on our interviews of FyA directors, it is quite evident that the overall cal-iber and value-centeredness of the leadership is largely not replicable, even if some of themore mechanical management techniques they use are replicable. The average public schooldirector in Peru will, by definition, not have had, in his or her background, the experience ofrunning a well-managed Canadian or Spanish vocational school, and will typically not havethe intrinsic devotion to principle that many of the FyA managers have.
Teacher selection. FyA openly selects teachers who are motivated and appear to be hardworkers. These are non-observable factors, but they seem to be operational to some degree.Staffing autonomy, which allows selection to assess these factors and “values” more broadly,would be much more difficult to replicate in the public sector and virtually impossible if thesector maintains its current configuration. Furthermore, because FyA selects the most moti-vated teachers via a “cherry-picking” process, this practice would appear to be non-replicableto a public system. However, Peru currently has a surplus of trained teachers who are notworking, so selection, even in the public sector, would be possible. Many of theseunemployed teachers may be more motivated than teachers who are currently employed.Anecdotally, one knows that many current teachers have been appointed through patron-age processes and are therefore not particularly motivated or well-suited to be teachers.Thus, the public sector could, at least for a considerable time, replace unmotivated person-nel with (potentially) more motivated personnel who are currently unemployed. FyA’spractice, viewed in this light, is indeed “cherry-picking” but it is a replicable sort of “cherry-picking” because of the particular circumstances in Peru, namely the teacher surplus. Fur-thermore, one has to note that many of the FyA teachers, as stated above, feel that they were
108 A World Bank Country Study
not any different from other teachers when they joined FyA, but that FyA has changed them.Thus, how much “cherry-picking” there is, as opposed to subsequent shaping of those whoare chosen, is not totally clear, though there seems to be some.
Policy Implications
There are about a dozen factors that seem to account for FyA’s success. Of these, some70–80 percent are potentially replicable to a whole system, while some 20–30 percent are“zero-sum” factors that by definition tend to be difficult to replicate or, more strictly, thatif replicated could not produce better results. The latter are very important, though, sotheir weight is probably greater than is implied by the fact that they constitute only threefactors out of approximately twelve. While this is difficult to measure, one could concludethat the non-replicable factors account for about 50 percent, or somewhat more, of per-formance differences. Of the factors that are replicable to a whole system, a few would berelatively easily replicable to the public sector even with current legislation and norms,though skills would have to increase (for example, improving the specificity of the curricu-lum, developing better standards that allow linkage of curriculum to assessment). The neededskills are probably only required at the apex of the system. The rest of the improvementswould require quite significant reform and expenditure in massive capacity development(for example, in teacher career systems and human resource management, or in schoolaccountability to parents). A few factors (such as decreasing factionalism and personal andparty politics in schools) are in principle amenable to reform in the public sector, but inpractice are nearly impossible to reform until the public sector as a whole is reformed.Thus, of the ten or so factors that would be replicable to a whole system, most would bereplicable to a whole system only if this system included groups of privately-managed“franchises” or “chains.” Most of them would be difficult to replicate to the public sector,particularly with the current laws and incentives. This section would thus suggest that fur-ther managerial and accountability improvements are needed in the public sector. It alsosuggests that more experimentation with private or religious management of schools, butwith a public funding subsidy base, should be carried out. The areas in which the publicsector could learn fairly easily are:
a) Clearer curricular and achievement standards. Less convoluted and esoteric curric-ular statements.
b) More monitoring and evaluation, and tighter integration of monitoring results intosupport and standards.
c) More continuity in leadership at all levels; more reliance on accretion and lessreliance on curricular and pedagogical “reforms”.
d) More use of universalized measurement as feedback to individual schools.e) Realization that schools are the ultimate quality interface with the clients, and thus
more downward accountability and service standards, of schools to communities,of UGELs to schools, and of the Ministry to both UGELs and schools.
Toward High-quality Education in Peru 109


The Issue
Inter-cultural and bilingual education (EIB henceforth, for Educación Intercultural Bilingüe)is not a theme that fits easily into the accountability framework being used in this report. Insome respects, it could be framed as a matter of accountability to parents and communities.However, we have chosen to view it as an issue related to standards and the adequacy of ped-agogical models, as well as financial, policy, and technical support. That is, we have chosento treat it as a “compact” issue. The reason for this is that progress in EIB might be condi-tioned by an important paradox that has perhaps not yet been sufficiently discussed in Peru—the need to standardize and unify the less-dominant languages for teaching purposes, and tocreate standard pedagogical practices oriented at learners from communities whose mothertongue may not be Spanish. How to create standards that accommodate diversity, not justSpanish-Indigenous diversity, but diversity of variants of a single Indigenous language group,is a paradox—or an apparent paradox—whose resolution would be helpful in advancing EIB.
The importance of bilingual education in Peru is given by two factors. First, some 26 per-cent of children have a language other than Spanish as a first language (as determined bythe answers of 4th grade students in the 2001 National Evaluation, probably the most reli-able source on this theme). If one reasons at the school level, in the average school 31 percentof children have a language other than Spanish as a first language (the difference between thechild-level value and the school-level value is due to the fact that schools frequented by chil-
CHAPTER 8
Progress and Paralysison Intercultural andBilingual Education
A Special Problem with Standards43
111
43. This section is partially based on the author’s interpretation of “Educación Intercultural Bilingüeen el Perú: Tendencias” a consultancy report prepared for this study by Lilliam Hidalgo Collazos andIngrid Guzmán Sota of TAREA.

dren from non-Spanish-speaking households are smaller). Second, there is a significant cor-relation between having Spanish as a first language and school achievement. The bivariatecorrelation between being Spanish-speaking and mathematics achievement in fourth grade is0.35, and with Spanish achievement the correlation is 0.42, at the level of the individual child;the school-level correlation between percentage of children from non-Spanish origin inthe school and the school’s average achievement in Spanish is 0.57 (and our own researchshowed that such children are extremely slow at acquiring reading skills even in their ownlanguages). In Chapter 2, it was shown in a multivariate context that having a languageother than Spanish as a mother tongue, or coming from a non-Spanish-dominant envi-ronment (be it in the family or the community), is an important factor—identified by thePeruvian literature—in explaining low academic achievement. In Chapter 6, it was alsoshown that early literacy acquisition among Peruvian children is a serious problem: schoolsare taking three to four years, maybe five years, to do what in a proper school could be donein one or two years—suggesting a waste or inefficiency of some 30 percent at least, andperhaps as high as 60 percent in the early years of schooling.
Documentation of this problem is of course nothing new. Cummings and Tamayo (1994)refer to studies from the 1980s where this is already demonstrated. Multivariate analyses havealso found that this effect tends to be (somewhat) independent of socioeconomic status orpoverty; linguistic origin or the fact that a school is located in a bilingual region are, aside frompoverty, barriers to achievement under current educational models. (It has to be noted,though, that these factors appear to be third in importance, after poverty and managementfactors.) In Chapter 4, we also saw that the learning performance of the poor is not only lowerthan that of the less poor, but that, more interestingly, it is less predictable. The variance inlearning achievement among the poor is higher than the variance in learning achievementamong the less poor. Poor and non-Spanish-origin individuals thus face a double burden; theyreceive a poorer education and are not even exactly sure what they are getting in the first place.At the same time, the fact that the education they receive is so variable—that in some schoolsthe achievement among the poor is almost as high as among the rich—suggests that there areuseful working models of pedagogy already available in Peru that require neither major dis-coveries nor technical adaptations. And this, in turn, implies that one of the issues confrontingthe education of those with non-Spanish origins is that of standards—from the availabilityof strong and accepted pedagogical models and teacher training in this area, to the actualappropriate standardization of the teaching vernacular language (which does not require astandardization of the generally spoken vernacular). Finally, we also saw in Chapter 1 thatPeru, along with South Africa, is one of the countries with the highest internal educationalinequality (of the 14 or so developing countries with good enough data, South Africa is thecountry with the most measured educational inequality in mathematics, Peru is second).All the facts discussed in this paragraph are related to each other in ways that do not requireelaboration—they are not a set of coincidences. One final fact needs to be added: the evi-dence is clear, and has been for a long time, that children—including Peruvians—trainedin good EIB programs do better in actually developing their Spanish abilities (see Cumminsand Tamayo (1994)). As such, there are models—even within Peru—that seem to work andwhich have been known for quite some time.
The rest of this section summarizes what seems to be required in order to improve thelearning performance of non-Spanish-origin segments of the population. It should benoted that the concern here is not the re-vitalization of non-Western languages. This is a
112 A World Bank Country Study
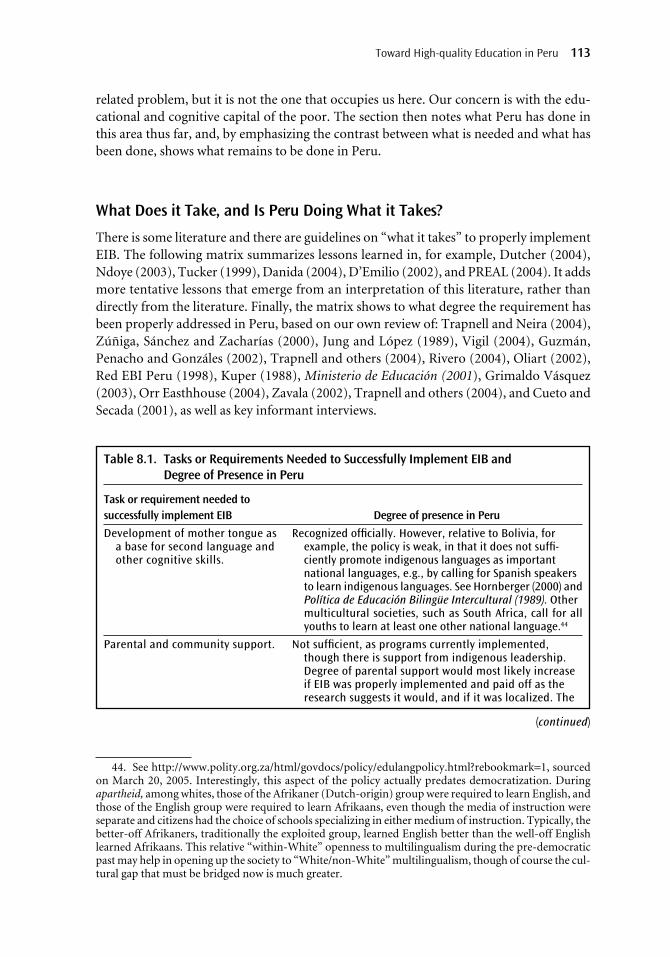
44. See http://www.polity.org.za/html/govdocs/policy/edulangpolicy.html?rebookmark=1, sourcedon March 20, 2005. Interestingly, this aspect of the policy actually predates democratization. Duringapartheid, among whites, those of the Afrikaner (Dutch-origin) group were required to learn English, andthose of the English group were required to learn Afrikaans, even though the media of instruction wereseparate and citizens had the choice of schools specializing in either medium of instruction. Typically, thebetter-off Afrikaners, traditionally the exploited group, learned English better than the well-off Englishlearned Afrikaans. This relative “within-White” openness to multilingualism during the pre-democraticpast may help in opening up the society to “White/non-White” multilingualism, though of course the cul-tural gap that must be bridged now is much greater.
related problem, but it is not the one that occupies us here. Our concern is with the edu-cational and cognitive capital of the poor. The section then notes what Peru has done inthis area thus far, and, by emphasizing the contrast between what is needed and what hasbeen done, shows what remains to be done in Peru.
What Does it Take, and Is Peru Doing What it Takes?
There is some literature and there are guidelines on “what it takes” to properly implementEIB. The following matrix summarizes lessons learned in, for example, Dutcher (2004),Ndoye (2003), Tucker (1999), Danida (2004), D’Emilio (2002), and PREAL (2004). It addsmore tentative lessons that emerge from an interpretation of this literature, rather thandirectly from the literature. Finally, the matrix shows to what degree the requirement hasbeen properly addressed in Peru, based on our own review of: Trapnell and Neira (2004),Zúñiga, Sánchez and Zacharías (2000), Jung and López (1989), Vigil (2004), Guzmán,Penacho and Gonzáles (2002), Trapnell and others (2004), Rivero (2004), Oliart (2002),Red EBI Peru (1998), Kuper (1988), Ministerio de Educación (2001), Grimaldo Vásquez(2003), Orr Easthhouse (2004), Zavala (2002), Trapnell and others (2004), and Cueto andSecada (2001), as well as key informant interviews.
Toward High-quality Education in Peru 113
Table 8.1. Tasks or Requirements Needed to Successfully Implement EIB and Degree of Presence in Peru
Task or requirement needed tosuccessfully implement EIB Degree of presence in Peru
Development of mother tongue asa base for second language andother cognitive skills.
Parental and community support.
Recognized officially. However, relative to Bolivia, forexample, the policy is weak, in that it does not suffi-ciently promote indigenous languages as importantnational languages, e.g., by calling for Spanish speakers to learn indigenous languages. See Hornberger (2000) andPolítica de Educación Bilingüe Intercultural (1989). Othermulticultural societies, such as South Africa, call for allyouths to learn at least one other national language.44
Not sufficient, as programs currently implemented,though there is support from indigenous leadership.Degree of parental support would most likely increase if EIB was properly implemented and paid off as theresearch suggests it would, and if it was localized. The
(continued)

Teachers able to understand anduse both languages, andprepared in bilingualinstruction and inter-culturalcompetence.
“Localized standardization” ofapproaches within theindigenous languages, toinclude standardization of thelanguage used for instruction,as well as discovery anddiffusion of standard, effectivepedagogical models.
114 A World Bank Country Study
Table 8.1. Tasks or Requirements Needed to Successfully Implement EIB and Degreeof Presence in Peru (Continued )
Task or requirement needed tosuccessfully implement EIB Degree of presence in Peru
poor quality alienates the parents. (E.g., childrenwould learn Spanish better in a proper EIB program,and most likely parents would then be satisfied.) SeeOrr Easthouse (2004), López (2002), Uccelli (1999), Oliart(2002), and Zúñiga, Sánchez and Zacharías (2000). Fur-thermore, it is important to realize what “communitysupport” might mean in a country such as Peru. Chap-ter 6 of this report shows how parents are often happywith the level of quality of education their childrenreceive, even if it objectively seems poor. Nonetheless,parents do seem to have a concern over their children’sacquisition of Spanish.
Minimal, but public discourse on EIB is very aware ofthe need. Progress is being made, as teacher traininginstitutions take on the need. However, up to dateonly nine teacher training colleges (out of severalhundred) officially offer this specialty, and the firstcohorts of graduates are only now exiting. Further-more, four of these are in the Amazon region, whichappears to be an imbalance. (See Oliart 2002, Trapnelland others 2004.) Teachers themselves often do not actually know how to use the language they aresupposed to teach for writing. Worse, many of thetrainers in EIB do not speak or use the languages(López 2002). Some apparently actually undermineEIB with parents (López 2002). One hopeful sign is the increased self-organization and interest of teach-ers as in, for example, national meetings on EIB whichare not state-based. See López (2002).
Minimal, and public discourse does not seem cognizantof the need. Standardization is achieved in a bureau-cratic manner and seems unrealistic because of lack ofattention to local variants. Furthermore, standardiza-tion appears not to have been created, yet, with aproper degree of understanding of the complexitiesinvolved. In the opinion of some researchers, itappears as if the standardization proposed is similar towhat would result in Europe if one were to standard-ize, say, Spanish and Italian around Latin, so as toeconomize on the production of books and materialsin Spain and Italy. See Orr Easthouse (2004), Hornberger(2002), Zúñiga, Sánchez, and Zacharías (2002), Vigil(2004), Kuper (1988), Red EBI Peru (1999), and López(2002), who comments on lack of systems, standards,and indicators, and a big gap between theory andpractice. The studies, taken together (with varyingopinions among the authors) could be synthesized asrecognizing the need for some standardization butwith localized variants, in the case of language itself,and for standardization of pedagogical approachesbased on solid research and local participation.

Thorough national research andevaluation processes that allow“cycles of discovery” ratherthan importation of models ordependence on a “once-and-forall” approach.
Proper planning and resourcingcommensurate with the task,availability of materials teacherswould actually want to use.
A decentralized system character-ized by “decentralization withstandards” that can provide thespace for diversity while respectingneed for accountability.
Table 8.1. Tasks or Requirements Needed to Successfully Implement EIB and Degreeof Presence in Peru (Continued )
Task or requirement needed tosuccessfully implement EIB Degree of presence in Peru
Weak, not just in EIB, but in education in general. Thoughthere is a very good education research industry in Peruin general, there is weak linkage between research andpolicymaking and policy-enforcement, and, specifically,EIB-oriented research is incipient. There are someexamples of an incipient cycle of discovery (researchand feedback) such as in PEEB-Puno and FORMABIAP.But in general the opinion of key informants and theliterature is that there is very little evaluation-basedlearning going on. See Zúñiga, Sánchez, and Zacharías(2000), Jung and López (1989), and Trapnell and Neira(2004). There is little evaluation of results against anyreading and literacy targets (Trapnell and others 2004).Considering the large number of EIB projects that hasbeen funded (see Table 8.2), this is a considerablewaste. Had there been a serious interest in a cycle ofevaluation and learning, there would now be powerfullessons, instead of widely dispersed opinions, and therecould be strong national programs.
Weak. Education spending in Peru is low, in general, andhuman resourcing is weak (great instability in positions).EIB is also poorly resourced, and seems to be resourcedtoo much at the insistence of donors, and with donorfunding. A common complaint among key informantsand in much of the literature is that most of the supportseems to come from international organizations. SeeLópez (2022), and Trapnell and Neira (2004).
Incipient, though actors are keenly aware of the opportu-nity decentralization represents and are beginning totake advantage of this. However, there seems to be verylittle clarity about how one achieves “decentralizationwith standards”, how one can have standards with diver-sity, etc., though there is some increasing awareness ofthis (see Trapnell and Neira (2004) on the notion of pro-cedural rights to produce localized norms). EIB itself isstill a centralized program. Key informants were of theopinion that indigenous groups are consulted and dogive opinions (which is progress) but are not involved incrafting solutions in a decentralized manner.
The results of the table should be fairly convincing that efforts towards improved EIBin Peru are insufficient. The table also points out the directions in which more effort isneeded. It also highlights, by reference to key studies such as Jung and López (1989) andKuper (1988) that date back at least 15 years, the fact that much of this is not new. Further-more, even if the many existing projects (see Table 8.2) have not been formally evaluated, itwould seem that much of what has been learned should be codifiable into useful standards,even in an ex-post manner, if sufficient effort and leadership were to be devoted to this issue.The fact that after so many projects there is still so much fundamental uncertainly and
Toward High-quality Education in Peru 115
Sources: Elaborated by the authors from the reports cited and key informants as noted.
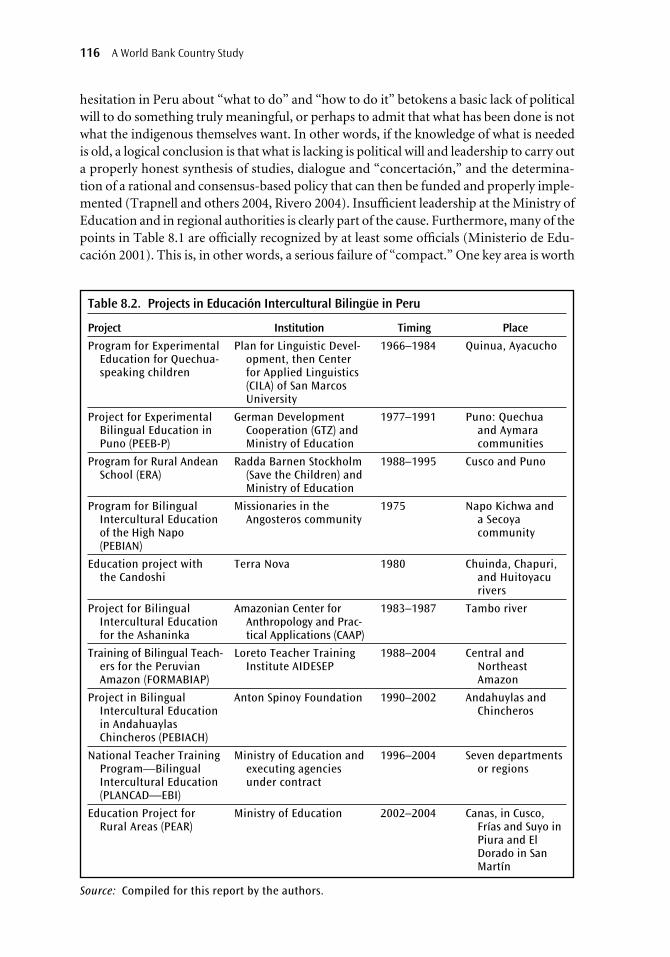
hesitation in Peru about “what to do” and “how to do it” betokens a basic lack of politicalwill to do something truly meaningful, or perhaps to admit that what has been done is notwhat the indigenous themselves want. In other words, if the knowledge of what is neededis old, a logical conclusion is that what is lacking is political will and leadership to carry outa properly honest synthesis of studies, dialogue and “concertación,” and the determina-tion of a rational and consensus-based policy that can then be funded and properly imple-mented (Trapnell and others 2004, Rivero 2004). Insufficient leadership at the Ministry ofEducation and in regional authorities is clearly part of the cause. Furthermore, many of thepoints in Table 8.1 are officially recognized by at least some officials (Ministerio de Edu-cación 2001). This is, in other words, a serious failure of “compact.” One key area is worth
116 A World Bank Country Study
Table 8.2. Projects in Educación Intercultural Bilingüe in Peru
Project Institution Timing Place
Program for ExperimentalEducation for Quechua-speaking children
Project for ExperimentalBilingual Education inPuno (PEEB-P)
Program for Rural AndeanSchool (ERA)
Program for BilingualIntercultural Educationof the High Napo(PEBIAN)
Education project withthe Candoshi
Project for BilingualIntercultural Education for the Ashaninka
Training of Bilingual Teach-ers for the PeruvianAmazon (FORMABIAP)
Project in BilingualIntercultural Educationin AndahuaylasChincheros (PEBIACH)
National Teacher TrainingProgram—BilingualIntercultural Education(PLANCAD—EBI)
Education Project forRural Areas (PEAR)
Plan for Linguistic Devel-opment, then Centerfor Applied Linguistics(CILA) of San MarcosUniversity
German DevelopmentCooperation (GTZ) andMinistry of Education
Radda Barnen Stockholm(Save the Children) andMinistry of Education
Missionaries in theAngosteros community
Terra Nova
Amazonian Center forAnthropology and Prac-tical Applications (CAAP)
Loreto Teacher TrainingInstitute AIDESEP
Anton Spinoy Foundation
Ministry of Education andexecuting agenciesunder contract
Ministry of Education
1966–1984
1977–1991
1988–1995
1975
1980
1983–1987
1988–2004
1990–2002
1996–2004
2002–2004
Quinua, Ayacucho
Puno: Quechuaand Aymaracommunities
Cusco and Puno
Napo Kichwa and a Secoya community
Chuinda, Chapuri,and Huitoyacurivers
Tambo river
Central andNortheastAmazon
Andahuylas andChincheros
Seven departmentsor regions
Canas, in Cusco,Frías and Suyo inPiura and ElDorado in SanMartín
Source: Compiled for this report by the authors.

discussing at greater length than the table allows, because it is central to the arguments inthe rest of this report. This is the issue of standards. There are many reasons why EIB is notworking as well as it could in Peru. However, from the literature reviewed, and as suggestedby the table above, these appear to be relatively well understood. The issue of standards, onthe other hand, seems to be clouded by confusion and controversy.
A Special Issue Related to “Compact” and Accountability: Standards andStandardization in EIB45
Analysis of EIB experience in Bolivia suggests that Bolivia has made more recent progresswith EIB than Peru has (D’Emilio 1996). There may be many reasons for this. An impor-tant one may be that the PEIB project in Bolivia—unlike others of its kind that developeddifferent alphabets and educational materials for different varieties of each language—emphasized linguistic standardization and consolidation of the ‘larger identities,’ whichhas created new ties of solidarity in areas where excessive development of local terms hadsharpened differences. Under the motto “one language must unite and not divide thegroup that speaks it,” a single alphabet has been used for all varieties of each language. This“has allowed for a degree of linguistic development and consolidation that is unprecedentedin Bolivian history” (D’Emilio 1996). Not only were languages standardized, but this wasaccomplished as a common effort not imposed by the government.
However, in the opinion of some authors, the approach to standardization undertakenby the Peruvian government has been naïve at best, and may, at worst, actually underminelearning in the indigenous language (Orr Easthouse 2004; Vigil 2004). This may be the resultof a situation where standardization has been imposed on language variants as different fromeach other, in the opinion of some linguists, as Spanish is from Portuguese or from Italian.(This applies to Quechua variants in particular—variants which are, within Peru, quite dif-ferent from each other.) Creating a standardized variant of, say, Spanish and Italian wouldrequire reaching so far back to the original Latin roots that the standardized variant woulditself be largely unrecognizable by either the Spanish or Italian speakers (Orr Easthouse2004).46 Many authors recognize the need for standardization, while others call for attentionto local variants, and yet others call for both simultaneously (Hornberger 2002; Zúñiga,Sánchez, and Zacharías 2002; Vigil 2004; Kuper 1988; Red EBI Peru 1999; López 2002).
It is clear that there are advantages to standardization. They include most obviouslythe achievement of economies of scale in, for example, materials production. Most impor-tantly (and most germane to the accountability approach taken in this report), however,without standards there can be no accountability, or at least no bureaucratic accountabil-ity. More accurately, if there are no standards, public accountability becomes so costly—so mired in constant transacting—that it is difficult to achieve in any but the wealthiest ormost culturally homogeneous societies. In order for standards to lower transaction costs
Toward High-quality Education in Peru 117
45. In this section “standards” can refer to standards of learning, to the use of a locally-standardizedteaching language, or to proven and effective standard pedagogical models.
46. Why a country, or even a group of countries, would attempt to standardize something so diffi-cult to standardize is unknown. Various authors cite political reasons (such as the need to create a uni-fied voting bloc), technical naiveté in linguistics, excessive faith in what could be achieved througheconomies of scale, the fact that even EIB itself is assimilationist, and other factors (Orr Easthouse 2004,Hornberger 2000).
and result in affordable systems of accountability, they have to be partially “artificial” bydefinition, and this is true of any standard. This is the paradox. If public funding is beingused, and particularly if this public funding is central (for example, via fiscal transfers),rather than own-source localized public funding, then imposing a form of accountabilitythat must be somewhat bureaucratic and to some degree “artificial” is simply inevitable.For the foreseeable future, the funding of education in Peru, including funding for bilin-gual education will continue to be based on fiscal transfers given that relying on own-source local tax revenues is not only impractical but highly inequitable. Hence, there islikely to be a need for continued bureaucratic accountability, which requires the existenceof some form of standards. In an accountable system, if there are central fiscal transfers,there is a need to account for the productivity of the funding used across units of sub-national government, and this requires the existence of standards. It must ultimately bepossible to tell which sub-national units are doing better than others, and within sub-national units, which areas or schools are doing better than others. This is key not just toaccountability but to the targeting of interventions and assistance.
However, to use a commercial analogy, if economies of scale, through the use of stan-dards, are achieved in the production of a good for which there is then no consumerdemand (because the good has become “bland” and appeals to no specific consumers),then the standardization is not only useless but counterproductive. Similarly, if a standardsagency imposes weights and measures on a market to promote accountability of produc-ers to consumers and to lower the transaction costs involved in this accountability, but thisis done in such a way that the goods traded are thereby devalued by the consumers them-selves, then, again, the standardization is worse than useless. In Peru’s language approachthis appears to be a distinct possibility (Orr Easthouse 2004). But there may be ways to dealwith the apparent contradiction or paradox between the need for standards and the needfor localized adaptation (some of which are suggested in, for example, Hornsberger (2004),but require much attention to detail and clear thinking). Clarity on how this could be done,in a decentralizing context, has not yet arisen among the intellectual leadership of Peru,though ideas are emerging (such as the call for localized procedural rights to the creationof norms and standards as in Trapnell and Neira (2004)). This would be a fruitful area fortechnical assistance and policy dialogue. As discussions among linguists show (del Rosarioand Warren 2003; Luykx 2004; Hornberger and Coronel-Molina 2004; Orr Easthouse2004), resolving this problem is not a simple matter. Furthermore, inevitably, some com-promises and tradeoffs will exist (as total local adaptation is impossible, if standards areindeed to be maintained and excessive costs are to be avoided). It should be noted that alocalized approach to standardization, while expensive, does avoid the high transactioncosts involved in creating very broad consensus. Creating broader standards, even if lin-guistically possible, would require crafting broad consensus, which would be very costly(in time if not in fiscal resources) and could lead to paralysis or very slow progress. Tosome extent, this is what has been happening in Peru with the issue of standards. Thus, theeconomies achievable through broad standards may be somewhat illusory. That standardsare possible in language instruction for relatively small groups is exemplified by the devel-opment of standards of teaching in foreign languages in the United States, where stan-dards have been, to a reasonable degree, successfully promoted by the American Councilof the Teaching of Foreign Languages (ACTFL undated). Similarly, individual states inthe United States, facing significant immigration of children of Spanish-speaking origin,
118 A World Bank Country Study

have managed to develop very clear and detailed standards that use proper sequencingbetween grades for the teaching of English as a second language (Public Schools of NorthCarolina 2003). Other states have created bilingual programs, and these also have standards.The task is by no means impossible, though it requires resources and attention to detail.
Decentralization makes new options available. In a decentralized country, approachesthat assess and reward the willingness of sub-national communities to value their own learn-ing variants can be tried. Matching grants systems that can underwrite the development oflocalized standards would be one approach. (Central work to sort out equivalences wouldstill be needed.) Relatively expensive localized standard-setting (such as in the case of lan-guages spoken by relatively small numbers of persons, such as variants of Quechua) can thusbe supported by a central government, but only if the sub-national community is willing tomake own-source efforts to co-pay for the system. The own-source efforts need not literallyrely on local taxation as this may be inequitable and impractical; they may simply requirethe willingness to allocate parts of a block transfer to the language issue, to match an ear-marked grant (it would thus require both a block grant and a targeted grant system). In thismanner the central government provides support for equity reasons but does so by usingthe community’s willingness-to-pay (by diverting some of its block grant) as an indicatorof seriousness and organization on the part of the recipients. The matching ratio can be gen-erous, as a way to mitigate poverty and inequality problems. If “the community” of speak-ers is not geographically localized to be coterminous with political governance districts, thematching grants systems can encourage dispersed communities of speakers of a similar vari-ant to coalesce “from the ground up” even if they are not neighbors. This can then achievesome economies of scale. The funding system would act as an inducement carrot rather thanas a bureaucratic stick, and would decentralize and “communitize” the transaction costsinvolved in coming to agreement. Furthermore, it removes the politics involved from thenational stage. The optimal size of “the local” would then tend to be organically determinedas an equilibrium between the economics of the grants system and the dissimilaritiesbetween the variants of the languages, rather than being bureaucratically imposed. Further-more, with a proper grants system, groups would hire their own linguists, researchers andfacilitators to assist them, again putting the communities of speakers in charge.
It is also necessary to admit that the linguistic complexity of Peru may be such thatthe “community of interests” may not really overlap with political decentralization. Ifthere are essentially infinite gradients in language mixes and needs, and these interact incomplex ways, the language policy needs to take advantage not of decentralization but,at the extreme, of school autonomy. In this case, a fiscal grants system related to decen-tralization that is used to create standards may help, but much more is needed. Addi-tionally, it may be necessary to allow schools to choose (some of) the standards to whichthey are willing to be held accountable and offer them options for learning how to deliveragainst those standards.
Finally, it should be noted that the possible policy suggestion emerging above is not torecommend a “free-for-all” system of grants. Some central body would need to establishcriteria and methods for providing such grants, and all this would have to take place withinthe context of a global policy on EIB that sets out the overall objectives as a national pol-icy. Furthermore, the context would also have to exist to create effective models of “peda-gogical delivery to standard.” It is not sufficient to create standards. A context that canrigorously evaluate effective pedagogical models for delivery to standard does not yet exist.
Toward High-quality Education in Peru 119

The resources needed to attract intellectual capacity to this task, and the technical capac-ity itself, have not yet been devoted to the task, as noted in Table 8.1.
In conclusion, there are options to move the situation forward. The options for deal-ing with some of the more obvious issues, such as teacher training for EIB, are already cov-ered in the literature cited. Thus, it is clear in the case of the more obvious options that ifthings do not progress it is for lack of political will or implementation skill, not for lack oftechnical policy options. This section has noted that there are thornier technical problems,for example those related to standards. But there are options for dealing with these diffi-cult issues, and some have been suggested. The options in question have not yet been fullyexplored in the Peruvian literature, which is why this section has gone to some length toillustrate what such options might consist of. Further discussion of and policy dialoguearound these sorts of options would most likely be of benefit to the EIB sector in Peru.
120 A World Bank Country Study

Other chapters have dealt indirectly with the issue of accountability to parents. InChapter 6, it was noted that the fact that most parents are in fact happy with thequality of schooling at their schools—when objective evidence suggests the quality
of schooling is very poor—is worrisome in that it creates an accountability problem. If par-ents are basically happy, it seems unlikely that, in the absence of certain improvements inparental overview of schools, parental pressure could be relied on to improve quality. Onthe other hand, it was noted in Chapter 7, where effective public schools and the FyA mod-els were discussed, that the best schools are indeed those that are focused on delivering toparents and community (though not necessarily those where parents are heavily involvedin school governance). This chapter looks at the issues of participation at the local level, aswell as voice at the regional or national level, as instruments of accountability.
The main conclusions of the chapter are that while in Peru there is a great deal of poten-tial participation and voice given the existence, in a formal sense, of many “spaces” andopportunities for the expression of voice, in reality there is little effective voice in the edu-cation sector for parents and ordinary citizens (including the private sector and the poor).The main reasons for this appear to be:
a) unsolved classical collective action problems, namely that it is not in the interest ofspecific parents to militate to solve the problems of all children,
b) lack of standards and a perception of rights specifically around quality issues, whichmakes it difficult for citizens to know when their rights or entitlements are being
CHAPTER 9
Participation andDecentralization
Little Effect, Some Potential47
121
47. This chapter was prepared partially on the basis of input from Flavio Figallo in a consultant’sreport prepared entitled “De Altavoces y Audífonos en la Educación.”
violated and hence prevents organization and the expression of grievance; in short,a lack of effective demand for quality,
c) the fact that most voice mechanisms are captured by the providers,d) weak legislation (contradictory, overlapping, complex, and unclear duties and pow-
ers) regulating the bodies implementing voice, and, finally,e) lack of effective power to go along with voice and participation.
The following paragraphs document these issues in some detail, first at the most locallevel, namely the school, and then at higher levels. It is noted that while the current situa-tion is not very positive, there are some positive trends, and some suggestions are made forhow to accentuate the positive potential for voice and participation.
School Level
In our survey of schools, we noted that some 89 percent of parents are happy with the qual-ity of education their children receive. This echoes the findings of the National Evaluation,where a similar percentage of “happiness” is found. This level of happiness appears not tobe due to a basic lack of information, as we discovered in our survey. We surveyed a goodmix of APAFA members and non-members. In general, the following findings corroboratethe fact that parents are in fact informed (in the literal sense of being provided with infor-mation). First, 93 percent of parents state that the principal of the school has meetings withthem to keep them informed of school matters. The plurality (though not the majority) ofthose giving answers (40 percent) stated that the main theme of discussion is, in fact, stu-dent achievement. A good bit of information is also provided regarding the school’s workplan (25 percent of parents mentioning this aspect). The percentages of parents reportingthat teachers keep them informed was even higher: 96 percent. And the percentage of par-ents saying that the information conveyed related to children’s achievement was evenhigher than the percentage for the same attributed to principals (78 percent). All of thishardly suggests a situation where parents are kept in the dark regarding quality mattersthrough the sheer non-provision of information. The failure is elsewhere: either in a basiclack of demand for quality, or in a lack of demand generated by the fact that there is noarticulation of rights to quality, or normed expectations, for parents to form their ideasabout quality (such as that a child should be able to read fluently by the end of grade 2,along with examples and data on which children in fact do).
When asked what they wished the APAFA would do more of, most parents (63 per-cent) mentioned that it should provide more infrastructure; only one parent mentionedthat the APAFA should take more interest in learning achievement. Again, this suggests asituation where most parents identify “good education” with mere access to facilities, andhave little sense of education as having to do with cognitive development.
The picture that emerges is one where information is in fact provided, but where thereis either no normed basis for providing information about achievement, or no inherentdemand for it. When asked whether there were prescribed formats for the provision ofinformation (of any kind) to parents, 86 percent of school directors responded “no.” Thus,though by regulation APAFAs and parents have a right to information, and this right isactually implemented, the information supplied appears to be ineffective and lacking in
122 A World Bank Country Study
reference to any norm (either a norm regarding the type of information to be provided, orthe fact that information needs to be provided against some norm of achievement). Onlyabout 50 percent of parents claimed to be aware of what their rights as parents were (andeven this seems high, given our main hypothesis), but only 50 percent of those (25 percentof the total) could describe how they got a sense of those rights. Unfortunately we did notask for their opinion of what those rights were, so it is difficult to know whether “yes, I know I have rights” was a conditioned social response or represents a real awareness ofeducational rights or entitlements based on some norms or expectations, such as the rightto have one’s child be able to read by a certain age.
The positive aspect in all this is that information transactions do in fact happen. In thissense, if there was a more common basis of information on rights to cognitive achievement,built around some standards of learning, perhaps more progress could be made. However,it is also apparent that most parents probably would have to be educated about these rights,and that this would take considerable time. The inherent demand for quality appears low.Thus, the belief that a faster move towards parental power and school autonomy could—in the absence of much stronger standards and parental education—lead to increases inschool quality, would seem quite unjustified.
Levels Above the School
At levels above the school there is a veritable florescence of “spaces” for educational par-ticipation. If the creation of committees, forums, councils, and so forth could by itself leadto improved education and effective representation of those affected by poor education(citizens as parents, and the users of labor in business), Peru’s educational future wouldbe assured. The following is a more or less complete list of bodies with a specific educa-tional role. There are also bodies with a general social or poverty-fighting role, such as theMesas de Concertación de Lucha Contra la Pobreza; these are not analyzed here to keepthings simple:
■ A national association of APAFAs, the CENAPAFA. (In fact, there are two, theCENAPAFA, and a splinter from it, the FENAPAFA.)
■ Consejo Nacional de Educación.■ Foro Educativo.■ The legislature’s Comisión de Educación, Cultural, Ciencia y Tecnología.■ At provincial level, the Consejo Participativo Local de Educación (COPALES),
associated with the UGEL.■ At regional level, the Consejo Participativo Regional de Educación (COPARES),
associated with the DRE.■ At school level, the Asociación de Padres de Familia (APAFA) and the Consejo
Educativo Institucional (CEI).■ In addition to these “bodies” there have been processes of national consultation
around education policy. Some of these processes bleed into and merge with eachother, so it is a little difficult to state how many there have been, but over the pastdecade or so there appear to have been three or four distinct, fairly large-scale andreasonably well-organized formal consultative processes on education policy.
Toward High-quality Education in Peru 123
As noted, in theory, if these bodies and processes worked well, the citizens’ voice wouldbe well-represented and heard. However, these bodies do not work as well as one wouldhope. The following are the main problems, illustrated via reference to particular bodiesand processes.
Many of these bodies are simply captured by special interests. The CENAPAFA andthe Comisión of the legislature, for example, could be said to be largely captured by teach-ers, and to speak for and represent teachers, not citizens. Furthermore, their creationappears to have been fostered by political parties or movements, not spontaneously by cit-izens or as a result of multi-partisan legislative efforts. Foro Educativo is composed ofprominent citizens, but most of them are professional educators in some sense (for example,former Ministers or high-level executive branch officials) and are part of the provider estab-lishment. The CENAPAFA, supposedly a parents’ organization, rarely takes positions thatdiffer from that of the SUTEP, the teacher’s union, and is headed by a former teacher whohappens to be a member of the union. The legislature’s Comisión is largely populated byex-teachers (a large plurality, though not a majority), and most of its legislative work hasto do with either the creation of jobs for teachers, or improvements in working conditionsfor teachers. The reason why this capture takes place has to do with classical problems ofcollective action and information. First, parents are poorly (though actively, as notedabove) informed. Moreover, it is not really rational for most parents to make monetarycontributions and be activists at levels higher than the school: a classic free-rider problem.The free-rider problem is compounded by the fact that public schools are quite hetero-geneous. Thus, the free-rider effect is created not only by the usual problem of dispersedcosts and the feeling that if one does not take action someone else will, but by the fact thatthe actors confronting these feelings range from the very poor and rural to the relativelywell-off and urban. This makes it difficult to generate the financial contributions neededto defend a common view, which leaves a vacuum. This space is therefore “captured” bythose whose interests are very concentrated: the teachers. In short, in Peru, as in most poorcountries, it seems unlikely that one can rely on aggregated voice—which arises sponta-neously from citizens—to put pressure on the executive branch or the service providers.The executive branch of government exists to solve problems of collective action, but is eas-ily captured by the interests of the providers themselves; the same thing happens to bodiesthat could otherwise serve as watchdogs over the executive branch. They too suffer from acollective action problem. The shortcuts to accountability through citizen pressure groupsthat societies could use when legislatures are not representative, and when policymakers donot respond to the needs of citizens, appear to be somewhat blocked, at least for now.
The Consejo Nacional de Educación is a statutory body appointed by the Minister ofEducation. Thus, from a structural perspective, it seems difficult that it would serve a crit-ical or watchdog function, and indeed it mostly does not, given that it appears to have fewopinions that are critical of the executive branch, and acts more as a group that producestechnical opinions and support for the executive branch. Furthermore, 40 percent of theleadership of the CNE overlaps with the Foro Educativo, which, as mentioned, is composedlargely of providers. Thus, again, the CNE appears to largely represent providers. The fewnon-provider citizens, for example, representatives of the private sector, appear relativelynon-active and, as noted, are very few in number. Its technical secretariat (as opposed to theConsejo per se), however, does appear to possess quite a bit of independence from the tradi-tional provider establishment, judging by the professional background of the technicians.
124 A World Bank Country Study

Both Foro Educativo and the CNE also appear at times to be collections of individualconsultants and thinkers who are engaged in producing policy studies or positions for thegovernment or donors. They also seem to implement delivery or consultation projects,sometimes using donor funding. Thus, at least part of their function appears to be morecharacteristic of implementation and consulting NGOs, rather than of true advocacy andresearch think-tanks. This no doubt has to do with their sources of funding.
There are new organizations related to the process of decentralization, namely theCOPAREs and the COPALEs. These are regional or provincial bodies that play a “legisla-tive” or “representative” role at regional and local level, as the counterparts of the DRE andthe UGEL. The legislation creating these institutions is very recent, and the specific norm-ing is still in draft form. Many of these institutions are either not functioning yet, or are onlyincipiently functioning. Unfortunately, the norming framework is sometimes ambiguous:many of the attributions are overlapping, contradictory, incomplete, or subservient to thesub-national executive branch (the DRE or the UGEL). The representativity of these bod-ies is, under current norming, corporativist rather than truly representative or democratic,and is thus inherently likely to suffer from capture.
In addition to “bodies” there have been large-scale consultative processes, often led bythe bodies. In 1997, Foro Educativo promoted an Acuerdo Nacional in opposition to theFujimori-era policies of the Ministry of Education. In 2001, the then Minister initiated alarge scale consultative process to set the tone for education policy in the post-Fujimoriera. This process was truly large scale, very well-organized, and resulted in large volumesof well-presented information. In 2002 another consultative process was launched to legit-imize and to some degree shape the new education law that eventually emerged in 2003.Finally, in 2004 and 2005 there was a process that led to the “Pacto Social de CompromisosRecíprocos” and the Proyecto Educativo Nacional. Many of the current members of theCNE took leadership positions in these consultative processes. Furthermore, these consul-tative processes do create some consistent sets of results and recommendations. This is duein part to the fact that many of the actors who generally participate in efforts of this kindparticipate in process after process. Because of their very nature and broad base and appeal,however, the recommendations tend to be well-meaning wish lists; the difficult and morecontroversial issues are often avoided and “left for later.”
A Way Forward on Voice and Participation? Opportunities and Dangers in Decentralization
A possible but insufficient source of hope is that all of these institutions are new, and there-fore represent a positive trend. However, this is not exactly the case. The basic shape ofmost of the institutions is quite old, but they have had to undergo various legal changesover time. Some version of APAFA has existed in law and in practice since 1941, but theCENAPAFA itself is a much more recent creation, and one apparently sponsored to a sig-nificant degree by political-partisan interests. Foro Educativo was created in 1992. The CNEhas antecedents that go back as far as 1959, though the specific legislation first appears onlyin 1982. It is mentioned again in legislation in 1992, but it was not until 2002 when, undera decree rather than a law, it came fully into being. CNE is supposed to have its own law,but so far it does not. While these institutions have been around for a long time, however,
Toward High-quality Education in Peru 125

it is also true that their more recent evolution gives them more “teeth” and more capacityto extract accountability. For example, it is only recently that APAFAs were empowered todemand accountability for learning results. Thus, the movement is at least going in theright general direction.
The process of decentralization is also a cause for optimism. Without a doubt, themore progressive regions will move ahead of others, creating laboratories of accountabil-ity and representativity that can be models for other regions or provinces. In fact, someregions are moving ahead of the national government and are creating regional educationplans (Proyecto Educativo Regional) even though the national education plan (ProyectoEducativo Nacional) is not finished and norms for crafting the Proyecto Educativo Regionalhave never been made clear.
Another source of hope is that these institutions do at least provide some accountabil-ity for continuity, and an institutional “home” for some continuity of policy. One of themajor policy problems confronted by Peru is the extreme instability in education policycreated by the fact that Ministers have changed about every eight months in the last few decades. Many institutions such as Foro Educativo and the CNE are populated byex-Ministers and ex-officials under various Ministries. Given their prestige and power of con-vocation, these institutions are in fact able to demand some accountability for the continua-tion of major policies, and create some continuity in thinking around major policy issues.However, in order to finish the agenda, Peru could consider several policy options.
First, accountability, and its basis in participation and voice, should start at the lowestlevel possible. Peru’s most recent legislation, the Ley General de Educación, creates the legalspace for giving the Consejo Educativo Institucional more power. The CEIs could be normedto represent parents by giving parents a statutory majority. Parents’ capacity to demandaccountability could be increased if schools received direct per capita funding and CEIshad to approve the budget that plans the use of these funds. More power could be given toparents if numerical, standard expectations of learning were developed and popularized sothat they could begin to see these levels of learning as rights, and if standard measurementand reporting formats were created. Finally, CEIs could play a sharper role in teacher eval-uation and selection, again on the basis of standards of performance (which would have tobe created first).
Second, the legislation and norming around local and regional participatory bodiesshould be clearer and simpler. The powers and duties of these bodies should be made lesscontradictory and overlapping with those of other bodies, unlike the current situationwhere everyone is seemingly involved or in charge of the same task. Furthermore, thesebodies should be made less dependent on the regional or local executive branch and thenational executive (the DRE and the UGEL), and could be given more real powers (forexample, power to approve certain budgets).
Third, some of the national voice mechanisms should receive more solid, permanentfunding that is more independent of particular Ministers. To prevent the posts funded inthis manner from becoming semi-academic sinecures, and therefore to prevent institu-tions from lapsing into irrelevance, selection for the boards and executive directorships ofthe institutions should be competitive and term-limited. Performance indicators for theinstitutions, based on the production of policy-relevant feedback and watchdog functions,could be created. All efforts to make representation in these bodies corporativist (one rep-resentative from the union, one from the parents, and so forth) should be resisted.
126 A World Bank Country Study
Educational decentralization in Peru has started; a basic legislative and normativeframework is either in place or is taking shape. As of the writing of this document, how-ever, the state of decentralization in practice (and even in regulation) is fluid and confusedto such an extent that it is impossible to make forecasts as to whether decentralization islikely to make all of the problems listed here worse or better. There are various options forusing decentralization to improve quality, but several dangers also exist. Neither the dan-gers nor the opportunities are real yet. Maximizing the potential is likely to require signif-icant work in crafting a regime of accountability at the regional level. The work required isdiscussed below.
On the positive side, decentralization could have a beneficial impact if the regionalleaderships (the regional president, the “gerente social”, and the head of the DRE) areforced to take responsibility for the quality of education in their jurisdictions, are requiredto compete with each other (or at least compare themselves to each other), and are giventhe authority to address problems. This would require that, for example, comparativeinformation on school performance be available on a region by region basis (since presum-ably most of the authority will be at that level and at school level) and disseminated to cit-izens and regional representative bodies (both general, namely the Consejo Regional andConsejo de Coordinación Regional, for example, and specific, namely the Consejo Participa-tivo Regional de Educación) in order for these two groups to hold the local executives (suchas the DRE) accountable for school performance. This information can also be used by thenational government (or civil society) to enhance the accountability of regional authori-ties to their local citizenry by publishing comparative data. However, the regional author-ities would have to have full ability to respond to problems that show up in comparativeperformance data; for example, they would have to be able to move personnel around, allo-cate resources to particular problems, and be able to innovate. In this sense, decentraliza-tion could take advantage of the fact that some regional leaders are likely to be moreinnovative and interested in education than others. With decentralization, the country willhave a larger variety of approaches to tackling problems; regions can experiment with avariety of practices, and the likelihood that best practices will emerge is enhanced. But forthe country as a whole to benefit from this variety of practices, a centralized process forstudying good practice, and spreading it, is needed. Few (if any) countries in Latin Amer-ica have been able to craft these kinds of systems in order to benefit from decentralization.It is far from clear that, as it is shaping up, decentralization in Peru is going in the direc-tion needed for quality improvement.
There are also various dangers. A clear one is confusion. Current legislation in Peru iscreating such a variety of participatory and parliament-like bodies, and with such vaguelanguage, that confusion over roles and conflict over jurisdictions is all but inevitable.(And, in many cases, in practice, one jurisdiction is given control over a neighboring one,if one of them is considered weak, instead of control reverting to the higher-level govern-ment. Thus, some “stronger” UGELs have executive authority over other, “weaker”UGELs, instead of control of the weaker UGELs reverting to the DRE. This is a recipe forchaos and conflict, and indeed this is what one finds, repeatedly, throughout Peru.) At thesame time, executive branch bodies (such as the DRE and the UGEL) have both horizon-tal (to their own regional government) and vertical (to national Ministries, in particulareducation and finance) accountability lines that overlap and are not at all clear. Thiscan and does lead to confusion and evasion of responsibilities. Finally, though (most of)
Toward High-quality Education in Peru 127

education, as a sectoral competence, is allocated to regions, the reality is that a region is solarge that, in terms of the accountability triangle discussed above, the citizens are not suf-ficiently closer to the top of the pyramid to make the voice mechanism much more pow-erful than if the top of the pyramid is simply the national government. Nor are thepolicymakers and the regional level close enough to the delivery points (schools) to makethe norms stronger or truly more sensitive to local conditions, or to make problem detec-tion at the school level any easier. In short, whether a school is one of fifteen hundred (ina region) or one of forty thousand (in the country) will probably not make much practicaldifference to accountability, even if it does make some difference to local adaptation andclient preference.
In these regards, it is some form of school autonomy (contemplated in the currenteducation law, but largely unimplemented) oriented at autonomy of management prerog-atives such as control over teachers, but with centralized standards and testing, that mightultimately bring the service close enough to the citizens to make a significant difference tolearning achievement. Most of the recommendations in the rest of this report are orientedto enhancing this sort of localized accountability.
128 A World Bank Country Study
This chapter summarizes the main sector-wide policy recommendations arising fromthe analysis in all the previous chapters and which address the key policy issues: qual-ity and its distribution. Some of the chapters, such as Chapter 5, on dropout behav-
ior, and Chapter 8, on bilingual education, have some specific recommendations that arenot reproduced here.
Standards
Standards are needed in three key areas: learning (outcome standards), service to communi-ties and to schools (“process” standards), and resource allocation. Without standards,accountability is either impossible or consumes too much social energy in transaction costs;standards are the currency, or the weights and measures, of accountability and help to econ-omize on the informational content of transaction costs. Similarly, it is only the applicationof standards that gives meaning to the notion of a right to education once mass-scale enroll-ment exists. Thus, standards are the key not only to efficiency, but also to a rights-orientedapproach to quality and equity of quality. “Standards” refers generically to three sets of things:(a) standardized, simplified, and transparent ways of doing things in a manner that reducesdiscretion and transaction costs, such as allocating resources via formulas based on enroll-ment (or attendance) and poverty; (b) setting metrics of performance—such as performanceon reading as measured by a test or service standards for UGELs to provide services toschools—that do not set actual goals for a level on that test; and finally (c) actually settinggoals, such as reaching a certain level on a reading test.
Peru needs much clearer learning standards, especially in the early grades, and needsto focus particularly on reading achievement. These standards need to be developed and
CHAPTER 10
Policy Recommendations
129

disseminated. The current approach is too vague. The need for local and regional adapta-tion is, currently, being used as an excuse for mediocrity. It is possible to develop standardsthat are locally adapted yet that provide both ambition and a metric for accountability. Theambition to simultaneously develop standards for the whole system should be resisted.Peru needs to start with reading (and perhaps writing) standards, and with the early grades.Standards should be simple, should emphasize skill, and should be meaningful particularlyto teachers and parents. With regard to reading, Peru should at first develop a simple anduniversal metric applied to every child in every school (and publicize school-level achieve-ment against this metric), with a goal in mind of reaching a certain value on that metric(for example, 60 words read correctly per minute by the end of grade 2) within five years.Standards could focus on comprehension as a goal, and on speed (or fluency) of readingas an important measured instrument. Standards should be grade specific, or perhaps evenspecific to semesters within the school year. The simpler standards in the earlier gradescould be developed first, and the rest of the system, meaning the later grades, could be tack-led later. The idea is not to fixate the system on literacy in the early grades, but to start thereboth chronologically and in terms of priority as the basis for all other later skills. If the stan-dards set for the lower grades cannot be set and met, the prognosis for the more advancedgrades will not be good.
Standards need to allow for cultural and regional diversity, and yet remain standards.This can be done in a variety of ways to which Peru has not yet devoted sufficient atten-tion. Matching-grant systems that require local effort, for example, could be developed asa way to stimulate standards that are applicable to particular regions, or adaptation of stan-dards to intercultural and bilingual education (EIB).
One possible focus on learning standards that Peru could consider is a secondary-school exit exam. It would be possible to generate this process gradually and with less con-flict by, for example, creating nationwide prizes for those who pass an exam that wouldinitially be voluntary (only those aiming for the prize would take the exam, though onemay wish to do it for whole schools rather than individuals, for reasons discussed below).Should this process find social acceptability, and as it leads to a refinement of the exit exam,the exit exam could be made mandatory. This kind of exit exam tends to drive parental andstudent pressure for school accountability, and this accountability pressure in turn tendsto trickle down to primary schools (as feeder schools), though this takes a long time. Itwould be possible to create prize systems that are sensitive to differential starting condi-tions, by, for example giving prizes at the school level (for example, if a whole school vol-unteers for the system), by giving awards to the top marks-earners at any given school, byrecognizing progress rather than actual achievement, or using statistical controls that cre-ate peer groups (as in Chile’s National Teacher Performance Evaluation System [SNED]).
Service or process standards should be developed over time via observation of success-ful practice under difficult or average conditions. Schools that outperform others undersimilar conditions could be studied, and the good practices they engage in should eventu-ally find their way into the procedural norms and standards. Current practice in Peru is forthese procedural norms to be based on vague theories and bureaucratic needs, rather thanon school-level practice and need. The next wave of Peruvian education research shouldfocus on this issue.
Standards for teacher selection, embodied in exams that would have to be passedbefore individuals can become teachers, should also be created. These should be coordi-
130 A World Bank Country Study

nated with standards for pre-service teacher training. Peru is currently considering theseissues in the drafting of the new law on Carrera Pública Magisterial and in debates onaccreditation of teacher training institutions. A new career ladder that promises better payfor better teachers will also help retain and attract better teachers.
Better funding standards are also needed, particularly as the country decentralizesand increases school-level autonomy under new legislation. This should take the formof a formula-based transfer of funds and physical resources from the national level toregions and from regions to schools. Formulas will lower transaction costs and willincrease transparency and trust. They will also make it possible to target spending whereit is needed most, in terms of both equity and results orientation. Finally, these formu-las enable a sense of rights, in that schools and parents can have a clearer sense of theminimum funding to which they are entitled. A minimum per-student funding could becreated, such as funding a basic minimum package of items including stationery, class-room supplies, cleaning materials, and so forth. The package could be more generous inpoorer regions.
Finally, the UGELs, or the administrative unit above the school, should set standards ofservice to schools, and schools should set standards of service to parents and communities.Parents and communities should rate schools, and schools should rate UGELs. Comparativedata should be publicized. After a few years, goals on these standards should be defined.
Accountability
While standards are needed for accountability, because otherwise there is no metric towhich to hold anyone accountable, it is also true that without accountability pressure, stan-dards do not do much good. Coming up to standard requires effort; effort should berewarded and lack of effort should be punished. Thus, incentives are needed to driveaccountability. To increase accountability pressure, the following steps are needed.
■ Measure results at all schools in key areas of knowledge, not just in a sample ofschools, concentrating first on reading in the early grades. Start publishing dataon learning results and on fiscal transfers on a regular basis, ideally down to theschool level. Publish average results and expenditure data at the regional level.Ensure that data are presented relative to standards, but also relative to capac-ity and disadvantage using some simple “value-added” concepts, and put moreemphasis on trends than on levels at any particular time. The system shouldavoid reporting on a “passed” basis, or using standards for grade retention ofstudents.
■ Ensure that parent groups at the school level have the power to hold schoolsaccountable by, for example, ensuring parents have a statutory majority on SchoolGoverning Councils (Consejos Educativos Institucionales, CEIs), and by requiringschools to report to parents on standards of achievement and resources receivedand used, according to simple, preset formats. Parents’ Associations (Asociaciónesde Padres de Familia, APAFAs) should be equally accountable to the principals andthe State. Parents should have a vote and voice in the promotion and selection ofprincipals and teachers. This will act as an incentive for teachers to work towards
Toward High-quality Education in Peru 131

satisfying the ultimate clients. However, as noted elsewhere, it is important that theclients be realistically informed about learning standards.
■ Encourage greater school-level autonomy for principals and parents, such as inthe procurement of materials and the allocation of inputs, as long as there is bothbudgetary and results accountability. This can be encouraged by formula-basedfiscal transfers to schools, as opposed to direct input provisioning of physicalinputs.
■ Experiment more extensively with non-government administration of schools withpublic funding, similar to the FyA experience. Reduce the current ad hoc nature ofthese experiences by creating more standardized formats and contracts for man-agement, and improving comparative evaluation of the experiences according toresults and cost measurement. Disseminate the results.
■ UGELs should experiment with contracting out to service providers (see below).Schools should be explicitly asked to rate the services provided by UGELs or ser-vice providers, and this information should be used to modify provider behaviorand to drive provider selection. The continuation and promotion of UGEL staffshould be keyed to school ratings. Similarly, the process to promote and continuethe employment of school personnel (principal and teachers) should be informedby parental rating of schools.
Support
Accountability pressure built around standards will lead to improved results only if onecan assume that all actors have all the information and skills needed to come up to stan-dard. This appears not to be the case in Peru. Thus, support is the third important leg onwhich qualitative improvement is needed.
■ Support is the area that will require the implementation work, and hence the mostfunding. Setting standards and accountability systems will require technical skilland creativity, as well as consensus building and dialogue (“political will”). Butdeveloping and using the support systems will, in addition, actually use up largeamounts of scarce resources (particularly human resources), and is something thatneeds to be improved on over time.
■ Teachers need much more intensive support and “accompaniment” in how to teachto the learning standards. Generic and low-intensity cascade support is unlikely towork. Instead, week-by-week, or at least month-by-month accompaniment, basedon measured results, is needed, at least for a few years. Experiments with massive andintensive training that instrumentally take teachers through a whole year’s curricu-lum, and with specific, measurable goals (the standards), are needed. This should startwith reading and with the first few grades, and can then be expanded to other skillsand later grades.
■ Parent bodies need training in how to hold schools accountable for performanceto standard and for budgetary and financial issues. This should include the devel-opment of reporting formats, and the training of parent bodies in how to use theformats to put pressure on schools. On the other hand, a clear distinction between
132 A World Bank Country Study
a governance or accountability role, which is positive, and a daily management rolefor parents, which is likely to be negative, needs to be drawn, and both parents andprincipals need to be educated about this.
■ School principals will need training in how to discharge their new accountabilityto parents and in how to perform to both outcome and process standards.
■ Support will also be needed in helping both schools and UGELs make cogent useof performance information in driving decisions on personnel progression and pay.This will not be an easy task.
■ UGELs and other intermediary institutions (such as DREs) are grossly under-equipped to provide support to schools on either pedagogical or administrative mat-ters. At this point, they fulfill more of a control and harassment function, in theworst of cases, or a vertical reporting, or upward accountability, function, in the bestof cases. Instead, UGEL personnel should be required and trained to support theaccountability of schools to parents and community, realizing that schools are thefront line of service provision, and are the quality “face” of the system. The regionaland national governments, in turn, should be accountable to UGELs and schools;there should be some clear “downward” accountability. Importantly, the capacityof UGELs to support schools pedagogically needs to be strengthened. In most cases,this will take too long. In the meantime, experiments in outsourcing school sup-port functions to NGOs or universities, in whole districts or even regions, can bedeveloped. However, such support should be explicitly oriented at helping schoolsdischarge accountability to standard; it should not be merely generic training onpedagogical theory and principles (as is all too common at present). Finally, thissupport should be rated for accountability purposes (see above).
■ Overall budgetary support, in the form of increased expenditure (to pay for theresources needed to provide all of the above-mentioned support, but to pay forother improvements not discussed here, as well), should be developed, pari passu,once the various systems discussed here start to be developed and applied. It isunlikely that all these forms of accountability will produce results if the current lev-els of total budgetary support to education are maintained. For example, the levelsof support and training needed to improve performance of teachers are likely to bemassive. But expenditure support, if provided before proper forms of accountabil-ity are developed, will tend to flow along the current channels (expansion of num-bers of teachers and schools). It would not tend to flow toward standards-basedaccountability support. While these channels were appropriate when the goal wasto increase coverage, they are quite inappropriate when the goal is to improve qual-ity; this, however, is what the systems are “trained” to do, and this is what the inter-est groups support.
■ Fiscal support should be standardized (or formula-driven), as noted above. Asimple way to do this is to make funding enrollment (or assistance) driven. Totalfunding (including personnel) from the national level to the regional level couldbe enrollment driven, with, perhaps, some differentiation for population den-sity or poverty. For funding from the regional to school level, the formula couldinitially cover only non-personnel spending, and should provide more supportto the poor by using simple targeting criteria such as the geographical locationof the school.
Toward High-quality Education in Peru 133

■ Finally, and related to budgetary support, there is the issue of teacher costs. Sinceteacher costs consume the large majority of budgetary resources, the financingof teacher costs is the most important part of “support” to the education sector.Teacher costs have increased significantly in recent years. Yet, even prior to theseincreases, Peru had an oversupply of teachers. Yet, these teachers may not be ofthe quality and level of skills society needs. Increases in pay, if not tied to improvedselection, incentives, and skills development, will not result in better teachers. Itwill result in further oversupply. At this point, instead of increases in pay, the focusshould be on much more rigorous quality control at entry (selection through com-petition based on skills and knowledge, that is, standards-based selection andtraining), and improved selection over the career, including measures to encour-age poor teachers to leave the profession.
134 A World Bank Country Study

Había un perrito gordo y peludo llamado Dogo. La familia con quien vivía lo quería mucho.
Dogo era un perro obediente, cuidaba la casa, pero no comía toda su comida.
Un día salió de paseo con su amo Lucas y se perdió. Lucas se puso triste, pero felizmenteDogo apareció al rato. Lucas lo cargó y lo llevó a su casa.
Preguntas de comprensión (van en otra hoja)
1. ¿Cómo se llamaba el perro?2. ¿Con quién vivía el perro?3. ¿El perro comía toda su comida?
APPENDIX A
Dogo
135


APPENDIX B
Classification and Frequencyof Classroom Activities
137

138A W
orld Bank Country StudyClassificationObserved of Pedagogical
Main Activity Sub-activity Cases Value
Teacher explaining a theme Children listening attentively 12 Medium
Teacher working with groups of children Teacher working with some children, others no 8 Mediumspecific activity
Transition activity Teacher trying to organize class 7 Low
Teacher dictating to all children Some children listening or copying, others reading 6 Lowon their own or distracted
Classroom without specific activity Chaos, impossible to determine predominant activity 6 Low
Teacher with no specific activity Teacher talking causally, no goal 5 Low
Teacher dictating to all children Almost all children copying or listening 4 Medium
Teacher working with groups of children Teacher supervising group work 4 High
Children working on blackboard Other children paying attention or copying 4 Medium
Classroom without specific activity No teacher in classroom 3 Low
Classroom without specific activity Teacher chatting with some students 3 Low
Teacher dictating to all children Most children doing nothing and not paying attention 2 Low
Teacher explaining a theme Most children doing nothing and not paying attention 2 Low
Teacher working with groups of children Teacher working with some children, others no 2 Lowspecific activity

Toward H
igh-quality Education in Peru139
Children working on blackboard Some children listening or copying, others reading on 2 Mediumtheir own or distracted
Transition activity Teacher distributing books and materials 2 Medium
Classroom without specific activity Each child on his own without teacher involvement 2 Low
Teacher explaining a theme Most children doing nothing and not paying attention 1 Low
Classroom without specific activity Teacher writing on board without apparent goal 1 Low
Classroom with some specific child activity Children reading for the others 1 Low
Classroom without specific activity Teacher absent, children outside the classroom 1 Low
Classroom without specific activity Dance practice outside the classroom 1 Low
Children working on blackboard Most children doing nothing and not paying attention 0 Low
Children working on blackboard Other 0 Medium
Children working together Reading aloud together 0 High
Children working together Taking turns reading 0 Medium
Children working together Working on a common task with active teacher 0 Highsupervision
Classroom without specific activity Children working on exam 0 Medium
Classroom without specific activity Children working without teacher supervision 0 Low
Note: Two observations per classroom.


Abadzi, Helen. 2004. “Education for All or Just for the Smartest Poor?” Prospects 34:271–89.ACTFL. Undated. “Standards for Foreign Language Teaching: Preparing for the 21st Cen-
tury.” Accessed at http://www.actfl.org/files/public/execsumm.pdf on June 11, 2005.Alcázar, Lorena, and Nancy Cieza. 2002. “Hacia una mejor gestión de los centros educativos
en el Perú: el caso de Fe y Alegría.” Instituto Apoyo y CIES.Alcázar, Lorena. 2004. “Agenda Nacional De Reformas Económicas En Perú: El Sector
Educación.” Group for the Analysis of Development. Lima, Peru Wordprocessed.“Análisis del modelo de gestión institucional y pedagógica y lecciones para la educación
pública.” Group for the Analysis of Development. Lima, Peru.Arregui, Patricia, Hugo Díaz, and Barbara Hunt. 1996. “Problemas, Perspectivas y Requer-
imientos de la Formación Magisterial en el Perú.” Group for the Analysis of Develop-ment. Lima, Peru.
Arrisueño Fajardo, Gabriel. 2004. “Using Education To Heal Racism In Peru: LessonsFrom South Africa.” Master’s Thesis. The Maxwell School, Syracuse University.Processed.
Barr, R., C. Blachowicz, C. Katz, and B. Kaufman. 2002. “Reading Diagnosis for Teachers:An Instructional Approach (4th ed.).” Boston, MA: Allyn and Bacon.
Benavides, Martín. 2002. “Para Explicar Las Diferencias En El Rendimiento En MatemáticaDe Cuarto Grado En El Perú Urbano: Análisis De Resultados A Partir De Un ModeloBásico.” In Rodríguez, José, y Silvana Vargas, eds., Análisis de los resultados y metodologíade las pruebas CRECER 1998. Documento De Trabajo No. 13. Programa MECEP.Ministerio de Educación.
Carnoy, Martin, and Michel Welmond. No date. “Do Teachers Get Paid Too Much? AWorldwide Comparison Of Teacher Pay.” Wordprocessed draft.
Constance, Paul. 2003. Escuela pública, gerencia privada. Published in BID América, June.
Bibliography
141

Crouch, Luis. 2006. “Educación: Estándares, Apoyo y Rendición de Cuentas.” In D. Cotlear,ed., Un Nuevo Contrato Social Para El Perú: ¿Cómo lograr un país más educado, salud-able, y solidario? Washington, D.C.: The World Bank.
Crouch, Luis, and Tazeen Fasih. 2004. “Patterns in Educational Development.” The WorldBank. Processed.
Cruz, Gustavo, Giuliana Espinosa, Angélica Montané, Carlos Rodríguez. 2002. “InformeTécnico de la Consulta Nacional sobre Puntos de Corte para la Evaluación Nacional2001.” Ministerio De Educación, Unidad De Medición De La Calidad Educativa. Lima,Peru.
Cueto, Santiago and Walter Secada. 2001. “Mathematics Learning and Achievement inQuechua, Aymara and Spanish by Boys and Girls in Bilingual and Spanish Schools inPuno, Peru.” Group for the Analysis of Development. Lima, Peru.
Cueto, Santiago, Cecilia Ramírez, and Juan León. 2003. “Eficacia escolar en escuelas poli-docentes completas de Lima y Ayacucho.” Group for the Analysis of Development.Lima, Peru. Processed.
Cueto, Santiago, Cecilia Ramírez, Juan León, and Oscar Pain. 2003. “Oportunidades deaprendizaje y rendimiento en matemática en una muestra de estudiantes de sextogrado de primaria de Lima.” Documento de Trabajo 43. Group for the Analysis ofDevelopment. Lima, Peru.
Cueto, Santiago. 2003. “Factores Predictivos del Rendimiento Escolar, Deserción e Ingresoa Educación Secundaria en una Muestra de Estudiantes de Zonas Rurales del Perú.”Group for the Analysis of Development. Lima, Peru.
Cummings, S. M. and Stella Tamayo. 1994. “Language and Education in Latin America:An Overview.” Human Resources Development and Operations Policy Working Papers(HROWP), No. 30. Washington, D.C. The World Bank.
D’Emilio, Lucia. 1996. “Voices and Processes Toward Pluralism: Indigenous Educationin Bolivia.” Swedish International Development Cooperation Agency (SIDA). NewEducation Division Documents, No. 9. Stockholm, Sweden.
Danida. 2004. “Best practices for including indigenous peoples in sector programmesupport.” A Toolkit. Draft.
De la Colina, María G., Richard Parker, Jan Hasbrouck, and Raphael Lara-Alecio. 2001.“Intensive Intervention in Reading Fluency for At-Risk Beginning Spanish Readers.”Bilingual Research Journal 25(4):417–52.
Del Rosario, Mercedes and Nanda Warren. 2003. “Response to ‘Whose Language Is it Any-way?’ Historical Fetishism and the Construction of Expertise in Bolivian LanguagePlanning.” Current Issues in Comparative Education 5(2).
Department of Education. 2002. Revised National Curriculum Statement. Grades R-9(Schools). Pretoria, South Africa. Sourced at http://education.pwv.gov.za/DoE_Sites/Curriculum/Final%20curriculum/policy/English/Eng%20Home%20Language%20Fin.pdf on 20 February 2005.
Díaz, Hugo, and Jaime Saavedra. 2000. “La Carrera del Maestro en el Perú: Factores Insti-tucionales, Incentivos Económicos, y Desempeño.” Lima, Perú. GRADE. Documentode Trabajo No. 32.
Dutcher, Nadine, with the collaboration of G. Richard Tucker. 1997. “The Use of First andSecond Languages in Education. A Review of International Experience.” PacificIslands Discussion Paper Series. No. 1. The World Bank. Washington D.C.
142 A World Bank Country Study

Equipo de Análisis de la Unidad de Medición de la Calidad Educativa. 2004. “Factores Aso-ciados Al Rendimiento Estudiantil.” Unidad de Medición de la Calidad Educativa.Ministerio de Educación. Lima, Peru. Processed.
Equipo de Orientación Educativa de Marbella. 2003. “Evaluación de la velocidad lectoraoral y Análisis de la correlación de esta variable con la nota global de junio.” Conse-jería de Educación y Ciencia. Junta de Andalucía.
Equipo Pedagógico Nacional de FyA. 2003. Propuesta pedagógica. Lima, Peru.Espinosa, Giuliana and Alberto Torreblanca. 2003. “Resultados de las Pruebas de Comu-
nicación y Matemática de la Evaluación Nacional del Rendimiento Estudiantil 2001.”Ministerio de Educación, Unidad de Medición de la Calidad Educativa. Lima, Peru.Sourced at http://www.minedu.gob.pe/umc/2003/pdfs_nac/result_pruebas_commat.pdf on 20 February 2005.
FyA. 2003. FyA: Movimiento de Educación Popular Integral y Promoción Social. Presen-tation available at www.feyalegria.org.
Fiszbein, Ariel, editor. 2005. “Citizens, Politicians, and Providers: The Latin AmericanExperience with Service Delivery Reform.” The World Bank, Washington, D.C.
Foro del Acuerdo Nacional. 2004. Pacto Social De Compromisos Recíprocos Por La Educación 2004–2006. Sourced at http://www.acuerdonacional.gob.pe/Pactos/PactoSocialdeEducaci%F3n.pdf on July 2, 2004.
Francke, Pedro. 2004. “Educación pública, salud y descentralización.” Universidad Ponti-ficia Católica del Peru. Palestra Web-Site. Sourced at http://palestra.pucp.edu.pe/?id=38on July 23, 2004.
Galindo, Claudia. 2002. “El Currículo Implementado Como Indicador Del Proceso Educa-tivo.” In José Rodríguez and Silvana Vargas, eds., Análisis de los resultados y metodologíade las pruebas CRECER 1998. Documento De Trabajo No. 13. Programa MECEP. Min-isterio de Educación.
Grimaldo Vásquez, Rengifo. 2003. “La Enseñanza Es Estar Contento: Educación y Afirma-ción Cultural Andina.” Proyecto Andino de Tecnologías Campesinas (PRATEC).Lima, Peru. Processed.
Guzmán, Ingrid, Leonel Penacho and Alicia Gonzáles. 2002. “Sistematización en Torno ala Capacitación Docente en EBI Desarrollada por la DINEBI.” Lima, Peru. Processed.
Herrera, S. and G. Pang, 2004. “Efficiency of public spending in developing countries: andefficiency frontier approach.” A World Bank Economic Policy Paper. Washington, D.C.
Hoffman, J. V., P. D. Pearson, S. N. Beretvas, and M. Sailors. 2003. “The Business Trust:Learning for Living Project: Year 3 Progress Report.” The READ Trust. Johannes-burg. Sourced at http://www.read.org.za/news/READ%20Final%202003.pdf on 19February 2005.
Hornberger, Nancy, and Serafín Coronel-Molina. 2004. “Quechua language shift, main-tenance, and revitalization in the Andes: the case for language planning.” InternationalJournal of the Sociology of Language 167:9–67.
Hornberger, Nancy. 2000. “Bilingual Education Policy and Practice in the Andes: Ideolog-ical Paradox and Intercultural Possibility.” Anthropology and Education Quarterly31(2).
Hunt, Barbara. 2001. “Peruvian Primary Education: Improvement Still Needed.” Preparedfor delivery at the meeting of the Latin American Studies Association, Washington,D.C., September 6–8. Processed.
Toward High-quality Education in Peru 143
Instituto Superior Pedagógico Público Loreto. 1992. “Diseño Curricular de FormaciónDocente en Educación Intercultural Bilingüe para la Amazonía Peruana.” Iquitos, Peru.
“Investments, Incentives and Institutions.” Report of the Task Force on Education andGender Equality. New York.
Rivero, José. 2002. “Magisterio, Educación y Sociedad en el Perú.” Ministerio de Educacióny UNESCO. Lima, Peru.
Rivero, José. 2004. “Políticas educativas y exclusión: sus límites y complejidad.” Sourcedat http://palestra.pucp.edu.pe/?id=48, on July 23, 2004.
Jung, Ingrid and Luis Enrique López. 1989. “Sistematización del Proyecto Experimental deEducación Bilingüe Puno (PEEB-P), 1977–1988.” GTZ. Lima, Perú. Second edition.
Kuper, Wolfgang. 1988. “Interculturalidad y Reforma Educativa en Tres Países Andinos.”Pueblos Indígenas y Educación. Nos. 45–46. Abya Yala. GTZ. Quito, Ecuador.
Lazcano, Josefa. 2003. “FyA. Las claves de una experiencia exitosa”. Prepared for a semi-nar on “Experiencias exitosas de Capital Social” at the International Seminar onSocial Capital, Ethics, and Development: The Challenges of Democratic Governance,Caracas, June 25–26.
López, Luis Enrique. 2002. “A ver, a ver . . . ¿Quién quiere salir a la pizarra? ¿Jumasti?Jupasti?” Programa MECEP. Documento de Trabajo No. 15. Ministerio de Educación.Lima, Peru.
Hernani Limarino, Werner. 2004. “Are teachers well paid in LAC? Relative wage and struc-ture of returns of teachers in LAC.” Processed.
Luykx, Aurolyn. 2004. “The future of Quechua and the Quechua of the future: languageideologies and language planning in Bolivia.” International Journal of the Sociology ofLanguage 167:147–58.
Martiniello, María. 2001. “Fe y Alegría: Where Community is the Choice.” GraduateSchool of Education, Harvard University.
McMeekin, R. W., Marcela Latorre, and Francisca Zeledón. 2001. “Instituciones dentro delas organizaciones escolares.” Processed.
Mealla, Eloy. “ONGs y Administración Pública: la experiencia de Fe y Alegría.” RevistaColecciones VII(11). Buenos Aires.
Ministerio de Educación de Chile. Undated. “Desempeños a Lograr en Escritura, Lectura,y Matemáticas, 2ndo Nivel de Transición, Nivel Básico 1, Nivel Básico 2.” Santiago,Chile. Sourced at http://biblioteca.mineduc.cl/documento/desempenos-ultimo3.pdfon 20 February 2005.
Ministerio de Educación del Perú (MINEDU). 2000. “Estructura Curricular Básica de Edu-cación Primaria de Menores.” Documento elaborado por la Dirección Nacional deEducación Inicial y Primaria.
———. 2001. “Los Desafios de la Diversidad.” DINEIP—UNEBI. FORTE PE. Lima, Peru.———. 2004. “Contribución al Desarrollo de la Educación en Areas Rurales: Sistemati-
zación de la Experiencia en Cuatro Ámbitos Seleccionados.” Oficina de Coordinaciónpara el desarrollo Educativo Rural. Lima, Peru.
Ministerio de Educación del Perú/Dirección de Educación Inicial y Primaria. 2000. “Pro-grama Curricular de Educación Primaria de Menores. (Primer y segundo grados)Estructura Curricular Básica de Educación Primaria de Menores.” Lima, Peru.Accessed at http://www.minedu.gob.pe/gestion_pedagogica/dir_edu_inicial_primaria/2003/dir.php?obj=curriculo2003.htm, on 20 February 2005.
144 A World Bank Country Study

Montero, Carmen (coordinadora). 2001. “La Escuela Rural: Modalidades y Prioridades deIntervención.” Ministerio de Educación. Lima, Peru.
Montero, Carmen, Patricia Ames, Zoila Cabrera, Andrés Chirinos, Mariella FernándezDávila, and Eduardo León. 2002. “Propuesta metodológica para el mejoramiento de laenseñanza y el aprendizaje en el aula rural multigrado.” Documento de Trabajo No. 18.Programa MECEP. Ministerio de Educación.
Navarro, Juan Carlos. 2002. “Y sin embargo se mueve: Educación de financiamiento públicoy gestión privada en el Perú.” In Lawrence Wolf, Pablo González, and Juan CarlosNavarro, Educación privada y política pública en América Latina. Santiago: PREAL/BID.
Ndoye, Mamadou. 2003. “Bilingualism, language policies, and educational strategies inAfrica.” IIEP Newsletter (July-September).
Organisation for Economic Cooperation and Development (OECD). 2005. Worksheet onteacher salaries sourced on May 29, 2005, at http://www.oecd.org/dataoecd/61/34/33671263.xls.
Organisation for Economic Cooperation and Development (OECD) and Unesco Instituteof Statistics (UIS). 2003. “Literacy Skills for the World of Tomorrow: Further Resultsfrom PISA 2000.” Paris: OECD.
Oliart, Patricia. 2002. “Qué Podemos Aprender de las Escuelas Rurales: Reflexiones Acercade los Dilemas de la Escuela Rural en la Sierra Peruana.” Escuelas que Aprenden y seDesarrollan. Universidad Peruana Cayetano Heredia. Lima, Peru.
Orr Easthouse, Linda. 2004. “Literacy: Freedom depends on who holds the tools.” Word-processed. Wycliffe Canada.
Passolunghi, C. M, C. Cornoldi and S. de Libero. 1999. “Working memory and intrusionsof irrelevant information in a group of specific problem solvers.” Memory and Cogni-tion 27(5):779–90.
Pérez Villar, José. 1996. “¿Cómo lee mi paciente?: Contribución a la metodología del exa-men directo en psiquiatría de niños.” Revista Cubana de Pediatría 68(3).
Ponencia presentada para el Seminario sobre Escuela Rural Andina. Tarea. Cusco, Peru.Pontificia Universidad Católica del Perú. 1995. “Una Propuesta Andina de Profesional-
ización Docente.” CRAM Urubamba. CISE. Lima, Peru.PREAL (Programa de Promoción Educativa en América Latina y el Caribe). 2003.
“Informe de Progreso Educativo–Perú.”———. 2004. “Mexico: Programa Atención Educativa a Población Indígena (PAEPI).”
Serie “Buenas Prácticas.” Sourced at http://www.preal.org/Biblioteca.asp?Id_Carpeta=118&Camino=80⎟Buenas%20Prácticas/104⎟Banco%20de%20Datos%20Buenas%20Prácticas%20de%20Política%20Educacional%20y%20Reforma%20Educativa/106Experiencias%20registradas%20según%20país/118⎟ México accessed on Feb 06, 2007.
Public Schools of North Carolina. 2003. “English Language Development: StandardCourse of Study and Grade Level Competencies.” Department of Public Instruction,Raleigh, North Carolina, USA.
Raczynski, Dagmar and Gonzalo Muñoz. 2005. “Effective Schools in Poverty Areas inChile. Keys And Challenges.” Asesorías para el Desarrollo, Santiago, Chile. Processed.
Reisberg, D. 2001. Cognition: Exploring the Science of the Mind. Second edition. New York:Norton.
Red EBI Perú. 1999. “Congreso Nacional De Educación Intercultural Bilingüe 1998.” InEducación Bilingüe Intercultural: Experiencias y Propuestas. GTZ. Lima, Perú.
Toward High-quality Education in Peru 145

Reimers, Fernando. 1993. “FyA: una innovación educativa para proporcionar educaciónbásica con calidad y equidad.” Harvard Institute for International Development.Processed.
Rivero, José. 2004. “Políticas Regionales Andinas para el Desarrollo de la Escuela Rural.”Lima, Peru. Processed.
Rodas, Antonio. 1999. “Experiencia Pedagógica del Proyecto de Educación Bilingüe Inter-cultural de Andahuylas Chincheros-PEBIACH.” In “Educación Bilingüe Intercultural:Experiencias y Propuestas. GTZ.” Lima, Peru.
Rodríguez, José. 2004. “Importancia del gasto público de calidad en la educación.” Uni-versidad Pontificia Católica del Perú. Palestra website. Accessed at http://palestra.pucp.edu.pe/?id=25 on July 23, 2004.
Romero, Leonor y Nelly Cáceres. 2001. “Fe y Alegría: Una alternativa educativa de cali-dad para los empobrecidos.” Universidad Peruana Cayetano Heredia, Facultad deEducación.
Sakellariou, Chris. 2004. “The Indigenous/Non-Indigenous Early Test Score Gap inBolivia, Perú and México.” Applied Economics. School of Humanities and Social Sci-ence. Nanyang Technological University. Singapore. Processed.
Shaywitz, Sally. 2003. Overcoming Dyslexia. New York: Alfred Knopf.Ramírez, Eliana. 2003. “Balance de las Experiencias de Educación Rural en el Perú.”Saavedra, J., and E. Maruyama, 1999. “Los retornos a la educación y a la experiencia en el
Perú: 1985–1997.” Grupo de Análisis para el Desarrollo, GRADE, Lima, Peru.Swope, John y Marcela Latorre. 1998. Comunidades Educativas Donde Termina el Asfalto,
Escuelas Fe y Alegría en América Latina. Santiago, Chile: Centro de Investigación yDesarrollo de la Educación.
Trapnell, Lucy and Eloy Neira. 2004. “Situación de la Educación Intercultural Bilingüe enel Perú.” Consultancy for the World Bank. Working document.
Trapnell, Lucy and others. 2004. “Balance y Perspectivas de la EIB en el Perú.” Conclu-siones presentadas por la delegación peruana en el Seminario Internacional Balance yPerspectivas de la EIB en América Latina in Cochabamba, Bolivia.
Tucker, G. Richard. 1999. “A Global Perspective on Bilingualism and Bilingual Education.”Center for Applied Linguistics. August. Accessed at http://www.cal.org/resources/digest/digestglobal.html on March 13, 2005.
Uccelli, Francesca. 1999. “Familias Campesinas, Educación y Democracia en el SurAndino.” Instituto de Estudios Peruanos (IEP). Documento de Trabajo. Lima, Peru.
Universidad Peruana Cayetano Heredia, Facultad de Educación. 2001. Primer SeminarioInternacional Investigación para una mejor educación. Escuelas que aprenden y sedesarrollan. Lima. Processed.
Vega, Juan Fernando. 2004. “La autoridad de los padres de familia como base de lapolítica educativa.” Sourced at http://www.palestra.pucp.edu.pe/index.php?id=24on February 06, 2004.
Vigil, Nila. 2004. “Pueblos Indígenas y Escritura.” Accessed at http://www.aulaintercultural.org/IMG/pdf/indigenas_escritura.pdf on March 20, 2005.
Webb, Richard, and Sofía Valencia. 2006. “Los Recursos Humanos en La Salud y La Edu-cación Públicas del Perú.” In D. Cotlear, ed., Un Nuevo Contrato Social Para El Perú:¿Cómo lograr un país más educado, saludable, y solidario? Washington D.C.: TheWorld Bank.
146 A World Bank Country Study

Wolf, Lawrence, Pablo González, and Juan Carlos Navarro. 2002. Educación privada ypolítica pública en América Latina. Santiago: PREAL/BID.
World Bank. 2001. “Peruvian Education at a Crossroads: Challenges and Opportunitiesfor the 21st Century.” A World Bank Country Report, No. 22357. Washington, D.C.
———. 2003. Making Services Work for Poor People. World Development Report 2004.World Bank. Washington, D.C.
———. 2004. “Education in Indonesia: Managing the Transition to Decentralization.”Human Development Sector Reports, East Asia and Pacific Region. Report No. 29506.
———. undated. “Implications for Further Efficiency Analysis.” Washington D.C. Processed.Zavala, Virginia. 2002. “Desencuentros con la Escritura: Escuela y Comunidad en los Andes
Peruanos.” Red para el Desarrollo de las Ciencias Sociales en el Perú. Lima, Peru.Zúñiga, Madeleine, Liliana Sánchez, and Daniela Zacharías. 2002. “Demanda y Necesidad
De Educación Bilingüe: Lenguas Indígenas y Castellano en el Sur Andino.” GermanAgency for Technical Cooperation, KFW. Ministerio de Educación. Lima, Peru.
Toward High-quality Education in Peru 147

Eco-AuditEnvironmental Benefits Statement
The World Bank is committed to preserving Endangered Forests and natural resources. Weprint World Bank Working Papers and Country Studies on 100 percent postconsumer recy-cled paper, processed chlorine free. The World Bank has formally agreed to follow the rec-ommended standards for paper usage set by Green Press Initiative—a nonprofit programsupporting publishers in using fiber that is not sourced from Endangered Forests. For moreinformation, visit www.greenpressinitiative.org.
In 2006, the printing of these books on recycled paper saved the following:
Trees*
203*40” in height and6-8” in diameter
Total Energy
141 mil.BTUs
Net Greenhouse Gases
17,498Pounds CO2 Equivalent
Water
73,944Gallons
Solid Waste
9,544Pounds


ISBN 0-8213-7017-0
THE WORLD BANK
1818 H Street, NW
Washington, DC 20433 USA
Telephone: 202 473-1000
Internet: www.worldbank.org
E-mail: [email protected]
Toward High-quality Education in Peru is part of the World
Bank Country Study series. These reports are published with
the approval of the subject government to communicate the
results of the Bank’s work on the economic and related condi-
tions of member countries to governments and to the devel-
opment community.
Peru has made great strides in educational coverage. Although
the gender balance is not perfect, it is at about the same level
as that found in the rest of Latin America. However, Peru has
an inequality problem which cannot be explained solely in
economic terms. Other factors, such as linguistic or cultural
discrimination or a lack of attention to pedagogical
development for the poor, seem to be at work. This situation
is a consequence of the lack of quality standards in education,
no accountability and monitoring of the level of performance,
and not enough teachers’s training.
This book has three main recommendations. First, it is neces-
sary to generate basic standards, quality goals, and quality
measurement systems. Second, once quality can be meas-
ured, a clear system of accountability should be implemented
based on these standards and quality goals. The clients will
play a central role in these systems by demanding their rights
to quality services; this will only become possible once there
are standards and goals that clarify clients’ rights. Third, once
there are standards and systems of accountability, investment
is needed to strengthen the institutional capacity of the
providers.
World Bank Country Studies are available individually or by
standing order. Also available online through the World Bank
e-Library (www.worldbank.org/elibrary).