tools and techniques for total quality
DESCRIPTION
Tools and Techniques for Total Quality. Introduction. Quality practitioners have adapted a variety of tools from other disciplines, such as statistics, operations research, and creative problem solving to help design, improve, and control processes. - PowerPoint PPT PresentationTRANSCRIPT
Tools and Techniques for Total Quality
Introduction
• Quality practitioners have adapted a variety of tools from other disciplines, such as statistics, operations research, and creative problem solving to help design, improve, and control processes.
• These tools provide a means by which problems and issues can be viewed objectively, data can be used as a basis for fact-driven decisions, and managers can deal with variation in a logical fashion.

Tools for Quality Design• Customers’ needs and expectations drive the
planning process for products and the systems by which they are produced. Marketing plays a key role in identifying customer expectations. Once they are identified, managers must translate them into specific product and service specifications that manufacturing and service delivery processes must meet. In some cases the product or service that customers receive is quite different from what they expect. It is management’s responsibility to minimize such gaps. Firms use several tools and approaches to help them focus on their external and internal customers.

Quality Function Deployment (QFD)
• QFD is a methodology used to ensure that customers’ requirements are met throughout the product design process and in the design and operation of production systems.
• It is both a philosophy and a set of planning and communication tools that focuses on customer requirements in coordinating the design, manufacturing, and marketing of goods.

Quality Function Deployment (QFD)
• The focus of QFD is translating customer requirements into the appropriate technical requirements for each stage of product development and production.
• The customers’ requirements – expressed in their own terms – are appropriately called the voice of the customer. These are the collection of customer needs, including all satisfiers, delighters/exciters, and dissatisfiers – the “whats” that customers want from a product. Sometimes these requirements are referred to as customer attributes.
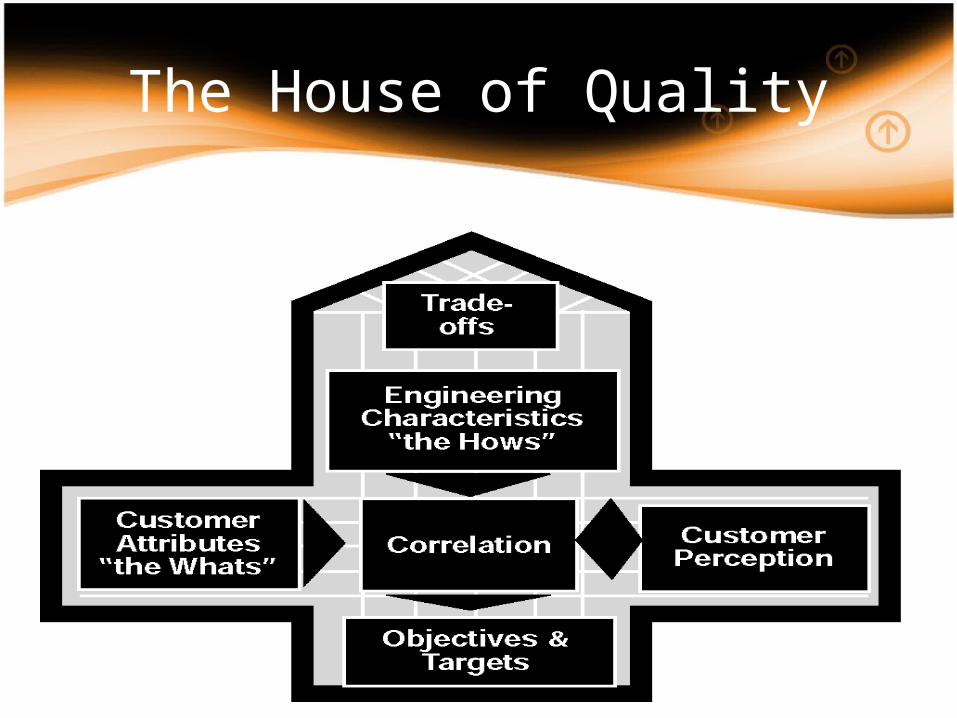
The House of Quality
Concept Engineering (CE)
• This emerged from a consortium of companies that included Polaroid and Bose along with researchers at MIT, and is promoted and taught by the Center for Quality Management.
• It is a focused process for discovering customer requirements and using them to select superior product or service concepts that meet those requirements.
5 Major Steps (CE)
• Understanding the customer’s environment• Converting understanding into requirements• Operationalizing what has been learned.• Concept generation• Concept selection

Design Failure Mode and Effects Analysis (DFMEA)
• The purpose of DFMEA is to identify all the ways in which a failure can occur, to estimate the effect and seriousness of the failure, and to recommend corrective design actions.
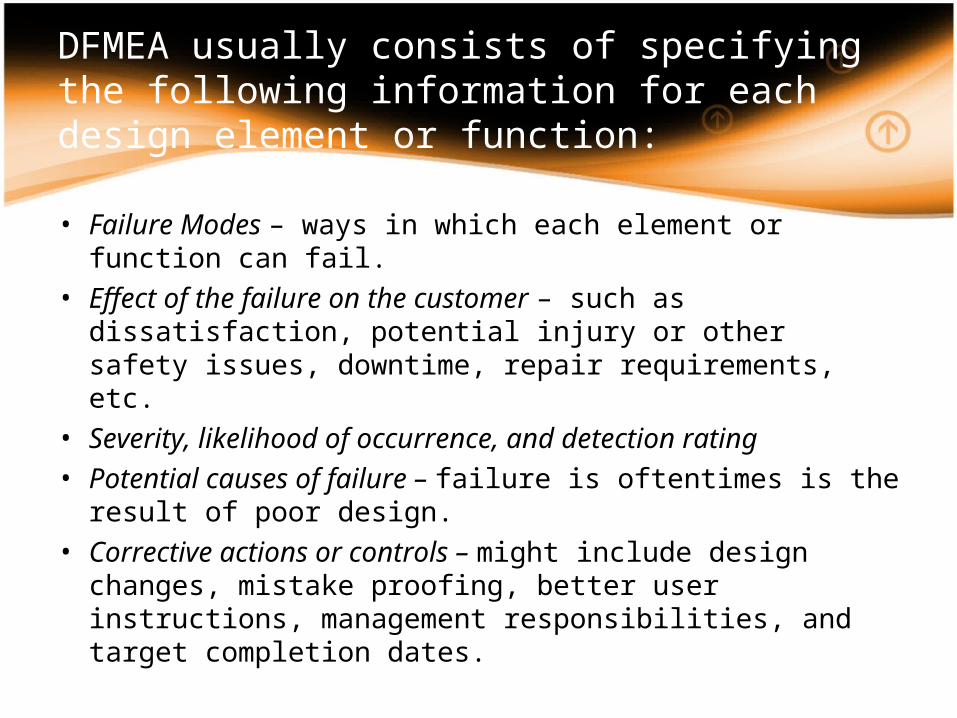
DFMEA usually consists of specifying the following information for each design element or function:
• Failure Modes – ways in which each element or function can fail.
• Effect of the failure on the customer – such as dissatisfaction, potential injury or other safety issues, downtime, repair requirements, etc.
• Severity, likelihood of occurrence, and detection rating • Potential causes of failure – failure is oftentimes is the result
of poor design.• Corrective actions or controls – might include design changes,
mistake proofing, better user instructions, management responsibilities, and target completion dates.
Tools for Quality Planning• Planning is one of the basic functions of every
manager. Because of the complexity of today’s business environment, planning is not always easy to do. However, various tools have been developed by several Japanese companies over the last half-century as part of their planning processes.

Affinity Diagram / KJ Method
• This is a technique for gathering and organizing a large number of ideas, opinions, and facts relating to a broad problem or subject area. It enables problem solvers to sift through large volumes of information efficiently and to identify natural patterns or groupings in the information.
• It was developed in the 1960s by Kawakita Jiro.
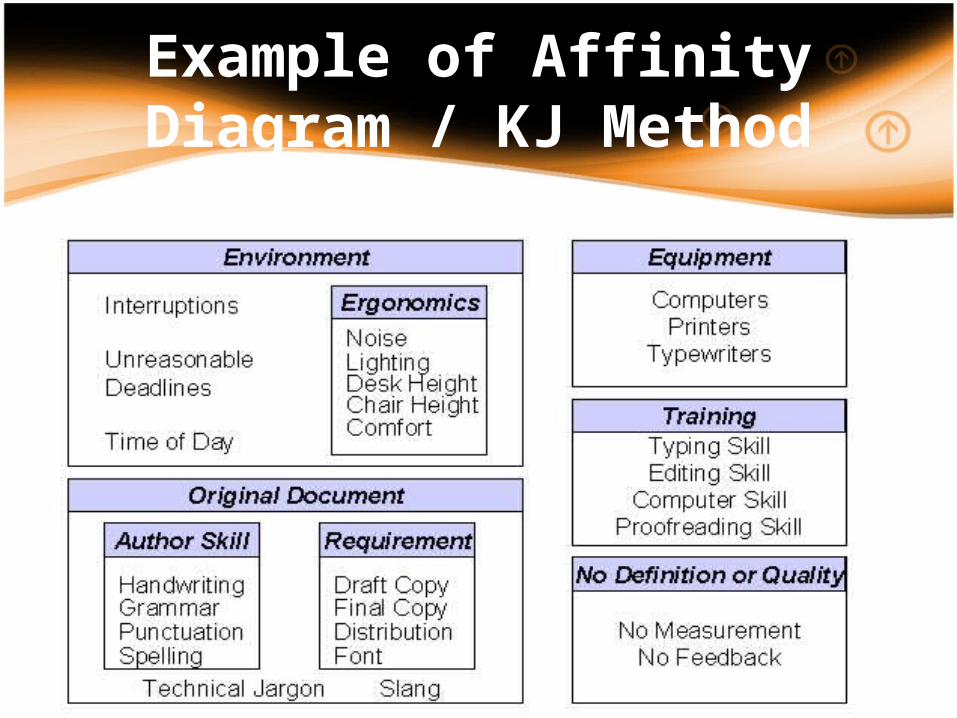
Example of Affinity Diagram / KJ Method
Interrelationship Digraphs
• The purpose of an interrelationship digraph is to take a central idea and map out logical or sequential links among related categories. It shows that every idea can be logically linked with more than one idea at a time.
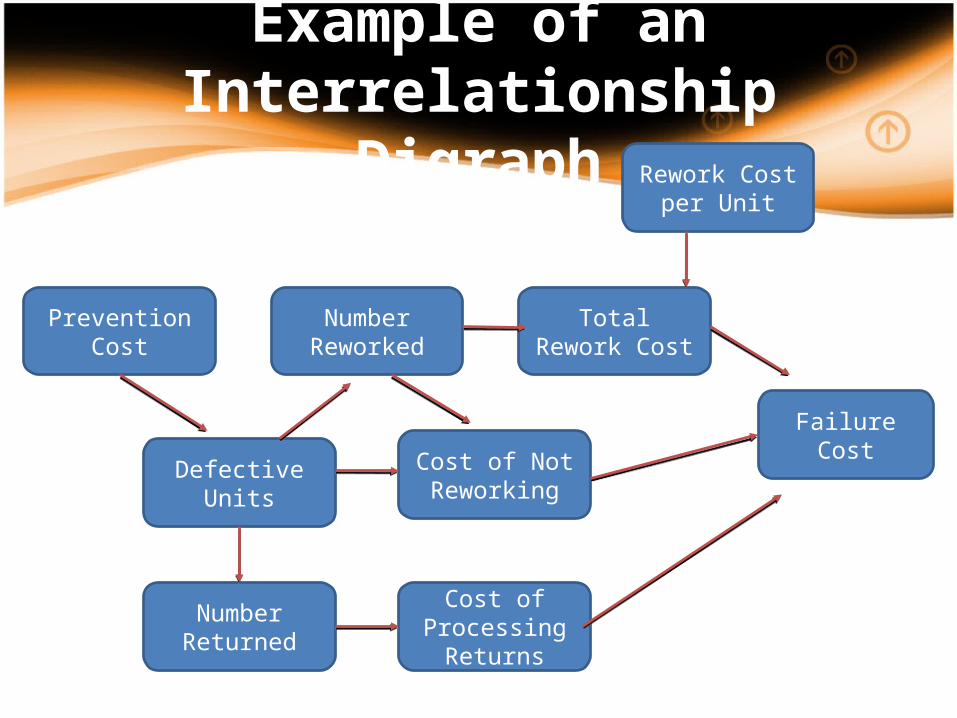
Example of an Interrelationship Digraph
Prevention Cost
Number Returned
Total Rework Cost
Cost of Not Reworking
Number Reworked
Defective Units
Cost of Processing
Returns
Rework Cost per Unit
Failure Cost
Tree Diagram
• This maps out the paths and tasks that need to be accomplished to complete a specific project or to reach a specified goal.
• A planner uses this technique to seek answers to such answers to questions such as “what sequence of tasks needs to be completed to address the issue?” or “what are all of the factors that contribute to the existence of the key problem?”

Example of a Tree Diagram
Matrix Diagrams
• Lorem ipsum dolor sit amet, consectetuer adipiscing elit. Vivamus et magna. Fusce sed sem sed magna suscipit egestas.
• Lorem ipsum dolor sit amet, consectetuer adipiscing elit. Vivamus et magna. Fusce sed sem sed magna suscipit egestas.

Example of a Matrix Diagram
Matrix Data Analysis
• This process takes data from matrix diagrams and seeks to arrange it quantitatively to display the strength of relationships among variables so that they can be easily viewed and understood.

Process Decision Program Chart (PDPC)
• This is a method for mapping out every conceivable event and contingency that can occur when moving from a problem statement to possible solutions.
• It is used to plan for each possible chain of events that could occur when a problem or goal is unfamiliar.

Arrow Diagrams
• These have been used by construction planners for years in the form of CPM and PERT project planning techniques.

Tools for Continuous Improvement• Many tools have been created or adapted from
other disciplines to facilitate the process of continuous improvement.
• Seven simple statistically based tools are used extensively to gather and analyze data. These are known as the Tools for Process Analysis. Historically, these tools receded the seven management and planning tools and often are called the “Seven QC Tools” and later on have been referred to as the “New Seven.”
Flowcharts
• This is a picture of a process that shows the sequence of steps performed. It is also called a process map.

Exam
ple
of a
Flo
wch
art
Check Sheets
• These are data collection forms that facilitate the interpretation of data. Quality-related data are of two general types: Attribute Data (obtained by counting or from some type of visual inspection) and Variable Data (collected by numerical measurement on a continuous scale.

Histograms
• This is a graphical representation of the variation in a set of data. It shows the frequency or number of observations of a particular value or within a specified group.
• It provides clues about the characteristics of the population from which a sample is taken.

Pareto Diagrams
• Pareto analysis is a technique for prioritizing types or sources of problems. It separates the “vital few” from the “trivial many” and provides help in selecting directions for improvement.

Example of a Pareto Diagram

Cause-and-Effect Diagrams
• The most useful tool for identifying the causes of problems.
• It is also known as a Fishbone Diagram or Ishikawa Diagram.
• It is simply a graphical representation of an outline that presents a chain of causes and effects.

Example of a Cause-and-Effect Diagram

Scatter Diagrams
• Scatter diagrams illustrate relationships between variables. Typically the variables represent possible causes and effects obtained from cause-and-effect diagrams.

Control Chart
• Control charts are considered as the backbone of statistical process control and were first proposed by Walter Shewhart.
Poka-Yoke
• This is an approach for mistake-proofing processes using automatic devices or methods to avoid simple human error. The idea is to avoid repetitive tasks or actions that depend on vigilance or memory in order to free workers’ time and minds to pursue more creative and value-adding activities.