tobin’s q does not measure performance: theory, empirics ... · pdf filetobin’s q...
TRANSCRIPT
Electronic copy available at: http://ssrn.com/abstract=1562444
Tobin’s Q Does Not Measure Performance: Theory,
Empirics, and Alternative Measures∗
Philip H. Dybvig†and Mitch Warachka‡
March 2010
Abstract
Although empirical studies often use Tobin’s Q as a proxy for operating perfor-
mance, our theoretical framework highlights its ambiguity when evaluating corporate
governance. In particular, capital in the denominator of Tobin’s Q is endogenous since
entrenched managers can enjoy the quiet life and underinvest (Bertrand and Mul-
lainathan, 2003). Firms that underinvest operate below their firm’s profit-maximizing
scale. Despite reducing a firm’s net present value, underinvestment increases Tobin’s
Q. Furthermore, strong governance can either decrease Tobin’s Q by mitigating un-
derinvestment or increase Tobin’s Q by lowering costs. Therefore, the net impact of
governance on Tobin’s Q is ambiguous. Our framework then provides measures of
operating efficiency to assess a firm’s scale decisions and cost discipline. These mea-
sures capture the benefits of acquisitions that improve scale and lower costs as well
as the inefficiencies associated with empire building. Their estimation confirms that
underinvestment is responsible for inflating Tobin’s Q.
∗We thank Nina Baranchuk, Lauren Cohen, Long Chen, Vidhi Chhaochharia, Alex Edmans, Fangjian
Fu, Vidhan Goyal, Bruce Grundy, Jay Hartzell, Mike Lemmon, Angie Low, Michelle Lowry, James Ohlson,
Robert Prilmeier, Neal Stoughton, Rong Wang, and Yajun Wang for their helpful comments and suggestions.†Boatmens Bancshares Professor of Banking and Finance, Washington University in Saint Louis, Olin
School of Business, Campus Box 1133, One Brookings Drive, Saint Louis, MO 63130-4899. Email:
[email protected]‡Singapore Management University, L.K.C. School of Business, 50 Stamford Road, 178899, Singapore.
Email: [email protected]
1

Electronic copy available at: http://ssrn.com/abstract=1562444
1 Introduction
Empirical finance often requires proxies for variables of interest. However, proxies must be
chosen carefully since inappropriate proxies can cause a hypothesis to be spuriously rejected
or accepted. Indeed, proxies result in joint tests of the stated hypotheses and the validity of
the chosen proxies. Ideally, empirical proxies would originate from a theoretical model that
justifies their use under different assumptions.
Tobin’s Q is a widely used proxy for operating performance in studies of corporate gov-
ernance. For example, Gompers, Ishii and Metrick (2003) conclude that firms with more
shareholder rights are better governed since they have a higher Tobin’s Q.1 Yermack (1996)
also analyzes board performance using Tobin’s Q, while Anderson and Reeb (2003) employ
Tobin’s Q to examine the governance of family firms.
This paper provides a theoretical framework to highlight an endogeneity problem when
Tobin’s Q is used to measure the economic implications of corporate governance. Our frame-
work then offers a solution to this endogeneity problem by examining managerial decisions
regarding scale and cost discipline. For the single-product firm in our framework, scale is
defined as the number of units produced. The operating efficiency measures we propose are
based on revenue, to assess scale decisions, and costs. Our theoretically-motivated proxies
originate from the maximization of firm value net of invested capital, hence the maximization
of a firm’s net present value, and are also consistent with recent empirical research.
Intuitively, normalizing firm value by a proxy for capital in the denominator of Tobin’s
Q controls for the resources transferred from investors to management. Unfortunately, when
evaluating governance, capital is endogenous because of its dependence on governance. In
particular, entrenched managers can enjoy the quiet life and underinvest (Bertrand and
Mullainathan, 2003). Firms that underinvest operate below their firm’s profit-maximizing
scale. Higher profit margins, a lower likelihood of being fired due to negative demand shocks,
and the need for less monitoring make underinvestment attractive to managers while lowering
the denominator of Tobin’s Q. Our framework demonstrates that underinvestment, which
1In an earlier study, Morck, Shleifer, and Vishny (1988) interpret the non-monotonic relationship between
managerial ownership and Tobin’s Q as evidence that managerial ownership has countervailing influences on
corporate governance.
2

Electronic copy available at: http://ssrn.com/abstract=1562444
corresponds to weak governance, increases Tobin’s Q. Consequently, underinvestment can
inflate Tobin’s Q.
More formally, the ideal manager in our framework maximizes their firm’s market value
net of invested capital. Operating at a suboptimal scale and lax cost discipline result in
deviations from this objective. Underinvestment restricts output below the firm’s optimal
scale, and results in a proportional reduction in capital but a less than proportional reduction
in revenue since demand curves are downward sloping. Specifically, as marginal revenue
decreases with output, operating at a suboptimal scale causes the ratio of market value
divided by capital, hence Tobin’s Q, to be higher than optimal. Indeed, while investment is
optimal until its marginal benefit is zero, restricting investment increases its average benefit,
hence Tobin’s Q. As a simple numerical illustration, consider a firm with a Tobin’s Q of
1.5 whose $15 market value is based on a capital investment of $10. If the firm initiates a
project requiring $20 of additional capital that increases its market value by $24, Tobin’s Q
declines from 1.5 to 1.3, ($15 + $24) / ($10 + $20). Thus, despite its positive net present
value of $4, this investment lowers Tobin’s Q.
Our framework highlights two conflicting implications of corporate governance on Tobin’s
Q. First, strong governance can decrease Tobin’s Q by mitigating underinvestment. Second,
strong governance can also increase Tobin’s Q by improving cost discipline. Therefore, the
net impact of governance on Tobin’s Q is ambiguous as it depends on the relative importance
of scale decisions versus cost discipline. Scale decisions are especially important for firms
whose products have steep downward sloping demand curves.2
Similarly, return on assets is ambiguous with respect to corporate governance. A high
return on assets can either be attributed to underinvestment or stringent cost discipline that
signify weak and strong governance, respectively. The ambiguous influence of governance on
Tobin’s Q and return on assets leads us to propose separate measures of operating efficiency
based on revenue, which reflects managerial decisions regarding scale, and cost discipline.
Although these operating efficiency measures normalize revenue and costs by capital, they
both decrease with stronger governance. In particular, a low revenue-to-capital ratio is
2A downward sloping demand curve is equivalent to the firm earning some monopoly rents in its respective
product market.
3
consistent with managers maximizing firm value net of capital by choosing an output level
that ensures marginal revenue equals marginal cost.
Our framework’s assumption that weak assumption that weak governance leads to un-
derinvestment is motivated by prior empirical research. Bertrand and Mullainathan (2003)
report that entrenched managers enjoy the quiet life by underinvesting.3 Aggarwal and
Samwick (2006) confirm that weak governance results in underinvestment and conclude that
managers incur private costs when investing such as the need for additional monitoring.
John and Knyazeva (2006) also report that weak corporate governance leads to underinvest-
ment. Furthermore, after an exogenous increase in managerial entrenchment, Low (2009)
finds evidence of greater managerial conservatism. The second assumption that weak gover-
nance results in poor cost discipline also originates from prior empirical research. Cronqvist,
Heyman, Nilsson, Svaleryd, and Vlachos (2009) conclude that entrenched managers obtain
private benefits by paying higher wages, while Core, Holthausen, and Larcker (1999) find
that weaker corporate governance results in higher CEO compensation. Giroud and Mueller
(2009) provide additional evidence that weak governance leads to higher costs.
Graham, Lemmon, and Wolf (2002) find that target firms have lower normalized valua-
tions than acquiring firms. This finding is consistent with managers focusing on the marginal
benefit of acquisitions, and challenges the assumption that acquisitions destroy value simply
by lowering the combined entity’s average valuation. This conclusion parallels our frame-
work’s implication that increasing output until marginal profits are zero reduces Tobin’s
Q. The theoretical framework of Maksimovic and Phillips (2001, 2002) also has managers
allocating resources to ensure that marginal profits are zero.
Our operating efficiency measures are able to capture the benefits of increased scale
and cost-savings arising from acquisitions. Alternatively, if managers assemble a collection
of inefficient enterprises that increase firm size without improving operating efficiency, our
measures are compatible with Jensen and Meckling (1976)’s empire building hypothesis.
While our framework investigates a single-product firm, the operating efficiency of a con-
3Our framework is designed for measuring the governance implications of individual firms. At the coun-
try level, cross-sectional differences in legal environments are more likely to capture variation in capital
investment and its productivity.
4
glomerate is the combined operating efficiency of its individual divisions (products). Thus,
a combination of inefficient enterprises is identified as being inefficient by our measures of
operating efficiency.
Our operating efficiency measures are not intended to replace existing proxies for corpo-
rate governance since operating efficiency is the result of governance. The corporate gover-
nance index of Gompers, Ishii, and Metrick (2003), abbreviated as the G index hereafter,
assigns firms a score between zero and twenty-four by counting the number of their charter
provisions that inhibit the replacement of management. Firms with a higher G index are are
labelled dictatorship firms as their shareholders have less rights. Gompers, Ishii, and Metrick
(2003) report that firms with a higher G index have a lower Tobin’s Q, while Cremers and
Nair (2005) report that the G index complements internal governance mechanisms such as
the presence of large investors. However, the G index is not designed to capture impor-
tant dimensions of governance such as board independence. Besides the G index, which is
not theoretically-motivated, we also use institutional ownership to proxy for corporate gov-
ernance since institutional investors can improve governance by facilitating takeovers and
thereby enhance the market for corporate control (Shleifer and Vishny, 1986).4 Nonetheless,
proxies for corporate governance are only invoked to verify our assumptions that stronger
governance coincides with less underinvestment and lower costs. Proxies for governance are
not required to examine the relationship between operating efficiency and Tobin’s Q that
defines our main empirical contribution.
Our operating efficiency measures are estimated using COMPUSTAT data. These mea-
sures are interpreted using a cross-sectional comparison of firms within Fama and French
(1997) industry classifications. Our empirical analysis finds that differences in operating effi-
ciency are captured by the G index and institutional ownership. Specifically, a high G index
and low institutional ownership, which correspond to weak governance, are associated with
underinvestment and high costs. Moreover, Tobin’s Q is lower for firms with better operating
efficiency. This finding indicates that decisions regarding scale are crucially important as
4High managerial ownership can either mitigate agency problems or inhibit the market for corporate
control. Although earnings management can signify weak governance, well governed firms may manage
earnings to lower their cost of capital.
5

underinvestment appears to inflate Tobin’s Q in our sample. Overall, stronger governance
improves operating efficiency but better operating efficiency does not improve Tobin’s Q.
The remainder of this paper formalizes our framework in Section 2. The operating
efficiency measures derived from this framework are then estimated in Section 3, while Section
4 contains our conclusions and suggestions for future research.
2 Theoretical Framework
Our intention is to provide a general framework for analyzing the economic implications of
corporate governance rather than construct a detailed structural model. In our framework,
corporate managers are entrusted with two crucial tasks. They determine their firm’s scale
and control its costs. Therefore, management determines the number of units of output
denoted y and per unit costs denoted c, where c0 > 0 denotes the lowest possible cost to
produce a single unit of output. With c being constant, the firm’s total costs equals cy.
The assumption that total costs are linear in output is a local approximation. Further-
more, the novel implications of our framework regarding Tobin’s Q arise from scale decisions
rather than cost discipline. Nonetheless, monopoly power often stems from economies of
scale that imply c is a decreasing function of output. Thus, economies of scale reinforce the
negative implications of underinvestment.
The amount of capital required to produce one unit of output equals k > 0. A linear
production function implies the total amount of required capital to produce y units of output
equals ky. Consequently, capital depends on a firm’s corporate governance through its
dependence on output.
The price of the firm’s output is determined by managerial decisions regarding its level
of output since firms are assumed to earn some monopoly rents in their respective product
market. The following demand function determines the price (per unit) of the firm’s output
Price(y) = P0 −y
2a. (1)
The a parameter in this downward-sloping demand function links prices with output, with
a large a parameter indicating that prices are insensitive to output.
6

2.1 Tobin’s Q
As revenue equals output y times the price in equation (1), revenue minus costs equals
y(P0 − y
2a
)− cy. This quantity represents the firm’s earnings. With the discount rate for
future cashflows equaling r, these per period earnings yield a market value of5
M(y, c) =∞∑i=1
y(P0 − y
2a
)− cy
(1 + r)i=
y (P0 − c)− y2
2a
r, (2)
while normalizing this market value by capital, ky, yields Tobin’s Q
Q(y, c) =P0 − c− y
2a
kr. (3)
Observe that Tobin’s Q is a decreasing function of output as the partial derivative ∂Q∂y
equals
− 12a
. Thus, Tobin’s Q is more sensitive to output when prices are more sensitive to out-
put. Moreover, corporate governance has an ambiguous influence on Tobin’s Q. Specifically,
stronger governance decreases c while increasing y, which causes Tobin’s Q to increase and
decrease, respectively.6 Therefore, the net influence of governance on Tobin’s Q is ambigu-
ous. Nonetheless, provided scale decisions are important, stronger governance can decrease
Tobin’s Q.
In empirical applications that regress Tobin’s Q on proxies for corporate governance,
including proxies for capital as independent variables does not alleviate the ambiguity sur-
rounding the governance coefficients. Furthermore, underinvestment pertains to the differ-
ence between a firm’s optimal scale and the scale chosen by management. However, only
proxies for the the capital chosen by management are observable.
Finally, as stronger governance results in lower costs and lower marginal revenue, the net
impact of governance on any capital-adjusted profitability metric is ambiguous. Indeed, with
operating profit being approximately equal to revenue minus costs, return on assets (ROA)
is proportional to the difference between our operating efficiency measures; Ry − Rc, since
ROA is defined as operating profit normalized by total assets. Thus, ROA is ambiguous
with respect to governance. For example, a high ROA can be attributed to a high Ry, which
5Core, Guay, and Rusticus (2006) document that expected stock returns are not sensitive to governance.6The lower bound for c is c0 while an upper bound for y is provided in the next subsection.
7

signifies weak governance, or a low Rc, which signifies strong governance.7 Consequently,
while Ry and Rc are both decreasing functions of governance, the existing literature examines
the difference between these measures despite the ambiguity of this difference with respect
to governance.
2.2 Operating Efficiency
Our framework does not examine the incentive contracts required to mitigate underinvest-
ment and improve cost discipline. This issue is examined in Aggarwal and Samwick (2006) as
well as Low (2009). Instead, our analysis proposes operating efficiency measures to capture
the economic implications of corporate governance by identifying underinvestment and lax
cost discipline.
Our ideal manager maximizes their firm’s market value minus the invested capital
maxc,y
M − ky = maxc,y
y (P0 − c− rk)− y2
2a
r. (4)
This objective function is equivalent to maximizing the firm’s net present value (NPV).
Equation (4) is a concave function with respect to y that is maximized by
y∗ = a (P0 − c0 − rk) . (5)
Weak governance allows managers to underinvest by producing less than y∗ and to shirk
their responsibility to control costs by having c exceed c0. The maximization in equation (4)
is equivalent to maximizing
Revenue - Costs - rent on Capital
r=
y(P0 − y
2a
)− cy − rky
r, (6)
where the rental cost for capital equals rky. In contrast to the level of output a (P0 − c0)
that maximizes (Revenue - Costs)/ r, hence the firm’s market value M in equation (2),
incorporating the rent on capital yields y∗ in equation (5).
To clarify, investors want managers to produce a level of output that exploits the firm’s
monopoly power while setting marginal revenue equal to marginal cost. The optimal level
7When a fraction 0 ≤ f < 1 of the firm’s capital is financed by borrowing, its earnings is reduced by the
periodic borrowing cost of frky and generated from a lower capital investment of (1− f)ky.
8

of output y∗ is too low from the perspective of consumers but too high from the perspective
of entrenched managers that underinvest by producing below y∗.
Using the maximization in equation (4), we propose two operating efficiency ratios to
measure the economic implications of corporate governance. The first operating efficiency
measure is derived from revenue, defined as y(P0 − y
2a
)based on the demand function in
equation (1). The second measure is derived from costs.
The first operating efficiency ratio, Ry, isolates the impact of corporate governance on
managerial decisions regarding scale through revenue
Revenue
Capital=
y(P0 − y
2a
)ky
=P0 − y
2a
k≥ P0 + c0 + rk
2k, (7)
with the lower bound being independent of a after invoking y∗ from equation (5). The nor-
malization of revenue by capital ensures that Ry is a decreasing function of y. Observe that
the influence of corporate governance on Ry is not complicated by costs. Furthermore, while
y∗ defines the lower bound in equation (7), this lower bound is not required for empirical tests
since Ry is decreasing with stronger governance. More importantly, measuring deviations
between y and y∗ is unnecessary.
The second operating efficiency ratio, Rc, isolates the impact of corporate governance on
costs
Costs
Capital=
cy
ky=
c
k≥ c0
k. (8)
The normalization of costs by capital ensures that Rc is not complicated by management
decisions regarding output. This ratio is smaller for firms with stronger governance since
c decreases with stronger governance. Moreover, measuring deviations between c and c0 is
unnecessary.
Ang, Cole, and Lin (2000) estimate a sales-to-assets ratio that parallels Ry. However, as
this ratio is not theoretically motivated, they interpret a high sales-to-assets ratio as evidence
of low agency costs due to high managerial effort. This interpretation does not recognize that
marginal revenue is a decreasing function of output. Moreover, their empirical methodology
is based on the assumption that firms owned entirely by management have zero agency
costs. Therefore, despite the high concentration of managerial wealth in these firms, their
9

benchmark does not allow managerial conservatism to be suboptimal and manifest itself
through underinvestment.
The optimal Tobin’s Q in our framework, denoted Q∗, equals
Q∗ =P0 − c0 − (y∗)2
2a
kr. (9)
However, our intention is not to provide a detailed structural model that is sufficient to
estimate Q∗. More importantly, managers are expected to have better information regarding
demand and costs than investors. Indeed, one motivation for managers to underinvest is
the inability of investors to accurately differentiate between unpredictable negative demand
shocks and poor management. If investors are able to easily estimate y∗ and c0, then they
could simply devise a contract that requires managers to produce the optimal number of
units at the lowest possible cost. Our framework recognizes that Q∗ is difficult to estimate
and does not require the estimation of y∗ and c0.
Finally, the maximization in equation (4) provides an alternative measure of operating
efficiency as the difference between a firm’s market value and its capital. However, discount
rate innovations, which can arise from changes in the market’s risk premium, affect market
valuations but not operating efficiency. Instead, revenue and costs capture realized operating
efficiency while market valuations manifest a multitude of factors that determine cashflow
expectations beyond governance. Furthermore, according to equation (2), the earnings-to-
price ratio equals r as governance influences both its numerator and denominator. Therefore,
the earnings-to-price ratios is independent of governance.
2.3 Robustness of Operating Efficiency Measures
Acquisitions can improve operating efficiency through synergies and cost-savings. Conversely,
acquisitions can reduce operating efficiency by creating a collection of diverse enterprises with
insufficient scale. While our framework investigates a single-product firm, the combined op-
erating efficiency of two divisions equals their combined efficiency. Specifically, the combined
10
revenue-based operating efficiency measure for two divisions equals
Combined Revenue
Combined Capital=
y1
(P0 − y1
2a1
)+ y2
(P0 − y2
2a2
)ky1 + ky2
≥(
y1
y1 + y2
)P0 + c0 + rk
2k+
(y2
y1 + y2
)P0 + c0 + rk
2k
=P0 + c0 + rk
2k.
Thus, for a conglomerate, a lower Ry measure continues to signify better operating efficiency
in terms of scale. Similarly, the following holds for our cost-based measure of operating
efficiency
Combined Costs
Combined Capital=
c1y1 + c2y2
ky1 + ky2
≥ c0
k
(y1
y1 + y2
)+
c0
k
(y2
y1 + y2
)=
c0
k.
Therefore, our operating efficiency measures are valid for conglomerates.
Nonetheless, our framework has two limitations. First, weak governance may allow man-
agers to utilize an excess amount of capital while simultaneously producing a suboptimal
amount of output. This “overinvestment” in unproductive capital is identifiable through a
normalization of capital by output to facilitate a comparison of k across firms. However,
y is not reported in standard financial databases and is difficult to compare across firms
that have some monopoly power in their respective product market. Nonetheless, our cross-
sectional comparisons are unlikely to be compromised by all managers utilizing excess capital
and having low Ry and Rc metrics as a consequence. As demonstrated in the next section,
heterogeneity in firm-level governance validates cross-sectional comparisons of operating ef-
ficiency.
Second, capital structure is not examined. Berger, Ofek, and Yermack (1997) find ev-
idence that managers may play it safe by issuing a suboptimal amount of debt. However,
Stulz (1990) allows managers to entrench themselves by issuing too much debt. The uncer-
tainty surrounding the role of debt in corporate governance is one motivation for leaving its
introduction into our framework for future research.
11

3 Empirical Implementation
We focus our empirical relationships between corporate governance, operating efficiency, and
Tobin’s Q. Although Gompers, Ishii, and Metrick (2003) attempt to link corporate gover-
nance with stock returns, Core, Guay, and Rusticus (2006) find no evidence that governance
influences expected returns.
Our first empirical analysis utilizes the G index and institutional ownership to proxy for
corporate governance. This analysis is intended to verify the assumptions of our reduced
form model that strong governance improves operating efficiency. Our second empirical
analysis determines the response of Tobin’s Q to operating efficiency. This second analysis
implicitly tests the relative importance of scale decisions, and consequently sheds light on
the appropriateness of using Tobin’s Q to measure the economic implications of corporate
governance.
3.1 Data
COMPUSTAT data is used to estimate our operating efficiency measures and Tobin’s Q.
Total assets is our primary proxy for capital. The numerator of Tobin’s Q is computed as
total assets plus the market value of equity minus the book value of equity. As the standard
definition of Tobin’s Q has assets in its denominator, we also use assets as a proxy for capital
in the denominator of our operating efficiency ratios for consistency.
Revenue (REVT) proxies the numerator of Ry in equation (7) while several expenses
comprise the numerator of Rc in equation (8). These costs include expenses for advertising
(XAD), sales and administration (XSGA), staff (XLR), and rent (XRENT). Cost of goods
sold (COGS) is used to define return on assets but is excluded from the numerator of Rc
given the high correlation between COGS and revenue. Intuitively, a firm’s total cost cy
consists of two components; COGS plus expenses, with Rc defined by expenses to prevent
Rc and Ry from being too highly correlated.
The G index in 1990, 1993, 1995, 1998, 2000, 2002, and 2004 is obtained from the Investor
Responsibility Research Center (IRRC).8 Quarterly institutional ownership data is obtained
8Institutional Shareholder Services produces the Corporate Governance Quotient (CGQ) that evaluates
12

from 13f filings with the SEC and are averaged within each year. A total of 10,792 firm-year
observations are available for our empirical study.
Four digit SIC codes are obtained from CRSP to implement the 49 industry classifica-
tions in Fama and French (1997). Bizjak, Lemmon, and Nguyen (2009) use these industry
classifications in their study of CEO compensation and relative performance. The operating
efficiency measures Ry and Rc are standardized within these industries. Thus, positive and
negative operating efficiency ratios represent above-average and below-average operating ef-
ficiency relative to a firm’s industry, respectively. This normalization relaxes the assumption
that k and c are identical across different industries. We also remove firms in the banking,
insurance, real estate, and financial trading industries.
Table 1 reports industry-level averages for Tobin’s Q and ROE as well as the three proxies
for corporate governance and our operating efficiency measures. In Table 1, the operating
efficiency measures are not normalized within individual industries. The results in Table
1 confirm that Tobin’s Q and ROA as well as operating efficiency vary across industries,
while the corporate governance proxies exhibit less industry-level variation. Furthermore,
the standard deviations in Panel B reveal considerable variation in operating efficiency within
individual industries. This property justifies our later cross-sectional comparisons of oper-
ating efficiency within these industries.
Panel A of Table 2 summarizes the distribution across firms of Tobin’s Q and ROE as well
as the proxies for corporate governance and operating efficiency. The operating efficiency
measures Ry and Rc are both normalized within each industry using their respective mean
and standard deviation. Panel B reports on the correlations between these variables and
also evaluates their respective correlations with market value. With Tobin’s Q being highly
positively correlated with ROA, we focus our empirical analysis on Tobin’s Q. Panel B also
indicates that more shareholder rights (low G index) and higher institutional ownership
coincide with lower Ry measures, hence better operating efficiency. These relationships are
explored more thoroughly in the next subsection. Furthermore, the positive correlation
firm characteristics in eight categories; audit, board, charter/bylaws, director education, executive and direc-
tor compensation, ownership, progressive practices, and state of incorporation. The G index is concentrated
in the charter/bylaws category.
13

between Ry and Rc confirms our framework’s implicit assumption that underinvestment
coincides with poor cost discipline. Although market capitalization is not highly correlated
with the other variables in our study, large firms tend to have better operating efficiency in
terms of scale and slightly worse operating efficiency in terms of cost discipline.
3.2 Hypotheses and Tests
To evaluate the relationship between corporate governance and operating efficiency, we esti-
mate the following regression specification
Ry = α0 + α1 G + α2 IO + γ X + ε , (10)
where G and IO denote the G index and institutional ownership, respectively. The X vector
denotes industry and time dummy variables along with the log of total assets and the log
of market capitalization that serve as control variables. Standard errors are clustered at the
firm level. The above regression is also repeated with Rc as the dependent variable instead
of Ry.
A positive α1 coefficient indicates that a high G index captures the operating inefficiencies
associated with weak governance, while a negative α2 coefficient indicates that lower insti-
tutional ownership, hence weaker governance, also coincides with poor operating efficiency.
These respective coefficients verify the assumptions underlying our reduced-form framework.
Table 3 reports on the coefficient estimates in equation (10). The positive coefficients
for the G index and negative coefficients for institutional ownership indicate that these
governance proxies capture operating efficiency. For example, firms with a high G index and
low institutional ownership, which are associated with weak corporate governance, appear
to underinvest.9 Higher institutional ownership also coincides with greater cost discipline.
In unreported results, a regression of ROA on the G index
ROA = α0 + αROA G + ε , (11)
produces an αROA estimate of -0.0020 (t-statistic of -2.17). As in the existing literature, this
negative coefficient indicates that firms with more shareholder rights earn a higher return
9Institutional investors may invest in firms with stronger governance rather than improve governance.
Chung and Zhang (2009) report that institutional investors gravitate towards firms with strong governance.
14

on assets. The numerator of ROA is defined as revenue minus cost of goods sold (COGS)
minus the expenses that define the numerator of Rc in equation (8). Consequently, ROA
equals Ry − Rc̃ where Rc̃ = COGSAssets + Rc. When the dependent variable ROA in equation
(11) is replaced with Ry and Rc̃,
Ry = α0 + αRy G + ε
Rc̃ = α0 + αRc̃G + ε
the equality ROA=Ry − Rc̃ implies that αROA = αRy − αRc̃. Indeed, the estimates for
αRy and αRc̃are 0.0055 (t-statistic of 2.04) and 0.0075 (t-statistic of 3.09), respectively.
Thus, the inverse relationship between the G index and ROA is attributable to Rc̃ having a
larger coefficient than Ry when the high correlation between revenue and COGS is ignored.
Intuitively, a lower G index coincides with better operating efficiency in terms of scale and
cost discipline, with the greater sensitivity of the latter yielding an inverse relationship
between ROA and the G index.
We estimate the following regression specification to examine the relationship between
Tobin’s Q and operating efficiency
Q = β0 + βy Ry + βc Rc + γ X + ε . (12)
The X vector industry and time dummy variables, while the standard errors of the regression
coefficients are clustered at the firm level. Total assets and market capitalization are not
included as control variables since they define the numerator and denominator of Tobin’s Q.
Instead, the G index and institutional ownership are included as control variables, although
their presence exerts little influence on the βy and βc estimates.
A positive βy coefficient is consistent with underinvestment, specifically poor operat-
ing efficiency with respect to scale, being able to increase Tobin’s Q. Thus, a positive βy
coefficient indicates that a high Tobin’s Q is not evidence of strong governance.
Panel A of Table 4 reports the estimates from equation (12). The positive βy coefficients
indicate that Tobin’s Q is higher for firms with lower operating efficiency in terms of scale.
Consequently, this finding is inconsistent with the prior literature’s interpretation of Tobin’s
Q when evaluating the economic implications of governance. The regression specification in
15

equation (12) controls for the correlation between our measures of operating efficiency. After
controlling for Ry, the negative albeit insignificant βc coefficient is consistent with better
cost discipline increasing Tobin’s Q. Overall, underinvestment appears to exert a greater
influence on Tobin’s Q than cost discipline. Specifically, a large Ry ratio, which corresponds
with poor operating efficiency, coincides with a high Tobin’s Q. This finding challenges the
existing corporate governance literature’s interpretation of Tobin’s Q that assumes strong
governance increases Tobin’s Q.
Panel B of Table 4 is intended to provide additional intuition regarding the importance
of scale decisions. In Panel B, we report the five industries with the largest and smallest βy
coefficients after estimating equation (12) at the industry-level rather than the entire cross-
section of firms. The five industries with the largest five βy coefficients have significantly
positive βy coefficients and include publishing, computer hardware, as well as retail. These
large positive coefficients may arise from the uniqueness of their products, which allows
managers to benefit more from underinvestment. Unreported results find that over 50% of
the industries have significantly positive coefficients (at the 10% level). Panel B of Table 4
reports that the five lowest βy coefficients are negative, albeit insignificant.
3.3 Robustness Tests
Several robustness tests verify our conclusion that better operating efficiency does not in-
crease Tobin’s Q due to underinvestment.
Instead of using industry-level averages, our first robustness test industry-adjusts the
firm-level operating efficiency measures using deviations from their respective industry-level
minimum. These deviations from the minimum Ry and Rc ratio in an industry are then
standardized by each industry’s largest deviation from its minimum to ensure that large
outliers (very inefficient firms) are not unduly influencing the regression coefficients. In
particular, the normalized Ry ratios are defined as follows
Riy −min
(R1
y, . . . , Rny
)j
max(R1
y, . . . , Rny
)j−min
(R1
y, . . . , Rny
)j
(13)
for firm i = 1, 2, . . . , n in industry j. An identical normalization is also applied to the Rc
ratios. The positive βy coefficient estimated from equation (12) reported in Table 5 confirms
16

that poor scale decisions under this alternative industry-adjustment increase Tobin’s Q.
Our second robustness test uses property, plant, and equipment (PPE) to proxy for
capital in the denominators of Ry and Rc, while total assets remains as the denominator of
Tobin’s Q. Table 5 confirms that using PPE as an alternative proxy for capital does alter
our conclusions regarding the impact of underinvestment on Tobin’s Q. In particular, the βy
coefficient remains significantly positive.
Furthermore, our findings are not driven by a subset of firms with extremely low or
extremely high assets. As total assets defines the denominator of Tobin’s Q as well as our
operating efficiency measures, a third robustness test removes firms whose total assets are
either below the 2nd percentile or above the 98th percentile. The βy coefficient of 0.068
(t-statistic of 2.89) estimated after their removal indicates that the relationship between
operating efficiency and Tobin’s Q is not driven by firms with extremely low or high assets.
To better understand the role of intangible assets such as patents on operating perfor-
mance, we classify firms according to the uniqueness of their assets. This firm characteristic
is defined in Berger, Ofek, and Yermack (1997) as R&D divided by revenue. In the absence of
stronger governance, provided firms with high R&D-to-revenue ratios produce more unique
products, they have greater monopoly power and consequently the potential for greater un-
derinvestment. Nonetheless, a high R&D-to-revenue ratio can also yield intangible assets
such as patents that lower costs. For firms in the highest asset uniqueness tercile, we re-
estimate the regression in equation (12) and find a large βy coefficient. Specifically, firms
with the highest R&D-to-revenue ratios have a βy coefficient of 0.107 (t-statistic of 2.17)
that is significantly higher than 0.064 in Table 4 for the entire cross-section of firms. Thus,
underinvestment appears to be more acute for firms with unique products.
Finally, Lindenberg and Ross (1981) document considerable variation in Tobin’s Q across
different industries. Therefore, besides the use of industry dummies, our fourth robustness
test examines industry-adjusted Tobin’s Q measures that use each industry’s respective mean
and standard deviation to normalize each firm’s Tobin’s Q. According to Table 5, the βy
coefficient remains significantly positive when these industry-adjusted Tobin’s Q metrics are
used as the dependent variable in equation (12).
Overall, the results in Table 5 confirm that better operating efficiency lowers Tobin’s
17

Q. Therefore, our theoretical framework and empirical analysis caution that a high Tobin’s
Q does not necessarily result from strong corporate governance. In unreported results, we
also confirm that underinvestment is unlikely to be attributable to financing constraints.
Specifically, firms with high Ry measures do not have abnormally low credit ratings that
could potentially prevent them from expanding their output.
4 Conclusion
We provide a simple theoretical framework to demonstrate that underinvestment by en-
trenched managers confounds the relationship between Tobin’s Q and corporate governance.
In particular, stronger corporate governance can decrease Tobin’s Q as well as return on
assets. Overall, the relationship between corporate governance and Tobin’s Q is ambiguous.
This ambiguity arises from managerial decisions regarding scale and cost discipline having
offsetting effects on Tobin’s Q.
Our framework then develops two unambiguous measures of operating efficiency. The first
measure uses revenue to assess managerial decisions regarding their firm’s level of output,
while the second measure uses costs to assess the cost discipline of management. These
operating efficiency measures are derived from the maximization of market value net of
invested capital.
Empirically, the corporate governance index in Gompers, Ishii, and Metrick (2003) and
institutional ownership capture cross-sectional differences in operating efficiency. In partic-
ular, firms associated with stronger governance exhibit better operating efficiency. However,
better operating efficiency lowers Tobin’s Q, a finding that is consistent with underinvest-
ment’s ability to inflate Tobin’s Q.
A number of issues remain for future research. Our framework can be extended by
introducing leverage as entrenched managers may play it safe by using a suboptimal amount
of debt. In addition, future empirical research can examine whether mergers improve or
reduce operating efficiency.
18
References
Aggarwal, R. K., and A. A. Samwick, 2006, Empire-builders and shirkers: Investment, firm
performance, and managerial incentives. Journal of Corporate Finance 12, 489-515.
Anderson, R. C., and D. M. Reeb, 2003, Founding-family ownership and firm performance:
Evidence from the S&P 500. Journal of Finance 58, 1301-1328.
Ang, J. S., R. A. Cole, and J. W. Lin, 2000, Agency costs and ownership structure. Journal
of Finance 55, 81-106.
Berger, P. G., E. Ofek, and D. L. Yermack, 1997, Managerial entrenchment and capital
structure decisions. Journal of Finance 52, 1411-1438.
Bertrand, M., and S. Mullainathan, 2003, Enjoying the quiet life? Corporate governance
and managerial preferences. Journal of the Political Economy 111, 1043-1075.
Bizjak, J., M. Lemmon, and T. Nguyen, 2009, Are all CEOs above average? An empirical
analysis of compensation peer groups and pay design. Working Paper.
Chung, K. H., and H. Zhang, 2009, Corporate governance and institutional ownership. Forth-
coming in Journal of Financial and Quantitative Analysis.
Core, J. E., W. R. Guay, and T. O. Rusticus, 2006, Does weak governance cause weak stock
returns? An examination of firm operating performance and investors’ expectations. Journal
of Finance 61, 655-687.
Core, J. E., R. W. Holthausen, and D. F. Larcker, 1999, Corporate governance, chief ex-
ecutive officer compensation, and firm performance. Journal of Financial Economics 51,
371-406.
Cremers, K. J. M., and V. B. Nair, 2005, Governance mechanisms and equity prices. Journal
of Finance 60, 2859-2894.
19

Cronqvist, H., F. Heyman, M. Nilsson, H. Svaleryd, and J. Vlachos, 2009. Do entrenched
managers pay their workers more? Journal of Finance 64, 309-339.
Fama, E. F., and K. R. French, 1997, Industry costs of equity. Journal of Financial Economics
43, 153-193.
Giroud, X., and H. M. Mueller, 2009, Does corporate governance matter in competitive
industries? Forthcoming in Journal of Financial Economics.
Gompers, P. A., J. L. Ishii, and A. Metrick, 2003, Corporate governance and equity prices.
Quarterly Journal of Economics 118, 107-155.
Graham, J. R., M. L. Lemmon, and J. G. Wolf, 2002, Does corporate diversification destroy
value? Journal of Finance 57, 695-720.
Jensen, M., and W. Meckling, 1976, Theory of the firm: Managerial behavior, agency costs,
and ownership structure. Journal of Financial Economics 3, 305-360.
John, K., and D. Knyazeva, 2006, Governance and conservatism in investment decisions.
Working Paper.
Lindenberg, E. B., and S. A. Ross, 1981, Tobin’s q ratio and industrial organization. Journal
of Business 54, 1-32.
Low, A., 2009, Managerial risk-taking behavior and equity-based compensation. Journal of
Financial Economics 92, 470-490.
Maksimovic, V., and G. Phillips, 2001, The market for corporate assets: Who engages in
mergers and asset sales and are there efficiency gains. Journal of Finance 56, 2019-2065.
Maksimovic, V., and G. Phillips, 2002, Do conglomerate firms allocate resources inefficiently
across industries? Theory and evidence. Journal of Finance 57, 721-767.
Morck, R., A. Shleifer, and R. W. Vishny, 1988, Management ownership and market valua-
tion. Journal of Financial Economics 20, 293-315.
Shleifer, A., and R. Vishny, 1986, Large shareholders and corporate control. Journal of the
Political Economy 94, 461-488.
20

Stulz, R., 1990, Managerial discretion and optimal financing policies. Journal of Financial
Economics 26, 3-26,
Yermack, D. L., 1996, Higher market valuation of companies with a smaller board of direc-
tors. Journal of Financial Economics 40, 185-211.
21
Table 1: Summary Statistics within Industries
Panel A and Panel B of this table reports industry-level averages and standard deviations,respectively, for Tobin’s Q, return on assets (ROA), the G index in Gompers, Ishii, and Metrick(2003), institutional ownership (IO), and our operating efficiency measures denoted Ry and Rc.These summary statistics are computed within the industry classifications of Fama and French(1997). The number of observations denoted N within each industry is also reported. Ouroperating efficiency measures Ry and Rc are defined in equation (7) and equation (8) as P0− y
2ak
and ck , respectively. The demand curve P0 − y
2a determines the output price, hence revenue,corresponding to output y conditional on its intercept P0 and the sensitivity of prices to outputdenoted a. The cost and capital associated with producing a single unit of output are denoted c
and k, respectively.
Panel A: Average firm characteristics
Industry N Tobin’s Q ROA G IO Ry Rc
Agriculture 43 2.67 0.33 7.79 0.58 0.94 0.02
Food Products 208 1.78 0.36 9.49 0.40 1.46 0.08
Confectionery 55 2.98 0.43 6.98 0.38 1.01 0.10
Liqueur 25 1.74 0.27 7.48 0.38 0.96 0.14
Tobacco 28 2.86 0.46 9.43 0.33 0.94 0.03
Toys 58 1.52 0.40 8.59 0.57 1.24 0.08
Entertainment 69 1.69 0.24 8.72 0.48 0.71 0.06
Publishing 182 1.83 0.31 8.84 0.54 0.91 0.12
Consumer Goods 240 1.97 0.43 10.25 0.49 1.30 0.10
Apparel 131 1.54 0.49 9.10 0.58 1.70 0.13
Healthcare 163 1.96 0.13 8.58 0.54 1.26 0.16
Medical Equipment 182 2.68 0.48 9.23 0.62 0.90 0.03
Pharmaceutical 339 3.24 0.26 9.10 0.50 0.61 0.04
Chemicals 274 1.69 0.31 10.03 0.56 0.99 0.04
Rubber and Plastic 56 1.74 0.37 10.16 0.53 1.11 0.03
Textiles 69 1.10 0.30 7.80 0.52 1.33 0.05
Construction Materials 255 1.61 0.32 9.74 0.58 1.17 0.03
Construction 119 1.30 0.18 9.06 0.51 1.34 0.02
Steel 213 1.23 0.18 9.49 0.53 1.09 0.04
Fabricated Products 31 1.34 0.25 9.74 0.50 1.00 0.01
Machinery 406 1.60 0.33 10.02 0.55 1.10 0.02
Electrical Equipment 186 2.09 0.32 9.53 0.51 0.91 0.05
Automobiles 231 1.42 0.28 9.72 0.52 1.48 0.04
Aerospace 67 1.36 0.16 9.21 0.56 1.10 0.10
Shipbuilding and Railroad 32 1.32 0.11 8.00 0.58 0.98 0.03
Defense 25 1.76 0.17 8.60 0.60 1.05 0.08
Precious Metals 29 1.82 0.06 10.34 0.37 0.39 0.01
Mining 56 1.21 0.19 8.79 0.50 1.00 0.01
Coal 20 1.41 0.21 9.65 0.35 1.16 0.04
Petroleum and Natural Gas 437 1.56 0.19 9.17 0.51 0.81 0.03
Utilities 778 1.19 0.08 9.41 0.25 0.47 0.02
Communications 221 1.71 0.19 8.31 0.40 0.48 0.03
Personal Services 99 2.19 0.25 9.13 0.55 0.91 0.13
Business Services 450 2.14 0.24 8.64 0.56 1.24 0.15
Computer Hardware 332 1.95 0.41 8.64 0.48 1.14 0.03
Software 485 2.79 0.44 8.10 0.55 0.86 0.05
Semiconductors 518 2.10 0.31 7.94 0.59 0.91 0.02
Measurement Equipment 120 2.31 0.42 9.22 0.61 0.96 0.03
Paper and Office Supplies 220 1.48 0.29 10.15 0.51 1.04 0.05
Boxes and Shipping 69 1.61 0.28 9.59 0.48 1.17 0.06
Transportation 246 1.47 0.12 8.62 0.43 1.16 0.30
Wholesale 414 1.52 0.40 9.05 0.51 2.18 0.04
Retail 622 1.87 0.50 8.84 0.53 1.98 0.14
Restaurants and Hotels 246 1.83 0.12 8.97 0.47 1.14 0.20
Average 221 1.77 0.26 9.01 0.50 1.01 0.06
22

Panel B: Standard deviation of firm characteristics (within industries)
Industry Tobin’s Q ROA G IO Ry Rc
Agriculture 1.68 0.20 2.44 0.24 0.56 0.02
Food Products 0.87 0.21 2.79 0.27 0.66 0.11
Confectionery 1.91 0.19 2.11 0.20 0.34 0.11
Liqueur 0.86 0.11 2.79 0.27 0.23 0.11
Tobacco 2.97 0.41 2.63 0.30 0.63 0.03
Toys 0.81 0.18 2.82 0.24 0.52 0.09
Entertainment 0.75 0.21 2.91 0.32 0.36 0.08
Publishing 0.71 0.23 2.95 0.27 0.37 0.14
Consumer Goods 1.19 0.25 2.62 0.29 0.54 0.12
Apparel 0.73 0.21 3.06 0.28 0.53 0.13
Healthcare 0.96 0.22 2.59 0.37 0.77 0.23
Medical Equipment 1.73 0.15 3.04 0.23 0.27 0.05
Pharmaceutical 2.24 0.38 2.60 0.30 0.46 0.06
Chemicals 0.75 0.15 2.50 0.26 0.37 0.07
Rubber and Plastic 0.83 0.18 2.63 0.30 0.33 0.04
Textiles 0.35 0.18 2.75 0.29 0.49 0.10
Construction Materials 0.77 0.14 2.83 0.22 0.44 0.04
Construction 0.46 0.14 3.10 0.33 0.79 0.02
Steel 0.47 0.11 2.90 0.29 0.47 0.09
Fabricated Products 0.41 0.11 3.42 0.26 0.29 0.01
Machinery 0.74 0.16 2.69 0.31 0.38 0.06
Electrical Equipment 2.17 0.18 3.02 0.28 0.37 0.10
Automobiles 0.61 0.13 2.60 0.26 0.61 0.10
Aerospace 0.47 0.12 3.20 0.22 0.37 0.17
Shipbuilding and Railroad 0.45 0.10 1.72 0.29 0.54 0.10
Defense 0.86 0.11 3.16 0.27 0.25 0.19
Precious Metals 0.71 0.16 1.90 0.19 0.15 0.01
Mining 0.44 0.11 1.96 0.25 0.60 0.01
Coal 0.51 0.12 2.48 0.38 0.57 0.03
Petroleum and Natural Gas 0.65 0.14 2.62 0.33 0.67 0.08
Utilities 0.16 0.04 2.46 0.25 0.23 0.04
Communications 0.99 0.15 2.93 0.35 0.32 0.04
Personal Services 2.06 0.36 2.39 0.30 0.49 0.16
Business Services 1.44 0.29 2.35 0.31 1.00 1.01
Computer Hardware 1.88 0.18 2.47 0.31 0.50 0.04
Software 2.86 0.27 2.08 0.31 0.51 0.06
Semiconductors 1.72 0.17 2.58 0.28 0.47 0.05
Measurement Equipment 1.89 0.17 2.33 0.31 0.36 0.04
Paper and Office Supplies 0.61 0.21 2.88 0.28 0.47 0.08
Boxes and Shipping 0.91 0.22 2.75 0.30 0.40 0.10
Transportation 0.74 0.15 2.74 0.33 0.82 0.35
Wholesale 1.00 0.22 2.70 0.31 1.21 0.06
Retail 1.20 0.21 2.76 0.32 0.80 0.11
Restaurants and Hotels 1.00 0.18 2.85 0.33 0.56 0.24
Average 1.03 0.18 2.70 0.29 0.49 0.11
23
Table 2: Summary Statistics and Correlations
Panel A of this table reports on the distribution for Tobin’s Q, return on assets (ROA),the G index in Gompers, Ishii, and Metrick (2003), institutional ownership (IO), and our operatingefficiency measures. The operating efficiency measures Ry and Rc are defined in equation (7) and
equation (8), respectively, as P0− y2a
k and ck . The demand curve P0 − y
2a determines the outputprice, hence revenue, corresponding to output y conditional on its output P0 and the sensitivity ofprices to output denoted a. The cost and capital associated with producing a single unit of outputare denoted c and k, respectively. The operating efficiency measures are not industry-adjusted inPanel A but are normalized within the industry classifications of Fama and French (1997) in PanelB. The correlations between the variables in Panel A along with market capitalization (M) arereported in Panel B.
Panel A: Summary statistics
PercentilesVariable 10th 25th 50th 75th 90th
Tobin’s Q 0.96 1.08 1.33 1.89 2.93ROA 0.04 0.08 0.23 0.38 0.46G 5.00 7.00 9.00 11.00 13.00IO 0.00 0.27 0.55 0.73 0.85Ry 0.15 0.42 0.86 1.31 1.88Rc 0.00 0.01 0.02 0.05 0.17
Panel B: Correlations
Variable M Tobin’s Q ROA G IO Ry Rc
M 1.00 0.24 0.00 -0.01 0.02 -0.05 0.01Tobin’s Q 1.00 0.32 -0.07 0.13 0.07 0.02ROA 1.00 -0.03 0.11 0.30 0.16G 1.00 0.03 0.03 0.00IO 1.00 -0.05 -0.08Ry 1.00 0.19Rc 1.00
24

Table 3: Operating Efficiency, Corporate Governance, and Tobin’s Q
This table reports the coefficient estimates from the regression specification in equation(10), Ry = α0 +α1 G+α2 IO+γ X + ε, that examines the relationship between operating efficiencyand corporate governance. The X vector contains the log of total assets and the log of marketcapitalization as well as industry and time dummy variables. Below each regression coefficient,t-statistics are reported in parentheses, with the standard errors of the regression coefficientsclustered at the firm level. Besides the G index of Gompers, Ishii, and Metrick (2003), institutionalownership (IO) proxies for corporate governance. The regression is also repeated by replacingthe dependent variable Ry with Rc. The operating efficiency measures Ry and Rc are defined in
equation (7) and equation (8), respectively, as P0− y2a
k and ck . The demand curve P0− y
2a determinesthe output price, hence revenue, corresponding to output y conditional on its intercept P0 andthe sensitivity of prices to output denoted a. The cost and capital associated with producing asingle unit of output are denoted c and k, respectively. Both measures of operating efficiency arenormalized within the industry classifications of Fama and French (1997).
intercept G index IO log(size) log(assets) time / industry adjusted numberα0 α1 α2 γ1 γ2 dummies R2 of obs
Ry 0.902 0.026 -0.003 0.173 -0.330 Yes 9.80% 10792(3.55) (4.21) (-2.06) (9.00) (-14.66)
Rc 1.110 0.008 -0.156 0.198 -0.345 Yes 10.17% 10792(4.41) (1.24) (-2.69) (9.15) (-13.41)
25
Table 4: Operating Efficiency and Tobin’s Q
Panel A of this table reports the β coefficients from the regression specification in equation(12), Q = β0 + βy Ry + βc Rc + γ X + ε, which examines the relationship between Tobin’s Q andoperating efficiency. The X vector contains industry and time dummy variables. Below eachregression coefficient, t-statistics are reported in parentheses, with the standard errors of theregression coefficients clustered at the firm level. The operating efficiency measures Ry and Rc
are defined in equation (7) and equation (8), respectively, as P0− y2a
k and ck . The demand curve
P0 − y2a determines the output price, hence revenue, corresponding to output y conditional on its
intercept P0 and the sensitivity of prices to output denoted a. The cost and capital associatedwith producing a single unit of output are denoted c and k, respectively. Both operating efficiencymeasures are normalized within the industry classifications of Fama and French (1997). In PanelB, the five largest and five smallest industry-level βy estimates are reported after estimatingequation (12) within each industry.
Panel A: Relationship between Tobin’s Q and operating efficiency
intercept scale costs time / industry adjusted numberβ0 βy βc dummies R2 of obs
Tobin’s Q 1.585 0.106 Yes 18.22% 10792(10.51) (5.12)
Tobin’s Q 1.556 0.126 Yes 18.49% 10792(10.28) (1.98)
Tobin’s Q 1.575 0.064 -0.030 Yes 18.68% 10792(10.15) (2.78) (-1.78)
Panel B: Largest and smallest scale coefficients by industry
Largest βy Estimates Smallest βy EstimatesIndustry βy t-stat. Industry βy t-stat.
Publishing 0.365 3.83 Construction Materials -0.058 -0.94Communications 0.335 2.52 Toys -0.083 -0.63Computer Hardware 0.323 2.43 Business Services -0.101 -1.32Transportation 0.304 3.10 Agriculture -0.284 -1.02Retail 0.208 3.15 Defense -0.409 -1.57
26
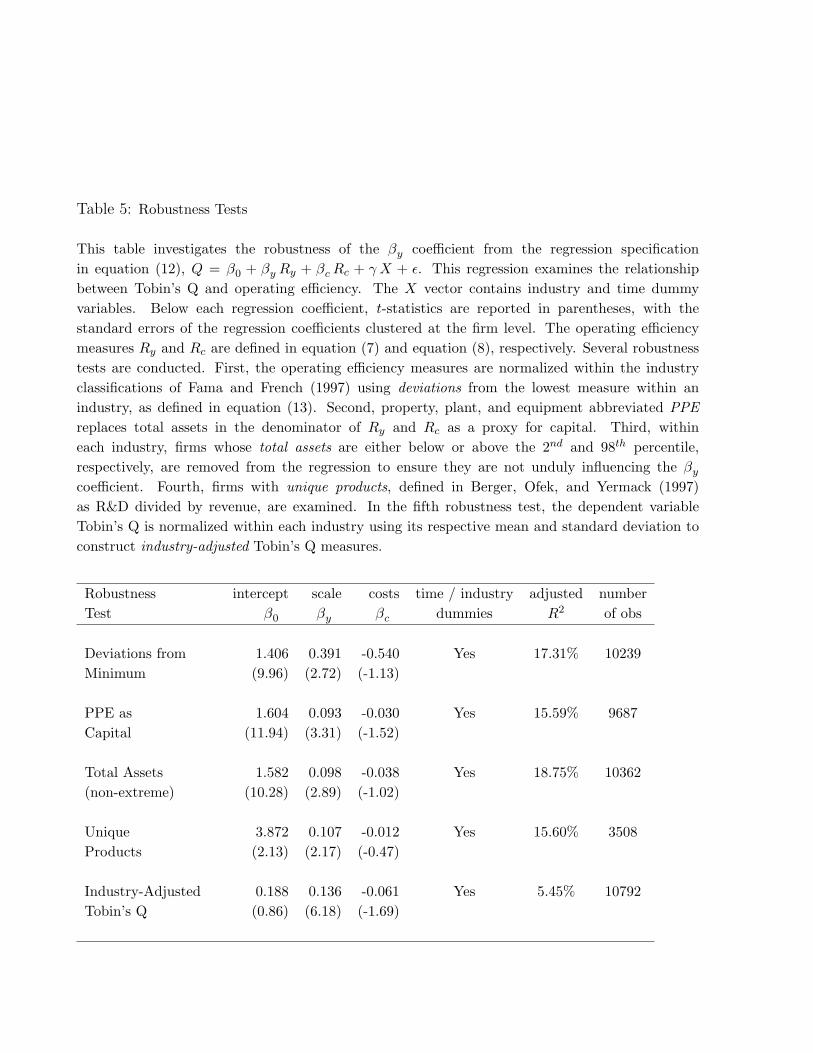
Table 5: Robustness Tests
This table investigates the robustness of the βy coefficient from the regression specificationin equation (12), Q = β0 + βy Ry + βc Rc + γ X + ε. This regression examines the relationshipbetween Tobin’s Q and operating efficiency. The X vector contains industry and time dummyvariables. Below each regression coefficient, t-statistics are reported in parentheses, with thestandard errors of the regression coefficients clustered at the firm level. The operating efficiencymeasures Ry and Rc are defined in equation (7) and equation (8), respectively. Several robustnesstests are conducted. First, the operating efficiency measures are normalized within the industryclassifications of Fama and French (1997) using deviations from the lowest measure within anindustry, as defined in equation (13). Second, property, plant, and equipment abbreviated PPEreplaces total assets in the denominator of Ry and Rc as a proxy for capital. Third, withineach industry, firms whose total assets are either below or above the 2nd and 98th percentile,respectively, are removed from the regression to ensure they are not unduly influencing the βy
coefficient. Fourth, firms with unique products, defined in Berger, Ofek, and Yermack (1997)as R&D divided by revenue, are examined. In the fifth robustness test, the dependent variableTobin’s Q is normalized within each industry using its respective mean and standard deviation toconstruct industry-adjusted Tobin’s Q measures.
Robustness intercept scale costs time / industry adjusted numberTest β0 βy βc dummies R2 of obs
Deviations from 1.406 0.391 -0.540 Yes 17.31% 10239Minimum (9.96) (2.72) (-1.13)
PPE as 1.604 0.093 -0.030 Yes 15.59% 9687Capital (11.94) (3.31) (-1.52)
Total Assets 1.582 0.098 -0.038 Yes 18.75% 10362(non-extreme) (10.28) (2.89) (-1.02)
Unique 3.872 0.107 -0.012 Yes 15.60% 3508Products (2.13) (2.17) (-0.47)
Industry-Adjusted 0.188 0.136 -0.061 Yes 5.45% 10792Tobin’s Q (0.86) (6.18) (-1.69)
27