corporate governance scores, tobin’s q and equity...
TRANSCRIPT

Corporate Governance Scores, Tobin’s Q and Equity Prices: Evidence from Canadian Capital Markets
Parveen P. Gupta Department of Accounting, Lehigh University,
Bethlehem, PA 18015-3117, USA
Duane B. Kennedy School of Accountancy, University of Waterloo
Waterloo, Ontario, Canada N2L 3G1
Samuel W. Weaver Department of Finance, Lehigh University
Bethlehem, PA 18015-3117, USA
This draft January 30, 2006
Copyright Material: Not to be reproduced or circulated without authors prior written permission
We are grateful for comments received from workshop participants at the European Institute of Advanced Studies in Management, the Annual Meeting of the British Accounting Association, and the American Accounting Association ______________________________________________________________________________ Corresponding author: Duane Kennedy, phone 519-888-4752, fax 519-888-7562, email [email protected]

2
Corporate Governance Scores, Tobin’s Q and Equity Prices: Evidence from Canadian Capital Markets
ABSTRACT
Recent financial scandals, in U.S., Canada and Europe, involving massive earning restatements, excessive CEO compensation and complete breakdown of the most basic of the corporate governance mechanisms have thrust “corporate governance” to the forefront in the global capital markets as never before. A number of market participants are asking for “summary” measures to assess the overall state of corporate governance in order to make better investment and credit decisions. Consequently, a cottage industry of corporate governance information intermediaries has developed all over the globe. In Canada, the investor service of the Globe and Mail annually publishes governance rankings for the 270+ companies represented on the TSX/S&P index. There are four sub-categories that comprise the composite scores and rankings: board composition; board and CEO compensation; shareholder rights; and board governance disclosure.
The purpose of this paper is to explore whether within the Canadian capital markets is there any association between composite as well as sub-category corporate governance scores as reported by the Globe & Mail and various measures of firm performance. Using a publicly available data-set for 2002, 2003 and 2004 on the Globe & Mail rankings and correlating it with various financial and market measures, we test for this association. Overall, our study does not find any association between the composite as well as sub-category corporate governance scores and various measures of firm performance. From our findings, it appears that within the Canadian capital markets, at least, the Globe & Mail corporate governance rankings do not appear to have any information content. Since there is no universal template that clearly defines what constitutes effective governance, it is difficult to truly evaluate the “representational faithfulness” of the holistic governance rankings from the Globe & Mail. More research, over a longer time horizon, is needed to establish the value-relevance of such ratings that are proliferating globally in response to the 2002 crisis faced by the U.S. capital markets in the aftermath of Enron and WorldCom debacles.

3
Corporate Governance Scores, Tobin’s Q and Equity Prices: Evidence from Canadian Capital Markets
I. Introduction
Recent financial scandals, in U.S., Canada and Europe, involving massive earning
restatements, excessive CEO compensation and complete breakdown of the most basic of the
corporate governance mechanisms have thrust “corporate governance” to the forefront in the
global capital markets as never before. In U.S. the Sarbanes-Oxley Act of 2002 which aims to curb
some of the most blatant abuses resulting from poor corporate governance was enacted into the law
in the shortest possible time in the country’s modern legislative history. In Canada, Ontario
Securities Commission’s proposed Multilateral Instruments No. 52-109 and 52-111 “Certification
of Disclosure in Issuers’ Annual and Interim Filings” follow in the footsteps of the Section 302
and 404 of the U.S. Sarbanes-Oxley Act of 2002 which aim to strengthen internal controls over a
company’s financial reporting systems. Similarly, in United Kingdom, which follows a “comply or
explain” approach to corporate governance, the Turnbull Guidance (which sets out best practices
for internal control for U.K.-based companies) is currently under review for possible alignment
with the Sections 302 and 404 of the Sarbanes-Oxley Act of 2002. Other countries with developed
securities markets in Europe and Australasia are also debating similar corporate governance
measures and reforms. The purpose of all these international legislative initiatives is to enhance
accountability and financial transparency in global capital markets which is based on the
presumption that good corporate governance produces better firm performance.
Corporate governance, from an agency theory perspective, deals with the problems of
information asymmetry, adverse selection and moral hazard that arise due to the separation of
ownership from control. As early as in 1776, Adam Smith, in his famous treatise, Inquiry into the

4
Nature and Causes of the Wealth of Nations wrote “…being the managers of other people’s money
rather than their own, it can not well be expected that (managers) should watch over it with the
same anxious vigilance with which (they would watch over their own money)”. Coase (1937),
Jensen and Meckling (1976), and Fama and Jensen (1983a and 1983b) postulated that in the
absence of adequate and effective monitoring and control mechanisms (or poor corporate
governance), the agents—corporate managers—work to maximize their own welfare by shirking
or otherwise extracting wealth from the principals—the shareholders. The resources expended to
ensure good governance are generally referred to as “agency costs.” In the corporate finance
literature (Cochran and Wartick, 1988) this problem is commonly referred to as “the Berle-Means
hypothesis because it was first examined by Adolf Berle and Gardiner Means in a 1932 work
entitled, the Modern Corporation and Private Property” (p. 7).
In a comprehensive survey of corporate governance, Shleifer and Vishny (1997) observe:
At first glance, it is not entirely obvious why the suppliers of capital get anything back. After all, they part with their money, and have little to contribute to the enterprise afterward. The professional managers or entrepreneurs who run the firms might as well abscond with the money. Although, they sometimes do, usually they do not. Most advanced market economies have solved the problem of corporate governance at least reasonably well, in that they have assured the flows of enormous amounts of capital to firms, and actual repatriation of profits to providers of finance. (p. 737).
It is through effective corporate governance, suppliers of capital attempt to assure themselves not
only the return of their initial investment but also an adequate return on their capital. Thus,
effective corporate governance not only deals with “monitoring and control which owners
exercise, but also with the incentives [it provides] for investment, innovation and entrepreneurial
activity” (Maher and Andersson, 1999, p. 31).
As required by various state and federal laws, at least in the U.S., managers have always
disclosed the corporate governance mechanisms and processes that their firms have put in place to

5
protect shareholder interests. It has been up to the investors and the analysts to collect and dissect
these disclosures to form an overall opinion about the state of corporate governance at a company.
However, given the current corporate climate of earnings restatements, executives and company
directors on trial, auditor indictments, and increasing participation by the public in the equity
markets, it is understandable why “investors and analysts are searching for management tools to
measure the vulnerability of firms to dishonesty, fraud and corruption” (Sonnenfeld, 2004, p. 108).
Consequently, capital market participants are becoming increasingly interested in a single measure
that can communicate to them the overall state of corporate governance in a company.
Consequently, a cottage industry of information intermediaries has developed all over the
globe. For example, in U.S. Standard & Poor’s develops and privately distributes such ratings for
companies in S&P 400, S&P 500, S&P 600 and Russell 3000 indexes; the Corporate Library, an
independent research and governance watch-dog organization, started by noted governance
advocates, Nell Minow and Robert A. G. Monks, tracks and provides board effectiveness ratings
for more than 2000 U.S. companies and 500 top international companies, the Institutional
Shareholder Service (ISS), the leading proxy advisory firm, now rates more than 7,500 U.S. and
international corporations on a number of proprietary dimensions and markets its corporate
governance quotient (CGQ) to institutional shareholders, and GovernanceMetrics International
(GMI), a privately-held firm based in New York City, has developed corporate governance scores
for more than 1,600 companies in its data base from over 600 different proprietary governance
variables. None of these composite governance ratings are available to the capital markets, at large,
and all of providers sell their ratings to the client firms as well as to the institutional and individual
investors. Similarly, in Europe Deminor Corporate Governance ratings are published for
companies included in the FTSE Eurotop 300 index and in Canada, the investor service of the

6
Globe and Mail annually publishes (typically around September/October of each year) the
governance ratings for all the companies represented on the TSX/S&P index.
Although, the use of these composite ratings is on increase, Sonnenfeld (2004, p. 108)
warns that these rating services “may cross the line from being independent raters to becoming
active consultants for the firms they study in ways which lead to questions about their objective
credibility.” In spite of the potential for conflict of interest and the limitations of these ratings,
many believe that “it is dangerous for firms to challenge [these ratings], given the attention paid to
them by credit analysts, institutional portfolio managers, and liability underwriters (Sonnenfeld,
2004, p. 108). It should be noted that the Globe & Mail ratings are provided as a public service by
the newspaper. Across the globe, these ratings, scores, or grades are being increasingly used by
the market participants for investment and credit decisions and by the insurance companies for
directors and officers’ liability insurance purposes. However, from a research standpoint, an
interesting question emerges: Are these governance ratings a fad or is there any “real” value
relevance in the information conveyed by these ratings?
The purpose of this paper is to explore this question within the context of the Canadian
capital markets. We use publicly disclosed Globe & Mail ratings and corporate governance scores
of the 270 companies represented on Canada’s TSX/S&P index. Using this data-set for 2002, 2003
and 2004, we attempt to ascertain whether firms with overall higher corporate governance scores
do consistently out-perform firms with overall lower corporate governance scores? We also test for
any association between a firm’s performance, and four specific dimensions of corporate
governance that comprise the composite corporate governance scores in our sample to better
understand whether any one corporate governance dimension associates better with firm
performance.

7
The remainder of the paper is organized as follows: Section II discusses prior research and
develops hypotheses. Section III presents a description of the Globe & Mail data-set and study’s
research design. Section IV presents empirical results and discusses findings and Section V
concludes the paper with a discussion of its limitations and potential for future research in this
area.
II. Prior Research and Hypotheses Development
Does good governance matter or is it just the cost of doing business in today’s global
capital markets? Is there any association between corporate governance practices employed by a
firm and its performance as measured by accounting and market variables? Do the composite
governance ratings provide any valuable information to capital market participants in helping them
identify better performing firms? These and many others related questions are a matter of study
and debate because academic research has not yet provided any conclusive answers on these
issues.
A series of anecdotal global investor opinion surveys and interviews conducted by
McKinsey & Company indicate that good governance has value and a large number of institutional
investors are willing to pay significant premium for the stock of a well-governed company. For
example, according to the 1996 McKinsey survey, on an average investors were willing to pay a
premium of about 16% for a Fortune 1000 company (Felton, et. al. 1996, p. 171) and the same
price premium increased to more than 18 percent for a U.S. and U.K. company in a 2000 survey
(Coombes and Watson, 2000, p. 75). Surprisingly, the same surveys also concluded that CEOs and
executives are willing to pay even higher premiums (24 percent) for the stock of a well-governed
company. These findings do indicate that market participants value good governance which, in
turn, positively impacts a firm’s market value or its overall shareholder return. However, these

8
survey results should be taken with a “grain of salt” because there is quite a difference in saying
what one would be willing to pay for a good governing company versus what one actually pays.
The majority of the empirical1 research prior to 2000 has focused on understanding the
relationship of specific corporate governance variables to firm performance. Significant among
these variables are: ownership concentration (owner-controlled firms versus manager-controlled
firms, presence of a dominant shareholder versus controlling blockholders), market for corporate
control (mergers, acquisitions and hostile takeovers), monitoring of mangers via managerial
compensation (salary, bonus, stock options or other equity based) and board composition (presence
of outside or independent directors) etc. According to Maher and Andersson (1999), the results of
these studies vary from country-to-country and are mixed at best. However, it is only recently, that
researchers have begun to explore whether corporate governance as a whole, as measured by a
composite score, rating or ranking2, has any relationship to firm performance. Although a great
deal of research has been conducted on the relationship of specific governance practices on firm
performance, only a handful of studies have, so far, explored the relationship between the
“composite” measure of corporate governance and firm performance.
Potentially, there are two reasons for lack of research in this area: one reason is lack of
global consensus on the definition and elements of what constitutes good governance and the other
is lack of a recognizable entity that consistently measures corporate governance in a “composite”
sense and makes it available to all capital market participants in a fair and equitable manner.
Consequently, academic researchers have attempted to deal with these two issues by creating their
1 For a comprehensive review of this topic, see “Corporate Governance: Effects on Firm Performance and Economic Growth” by Maher and Andersson (1999). 2 Although, there are several issues (i.e., what individual corporate governance variables should be included in such ratings? Should all the variables be weighted equally? Is the index simply an arithmetic mean of all the individual variables? What data correctly “proxy” the underlying intent of the variable?) that surround the construction of these indices, as mentioned earlier in this paper, their use by market participants is on the rise.

9
own indexes, scores or ratings as proxies for the overall level of corporate governance in a
company either by collecting data from the various regulatory filings or through a set of self report
surveys. However, in spite of the increasing reliance by the market participants on these composite
governance scores, no where else in the world, except Canada, are these composite scores
available in the public domain on a regular basis. It is precisely for this reason that we are focusing
on Canada to test whether there is any association between the corporate governance ratings and
firm performance.
One of the earliest U.S. research studies, exploring the relationship between composite
governance scores and firm performance was conducted by the Standard & Poor’s and is often
referred to as S&P Transparency & Disclosure (T&D) study (Patel and Dallas, 2002). Collecting
data from the annual reports, 10-Ks, and proxy filings of 460 of the S&P 500 companies, on 98
possible attributes, broadly classified into three major categories (i.e., ownership structure and
investor rights, financial transparency and information disclosure, and board and management
structure and process), the study concludes that companies can lower their cost of equity capital by
providing higher transparency and disclosure to the capital markets. To understand whether T&D
study ratings had any information content around the disclosure date, Cheng, Collins and Huang
(2003) investigated association between these ratings and market beta, abnormal returns, and
earnings response coefficients, and found that “S&P T&D rankings provide new information on
corporate governance attributes, and the market responds favorably during the event period to
firms with stronger corporate governance” because stronger corporate governance reduces firm
risk by providing for higher earnings quality. At least, preliminarily, these findings can lead one to
conclude, that, although, the information on the three major categories was already available to the
10
market participants in publicly disclosed filings, aggregation of this information in an index form,
does indeed has information content or value relevance.
Another recent and widely cited research study in U.S. is by Gompers, Ishii, and Metrick
(2003) in which the researchers, once again, construct their own “governance index to proxy for
the level of shareholder rights at about 1,500 large firms during the 1990s” (p. 107). Based on this
proprietary index, the study classifies the sample firms into two distinct portfolios: firms with
strongest shareholder rights and firms with weakest shareholder rights. Given this classification,
the study back-tests an investment strategy that, during the sample period, bought firms with
strongest shareholder rights and sold firms with weakest shareholder rights and found that such an
investment strategy “would have earned abnormal returns of 8.5 percent per year” (p. 107).
Although, the study establishes a strong relationship between corporate governance and firm
performance, within the context of our research paper, it has some important implications: one, the
study only focuses on one critical dimension (i.e., shareholder rights) of the overall state of
corporate governance in a company. Two, although the “shareholder right” information was
already in the “public domain,” it was not available to the market in its present composite form,
indicating that creation of an index or aggregation of such information, even only on one
dimension of corporate governance, may indeed have some value to the market participants.
Core, Guay and Rusticus (2004) are however troubled by these findings. According to them
(2004, p. 1), “a puzzling feature of the [Gompers et al, (2003)] paper is that the authors find
persistent stock market underperformance for firms with weak shareholder rights, but they do not
find significant underperformance in firm operating performance, which they measure with
accounting return on equity.” Using analysts forecast errors and earnings announcement returns,
Core, Guay and Rusticus (2004) conclude that not only weak governance does not cause poor

11
stock returns but also note that any “stock return differential reverses in the period after the initial
sample period” (p. 1).
Following the Gompers, Ishii, and Metrick (2003) approach, Bauer, Gunster, and Otten
(2004) also construct “good governance portfolios” (or top 20% of the companies with highest
corporate governance ratings) and “bad governance portfolios” (or bottom 20% of the companies
with lowest corporate governance ratings) using the Deminor corporate governance ratings for
companies included in the FTSE Eurotop 300 index. Given the zero investment strategy, the study
finds positive correlation between firm valuation (as measured by Tobin’s Q) and corporate
governance scores. However, the authors suggest that “this relationship weakens substantially after
adjusting for country differences” (p. 1). Contrary to the Gompers, Ishii, and Metrick (2003)
findings, this study finds “a negative relationship between governance standards and earnings
based performance ratios” (p. 1).
Drobetz, Schillhofer, and Zimmermann (2003) construct a broad corporate governance
index, based on 30 governance proxies divided into five distinct categories (e.g., corporate
governance commitment, shareholder rights, transparency, management and supervisory board
matters, and auditing) from data obtained from survey and other archival sources, for German
public firms. The study presents mixed evidence on whether there is any relationship between
good governance and firm performance. Following the Gompers, Ishii, and Metrick (2003)
approach, the authors back-test the investment strategy and conclude that buying high corporate
governance index firms and shorting low corporate governance index firms during the sample
period would have “earned abnormal returns of around 12 percent on an annual basis” (p. 1).
However, findings suggest that although “expected stock returns are negatively correlated with
firm-level corporate governance when dividend yield are used as proxies for the cost of capital” (p.

12
1) “firms with better governance practices tend to be large, have higher average returns and lower
dividend yield, and generally receive higher valuations, as measured by Tobin’s Q and the market-
to-book-ratio” (p. 13).
Similarly, von Nandelstadth and Rosenberg (2003) construct an index of corporate
governance for the firms traded on the main list of the Helsinki Stock Exchange and find that
“firms characterized by a high (efficient) level of corporate governance have delivered greater
stock returns, are higher valued based on the measure of Tobin’s Q, and exhibit higher ratios of
cash flow to assets, on average, in comparison to their counterparts characterized by a low
(inefficient) level of corporate governance” (p. 1).
Black, Jang, and Kim (2003) construct a corporate governance index for 525 companies
listed on the Korean Stock Exchange. The data is collected through a survey on five key
dimensions of the corporate governance: shareholder rights, board structure, board procedure,
disclosure to investors, and ownership parity. Using ordinary least squares regression, the authors
find that a “worst-to-best change in [their corporate governance index] predicts a 0.48 increase in
Tobin’s Q (about a 160% increase in share price). This effect is statistically strong (t = 6.11),
robust to choice of market value variable (Tobin’s Q, market/book, and market/sales), robust to
specification of the corporate governance index, and robust to inclusion of extensive control
variables” (p. 1).
Although the studies discussed above lean more towards establishing a positive association
between either a composite or a single measure of the corporate governance and firm performance,
all of these studies attempt to self-construct a corporate governance index and then hypothetically
back-test various investment strategies to determine whether good governance firms yield higher
firm performance. Interestingly, in none of the capital markets covered by the above mentioned

13
studies, the corporate governance ratings or the index (comprised from publicly available
information) is disclosed publicly to the capital markets. Thus, based on the findings of these
studies, although, one may conclude, with some reservations, that there is a positive association
between corporate governance and firm performance, it is not possible to determine whether there
is any value-added from focusing on the composite governance ratings or whether there is any new
information that is communicated by these composite governance ratings.
Interestingly, Canadian capital markets provide a fertile ground to test, in real-time, for any
association between corporate governance ratings and firm performance, because the Globe &
Mail, a prominent national newspaper, publishes annually the corporate governance scores for the
all the companies traded on the Toronto Stock Exchange that are part of Canada’s benchmark
S&P/TSX index. Rather than back-testing a contrived investment strategy, based on the constancy
of corporate governance and various macro-economic environment variables and the market
psyche, our study explores whether there is any association between the publicly disclosed
corporate governance scores and firm performance based on a three-year time series. We also
explore whether any one of the four dimensions that comprise the composite Globe & Mail ratings
are associated with firm performance. We measure firm performance along three dimensions:
relative market valuation as measured by the Tobin’s Q and price-to-book ratio, financial
performance as measured by return on assets, and market reaction as measured by the 11-day and
2-day reaction. Since many firms included in the study are cross-listed on U.S. stock exchanges as
well, we also explore whether cross-listing matters while explaining association between corporate
governance scores and firm performance. Consequently, at the macro-level we test following null
hypotheses:
H0 There is no relationship between Globe & Mail’s composite corporate governance ratings and firm performance.

14
H0 There is no relationship between any one of the components of the Globe & Mail’s composite corporate governance ratings and firm performance.
III. Data Description and Research Design
(i) Data Description
Our study utilizes the data on corporate governance scores and rankings, and related stock
price and financial statement data on companies included in Canada’s benchmark S&P/TSX
composite index. The corporate governance scores and rankings are obtained from the Globe &
Mail website.3 These scores and rankings are published each year in the Globe & Mail’s Report on
Business, which is made available to public at no cost. The 2002 scores and rankings were
published on October 7, 2002 for the entire set of 270 companies then in the S&P/TSX index. The
2003 rankings covered 207 companies and were published on September 22, 2003. The 2004
rankings included 218 companies and were published on October 12, 2004.4 We focused on the
companies that are common to all three years leading to a sample consisting of 178 companies
with three years of time series data on corporate governance scores.
The data to develop the composite governance scores and rankings is collected by the
Globe & Mail from the proxy circulars filed by the Canadian companies to the Ontario Securities
Commission. There are four sub-categories that comprise the composite scores and rankings: board
composition, board and CEO compensation, shareholder rights, and board governance related
disclosures. The maximum composite score that a company can achieve is 100 points. Out of the
total 100 possible points, during 2002, on the board composition dimension a company could score
3 www.globeandmail.com/series/boardgames/charts/chart1.html 4 There are two reasons for different number of companies being reported by the Globe & Mail in their Report on Business each year. One reason is the restructuring of the index that took place from May 2002 to December 2002. The TSX 300 was renamed on May 1, 2002 to the S&P/TSX composite index. The index went through a transition that was designed to reduce the number of constituent companies because the bottom 100 companies were too small, collectively representing only two percent of the index. The second reason is the cut-off date of the Report on Business study, which affects the number of proxy circulars available to the Globe & Mail reporters who compile this data. The Globe & Mail excludes companies that are in bankruptcy protection.

15
maximum 40 points, 23 points on the board and CEO compensation dimension, 22 points on the
shareholder rights dimension and 15 points on the disclosure of board related structure and process
dimension. During the ensuing two years, the newspaper made some adjustments to each of the
three sub-categories except the board composition dimension, which remained at the 40 point
level.5 Appendix 1 reproduces the 22 questions along with the Globe & Mail scoring scheme.
(ii) Research Design
Firm performance is the independent variable and composite as well as sub-category
governance scores are the dependent variables in our overall research design. We measure firm
performance through three separate sets of metrics: (1) relative market valuation as measured by
Tobin’s Q and price-to-book ratio, (2) firm’s operating performance as measured by its return on
assets, and (3) market reaction as measured by the 11-day stock returns and 2-day stock returns
around the publication date of the Globe & Mail rankings.
We use Tobin’s Q as one of the measures of firm performance because it has been used “in
corporate governance studies since the work of Demsetz and Lehn (1985) and Morck, Shleifer, and
Vishny (1988)” (Gompers, Ishii and Metrick, 2003, p. 126). According to White, Sondhi, and
Fried (1998, p. 1041),
The relationship between a company’s market and book values can be measured by Tobin’s Q ratio, defined as the market value of the firm divided by its book value on a replacement cost basis. Q values below 1 (price less than replacement book value) imply that the firm earns less than the required rate of return; a (marginal) dollar invested in the firm’s assets results in future cash flows whose present value is less than a $1.
Based on the definition provided by Gompers, Ishii and Metrick (2003), we obtained data from
Compustat Research Insight to calculate Tobin’s Q. Specifically, Tobin’s Q equals the market
5 The first note in Table 1 details the maximum score for each sub-category over the three-year time period. The “board and CEO compensation” and “board related structure and process” sub-categories declined respectively by 4% and 2% while the “shareholder rights” sub-category picked up an additional 6% weight in the overall composite scores and rankings.

16
value of assets divided by the book value of assets where the market value of assets is computed as
the book value of assets (variable AT for the most recent fiscal year end) plus the market value of
common stock (variable MKVALM at month end) minus the book value of common stock
(variable CEQ for the most recent fiscal year end) minus deferred taxes from the balance sheet
(variable TXDB for the most recent fiscal year end). As a sensitivity check, we use price-to-book
ratio as an alternative measure of firm performance. The price-to-book ratio is obtained from
Compustat Research Insight (variable MKBK for the month end). Both Tobin’s Q and the price-to-
book metrics measure firm performance based on book vis-à-vis market-based measures. For our
research study, the measures are highly positively correlated (greater than 0.85 in each year).
We also measure firm performance as return on assets. In our study, return on assets is a
proxy for operating performance. It is calculated as income (variable IB for the most recent fiscal
year end) divided by the book value of assets (variable AT) using data obtained from Compustat
Research Insight.
After analyzing the corporate governance scores and the measures of firm performance
through univariate statistical measures, three econometric regression models are developed. The
three regressions are estimated using companies common to all three years (2002-2004) for which
data on the variables are available from COMPUSTAT.
Econometric Model 1
The first regression model regresses Tobin’s Q and price-to-book ratio against the composite
governance scores as well as against each one of the four sub-categories (board composition, board
and CEO compensation, shareholder rights, and board governance related disclosures) to
investigate whether any one sub-component of the overall corporate governance scores is more

17
value relevant than the others. The following two equations capture the overall governance score
regressions:
Tobin’s Q = α + β Composite Governance Score + γ ln(Sales) + δ Return on Assets + ζ Cross-listing status+ ε (1) Price-to-book ratio = α + β Composite Governance Score + γ ln(Sales) + δ Return on Assets + ζ Cross-listing status+ ε (2)
where Tobin’s Q for 2002 (2003) (2004) was calculated using the market value of common stock
at the end of October 2002 (September 2003) (October 2004)6 and book values at the most recent
fiscal year end on or before October 2002 (September 2003) (October 2004). Following two
equations capture the sub-category score regressions:
Tobin’s Q = α + ∑ β Sub-category Score + γ ln (Sales) + δ Return on Assets + ζ Cross-listing status+ ε (3) Price-to-book ratio = α + ∑ β Sub-category Score + γ ln (Sales) + δ Return on Assets + ζ Cross-listing status+ ε (4)
Econometric Model 2
The second regression model regresses return on assets against the composite governance scores as
well as each one of the four sub-categories. The following two equations respectively capture each
one of the regressions:
Return on Assets = α + β Composite Governance Score + γ ln(Book-to-Market) + δ ln(Sales) + ζ Cross-listing status+ ε (5) Return on Assets = α + ∑ β Sub-category Score + γ ln(Book-to-Market) + δ ln(Sales) + ζ Cross-listing status+ ε (6)
Econometric Model 3
The third and the final regression model tests whether there is any stock market reaction around
the announcement date of the Globe & Mail rankings. We investigated only the short-window
stock returns as measured by the two-day7 and eleven-day8 “event” period. The cross-sectional
analysis at the firm level over a three year time period is based on the following equation:
6 The reason to choose month-end market value of the common stock was due to the timing of the release of the corporate governance scores: for 2002, the governance scores were published on October 7, 2002; for 2003 the governance scores were published on September 22, 2003, and for 2004 the governance scores were published on October 12, 2004. 7 Two-day “event” period for each of the three years was as follows: for 2002, close of trading on Friday, October 4, 2002 to close of trading on Tuesday, October 8, 2002; for 2003, close of trading on Friday, September 19, 2003 to close of trading on Tuesday, September 23, 2003; for, 2004 close of trading on Monday, October 11, 2004 to close of trading on Wednesday, October 13, 2004. 8 Eleven day “event” period for each of the three years was as follows: for 2002, close of trading on Monday, September 30, 2002 to close of trading on Tuesday, October 15, 2002; for 2003, close of trading on Monday,
18
Rit = α + β Governance Score + γ ln(Sales) + δ Cross-listing Status+ ε (7) Rit = α + β Governance Category sub-Scores + γ ln(Sales) + δ Cross-listing Status+ ε (8)
where Rit is the aggregate excess return over period t of individual firm i for each one of the three
years. Excess returns were calculated by subtracting the Canadian Financial Markets Research
Centre (CFMRC) equally-weighted market index for the appropriate period.
While running various regressions, we controlled for the size of the firm as measured by
total sales as a proxy, because there was a significant negative correlation between sales and a
number of firm performance measures (see Panel B Table 2). We also constructed quartile-based
portfolios as determined by the composite governance scores to test for the robustness of our
findings.
IV. Findings and Discussion
Sample Demographics
In Table 1, we present descriptive statistics for our sample companies for each one of the
three years for which the Globe & Mail ratings were released to the Canadian capital markets.
INSERT TABLE 1 ABOUT HERE
As mentioned earlier, a Canadian company can achieve a composite score anywhere from 0
to 100 in the annual Globe & Mail corporate governance survey. A review of the Table 1, Panel A
reveals that, from 2002 to 2004, although, the mean composite governance scores increased by
approximately 10 points and standard deviation declined by approximately 1 point, the range of the
scores has remained relatively stable for the same period. This does not tell us a lot about what
structural changes might be occurring in the composite governance scores of the sample firms over
a three year period. However, the coefficient of variation which is the ratio of standard deviation to
September 15, 2003 to close of trading on Monday, September 29, 2003; for 2004, close of trading on Monday, October 4, 2004 to close of trading on Tuesday, October 19, 2004.

19
the mean indicates that relative to the mean governance score for each year the variation in the
yearly composite governance scores is declining. In spite of the stability in the range, which is the
result of few outliers9, this suggests that year-over-year composite governance scores are getting
into a tighter band. However, same is not true for the four sub-categories. Although, three out of
four sub-categories exhibit an increase in their average sub-scores, the Board Composition sub-
category shows the largest amount of improvement followed by the Board Governance Related
disclosure sub-category and Shareholder Rights sub-category. Interestingly, the sub-scores for the
Board and CEO compensation category were approximately equal in spite of the maximum score
dropping from 23 to 19. Overall, the data presented in the Table 1 Panel A suggests that some
structural shifts are occurring in the corporate governance structure and processes within Canadian
companies as measured by the Globe & Mail survey. However, what is not clear is whether these
changes are driven by the firms’ desire to improve their reported ratings in the media or these
changes are genuinely intended to improve the overall state of corporate governance in these
companies.
In order to better understand this phenomenon, we divided our sample into cross-listed vs.
not cross-listed firms. Since a large number of Canadian companies are cross-listed on the U.S.
stock exchanges we would normally expect the cross-listed firms to score higher in total as well as
on each one of the four sub categories. The basis for our belief is the passage of the Sarbanes-
Oxley Act in July 2002 which mandated many corporate governance reforms for all U.S. listed
companies. Additionally, during the same period, the New York Stock Exchange (NYSE) and
NASDAQ stock exchange substantially revised their listing standards for all public companies
raising capital in the U.S. equity markets. Consistent with our expectations, the findings presented
9 There is only one governance score that looks like an outlier. In 2003, Investors Group had a score of 34 and the next lowest score was 39. In all other cases (top and bottom), the most extreme score was close to the next most extreme.

20
in Table 1 Panel B clearly indicate that for each of the three years, cross-listed companies
demonstrate higher overall corporate governance scores than the non-cross-listed companies. The
differences in scores are statistically significant at p-value of 0.01.
However, when we analyze our sample by cross-listings at the sub-category level, we do
not find across the board statistically significant difference in the sub-scores of the two groups of
firms. For each year, the most statistically significant difference is found with respect to the Board
Composition sub-category (at p-value of 0.01 for 2002 and 2003 and p-value of 0.05 for 2004)
which indicates that cross-listed firms (1) have higher proportion of independent directors on their
boards with lesser number of them in the directors interlocks, (2) tend to conduct more executive
sessions, and (3) regularly conduct overall board and director performance evaluations. Although,
cross-listed firms score higher on the Board Governance Disclosure sub-category, differences
between the two groups of firms are not as significant (p-value of 0.01 for 2002 and 0.10 for 2003
and 2004) as the Board Composition sub-category. However, the most surprising finding from the
data presented in Table 1 Panel B is that there is little difference between the cross-listed and not
cross-listed firms when it comes to the Shareholder Rights sub-category (except for 2004 at p-
value of 0.10) and the Board and CEO Compensation sub-category (except for 2004 at p-value of
0.01). To understand why might this be the case, we reviewed the measurement metrics used by
the Globe & Mail (and as presented in Appendix 1) to compute scores for each one of the four sub-
categories. A review of these metrics (or questions) suggests to us that for firms to score higher on
the Board and CEO compensation sub category and on the Shareholder Rights sub-category, they
need to make more substantive changes in their governance structure and processes than the other
two sub-categories. As a rational market participant, believing that Canadians pay attention to the

21
Globe & Mail ratings, the firms may have chosen the path of least resistance to raise their ratings
by instituting changes in less challenging categories.
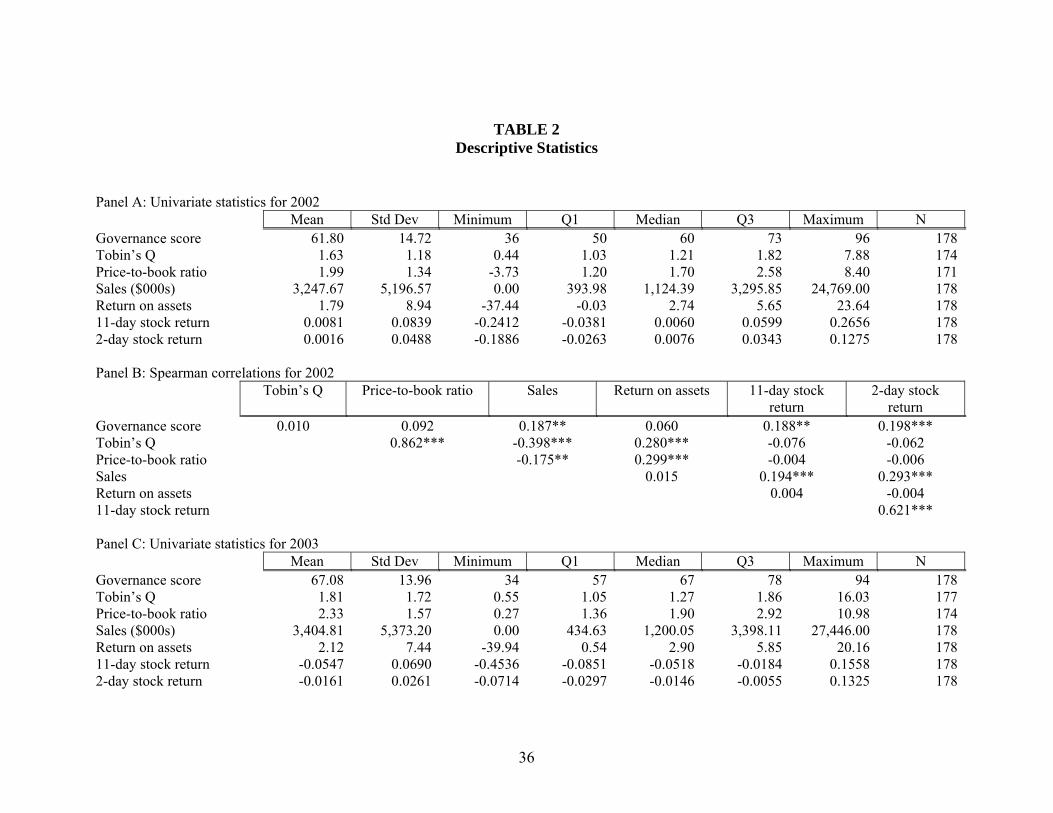
Table 2 provides univariate statistics and Spearman correlation coefficients for each year
for the following variables: Governance score, Tobin’s Q, Price-to-Book Ratio, Sales, Return on
assets, 11-day stock return and 2-day stock return. The sample size varies from 171-178 firms due
to missing values for some variables in Research Insight.
INSERT TABLE 2 ABOUT HERE
A review of the univariate statistics shows a gradual increase in the median values of
Tobin’s Q and the price-to-book ratio over the three years. There is a large increase in the mean
and maximum values of Tobin’s Q and price-to-book ratios from 2002 to 2003. This increase is
caused by a substantial increase in market value for three companies. If these three observations
are deleted, the mean and maximum values for Tobin’s Q and the price-to-book ratio are similar
across the three years.
Table 2 Panels B, D, and F show significant positive correlation between composite
corporate governance scores and firm size as measured by sales. This statistically significant
positive correlation across all three years clearly indicates that large firms have higher composite
corporate governance scores. Interestingly, Tobin’s Q and the price-to-book ratios for each one of
the three years are significantly negatively correlated with total sales, implying that larger firms,
comparatively, have a lower market capitalization relative to book values. Since “most proxies for
Q are poor” (Erickson and Whited, 2001), we also used price-to-book ratio as another measure of
the market valuation of a firm. Panel B, D, and E indicate that the price-to-book ratio is
significantly (p-value = 0.01) positively correlated (0.862 for 2002, 0.865 for 2003, and 0.852 for
2004) with Tobin’s Q. In spite of this strong positive correlation between the two measures, it is

22
only the Tobin’s Q that is significantly (p-value = 0.01) positively correlated, for all the three
years, with accounting measure of firm performance as measured by return on total assets. This
suggests that firms with higher Tobin’s Q have higher return on assets in our sample but not
necessarily higher price-to-book ratio. These findings suggest that in spite of such high positive
correlation between the two, the Tobin’s Q and the price-to-book are not perfect substitutes for
each other because each appears to capture a somewhat different aspect of market valuation of the
firm. Now we present and discuss our results and findings for each one of the hypotheses
presented earlier.
Test of Hypothesis One: Is There an Association Between Globe & Mail’s Composite Corporate Governance Scores and Various Firm Performance Measures? As mentioned earlier in Section II, the first null hypothesis explores association between
the Globe & Mail’s composite corporate governance scores and three broader measures of firm
performance: (1) market valuation measures as measured by Tobin’s Q and price-to-book ratio
(see Table 3), (2) operating performance measures as measured by accounting return on assets (see
Table 5), and (3) market reaction measures as measured by 2-day and 11-day stock returns around
the “event” date (see Table 6). Discussed below are our findings for each one of these firm
performance related variables.
A. Are Tobin’s Q and Price-to-Book Associated with Globe & Mail’s Composite Corporate Governance Scores?
Table 3 presents results of our first econometric model which comprises of the following two
regression equations:
Tobin’s Q = α + β Composite Governance Score + γ ln(Sales) + δ Return on Assets + ζ Cross-listing status+ ε (1) Price-to-book ratio = α + β Composite Governance Score + γ ln(Sales) + δ Return on Assets + ζ Cross-listing status+ ε (2)
INSERT TABLE 3 ABOUT HERE

23
A review of the results presented in Table 3 Panels A and B indicates that after controlling
for firm size (as measured by sales) neither Tobin’s Q nor price-to-book ratio are related to the
composite governance scores as reported by Globe & Mail. What is surprising is not only the lack
of statistical significance for each of the three years, but also for 2003 and 2004 the negative sign
associated with the composite governance score coefficients indicating that higher governance
score leads to decline in the market valuation measures of our sample firms. Although
insignificant, these findings are counter intuitive. Higher corporate governance scores, assuming
no measurement error,10 a priori, should lead to higher market valuation because adoption of good
governance practices by a firm leads to higher transparency in its financial and non-financial
disclosures and communicates to the capital markets that the boards of directors are serious about
management accountability which in turn reduces the uncertainty created by the “separation of
ownership from control” leading to lower cost of capital and higher overall return for shareholders.
This was the rationale provided by many respondents in the earlier mentioned McKinsey surveys
which documented that market participants were willing to pay a premium for better governing
companies. As a sensitivity check, we replicated the regressions after deleting 7 observations with
Tobin’s Q values greater than 6.0 in each of the three years. The results remain unchanged in all
respects Although, these results indicate that composite governance score is not a robust predictor
of Tobin’s Q and price-to-book, our regression models (1) and (2) assume a linear relationship
between the dependent and independent variables.
B. Is Return on Assets Associated with Globe & Mail’s Composite Corporate Governance Scores?
10 There is no universal definition of what constitutes good governance and how it can be measured for empirical validation but our review of the literature suggests that Globe & Mail scores are developed using commonly accepted measures of good governance. Other research studies cited in the literature review section of this paper also use similar measures.

24
Table 5 Panel A presents the results of our second econometric model which comprises of
the following regression equation:
Return on Assets = α + β Composite Governance Score + γ ln(Book-to-Market) + δ ln(Sales) + ζ Cross-listing status+ ε (5)
INSERT TABLE 5 ABOUT HERE
Once again, we find that Globe & Mail’s composite corporate governance scores are not associated
with a firm’s return on assets. Consistent with the Tobin’s q and Price-to-Book findings, the
coefficient of the composite corporate governance scores is once again negative for years 2003 and
2004 indicating that firms with higher corporate governance scores tend to report lower return on
their assets. Although, a firm’s total sales is a significantly positive predictor of its return on assets,
the negative coefficients for all the three years (significant only for 2002 and 2004 at p-value =
0.05) indicate that higher Book-to-Market ratio firms have lower return on assts. These findings
are perplexing. However, juxtaposing the negative coefficients for the composite corporate
governance score (from Table 3 Panels A and B) with the significantly negative association
between book-to-market and return on assets (from Table 5 Panel A) could also suggest that for
firms in our sample cost of corporate governance outweighs the benefits produced by it. In other
words, Canadian investors expect a certain level of corporate governance from firms raising capital
in their equity markets and the costs incurred by these firms to meet those expectations,
consequently, create a negative drag on the firm’s earnings which in turn depresses their
accounting as well as market measures of firm performance.
C. Is there a Market Reaction around the “Event” Date to Globe & Mail’s Composite Corporate Governance Score Disclosures?
Table 6 Panels A and C presents the results of our short-window “event” study which
comprises of the following regression equation:
Rit = α + β Governance Score + γ ln (Sales) + δ Cross-listing Status+ ε (7)

25
INSERT TABLE 6 ABOUT HERE
Consistent with the previous two measures of firm performance, we do not find any significant
market reaction around the 2-day as well as the 11-day window. Although the composite
governance score coefficients are significant (p-value = 0.10) and positive for 2002, close to zero
coefficient values suggest that whatever little market reaction our model appears to be catching is
probably due to the hype that might have been created by the first time disclosure of these scores
in a major Canadian newspaper. Also, we should not forget that 2002 was the year during which
Enron and WorldCom imploded and the Sarbanes-Oxley Act was passed.
Overall, based on these findings, we are unable to reject the first null hypothesis of no
association between Globe & Mail’s composite corporate governance scores and firm
performance. Now we present and discuss our results and findings on the second null hypothesis.
Test of Hypothesis Two: Is there Any Association between Globe & Mail’s Corporate Governance Sub-category Sub-Scores and Various Firm Performance Measures? The Globe & Mail’s composite corporate governance scores are a sum total of the scores
achieved by the Canadian firms in the following four sub-categories: Board Composition, Board
and CEO Compensation, Shareholder Rights, and Board Governance Disclosures (see Table 1,
Panel A). In an effort to understand whether any of these sub-categories exhibit greater association
to firm performance for our sample companies, we replicated our econometric models by
incorporating each one of the four sub-categories in our individual regressions as described below.
A. Are Tobin’s Q and Price-to-Book Associated with any one of the Globe& Mail’s Four Corporate Governance sub-Category scores?
Table 4 presents results of our first econometric model (as it relates to sub-categories)
which comprises of the following two regression equations:
Tobin’s Q = α + ∑ β Sub-category Score + γ ln (Sales) + δ Return on Assets + ζ Cross-listing status+ ε (3)

26
Price-to-book ratio = α + ∑ β Sub-category Score + γ ln (Sales) + δ Return on Assets + ζ Cross-listing status+ ε (4)
INSERT TABLE 4 ABOUT HERE
A review of the results presented in Panels A and B of this table suggests that there is no consistent
pattern of relationship between the 2 measures of market valuation (Tobin’s Q and book-to-market
ratio) and corporate governance sub-scores for each one of the four sub-categories. Although, with
respect to Tobin’s Q, three out of the four sub-categories are significant at p-values = 0.10 for
2002, this association virtually disappears in the subsequent years except for that in 2004 Board
Composition sub-category re-emerges significant at p-values = 0.05 but with a negative
coefficient. These results persist only partially for the association with price-to-book.
Interestingly, the cross-listed firms, whether regressed with composite governance scores (see
Table 3) or with sub-category scores (see Table 4) appear to have higher Tobin’s Q and Price-to-
Book ratio during 2004 at p-values = 0.01. Based on these results, it is difficult to conclude
whether there is any association between market valuation measures and corporate governance
sub-category scores for our sample of firms.
B. Is Return on assets Associated with any one of the Globe & Mail’s Four Corporate Governance sub-Category scores?
Table 5 Panel B presents results of our second econometric model (as it relates to sub-
categories) which comprises of the following regression equation:
Return on Assets = α + ∑ β Sub-category Score + γ ln(Book-to-Market) + δ ln(Sales) + ζ Cross-listing status+ ε (6) Once again, we do not find a significant relationship between any of the Globe & Mail Corporate
Governance sub-categories (except Board Governance Disclosure sub-category which is
significant with a negative coefficient only for 2003 at p-value = 0.10) and the return on assets.
The cross-listing variable is negatively significant for 2003 (p-value = 0.01) and 2004 (p-value =

27
0.05) confirming the earlier observation that cross-listing increases the costs associated with
corporate governance which depresses the accounting return on assets.
C. Is there a Market Reaction around the “Event” Date to any one the Globe & Mail’s Four Corporate Governance sub-category Score Disclosures?
Table 6 Panels B and D present the results of our short-window “event” study which
comprises of the following regression equation:
Rit = α + ∑ β Sub-category Score + γ ln (Sales) + δ Cross-listing Status+ ε (8)
Once again, consistent with the findings presented with respect to the relationship between Globe
& Mail composite governance scores and market reaction, we find no association even at any one
of the four sub-categories score level (except for Board Governance Disclosure sub-category is
significant at p-value = 0.10 for 2002 only).
Overall, based on these findings, we are unable to reject the second null hypothesis that
postulated no association between firm performance and the corporate governance sub-category
scores.
Robustness Tests
Since the majority of our findings indicate that Globe & Mail’s Corporate Governance
scores are not associated with firm performance, we ran sensitivity analysis to ensure that our
findings are robust. These results and discussion are presented in the following sections.
A. Impact of Quartile-based Portfolios
Given that we analyze a common sample of firms, across a three-year time period, it is
possible that the linearity assumption of regression analysis may hide differences in the firm
performance variables between firms with the highest governance scores and firms with the lowest
governance scores. To test for this, we sub-divided our sample, for each year, into quartiles. We
treated each quartile as a separate portfolio and computed mean scores for each of the firm

28
performance variables. The results from this analysis are presented in Table 7 Panel A, B, and C.
The final column of each of these the panels present the chi-square statistics for the Kruskal-Wallis
test of differences for the means across the four portfolios.
INSERT TABLE 7 ABOUT HERE
For 2002, mean and median scores for the Tobin’s Q and the price-to-book ratio increase for the
first 3 quartiles but both variables’ values decline for the fourth quartile firms (fourth quartile firms
have the highest corporate governance score in our sample). In 2003 and 2004, there is no clear
pattern in the mean and median scores for Tobin’s Q and the price-to-book ratio across the
quartiles. With the exception of 11-day stock return for 2003 (significant at p-value = 0.01), we do
not find an association across quartiles with the firm performance variables. This once again
confirms that Corporate Governance scores or ratings as complied by the Globe & Mail do not
help Canadian investors predict firm performance for the S&P/TSX index companies.
B. Impact of Changes in Composite Corporate Governance Scores
An argument can be made that after the initial release of the composite governance scores
by the Globe& Mail, it is more relevant to understand whether changes in a firm’s composite
corporate governance score are accompanied with changes in any one of our firm performance
variables. To test for this, we took the 2002 (2003) scores as a baseline and computed changes in
the composite corporate governance scores for 2003 (2004). We re-ran all the regressions in the
three econometric models presented above only to find the same insignificance as reported earlier.
In Table 6 Panels E and F we present the “event” study results which clearly indicate that
Canadian capital markets do not find value-relevant information in Globe & Mail’s Corporate
Governance ratings.
C. Potential for Survivorship Bias when working with the Sample of Firms Common to all Three Years

29
We chose to work with a time series instead of the cross-sectional data by focusing only on
the firms that were common to all the three years in our sample. One can argue that since we are
running cross-sectional linear regressions, our model does not necessitate working with the
common-set of firms to test our hypotheses. Thus, we may be introducing a survivorship bias in
our sample because we would be eliminating the firms that have ceased to exist or have been
acquired by other companies due to their poor performance (which may possibly be due to poor
corporate governance). Thus, we re-ran the regressions in Tables 3, 4, and 5. Except for some
changes in the significance levels of some of the previously significant corporate governance sub-
categories and few new categories emerging as significant in Table 411, we did not see any
consistent pattern of association emerge again, that would make us reconsider our earlier
conclusions.
V. Conclusions and Future Research
Taken together, our research study does not find consistently strong association between
the composite corporate governance scores as published annually by the Globe & Mail newspaper
and various measures of firm performance. Although, overall corporate governance score does not
help explain any change in the market value of the firm, when analyzing the same association at
the sub-category level, we find that some categories do emerge as significant but again on an
11 The new results are as follows with respect to Table 4 Panel A: 2002: R2 declines to .20, Board Composition and Board Governance Disclosure sub-categories are now significant at p-value = 0.01 instead of p-value = 0.10, Shareholder Rights are now significant at p-value = 0.05 instead of p-value = 0.10; No change in 2003; and for 2004 R2 increases to 0.34, Board Composition is significant at p-value = 0.01 instead of at p-value = 0.05, Board & CEO Compensation and Shareholder Rights which were not previously significant are now significant respectively at p-value = 0.01 and p-value = 0.10. Similarly, for Table 4 Panel B for 2002 R2 declines to 0.05 and Board Composition which was not significant earlier is nor significant at p-value = 0.01; for 2003 Board Composition and Board & CEO Compensation which were previously insignificant are now respectively significant at p-value = 0.05 and 0.10; for 2004 R2 increases to 0.16, Board Composition and Board & CEO compensation which were earlier significant at p-value = 0.10 are now respectively significant at p-value = 0.05 and p-value = 0.01.

30
inconsistent basis. Overall, these results are not robust across time and across various measures of
firm performance. These findings indicate to us that within the Canadian capital markets Globe
and Mail corporate governance rankings are not associated with firm performance as measured by
the market value of the firm, accounting measures of firm performance and a market reaction to
these annual disclosures. However, one should be careful not to prematurely conclude also that
there is no relationship between good corporate governance and firm performance because there
are a number of fundamental problems with this line of causality. One, it is possible that the
governance scores developed by the Globe & Mail do not adequately capture the true state of
overall corporate governance of our sample firms. There is no doubt that there is considerable
publicity in Canada around these rankings but we believe that it is more hype than reality. Two,
since there is no universal template that clearly defines what constitutes effective governance, it is
difficult to truly evaluate the “representational faithfulness” of the holistic governance rankings
from the Globe & Mail. A number of studies summarized in Section II suffer from the same
problem which makes comparison of results across countries virtually impossible. Third, although
our study examined 3-year of time series data, one can argue that corporate governance is
manifested in the market value of a firm over a much longer period of time especially when the
year 2002 was a year of corporate scandals in the United States as well as Canada, and the year
2003 was a year of recession in the United States. It is possible that these extraneous events may
be confounding some of the association that may be present in our sample firms. Last but not least,
one can also conclude that since the Globe & Mail scores are complied from the publicly filed
proxy circulars, this information is already impounded in the market measures of firm
performance. Consequently, one should expect no relationship between composite corporate

31
governance scores or ratings and firm performance, at least with respect to stock price reaction on
the date of disclosure and market value related measures of firm performance.
Canada is a significant trading partner with the United States and plays an important role in
the global capital markets, thus it is important to understand how good governance relates to firm
performance. Since it is the only country in the world where these rankings are made public
annually by a newspaper, it provides a fertile ground to test hypotheses related to good governance
and firm performance. Rather than conclusively declaring that within the Canadian capital
markets, good governance does not matter or there is no causal link between the two, we believe
additional research is needed to understand the impact that good governance practices have on a
firm’s performance. Future research in this area may explore some of the following questions: is it
possible that Canadian capital markets are so advanced that they expect a certain minimum level of
corporate governance from the firms operating in Canada and consequently do not reward the
firms for instituting good governance but do penalize the firms for poor governance? However, to
investigate this and other similar questions, we need to first clearly understand what is meant by
good corporate governance and how to best to measure those elements that constitute good
governance? Unfortunately, many of the good governance practices, such a director asking tough
questions in the board meetings, independence of the internal audit function etc. are difficult to
measure variables.
Overall, based on the results of this research study, we would advice investors to think
twice before spending a lot of resources to acquire these rankings, especially from the commercial
firms in U.S., Canada and other countries because these rankings are either complied from the
already publicly available information or are put together from self-administered surveys sent by
these commercial entities to the firms being rated themselves.

32
BIBLIOGRAPHY Bauer, Rob, Nadja Gunster and Roger Otten. 2004. “Empirical Evidence on Corporate Governance in Europe: The Effect on Stock Returns, Firm Value and Performance.” Journal of Asset Management 5 (August): 91-104. Black, Bernard S., Hasung Jang, and Woochan Kim. 2003. “Does Corporate Governance Predict Firm’s Market Values; Evidence from Korea” Working paper #237 of the Stanford Law School, John M. Olin Program in Law and Economics. Cheng, C.S. Agnes, Denton Collins, and Henry Huang. 2003. “The Effect of the S&P T&D Rankings on Market Beta, Abnormal Returns and Earnings Response Coefficients in the Period Surrounding the Report Release Date.” Working paper, University of Houston. Coase, R. H. 1937. “The Nature of the Firm.” Economica, New Series, 4 (16): 386-405. Coombes, Paul and Mark Watson. 2000. “Three Surveys on Corporate Governance.” The McKinsey Quarterly 4: 74-77. Core, John, Wayne Guay and Tjomme Rusticus. May 2004 version. “Does Weak Governance Cause Weak Stock Returns? An Examination of Firm Operating Performance and Analysts’ Expectations.” Working paper, The Wharton School, University of Pennsylvania. Drobetz, W., A. Schillhofer, and H. Zimmermann. 2003. “Corporate Governance and Firm Performance: Evidence from Germany.” Working paper, University of Basel. Erickson, Timothy and Tony M. Whited. 2001. “On the Information Content of Different Measures of Q.” Working Paper, University of Wisconsin - Madison. Felton, Robert F., Alec Hudnut, and Jennifer van Heeckeren. 1996. “Putting a Value on Board Governance.” The McKinsey Quarterly 4: 170-175. Foerster, Stephen R. and Brian C. Huen. 2004. “Does Corporate Governance Matter to Canadian Investors?” Canadian Investment Review (Fall): 19-25. Gompers, Paul, Joy Ishii, and Andrew Metrick. 2003. “Corporate Governance and Equity Prices.” The Quarterly Journal of Economics 118 (February): 107-155. Jensen, Michael C. and William H. Meckling. 1976. “Theory of the Firm: Managerial Behavior, Agency Costs, and Ownership Structure.” Journal of Financial Economics 3: 305-360. Maher, Maria and Thomas Andersson. 1999. “Corporate Governance: Effects on Firm Performance and Economic Growth.” Organization for Economic Co-operation and Development Monks, R. A. G. and N. Minow. 2001. Corporate Governance. 2nd ed. Blackwell Publishing.

33
Monks, R. A. G. and N. Minow. 1996. Watching the Watchers: Corporate Governance for the 21st Century. Blackwell Publishing. Morck, Randall, Andrei Shleifer, and Robert Vishny. 1988. “Management Ownership and Market Valuation: An Empirical Analysis.” Journal of Financial Economics 20: 293-315. Patel, Sandeep A. and George Dallas. 2002. ‘Transparency and Disclosure: Overview of Methodology and Study Results-United States.” Standard & Poors. Shleifer, Andrei and Robert Vishny. 1997. “A Survey of Corporate Governance.” Journal of Finance 52 (June): 737-783. Sonnenfeld, Jeffrey. 2004. “Good Governance and the Misleading Myths of Bad Metrics” Academy of Management Executive 18 (1): 108-113. von Nandelstadh, Alexander and Matts Rosenberg. 2003. “Corporate Governance Mechanisms and Firm Performance: Evidence from Finland.” Working paper, Swedish School of Economics and Business Administration, Helsinki, Finland White, Gerald I., Ashwinpaul C. Sondhi and Dov Fried. 1998. The Analysis and Use of Financial Statements, 2nd Edition, John Wiley and Sons, New York.

34
TABLE 1 Governance Scores
Panel A: All sample firms 2002 2003 2004
Mean 61.68 67.08 71.59 Std Dev 14.72 13.96 13.85 Coefficient of Variation .24 .21 .19 Quartile ranges: Minimum 36 34 38 Q1 50 57 63 Median 59.5 67 73 Q3 73 78 83 Maximum 96 94 95 Means for score components: Board Composition 24.83 26.57 29.38 Board and CEO Compensation 12.80 13.28 12.46 Shareholder Rights 17.30 17.02 19.36 Board Governance Related Disclosures 6.71 10.20 10.40
Number of Companies 178 178 178 Panel B: Conditional on cross-listing status 2002 2003 2004 Not
cross-listed
Cross-listed
Not cross-listed
Cross-listed
Not cross-listed
Cross-listed
Mean for overall governance score
58.88 64.48*** 64.45 69.53*** 68.43 74.54***
Means for score components:
Board Composition 22.97 26.70*** 24.72 28.30*** 27.99 30.66** Board and CEO Compensation
12.31 13.28 12.66 13.85* 11.67 13.18***
Shareholder Rights 17.57 17.02 17.21 16.85 18.71 19.97* Board Governance Related Disclosures
5.96 7.47*** 9.84 10.53* 10.06 10.73*
Number of observations
89 89 86 92 86 92

35
Notes: • The maximum score for each component is:
2002 2003 2004
Board Composition 40 40 40 Board and CEO Compensation 23 21 19 Shareholder Rights 22 24 28 Board Governance related Disclosures 15 15 13 Total 100 100 100
• The sample consists of 178 companies for which the Globe and Mail reported governance
scores in 2002, 2003, and 2004. • Cross-listing status for 2002 (2003) [2004] is obtained from TSX Review for October 2002
(September 2003) [October 2004]. • Differences in mean scores between the non-cross-listed and cross-listed samples are tested
using the Wilcoxon test with one-tailed probabilities: o * significant at 0.10, ** significant at 0.05, *** significant at 0.01
36
TABLE 2 Descriptive Statistics
Panel A: Univariate statistics for 2002 Mean Std Dev Minimum Q1 Median Q3 Maximum N Governance score 61.80 14.72 36 50 60 73 96 178Tobin’s Q 1.63 1.18 0.44 1.03 1.21 1.82 7.88 174Price-to-book ratio 1.99 1.34 -3.73 1.20 1.70 2.58 8.40 171Sales ($000s) 3,247.67 5,196.57 0.00 393.98 1,124.39 3,295.85 24,769.00 178Return on assets 1.79 8.94 -37.44 -0.03 2.74 5.65 23.64 17811-day stock return 0.0081 0.0839 -0.2412 -0.0381 0.0060 0.0599 0.2656 1782-day stock return 0.0016 0.0488 -0.1886 -0.0263 0.0076 0.0343 0.1275 178 Panel B: Spearman correlations for 2002 Tobin’s Q Price-to-book ratio Sales Return on assets 11-day stock
return 2-day stock
return Governance score 0.010 0.092 0.187** 0.060 0.188** 0.198*** Tobin’s Q 0.862*** -0.398*** 0.280*** -0.076 -0.062 Price-to-book ratio -0.175** 0.299*** -0.004 -0.006 Sales 0.015 0.194*** 0.293*** Return on assets 0.004 -0.004 11-day stock return 0.621*** Panel C: Univariate statistics for 2003 Mean Std Dev Minimum Q1 Median Q3 Maximum N Governance score 67.08 13.96 34 57 67 78 94 178Tobin’s Q 1.81 1.72 0.55 1.05 1.27 1.86 16.03 177Price-to-book ratio 2.33 1.57 0.27 1.36 1.90 2.92 10.98 174Sales ($000s) 3,404.81 5,373.20 0.00 434.63 1,200.05 3,398.11 27,446.00 178Return on assets 2.12 7.44 -39.94 0.54 2.90 5.85 20.16 17811-day stock return -0.0547 0.0690 -0.4536 -0.0851 -0.0518 -0.0184 0.1558 1782-day stock return -0.0161 0.0261 -0.0714 -0.0297 -0.0146 -0.0055 0.1325 178

37
Panel D: Spearman correlations for 2003 Tobin’s Q Price-to-book ratio Sales Return on assets 11-day stock
return 2-day stock return
Governance score -0.078 -0.044 0.275*** -0.009 -0.174** 0.122 Tobin’s Q 0.865*** -0.416*** 0.248*** -0.012 0.225*** Price-to-book ratio -0.187** 0.194** 0.034 0.212*** Sales 0.068 -0.002 0.035 Return on assets 0.016 0.068 11-day stock return 0.272*** Panel E: Univariate statistics for 2004 Mean Std Dev Minimum Q1 Median Q3 Maximum N Governance score 71.59 13.85 38 63 73 83 95 178Tobin’s Q 1.71 1.05 0.55 1.08 1.40 1.93 8.55 172Price-to-book ratio 2.30 1.33 0.02 1.37 2.07 2.84 8.70 175Sales ($000s) 3,709.70 5,455.45 0.00 518.74 1,488.31 3,949.00 29,198.00 173Return on assets 2.75 7.15 -46.45 0.90 3.31 5.81 18.17 17311-day stock return -0.0084 0.0665 -0.1773 -0.0427 -0.0114 0.0329 0.4069 1782-day stock return 0.0063 0.0391 -0.0798 -0.0161 0.0087 0.0247 0.3206 178 Panel F: Spearman correlations for 2004 Tobin’s Q Price-to-book ratio Sales Return on assets 11-day stock
return 2-day stock return
Governance score -0.042 0.037 0.270*** -0.032 0.014 0.105 Tobin’s Q 0.852*** -0.354*** 0.223*** 0.016 -0.226*** Price-to-book ratio -0.131* 0.109 0.158** -0.087 Sales 0.069 0.104 0.271*** Return on assets 0.083 0.066 11-day stock return 0.514*** Notes:
• The sample consists of 178 companies for which the Globe and Mail reported governance scores in 2002, 2003, and 2004. The scores were published on October 7, 2002, September 22, 2003, and October 12, 2004.

38
• Tobin’s Q for 2002 (2003) [2004] was calculated using the market value of common stock at the end of October 2002
(September 2003) [October 2004] and book values at the most recent fiscal year end on or before October 2002 (September 2003) [October 2004].
• The price-to-book ratio for 2002 (2003) [2004] is obtained from Compustat Research Insight for October 2002 (September
2003) [October 2004]. • Sales and return on assets for 2002 (2003) [2004] are the values at the most recent fiscal year end on or before October 2002
(September 2003) [October 2004]. Total assets and sales are measured in millions of dollars.
• Stock returns are obtained from the TSE/CFMRC database and are adjusted for the CFMRC equally-weighted market index.
• Cross-listing status for 2002 (2003) [2004] is obtained from TSX Review for October 2002 (September 2003) [October 2004]. Cross-listing status equals 0 for non-cross-listed firms and 1 for cross-listed firms.
• * significant at 0.10, ** significant at 0.05, *** significant at 0.01

39
TABLE 3 Market Valuation and Overall Governance Scores
Panel A: Tobin’s Q = α + β Governance Score + γ ln(Sales) + δ Return on Assets + ζ Cross-listing status Intercept Governance score Ln (sales) Return on
assets Cross-listing
status Adj R2 N
2002 3.390*** (9.24)
0.003 (0.64)
-0.297*** (-8.75)
0.030*** (3.46)
-0.037 (-0.24) 0.305 174
2003 4.467*** (7.69)
-0.003 (-0.32)
-0.371*** (-6.71)
-0.044*** (-2.79)
0.317 (1.41) 0.315 177
2004 3.646*** (8.76)
-0.002 (-0.38)
-0.295*** (-6.76)
0.031*** (2.77)
0.427*** (2.90) 0.240 172
Panel B: Price-to-book ratio = α + β Governance Score + γ ln(Sales) + δ Return on Assets + ζ Cross-listing status Intercept Governance score Ln (sales) Return on
assets Cross-
listing status Adj R2 N
2002 2.770*** (5.96)
0.011 (1.61)
-0.211*** (-4.86)
0.038*** (3.47)
-0.197 (-1.01) 0.138 171
2003 4.180*** (6.90)
-0.002 (-0.21)
-0.261*** (-4.53)
0.003 (0.16)
0.111 (0.47) 0.108 174
2004 3.495*** (6.02)
-0.002 (-0.26)
-0.203*** (-3.31)
0.045*** (2.87)
0.574*** (2.78) 0.087 170
Notes:
• The sample and variables are described in the notes to Tables 1 and 2. • * significant at 0.10, ** significant at 0.05, *** significant at 0.01; t-statistics are shown in parentheses below the coefficient
estimates

40
TABLE 4 Market Valuation and Governance Sub-categories
Panel A: Tobin’s Q = α + ∑ β Score + γ ln (Sales) + δ Return on Assets + ζ Cross-listing status
Intercept Board Composition
score
Board and CEO
Compensation score
Shareholder rights score
Board Governance Disclosure
score
ln(sales) Return on assets
Cross-listing status
Adj R2 N
2002 3.113*** (7.76)
-0.020* (-1.96)
0.003 (0.16)
0.033* (1.83)
0.061* (1.95)
-0.305*** (-8.91)
0.029*** (3.47)
-0.027 (-0.17)
0.325 174
2003 4.400*** (7.32)
-0.017 (-1.12)
0.018 (0.58)
0.013 (0.52)
0.002 (0.04)
-0.393*** (-6.61)
-0.043*** (-2.70)
0.345 (1.50)
0.309 177
2004 3.932*** (9.21)
-0.026** (-2.34)
0.038 (1.65)
0.020 (1.56)
-0.016 (-0.55)
-0.344*** (-7.22)
0.033** (3.01)
0.414*** (2.84)
0.265 172
Panel B: Price-to-book ratio = α + ∑ β Score + γ ln (Sales) + δ Return on Assets + ζ Cross-listing status
Intercept Board Composition
score
Board and CEO
Compensation score
Shareholder rights score
Board Governance Disclosure
score
ln(sales) Return on assets
Cross-listing status
Adj R2 N
2002 2.723*** (5.33)
-0.016 (-1.22)
0.015 (0.63)
0.019 (0.82)
0.105** (2.58)
-0.225*** (-5.13)
0.037*** (3.48)
-0.253 (-1.27)
0.159 171
2003 4.214*** (6.76)
-0.025 (-1.59)
0.052 (1.56)
-0.003 (-0.09)
0.015 (0.40)
-0.306*** (-4.95)
0.005 (0.29)
0.116 (0.48)
0.113 174
2004 3.877*** (6.48)
-0.029* (-1.81)
0.063* (1.94)
0.013 (0.71)
-0.025 (-0.61)
-0.265*** (-3.96)
0.048*** (3.08)
0.538*** (2.62)
0.103 170
Notes:
• The sample and variables are described in the notes to Tables 1 and 2. • * significant at 0.10, ** significant at 0.05, *** significant at 0.01; t-statistics are shown in parentheses below the coefficient
estimates

41
TABLE 5 Operating Performance
Panel A: Return on Assets = α + β Governance Score + γ ln(Book-to-Market) + δ ln(Sales) + ζ Cross-listing status Intercept Governance score ln (Book-to-
market) ln (Sales) Cross-listing status Adj R2 N
2002 -7.365** (-2.23)
0.018 (0.38)
-2.330** (-2.43)
1.039*** (3.36)
-0.129 (-0.09)
0.067 170
2003 -3.864 (-1.30)
-0.019 (-0.48)
-0.901 (-1.03)
1.242*** (4.70)
-3.523*** (-3.29)
0.156 174
2004 -8.120*** (-2.81)
-0.030 (-0.77)
-1.582** (-2.13)
1.854*** (6.77)
-2.358** (-2.33)
0.231 170
Panel B: Return on Assets = α + ∑ β score + γ ln(Book-to-Market) + δ ln(Sales) + ζ Cross-listing status
Intercept
Board Composition
score
Board and CEO
Compensation score
Shareholder rights score
Board Governance Disclosure
score
ln (Book-to-market) ln (Sales)
Cross-listing status Adj R2 N
2002 -7.548** (-2.03)
0.045 (0.49)
-0.107 (-0.60)
-0.054 (-0.32)
0.031 (0.10)
-2.422** (-2.47)
1.092*** (3.40)
-0.075 (-0.05) 0.053 170
2003 -3.385 (-1.11)
0.060 (-0.82)
-0.019 (-0.12)
-0.032 (-0.26)
-0.323* (-1.78)
-1.031 (-1.17)
1.340*** (4.70)
-3.600*** (-3.31) 0.158 174
2004 -9.462*** (-3.14)
-0.000 (-0.00)
-0.238 (-1.47)
-0.065 (-0.73)
0.248 (1.20)
-1.757** (-2.34)
1.954*** (6.33)
-2.250** (-2.21) 0.231 170
Notes:
• The sample and variables are described in the notes to Tables 1 and 2. • The book-to-market ratio is calculated as the inverse of the price-to-book ratio].
• * significant at 0.10, ** significant at 0.05, *** significant at 0.01; t-statistics are shown in parentheses below the coefficient
estimates

42
TABLE 6 Market Reaction
Panel A: 11-day Stock Return = α + β Governance Score + γ ln(Sales) + δ Cross-listing Status Intercept Governance score ln (Sales) Cross-listing status Adj R2 N
2002 -0.096*** (-3.23)
0.001* (1.83)
0.007*** (2.66)
0.013 (1.07) 0.061 178
2003 -0.008 (-0.29)
-0.000 (-0.99)
-0.002 (-0.72)
-0.017 (-1.57) 0.011 178
2004 -0.021 (-0.71)
-0.000 (-0.40)
0.003 (1.21)
0.003 (0.26) -0.009 173
Panel B: 11-day Stock Return = α + ∑ β Score + γ ln(Sales) + δ Cross-listing Status
Intercept
Board Composition
score
Board and CEO
Compensation score
Shareholder rights score
Board Governance Disclosure
score
ln (Sales)
Cross-listing status Adj R2 N
2002 -0.084** (-2.53)
0.000 (0.25)
0.001 (0.44)
-0.000 (-0.22)
0.005* (1.89)
0.007** (2.49)
0.009 (0.69) 0.062 178
2003 -0.011 (-0.37)
-0.001 (-0.91)
-0.000 (-0.32)
-0.000 (-0.20)
0.001 (0.37)
-0.002 (-0.77)
-0.016 (-1.50) -0.003 178
2004 -0.017 (-0.55)
-0.000 (-0.02)
0.001 (0.83)
-0.001 (-1.31)
-0.000 (-0.16)
0.003 (0.87)
0.001 (0.13) -0.014 173
Panel C: 2-day Stock Return = α + β Governance Score + γ ln(Sales) + δ Cross-listing Status Intercept Governance score ln (Sales) Cross-listing status Adj R2 N
2002 -0.065*** (-3.84)
0.000* (1.91)
0.006*** (3.86)
-0.005 (-0.70) 0.098 178
2003 -0.009 (-0.89)
0.000 (1.07)
-0.003*** (-3.38)
0.008** (2.05) 0.076 178
2004 -0.023 (-1.32)
0.000 (0.67)
0.003 (1.54)
0.000 (0.01) 0.004 173

43
Panel D: 2-day Stock Return = α + ∑ β Score + γ ln(Sales) + δ Cross-listing Status
Intercept
Board Composition
score
Board and CEO
Compensation score
Shareholder rights score
Board Governance Disclosure
score
ln (Sales)
Cross-listing status Adj R2 N
2002 -0.054*** (-2.89)
0.000 (0.72)
0.001 (1.34)
-0.001 (-0.84)
0.002 (1.11)
0.006*** (3.53)
-0.008 (-1.04) 0.100 178
2003 -0.013 (-1.24)
0.000 (1.00)
-0.001 (-1.65)
0.001 (1.52)
0.000 (0.60)
-0.003*** (-2.65)
0.009** (2.28) 0.084 178
2004 -0.025 (-1.37)
0.000 (0.59)
0.000 (0.43)
-0.001 (-1.12)
0.001 (0.94)
0.002 (1.29)
-0.000 (-0.08) 0.004 173
Panel E: 11-day Stock Return = α + β Change in Governance Score + γ ln(Sales) + δ Cross-listing Status Intercept Change in
Governance score ln (Sales) Cross-listing status Adj R2 N
2003 -0.030 (-1.61)
0.000 (0.67)
-0.003 (-1.03)
-0.018* (-1.77) 0.008 178
2004 -0.031 (-1.49)
0.000 (0.71)
0.003 (1.11)
0.001 (0.12) -0.007 173
Panel F: 2-day Stock Return = α + β Change in Governance Score + γ ln(Sales) + δ Cross-listing Status Intercept Change in
Governance score ln (Sales) Cross-listing status Adj R2 N
2003 -0.001 (-0.16)
0.000 (0.22)
-0.003*** (-3.32)
0.009** (2.31) 0.070 178
2004 -0.015 (-1.26)
0.000 (0.67)
0.003* (1.78)
0.001 (0.16) 0.004 173
Notes:
• The sample and variables are described in the notes to Tables 1 and 2.

44
• Change in governance score is calculated as the governance score in 2003 minus the governance score in 2002.
• * significant at 0.10, ** significant at 0.05, *** significant at 0.01; t-statistics are shown in parentheses below the coefficient estimates
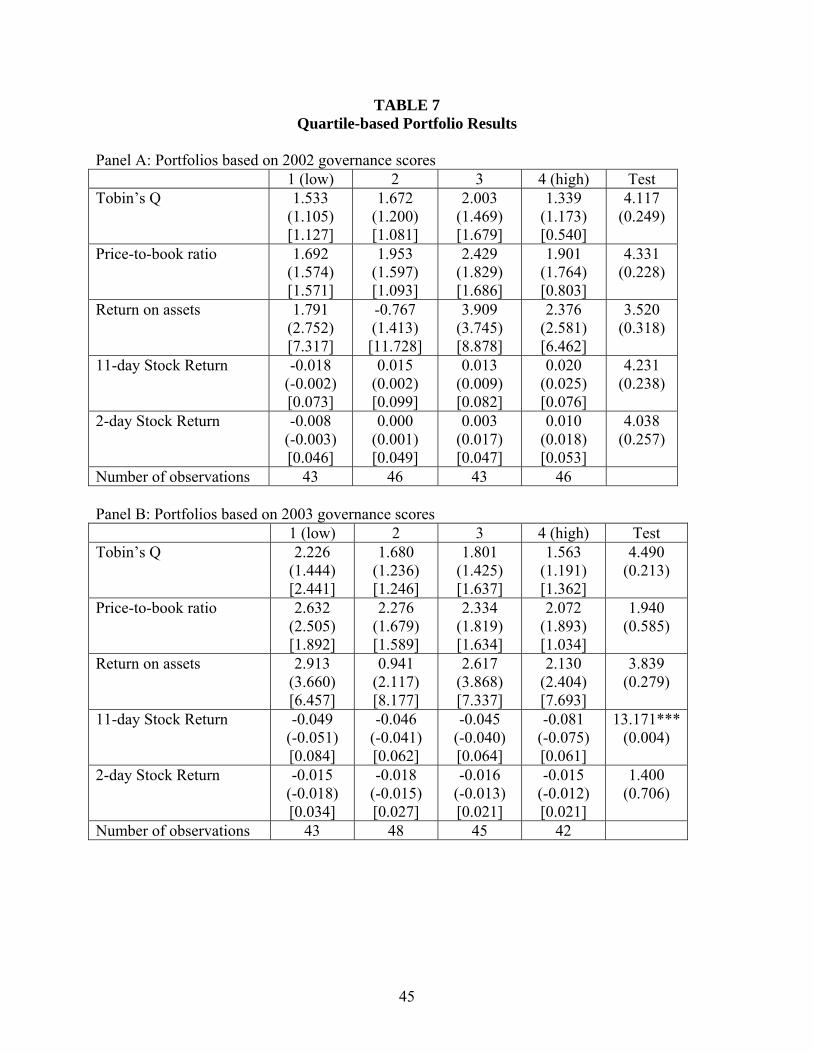
45
TABLE 7 Quartile-based Portfolio Results
Panel A: Portfolios based on 2002 governance scores 1 (low) 2 3 4 (high) Test Tobin’s Q 1.533
(1.105) [1.127]
1.672 (1.200) [1.081]
2.003 (1.469) [1.679]
1.339 (1.173) [0.540]
4.117 (0.249)
Price-to-book ratio 1.692 (1.574) [1.571]
1.953 (1.597) [1.093]
2.429 (1.829) [1.686]
1.901 (1.764) [0.803]
4.331 (0.228)
Return on assets 1.791 (2.752) [7.317]
-0.767 (1.413) [11.728]
3.909 (3.745) [8.878]
2.376 (2.581) [6.462]
3.520 (0.318)
11-day Stock Return -0.018 (-0.002) [0.073]
0.015 (0.002) [0.099]
0.013 (0.009) [0.082]
0.020 (0.025) [0.076]
4.231 (0.238)
2-day Stock Return -0.008 (-0.003) [0.046]
0.000 (0.001) [0.049]
0.003 (0.017) [0.047]
0.010 (0.018) [0.053]
4.038 (0.257)
Number of observations 43 46 43 46 Panel B: Portfolios based on 2003 governance scores 1 (low) 2 3 4 (high) Test Tobin’s Q 2.226
(1.444) [2.441]
1.680 (1.236) [1.246]
1.801 (1.425) [1.637]
1.563 (1.191) [1.362]
4.490 (0.213)
Price-to-book ratio 2.632 (2.505) [1.892]
2.276 (1.679) [1.589]
2.334 (1.819) [1.634]
2.072 (1.893) [1.034]
1.940 (0.585)
Return on assets 2.913 (3.660) [6.457]
0.941 (2.117) [8.177]
2.617 (3.868) [7.337]
2.130 (2.404) [7.693]
3.839 (0.279)
11-day Stock Return -0.049 (-0.051) [0.084]
-0.046 (-0.041) [0.062]
-0.045 (-0.040) [0.064]
-0.081 (-0.075) [0.061]
13.171***(0.004)
2-day Stock Return -0.015 (-0.018) [0.034]
-0.018 (-0.015) [0.027]
-0.016 (-0.013) [0.021]
-0.015 (-0.012) [0.021]
1.400 (0.706)
Number of observations 43 48 45 42

46
Panel C: Portfolios based on 2004 governance scores 1 (low) 2 3 4 (high) Test Tobin’s Q 1.767
(1.374) [1.427]
1.863 (1.509) [1.100]
1.759 (1.407) [0.994]
1.449 (1.365) [0.499]
2.276 (0.517)
Price-to-book ratio 2.326 (1.903) [1.612]
2.362 (2.036) [1.452]
2.291 (1.970) [1.235]
2.225 (2.224) [1.015]
0.455 (0.929)
Return on assets 2.211 (2.830) [6.880]
2.809 (3.629) [6.103]
3.032 (2.658) [9.703]
2.922 (2.990) [5.184]
1.567 (0.667)
11-day Stock Return -0.004 (-0.008) [0.057]
-0.020 (-0.021) [0.067]
0.001 (-0.009) [0.084]
-0.012 (-0.011) [0.055]
1.822 (0.610)
2-day Stock Return 0.002 (0.004) [0.031]
0.005 (0.006) [0.036]
0.009 (0.005) [0.054]
0.008 (0.017) [0.030]
2.200 (0.532)
Number of observations 44 43 46 45 Notes:
• The sample was divided into four quartiles using the governance scores. Portfolio 1 (4) contains firms with the lowest (highest) governance scores.
• Mean (median) values [standard deviations] are shown in the second to fifth columns.
The final column, labeled Test, contains the Chi-Square statistic (p-value) for the Kruskal-Wallis test of differences across the quartiles.
• The sample and variables are described in the notes to Tables 1 and 2. • * significant at 0.10, ** significant at 0.05, *** significant at 0.01
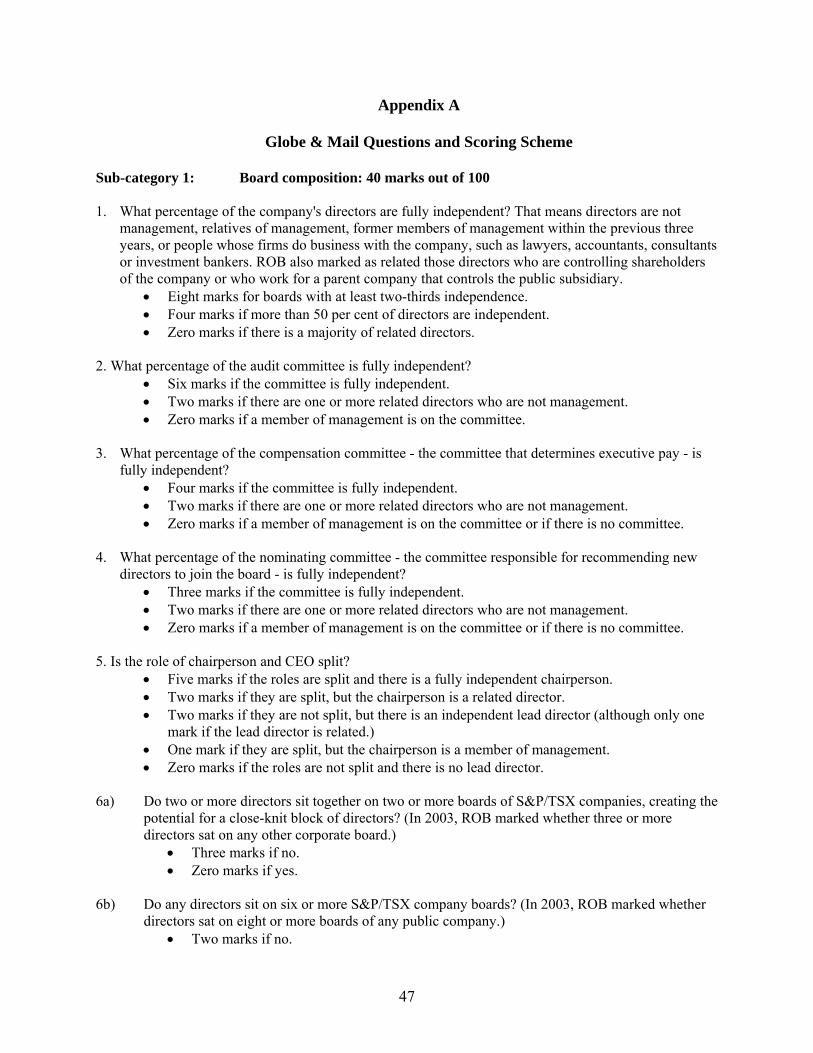
47
Appendix A
Globe & Mail Questions and Scoring Scheme
Sub-category 1: Board composition: 40 marks out of 100 1. What percentage of the company's directors are fully independent? That means directors are not
management, relatives of management, former members of management within the previous three years, or people whose firms do business with the company, such as lawyers, accountants, consultants or investment bankers. ROB also marked as related those directors who are controlling shareholders of the company or who work for a parent company that controls the public subsidiary.
• Eight marks for boards with at least two-thirds independence. • Four marks if more than 50 per cent of directors are independent. • Zero marks if there is a majority of related directors.
2. What percentage of the audit committee is fully independent?
• Six marks if the committee is fully independent. • Two marks if there are one or more related directors who are not management. • Zero marks if a member of management is on the committee.
3. What percentage of the compensation committee - the committee that determines executive pay - is
fully independent? • Four marks if the committee is fully independent. • Two marks if there are one or more related directors who are not management. • Zero marks if a member of management is on the committee or if there is no committee.
4. What percentage of the nominating committee - the committee responsible for recommending new
directors to join the board - is fully independent? • Three marks if the committee is fully independent. • Two marks if there are one or more related directors who are not management. • Zero marks if a member of management is on the committee or if there is no committee.
5. Is the role of chairperson and CEO split?
• Five marks if the roles are split and there is a fully independent chairperson. • Two marks if they are split, but the chairperson is a related director. • Two marks if they are not split, but there is an independent lead director (although only one
mark if the lead director is related.) • One mark if they are split, but the chairperson is a member of management. • Zero marks if the roles are not split and there is no lead director.
6a) Do two or more directors sit together on two or more boards of S&P/TSX companies, creating the
potential for a close-knit block of directors? (In 2003, ROB marked whether three or more directors sat on any other corporate board.)
• Three marks if no. • Zero marks if yes.
6b) Do any directors sit on six or more S&P/TSX company boards? (In 2003, ROB marked whether
directors sat on eight or more boards of any public company.) • Two marks if no.

48
• Zero marks if yes. 7. Are there any women on the board?
• Two marks if one-third of the board or more are women. • One mark if there is at least one woman on the board. • Zero marks if there are no women.
8. Does the board have a system to evaluate its performance?
• Four marks if there is a formal board evaluation and a formal individual director evaluation, with detailed disclosure of what sort of process is used for both.
• Three marks if there is a formal board evaluation, but no individual director review, or only informal individual director review.
• One mark if there is only a cursory mention of evaluation with no detailed disclosure of the process, or if the company says it only has informal evaluations.
• Zero marks if there is no evaluation. 9. Do independent directors meet without management?
• Three marks if they meet without management at every board meeting. • Two marks if there are regular meetings without management. • One mark if it happens occasionally. • Zero marks if there is no mention or if there are no meetings without management.
Sub-category 2: Share holding and Compensation: 19 marks out of 100 10a) Are directors required to own shares or share units? (Stock options don't count.)
• Four marks if the requirement is equal to at least three times the annual retainer paid to directors.
• Two marks if there is a requirement, but it is lower than three times retainer. • Zero marks if there is no requirement.
10b) How many shares to directors own?
• Four marks maximum, but minus one mark for each director who owns less than three times the annual retainer. (In 2003, ROB marked whether directors owned 2,000 shares or more, but decided to tie the requirement to retainer in 2004 to recognize the differences in companies' share prices, and in the compensation differences among companies.)
• If a director has been on the board less than one year, the ownership requirement does not apply.
• If a director has been on the board one to two years, the required ownership level is reduced to one times the retainer.
• If the base retainer is over $100,000 a year (usually when companies have introduced flat fee director compensation), the ownership requirement is 1.5 times retainer.
11a) Is the CEO required to own shares? (Stock options don't count.)
• Two marks if there is a requirement, or if the CEO is the company's controlling shareholder.
• Zero marks if there is no requirement.

49
11b) Does the CEO own shares? • Three marks if the CEO owns shares at least equal to his or her base cash salary. (In
2003, ROB marked whether CEOs owned at least 50,000 shares, but decided to tie the requirement to base salary to recognize differences in companies' share prices as well as compensation differences among companies.)
• Two marks if the CEO owns shares equal to 40 per cent of his or her base salary. • Zero marks if the CEO owns shares worth less than 40 per cent of his or her base salary.
12. Does the company give loans to its senior executives?
• Two marks if there are no loans or if the company is a bank and makes loans at consumer rates. (In 2003, companies received four marks for no loans, but the maximum score was reduced because loans have become less commonly used.)
• One mark if the loans carry interest and are under $500,000 in total. • Zero marks if loans are interest free or over $500,000 in total.
13. How well does the company disclose the compensation policies it applies when deciding CEO
bonuses? • Four marks if the company explains in detail how it awards the CEO's bonus, including
details of financial targets that must be met to receive a full bonus, as well as how much these targets count toward the bonus (compared with other personal performance factors) and whether the criteria were met in the previous financial year.
• Three marks if the company explains its benchmarks generally and their weightings, but not the precise financial targets.
• Two marks if the company lists a number of benchmarks, but provides no details on how they are applied.
• One mark if there is only a cursory mention of benchmarks. • Zero marks if there are no clear benchmarks identified or if the company simply says
bonuses are based on "corporate performance." Sub-category III: Shareholder Rights: 28 marks out of 100 14. Do companies allow shareholders to vote for individual directors, or only the entire slate of
nominees? (This is a new question, replacing a question that has been dropped on whether companies have annual elections for all directors versus staggered board elections.)
• Four marks if there is voting for individual directors. • Zero marks if there is only slate voting.
15a) Are stock options excessively dilutive?
For 2004, ROB assessed the dilution based on the number of options outstanding at the company's fiscal year end as a percentage of all shares outstanding. Where the company has more than one class of shares, dilution is measured for whichever class of shares is diluted by the outstanding options. (In 2003, stock option dilution was calculated with a tougher formula that also included options approved for issuance but not yet granted. As well, the maximum possible score was six marks.)
• Four marks if the dilution is less than five per cent of outstanding shares. • Two marks if the dilution is between five per cent and 10 per cent of outstanding shares. • Zero marks if options are more than 10 per cent dilutive to shareholders.

50
15b) Is the annual grant rate excessive? • Four marks if the number of options granted in the last fiscal year was less than 1.5 per
cent of all shares outstanding. (In 2003, the threshold was two percent, and the question carried a maximum of two marks.)
• Zero marks if the grant rate exceeded 1.5 per cent annually. 15c) Is there a vesting period before options can be exercised?
• Two marks if yes. • Zero marks if some options are immediately exercisable upon granting.
16. What are other option plan features?
• Four marks if there is no stock option plan. • Zero marks if the company has re-priced its stock options in the past fiscal year. Otherwise:
16a) Does the company award options to directors?
• Two marks if there are no options for directors • One mark if the company's option plan includes a firm cap on director option grants. • Zero marks if directors participate in the option plan at the board's discretion.
16b) Has the company introduced performance hurdles that must be met before stock options can be
exercised, or requirements that shares must be held for a period after options are exercised? • Two marks if yes to either question. • Zero marks if no.
17. Are there non-voting or subordinate voting shares?
• Ten marks if there are no dual-class shares. (In 2003, ROB awarded a maximum of eight marks.)
ROB gave reduced marks depending on the gap between the percentage of votes controlled by the superior voting shares and the percentage of the company's equity they represent, using the following guidelines:
• Five marks if the ratio is less than 2:1. • Four marks if the ratio is between 2:1 and 3: 1. • Three marks ifthe ratio is between 3:1 and 5:1. • Zero marks if the ratio is 5:1 or worse.
Sub-Category IV: Board Governance Disclosure issues: 13 marks out of 100 18. Does the company provide a full explanation of which directors are related and unrelated and
why? (In 2003, ROB also awarded marks if a company had a full statement of corporate governance practices, but this part of the question has been dropped.)
• Three marks if full disclosure. • Two marks if a company calls a director with close relationships an "independent"
director. • Zero marks if related directors are not identified by name.
19. Does the company disclose how much the auditor is paid for consulting and other services?
• Three marks if all the details are disclosed.

51
• Two marks if details are disclosed, but consulting fees are higher than audit fees. • One mark if consulting fees are more than double the audit fees. • Zero marks if there is no disclosure.
20. Does the company disclose detailed biographies to explain directors' qualifications to represent
shareholders? Does the company list other public company boards the directors sit on? • Two marks, one for each question. • Zero marks if there is no disclosure.
21. Does the company disclose director attendance records at board meetings?
• Two marks for disclosure. • One mark if any director has missed more than one-third of meetings. • Zero marks if there is no disclosure or if there are only average attendance numbers provided
for the board as a whole. 22. How often did the board and its committees meet last year?
• Three marks for full disclosure. • Two marks for partial disclosure. • Zero marks for no disclosure.
Source: Globe & Mail website.