tobin’s q of asian banks after recovering from the 1997
TRANSCRIPT

142
* Department of Finance Faculty of Commerce and AccountancyThammasat University, Bangkok 10200, Thailand, E-mail address: [email protected]** School of Business University of the Thai Chamber of Commerce126/1 Vibhavadee-Rangsit Road, Dindaeng, Bangkok 10400, Thailand, E-mail address: [email protected]
Tobin’s Q of Asian Banks after Recoveringfrom the 1997 Financial Crisis
Pornchai Chunhachinda* Li Li**
Abstract
This paper studies the Tobin’s Q in eight major Asian countries over the period of 2004-2013. The eight major countries studied are Hong Kong, Indonesia, Malaysia, the Philippines, Singapore, South Korea, Taiwan and Thailand. The results indicate that on average banks in Indonesia have the highest Q ratio of 1.125 followed by banks in the Philippines with 1.075, and banks in Taiwan and South Korea have the lowest Q ratios of 0.995 and 0.990, respectively. However, the determinants of Tobin’s Q were found to be quite different from country to country. For most countries, asset quality (loan loss reserves/gross loans), capital adequacy (equity/total assets), and liquidity (net loans/customer and short-term funding) are significantly associated with the Q ratio. Whereas the effects of profitability ROAA (return on average assets), ROAE (return on average equity), and NIM (net interest margin) on Q ratios are mixed.
JEL classification: G2; G21Keywords: Tobin’s Q, competitiveness, bank, Asian country
p.142-160_Tobin.indd 142 6/8/16 1:54 PM

143
บทคัดย่อ
งานวิจัยนี้ศึกษาเรื่อง Tobin’s Q ของธนาคารพาณิชย์ในประเทศเอเชียหลัก 8 ประเทศในช่วงปี ค.ศ. 2004-2013 โดย 8 ประเทศหลักประกอบด้วย ฮ่องกง อินโดนีเซีย มาเลเซีย ฟิลิปปินส์ สิงคโปร์ เกาหลีใต้ ไต้หวัน และประเทศไทย ผลการศึกษาพบว่าโดยเฉลี่ยธนาคารพาณิชย์ในประเทศอินโดนีเซียมีค่า Q ratio สูงที่สุดเท่ากับ 1.125 รองลงไปคือ ธนาคารพาณิชย์ในประเทศฟิลิปปินส์มีค่าเฉลี่ยเท่ากับ 1.075 ขณะที่ ธนาคารพาณิชย์ในประเทศไต้หวันและเกาหลีใต้มีค่า Q ratio ต่ำาที่สุดคือ 0.995 และ 0.990 ตามลำาดับ
อย่างไรก็ตาม ปัจจัยที่กำาหนดค่า Tobin’s Q พบว่ามีความแตกต่างกันในหลายๆ ประเทศ แต่โดย ส่วนใหญ่พบว่า คุณภาพของสินทรัพย์ ความเพียงพอของทุน และสภาพคล่อง เป็นปัจจัยที่มีนัยสำาคัญต่อ Q ratio ขณะที่ผลกระทบของปัจจัยเรื่องความสามารถในการทำากำาไร เช่น ROAA, ROAE, และ NIM ไม่ได ้ไปในทิศทางเดียวกัน
p.142-160_Tobin.indd 143 6/8/16 1:54 PM

144
1. Introduction
The Asian financial system has gone through many changes over the last decade. Among financial institutions, the banking sector is generally the first to be affected in a financial crisis. This is one of the reasons why banks always have been heavily regulated. Many research papers (e.g. Beck et al. 2006; Jonghe and Vennet 2008; Roussseau and Kim 2008; Joen et al. 2010) have studied the performance or efficiency improvement of banks after a financial crisis. This paper intends to study the Tobin’s Q of banks in major Asian countries during the period 2004-2013 after recovering from the 1997 Asian financial crisis. Eight countries chosen to be studied are as follows: Hong Kong, Indonesia, Malaysia, the Philippines, Singapore, South Korea, Taiwan and Thailand (although Hong Kong is not strictly a country, it is included as such in this paper).
Tobin’s Q ratio is selected to be studied in this paper since it measures the competitiveness of financial institutions valued by financial markets (Chunhachinda and Jumreornvong 1999), and it is used to examine the degree of market power of an individual firm or industry (Lindenberg and Ross 1981). Therefore, through computing the Q ratios for banks in different geographical locations, it can be found which banks and countries have higher degree of market power or higher competitiveness from the investors’ point of view. It is expected that banks from different countries will have different Q ratios since the environmental conditions and characteristics of banks are different among the Asian countries studied.
This paper also explores the possible determinants of a bank’s Q ratio. Seven variables were chosen to reflect the bank’s specific characteristics. First, the ratio of loan loss reserves to gross loans outstanding was used as a proxy for the bank’s asset quality (or riskiness). Second, the ratio of equity to total assets was used to measure the bank’s capital adequacy (or degree of financial leverage). Third to fifth variables, the net interest margin, the return on average assets and the return on average equity, were selected to measure the profitability or financial performance of a bank. Sixth and seventh variables, the ratio of net loans outstanding to customer and short-term funding and the ratio of liquid assets to deposits and short-term funding were used to measure bank liquidity.
The remainder of the paper is organized as follows. Section 2 contains the literature review. Section 3 details the data and methodology. Descriptive statistics and empirical results are discussed in Section 4. Section 5 has the study conclusion.
p.142-160_Tobin.indd 144 6/8/16 1:54 PM

145
2. Literature Review
Tobin’s Q (initially defined by Tobin in 1969) is “the value of capital relative to its replacement cost”. It is argued by many researchers that the rate of investment should be related to the Q ratio. Since its development, the Q ratio has been used to test a firm’s investment potential or performance potential in the financial markets. For instance, Chung and Wright (1998) tested the predictive power of Tobin’s Q in explaining valuation results of major corporate policy variables. It was found that high debt ratio and payout ratio were favorably viewed by the market when the firm was overinvesting. Rousseau and Kim (2008) used the Q ratio to examine the investment behavior among exchange-listed Korean manufacturing companies before and after the 1997 financial crisis. It was found that the Q ratio is a robust determinant of investment made during the period 1992-2001.
Some papers also have used Tobin’s Q to study the banking industry. Aliber (1984) compared Tobin’s Q ratio of international banks to other industry firms in nine industrial countries, including Canada, France, Germany, Italy, Japan, the Netherlands, Switzerland, the United Kingdom and the United States for the period 1974-1982. Aliber (1984) found that the Q ratios for banks are about the same as those for all firms in most countries. However, the Q ratios for the banks are lower than those for industrial firms in the United States and the United Kingdom whereas the Q ratios for the banks are higher than those for industrial firms in Japan and Switzerland. The data also shows that the Q ratios for Japanese banks are higher than those for other countries.
Chunhachinda and Jumreornvong (1999) used Tobin’s Q ratio to measure the competitiveness of banks and finance companies in Thailand during the period of 1990-1996. They conclude that finance companies are more competitive than banks since the Q ratios of banks are significantly lower than those of finance companies. The paper further investigated the relationship between the Q ratios of banks and their characteristics such as performance (measured by net interest margin and return on equity), liquidity (proxied by the funding gap, the ratio of loans to deposits and the ratio of current assets to total loans), leverage (measured by the ratio of total assets to equity) and size (approximated by the log of total assets). The research suggested that the higher Tobin’s Q of a bank depends on higher profitability, liquidity and leverage, and smaller size of assets.
p.142-160_Tobin.indd 145 6/8/16 1:54 PM

146
Recently, corporate governance has been considered another important factor affecting the performance of a firm. Several studies have constructed corporate governance indexes or focused on different specific dimensions of corporate governance, such as in Bagchi (2011), Bhagat and Bolton (2008), Cheung et al. (2011), and Ho (2005). These studies conclude that firms having improvements in the quality of corporate governance will show an increase in market valuation in terms of Tobin’s Q and market-to-book ratio. Ho’s (2005) research results suggest that the relationship between corporate governance and firm competitiveness is much stronger when corporate governance is studied on a holistic nature rather than as an individual dimension.
Other than corporate governance, other factors have further been studied. Ownership concentration is found to have negative effect on a sample of European banks’ Tobin’s Q (Busta et al. 2014). Portfolios of trademarks with wide diversification do not help increase US commercial banks’ Tobin’s Q (Gonzalez-Pedraz and Mayordomo 2012). Foreign ownership, market power, and asset diversification are found to significantly affect Tobin’s Q of banks in new European Union member countries (Fang et al. 2014).
Most research literature modified or expanded the original Tobin’s Q formula. For instance, Chung and Pruitt (1994) had a simple approximation of Tobin’s Q as the following:
Chung and Pruitt’s approximate Q = (MVE + PS + DEBT)/TA (1) where MVE = a firm’s share price x the number of common shares outstanding PS = liquidating value of a firm’s outstanding preferred shares DEBT = current liabilities – current assets + book value of long-term debt TA = book value of the total assets
Further examples can be found in studies such as Doukas (1995), Bharadwaj et al. (1999), and Jonghe and Vennet (2008), etc. For publicly traded banks, Tobin’s Q is defined as the ratio of the sum of market value of equity (MVE) and book value of liability (BVL) to the book value of the total assets (BVA) (Jones et al. 2011):
Q = (MVE + BVL)/BVA (2)
p.142-160_Tobin.indd 146 6/8/16 1:54 PM

147
The paper showed theoretically that the Q ratio is a “scaled real measure of charter value” of the bank. Further, the paper concluded that Q is not a useful cardinal measure of charter value though it is a useful ordinal measure.
3. Data and Methodology
3.1 DataAll annual accounting data, year-end stock prices and number of shares outstanding
used in this study were compiled from Bankscope. To avoid any currency exchange rate effect, all data was collected in local currencies. Eight countries were chosen for study – Hong Kong, Indonesia, Malaysia, the Philippines, Singapore, South Korea, Taiwan and Thailand. Although China is a major Asian country, it was not chosen for study in this paper since its banking industry is mainly government oriented, and therefore its bank operations may be very different from commercial banks in other countries which are more private-sector oriented. In addition, Japan, also a major Asian country, was not included in this study because the huge number and size of its banks is very different from those in other countries.
In our study sample, we excluded finance companies, securities companies, credit card companies, cooperatives, leasing and land development companies since the functions of these companies are quite different from those of commercial banks. Financial ratios such as the liquidity ratio or asset quality of these companies are not comparable to those of banks. We also excluded capital groups, financial groups and holding companies because the market prices of their stocks can be misleading since the investor may value the whole group rather than the individual bank. Finally, we excluded banks if the market prices of their stocks were not available.
The scope of the paper is to study the Tobin’s Q of Asian banks after recovering from the 1997 financial crisis, hence, the sample period used was 2004 to 2013 as the data is readily available. Since the Asian financial crisis occurred in 1997, seven years before the start of the sample period, we assumed that the performances of the sample banks were free from that crisis effect. Moreover, with this sample period, this paper can provide the most recent evidence of Tobin’s Q of Asian banks.
p.142-160_Tobin.indd 147 6/8/16 1:54 PM

148
Table 1 shows the final sample used in this paper. There are a total of 725 bank observations, with Indonesia alone having 236 bank observations, about 33 percent of the total. The Philippines, Taiwan and Thailand have 119, 101 and 91 bank observations, respectively. Malaysia and Singapore have the least number of bank observations in the sample.
Table 1: Number of banks in eight countries
2013 2012 2011 2010 2009 2008 2007 2006 2005 2004Total bank
observations
Hong Kong 6 6 7 8 8 9 8 8 8 6 74
Indonesia 29 28 28 20 24 24 25 21 19 18 236
Malaysia 3 3 2 3 2 2 2 2 2 2 23
Philippines 13 13 12 12 14 14 12 10 10 9 119
Singapore 2 2 2 2 2 2 2 2 2 2 20
South Korea 4 4 6 5 5 6 5 10 10 6 61
Taiwan 12 12 11 9 11 11 10 10 10 5 101
Thailand 8 8 9 10 10 9 10 9 9 9 91
Total 77 76 77 69 76 77 74 72 70 57 725
3.2 MethodologyThis paper consists of two parts. The first part computes and compares Tobin’s Q ratio
among Asian banks and the second part investigates the determinants of the Q ratio. For the first part, this study follows Jones et al. (2011) and Chunhachinda and Jumreornvong (1999) to calculate Tobin’s Q.
Therefore, Tobin’s Q ratio is measured as follows:
(3)
A higher Q ratio means a higher degree of market power of the bank in the financial markets from the investors’ point of view. After the Q ratios of each bank are calculated, comparison of these ratios among the eight countries will be conducted to test whether the Q ratios are the same across countries. It is expected that the Q ratios will be different across
sBookValueLiabilitieValueEquityBooksBookValueLiabilitieetValueEquityMarkQ
++=
p.142-160_Tobin.indd 148 6/8/16 1:54 PM

149
countries since the environmental backgrounds are different and investors’ values and expectations may be different.
In the second part, this study investigates the determinants of Q ratios and explores whether the determinants are the same across countries. Two OLS regression models (or GLS regression models to eliminate the possible serial correlation), with White Heteroskedasticity-Consistent Standard Errors & Covariance, are set as follows:
For pooled sample:Q
it = α + β
1 AQ
it + β
2 CA
it + β
3 NIM
it + β
4 ROAA
it + β
5 ROAE
it
+ β6 Liquidity1
it + β
7 Liquidity2
it + β
8 CDs + ε
it (4)
For single country or district:Q
it = α + β
1 AQ
it + β
2 CA
it + β
3 NIM
it + β
4 ROAA
it + β
5 ROAE
it
+ β6 Liquidity1
it + β
7 Liquidity2
it + β
8 Size
it + ε
it (5)
where α is the constant term, βs are coefficients of independent variables and ε is the error term; “i” represents the ith bank observation and “t” represents the year of observation. Model (4) pools all bank observations together, thus country dummies CDs (Thailand is chosen as the base country) are added in the model to be the control variable to reflect the environmental background differences across countries. The independent variable Size, measured by Ln (Total Assets), may be misleading if added in this model because the total assets are stated in different local currencies. Model (5) runs for the bank observations of only one country, hence the country dummy is excluded, but the independent variable Size is included in the regression to control the size effect.
The other seven independent variables are possible determinants of Q ratios from different aspects of bank characteristics. Variable AQ represents the asset quality of the bank, measured by the ratio of Loan Loss Reserves to Gross Loan. A higher ratio implies poorer quality of the loans extended, but it also could imply a bank’s conservative loan loss reserve policy. Variable CA stands for capital adequacy of the bank, measured by Equity/Total Asset. A higher ratio means higher capital adequacy and lower financial leverage. Variables NIM (Net Interest Margin), ROAA (return on average assets) and ROAE (return on average equity) measure the profitability of the bank. Higher ratios indicate
p.142-160_Tobin.indd 149 6/8/16 1:54 PM

150
better performance. Variables Liquidity1, measured by Net Loans/Customer & Short Term Funding, and Liquidity2, measured by Liquid Assets/Deposits & Short Term Funding, capture the liquidity of the bank. Higher ratios of Liquidity1 and lower ratios of Liquidity2 suggest lower liquidity of the bank.
The corporate governance, ownership concentration, and foreign ownership variables are not included in this study due to the unavailability of relevant data.
4. Empirical Results
Tobin’s Q ratios for all banks are summarized in Tables 2 and 3. Banks in Indonesia were found to have the highest average Q ratio of 1.125, followed by banks in the Philippines which have the average Q ratio of 1.075. Banks in Taiwan and South Korea have the lowest average Q ratios of 0.995 and 0.990, respectively. This result could imply that banks in Indonesia are having higher degree of market power than banks in Taiwan or South Korea, or investor values Indonesian banks more than Taiwanese or South Korean banks. Banks in Malaysia, Hong Kong, Singapore, and Thailand have average Q ratios of 1.072, 1.061, 1.033, and 1.011, respectively.
To test whether the Q ratios are significantly different across countries, the single factor ANOVA was conducted and the results shown in Panel B of Table 3. It is obvious (see Panel A of Table 3) that the mean and standard deviation of Q ratios of banks in Indonesia are much higher than those of the other countries. Therefore, only banks in the remaining seven countries were included in this test. It is found that the F-statistic is significant at the 1% level. Hence, it can be concluded that the average Q ratios of banks in different countries are statistically significantly different.
p.142-160_Tobin.indd 150 6/8/16 1:54 PM

151
Table 2: Tobin’s Q Ratios of Banks in Eight Countries (Annual Averages)
2013 2012 2011 2010 2009 2008 2007 2006 2005 2004
Overall
average
Hong Kong 1.048 1.026 1.013 1.052 1.038 1.035 1.125 1.106 1.070 1.088 1.061
Indonesia 1.081 1.137 1.138 1.234 1.148 1.082 1.162 1.133 1.065 1.068 1.125
Malaysia 1.080 1.074 1.066 1.075 1.041 1.048 1.083 1.076 1.088 1.084 1.072
Philippines 1.102 1.111 1.065 1.061 1.073 1.068 1.129 1.069 1.045 1.000 1.075
Singapore 1.022 1.020 1.004 1.036 1.049 1.003 1.062 1.070 1.008 1.053 1.033
South
Korea0.956 0.953 0.973 0.985 0.993 0.982 1.011 1.009 0.999 0.998 0.990
Taiwan 0.995 0.994 0.995 1.015 0.991 0.974 0.984 1.017 0.996 1.003 0.995
Thailand 1.024 1.044 1.028 1.043 1.026 0.937 1.019 0.992 1.000 0.993 1.011
Tables 3: Average Q Ratios of Banks in Eight Countries over the Period 2004-2013
Panel A: Descriptive statistics of average Q ratios of banks in eight countries over
the period 2004-2013
Mean Median Standard
DeviationMinimum Maximum Observations
Hong Kong 1.061 1.042 0.088 0.922 1.344 74
Indonesia 1.125 1.067 0.216 0.875 2.450 236
Malaysia 1.072 1.069 0.023 1.031 1.124 23
Philippines 1.075 1.036 0.139 0.922 1.578 119
Singapore 1.033 1.036 0.029 0.965 1.077 20
South Korea 0.990 0.988 0.030 0.919 1.073 61
Taiwan 0.995 0.996 0.027 0.875 1.082 101
Thailand 1.011 1.014 0.086 0.706 1.287 91
sBookValueLiabilitieValueEquityBooksBookValueLiabilitieetValueEquityMarkQ
++=
p.142-160_Tobin.indd 151 6/8/16 1:54 PM

152
Table 4 lists the descriptive statistics of independent variables for the regression.
The total assets of banks from different countries are not comparable since the data are shown in local currencies.
Indonesian banks have the highest average ROAA of 1.91% and Malaysian banks have the highest average ROAE of 15.62%. Banks in Taiwan have the lowest average ROAA of -0.13% and lowest average ROAE of -1.76% which is the poorest performance among the banks in the sample. For Net Interest Margin, Indonesia banks again have the highest ratio of 5.30% and Hong Kong banks have the lowest ratio of 1.79% which may be the consequence of intense competition in Hong Kong. Regarding asset quality, Hong Kong banks have the lowest ratio of Loan Loss Reserves to Gross Loans at 0.55% and banks in the Philippines have the highest ratio of 6.99%, which could mean banks in Hong Kong have the best asset quality and banks in the Philippines have the poorest asset quality. However, banks in the Philippines have the highest average capital adequacy ratio (Equity/Total asset) of 13.29%, and banks in Taiwan have the average capital adequacy ratio of only 6.31%, which is the lowest in the sample. For liquidity ratios, banks in South Korea have the highest ratio of Net Loans to Customer and Short-Term Funding of 100.99%, which indicates poor liquidity, while banks in the Philippines have the best liquidity of 52.40%. Another liquidity ratio of Liquid Assets to Deposits and Short-Term Funding indicates that South Korean banks have the poorest liquidity ratio of 13.06% and Indonesia banks have the best liquidity ratio of 31.19%.
Next, the OLS or GLS regression with the White Heteroskedasticity-Consistent Standard Errors & Covariance is run to investigate the possible determinants of the Q ratios of banks in different countries. Table 5 displays the correlations of variables, and it can be seen that the correlations among variables are not very high, except two coefficients that have values slightly above 0.5. Therefore, the serious problem of multicollinearity may not affect this regression analysis.
Panel B: Single Factor ANOVA for Q Ratios of Banks in Seven Countries (Excluding Indonesia)
Source of Variation SS df MS F P-value
Between Groups 0.607 6 0.101 13.32 0.000
Within Groups 3.660 482 0.008
p.142-160_Tobin.indd 152 6/8/16 1:54 PM

153
Table 4: Descriptive Statistics of Regression Variables
TA
(million Local
Currency Unit) SIZE
AQ
%
CA
%
NIM
%
ROAA
%
ROAE
%
Liquidity1
%
Liquidity2
%
Hong Kong (74 observations)
Mean 408,165 12.29 0.55 8.88 1.79 1.06 12.47 61.82 28.25
Standard
Deviation 478,561 1.13 0.34 1.70 0.27 0.60 8.05 8.79 8.33
Minimum 41,361 10.63 0.17 6.02 1.19 -0.84 -7.13 46.06 12.58
Maximum 2,046,936 14.53 1.86 13.44 2.37 2.63 38.85 83.73 53.29
Indonesia (236 observations)
Mean 88,681,368 17.24 3.01 12.27 5.30 1.91 13.11 78.67 31.19
Standard
Deviation 128,441,068 1.65 2.69 8.55 2.25 2.92 17.27 51.43 18.68
Minimum 828,700 13.63 0.07 2.76 -0.95 -8.82 -172.69 20.15 6.68
Maximum 733,099,800 20.41 29.72 55.02 17.29 19.18 47.83 528.20 226.61
Malaysia (23 observations)
Mean 223,271 12.09 2.93 7.65 2.70 1.17 15.62 68.47 27.75
Standard
Deviation 143,454 0.73 1.48 0.83 0.26 0.27 4.40 12.59 10.89
Minimum 49,060 10.80 0.80 6.05 2.21 0.26 3.27 49.54 12.91
Maximum 560,443 13.24 6.23 9.02 3.14 1.49 24.40 82.11 46.64
Philippines (119 observations)
Mean 331,146 12.06 6.99 13.29 4.07 1.45 12.13 52.40 30.36
Standard
Deviation 336,257 1.41 4.75 5.90 1.21 0.75 6.60 15.95 11.40
Minimum 1,830 7.51 1.34 6.51 1.94 0.14 0.40 14.37 8.92
Maximum 1,672,778 14.33 23.85 40.49 7.75 4.58 41.85 87.84 76.54
p.142-160_Tobin.indd 153 6/8/16 1:54 PM

154
TA (million Local Currency Unit) SIZE
AQ %
CA %
NIM %
ROAA %
ROAE %
Liquidity1 %
Liquidity2 %
Singapore (20 observations)
Mean 203,507 12.18 2.40 9.87 1.82 1.19 12.01 69.28 26.54
Standard Deviation 60,891 0.29 1.15 0.67 0.33 0.20 1.87 5.39 5.65
Minimum 119,882 11.69 1.03 8.30 1.37 0.94 10.11 58.41 21.45
Maximum 338,448 12.73 5.41 11.21 2.43 1.71 16.21 75.98 42.41
South Korea (61 observations)
Mean 61,673,972 16.66 2.61 6.59 3.55 0.73 9.81 100.99 13.06
Standard Deviation 72,997,268 2.02 2.41 1.64 1.27 1.14 24.72 33.04 5.42
Minimum 143,900 11.88 0.81 1.47 1.50 -3.54 -126.14 62.55 3.39
Maximum 266,460,000 19.40 13.40 12.09 10.39 3.70 52.79 213.29 30.38
Taiwan (101 observations)
Mean 632,746 12.96 1.42 6.31 1.94 -0.13 -1.76 71.80 19.38
Standard Deviation 638,700 0.86 0.94 2.26 1.33 1.37 19.33 10.40 9.46
Minimum 59,372 10.99 0.38 2.75 0.42 -5.55 -101.31 30.69 5.49
Maximum 2,757,964 14.83 6.76 15.74 7.06 2.03 20.64 91.08 49.13
Thailand (91 observations)
Mean 920,446 13.25 5.82 11.38 3.62 1.22 10.37 84.35 15.29
Standard Deviation 713,118 1.18 4.60 6.16 1.04 1.26 13.19 14.96 5.49
Minimum 21,277 9.97 1.79 5.77 2.32 -6.34 -94.12 47.51 2.41
Maximum 2,596,507 14.77 40.17 46.43 8.12 5.20 25.92 174.37 29.26
Note: TA stands for total assets; SIZE is measured by ln(total assets). AQ stands for asset quality, measured by loan loss reserve/gross loans; CA stands for capital adequacy, measured by equity/total assets; NIM stands for net interest margin; ROAA stands for return on average assets; ROAE stands for return on average equity; Liquidity1 is measured by net loans/customer and short-term funding; Liquidity2 is measured by liquid assets/deposits and short-term funding.
Table 4: Descriptive Statistics of Regression Variables (continued)
p.142-160_Tobin.indd 154 6/8/16 1:54 PM

155
Table 5: Correlations of Independent Variables
SIZE
AQ
%
CA
%
NIM
%
ROAA
%
ROAE
%
Liquidity1
%
AQ % -0.150
CA % -0.017 0.246
NIM % 0.393 0.129 0.125
ROAA % 0.248 0.123 0.695 0.058
ROAE % 0.210 -0.072 0.172 0.210 0.625
Liquidity1 % 0.262 -0.118 0.451 -0.095 0.499 0.081
Liquidity2 % 0.030 0.028 0.427 -0.019 0.385 0.089 0.177
Note: AQ stands for asset quality, measured by loan loss reserve/gross loans; CA stands for capital adequacy, measured by equity/total assets; NIM stands for net interest margin; ROAA stands for return on average assets; ROAE stands for return on average equity; Liquidity1 is measured by net loans/customer and short-term funding; Liquidity2 is measured by liquid assets/deposits and short-term funding. SIZE is measured by ln(total assets).
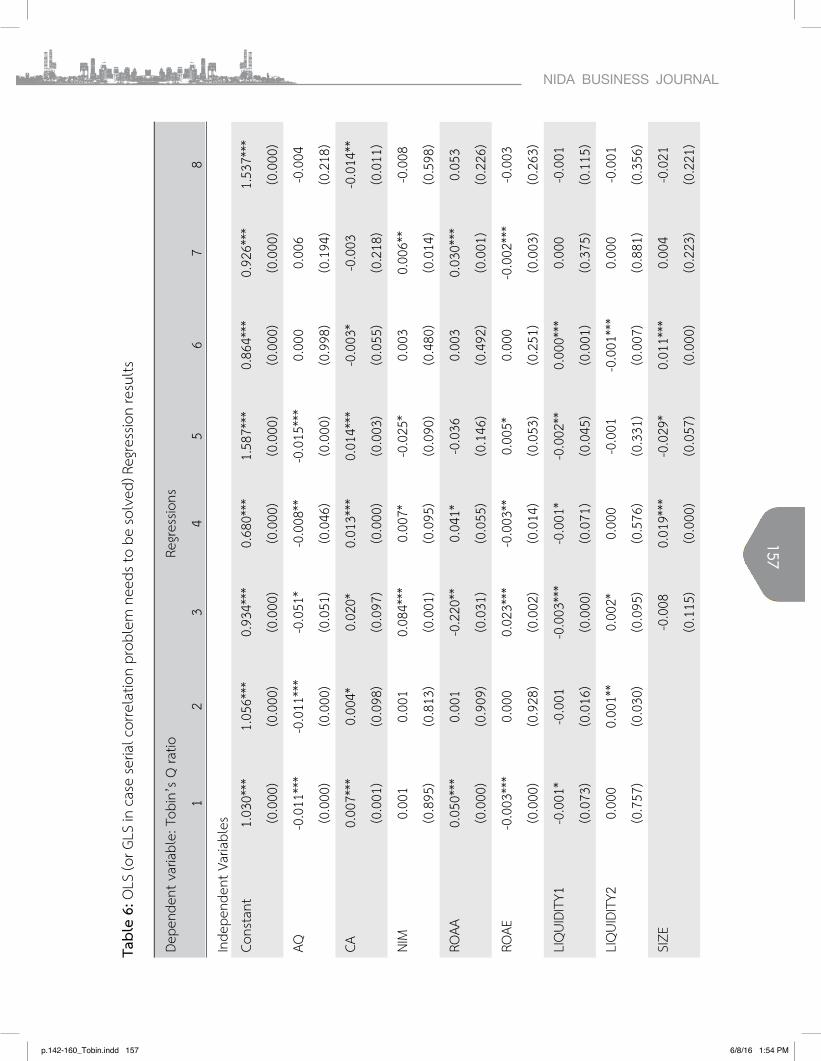
Table 6 details the results of eight different regressions. The results suggest that the
determinants of the Q ratios are different from country to country. Regression 1 includes banks in all eight countries. On average, ROAA and CA (Equity/Total Assets) are significantly positively related to the Q ratio at the 1 percent significant level. AQ (Loan Loss Reserves/ Gross Loan), ROAE, and Liquidity1 (Net Loans/Customer and Short-term Funding) are significantly negatively related to the Q ratio at the 1 percent or 10 percent significant level. This can lead to the implication that investors in the market prefer banks with good performance (higher ROAA), lower financial leverage (higher Equity/Total Assets), higher quality of assets (lower Loan Loss Reserves/Gross Loan), and better liquidity (lower Net Loans/Customer and Short-term Funding). Banks with the above characteristics are more competitive in the financial markets.
Banks in Indonesia were excluded in Regression 2 to avoid the dominant effect, as they account for 33 percent of the sample and the average Q ratios are significantly higher than the others. The regression results show that AQ (Loan Loss Reserves/Gross Loan) is
p.142-160_Tobin.indd 155 6/8/16 1:54 PM

156
significantly negatively related to the Q ratio at the 1 percent significant level, and CA (Equity/Total Assets) is positively related to the Q ratio, which are the same results as Regression 1. In addition, it is found that the Liquidity2 (Liquid Assets/ Deposits & Short-Term Funding) is positively related to the Q ratio at the 5 percent significant level, which suggests that the higher liquidity leads to higher Q ratios.
Regressions 3 - 8 are separate regressions only on banks in one country. Banks in Singapore and Malaysia were not studied because the size of the sample is too small to run the regression. It can be seen from the significant coefficients that the determinants of the Q ratio are quite different from country to country. For banks in Thailand, only 1 variable CA (Equity/Total Assets) is significantly negatively related to the Q ratio at the 5 percent significant level, which indicates that investors in Thailand prefer banks with higher financial leverage ratio.
For banks in Indonesia, higher Q ratios are significantly associated with bigger Size (Ln(Total Assets)), better Liquidity (higher Liquid Asset/Deposits & Short-Term Funding), higher asset quality (Loan Loss Reserves/Gross Loan), and higher capital adequacy (Equity/Total Assets). Investors in Indonesia prefer banks with high liquidity (short-term payback ability), better asset quality, lower financial leverage, and bigger size.
For banks in Hong Kong, ROAE, NIM (Net Interest Margin) and CA (Equity/Total Assets) are significantly positively related to the Q ratio, whereas AQ (Loan Loss Reserves/Gross Loan) and Liquidity1 (Net Loans/Customer & Short-Term Funding) are significantly negatively related to the Q ratio. In the Philippines, AQ (Loan Loss Reserves/Gross Loan) and Liquidity1 (Net Loans/Customer & Short-Term Funding) are significantly negatively related to the Q ratio, whereas CA (Equity/Total Assets) is significantly positively related to the bank’s Q ratio. Regarding the banks in South Korea, the Size is positively related to the bank’s Q ratio, which means that bigger bank has higher Q ratio.
p.142-160_Tobin.indd 156 6/8/16 1:54 PM
157
Tabl
e 6:
OLS
(or G
LS in
cas
e se
rial c
orre
latio
n pr
oble
m n
eeds
to b
e so
lved
) Reg
ress
ion
resu
lts
Depe
nden
t var
iabl
e: T
obin
’s Q
ratio
Regr
essio
ns
12
34
56
78
Inde
pend
ent V
aria
bles
Cons
tant
1.03
0***
1.05
6***
0.93
4***
0.68
0***
1.58
7***
0.86
4***
0.92
6***
1.53
7***
(0.0
00)
(0.0
00)
(0.0
00)
(0.0
00)
(0.0
00)
(0.0
00)
(0.0
00)
(0.0
00)
AQ-0
.011
***
-0.0
11**
*-0
.051
*-0
.008
**-0
.015
***
0.00
00.
006
-0.0
04
(0.0
00)
(0.0
00)
(0.0
51)
(0.0
46)
(0.0
00)
(0.9
98)
(0.1
94)
(0.2
18)
CA0.
007*
**0.
004*
0.02
0*0.
013*
**0.
014*
**-0
.003
*-0
.003
-0.0
14**
(0.0
01)
(0.0
98)
(0.0
97)
(0.0
00)
(0.0
03)
(0.0
55)
(0.2
18)
(0.0
11)
NIM
0.00
10.
001
0.08
4***
0.00
7*-0
.025
*0.
003
0.00
6**
-0.0
08
(0.8
95)
(0.8
13)
(0.0
01)
(0.0
95)
(0.0
90)
(0.4
80)
(0.0
14)
(0.5
98)
ROAA
0.05
0***
0.00
1-0
.220
**0.
041*
-0.0
360.
003
0.03
0***
0.05
3
(0.0
00)
(0.9
09)
(0.0
31)
(0.0
55)
(0.1
46)
(0.4
92)
(0.0
01)
(0.2
26)
ROAE
-0.0
03**
*0.
000
0.02
3***
-0.0
03**
0.00
5*0.
000
-0.0
02**
*-0
.003
(0.0
00)
(0.9
28)
(0.0
02)
(0.0
14)
(0.0
53)
(0.2
51)
(0.0
03)
(0.2
63)
LIQ
UIDI
TY1
-0.0
01*
-0.0
01-0
.003
***
-0.0
01*
-0.0
02**
0.00
0***
0.00
0-0
.001
(0.0
73)
(0.0
16)
(0.0
00)
(0.0
71)
(0.0
45)
(0.0
01)
(0.3
75)
(0.1
15)
LIQ
UIDI
TY2
0.00
00.
001*
*0.
002*
0.00
0-0
.001
-0.0
01**
*0.
000
-0.0
01
(0.7
57)
(0.0
30)
(0.0
95)
(0.5
76)
(0.3
31)
(0.0
07)
(0.8
81)
(0.3
56)
SIZE
-0.0
080.
019*
**-0
.029
*0.
011*
**0.
004
-0.0
21
(0.1
15)
(0.0
00)
(0.0
57)
(0.0
00)
(0.2
23)
(0.2
21)
p.142-160_Tobin.indd 157 6/8/16 1:54 PM

158
Depe
nden
t var
iabl
e: T
obin
’s Q
ratio
Regr
essio
ns
12
34
56
78
HONG
KO
NG0.
009
-0.0
20(0
.671
)(0
.309
)IN
DONE
SIA
0.04
9**
(0.0
16)
MAL
AYSI
A0.
064*
**0.
025
(0.0
00)
(0.1
17)
PHIL
IPPI
NES
0.04
0*0.
038*
*(0
.051
)(0
.013
)SI
NGAP
ORE
-0.0
07-0
.026
(0.6
74)
(0.1
09)
KORE
A0.
009
-0.0
27**
(0.6
18)
(0.0
49)
TAIW
AN-0
.006
-0.0
53**
*(0
.708
)(0
.000
)R-
squa
red
0.50
00.
291
0.72
50.
588
0.46
30.
758
0.34
30.
372
Durb
in-
Wat
son
stat
1.99
11.
979
1.86
81.
888
1.84
62.
044
1.84
91.
949
Obs
erva
tions
725
489
7423
611
961
101
91Co
untry
8 co
untri
es7
coun
tries
Hong
Kon
gIn
done
siaPh
ilipp
ines
Sout
h Ko
rea
Taiw
anTh
aila
nd
Note
s: AQ
sta
nds
for a
sset
qua
lity,
mea
sure
d by
loan
loss
rese
rve/
gros
s lo
ans;
CA s
tand
s fo
r cap
ital a
dequ
acy,
mea
sure
d by
equ
ity/t
otal
ass
ets;
NIM
st
ands
for
net
inte
rest
mar
gin; R
OAA
sta
nds
for
retu
rn o
n av
erag
e as
sets
; RO
AE s
tand
s fo
r re
turn
on
aver
age
equi
ty; L
iqui
dity
1 is
mea
sure
d by
net
lo
ans/
cust
omer
and
sho
rt-te
rm fu
ndin
g; Li
quid
ity2
is m
easu
red
by li
quid
ass
ets/
depo
sits
and
shor
t-ter
m fu
ndin
g. SI
ZE is
mea
sure
d by
ln(to
tal a
sset
s).
P-va
lues
are
in p
aren
thes
es. *
**, *
* an
d *
indi
cate
sign
ifica
nce
at 1
%, 5
% a
nd 1
0% le
vels
, res
pect
ivel
y. E
ight c
ount
ries
incl
ude
Hong
Kon
g, In
done
sia,
Mal
aysia
, the
Phi
lippi
nes,
Sing
apor
e, S
outh
Kor
ea, T
aiw
an a
nd T
haila
nd. S
even
cou
ntrie
s in
clud
e Ho
ng K
ong,
Mal
aysia
, the
Phi
lippi
nes,
Sing
apor
e,
Sout
h Ko
rea,
Tai
wan
and
Tha
iland
.
Tabl
e 6:
OLS
(or G
LS in
cas
e se
rial c
orre
latio
n pr
oble
m n
eeds
to b
e so
lved
) Reg
ress
ion
resu
lts
p.142-160_Tobin.indd 158 6/8/16 1:54 PM

159
Finally, for the banks in Taiwan, ROAE is significantly negatively related to the Q ratio whereas ROAA and NIM are significantly positively related to the Q ratio.
5. Conclusion
This paper studied the Tobin’s Q of banks in eight major Asian countries over the period 2004 - 2013, which is after recovering from the 1997 financial crisis. The eight major Asian countries chosen for study are: Hong Kong, Indonesia, Malaysia, the Philippines, Singapore, South Korea, Taiwan and Thailand. Tobin’s Q was selected in this study to measure bank competitiveness as valued by the financial markets. It was found that on average, banks in Indonesia have the highest Q ratio of 1.125, followed by banks in the Philippines with a Q ratio of 1.075. Banks in Taiwan and South Korea have the lowest Q ratios of 0.995 and 0.990, respectively.
The determinants of the Q ratio were found to be quite different from country to country. For most countries, capital adequacy (equity/total assets) is significantly positively correlated with the Q ratio whereas asset quality (loan loss reserves/gross loans), and liquidity (net loans/customers &short-term funding) are significantly negatively correlated with the Q ratio. The effects of profitability ROAA, ROAE, and NIM (net interest margin) on Q ratios are mixed. In general, investors in the market prefer banks with better liquidity (lower net loans/customers &short-term funding), higher assets quality (lower Loan Loss Reserves/Gross Loan), and lower financial leverage (higher Equity/Total Assets).
Therefore, for banks in the Asian financial markets, if they intend to increase their Tobin’s Q ratio, it is recommended that they should improve their liquidity position, enhance their asset quality, and reduce their financial leverage.
References:
Aliber RZ (1984) International banking: a survey. Journal of Money, Credit, and Banking 16: 661-678.
Bagchi D (2011) An analysis of relationships between corporate governance of firms and their capital market performance. The IUP Journal of Applied Finance 17: 5-15.
Beck T, Demirguc-Kunt A, Levine R (2006) Bank concentration, competition, and crises: first results. Journal of Banking and Finance 30: 1581-1603.
p.142-160_Tobin.indd 159 6/8/16 1:54 PM

160
Bhagat S, Bolton B (2008) Corporate governance and firm performance. Journal of Corporate Finance 14: 257-273.
Bharadwaj AS, Bharadwaj SG, Konsynski BR (1999) Information technology effects on firm performance as measured by Tobin’s Q. Management Science 45: 1008-1024.
Busta I, Sinani E, Thomsen S (2014) Ownership concentration and market value of European banks. Journal of Management & Governance 18: 159-183.
Cheung YL, Connelly JT, Jiang P, Limpaphayom P (2011) Does corporate governance predict future performance? Evidence from Hong Kong. Financial Management Spring: 159-197.
Chung KH, Pruitt SW (1994) A simple approximation of Tobin’s Q. Financial Management, 23: 70-74.
Chung KH, Wright P (1998) Corporate policy and market value: a q-theory approach. Review of Quantitative Finance and Accounting 11: 293-310.
Chunhachinda P, Jumreornvong S (1999) Competitiveness of banks and finance companies in Thailand. Thammasat Review 4: 59-88.
Doukas J (1995) Overinvestment, Tobin’s Q and gains from foreign acquisitions. Journal of Banking and Finance 19: 1285-1303.
Fang Y, Hasan I, Marton K, Waisman M (2014) Bank valuation in new EU member countries. Economic Systems 38: 55-72.
Gonzalez-Pedraz C, Mayordomo S (2012) Trademark activity and the market performance of U.S. commercial banks. Journal of Business Economics & Management 13: 931-950.
Ho CK (2005) Corporate governance and corporate competitiveness: an international analysis. Corporate Governance: An International Review 13: 211-253.
Joen B N, Olivero M P, Wu J (2010) Do foreign banks increase competition? Evidence from emerging Asian and Latin American banking markets. Journal of Banking and Finance 35: 856-875.
Jones JS, Miller SA, Yeager TJ (2011) Charter value, Tobin’s Q and bank risk during the subprime financial crisis. Journal of Economics and Business 63: 372-391.
Jonghe OD, Vennet RV (2008) Competition versus efficiency: what drives franchise values in European banking? Journal of Banking and Finance 32: 1820-1835.
Lindenberg E, Ross S (1981) Tobin’s Q ratio and industrial organization. Journal of Business 54: 1-32.
Rousseau PL, Kim JH (2008) A flight to Q? Firm investment and financing in Korea before and after the 1997 financial crisis. Journal of Banking and Finance 32: 1416-1429.
Tobin J (1969) A general equilibrium approach to monetary theory. Journal of Money, Credit, and Banking 1: 15-29.
p.142-160_Tobin.indd 160 6/8/16 1:54 PM