thought leadership series - global custody, custodians · thought leadership series fourth quarter...
TRANSCRIPT

Thought Leadership SeriesFourth Quarter 2009
Strategies Of Securities Lending
Similar to the various investment strategies asset managers use to generate alpha, securities lending providers, both Agents and Principals, pursue a variety of lending and cash collateral investment methodologies that expose participants to a wide range of risks inherent at some level in most lending program structures. In this paper, we will review some common lending strategies, understand certain sources of risk, and how to measure it, and articulate BNY Mellon’s position.
CONTENTS
Lending Strategies in Review 1
Simple Math 3
The BNY Mellon Position 6
Supply & Demand 9
Revenue Estimates 9
A Case Study 12
BNY Mellon’s Value-Based
Strategy 13
A Time-Tested Program 14 The large but little known business of Securities Lending, formally referred to as Stock Loan, stemming from the days where back-office operations personnel informally provided loans of securities as favors to their industry peers to avoid costly delivery fails, has come center stage. Recent events in the credit markets have resulted in significant losses for both participants and providers. These events and subsequent losses were due not to the business of lending securities but instead from the investing of cash collateral. Participants that had portfolios of lendable assets which allowed them to pursue more conservative parameters, such as restricting the investment of cash to only overnight government investments, money market instruments, or by accepting only non-cash collateral, and were willing to forgo the incremental revenues, largely avoided the losses that have been so newsworthy over the past year.


1
Lending Strategies In ReviewWhile lending providers typically utilize the same operational mechanics, the methodologies employed to generate returns can differ significantly. In fact, some methods create more market risk than others.
Beneficial Owners should be cognizant of the methods that are used to generate lending revenue based on the assets they are lending and the level of risk they will assume in the process. They should then choose a lending structure that is in line with their overall investment strategy and risk tolerance. Clients are best served by pursuing a lending structure that “fits” their risk tolerances and portfolio holdings.
At the most basic level, there are two primary types of strategies that providers can employ in managing their program. The first, and by far the most common strategy, is a high utilization approach – meaning the more volume, or amount of securities on loan, the more revenue the client will generate. Intuitively, this makes sense and does generally work; however, in addition to monitoring the amount of securities on loan, called the utilization rate, the client must review the gross spread, which is the difference between the cash collateral reinvestment rate and the rebate rate paid back to borrowers in exchange for that cash.
High Utilization StrategyThis strategy can generate income for those clients who hold low demand securities and are willing to accept a higher level of risk. For purposes of this paper, risk is defined as the amount of cash collateral invested and/or level of investment spread relative to total spread to generate a certain level of return. This paper does not consider risks of lending using non-cash collateral.
Some lending providers assert that they have the ability to produce high loan volumes that may result in higher absolute revenue streams. In this strategy, the lender engages in heavy lending of low demand securities. Additional revenue can be generated but it is earned with higher risks since the lending spread is reduced because the demand for the security is not great.
For example, the client may generate additional revenue by lending lower in demand securities up to the point where the borrowing communities’ marginal demand diminishes to 0%. Utilization rates may increase to 20%, 30%, 40% or higher. The returns, or spreads, on these loans decrease since these lower demand, or otherwise general collateral (GC), loans typically trade (have a rebate rate) at the Fed Funds target rate minus only several basis points, and quickly move upward from there. There is an inverse relationship with utilization and spread for lower demand securities.
For example, at 20% to 30% on loan, lenders are typically transacting loans at Fed Funds flat (rebate rate equivalent to Fed Funds or Target Rate). The more that is on loan, the higher the collateral activity and the higher the client’s level of risk due to more return being attributed to the reinvestment portion of the transaction than the lending function itself. This leveraging strategy, which is typically used for large cap, or lower demand securities, and theoretically may generate positive incremental absolute revenues, can actually present several risks that significantly dilute the client’s risk to reward tradeoff and increase the collateral investment risk.

2
Value-based StrategyA less common and more resource consuming strategy is the value-based approach. This particular process essentially attempts to maximize lending returns by focusing on the intrinsic (lending) value of specific securities, or asset classes, rather than attempting to simply maximize assets on loan (high utilization strategy). To illustrate, a utilization rate (percent on loan) of 10% seems better than 5% at first glance. Would the client’s opinion change, however, if the average spreads were 40 basis points and 100, respectively?
The 10% strategy produces a Return on Assets (ROA) of 4 bps (10% x 40 bps), while the 5% approach generates 5 bps (5% x 100 bps). This quick calculation, however, does not shed any light on the source of the excess returns. In other words, the extra 1bp ROA from the lower utilization scenario may be from superior loan negotiation where the majority of excess spread is intrinsic spread and not reinvestment spread. Alternatively, it can be additional spread derived from the investment of cash collateral, which by itself does not necessarily mean that more risk is taken since it could be from superior security selection. It is likely to be one or the other, but in rare instances can be both. Again, this may be appropriate given the client’s risk tolerance, portfolio holdings and program goals, but often times the client may be more comfortable with a value-based approach.
The level of risk becomes more evident when their performance exhibits common or predictable metrics and correlations. Potentially riskier strategies should be easy to spot. Utilization rates that are multiples of universe averages along with large gross spreads can be signs of increased risk taking, excluding the lending of specials. Specials are loans of securities that, for a variety of reasons and for some uncertain period of time, demand outpaces supply and will generate very large gross spreads at 100% utilization derived from their high intrinsic demand. Pursuant to the law of supply and demand, higher utilization comes at the price of lower intrinsic spreads. In other words, it would be extraordinarily unusual for a provider to have a higher utilization and a higher intrinsic spread, since the two are counter balancing - take from one and give to the other and visa-versa, given the same portfolio. Excluding specials, correlation of these two statistics are negative. Therefore, this outperformance, or alpha, must be attributed to the difference in the risk profile of cash collateral investments.
Spread attribution is a quick measure that can assist in the evaluation process of the client’s loan or entire program.
• Whatportionofthegrossspreadisderivedfromthedemandor“intrinsicvalue”ofthesecurities and what portion is from the reinvestment of the cash collateral?
Most lending providers have a variety of attribution reports available for review. They typically present monthly, year-to-date, asset class or country level metrics.
In this scenario, one option to controlling the risk to reward profile would be to offset higher utilizations with a lower risk profile of cash collateral management. This would result in an exponential erosion of revenue that can be exhibited by a negatively sloped curve (as utilization increases the marginal intrinsic revenue decreases at an increasing rate) but would offset sources of risk appropriately. In this scenario, lower demand assets can still generate lending revenue but with lower risk. Alternatively, higher demand assets can pursue a higher risk strategy and continue to maintain symmetry of the spread attribution. It is this balance of risk and reward and making slight, but meaningful changes to the client’s program parameters, that makes securities lending complex but exciting.
Spread attribution is a quick measure that can assist in the evaluation process of the client’s loan or entire program.
• Whatportionofthegrossspreadisderivedfromthedemandorintrinsicvalueofthesecurities and what portion is from the reinvestment of the cash collateral?
Lending providers have a variety of attribution reports available for review. They typically present monthly, year-to-date, asset class or country level metrics.

3
A trait of the value-based program is generally a lower level of risk. Conversely, with a high utilization program, the risk typically exceeds the reward. There are, however, many reasons for why a client would pursue a high utilization program. One reason is that they only have low demand securities and/or have a high risk tolerance and a separately managed collateral account and wish to still generate meaningful incremental lending revenue. Additionally, they may manage their own cash collateral in which case they may be more accepting of the investment risk. Likewise, they may use the cash as an added source of liquidity and the variety of benefits of using securities lending collateral outweigh the added risks. Lastly, they may need to fund term assets that may otherwise mature at par.
Simple Math Intrinsic value measures the lending spread received for the loaned security. Rebates are typically quoted in relation to a benchmark rate, such as the Fed Funds Target (FFT), Fed Funds Open (FFO), LIBOR or EONIA rates. It excludes the additional performance from the management of the cash collateral received against the loan.
Therefore, FFT – Rebate = Lending Spread = Intrinsic Spread = Demand Spread
Gross earnings spread is composed of two parts: the lending spread and the cash reinvestment spread. The cash reinvestment spread is the “value added” above the Fed Funds Target or other benchmark rate.
Therefore, Investment Yield – FFT = Reinvestment Spread.
Putting it all together:
Gross Earnings Spread = Lending Spread + Reinvestment Spread
Gross Earnings Spread = (FFT – Rebate) + (Investment Yield – FFT)
Gross Earnings Spread = Investment Yield – Rebate
or
or
Figure 2:

4
The Long and the Short of It Time has shown that the major source of risk in most securities lending programs has been from the reinvestment of cash collateral. Obtaining a higher investment yield is typically derived from lower credit quality or longer duration of investments, both of which are potentially subject to increased risk.
For example, if the client can make the same dollar revenue but have less cash collateral reinvestments, all else being equal, the risk is essentially reduced and the risk to reward profile and the client’s marginal utility of their program is improved (for example, a move from point A to point B in the following table).
2
1
3
4
5
The wisdom supporting a value-based lending strategy is that the majority of the earnings from any securities lending transaction should be obtained from the borrower, or as a result of borrowing activity, and not from the investment of the client’s cash collateral. Therefore, emphasis is placed upon “quality” trades, as securities each possess their own intrinsic values. This conservative lending philosophy translates into negotiation of lower average rebate rates. This approach also is conducive to a more cautious collateral investment strategy.
Value-based Lending
Lower On LoanAmounts
Lower Rebates toborrower
Higher LendingSpread
Lower Dependencyon CollateralReinvestmentEarnings
High UtilizationLending
Higher On LoanAmounts
Higher Rebates toborrower
Lower LendingSpread
Higher Dependencyon CollateralReinvestmentEarnings
Rebate Rate (Liability)
Investment Yield (Asset)
High Utilization Transaction Value-based Transaction
BenchmarkRate
0%
Rebate
Investment Yield (Asset)
Rebate Rate (Liability)
Benchmark Rate
0%
Investment Spread Investment
Spread
Lending Spread
Lending Spread
Rebate
Reduced Risk
Gross Spread
Gro
ss S
prea
d
15,071
9,914
8,000
9,000
10,000
11,000
12,000
13,000
14,000
15,000
16,000
Dec 31 2007
Mar 31 2008
Jun 30 2008
Sep 30 2008
Dec 31 2008
Mar 31 2009
May 31 2009
Dec 31 2007
Mar 31 2008
Jun 30 2008
Sep 30 2008
Dec 31 2008
Mar 31 2009
May 31 2009
SL Industry Lendable ($Bln)
Lendable ($Bln)
3,478
1,840
1,500
2,000
2,500
3,000
3,500
4,000
SL Industry On Loan ($Bln)
On Loan ($Bln)
Dol
lars
Days
Election Valuation
Cash Election Stock Election
Low Reinvestment Risk/High Borrower Exposure High Reinvestment Risk/High Borrower Exposure
High Reinvestment Risk/Low Borrower ExposureLow Reinvestment Risk/Low Borrower ExposureIncreasingBorrower
Exposure
Lower Borrower Risk
Lower Reinvestment Risk
Percentageof Securities
On Loan
Higher Borrower Risk Higher Reinvestment Risk
Intrinsic Lending Strategy
Volume Lending Strategy
More Cash Collateral Invested
Increasing Reinvestment Risk
5%
20%
Value-based Strategy Mitigates Potential Risks
A
B
22
24
26
28
30
32
1 2 3 4 5 6 7 8 9 10
Figure 3:
Therefore, a value-based strategy may not only outperform a high utilization approach, as measured by Return on Assets (ROA = utilization x spread), but it also may have a significantly higher risk-adjusted return when taking into consideration the amount of cash employed to generate a level of return.
Why wouldn’t all clients seek out a value-based program? As previously discussed, all clients are not best served by one lending strategy. Several reasons for employing a high utilization approach were previously provided. The value-based methodology works best for clients with small, mid-cap or other equity portfolios with high lending value, or other assets like U.S. Treasuries or International large cap equities that, due to the reasons for their demand, provide a higher intrinsic value. Since these assets are either less available in the lending markets, or because the general law of supply and demand do not necessarily apply (so additional supply is additive to revenue rather than dilutive), a Value methodology may be able to derive greater spreads by focusing solely on the lending of these high value assets.

5
As a generalization, a high utilization program seeks to bundle its clients’ large cap index names (S&P 500, FTSE 100, etc.), which generally do not command large spreads, with that of another clients’ harder to borrow names, or high in-demand names. This approach muddies the waters and can result in lower spreads for the small and mid-cap names; however, it does afford an opportunity to lend widely-held stocks as borrowers historically are typically willing to borrow larger volumes if it results in an overall lower cost to them. Clients with large cap liquid portfolios benefit from this strategy, albeit at a higher risk. High utilization lenders’ programs could increase risk in this way through higher volumes on loan since the majority of risk is gauged by the amount of cash collateral reinvested, as well as what that cash is reinvested in, so the risk may be compounded. Additionally, since lenders typically charge a fee for the management of cash collateral, it can further skew the risk to reward distribution.
The combination of utilization, spread attribution (intrinsic or cash collateral investment), can result in significantly asymmetric risks and returns making typical mitigants largely ineffective since, historically, losses have been skewed. By this we mean losses are observed as long tails in the probability distribution of the risk to reward continuum of securities lending.
To provide another example, the client with a portfolio containing a majority of U.S. Treasuries can possess a risk to reward profile significantly different than the client lending investment grade corporate bonds due to the dramatic difference in the level of, and consistency in, demand from a utilization perspective, for that asset class, as U.S. Treasuries are steadily in demand, as well as the intrinsic or demand value of the specific securities themselves. As a generalization, clients with higher intrinsic demand securities do not need to accept the same risk tolerance that clients with low demand securities need in order to generate the same level of return. Even if the return is the same, the attribution of earnings (the portion derived from the intrinsic value vs. collateral reinvestment return) will be dramatically different.
To elaborate, a U.S. Treasury lender can maintain spread attribution symmetry due to the larger intrinsic spreads that asset class provides offset with more conservative guidelines. Alternatively, an investment grade corporate bond holder will have to generate more investment spread to offset the little to negative intrinsic spread that asset class provides. While the revenue generated may be the same per unit of loaned asset, the attribution of earnings and risk profile will be very different.

6
The BNY Mellon PositionBNY Mellon’s professional trading staff works to determine the reason why a security is being borrowed, the value of the security to the borrower, and the trading strategy it supports. This is accomplished utilizing a number of different measures which are listed in the following table.
Identifying the Intrinsic Value
Reviewing pricing data across all asset classes and levels of demand
• General Collateral
• Mid-level
• Specials
Understand why the security is being borrowed
• What is the value to the borrower?
• What trade strategy does it support?
Apply proprietary models if applicable • Measures the “spread” in the deal
• Measures worth to the borrower
Quantify and/or qualify intrinsic value Define Context:• Current “yield” environment
• Relevant historic trends (price, volume, etc.)
• Applicable tax regulations
• Current bid/offer market
• Current utilization rates for the security (How much is already on loan?)
• Relevant adverse conditions
• Relevant news or “corporate actions”
• Know your counterparty (Who’s borrowing it?)
At BNY Mellon, we view aggregate lending revenue as the result of two complementary but very different activities - the lending (liability) function and the collateral investment (asset) function. As a generalization, the value-based methodology strives to extract value from the lending side of the equation as opposed to a high utilization approach, which attempts to put as many securities on loan as possible and focuses on investment returns as the revenue driver. High utilization lenders typically “package” or “bundle” hard-to-borrow stocks with more liquid, low demand names in exchange for the resulting larger and typically more stable cash collateral balance. If used as a general practice, this approach can change the attribution of returns and put pressure on the cash reinvestment function to find higher yielding investments with more risk due to lower credit quality or longer durations. The value-based approach seeks to extract the maximum potential intrinsic value for the security being lent as well as expose the client to less risk via lower collateral balances.

7
An important point to note is that it is an appropriate tool to bundle or package profiles of securities in executing a strategy. It is the bundling of pricing – charging less on the client’s high demand securities to subsidize or create demand for another client’s lower in-demand securities – that is the issue.
An Illustration …
Figure 4:
Spread Attribution Recap & Examples
Gross Spread = Lending Spread + Cash Reinvestment Spread = (Benchmark – Rebate) + (Investment Yield – Benchmark) = Investment Yield – Rebate.
Intrinsic Value refers to the amount of the “Lending” or “Demand” spread.
Spread Attribution describes the composition of the Gross Earnings Spread. In other words, the amount of Gross Earnings Spread that is derived from the “lending activity” (lending spread) and the amount that comes from the “reinvestment activity” (cash reinvestment spread).
Due to loans being collateralized with excess margin and vendor provided borrower default provisions, risk is typically associated with the cash reinvestment activity. Therefore, greater attribution towards the lending spread has a lower risk profile than an attribution that is weighted towards the cash reinvestment spread.
•Lower Risk Profile = Greater Attribution Lending Spread + Lower Attribution Cash Reinvestment Spread
•Higher Risk Profile = Lower Attribution Lending Spread + Greater Attribution Cash Reinvestment Spread
2
1
3
4
5
The wisdom supporting a value-based lending strategy is that the majority of the earnings from any securities lending transaction should be obtained from the borrower, or as a result of borrowing activity, and not from the investment of the client’s cash collateral. Therefore, emphasis is placed upon “quality” trades, as securities each possess their own intrinsic values. This conservative lending philosophy translates into negotiation of lower average rebate rates. This approach also is conducive to a more cautious collateral investment strategy.
Value-based Lending
Lower On LoanAmounts
Lower Rebates toborrower
Higher LendingSpread
Lower Dependencyon CollateralReinvestmentEarnings
High UtilizationLending
Higher On LoanAmounts
Higher Rebates toborrower
Lower LendingSpread
Higher Dependencyon CollateralReinvestmentEarnings
Rebate Rate (Liability)
Investment Yield (Asset)
High Utilization Transaction Value-based Transaction
BenchmarkRate
0%
Rebate
Investment Yield (Asset)
Rebate Rate (Liability)
Benchmark Rate
0%
Investment Spread Investment
Spread
Lending Spread
Lending Spread
Rebate
Reduced Risk
Gross Spread
Gro
ss S
prea
d
15,071
9,914
8,000
9,000
10,000
11,000
12,000
13,000
14,000
15,000
16,000
Dec 31 2007
Mar 31 2008
Jun 30 2008
Sep 30 2008
Dec 31 2008
Mar 31 2009
May 31 2009
Dec 31 2007
Mar 31 2008
Jun 30 2008
Sep 30 2008
Dec 31 2008
Mar 31 2009
May 31 2009
SL Industry Lendable ($Bln)
Lendable ($Bln)
3,478
1,840
1,500
2,000
2,500
3,000
3,500
4,000
SL Industry On Loan ($Bln)
On Loan ($Bln)
Dol
lars
Days
Election Valuation
Cash Election Stock Election
Low Reinvestment Risk/High Borrower Exposure High Reinvestment Risk/High Borrower Exposure
High Reinvestment Risk/Low Borrower ExposureLow Reinvestment Risk/Low Borrower ExposureIncreasingBorrower
Exposure
Lower Borrower Risk
Lower Reinvestment Risk
Percentageof Securities
On Loan
Higher Borrower Risk Higher Reinvestment Risk
Intrinsic Lending Strategy
Volume Lending Strategy
More Cash Collateral Invested
Increasing Reinvestment Risk
5%
20%
Value-based Strategy Mitigates Potential Risks
A
B
22
24
26
28
30
32
1 2 3 4 5 6 7 8 9 10

8
Example 1:
Investment Yield = 3.00%
Benchmark = 2.25%
Rebate = 2.10%
Gross Earnings Spread = 90 bp (3.00% – 2.10%)
Question: Of the 90 bps of Gross Earnings Spread, how much comes from the lendingactivity and how much comes from the cash reinvestment activity?
Answer: Reinvestment Spread = 75 bp (3.00% – 2.25%)
Lending Spread = 15 bp (2.25% – 2.10%)
In this example, most of the gross earnings spread is derived from the cash reinvestment activity (i.e. the reinvestment spread). In fact, about 83% of the gross earnings spread (75/90 bps) comes from the reinvestment spread.
Spread Attribution = 15 bp (lending) + 75 bp (reinvestment) = 90 bp
Example 2:
Investment Yield = 2.40%
Benchmark = 2.25%
Rebate = 1.50%
Gross Earnings Spread = 90 bp (2.40% – 1.50%)
Question: Of the 90 bps of Gross Earnings Spread, how much comes from the lending activity and how much comes from the cash reinvestment activity? (i.e. What is the Spread Attribution?)
Answer: Reinvestment Spread= 15 bp (2.40% – 2.25%)
Lending Spread = 75 bp (2.25% – 1.50%)
In this example, most of the gross earnings spread is derived from the intrinsic value (i.e. the lending spread). In fact, about 83% of the gross earnings spread (75/90 bps) comes from the lending spread.
Spread Attribution = 15 bp (lending) + 75 bp (reinvestment) = 90 bp
Summary:
In both cases, the gross earnings spread totals 90 bps. However, one has a higher risk profile than the other. Keep in mind, historically, the “real” risk in securities lending for cash collateral is in how the cash collateral is managed. Example 2 has a lower risk profile. Spread Attribution helps to measure the “quality” of the gross earnings spread. In the end, similar earnings may have different risk exposures.
Higher yield could be a function of obtaining better pricing; however, it is not typical in a High utilization strategy. Higher yield is usually achieved by accepting lower credit quality and/or longer duration cash collateral reinvestments, which equates to more risk to the client.

9
Supply And DemandTypically the supply and demand of a particular security are the most important factors in determining the intrinsic value and ultimate rebate rate applied to the cash collateral received for the loaned security. Widely-held securities rarely become so high in demand that they command a rate lower than what is called the “general collateral” rate. The general collateral (GC) rate is typically 5 to 10 basis points under the Fed Funds Target Rate, or other benchmark rate, but has been known to be well above those rates at times. Fiscal quarter-end, year-end, tax dates, Treasury bill or cash management bill issuance, Fed eases or tightening may all affect GC rates.
The amount of supply in these lendable securities usually exceeds the demand. When this occurs, lending providers have less leverage over the rebate rate that they need to pay on the cash collateral in order to transact a loan on behalf of the client. Both supply and demand are dynamic and will continually change over time. When this occurs, and demand exceeds supply, lenders obtain pricing leverage. This is one example of how a “special” is created.
Revenue EstimatesRevenue analysis is performed by looking at how much income can be generated by the lending and collateral reinvestment functions using client provided assets and guidelines and other program options. Supply and demand dynamics should be accounted for in revenue estimates that lending providers present to clients. Some estimates provide disclosures regarding the assumptions used in the calculations. The most common parameters that need to be established are whether the representation is forward looking or based on historical data. Investment guidelines and resulting performance, tax treatment, proxy or dividend recall procedures are among some other assumptions that need to be established. Changing the assumptions will change the estimate and the resulting difference may be significant and vary widely among lending providers. Depending on the level of detail provided, including estimated intrinsic and investment spread attribution, clients may be able to derive the strategy and risk profile used in the process.

10
Typical Revenue Estimate Parameters:
•Utilizationratesforassetclasses
- Review previous time period average by asset class
- Project on a pro-forma basis the next 12 month period
- Adjust-based on actual security holdings
• Spreadsforsecuritiesonloan
- Review previous time period average by asset class
- Project on a pro-forma basis the next 12 month period
- Adjust based on actual security holdings
• Considercurrentdemandforactualsecuritiesheld
- Analyze whether demand is sustainable for client’s actual portfolio holdings
- Is demand tied to a specific trade strategy that will/may expire soon?
• Cashcollateralinvestmentguidelines
• Taxarbitrageopportunities
• Overallportfoliosize,sizeofpositionswithintheportfolio,andassetallocationandstyle
• Potentialassetallocationchangesorchangesininterestrates
• Outstandingloanvolumelimits
• Regulatoryrestrictions,Borrowerrestrictions,Assetclassrestrictions,Countryclassrestrictions, Record date restrictions, Year-end restrictions and Proxy restrictions
• Otherconsiderationsthatareclientspecific.
11
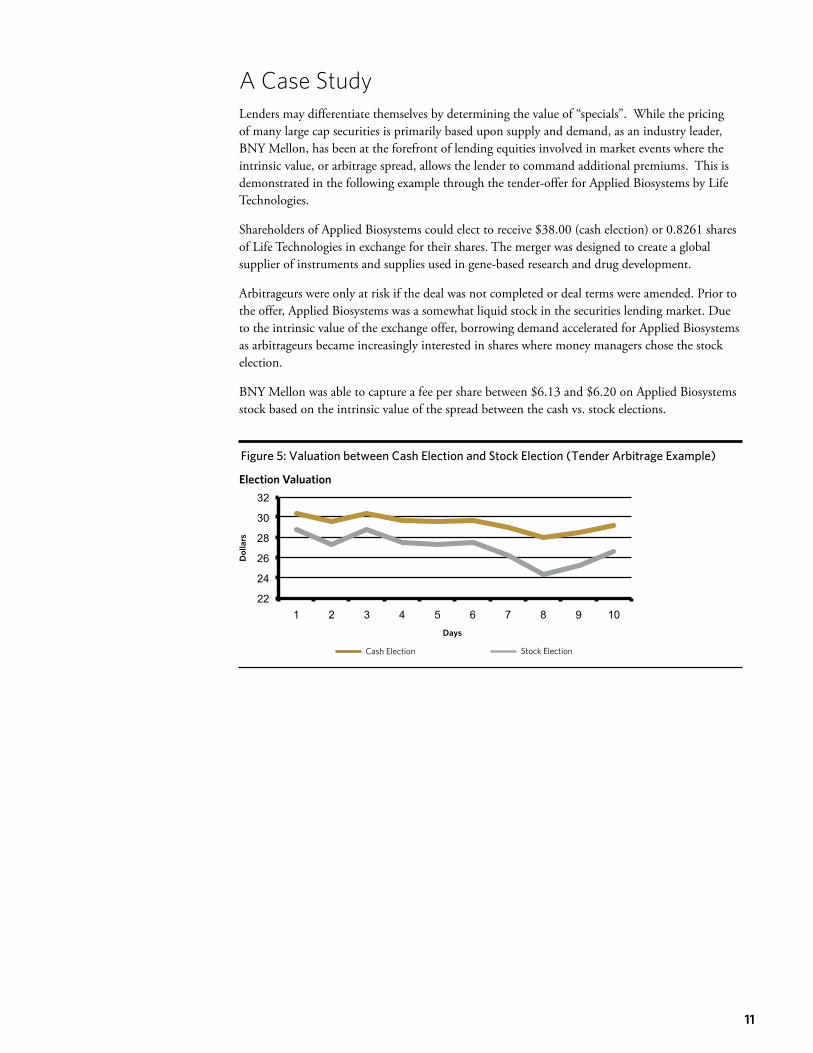
A Case Study Lenders may differentiate themselves by determining the value of “specials”. While the pricing of many large cap securities is primarily based upon supply and demand, as an industry leader, BNY Mellon, has been at the forefront of lending equities involved in market events where the intrinsic value, or arbitrage spread, allows the lender to command additional premiums. This is demonstrated in the following example through the tender-offer for Applied Biosystems by Life Technologies.
Shareholders of Applied Biosystems could elect to receive $38.00 (cash election) or 0.8261 shares of Life Technologies in exchange for their shares. The merger was designed to create a global supplier of instruments and supplies used in gene-based research and drug development.
Arbitrageurs were only at risk if the deal was not completed or deal terms were amended. Prior to the offer, Applied Biosystems was a somewhat liquid stock in the securities lending market. Due to the intrinsic value of the exchange offer, borrowing demand accelerated for Applied Biosystems as arbitrageurs became increasingly interested in shares where money managers chose the stock election.
BNY Mellon was able to capture a fee per share between $6.13 and $6.20 on Applied Biosystems stock based on the intrinsic value of the spread between the cash vs. stock elections.
2
1
3
4
5
The wisdom supporting a value-based lending strategy is that the majority of the earnings from any securities lending transaction should be obtained from the borrower, or as a result of borrowing activity, and not from the investment of the client’s cash collateral. Therefore, emphasis is placed upon “quality” trades, as securities each possess their own intrinsic values. This conservative lending philosophy translates into negotiation of lower average rebate rates. This approach also is conducive to a more cautious collateral investment strategy.
Value-based Lending
Lower On LoanAmounts
Lower Rebates toborrower
Higher LendingSpread
Lower Dependencyon CollateralReinvestmentEarnings
High UtilizationLending
Higher On LoanAmounts
Higher Rebates toborrower
Lower LendingSpread
Higher Dependencyon CollateralReinvestmentEarnings
Rebate Rate (Liability)
Investment Yield (Asset)
High Utilization Transaction Value-based Transaction
BenchmarkRate
0%
Rebate
Investment Yield (Asset)
Rebate Rate (Liability)
Benchmark Rate
0%
Investment Spread Investment
Spread
Lending Spread
Lending Spread
Rebate
Reduced Risk
G
ross Spread
Gro
ss S
prea
d
15,071
9,914
8,000
9,000
10,000
11,000
12,000
13,000
14,000
15,000
16,000
Dec 31 2007
Mar 31 2008
Jun 30 2008
Sep 30 2008
Dec 31 2008
Mar 31 2009
May 31 2009
Dec 31 2007
Mar 31 2008
Jun 30 2008
Sep 30 2008
Dec 31 2008
Mar 31 2009
May 31 2009
SL Industry Lendable ($Bln)
Lendable ($Bln)
3,478
1,840
1,500
2,000
2,500
3,000
3,500
4,000
SL Industry On Loan ($Bln)
On Loan ($Bln)
Dol
lars
Days
Election Valuation
Cash Election Stock Election
Low Reinvestment Risk/High Borrower Exposure High Reinvestment Risk/High Borrower Exposure
High Reinvestment Risk/Low Borrower ExposureLow Reinvestment Risk/Low Borrower ExposureIncreasingBorrower
Exposure
Lower Borrower Risk
Lower Reinvestment Risk
Percentageof Securities
On Loan
Higher Borrower Risk Higher Reinvestment Risk
Intrinsic Lending Strategy
Volume Lending Strategy
More Cash Collateral Invested
Increasing Reinvestment Risk
5%
20%
Value-based Strategy Mitigates Potential Risks
A
B
22
24
26
28
30
32
1 2 3 4 5 6 7 8 9 10
Figure 5: Valuation between Cash Election and Stock Election (Tender Arbitrage Example)

12
BNY Mellon’s Value-based StrategyBNY Mellon’s securities lending program is managed with the primary goal of extracting the full intrinsic value through lending spread from each transaction. The wisdom supporting this strategy comes from the belief that a majority of the earnings from any securities lending transaction should be obtained from the borrower, or as a result of borrowing activity, and not from the investment of the client’s cash collateral. BNY Mellon has been the industry leader in providing high risk-adjusted returns by following this previously unique and largely controversial lending strategy.
Significant opportunities still exist for clients with lower demand assets. These clients are typically exposed to higher risks in order to execute the program appropriately. For example, these clients usually require separately managed accounts, flexible or more liberal cash and non-cash collateral guidelines and term or spread trade structures.
Leveraging TechnologyAs an enhancement to our lending strategy, in 2001, BNY Mellon became the first custodial lender, and remains the only custodial lender, to possess and auction through a proprietary platform individual, multiple or entire portfolios of securities via the Internet to borrowers from around the globe who compete for the securities leading to higher returns for our clients. I-Bid, our revolutionary auction platform, was initially developed to complement a tactical equity lending strategy and allows us to extract greater returns by using Internet based auctions. I-Bid provides fast and efficient global execution and levels the playing field by giving borrowers, both large and small, an equal opportunity to secure our clients’ securities at the highest bid.
Collateral ManagementMany observers continue to assume that the main risk associated with securities lending was the borrower failing to return the loaned securities or some other type of operational risk. The pace of technological innovation and borrower default protection has shifted the primary risk to the investment of cash collateral.
A value-based strategy takes the emphasis off the collateral management function. The collateral investment process may run relatively more conservatively so that the primary source of earnings is the negotiation of the lowest rebate rate by extracting the maximum value from each loan. In such an environment the investment portfolio may be more liquid and use investments with higher credit quality or shorter durations. Investment guidelines should specify permissible and prohibited reinvestment securities as well as detail credit quality, average and final maturity parameters. Managing to maintain adequate liquidity and keeping the overall average maturity of the investment pool short have helped to maintain a very conservative reinvestment portfolio.

13
Risk Management and ComplianceSecurities lending risk management is better served when it is performed independently from the business line to provide objectivity. Multiple steps are needed to recognize, manage or minimize the risks inherent in a lending program. BNY Mellon features independent Risk Management and Compliance groups exclusive to and within our Securities Lending Division that oversee all client guidelines, perform credit analysis on the issuers of securities for our discretionary, internally managed investment funds (separate and commingled), and monitor compliance with procedures established for the program. These groups are completely dedicated to securities lending but follow an independent reporting structure outside of the Division to maintain independence and objectivity.
Industry RecognitionBNY Mellon’s lending strategies and methodologies have been widely appreciated and independently recognized by our clients and the marketplace.
In the Securities Lending Survey published by Global Custodian magazine in 2009, BNY Mellon Asset Servicing collected seven commended awards for securities lending. Our top achievements serve as a testament of our dedication to deliver a securities lending program driven to be the best in class service provider for clients. Moreover, our ratings demonstrate that our expertise, flexibility and focus on client service are at the core of everything we do. As testimony, our clients commented that BNY Mellon has “deep knowledge and perfect service” and consider our approach to risk protection as key strength and differentiator versus our competitors.
We have earned “commended” awards in the following seven categories: $1-10 billion, More than $10 billion, Europe, North America, Global, Single Provider, and Multiple Provider.
Historically, BNY Mellon has ranked among the best performing securities lending providers in the various surveys conducted by Global Custodian. Our product knowledge and in-depth expertise has translated into favorable rankings year after year.
A Time-Tested ProgramBNY Mellon launched securities lending in 1977 and was one of the industry’s initial lending agents providing services to institutional clients. BNY Mellon provides a multi-trillion dollar, 24-hour global securities lending franchise with offices in New York City, Pittsburgh, London, Hong Kong and Toronto. As agent to trillions of securities in 90 countries, BNY Mellon offers clients a comprehensive, flexible and innovative securities lending program.
BNY Mellon offers clients the following benefits:
• Highrisk-adjustedperformance–consistentlyhighindustrysurveyresults
• Borrowerindemnificationfromoneofthemosthighlycapitalizedbanksintheindustry
• Contractualsettlementandincomeinmostmarkets
• Equitableandautomatedloanallocation
• Industryleadingreporting
• LargestlenderofU.S.Treasuriesintheworld
• Automatedauctionplatformforcompetitivepricingofloans
• Dedicatedcreditunderwritingunit
• Real-timeworld-widelendingandreinvestmentplatform

14
GlossaryAgent Lender – a party authorized by a beneficial asset holder to lend out securities.
Basis Point – one one-hundredth of a percent or 0.01.
Benchmark Rate – a predetermined risk-free rate based on published indexes such as the Federal Funds Rate (FFO), the Federal Funds Open Rate (FFO), or the Euro Overnight Index Average (EONIA) for comparison purposes.
Beneficial Owner – the owner of a fully paid for security that usually contracts with a lending agent for the purposes of offering their securities to the borrowing community. The beneficial owner maintains the legal rights of ownership of the securities while they are on loan and is subject to all market events in connection with owning the securities, including interest and dividend income and other corporate actions. Proxy voting rights are forfeited while the securities are on loan.
Collateral – securities or cash delivered by a borrower to a lender to support a loan of securities or cash.
Collateral Management – investing the collateral received in exchange for a securities loan in a variety of instruments.
Demand Spread – for loans vs. cash collateral, it is the weighted average risk-free rate minus the rebate rate owed to the borrower. It represents a measure of the demand value of the loaned security and excludes the benefit of active collateral management. It is also referred to as the funding spread, the intrinsic spread, the intrinsic value, the natural spread or the below-the-line spread. For loans vs. non-cash collateral it is equal to the premium paid by the borrower.
General Collateral – little specific demand for a particular issue but has a generalized need by borrowers. Because there is an abundant supply of these securities, this results in the payment of the highest rebate level by the lending agent to the borrower close to, or may be above, the benchmark rate. Any security with low demand relative to available inventory is likely to be classified as general collateral.
Gross Spread – the total margin generated by the lending transaction subsequent to the rebate paid to the borrower. It is comprised of the demand spread and the reinvestment spread.
Indemnification – some indemnities may be limited to certain types of events (e.g. borrower solvency) while others exclude certain types of collateral deficiencies (e.g. losses in value of non-cash collateral).
Liquidity – a measure of the ability to meet maturing short-term obligations.
Rebate Rate – the interest rate that a securities lender pays the borrower for the use of the borrower’s cash collateral. This will typically be below the risk-free rate and will reflect the demand value of the securities.
Reinvestment Spread – weighted average collateral yield less the weighted average risk-free rate. This represents a measure of the excess return generated by the investment process.
Specials – driven by the laws of supply and demand. These securities are in high demand by borrowers relative to available inventory. Borrowers are willing to pay a higher fee, or accept a lower rebate, to obtain these issues than for general collateral. It is also referred to as hard to borrow.
Spread – the difference between two percentages expressed in basis points. If an investment portfolio yields 5.00% and the rebate is 4.25%, the spread is 75 basis points, or 75/100ths of 1% (1% = 100 basis points).
Utilization – the measure of the market value of securities on loan over the amount of securities that are lendable in a given portfolio. The utilization is expressed as a percentage. For example, Company A’s utilization rate is 80%.
om the cash reinvestment activity? (i.e. What is the Spread Attribution?)

15
AcknowledgementsWe sincerely thank the following for their contributions to this paper:
Tom Daniels, CFA Managing Director Securities Lending, BNY Mellon Asset Servicing
Michael Ruggiero Vice President Securities Lending, BNY Mellon Asset Servicing
Ronald Haller Senior Associate Securities Lending, BNY Mellon Asset Servicing
Kevin Chartier Associate Securities Lending, BNY Mellon Asset Servicing

16
Notes

17
Notes

© 2009 The Bank of New York Mellon Corporation. All rights reserved.
The Bank of New York Mellon – Incorporated with limited liability in the State of New York, USA. Head Office: One Wall Street New York, NY 10286, USA. London Branch registered in England & Wales with FC No 005522 and BR No 000818 - Registered Office at One Canada Square, London E14 5AL, authorised and regulated in the UK by the Financial Services Authority.
Material contained within this Whitepaper is intended for the purposes of general information only. It is not intended to be a comprehensive study of the subject matter, nor provide any business, legal, professional counsel, tax or investment advice, and is not to be used as such. No statement or expression is an offer or solicitation to buy or sell any products or services mentioned. The views expressed herein are those of the contributors only and not those of the Bank.
The contents may not be comprehensive or up-to-date, and the Bank will not be responsible for updating any information, it makes no representation as to its accuracy, completeness, timeliness, merchantability or fitness for a specific purpose. The Bank recommends that professional consultation should be obtained before using any service offered.
The Bank assumes no liability whatsoever for any action taken in reliance on the information contained herein, or for direct or indirect damages resulting from use of this Whitepaper, its content, or services. Any unauthorised use of material is at the user’s own risk. Reproduction, distribution, republication and retransmission of material is prohibited unless the prior consent of the Bank.
The Bank assumes no responsibility or liability for access to or content of any website which is linked to or from this Whitepaper.