thesis submitted for the degree of doctor of philosophy on
TRANSCRIPT
UNIVERSITÀ DEGLI STUDI DI NAPOLI “FEDERICO II”
Thesis submitted for the Degree of Doctor of Philosophy on
NOVEL TECHNOLOGIES FOR MATERIALS, SENSORS
AND IMAGING – XXVII CYCLE
High sensitive sensing by effective immobilization of
UV photo-activated antibodies
Riccardo Funari
Coordinator
Prof. Antonio Cassinese
Tutor
Prof. Raffaele Velotta
ACADEMIC YEAR 2014-2015

Abstract
2
Abstract
Nowadays there is a strong interest in precise and reliable measurement tools suitable for
quantifying physical, chemical, and biological properties. Biosensors face this problem by
exploiting the intrinsic specificity provided by biological sensitive molecules to reveal the
presence of the compound of interest. In particular, proteins like antibodies have a dominant
role in biosensor development since they are selected by host immune system to efficiently bind
foreign species including bacteria, viruses and toxins. Biomolecules involved in biosensing are
usually characterized by a recognition site responsible for the selective detection of the analyte.
This portion of the macromolecule has to be accessible when the sensitive element is coupled
with the inorganic transducer, thus making surface functionalization a crucial phase of
biosensor development. This issue strongly motivates the research of new immobilization and
functionalization techniques allowing the control on both amount and orientation of the
biomolecules thus resulting in better sensitivity and lower limit of detection. Conventional
functionalization strategies are based on covalent and non-covalent interactions between the
biological element and the surface of the transducer. Even if covalent approaches provide an
effective immobilization of the biomolecules, these methods are laborious and time-consuming
since several chemical treatments and purification steps are needed. In addition, the high
toxicity of some chemicals and the complexity of the procedure require trained operators. On
the other side, non-covalent immobilization is much easier to realize since it involves the
spontaneous adsorption of the biomolecules onto the substrate. It is worth mentioning that in
this case uncontrolled adsorption usually results in irregular layers and compromised
recognition of the analyte due to steric hindrance of the binding sites. In addition, weak
connections like van der Waals and hydrogen bonding interactions sometimes do not provide a
stable immobilization onto the sensor surface.
To face this issue, at the Physics Department of University of Naples “Federico II”, an all
optical technique (PIT, Photonic Immobilization Technique) based on the interaction of
ultrashort UV pulses with antibodies has been proposed as a simple and rapid approach capable
to effectively functionalize the sensitive surface of a quartz crystal microbalance. In this thesis,
PIT has been used to realize immunosensors for the detection of a group of analytes of practical
interest. This functionalization technology provides an effective immobilization of antibodies
onto the gold sensor surface upon activation of the protein sample through the selective
photoreduction of the disulphide bridge in the triad cysteine-cysteine/tryptophan, a typical

Abstract
3
structural feature of the immunoglobulins. The absorption of ultrashort UV laser pulses required
for this activation process does not affect the recognition properties of the antibodies. On the
other side, the free thiol groups so produced interact with gold surface thus leading to the
effective exposure of the sensitive portions of the protein, the so-called antigen binding sites,
thus greatly improving the detection efficiency. The effects of this unconventional
functionalization approach on immunoglobulins have been investigated by means of optical
techniques, atomic force microscopy and the so-called Ellman’s assay, a chemical method used
to quantify the thiol groups in a protein sample. PIT based immunosensors have proven to be
effective in the detection of small toxic molecules like parathion (pesticide) and patulin
(micotoxin). The issue of revealing these light molecules using a microgravimetric transducer
like a quartz crystal microbalance have been overcome by ballasting the analytes using two
labelling procedures involving either bovine serum albumin or an antibody in a sandwich-type
configuration. PIT has been used also to realize an immunosensor for the detection of gliadin,
the principal responsible for the coeliac disease. In all these cases, both sensitivity and limit of
detection (usually in nanomolar concentration range) result to be in line with the limits set by
current regulations and comparable or even better than other techniques used to quantify these
harmful molecules. These promising results make PIT a valuable functionalization method for
technologies involving gold surfaces for sensing and detection purposes.

Acknowledgements
4
Acknowledgements
Firstly, I would like to thank my supervisor Prof. Raffaele Velotta for his support and
suggestions provided during the last years. He gave me the opportunity to apply my skills and
creativity in a novel and interdisciplinary field like biosensing. He was always available for
clarifying my doubts about scientific issues quite far from my background. A special thank goes
to Dr. Bartolomeo Della Ventura who strongly assisted me in practical aspects of biosensing
and laboratory activities. Working in an interdisciplinary and open-minded group like the
biophotonic group at the department of physics (UNINA) was a great opportunity to challenge
myself and approaching scientific topic from a completely different point of view. Therefore, I
want to kindly thank Prof. Carlo Altucci, Dr. Felice Gesuele and Dr. Mohammadhassan
Valadan for their moral support, scientific tips and encouragements.
During the PhD activity there was the chance to establish a wide network of
collaborations and friendships mainly thanks to Fondazione con il Sud who supported the
project “Biosensori piezoelettrici a risposta in tempo reale per applicazioni ambientali e
agroalimentari” thereby providing an exciting context for the thesis’ project. Thus, I wish to
thank Dr. Ernesto Lahoz, Dr. Luigi Morra, Dr. Raffaele Carrieri (CRA-FRC), Dr. Nunzio
D’Agostino and Dr. Irma Terracciano (CRA-CAT) for their stimulating discussions. I would
like to thank also Dr. Maddalena Autiero (IVM) and Dr. Nicola Ciancia (Strago) for their
support in the project “Dottorati in Azienda”. Their contributions were crucial to achieve these
results. Furthermore, I want to thank Dr. Dirk Mayer and all members of the Bioelectronics
group of the Jülich Forschungszentrum (PGI-8/ICS-8) for their support during my internship in
their institute.
I thank all my friends for their encouragements and patience. Even if I am not completely
sure that they understood what I was dealing with in the lab, their help was invaluable.
Finally, I would like to thank my parents, my aunt, my grandmother and my dog, Yuma,
for constant encouragements, support and, moreover, their endless love. Thank you, I could not
have done it without you.

Table of contents
5
Table of contents
Abstract ............................................................................................................................. 2
Acknowledgements ........................................................................................................... 4
Table of contents ............................................................................................................... 5
1 Principles of Biosensing ........................................................................................... 7
1.1 Sensors and Biosensors ........................................................................................ 7
1.2 Quartz Crystal Microbalance (QCM) ................................................................. 10
1.3 Surface functionalization .................................................................................... 13
1.4 Immunoglobulins: antibody structure and immune response ............................. 15
1.4.1 Polyclonal, monoclonal and recombinant antibodies .................................. 18
1.5 A sensing challenge: detection of small molecules ............................................ 20
1.5.1 Parathion...................................................................................................... 20
1.5.2 Patulin.......................................................................................................... 23
1.6 Biosensors in food analysis ................................................................................ 25
1.6.1 Gliadin ......................................................................................................... 25
2 Experimental section .............................................................................................. 27
2.1 Chemicals ........................................................................................................... 27
2.2 Immunoglobulin purification .............................................................................. 28
2.3 QCM apparatus and fluidic setup ....................................................................... 28
2.4 Gold surface preparation .................................................................................... 30
2.5 QCM experiment ................................................................................................ 31
2.6 UV laser source .................................................................................................. 32
2.7 Atomic Force Microscopy (AFM) measurements .............................................. 33
3 Photonic Immobilization Technique (PIT) ............................................................ 35
3.1 Photonic activation of immunoglobulins: molecular mechanism ...................... 35
3.2 Revealing thiol groups in proteins: Ellman’s assay ........................................... 38
Table of contents
6
3.3 Role of the UV source in the photonic activation .............................................. 40
3.4 Imaging proteins on nanometric scale: Atomic Force Microscopy (AFM) ....... 45
4 Applications of PIT ................................................................................................ 49
4.1 A case study: IgG and anti-IgG .......................................................................... 49
4.2 Parathion ............................................................................................................. 51
4.2.1 “BSA protocol” ........................................................................................... 51
4.2.2 “Sandwich protocol” ................................................................................... 56
4.3 Patulin ................................................................................................................. 63
4.4 Gliadin ................................................................................................................ 65
5 Conclusions ............................................................................................................ 68
References ....................................................................................................................... 70
List of publications .......................................................................................................... 78
Detection of Parathion Pesticide by Quartz Crystal Microbalance Functionalized with
UV-Activated Antibodies................................................................................................ 79
Nano- and femtosecond UV laser pulses to immobilize biomolecules onto surfaces with
preferential orientation .................................................................................................... 85
Detection of parathion and patulin by quartz-crystal microbalance functionalized by the
photonics immobilization technique ............................................................................... 91
A simple MALDI plate functionalization by Vmh2 hydrophobin for serial multi-
enzymatic protein digestions ........................................................................................... 97
Nano-machining of bio-sensor electrodes through gold nanoparticles deposition
produced by femtosecond laser ablation ....................................................................... 107
Chapter 1 Principles of Biosensing
7
1 Principles of Biosensing
1.1 Sensors and Biosensors
A sensor is a device providing an output signal in response to a certain input quantity.
The nature of the input signal can vary significantly, ranging from physical (e.g. mechanical
properties of thin films) to chemical and biological quantities (e.g. concentration of analytes
and pollutants in liquid or gaseous environment), whereas the output signal is usually electrical.
Thus, in a typical sensor, a transduction process leads to the conversion of the input event into
an electrical output which is eventually amplified and then sent outside the sensor itself for
displaying, storage or analysis. Such a devices are commonly characterized by considering three
fundamental parameters: sensitivity, limit of detection (LOD) and selectivity. The sensitivity is
the measure of the intensity of the output signal due to a corresponding input event; the LOD
is the lowest measurable input signal and the selectivity is the capability of the device to
discriminate between different inputs. Even if it is possible developing and realizing extremely
sensitive sensors for both gas and liquid analysis, it is challenging achieving a selective
response. On the other side, biosensor based detection provides high selective detection as a
results of the intrinsic properties of biological sensitive elements like proteins or nucleic acids1.
In the first book dedicated to biosensing (Biosensors: fundamentals and applications,
19872), A. P. F. Turner defined a biosensor as “a device incorporating a biological sensing
element either intimately connected to or integrated within a transducer. The usual aim is to
produce a digital electronic signal which is proportional to the concentration of a specific
chemical or set of chemicals. The apparently alien marriage of two contrasting disciplines
combines the specificity and sensitivity of biological systems with the computing power of the
microprocessor”. This definition, still valid, highlights the need to connect different research
areas (biology, chemistry, physics and engineering) to realize an analytical device capable to
quantify the presence of a specific substance in a complex sample. The main difference between
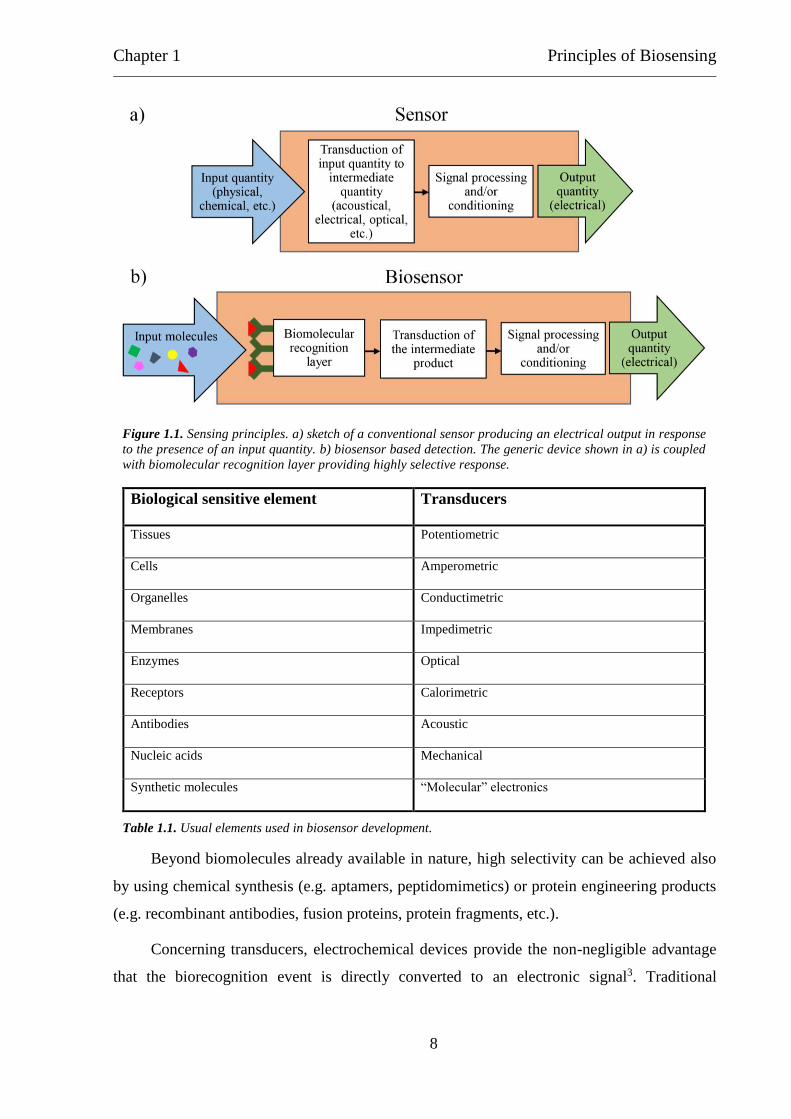
sensors and biosensors are sketched in Figure 1.1.
While a sensor involves the direct transduction of the input signal (Figure 1.1a), biosensor
based devices incorporate a biomolecular recognition element reacting with only one specific
type of molecule (Figure 1.1b). Biosensors are usually classified according to the sensitive
molecule and the transduction principle. Some examples are reported in Table 1.1.
Chapter 1 Principles of Biosensing
8
Beyond biomolecules already available in nature, high selectivity can be achieved also
by using chemical synthesis (e.g. aptamers, peptidomimetics) or protein engineering products
(e.g. recombinant antibodies, fusion proteins, protein fragments, etc.).
Concerning transducers, electrochemical devices provide the non-negligible advantage
that the biorecognition event is directly converted to an electronic signal3. Traditional
Biological sensitive element Transducers
Tissues Potentiometric
Cells Amperometric
Organelles Conductimetric
Membranes Impedimetric
Enzymes Optical
Receptors Calorimetric
Antibodies Acoustic
Nucleic acids Mechanical
Synthetic molecules “Molecular” electronics
Table 1.1. Usual elements used in biosensor development.
Figure 1.1. Sensing principles. a) sketch of a conventional sensor producing an electrical output in response
to the presence of an input quantity. b) biosensor based detection. The generic device shown in a) is coupled
with biomolecular recognition layer providing highly selective response.
Chapter 1 Principles of Biosensing
9
techniques like cyclic voltammetry, amperometry and potentiometry are commonly exploited
to measure the concentration of dissolved ions and gases4. The coupling of this approach with
biological sensitive elements allows to improve the specificity of the device, however these
methodologies can be severely affected by other electroactive species eventually present in the
sample.
Optical devices are commonly based on changes in the optical properties of a sensitive
layer or medium5. This effect is usually related to the biorecognition of the analyte. For instance,
in fluorescence-based detection, changes in the intensity of the fluorescence indicates the
presence of the target molecules, providing that the compound is intrinsically fluorescent.
Alternatively, either target or biorecognition molecules can be labeled with fluorescent tags.
Even if this procedure is extremely sensitive, the labelling procedure is usually laborious and it
may interfere with the recognition event. On the other side, label-free detection is much easier
to design. Such an approach is used for some optical transducers including Surface Plasmon
Resonance (SPR) devices6.
Mechanical phenomena due to chemical and biochemical events rule motility, adhesion,
transport and affinity effects on cellular and molecular scale. It is possible exploit such a
properties to investigate biorecognition events (e.g. antibody-antigen interaction) thus obtaining
valuable transducers for biosensor development7. To this aim, in view of their cost-effectiveness
and reliability, mechanical and acoustic devices like Quartz Crystal Microbalances (QCM)
achieved an important role in this research field.
A wide range of practical problems requiring portable and low-cost detection tools
motivates the research on biosensing. For instance, real-time and in situ analysis of clinical
samples is a valuable target in biomedical field. Even more interesting is achieving a continuous
in vivo monitoring of drugs and metabolites level using miniaturized devices. In this topic, the
classic example is the glucose sensor for diabetes8. Glucose biosensing has been the starting
point of the modern idea of biosensor. This concept started from the scientific activity of Clark
and Lyons9, who proposed that enzymes can be immobilized onto electrochemical detectors to
realize the so-called 'enzyme electrodes'. Another interesting application area for biosensing
concerns food quality, which requires rapid methods for estimating deteriorations and
contaminations. This issue is of paramount importance for people affected by allergies and food
related pathologies like the coeliac disease. In addition, concerns for natural environment
highlight the importance of sensors for pollutants like industrial products, pesticides and
Chapter 1 Principles of Biosensing
10
polycyclic aromatic hydrocarbons (PAH). More in general, the strong need of analytical tools
suitable for revealing the presence of toxic and harmful compounds strongly supports the
research of novel detection devices, like biosensors, providing cheap, fast and easy analysis of
the matrix of interest.
1.2 Quartz Crystal Microbalance (QCM)
In recent years Thickness Shear Mode (TSM) resonators, widely referred to as Quartz
Crystal Microbalances (QCM), are receiving an increasing interest from scientific community
mainly due to their wide range of application including surface characterization, material
science, sensing, environmental monitoring and protein studying1,10–14. QCMs were originally
used for studying material deposition phenomena in vacuum and air. Then, since this device
have been proven to work also in liquid environment, quartz microbalances were employed in
developing sensors and biosensors for water samples analysis. The physical principle which
rules this kind of technology is the reverse piezoelectric effect discovered by Pierre and Paul-
Jacques Curie in quartz. They found that for certain crystalline materials a mechanical stress
produces an electrical polarization (direct piezoelectric effect). On the other side, if an electric
field is applied to the same material this results in a mechanical deformation (reverse effect).
For QCM application AT-cut quartz are commonly used. AT-cut refers to crystals cut at an
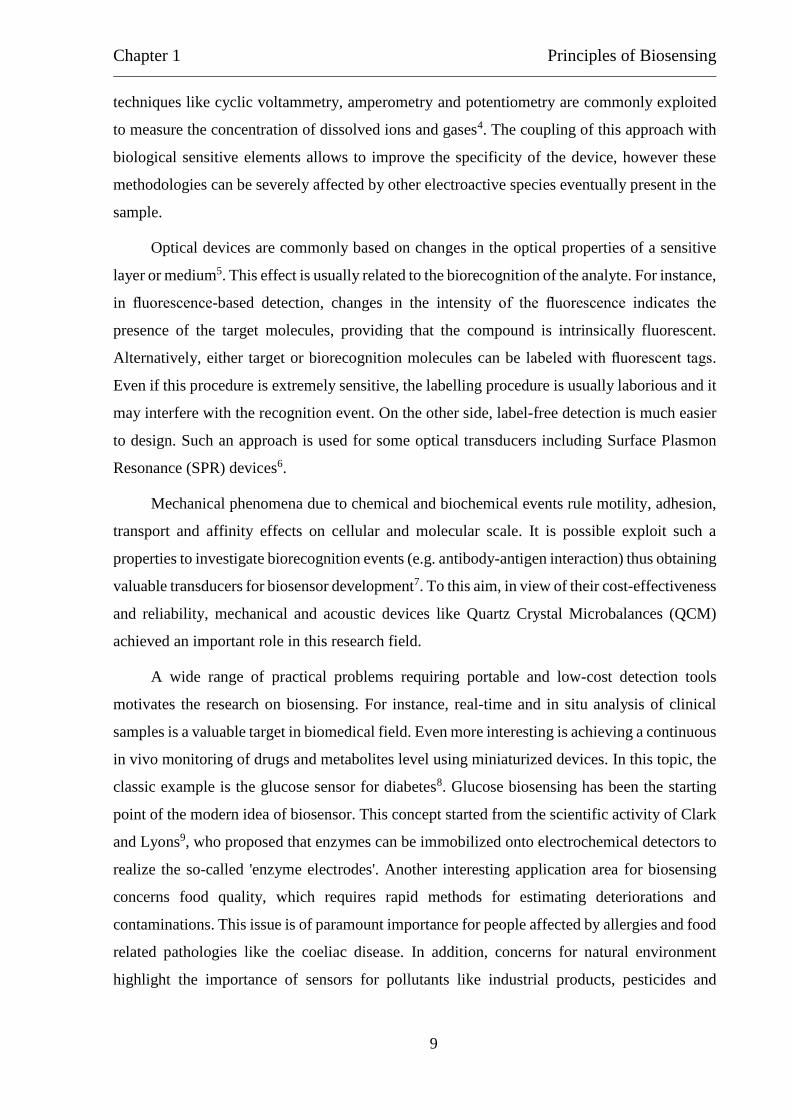
angle of 35° 15’ from the optical axis. A quartz crystal resonator consists of a thin disk of quartz
with circular gold electrodes on both sides as shown in Figure 1.2.
Figure 1.2. a) QCM electrode. b) Sketch (not to scale) of the structure of the electrode and c) shear deformation
at the fundamental frequency. Both sides (i.e. electrodes) can be used.

Chapter 1 Principles of Biosensing
11
In view of its piezoelectric properties, the application of an alternating voltage across the
electrodes results in the generation of shear waves in the crystal. The overlap of these two waves
is the displacement in the quartz.
A shear wave propagates through the crystal and is reflected on its faces. If the total phase
shift is an integer multiple of 2π constructive interference will lead to crystal resonance. For a
TSM resonator the following resonance conditions are valid:
ℎ𝑠 = 𝑁 (
𝜆
2) (1.1)
𝑓𝑁 =
𝑁𝑣𝑠
2ℎ𝑠 (1.2)
where hs is the thickness of the crystal, N is the mode number (odd integer), λ is the acoustic
wavelength, fN the resonance frequency and vs is the shear wave velocity which is defined as:
𝑣𝑠 = √𝜇𝑞
𝜌𝑞 (1.3)
where μq (2.947 × 10¹¹ g cm-1 s-2) and ρq (2.648 g cm-3) are quartz shear modulus (stiffness) and
density, respectively.
Since the displacement maximum occurs at the quartz disk faces, the device results to be
extremely sensitive to surface perturbations and mass deposition thus affecting QCM resonance
frequency. The gold-quartz wafer is commonly integrated in an oscillator circuit, where the
oscillation frequency tracks the quartz resonance allowing to monitor material adsorption onto
the gold surface. Resonance in a mechanical system is achieved only at specific frequencies
where kinetic (Uk) and potential (Up) peak energies are perfectly balanced. When mass
accumulates on the gold electrode, the kinetic energy of the system rises (the material moves
synchronously with the crystal surface) and resonant frequency must change to rebalance Uk
and Up. Analytical formulation for Uk and Up are obtained summing the contributions from
infinitesimal crystal slices across hs:
𝑈𝑘 =
𝜔2𝑢𝑥02
2(𝜌𝑠 +
𝜌𝑞ℎ𝑠
2) (1.4)
𝑈𝑝 =
𝜇𝑞𝑘2𝑢𝑥02 ℎ𝑠
4 (1.5)

Chapter 1 Principles of Biosensing
12
where ux0 is the surface displacement amplitude, ρs is the surface density (mass/area) of the
adsorbed material and k is the wavenumber. Since Uk and Up are supposed to be equivalent, the
following relationship turns out:
(
𝜔0
𝜔)
2
= 1 +2𝜌𝑠
ℎ𝑠𝜌𝑞 (1.6)
where ω0 and ω are the basal and the final angular resonance frequencies, respectively. In
particular ω0 is obtained when ρs = 0:
𝜔0 = 2𝜋𝑓0 =𝜋
ℎ𝑠√
𝜇𝑞
𝜌𝑞 (1.7)
For ρs<<hsρq Equation 1.6 can be linearly approximated as follow:
∆𝑓
𝑓0= −
𝜌𝑠
ℎ𝑠𝜌𝑞 (1.8)
This relationship shows that the fractional shift in the oscillation frequency of the
oscillator is equal to the fractional shift in mass due to the adsorbed material. This
approximation is valid for mass fractions up to a few percent of the mass of the wafer.
Combining equations 1.1, 1.2, 1.3 and 1.8 leads to the so called Sauerbrey’s equation
which is used to estimate the amount of material deposited onto the QCM gold electrode15:
∆𝑓 = −
2𝑓02𝜌𝑠
√𝜇𝑞𝜌𝑞
= −2𝑓0
2∆𝑚
𝐴√𝜇𝑞𝜌𝑞
(1.9)
where A is the piezoelectrically active area (the surface of the electrode) and Δm is the deposited
mass. To apply this relationship the layer on the electrode must be rigid and thin. QCM can be
used also to measure the accumulation of soft molecules from liquid phase or properties of the
contacting fluid (e.g. density, viscosity, etc.). In that case the electrical properties of the
oscillating circuit and dissipation phenomena have to be considered thus leading to a more
complex model. For example Kanazawa and Gordon16 showed that the liquid in contact with
the electrode damps the crystal oscillation and Sauerbrey’s equation has to be modified:
∆𝑓 = −√𝑓03
𝜌𝑙𝜂𝑙
𝜋𝜇𝑞𝜌𝑞 (1.10)
being ρl and ηl the density and the viscosity of the liquid, respectively.

Chapter 1 Principles of Biosensing
13
More in general, a variety of papers show that the combined effect of hydration water,
liquid trapped in the absorbed molecules, and the flexibility of many polymers/biomolecules,
induce frictional (viscous) losses and thus a dampening of the QCM oscillation frequency10–
12,17,18. An accurate estimation of the amount of mass adsorbed on the electrode will require the
measurement of the dissipation using expensive and up-to-date QCM devices like the QCM-D.
However, since the quartz microbalances are extremely sensitive to mass deposition onto the
electrode surface, it is possible use them as transducers to convert biomolecular recognition
events in frequency shifts. Biomolecules can be used to functionalize the gold sensor surface
thus exploiting the intrinsic specificity and sensitivity of proteins and nucleic acids to bind and
detect the desired compound. The biorecognition leads to an increase of the mass onto the
electrode thus decreasing the resonance frequency of the QCM. After a proper calibration and
specificity tests (e.g. analysis of a real sample) it is possible using the QCM technology to
develop sensors and biosensors.
1.3 Surface functionalization
Coupling a biomolecule with an inorganic transducer is one of the main issues in
developing biosensors. The topic of surface functionalization has been widely explored in
various research areas including diagnostics, affinity chromatography, ELISA assays and
microarrays.
Generally, a biological molecule (e.g. proteins, nucleic acids) moves into aqueous
environment and its functions are characterized by biochemical parameters, which can be
severely affected by the immobilization process. A biomolecule suitable for biosensing usually
has a sensitive site responsible for the selective recognition of the compound of interest. Since
this portion has to be available and well exposed to the environment to achieve the effective
detection of the analyte, the orientation of the biological sensitive element is crucial. In view
on the importance of this issue, there is a strong interest in the research of new immobilization
and functionalization techniques providing better sensitivity and lower LOD as highlighted by
the vast literature on this topic19,20. In particular, Trilling et al.21 have recently investigated the
relationship between analyte characteristics and capture molecule anchoring, showing that the
uniform orientation of the recognition elements provides a huge systematic improvement in
sensitivity when the binding involves weak interactions. They observed that the smaller the
molecule and the lower the epitope number per analyte, the more important is the orientation
of the sensitive biomolecule.
Chapter 1 Principles of Biosensing
14
The easiest way to immobilize biomolecules onto a hydrophobic substrate is via
spontaneous adsorption based on weak and non-covalent connections like van der Waals and
hydrogen bonding interactions. The main advantage of this method is that it avoids chemical
treatments but, on the other side, uncontrolled adsorption usually results in irregular layers and
compromised recognition of the analyte due to steric hindrance of the binding sites. Other non-
covalent approaches involve well-known strong biomolecular interactions. For instance,
biotinylated and His-tagged proteins (i.e. proteins having a poly-histidine sequence) can be
easily immobilized onto streptavidin-coated and Ni2+ chelating supports, respectively22. Even
if these strategies allow a more efficient orientation of the immobilized biomolecules, they
require recombinant proteins in which amino- or carboxy-terminal tags have to be introduced.
It is also possible take advantage of existing functional groups on the biomolecule.
Concerning covalent based immobilization, the most common methods involve the random
conjugation of the amino groups exposed by the biomolecule (mainly due to the lysine residues
in proteins) to amine-reactive surfaces. These kind of strategies are usually laborious since the
chemicals used during the activation process need to be removed at the end of each step. In
some cases, more strategies are coupled to obtain uniform protein layers. For example,
antibodies can be oriented onto the substrate through binding to immobilized protein A or G23.
These biomolecule recognize the Fc region of most immunoglobulins, but this interaction
sometimes is not stable enough for some applications.
Another covalent approach involves a photochemical reaction between the biomolecule
and a compound activated by absorbing photons in the visible or UV range. Several light-
induced immobilization techniques have been developed24 showing that the treatments required
can severely affect structure, activity and orientation of the target protein.
A particular category of functionalization involves the deposition of self-assembled
monolayers (SAM), widely used for metallic substrates25,26. This technique provides uniform
and homogeneous layers, which are crucial for optical sensors.
The functionalization of gold surfaces entices many efforts in view of their role in many
sensors including Quartz Crystal Microbalances27–30 and Surface Plasmon Resonance (SPR)31–
33 based devices. Gold is a noble metal having a low tendency to oxidize and easily cleanable
by chemical treatments such as piranha solution (a mixture of sulfuric acid and hydrogen
peroxide). The stability of gold-sulfur interaction is usually exploited to immobilize molecules
on gold supports, since the only requirement is the availability of a free thiol group (-SH). This
Chapter 1 Principles of Biosensing
15
chemical function is the main characteristic of the cysteine, one of the amino acids normally
present in proteins and peptides. If the biomolecule has not intrinsic thiol groups, it possible
introducing them by chemical reaction. For instance, the so-called Traut’s reagent (2-
iminothiolane hydrochloride) is used to modify amine groups on proteins thus obtaining new
sulfhydryl groups for further applications.
The majority of these immobilization methods require one or more time-consuming
chemical and thermal treatment, sometimes involving hazardous reactants, which can
potentially affect both structure and activity of the biological sensitive element. Therefore, there
is the need of less invasive procedures preserving the functional properties of the biomolecule.
To this aim, Neves-Petersen et al.34,35 developed the so-called LAMI (Light Assisted
Molecular Immobilization), a photonic method for protein functionalization of thiol-reactive
substrates which preserves the native structural and functional properties of the biomolecule.
This strategy allows to achieve spatially oriented and localized immobilization of biomolecules
by exploiting an intrinsic natural property of some proteins and peptides, whereby a disulphide
bridge, located in close proximity to an aromatic residue (i.e. tryptophan, tyrosine and
phenylalanine), is reduced as a consequence of the UV irradiation of the sample. Since, the triad
of residues cys-cys/aromatic (typically cys-cys/trp) is present in many proteins including
enzymes and immunoglobulins36, LAMI has been used to realize several biosensors and protein
microarrays34,35,37,38. The main drawback of this technique is that, using conventional UV
lamps, an effective protein activation requires several hours of irradiation. Therefore, there is
the opportunity to improve significantly the photonic activation process by using UV sources
(i.e. lasers) capable to deliver the amount of energy required by the photoreduction process in
much shorter time.
1.4 Immunoglobulins: antibody structure and immune response
Antibodies or immunoglobulins are big Y-shaped proteins, which play a key role in the
immune response since they are involved in catching and possibly neutralizing foreign targets
(named antigens) like bacteria, viruses and toxins39. The presence of an extraneous object into
an organism causes the activation of a complex metabolic pathway which leads to several
immune effects including the production and releasing of antibodies by B lymphocytes (a kind
of white blood cell). These cells expose a membrane immunoglobulin named B cell receptor
(BCR). The antigen binding by these membrane proteins and the eventual stimulation from
other elements of the immune system lead to B lymphocytes activation and differentiation in

Chapter 1 Principles of Biosensing
16
either “antibody factories” (plasma cells) or memory cells, which will survive in the organism
providing a faster immune response upon future exposure to the same antigen.
The majority of immunoglobulins has a common basic architecture consisting of three
globular domain of similar size connected by a flexible portion named “hinge region”. This big
tetrameric structure, weighing about 150 kDa, is made of two kinds of polypeptide chains, the
so-called heavy chains (of about 50 kDa) and light chains (of about 25 kDa), which are folded
in constant (C) and variable (V) immunoglobulin domains. This fold (of about 110 amino acids)
is typical of immunoglobulins and consists of two antiparallel β-sheets, which are assembled
through a disulphide bonds and non-covalent interactions (i.e. salt bridges, hydrophobic
interactions and hydrogen bonds). The two sheets are placed opposite to each other to form the
so-called “β barrel”. The four polypeptidic chains are connected into the Y-shaped structure
through inter-chain disulphide bridges and non-covalent bonds. The antibodies have two
distinct functions. The former is the antigen binding which allows to label and eventually
neutralize the antigen. The latter is the recruitment of other components of the immune system
to destroy and degrade the flagged object. These activities involve two distinct globular
domains of the macromolecule: the two antigen binding fragments (Fab) and the crystallizable
fragment region (Fc) which correspond to the arms and the legs of the “Y”, respectively. Each
Fab contains the variable domains of heavy and light chains (VH and VL) which form the
antigen-binding site, or paratope, which is specific for a portion of the antigen, the epitope. The
paratope, which includes the so-called complementary determining regions (CDR), is generated
by random arrangements of a specific gene cluster. After the activation of the lymphocyte, this
DNA region is slightly modified through random mutation to improve the immunoglobulin
binding affinity. This pathway provides an enormous variability in antibody specificity thus
allowing the immune system to recognize a wide range of antigens. The typical structure of a
type G immunoglobulin (IgG)40 and its classification in domains are shown in Figure 1.3.
Depending on the constant region, antibodies are classified in isotypes with different
functional locations and immunological properties. For instance, mammalian immunoglobulins
are divided in five classes: IgA, IgD, IgE, IgM, and IgG. IgA is dimeric and localized in mucosal
areas. IgD acts as membrane immunoglobulin on B cells and participate in immune system
stimulation. IgE is involved in allergic responses. IgM is expresses as either monomer on B
cells surface or as pentamer in the early stages of the antibody production. Finally, IgG, which
represents about the 75% of human adult serum antibodies, is the main effector molecule of the

Chapter 1 Principles of Biosensing
17
B cell activity against invading pathogens. In view of their properties (e.g. high specificity and
avidity), immunoglobulins are commonly used as biological sensitive element in biosensors
development31.
Figure 1.3. a) Crystallographic structure of a type G immunoglobulin (1IGY). The four polypeptide chains are
highlighted in different colors. b) Schematic representation of the antibody where the different portions are
labelled. Key: light chain – green; heavy chain – blue; VH – variable domain heavy chain; VL – variable
domain light chain; CH – constant domain heavy chain; CL – constant domain light chain.
a)
b)
Chapter 1 Principles of Biosensing
18
1.4.1 Polyclonal, monoclonal and recombinant antibodies
There are different ways to produce antibodies for practical applications like
immunosensing and diagnostics. The easiest is the immunization of a mammal (the most
common are rabbit and mouse). The host immune system will respond to the injection of a
foreign antigen producing big amounts of immunoglobulins, which will be purified from the
blood through chromatographic procedures (for more details see paragraph 2.2). Since different
B-lymphocytes clones produce antibodies against the injected antigen, these immunoglobulins
are known as polyclonal antibodies (pAb). pAbs bind different epitopes on the antigen thus
providing an effective neutralization of the targets. On the other side, this property can lead to
false positive events in detection techniques since pAbs can catch antigens showing similar sets
of epitopes (this risk is mostly negligible in small molecule detection since in that case the
epitope corresponds to the whole antigen). In addition, the production of pAbs is limited by the
size of the host. Mice are commonly killed during the blood taking while bigger mammalians
(e.g. rabbit) can be immunized several times.
The antibody production has been revolutionised by Kohler and Milstein in 197541 who
developed a procedure to get monoclonal antibody (mAb) producing cells winning the Nobel
Prize for physiology and medicine in 1984. Since mAbs are produced by a cell line deriving
from a single differentiated B-lymphocyte, they are able to recognize only a specific epitope on
the antigen. B-cells cannot artificially survive for long time, therefore, after the extraction from
the host, they are fused to cancer cells (i.e. myeloma cells) to get immortal cell lines. The fusion
is performed using polyethylene glycol (PEG) or, more recently, electric pulses (electrofusion).
The new immortalized cells are known as hybridoma cells. They are diluted and screened for
the ability to produce antibodies against the desired target using enzyme-linked immunosorbent
assays (ELISA). This selection procedure is performed several times (three at least) until a
stable cell line is achieved. Finally, these hybridoma cells are amplified for large scale antibody
production. In view of the more advanced techniques required for their production, mAbs are
usually more expensive than pAbs. The sketch in Figure 1.4 shows the differences between the
production processes of pAbs and mAbs.
Recent advances in protein engineering and molecular biotechnology allow in vitro
modifications of natural antibodies. The so-called recombinant antibodies (rAb) were initially
developed to face the issue of “humanise” natural mammalian mAbs for clinical applications42.

Chapter 1 Principles of Biosensing
19
Fig
ure
1.4
. O
verv
iew
of
pA
b a
nd
mA
b p
rodu
ctio
n, se
e te
xt f
or
det
ail
ed d
escr
ipti
on
. T
he
imm
un
iza
tio
n o
f th
e an
ima
l a
) is
req
uir
ed i
n b
oth
pro
ced
ure
s. b
) a
nd
c)
are
rel
ate
d t
o
pA
b e
xtra
ctio
n a
nd
pu
rifi
cati
on
. d
) to
i)
des
crib
e m
Ab
pro
duct
ion
.

Chapter 1 Principles of Biosensing
20
Further development of these techniques lead to “smaller” antibodies, improved binding
affinity and conjugation with specific molecules for imaging and cell-target therapies. It is
worth highlight that it is very hard producing antibodies against highly toxic molecules in
conventional ways. Mammalian hosts/cells usually do not survive for enough time to produce
antibodies against the harmful compound. On the other side, novel techniques like phage
display allow to overcome this issue exploiting CDR codifying DNA segments resulting from
random in vitro synthesis (i.e. polymerase chain reaction, PCR) and B-cells from immunized
and unimmunized (i.e. naïve B-cells) donors. Two examples of rAbs are the single-chain
variable fragment (scFv) and the Fab. The scFv consists of the VH and VL domains, which form
the paratope, connected by a short flexible peptide while the Fab is the macroglobular domain
of the immunoglobulin involved in the antigen recognition. rAbs have several advantages
compared to “classic” antibodies but the procedures to realize these novel immunoglobulins are
quite expensive and time-consuming. These bottlenecks make the conventional antibodies the
most valid choice for immunosensing.
1.5 A sensing challenge: detection of small molecules
The effective detection of small molecular weights analytes is of paramount importance
in a wide range of scientific topics like investigating molecular recognition events and sensing
of toxic molecules10,12,43,44. In particular, in the field of environmental monitoring it would be
valuable having cost-effective and sensitive tools allowing the detection of harmful compounds
like steroids, herbicides, pesticides, toxins and combustion products like PAHs. Usually, these
pollutants are low soluble in aqueous environment and have a quite small molecular weight (i.e.
about hundreds of Da) thus making their detection challenging. In view of their properties,
parathion and patulin have been chosen as cases studies to realize efficient detection tools.
These molecules have a relatively low molecular weight and high interest for environment and
health safety.
1.5.1 Parathion
Parathion [IUPAC name O,O-Diethyl O-(4-nitrophenyl) phosphorothioate] is the trading
name of a powerful insecticide and acaricide developed by IG Farben in the 1940s.
Organophosphate pesticides, like parathion, are chemical synthesis products widely used to
enhance agricultural production. This class of chemicals selectively inhibits the
acetylcholinesterase, an essential enzyme for nervous function in insects and mammalians.
Organophosphates act by phosphorylating the serine hydroxyl group in the active site of the
Chapter 1 Principles of Biosensing
21
acetylcholinesterase thus resulting in the inactivation of the enzyme. Acetylcholine is a
neurotransmitter produced during the nervous signal transmission and must be hydrolyzed to
prevent the continuous stimulation of cholinergic receptors45. As a consequence of the
organophosphate poisoning, the inhibition of the acetylcholinesterase leads to the accumulation
of the neurotransmitter thus resulting in respiratory distress and muscular overstimulation.
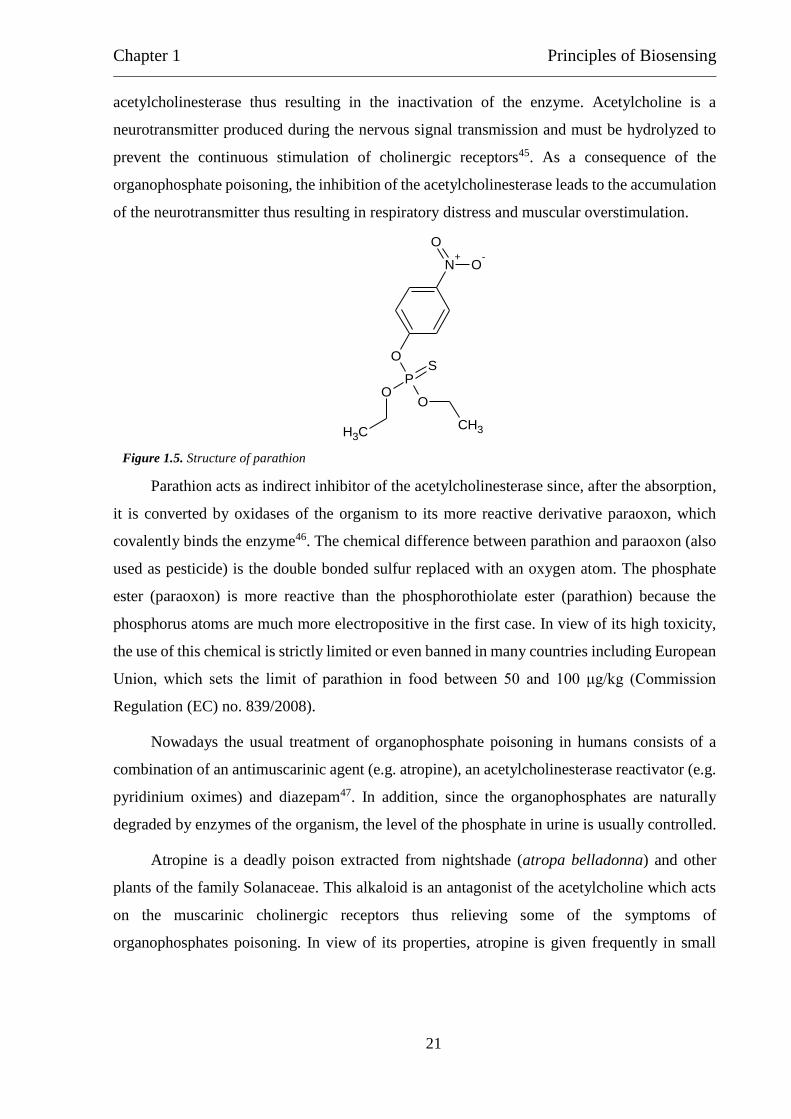
Parathion acts as indirect inhibitor of the acetylcholinesterase since, after the absorption,
it is converted by oxidases of the organism to its more reactive derivative paraoxon, which
covalently binds the enzyme46. The chemical difference between parathion and paraoxon (also
used as pesticide) is the double bonded sulfur replaced with an oxygen atom. The phosphate
ester (paraoxon) is more reactive than the phosphorothiolate ester (parathion) because the
phosphorus atoms are much more electropositive in the first case. In view of its high toxicity,
the use of this chemical is strictly limited or even banned in many countries including European
Union, which sets the limit of parathion in food between 50 and 100 μg/kg (Commission
Regulation (EC) no. 839/2008).
Nowadays the usual treatment of organophosphate poisoning in humans consists of a
combination of an antimuscarinic agent (e.g. atropine), an acetylcholinesterase reactivator (e.g.
pyridinium oximes) and diazepam47. In addition, since the organophosphates are naturally
degraded by enzymes of the organism, the level of the phosphate in urine is usually controlled.
Atropine is a deadly poison extracted from nightshade (atropa belladonna) and other
plants of the family Solanaceae. This alkaloid is an antagonist of the acetylcholine which acts
on the muscarinic cholinergic receptors thus relieving some of the symptoms of
organophosphates poisoning. In view of its properties, atropine is given frequently in small
CH3CH3
N+
O-
O
OO
O
PS
Figure 1.5. Structure of parathion
Chapter 1 Principles of Biosensing
22
doses. The usual therapy consists in giving 2 mg (0.02 mg/kg in a child) intravenously every 5-
10 minutes. The effect of atropine should be kept for the whole treatment.
In view of their high nucleophilicity, pyridinium oximes are able to reactivate
phosphorylated acetylcholinesterase by displacing the phosphoric group from the active site of
the enzyme thus releasing phosphorylated oximes. The efficiency of this treatment depends on
the organophosphate compound and on the rate of dealkylation of the phosphoric residue
bounded to the enzyme. This phenomenon, known as aging, stabilizes the enzyme-inhibitor
complex thus making the acetylcholinesterase resistant to both spontaneous and oxime-induced
reactivation. Pralidoxime (also known as 2-PAM) is commonly used in combination with
atropine for organophosphate poisoning48. The usual therapy consists in a PAM-2 intravenous
infusion (30 mg/kg for adults and 20-50 mg/kg for children) for the first 15-30 minutes.
Depending on the severity of the poisoning, additional oxime is given.
Diazepam is a benzodiazepine frequently used for treating and preventing convulsions
and muscle fasciculation due to organophosphate poisoning. It is given intravenously in both
absence (5-10 mg) and presence (10-20 mg) of convulsions.
The details of the treatment of organophosphate poisoning have been pointed out in
several publications49–51.
Organophosphate pesticides are usually quantified exploiting chromatographic based
strategies which requires sample pre-treatment and highly sensitive detection systems like mass
spectrometry52–54. On the other side sensor and biosensor based detection allows in situ and
real-time analysis for both environmental monitoring and food quality control32.
In this research field the lowest LOD for organophosphates in aqueous environment has
been achieved by Walker et al.55 using a Polymerized Crystalline Colloidal Array (PCCA)
photonic crystal sensing material. The crystals were coupled with acetylcholinesterase which,
once covalently modified by the pesticide, changes the optical properties of the device thus
reaching a detection limit of 4.26 fM. Since this PCCA based biosensor requires low ionic
strength solution, its application in analysing real aqueous samples is strictly limited. In
addition, it is worth to highlight that inhibition-based strategies involving acetylcholinesterase
are intrinsically not selective.
Another widely explored organophosphate detection method involve amperometric
devices56. This technique allows cheap, rapid and effective analysis of aqueous samples
Chapter 1 Principles of Biosensing
23
providing that the molecules to be detected are electroactive. For example, Chough et al.
realized a sensitive procedure for the detection of parathion using an enzyme electrode
containing organophosphorus hydrolase and albumin immobilized on a nylon net attached to a
carbon paste electrode. Exploiting this strategy, they were able to detect parathion with a LOD
of 15 nM. Even if this kind of devices offers several advantages for water analysis,
electrochemical detection can be easily influenced by other oxidizable molecules eventually
present in a real sample.
Among all the physical transducers, QCM technology has attracted research interest as
valid alternative to conventional strategies (e.g. immunoassays) for detecting pesticides. While
laboratory techniques require trained operators and expensive (and eventually dangerous)
chemicals, QCM based sensors and biosensors provide real-time output, high sensitivity,
simplicity of use, and cost-effectiveness57. For instance, Bi and Yang58 detected pesticides in
aqueous environment using a QCM based method. They used molecular imprinted monolayers
(MIMs), obtained from hexadecanethiol self-assembling on the QCM gold electrode, to detect
imidacloprid and thiacloprid pesticides in celery juice reaching a LOD of 1 μM by using an
extremely sensitive QCM apparatus. Concerning immunosensing, March et al.59 quantified
carbaryl insecticide and 3,5,6-trichloro-2-pyridinol (a derivative of both the chlorpyrifos and
triclopyr pesticides) using a QCM based detection. They developed a competitive immunoassay
method based on the covalent immobilization of hapten conjugated via thioctic acid self-
assembled monolayer on the gold sensor surface. The sample to test is mixed with a mAb
solution and then conveyed into the QCM camber. This strategy allows to achieve a LOD of 55
and 35 μM for carbaryl and 3,5,6-trichloro-2-pyridinol, respectively. Another kind of
immunosensor has been developed by Jia et al.60 who used patterned QCM electrodes prepared
via electron beam evaporation. Different patterned areas are functionalized by either anti-
carbofuran or anti-atrazine antibodies by using thiol chemistry. This methodology provides the
sequential detection of the antigens reaching a limit of detection of 4.5 and 4.6 μM for
carbofuran and atrazine, respectively.
1.5.2 Patulin
Mycotoxins are a wide class of secondary metabolites produced by filamentous fungi, or
molds61,62. Even if they are not necessary for growth or development, some of them involved
in weakening the infested host thus favouring fungal proliferation. They severely affect humans
and animals in different ways including mutagenesis and immune system deficiencies.

Chapter 1 Principles of Biosensing
24
Mycotoxins are usually found in crops as a result fungal infestation. Since they are highly
resistant to degradation, some of them even to thermal treatments, it is valuable have a detection
tool for monitoring food chains and analysing agricultural products.
Patulin is an example of this class of molecules produced by several species of fungi
belonging to the genera Aspergillus, Penicillium and Byssochlamys. It is most likely to be found
in apples and apple-derived products such as juice, cider, compotes and baby food. Since it has
strong affinity for sulfhydryl groups it acts as inhibitor of many enzymes. Patulin exposure is
associated with immunological, neurological and gastrointestinal diseases. In addition, it shows
mutagenic activity and high embriotoxicity63. Patulin level in food is strictly regulated in
European countries (Commission Regulation (EC) no. 1881/2006) which set a maximum level
of 50 μg/kg for fruit juices and derived products, 25 μg/kg for solid apple products and 10 μg/kg
for baby foods.
Mycotoxins are conventionally revealed by using expensive, time-consuming and
complex techniques like High-Performance Liquid Chromatography (HPLC) and/or mass
spectroscopy64,65. The lack of any commercial and standard efficient immunochemical method
underpins the research for biosensor based detection allowing in situ and real-time analysis for
crop monitoring and food quality control.
Electrochemical66, optical65 and piezoelectric67,68, sensors and biosensors for the
detection of mycotoxins are reported in literature, but only few papers concerned patulin
detection. A fluorescence assay was proposed by De Champdoré et al.69 with a LOD of 10 μg/L
(less than 0.1 μM), but no test on a real sample was carried out. Damián Chanique et al.70
realized a detection method based on the electrochemical reduction of patulin using glassy
carbon electrodes. With this strategy, they reached a LOD of 300 nM quantifying patulin in
commercial apple juices. Starodub and Slishek71 proposed a nano-porosus silicon based
immunosensor for measuring the level of patulin and T2 mycotoxinin real samples reaching a
sensitivity of about 10 ng/mL for both pollutants. They tried several immobilization strategies
for the anti-patulin antibodies and found that the transducer functionalization can easily affect
the detection signal. More recently, Pennacchio et al.72 proposed a competitive SPR based
O
OH
O
O
Figure 1.6. Structure of patulin
Chapter 1 Principles of Biosensing
25
bioassay for the detection of patulin. Exploiting the competition between free and immobilized
mycotoxin for anti-patulin antibodies they achieved a LOD of 0.1 nM. It is worth noticing that
the accuracy of SPR measurements can be influenced by interfering effects like temperature
and sample composition which produce a change in the refractive index not related to the
analyte binding.
1.6 Biosensors in food analysis
The risks associated with the presence of allergens, contaminants and harmful pathogens
in food and water raised the need for fast and sensitive procedures to detect these species in
complex matrixes. In particular, food industries seek rapid and reliable methods to assure the
quality of products and process control, where the use of conventional analytical techniques
(e.g. HPLC) is usually expensive and laborious. In view of their extremely high specificity, the
application of biosensor-based approaches in this field is promising73–75. For instance, the
availability of such a detection tool to analyse food for people affected by the coeliac disease
would be valuable.
1.6.1 Gliadin
Gliadins are a class of prolamin (plant storage proteins having high proline content)
mostly present in wheat and other cereals. Gliadins and glutenins are the main constituents of
gluten, a protein composite found in wheat and related grains. These proteins are the primary
responsible for celiac disease, a genetically determined autoimmune pathology characterized
by stimulation of helper T-cells resulting in a chronic inflammation of the mucosal tissue of the
small intestine76,77. This immunological disease is the most common food intolerance in the
Western population showing an incidence of about 1%78. In view of the lack of effective
medical treatments, celiac patients have to strictly follow a gluten-free diet to avoid intestinal
mucosal inflammation and other complications.
Concerning current regulation, the international Codex Alimentarius defines as “gluten-
free" a food having a gluten content which does not exceed 20 mg/kg or ppm (CODEX STAN
118 – 1979 and ALINORM08/31/26, Appendix III – 2008). According to Codex Alimentarius,
the prolamin fraction (i.e. gliadin content) is generally taken as 50% of gluten so that the gluten
content is estimated by doubling the prolamin concentration. In addition, food products labelled
as “very low gluten” can have a gluten level ranging between 20 and 100 ppm. These limitations
Chapter 1 Principles of Biosensing
26
are consistent with those set by other countries and international bodies like the European Union
and the American Food and Drug Administration (FDA).
Conventional detection procedures used to quantify gliadin in real samples involve
techniques like gluten-specific polymerase chain reaction (PCR)79, enzyme-linked
immunosorbent assay (ELISA)80 and HPLC81. The validated standard method for gluten
determination (according to the Codex Alimentarius) is an ELISA which uses the R5
monoclonal antibody82. This approach is exploited in several commercial immmunoassays
(RIDASCREEN®) which provide a LOD of about 1.5 ppm (3 ppm of gluten). However, these
gliadin detection procedures are time-consuming, expensive and require extensively trained
operators to be performed.
Both people affected by coeliac disease and industries processing raw materials for
gluten-free food could benefit from in situ and easy-to-use gluten detection tools for food
analysis and monitoring the production process. Biosensor based detection could provide a
rapid and low-cost alternative to conventional analytical methods for revealing the presence of
the analyte (e.g. gliadin) in various application fields including food safety. For instance, De
Stefano et al.83 exploited a glutamine-binding protein (GlnBP) from Escherichia coli which
recognizes an amino acid sequence typical of the prolamins. This bioreceptor has been
immobilized onto a nanostructured porous silicon (PSi) surface thus achieving a linear response
between 2.0 and 8.0 µM of gliadin. The main drawback of this procedure is that the sample
requires several complex and time consuming manipulation steps to make the amino acid
sequence detected by the GlnBP available. Nassef et al.84 realized amperometric and
impedimetric immunosensors for the detection of gliadin using Fab fragments. These
immunoglobulin fragments have been immobilized onto the gold electrodes using a self-
assembled monolayer (SAM) approach thus achieving a LOD of 3.29 ng/mL and 0.42 µg/mL
for amperometric and impedimetric devices, respectively. Anyway, these immunosensors have
not been tested against a real complex sample like a wheat extract, which can in principle
contain species affecting the gliadin detection. More recently, Chu et al.85 developed a QCM
based immunosensor incorporating gold nanoparticles to increase the effective surface area of
the electrode. They functionalized the gold sensor surface by immobilizing chicken anti-gliadin
antibodies (IgY) using a cross-link procedure thus claiming a LOD of 8 ppb by using an
extremely sensitive QCM device.
Chapter 2 Experimental section
27
2 Experimental section
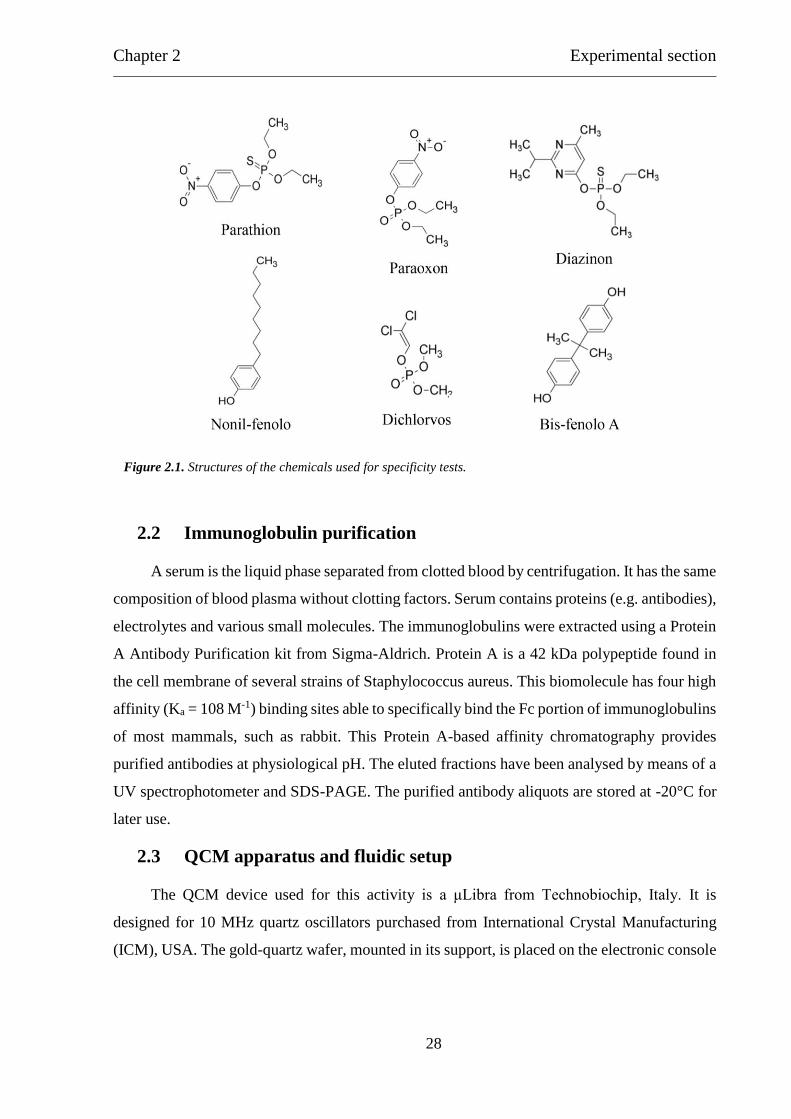
2.1 Chemicals
Parathion (45607), patulin (P1639), and gliadin from wheat (G3375) were from Sigma-
Aldrich. Anti-parathion (ABIN113883) and anti-patulin (AS11-1699) polyclonal antibodies
were purchased as rabbit sera from antibodies-online.com and Agrisera, respectively. The type
G immunoglobulins were purified using the Protein A Antibody Purification Kit (PURE1A)
from Sigma-Aldrich. Purified anti-gliadin polyclonal antibody from rabbit (G9144), anti-mouse
polyclonal antibody from goat (M8642), IgG from mouse (I5381), 5,5′-dithiobis-(2-
nitrobenzoic acid) also known as Ellman's reagent (D8130), bovine serum albumin (A2153)
and the compounds used for the specificity tests, bisphenol A (239658), p-nonylphenol (46018),
dichlorvos (45441), diazinon (45428) and paraoxon (36186), were from Sigma-Aldrich.
Bisphenol A or BPA (IUPAC name 4,4'-(propane-2,2-diyl)diphenol) is an organic
compound having two phenolic functions. It is used in the industrial manufacturing of certain
plastics and epoxy resins. This molecule is an endocrine disruptor involved in child
development and male fertility86.
Nonylphenol (p-nonylphenol) is a synthetic organic compound used as precursor in the
production of detergents, emulsifiers and solubilizers. Since it mimics the molecular structure
of the estradiol, this molecule acts as endocrine disruptor87.
Dichlorvos (IUPAC name 2,2-dichlorovinyl dimethyl phosphate), diazinon (IUPAC
name: O,O-Diethyl O-[4-methyl-6-(propan-2-yl)pyrimidin-2-yl] phosphorothioate) and
paraoxon (IUPAC name diethyl 4-nitrophenyl phosphate) are, like parathion, powerful
organophosphorus pesticides and inhibitor of the acetylcholinesterase. The exposure to these
chemicals produces the same symptoms of parathion poisoning.
Patulin has been extracted from real apple puree samples by using a Polyintell
Affinimip® SPE cartridge.
The pollutant samples were prepared using PBS 1x buffer, ethanol and acetonitrile
solution in the fume hood. Elix water (Millipore), sulfuric acid 98% and hydrogen peroxide
40% were used for the cleaning procedure of the QCM gold surfaces.
Chapter 2 Experimental section
28
2.2 Immunoglobulin purification
A serum is the liquid phase separated from clotted blood by centrifugation. It has the same
composition of blood plasma without clotting factors. Serum contains proteins (e.g. antibodies),
electrolytes and various small molecules. The immunoglobulins were extracted using a Protein
A Antibody Purification kit from Sigma-Aldrich. Protein A is a 42 kDa polypeptide found in
the cell membrane of several strains of Staphylococcus aureus. This biomolecule has four high
affinity (Ka = 108 M-1) binding sites able to specifically bind the Fc portion of immunoglobulins
of most mammals, such as rabbit. This Protein A-based affinity chromatography provides
purified antibodies at physiological pH. The eluted fractions have been analysed by means of a
UV spectrophotometer and SDS-PAGE. The purified antibody aliquots are stored at -20°C for
later use.
2.3 QCM apparatus and fluidic setup
The QCM device used for this activity is a μLibra from Technobiochip, Italy. It is
designed for 10 MHz quartz oscillators purchased from International Crystal Manufacturing
(ICM), USA. The gold-quartz wafer, mounted in its support, is placed on the electronic console
Figure 2.1. Structures of the chemicals used for specificity tests.

Chapter 2 Experimental section
29
of μLibra which is connected via USB cable to the computer. The oscillation frequency data
are displayed and stored by a producer released software.
In order to analyse liquid samples, the QCM device has been integrated in a fluidic
apparatus to convey the desired solution onto the sensor sensitive surface. One of the main
issues in realizing microfluidic circuits for cells and biological material is the accumulation of
aggregates which leads to channel obstructions causing leaks. To overcome this problem it is
worth to use easily cleanable plastic materials which are treated to avoid the adhesion of
biological molecules. For our experiments, platinum cured silicon pipes (070497) from Saint
Gobain and Tygon tubes designed for biological samples have been used.
Since QCM devices are extremely sensitive to surface perturbation, it is worth control
both density and pressure variations by using the same buffer solution for the various steps of
the experiment and a peristaltic pump from Gilson to keep constant the flow rate of the
circulating solution.
Another crucial issue concerns the accumulation of air bubbles in the cell containing the
electrode which affects the measurement in two different ways. If the bubbles are big, they will
be entrapped in the cell onto the gold plate, thus nullifying the experiment since the sensitive
part of the sensor will not be exposed to the liquid sample to analyse. While big bubbles can be
easily removed from the circuit by temporarily increasing the flow rate or gently hitting the
cell, small bubbles result to be more problematic. These are usually blocked between the input
channel and the gold electrode. Since these small bubbles are affected by peristalsis due to the
pump, they start pulsating onto the sensor surface thus greatly perturbing the oscillation
frequency of the QCM. The air bubble problem can be significantly reduced by placing before
the cell a “bubble trap” like a syphon or a small connection pipe with inner diameter slightly
bigger than the others.
Since the QCM technology is based on the quartz oscillation frequency, the device is
placed on a polystyrene base to protect the oscillator from vibrations and hits from the bench.
Figure 2.2 shows the experimental setup. The tubes have 0.51 and 0.64 mm internal
diameters for the input and output channel, respectively. The solution volume in contact with
the electrode in the cell is about 30 µL. In view of all its components the total volume of the
circuit is about 300 µL.

Chapter 2 Experimental section
30
2.4 Gold surface preparation
In view of its properties (i.e. high stability, low tendency to oxidize, biocompatibility)
gold is the first choice for metallic sensitive surfaces of technologies like QCM or Surface
Plasmon Resonance (SPR). In order to effectively immobilize biomolecules, the gold plates
have to be cleaned using the so called “piranha solution”. This extremely aggressive chemical
treatment is commonly used in microfabrication laboratories to remove organic impurities from
substrates, eliminate the photoresist in photolithographic processes and for surface
hydroxylation. The traditional piranha solution is a 3:1 mixture of sulphuric acid (H2SO4) and
30% hydrogen peroxide (H2O2). Other protocols use a 4:1 or 7:1 ratio and eventually a more
concentrated hydrogen peroxide solution. For our experiments the typical 3:1 ratio has been
used.
Figure 2.2. Experimental apparatus. a) electrode console; b) peristaltic pump; c) “bubble trap”; d) cell
containing the electrode (a opened cell is shown under the console); e) frequency reader; f) computer for data
acquisition.

Chapter 2 Experimental section
31
Since it is both highly acidic and a strong oxidizing solution, piranha cleaning procedures
have to be performed with extreme caution and using specific safety equipment (i.e. thick
chemically resistant gloves, cotton based lab coat, etc.). In the fume hood, the hydrogen
peroxide is slowly poured in a glass beaker containing the sulphuric acid. Since the solution is
highly corrosive, plastic vessels or tweezers are avoided. The reaction is extremely exothermic
and since the solution quickly reaches temperature up to 120°C it is used only after it cools
down. The effectiveness of this procedure lies in two distinct processes. The first and faster is
the dehydration due to sulphuric acid which leads to a cloudy solution. The second is related to
the formation of atomic oxygen and radical species which oxidize and degrade the dehydrated
organic compounds thus leading back the solution to its original clearness. The treated surfaces
have to be quite clean and completely free of organic solvents from previous steps because a
big amount of organic contaminants can cause violent bubbling or even explosion. The QCM
oscillators are immerged by steel tweezers in the reactive solution for about 2 minutes, washed
with Elix water and then left to dry in air. Finally, the quartz crystals are mounted on the support,
being careful in avoiding contact between tweezers or gloves and gold surfaces. This chemical
treatment allows to use the oscillators about 3-4 times making the quartz disks progressively
more fragile to handle. It is worth highlight that each gold-quartz wafer allows to perform two
QCM experiments, one for each face.
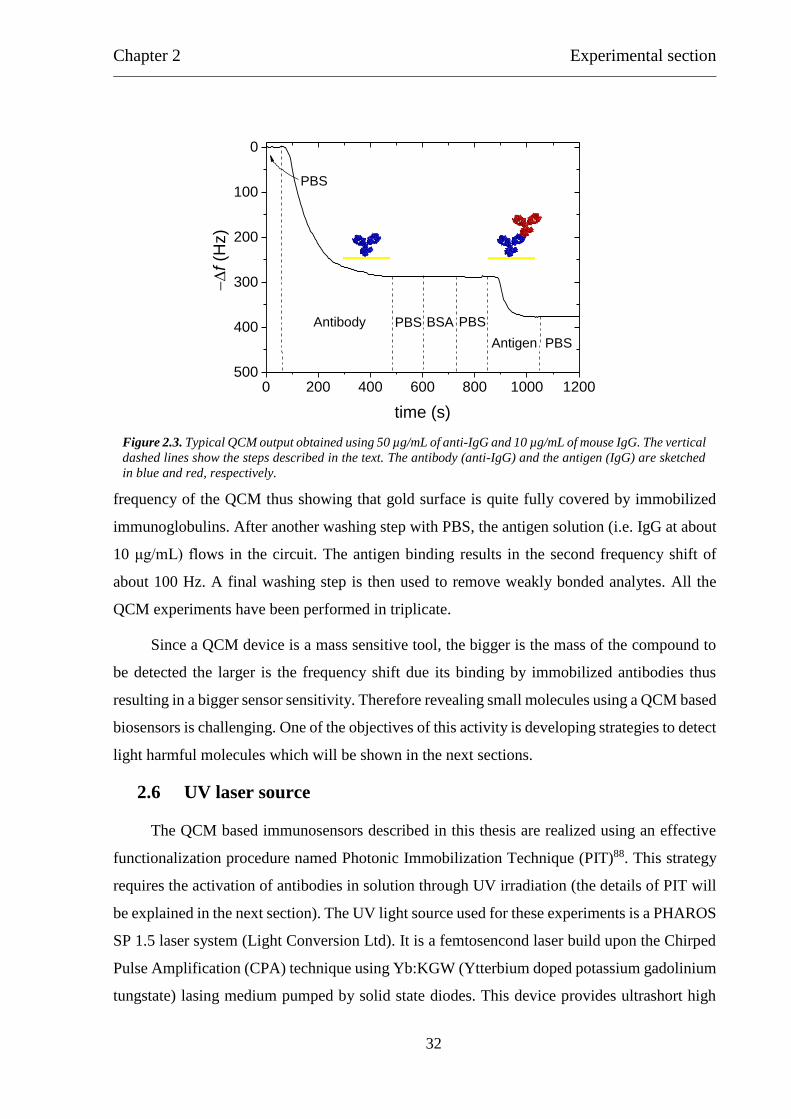
2.5 QCM experiment
A typical QCM output concerning a classic model system IgG-anti-IgG (antibodies which
catch other antibodies) is shown in Figure 2.3.
The first step of the experiment is the reaching of the basal frequency stabilization by
flowing 1x DPBS (Dulbecco’s Phosphate Buffered Saline) solution at pH 7.4. DPBS is used as
common buffer for all the phases to avoid frequency shifts due to different solution densities.
Then the gold surface is functionalized using the biological sensitive element (i.e. antibodies).
An immunoglobulin solution (50 μg/mL) is conveyed in the cell containing the electrode and
the proteins are adsorbed onto the sensor surface thus resulting in the first frequency drop of
about 300 Hz. When the oscillator reaches again the stabilization, the circuit is purged with
PBS to remove the excess of immunoglobulins. Then a Bovine Serum Albumin (BSA) solution
at 50 μg/mL is used to fill the remaining available space on the gold electrode thus preventing
non-specific interaction between the sensor surface and the sample to analyse. It is worth
highlight that the BSA blocking step results in a negligible perturbation of the resonance
Chapter 2 Experimental section
32
frequency of the QCM thus showing that gold surface is quite fully covered by immobilized
immunoglobulins. After another washing step with PBS, the antigen solution (i.e. IgG at about
10 μg/mL) flows in the circuit. The antigen binding results in the second frequency shift of
about 100 Hz. A final washing step is then used to remove weakly bonded analytes. All the
QCM experiments have been performed in triplicate.
Since a QCM device is a mass sensitive tool, the bigger is the mass of the compound to
be detected the larger is the frequency shift due its binding by immobilized antibodies thus
resulting in a bigger sensor sensitivity. Therefore revealing small molecules using a QCM based
biosensors is challenging. One of the objectives of this activity is developing strategies to detect
light harmful molecules which will be shown in the next sections.
2.6 UV laser source
The QCM based immunosensors described in this thesis are realized using an effective
functionalization procedure named Photonic Immobilization Technique (PIT)88. This strategy
requires the activation of antibodies in solution through UV irradiation (the details of PIT will
be explained in the next section). The UV light source used for these experiments is a PHAROS
SP 1.5 laser system (Light Conversion Ltd). It is a femtosencond laser build upon the Chirped
Pulse Amplification (CPA) technique using Yb:KGW (Ytterbium doped potassium gadolinium
tungstate) lasing medium pumped by solid state diodes. This device provides ultrashort high
0 200 400 600 800 1000 1200500
400
300
200
100
0
PBSBSA
f (H
z)
time (s)
PBSAntigen
PBS
PBS
Antibody
Figure 2.3. Typical QCM output obtained using 50 µg/mL of anti-IgG and 10 µg/mL of mouse IgG. The vertical
dashed lines show the steps described in the text. The antibody (anti-IgG) and the antigen (IgG) are sketched
in blue and red, respectively.
Chapter 2 Experimental section
33
power pulses (of about 190 fs) with high tunable repetition rate, from single pulse to 200 kHz
(eventually extendable to 1 MHz). Its maximum average power is about 6 W while the centre
wavelength is 1028 nm ± 5 nm. The UV pulses are obtained coupling PHAROS with a harmonic
generator stage (HIRO) which provides the conversion to 515 nm, 343 nm and 258 nm
wavelength of the IR fundamental radiation. All the immunoglobulin samples have been
irradiated in a quartz cuvette under mechanical stirring.
2.7 Atomic Force Microscopy (AFM) measurements
Goat anti-IgG antibody aliquots are irradiated by UV laser pulses delivered using the
femtosecond laser described in the previous section. The UV source operates at a repetition rate
of 10 kHz and 250 mW of average power at λ = 258 nm (resulting in energy per pulse of 25
μJ). Surface functionalization has been realized by incubating these samples with a metallic
substrate for about 90 s.
AFM imaging is performed using a Nanoscope Multimode 8 (Bruker) microscope
equipped with a 120 µm piezoelectric scanner and phosphorus doped Si cantilevers from Veeco
(RTESPW). The samples for AFM analysis have been prepared by stripping a gold-Si wafer
(80 nm Au) and functionalizing the metallic surfaces by using a custom glass and
polydimethylsiloxane (PDMS) microfluidic apparatus. The PDMS (Sylgard® 184) has been
prepared with a 1:10 w/w ratio between the curing agent and the prepolymer. The system
consists of a PDMS layer (about 5 mm) attached to a glass ring covered with a PDMS thin film
to confine the liquid onto the surface. The sample is loaded by using a tygon pipe connected to
a 1 mL syringe. The volume of the chamber is about 40 μL while the whole circuit is about 100
μL. The fluidic apparatus is shown in Figure 2.4.

Chapter 2 Experimental section
34
Figure 2.4. a) Top and b) cross-section of the fluidic device used for preparing the samples for AFM analysis.
In light and dark grey are highlighted the PDMS and glass elements, respectively. c) Picture showing sample
preparation.
Chapter 3 Photonic Immobilization Technique (PIT)
35
3 Photonic Immobilization Technique (PIT)
3.1 Photonic activation of immunoglobulins: molecular mechanism
Photonic Immobilization Technique (PIT)88 is a functionalization strategy based on the
photoreduction of disulphide bridges in immunoglobulins upon UV illumination of closely
spaced aromatic residues89. This light-induced reaction favours the proper orientation of the
immobilized antibody thus improving the antigen catching. On the other side, it is well known
that UV radiation affects both biomolecular structure and activity24,45,90. Therefore, it is of
paramount importance finding the best agreement between effective antibodies immobilization
and low protein damage (this issue will be discussed in the next sections).
Disulphide bonds (SS) are quite common in proteins since they have a crucial role in
protein folding and stability. They are the result of the oxidation of thiol groups (-SH) of two
cysteine residues thus connecting two portions of the molecule and biasing the protein folding.
The analysis of the 3D structures deposited in the Protein Data Bank (PDB) shows that many
proteins (e.g. immunoglobulins) have an aromatic sidechain (tryptophan, tyrosine or
phenylalanine) placed nearby a disulphide bridge located in the core of the molecule36. The
conservation of this feature suggests that the aromatic residue might play an important role in
stabilizing or protecting the disulphide bond. In particular, immunoglobulin domains show
highly conserved cysteine-cysteine/tryptophan (cys-cys/trp or C-C/W) triads. For instance,
every type G immunoglobulin has twelve immunoglobulin domains, each of them containing a
cys-cys/trp triad. The two cysteine residues are involved in the intra-chain disulphide bond
which connects the two β-sheets of the domain. These amino acids are mostly constant in all
the known Ig and Ig-like sequences while the tryptophan is also highly conserved in the core of
the fold in proximity of the disulphide bridge. It is worth highlight that the geometric parameters
of the triad (position of the atoms, angles and distances) are quite constant. The characteristics
of this feature are shown in Figure 3.1.
The details of the photonic activation pathway have been recently reported38. The results
of several papers concerning photophysics and photochemistry of tryptophan and cystine90–93
are assembled in the scheme in Figure 3.2.

Chapter 3 Photonic Immobilization Technique (PIT)
36
Figure 3.1. a) 3D structure of the antibody (1IGY). b) On the same protein cysteine (yellow), tryptophan
(green) and disulphide bridges (red) have been highlighted. Every immunoglobulin domain shows a closely
spaced cys-cys/trp amino acidic triad (red circles). c) Magnification of one of these triads. d) Geometric
characteristics of this structural feature. Both distances (a, b and c) and angles (α, β and γ) are highly
conserved.
Figure 3.2. Photophysical and photochemical pathways of tryptophan in proteins upon UV excitation.

Chapter 3 Photonic Immobilization Technique (PIT)
37
Bent and Hayon in 197591 described two non-radiative relaxation channels of the singlet
excited states of tryptophan (S1 and S*). The first results in the formation of tryptophan radical
cation (Trp•+), which rapidly deprotonates generating a neutral radical (Trp•), and solvated
electrons (e-aq). These particles can easily react with electrophilic species like molecular
oxygen, hydronium cations (at low pH), amidic bonds (forming ketyl radicals) or disulphide
bridges (RSSR). The last event generates an unstable disulphide bond electron adduct (RSSR•-).
𝑇𝑟𝑝𝑆∗→ 𝑇𝑟𝑝•+ + 𝑒𝑎𝑞
− (3.1)
𝑇𝑟𝑝𝑆1 → 𝑇𝑟𝑝•+ + 𝑒𝑎𝑞
− (3.2)
𝑇𝑟𝑝•+ → 𝑇𝑟𝑝• + 𝐻+ (3.3)
𝑅𝑆𝑆𝑅 + 𝑒𝑎𝑞− → 𝑅𝑆𝑆𝑅•− (3.4)
The latter channel involves the formation of a triplet-state tryptophan (TTrp) from S1Trp
through intersystem crossing (ISC). TTrp can transfer an electron to nearby electrophilic species
like disulphide bridges thus generating the electron adduct.
𝑇𝑟𝑝𝑆1 → 𝑇𝑟𝑝𝑇 (3.5)
𝑇𝑟𝑝𝑇 + 𝑅𝑆𝑆𝑅 → 𝑇𝑟𝑝•+ + 𝑅𝑆𝑆𝑅•− (3.6)
The intrinsic instability of the radical adduct can lead to the scission of the disulphide
bond. This result is achieved also when the adduct is protonated.
𝑅𝑆𝑆𝑅•− ⇄ 𝑅𝑆• + 𝑅𝑆− (3.7)
𝑅𝑆𝑆𝑅•− + 𝐻+ ⇄ 𝑅𝑆• + 𝑅𝑆𝐻 (3.8)
The sketches in Figure 3.3 shows the steps of the photonic activation.
These free thiol radicals/groups can easily react with other thiols thus forming new
disulphide bonds, or, alternatively, they can be exploited to achieve the oriented covalent
protein immobilization onto thiol-reactive surfaces (e.g. gold plates) for biosensing
applications88,94,95. Once immobilized, UV activated antibodies do not show any significant loss
in the antigen binding efficiency and selectivity. On the other side, the rise of the number of the
thiol groups onto the protein allows new structural conformation for the immobilized
immunoglobulins, which are characterized by a proper exposure of the antigen binding sites
thus greatly improving sensor sensitivity.
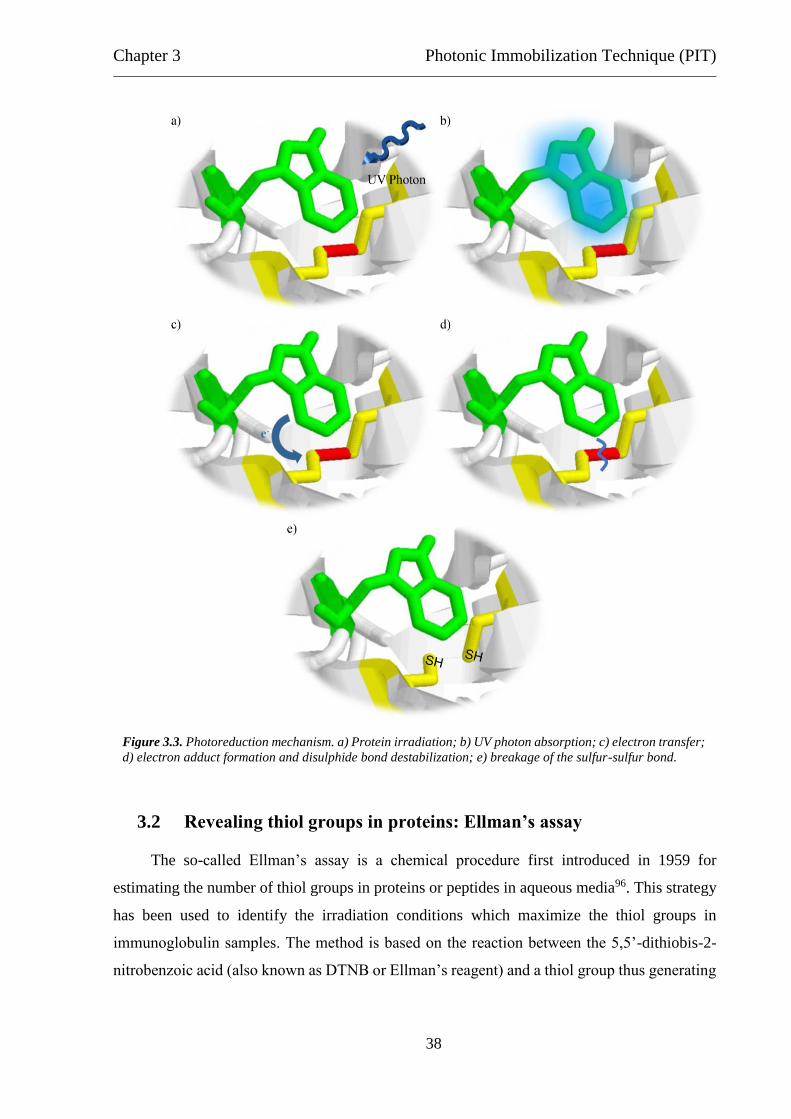
Chapter 3 Photonic Immobilization Technique (PIT)
38
3.2 Revealing thiol groups in proteins: Ellman’s assay
The so-called Ellman’s assay is a chemical procedure first introduced in 1959 for
estimating the number of thiol groups in proteins or peptides in aqueous media96. This strategy
has been used to identify the irradiation conditions which maximize the thiol groups in
immunoglobulin samples. The method is based on the reaction between the 5,5’-dithiobis-2-
nitrobenzoic acid (also known as DTNB or Ellman’s reagent) and a thiol group thus generating
Figure 3.3. Photoreduction mechanism. a) Protein irradiation; b) UV photon absorption; c) electron transfer;
d) electron adduct formation and disulphide bond destabilization; e) breakage of the sulfur-sulfur bond.
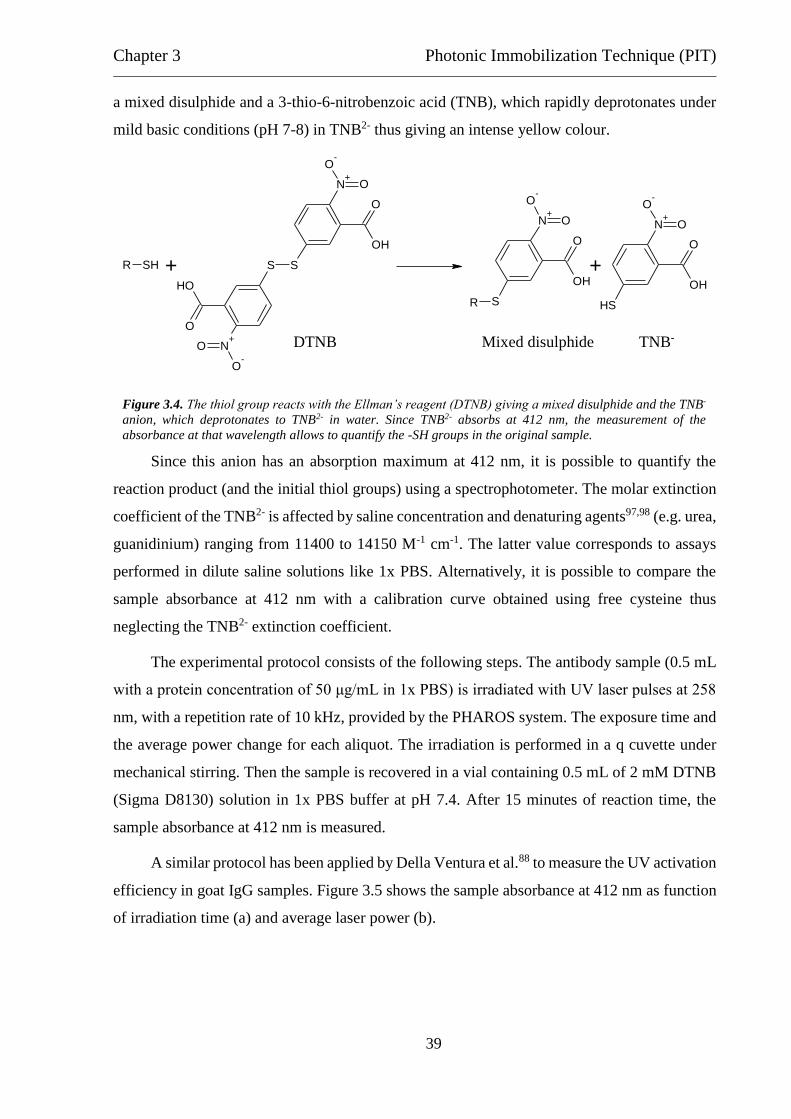
Chapter 3 Photonic Immobilization Technique (PIT)
39
a mixed disulphide and a 3-thio-6-nitrobenzoic acid (TNB), which rapidly deprotonates under
mild basic conditions (pH 7-8) in TNB2- thus giving an intense yellow colour.
Since this anion has an absorption maximum at 412 nm, it is possible to quantify the
reaction product (and the initial thiol groups) using a spectrophotometer. The molar extinction
coefficient of the TNB2- is affected by saline concentration and denaturing agents97,98 (e.g. urea,
guanidinium) ranging from 11400 to 14150 M-1 cm-1. The latter value corresponds to assays
performed in dilute saline solutions like 1x PBS. Alternatively, it is possible to compare the
sample absorbance at 412 nm with a calibration curve obtained using free cysteine thus
neglecting the TNB2- extinction coefficient.
The experimental protocol consists of the following steps. The antibody sample (0.5 mL
with a protein concentration of 50 μg/mL in 1x PBS) is irradiated with UV laser pulses at 258
nm, with a repetition rate of 10 kHz, provided by the PHAROS system. The exposure time and
the average power change for each aliquot. The irradiation is performed in a q cuvette under
mechanical stirring. Then the sample is recovered in a vial containing 0.5 mL of 2 mM DTNB
(Sigma D8130) solution in 1x PBS buffer at pH 7.4. After 15 minutes of reaction time, the
sample absorbance at 412 nm is measured.
A similar protocol has been applied by Della Ventura et al.88 to measure the UV activation
efficiency in goat IgG samples. Figure 3.5 shows the sample absorbance at 412 nm as function
of irradiation time (a) and average laser power (b).
N+
N+
O
OH
O
OH
O-
O
O-
O
S SR SH
N+
O
OH
O-
O
SR
++
N+
O
OH
O-
O
SH
Figure 3.4. The thiol group reacts with the Ellman’s reagent (DTNB) giving a mixed disulphide and the TNB-
anion, which deprotonates to TNB2- in water. Since TNB2- absorbs at 412 nm, the measurement of the
absorbance at that wavelength allows to quantify the -SH groups in the original sample.
DTNB Mixed disulphide TNB-
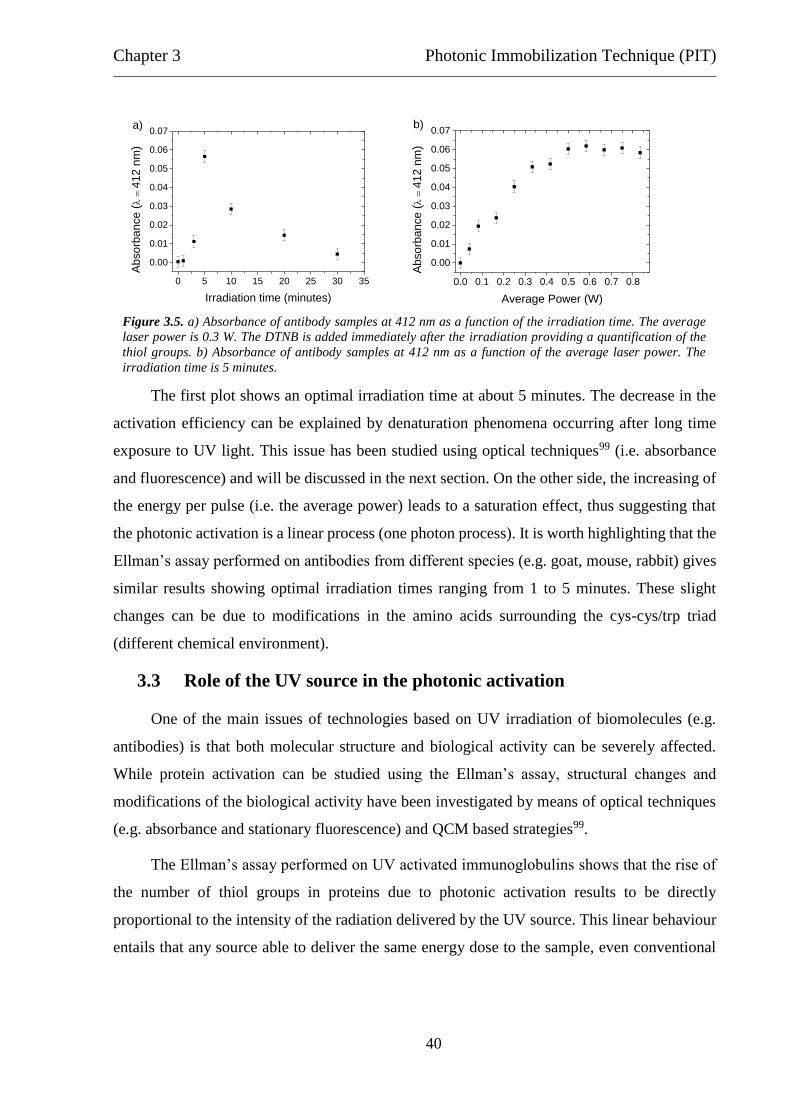
Chapter 3 Photonic Immobilization Technique (PIT)
40
The first plot shows an optimal irradiation time at about 5 minutes. The decrease in the
activation efficiency can be explained by denaturation phenomena occurring after long time
exposure to UV light. This issue has been studied using optical techniques99 (i.e. absorbance
and fluorescence) and will be discussed in the next section. On the other side, the increasing of
the energy per pulse (i.e. the average power) leads to a saturation effect, thus suggesting that
the photonic activation is a linear process (one photon process). It is worth highlighting that the
Ellman’s assay performed on antibodies from different species (e.g. goat, mouse, rabbit) gives
similar results showing optimal irradiation times ranging from 1 to 5 minutes. These slight
changes can be due to modifications in the amino acids surrounding the cys-cys/trp triad
(different chemical environment).
3.3 Role of the UV source in the photonic activation
One of the main issues of technologies based on UV irradiation of biomolecules (e.g.
antibodies) is that both molecular structure and biological activity can be severely affected.
While protein activation can be studied using the Ellman’s assay, structural changes and
modifications of the biological activity have been investigated by means of optical techniques
(e.g. absorbance and stationary fluorescence) and QCM based strategies99.
The Ellman’s assay performed on UV activated immunoglobulins shows that the rise of
the number of thiol groups in proteins due to photonic activation results to be directly
proportional to the intensity of the radiation delivered by the UV source. This linear behaviour
entails that any source able to deliver the same energy dose to the sample, even conventional
0 5 10 15 20 25 30 35
0.00
0.01
0.02
0.03
0.04
0.05
0.06
0.07a)
Absorb
ance (4
12 n
m)
Irradiation time (minutes)
0.0 0.1 0.2 0.3 0.4 0.5 0.6 0.7 0.8
0.00
0.01
0.02
0.03
0.04
0.05
0.06
0.07b)
Absorb
ance (4
12 n
m)
Average Power (W)
Figure 3.5. a) Absorbance of antibody samples at 412 nm as a function of the irradiation time. The average
laser power is 0.3 W. The DTNB is added immediately after the irradiation providing a quantification of the
thiol groups. b) Absorbance of antibody samples at 412 nm as a function of the average laser power. The
irradiation time is 5 minutes.
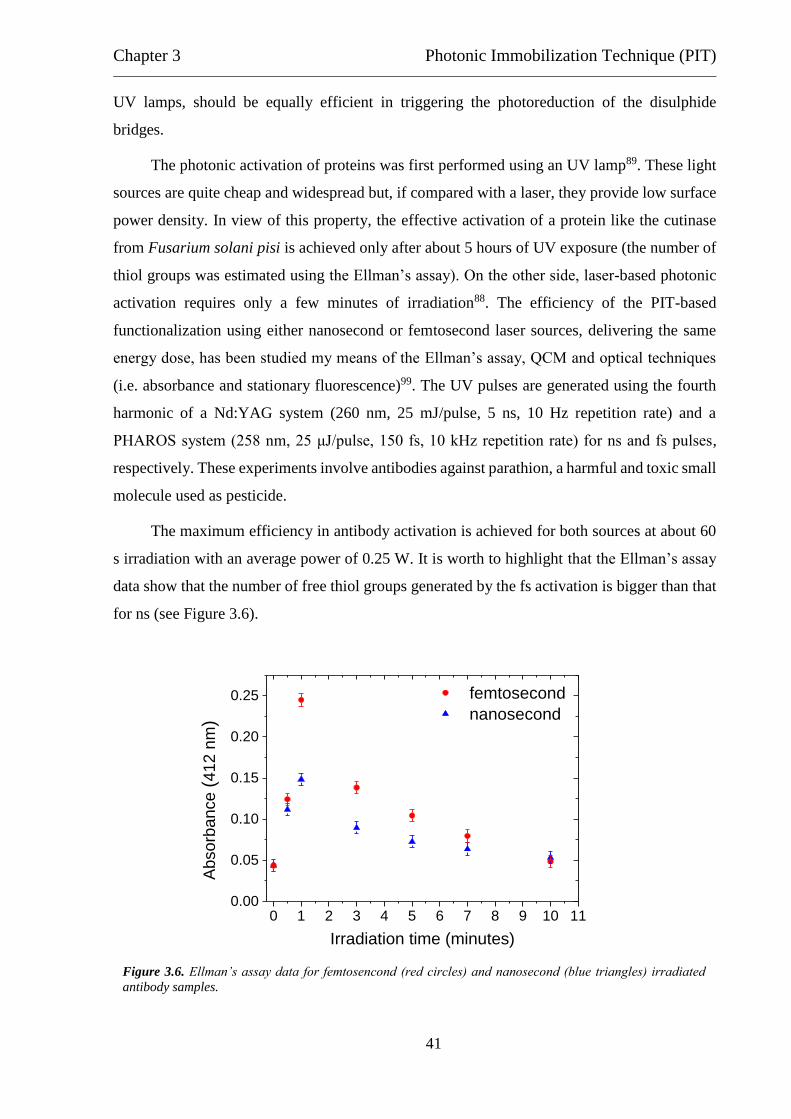
Chapter 3 Photonic Immobilization Technique (PIT)
41
UV lamps, should be equally efficient in triggering the photoreduction of the disulphide
bridges.
The photonic activation of proteins was first performed using an UV lamp89. These light
sources are quite cheap and widespread but, if compared with a laser, they provide low surface
power density. In view of this property, the effective activation of a protein like the cutinase
from Fusarium solani pisi is achieved only after about 5 hours of UV exposure (the number of
thiol groups was estimated using the Ellman’s assay). On the other side, laser-based photonic
activation requires only a few minutes of irradiation88. The efficiency of the PIT-based
functionalization using either nanosecond or femtosecond laser sources, delivering the same
energy dose, has been studied my means of the Ellman’s assay, QCM and optical techniques
(i.e. absorbance and stationary fluorescence)99. The UV pulses are generated using the fourth
harmonic of a Nd:YAG system (260 nm, 25 mJ/pulse, 5 ns, 10 Hz repetition rate) and a
PHAROS system (258 nm, 25 μJ/pulse, 150 fs, 10 kHz repetition rate) for ns and fs pulses,
respectively. These experiments involve antibodies against parathion, a harmful and toxic small
molecule used as pesticide.
The maximum efficiency in antibody activation is achieved for both sources at about 60
s irradiation with an average power of 0.25 W. It is worth to highlight that the Ellman’s assay
data show that the number of free thiol groups generated by the fs activation is bigger than that
for ns (see Figure 3.6).
0 1 2 3 4 5 6 7 8 9 10 110.00
0.05
0.10
0.15
0.20
0.25 femtosecond
nanosecond
Ab
so
rba
nce
(4
12
nm
)
Irradiation time (minutes)
Figure 3.6. Ellman’s assay data for femtosencond (red circles) and nanosecond (blue triangles) irradiated
antibody samples.
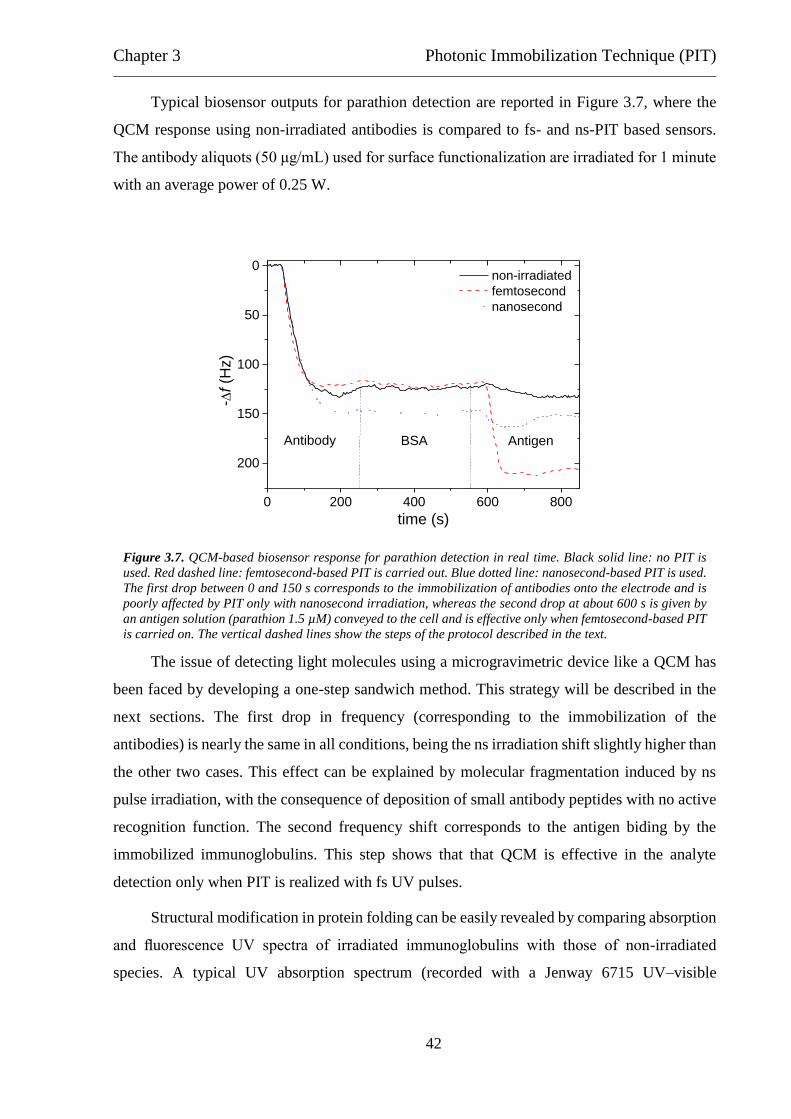
Chapter 3 Photonic Immobilization Technique (PIT)
42
Typical biosensor outputs for parathion detection are reported in Figure 3.7, where the
QCM response using non-irradiated antibodies is compared to fs- and ns-PIT based sensors.
The antibody aliquots (50 μg/mL) used for surface functionalization are irradiated for 1 minute
with an average power of 0.25 W.
The issue of detecting light molecules using a microgravimetric device like a QCM has
been faced by developing a one-step sandwich method. This strategy will be described in the
next sections. The first drop in frequency (corresponding to the immobilization of the
antibodies) is nearly the same in all conditions, being the ns irradiation shift slightly higher than
the other two cases. This effect can be explained by molecular fragmentation induced by ns
pulse irradiation, with the consequence of deposition of small antibody peptides with no active
recognition function. The second frequency shift corresponds to the antigen biding by the
immobilized immunoglobulins. This step shows that that QCM is effective in the analyte
detection only when PIT is realized with fs UV pulses.
Structural modification in protein folding can be easily revealed by comparing absorption
and fluorescence UV spectra of irradiated immunoglobulins with those of non-irradiated
species. A typical UV absorption spectrum (recorded with a Jenway 6715 UV–visible
0 200 400 600 800
200
150
100
50
0
AntigenBSAAntibody
-f
(Hz)
time (s)
non-irradiated
femtosecond
nanosecond
Figure 3.7. QCM-based biosensor response for parathion detection in real time. Black solid line: no PIT is
used. Red dashed line: femtosecond-based PIT is carried out. Blue dotted line: nanosecond-based PIT is used.
The first drop between 0 and 150 s corresponds to the immobilization of antibodies onto the electrode and is
poorly affected by PIT only with nanosecond irradiation, whereas the second drop at about 600 s is given by
an antigen solution (parathion 1.5 µM) conveyed to the cell and is effective only when femtosecond-based PIT
is carried on. The vertical dashed lines show the steps of the protocol described in the text.
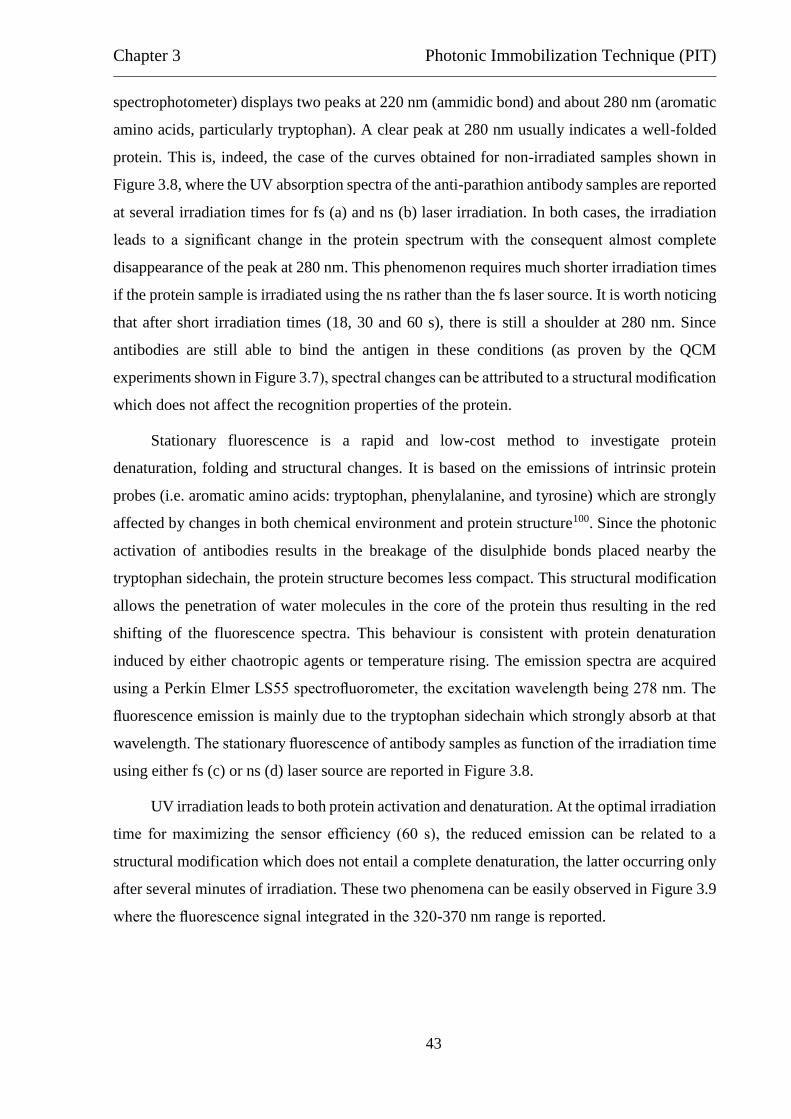
Chapter 3 Photonic Immobilization Technique (PIT)
43
spectrophotometer) displays two peaks at 220 nm (ammidic bond) and about 280 nm (aromatic
amino acids, particularly tryptophan). A clear peak at 280 nm usually indicates a well-folded
protein. This is, indeed, the case of the curves obtained for non-irradiated samples shown in
Figure 3.8, where the UV absorption spectra of the anti-parathion antibody samples are reported
at several irradiation times for fs (a) and ns (b) laser irradiation. In both cases, the irradiation
leads to a significant change in the protein spectrum with the consequent almost complete
disappearance of the peak at 280 nm. This phenomenon requires much shorter irradiation times
if the protein sample is irradiated using the ns rather than the fs laser source. It is worth noticing
that after short irradiation times (18, 30 and 60 s), there is still a shoulder at 280 nm. Since
antibodies are still able to bind the antigen in these conditions (as proven by the QCM
experiments shown in Figure 3.7), spectral changes can be attributed to a structural modification
which does not affect the recognition properties of the protein.
Stationary fluorescence is a rapid and low-cost method to investigate protein
denaturation, folding and structural changes. It is based on the emissions of intrinsic protein
probes (i.e. aromatic amino acids: tryptophan, phenylalanine, and tyrosine) which are strongly
affected by changes in both chemical environment and protein structure100. Since the photonic
activation of antibodies results in the breakage of the disulphide bonds placed nearby the
tryptophan sidechain, the protein structure becomes less compact. This structural modification
allows the penetration of water molecules in the core of the protein thus resulting in the red
shifting of the fluorescence spectra. This behaviour is consistent with protein denaturation
induced by either chaotropic agents or temperature rising. The emission spectra are acquired
using a Perkin Elmer LS55 spectrofluorometer, the excitation wavelength being 278 nm. The
fluorescence emission is mainly due to the tryptophan sidechain which strongly absorb at that
wavelength. The stationary fluorescence of antibody samples as function of the irradiation time
using either fs (c) or ns (d) laser source are reported in Figure 3.8.
UV irradiation leads to both protein activation and denaturation. At the optimal irradiation
time for maximizing the sensor efficiency (60 s), the reduced emission can be related to a
structural modification which does not entail a complete denaturation, the latter occurring only
after several minutes of irradiation. These two phenomena can be easily observed in Figure 3.9
where the fluorescence signal integrated in the 320-370 nm range is reported.
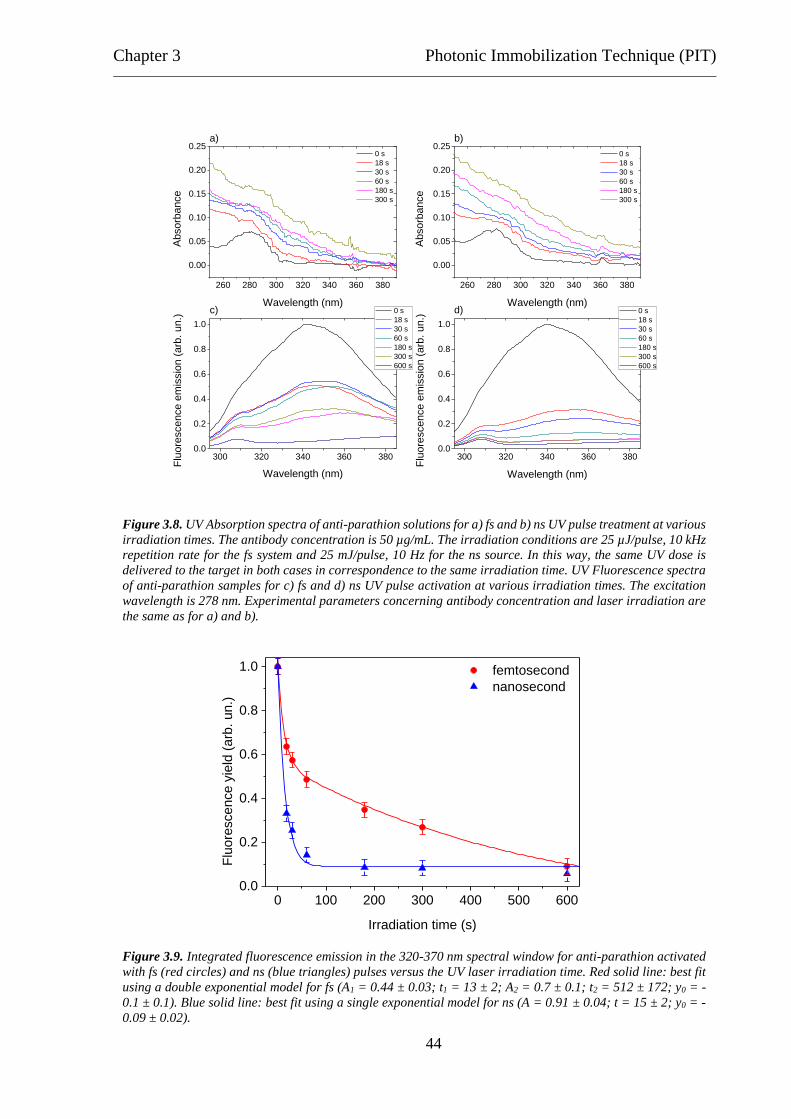
Chapter 3 Photonic Immobilization Technique (PIT)
44
0 100 200 300 400 500 6000.0
0.2
0.4
0.6
0.8
1.0 femtosecond
nanosecond
Flu
ore
sce
nce
yie
ld (
arb
. u
n.)
Irradiation time (s)
Figure 3.9. Integrated fluorescence emission in the 320-370 nm spectral window for anti-parathion activated
with fs (red circles) and ns (blue triangles) pulses versus the UV laser irradiation time. Red solid line: best fit
using a double exponential model for fs (A1 = 0.44 ± 0.03; t1 = 13 ± 2; A2 = 0.7 ± 0.1; t2 = 512 ± 172; y0 = -
0.1 ± 0.1). Blue solid line: best fit using a single exponential model for ns (A = 0.91 ± 0.04; t = 15 ± 2; y0 = -
0.09 ± 0.02).
260 280 300 320 340 360 380
0.00
0.05
0.10
0.15
0.20
0.25
260 280 300 320 340 360 380
0.00
0.05
0.10
0.15
0.20
0.25
300 320 340 360 3800.0
0.2
0.4
0.6
0.8
1.0
300 320 340 360 3800.0
0.2
0.4
0.6
0.8
1.0
c)
Absorb
ance
Wavelength (nm)
0 s
18 s
30 s
60 s
180 s
300 s
d)
Absorb
ance
Wavelength (nm)
0 s
18 s
30 s
60 s
180 s
300 s
Flu
ore
scence e
mis
sio
n (
arb
. un.)
Wavelength (nm)
0 s
18 s
30 s
60 s
180 s
300 s
600 s
a) b)
Flu
ore
scence e
mis
sio
n (
arb
. un.)
Wavelength (nm)
0 s
18 s
30 s
60 s
180 s
300 s
600 s
Figure 3.8. UV Absorption spectra of anti-parathion solutions for a) fs and b) ns UV pulse treatment at various
irradiation times. The antibody concentration is 50 µg/mL. The irradiation conditions are 25 µJ/pulse, 10 kHz
repetition rate for the fs system and 25 mJ/pulse, 10 Hz for the ns source. In this way, the same UV dose is
delivered to the target in both cases in correspondence to the same irradiation time. UV Fluorescence spectra
of anti-parathion samples for c) fs and d) ns UV pulse activation at various irradiation times. The excitation
wavelength is 278 nm. Experimental parameters concerning antibody concentration and laser irradiation are
the same as for a) and b).
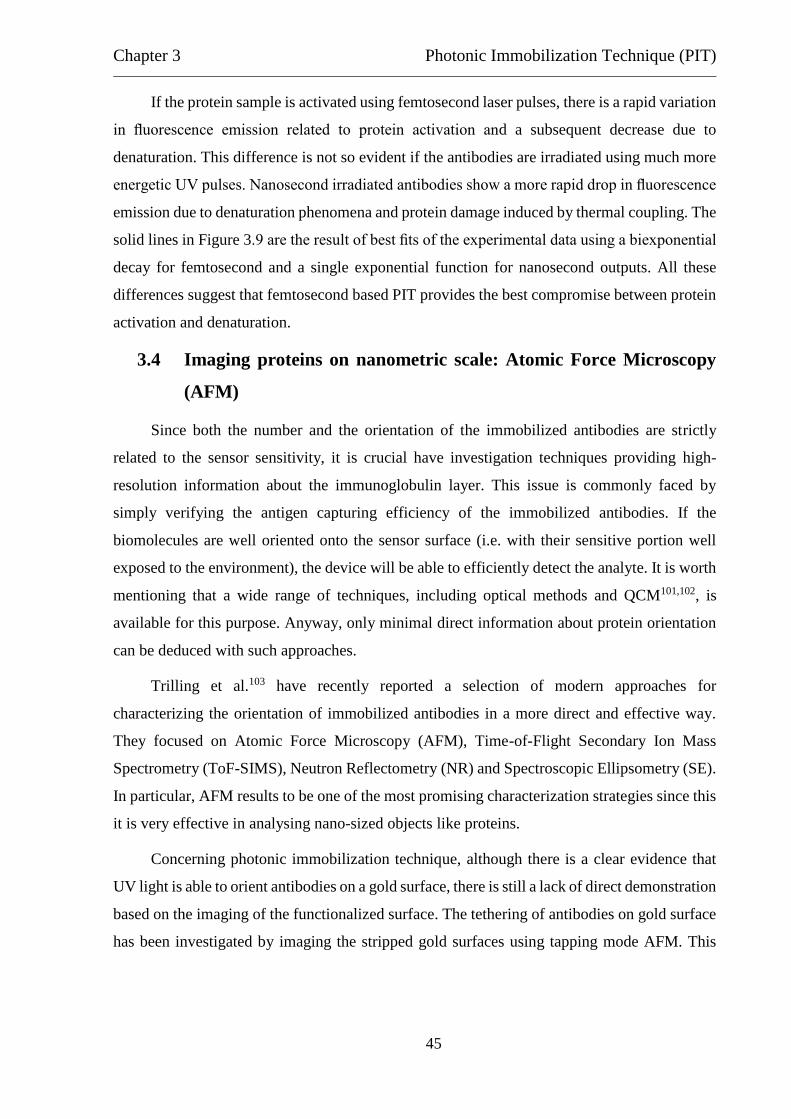
Chapter 3 Photonic Immobilization Technique (PIT)
45
If the protein sample is activated using femtosecond laser pulses, there is a rapid variation
in fluorescence emission related to protein activation and a subsequent decrease due to
denaturation. This difference is not so evident if the antibodies are irradiated using much more
energetic UV pulses. Nanosecond irradiated antibodies show a more rapid drop in fluorescence
emission due to denaturation phenomena and protein damage induced by thermal coupling. The
solid lines in Figure 3.9 are the result of best fits of the experimental data using a biexponential
decay for femtosecond and a single exponential function for nanosecond outputs. All these
differences suggest that femtosecond based PIT provides the best compromise between protein
activation and denaturation.
3.4 Imaging proteins on nanometric scale: Atomic Force Microscopy
(AFM)
Since both the number and the orientation of the immobilized antibodies are strictly
related to the sensor sensitivity, it is crucial have investigation techniques providing high-
resolution information about the immunoglobulin layer. This issue is commonly faced by
simply verifying the antigen capturing efficiency of the immobilized antibodies. If the
biomolecules are well oriented onto the sensor surface (i.e. with their sensitive portion well
exposed to the environment), the device will be able to efficiently detect the analyte. It is worth
mentioning that a wide range of techniques, including optical methods and QCM101,102, is
available for this purpose. Anyway, only minimal direct information about protein orientation
can be deduced with such approaches.
Trilling et al.103 have recently reported a selection of modern approaches for
characterizing the orientation of immobilized antibodies in a more direct and effective way.
They focused on Atomic Force Microscopy (AFM), Time-of-Flight Secondary Ion Mass
Spectrometry (ToF-SIMS), Neutron Reflectometry (NR) and Spectroscopic Ellipsometry (SE).
In particular, AFM results to be one of the most promising characterization strategies since this
it is very effective in analysing nano-sized objects like proteins.
Concerning photonic immobilization technique, although there is a clear evidence that
UV light is able to orient antibodies on a gold surface, there is still a lack of direct demonstration
based on the imaging of the functionalized surface. The tethering of antibodies on gold surface
has been investigated by imaging the stripped gold surfaces using tapping mode AFM. This
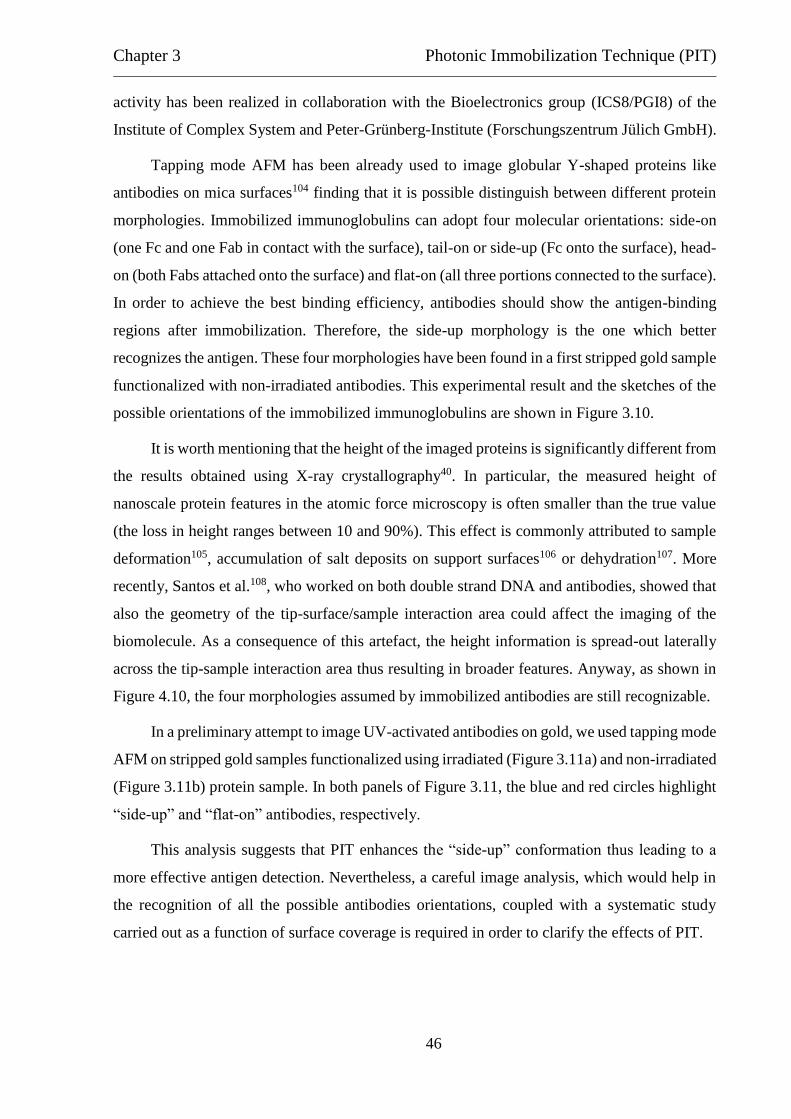
Chapter 3 Photonic Immobilization Technique (PIT)
46
activity has been realized in collaboration with the Bioelectronics group (ICS8/PGI8) of the
Institute of Complex System and Peter-Grünberg-Institute (Forschungszentrum Jülich GmbH).
Tapping mode AFM has been already used to image globular Y-shaped proteins like
antibodies on mica surfaces104 finding that it is possible distinguish between different protein
morphologies. Immobilized immunoglobulins can adopt four molecular orientations: side-on
(one Fc and one Fab in contact with the surface), tail-on or side-up (Fc onto the surface), head-
on (both Fabs attached onto the surface) and flat-on (all three portions connected to the surface).
In order to achieve the best binding efficiency, antibodies should show the antigen-binding
regions after immobilization. Therefore, the side-up morphology is the one which better
recognizes the antigen. These four morphologies have been found in a first stripped gold sample
functionalized with non-irradiated antibodies. This experimental result and the sketches of the
possible orientations of the immobilized immunoglobulins are shown in Figure 3.10.
It is worth mentioning that the height of the imaged proteins is significantly different from
the results obtained using X-ray crystallography40. In particular, the measured height of
nanoscale protein features in the atomic force microscopy is often smaller than the true value
(the loss in height ranges between 10 and 90%). This effect is commonly attributed to sample
deformation105, accumulation of salt deposits on support surfaces106 or dehydration107. More
recently, Santos et al.108, who worked on both double strand DNA and antibodies, showed that
also the geometry of the tip-surface/sample interaction area could affect the imaging of the
biomolecule. As a consequence of this artefact, the height information is spread-out laterally
across the tip-sample interaction area thus resulting in broader features. Anyway, as shown in
Figure 4.10, the four morphologies assumed by immobilized antibodies are still recognizable.
In a preliminary attempt to image UV-activated antibodies on gold, we used tapping mode
AFM on stripped gold samples functionalized using irradiated (Figure 3.11a) and non-irradiated
(Figure 3.11b) protein sample. In both panels of Figure 3.11, the blue and red circles highlight
“side-up” and “flat-on” antibodies, respectively.
This analysis suggests that PIT enhances the “side-up” conformation thus leading to a
more effective antigen detection. Nevertheless, a careful image analysis, which would help in
the recognition of all the possible antibodies orientations, coupled with a systematic study
carried out as a function of surface coverage is required in order to clarify the effects of PIT.
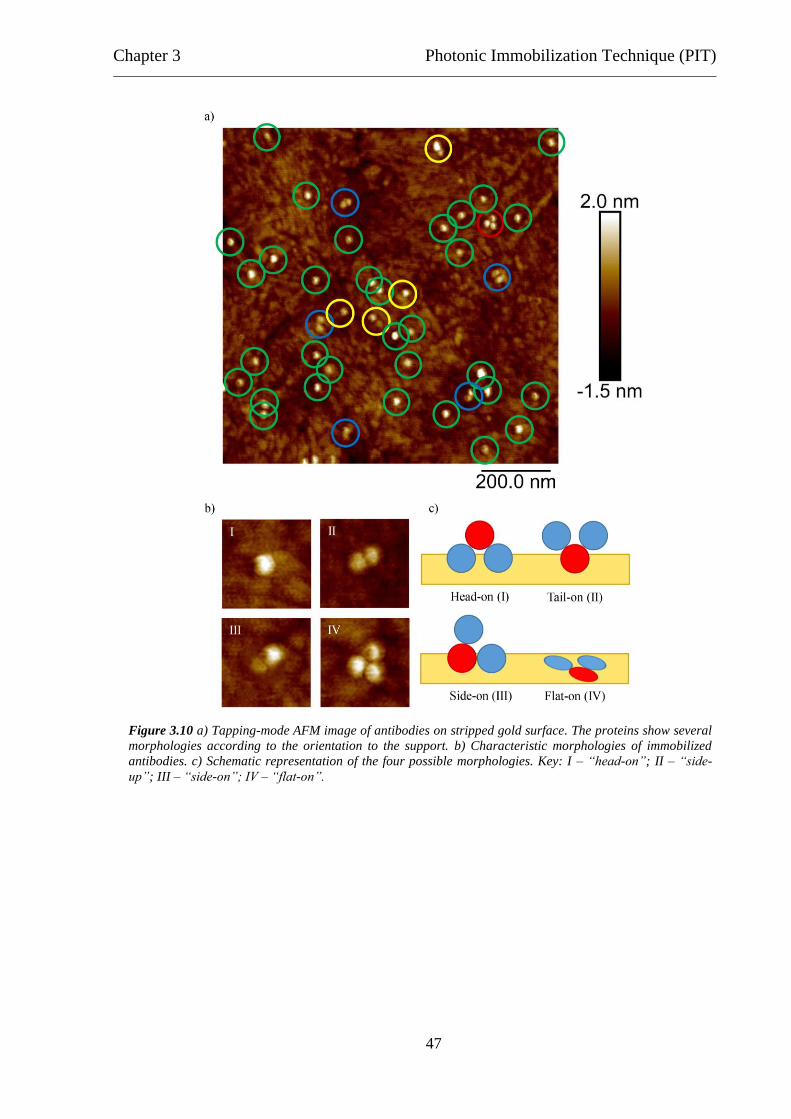
Chapter 3 Photonic Immobilization Technique (PIT)
47
Figure 3.10 a) Tapping-mode AFM image of antibodies on stripped gold surface. The proteins show several
morphologies according to the orientation to the support. b) Characteristic morphologies of immobilized
antibodies. c) Schematic representation of the four possible morphologies. Key: I – “head-on”; II – “side-
up”; III – “side-on”; IV – “flat-on”.

Chapter 3 Photonic Immobilization Technique (PIT)
48
Figure 3.11 AFM images for (a) irradiated and (b) non-irradiated samples where the “side-up” and “flat-
on” antibodies are highlighted (blue and red circles, respectively). The substrate is stripped gold while the
protein concentration is 0.5 μg/mL.

Chapter 4 Applications of PIT
49
4 Applications of PIT
4.1 A case study: IgG and anti-IgG
In order to investigate the efficiency of PIT in functionalizing surfaces, Della Ventura et
al.88 realized a QCM based biosensor on the model antigen-antibody system IgG-anti-IgG (i.e.
an antibody which catches another antibody). This scheme is quite common in immunoassays
since it is used to amplify the signal due to antigen binding109. The “antibody” is an anti-IgG
produced in goat while the “antigen” is a murine IgG. The irradiation conditions (λ = 258 nm)
resulting from the Ellman’s assay are: 10 kHz repetition rate, 5 minutes irradiation time and 0.3
W average power (30 μJ/pulse). The protein concentration used for surface functionalization is
50 μg/mL.
The QCM responses versus time for both irradiated and non-irradiated (control)
immobilized antibodies are reported in Figure 4.1.
The comparison between the two curves (the solid and dashed lines correspond to the
non-irradiated and irradiated samples, respectively) shows that the amount of tethered antibody
(first drop in frequency of about 320 Hz) is mostly the same in both conditions. On the other
side, since the photonic activation leads to a more effective orientation of the immobilized
antibodies, the detection of the antigen results to be more efficient for irradiated
0 2000 4000 6000 8000
600
500
400
300
200
100
0 non-irradiated
irradiated
PBSIgG
PBSBSAPBS
f (H
z)
time (s)
PBS
anti-IgG
Figure 4.1. QCM outputs obtained with 50 µg/mL of anti-IgG and 50 µg/mL of mouse IgG of non-irradiated
(black solid line) and irradiated antibody (red dashed line). The vertical dashed lines show the steps described
in the text.

Chapter 4 Applications of PIT
50
immunoglobulins (second drop in frequency). The frequency shifts due to analyte binding as
function of the antigen concentration for PIT based (red circles) and control (black squares)
sensors are shown in Figure 4.2.
This behaviour has been fitted by using a Michaelis-Menten type equation, a
mathematical model commonly used to describe a wide range of biochemical reactions,
enzymatic kinetics and antigen-antibody binding events110:
∆𝑓(𝐴𝑔) =
(∆𝑓)𝑠𝑎𝑡𝐴𝑔
𝐾𝑀 + 𝐴𝑔 (4.1)
where Ag is the antigen concentration, (Δf )sat contains the instrument response and KM is the
so-called Michaelis-Menten constant. (Δf )sat is the maximum frequency shift achieved by the
system at saturating antigen concentration, while KM is the antigen concentration at which the
sensor response is half of its maximum. This parameter is an inverse measure of the affinity of
the antibody for the antigen. The rise in both slope and saturation level observed when PIT is
applied is attributed to the better exposure of the antigen binding sites. This effect increases the
capture probability thus making the immobilized antibodies more efficient in binding the
antigen and affecting both (Δf )sat and KM. The decrease of KM (i.e. the increase of the apparent
affinity of the immobilized immunoglobulins) results in the rise of the slope. On the other side,
a more correct orientation of the immunoglobulins increases the number of the available
0 10 20 30 40 500
50
100
150
200
250
300 non-irradiated
irradiated
f (H
z)
Ag concentration (g/mL)
Figure 4.2. Frequency shifts observed with irradiated (red circles) and not-irradiated (black squares) antibody
solutions as function of the antigen concentration. The best fit obtained with Equation 4.1 provides (Δf)sat =
212 ± 14 Hz, kM = 8 ± 2 μg/mL and (Δf)sat = 279 ± 13 Hz, kM = 2.4 ± 0.6 μg/mL for the irradiated and non-
irradiated anti-IgG samples, respectively.
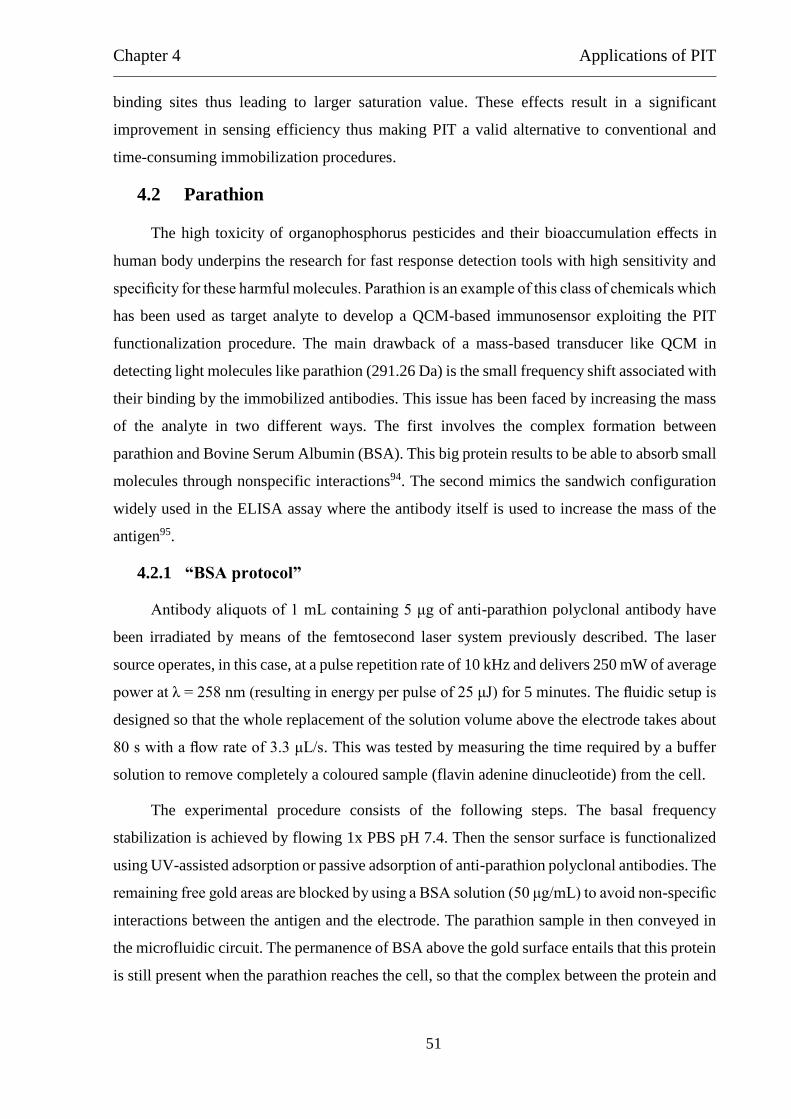
Chapter 4 Applications of PIT
51
binding sites thus leading to larger saturation value. These effects result in a significant
improvement in sensing efficiency thus making PIT a valid alternative to conventional and
time-consuming immobilization procedures.
4.2 Parathion
The high toxicity of organophosphorus pesticides and their bioaccumulation effects in
human body underpins the research for fast response detection tools with high sensitivity and
specificity for these harmful molecules. Parathion is an example of this class of chemicals which
has been used as target analyte to develop a QCM-based immunosensor exploiting the PIT
functionalization procedure. The main drawback of a mass-based transducer like QCM in
detecting light molecules like parathion (291.26 Da) is the small frequency shift associated with
their binding by the immobilized antibodies. This issue has been faced by increasing the mass
of the analyte in two different ways. The first involves the complex formation between
parathion and Bovine Serum Albumin (BSA). This big protein results to be able to absorb small
molecules through nonspecific interactions94. The second mimics the sandwich configuration
widely used in the ELISA assay where the antibody itself is used to increase the mass of the
antigen95.
4.2.1 “BSA protocol”
Antibody aliquots of 1 mL containing 5 μg of anti-parathion polyclonal antibody have
been irradiated by means of the femtosecond laser system previously described. The laser
source operates, in this case, at a pulse repetition rate of 10 kHz and delivers 250 mW of average
power at λ = 258 nm (resulting in energy per pulse of 25 μJ) for 5 minutes. The fluidic setup is
designed so that the whole replacement of the solution volume above the electrode takes about
80 s with a flow rate of 3.3 μL/s. This was tested by measuring the time required by a buffer
solution to remove completely a coloured sample (flavin adenine dinucleotide) from the cell.
The experimental procedure consists of the following steps. The basal frequency
stabilization is achieved by flowing 1x PBS pH 7.4. Then the sensor surface is functionalized
using UV-assisted adsorption or passive adsorption of anti-parathion polyclonal antibodies. The
remaining free gold areas are blocked by using a BSA solution (50 μg/mL) to avoid non-specific
interactions between the antigen and the electrode. The parathion sample in then conveyed in
the microfluidic circuit. The permanence of BSA above the gold surface entails that this protein
is still present when the parathion reaches the cell, so that the complex between the protein and
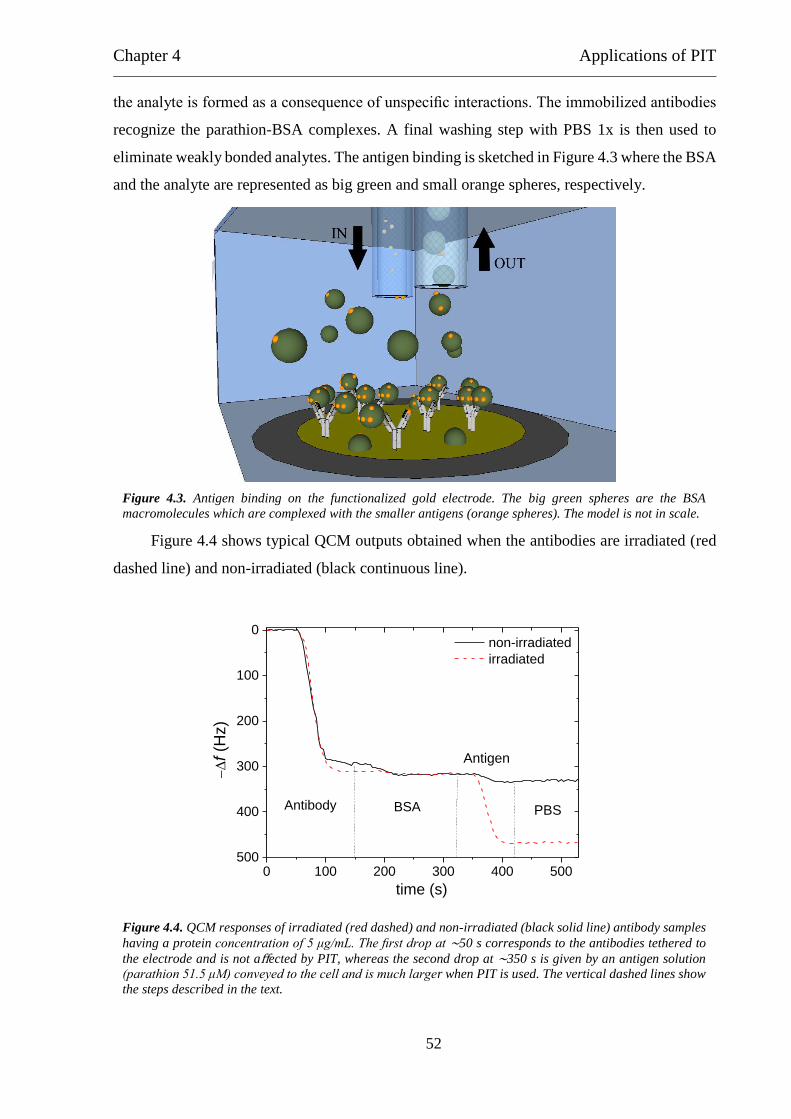
Chapter 4 Applications of PIT
52
the analyte is formed as a consequence of unspecific interactions. The immobilized antibodies
recognize the parathion-BSA complexes. A final washing step with PBS 1x is then used to
eliminate weakly bonded analytes. The antigen binding is sketched in Figure 4.3 where the BSA
and the analyte are represented as big green and small orange spheres, respectively.
Figure 4.4 shows typical QCM outputs obtained when the antibodies are irradiated (red
dashed line) and non-irradiated (black continuous line).
Figure 4.3. Antigen binding on the functionalized gold electrode. The big green spheres are the BSA
macromolecules which are complexed with the smaller antigens (orange spheres). The model is not in scale.
0 100 200 300 400 500500
400
300
200
100
0
PBS
non-irradiated
irradiated
f (H
z)
time (s)
Antibody BSA
Antigen
Figure 4.4. QCM responses of irradiated (red dashed) and non-irradiated (black solid line) antibody samples
having a protein concentration of 5 μg/mL. The first drop at ∼50 s corresponds to the antibodies tethered to
the electrode and is not affected by PIT, whereas the second drop at ∼350 s is given by an antigen solution
(parathion 51.5 μM) conveyed to the cell and is much larger when PIT is used. The vertical dashed lines show
the steps described in the text.
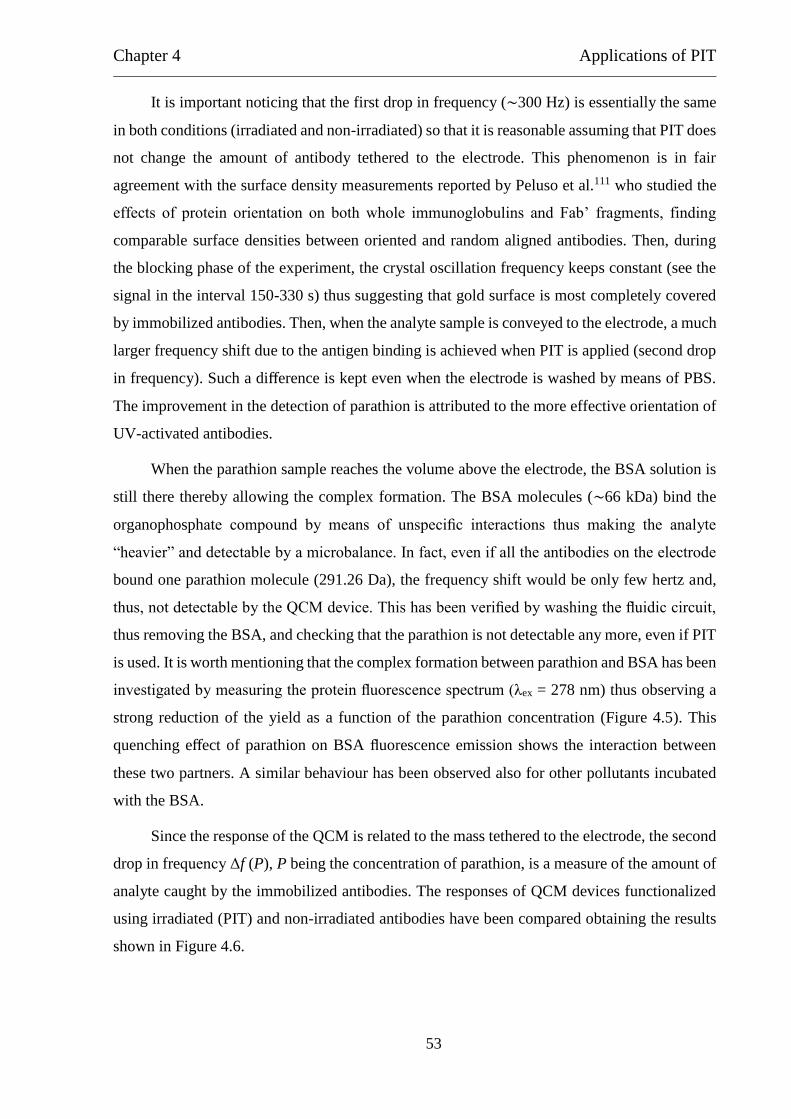
Chapter 4 Applications of PIT
53
It is important noticing that the first drop in frequency (∼300 Hz) is essentially the same
in both conditions (irradiated and non-irradiated) so that it is reasonable assuming that PIT does
not change the amount of antibody tethered to the electrode. This phenomenon is in fair
agreement with the surface density measurements reported by Peluso et al.111 who studied the
effects of protein orientation on both whole immunoglobulins and Fab’ fragments, finding
comparable surface densities between oriented and random aligned antibodies. Then, during
the blocking phase of the experiment, the crystal oscillation frequency keeps constant (see the
signal in the interval 150-330 s) thus suggesting that gold surface is most completely covered
by immobilized antibodies. Then, when the analyte sample is conveyed to the electrode, a much
larger frequency shift due to the antigen binding is achieved when PIT is applied (second drop
in frequency). Such a difference is kept even when the electrode is washed by means of PBS.
The improvement in the detection of parathion is attributed to the more effective orientation of
UV-activated antibodies.
When the parathion sample reaches the volume above the electrode, the BSA solution is
still there thereby allowing the complex formation. The BSA molecules (∼66 kDa) bind the
organophosphate compound by means of unspecific interactions thus making the analyte
“heavier” and detectable by a microbalance. In fact, even if all the antibodies on the electrode
bound one parathion molecule (291.26 Da), the frequency shift would be only few hertz and,
thus, not detectable by the QCM device. This has been verified by washing the fluidic circuit,
thus removing the BSA, and checking that the parathion is not detectable any more, even if PIT
is used. It is worth mentioning that the complex formation between parathion and BSA has been
investigated by measuring the protein fluorescence spectrum (λex = 278 nm) thus observing a
strong reduction of the yield as a function of the parathion concentration (Figure 4.5). This
quenching effect of parathion on BSA fluorescence emission shows the interaction between
these two partners. A similar behaviour has been observed also for other pollutants incubated
with the BSA.
Since the response of the QCM is related to the mass tethered to the electrode, the second
drop in frequency Δf (P), P being the concentration of parathion, is a measure of the amount of
analyte caught by the immobilized antibodies. The responses of QCM devices functionalized
using irradiated (PIT) and non-irradiated antibodies have been compared obtaining the results
shown in Figure 4.6.

Chapter 4 Applications of PIT
54
It is evident that no significant signal is measured at a parathion concentration lower than
50 μM (about 15 μg/mL) when the antibodies are not irradiated (black squares). On the other
side, the signal is already in the saturation region if PIT is used (red circles).
0 20 40 60 80 1000
10000
20000
30000
40000
50000
Flu
ore
sce
nce y
ield
(a
rb.
un
.)
Parathion concentration (M)
Figure 4.5. Fluorescence yield of BSA versus parathion concentration. The area of the BSA fluorescence
spectra in the range 335-350 nm is reported versus the concentration of the pollutant added to the BSA sample.
0 10 20 30 40 50 60 70
0
50
100
150
0.0 0.5 1.0 1.5 2.00
50
100
non-irradiated
irradiated
Parathion concentration (µM)
f (H
z)
Figure 4.6. QCM response versus the parathion concentration with irradiated (circles) and not-irradiated
(squares) antibodies. The experimental points obtained with the irradiated antibody are fitted by a
Michaelis−Menten type equation (black solid line). The small frequency shift achieved when the antibody is
not irradiated does not allow any significant fit of the experimental data. The inset is the enlargement of the
low concentration region.

Chapter 4 Applications of PIT
55
By considering the law of mass action and given the free diffusion conditions of this
experiment, the analysis of the interaction kinetic between the analyte and the antibody leads
to a Michaelis-Menten type equation110:
∆𝑓(𝑃) =
(∆𝑓)𝑠𝑎𝑡𝑃
𝐾𝑀 + 𝑃 (4.2)
The best fitting of the experimental results obtained with UV-activated antibodies by
Equation 4.2 (solid line in Figure 4.6) provides (Δf )sat = 151 ± 5 Hz and KM = 2.2 ± 0.7 μM.
The uncertainty in the measurements is due to instrumental limitations of the QCM device, as
well as to random fluctuations in some steps of the detection procedure. In view of these
restrictions, a conservative frequency error of 15 Hz has been considered. Therefore, a
minimum frequency change (Δf )min of 15 Hz is required to consider a measurement different
from zero. An estimation of the LOD has been obtained by inverting Equation 4.2:
𝐿𝑂𝐷 ≈
(∆𝑓)𝑚𝑖𝑛𝐾𝑀
(∆𝑓)𝑠𝑎𝑡≈ 200 𝑛𝑀 ≈ 60 𝑛𝑔/𝑚𝐿
(4.3)
The striking difference shown in Figure 4.6 allows to estimate an increase in the
sensitivity of at least 1 order of magnitude when PIT is used. It is reasonable attributing this
result to the improved orientation of the antibodies which is much more significant than that
achieved with the IgG-anti-IgG model system88. These observations are in fair agreement the
mass dependence effects described by Trilling et al.21, who have recently reported that the
smaller the analyte, the more important is the orientation of the sensitive biomolecule.
To prove sensor specificity, the same experimental procedure has been used for four
compounds, progressively similar to parathion, from the chemical and structural point of view.
They are bisphenol A, p-nonylphenol, dichlorvos, and paraoxon. At a concentration of
approximately 1.7 μM, where parathion exhibits a significant response, all the four chemicals
showed no detectable frequency shift when they were tested separately. Therefore, the sensor
response has been measured while working in contact with a mixture of the four compounds at
an even higher concentration (3.5 μM), thereby mimicking a real complex sample. The results
of these experiments are reported in Figure 4.7, where the detection steps of the protocol are
highlighted.

Chapter 4 Applications of PIT
56
The signal measured when only the four compounds are in solution is just few hertz, but
the frequency goes back to the previous value when PBS is conveyed into the circuit (blue
dotted line). The parathion alone at 3.5 μM leads to a frequency shift of approximately 90 Hz
(red dashed line). The mixture containing all the pollutants (including parathion) produces a
slightly larger shift (solid black line) that disappear after washing with PBS. As final test, the
concentration of the pollutants were increased by two orders of magnitude (170 μM) compared
to the initial experiment (1.7 μM), but despite such high concentration, the QCM responses
were always lower than those provided by parathion in the saturation regime of the dose-
response curve. All these results demonstrate that recognition efficiency of antibodies is not
affected by photonic activation.
4.2.2 “Sandwich protocol”
Since not all the molecules are able to complex with BSA, a more general approach
leading to higher sensitivity and specificity has been developed. Basically, the light analyte (i.e.
parathion) is ballasted by the same antibodies used to functionalize the QCM. This procedure
mimics the so-called sandwich configuration widely used in the ELISA technique109. It is worth
mention that “sandwich” immunoassays can be performed in two different ways commonly
referred to as “one-step” and “two-step”. The first requires that antigen and antibody are mixed
300 350 400 450 500
450
400
350
300
250
Antigen PBSBSA
f (H
z)
time (s)
Parathion + Pollutants
Parathion
Pollutants
Figure 4.7. Sensor specificity i.e. sensor responses against different pollutants similar to parathion. QCM
response to parathion (red dashed line), to a mixture of bisphenol A, p-nonylphenol, dichlorvos, paraoxon
(blue dotted line), and to parathion + other pollutants (black solid line). The concentration of all the
compounds is 3.5 μM.
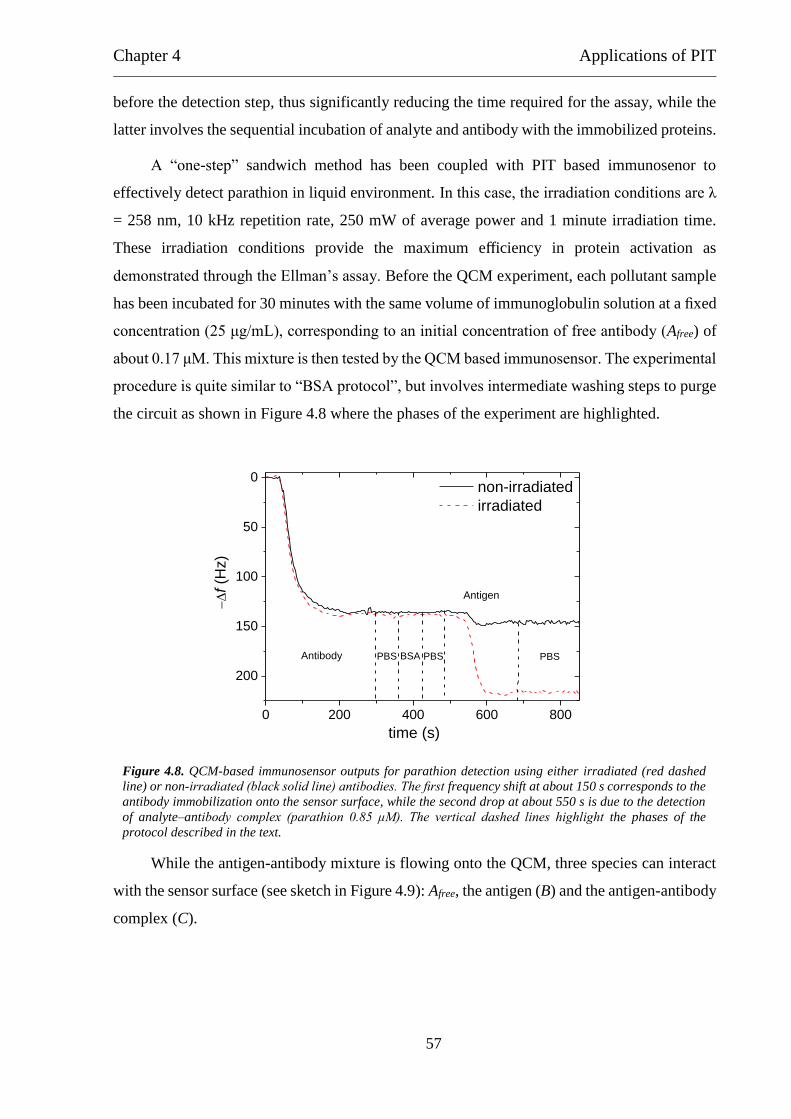
Chapter 4 Applications of PIT
57
before the detection step, thus significantly reducing the time required for the assay, while the
latter involves the sequential incubation of analyte and antibody with the immobilized proteins.
A “one-step” sandwich method has been coupled with PIT based immunosenor to
effectively detect parathion in liquid environment. In this case, the irradiation conditions are λ
= 258 nm, 10 kHz repetition rate, 250 mW of average power and 1 minute irradiation time.
These irradiation conditions provide the maximum efficiency in protein activation as
demonstrated through the Ellman’s assay. Before the QCM experiment, each pollutant sample
has been incubated for 30 minutes with the same volume of immunoglobulin solution at a fixed
concentration (25 μg/mL), corresponding to an initial concentration of free antibody (Afree) of
about 0.17 μM. This mixture is then tested by the QCM based immunosensor. The experimental
procedure is quite similar to “BSA protocol”, but involves intermediate washing steps to purge
the circuit as shown in Figure 4.8 where the phases of the experiment are highlighted.
While the antigen-antibody mixture is flowing onto the QCM, three species can interact
with the sensor surface (see sketch in Figure 4.9): Afree, the antigen (B) and the antigen-antibody
complex (C).
0 200 400 600 800
200
150
100
50
0 non-irradiated
irradiated
time (s)
f (H
z)
PBS
Antigen
PBSBSAPBS
Antibody
Figure 4.8. QCM-based immunosensor outputs for parathion detection using either irradiated (red dashed
line) or non-irradiated (black solid line) antibodies. The first frequency shift at about 150 s corresponds to the
antibody immobilization onto the sensor surface, while the second drop at about 550 s is due to the detection
of analyte–antibody complex (parathion 0.85 μM). The vertical dashed lines highlight the phases of the
protocol described in the text.
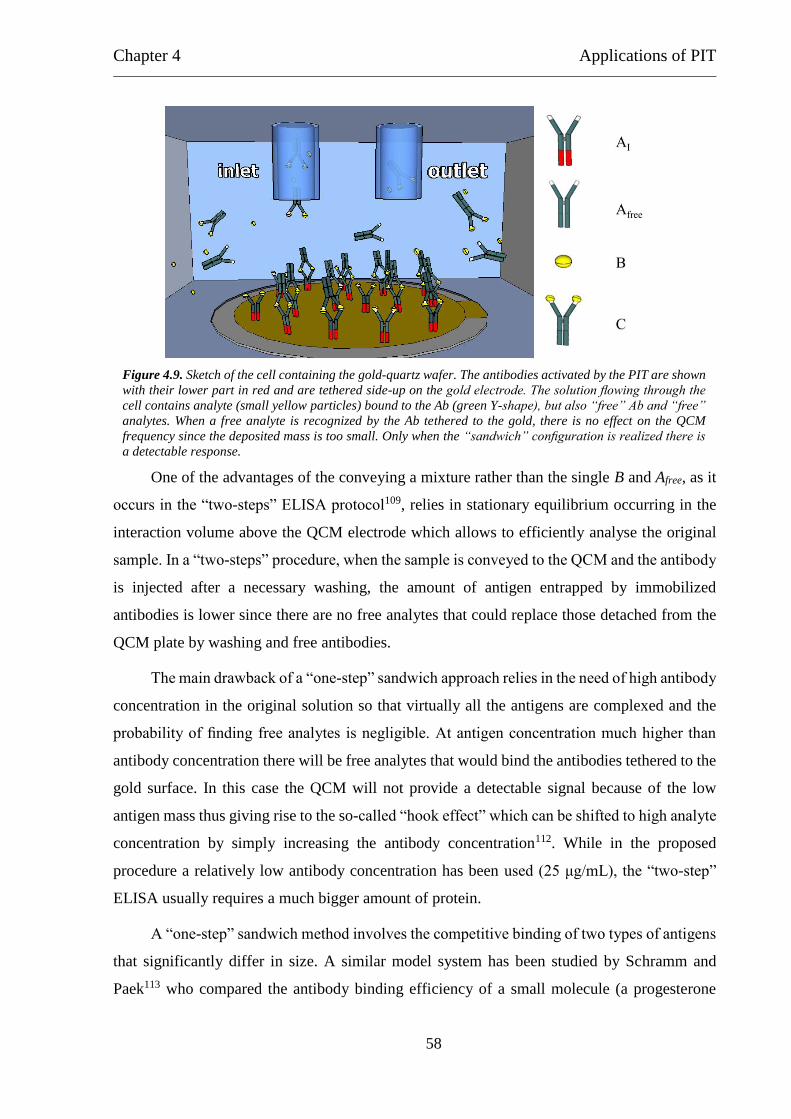
Chapter 4 Applications of PIT
58
One of the advantages of the conveying a mixture rather than the single B and Afree, as it
occurs in the “two-steps” ELISA protocol109, relies in stationary equilibrium occurring in the
interaction volume above the QCM electrode which allows to efficiently analyse the original
sample. In a “two-steps” procedure, when the sample is conveyed to the QCM and the antibody
is injected after a necessary washing, the amount of antigen entrapped by immobilized
antibodies is lower since there are no free analytes that could replace those detached from the
QCM plate by washing and free antibodies.
The main drawback of a “one-step” sandwich approach relies in the need of high antibody
concentration in the original solution so that virtually all the antigens are complexed and the
probability of finding free analytes is negligible. At antigen concentration much higher than
antibody concentration there will be free analytes that would bind the antibodies tethered to the
gold surface. In this case the QCM will not provide a detectable signal because of the low
antigen mass thus giving rise to the so-called “hook effect” which can be shifted to high analyte
concentration by simply increasing the antibody concentration112. While in the proposed
procedure a relatively low antibody concentration has been used (25 μg/mL), the “two-step”
ELISA usually requires a much bigger amount of protein.
A “one-step” sandwich method involves the competitive binding of two types of antigens
that significantly differ in size. A similar model system has been studied by Schramm and
Paek113 who compared the antibody binding efficiency of a small molecule (a progesterone
Figure 4.9. Sketch of the cell containing the gold-quartz wafer. The antibodies activated by the PIT are shown
with their lower part in red and are tethered side-up on the gold electrode. The solution flowing through the
cell contains analyte (small yellow particles) bound to the Ab (green Y-shape), but also “free” Ab and “free”
analytes. When a free analyte is recognized by the Ab tethered to the gold, there is no effect on the QCM
frequency since the deposited mass is too small. Only when the “sandwich” configuration is realized there is
a detectable response.

Chapter 4 Applications of PIT
59
derivative) with that of an enzyme-labelled form of the same antigen. A possible strategy to
characterize the competitive binding between large and small antigens is considering the
equilibria between the different species which are involved. These are shown in Figure 4.10.
In this scheme, only the formation of the AIC complex leads to a significant change of the
resonance frequency of the QCM. This is due to the huge mass of the big antigen (C), which
weighs about 150 kDa, like the free immunoglobulin (Afree) used to label the organophosphate
compound. On the other side, since native parathion (B) molecules weigh only 291.26 Da, their
binding onto the antibody-functionalized surface results in a negligible frequency variation.
These analytes occupy the sensitive sites of immobilized antibodies (AI) thus acting as
“inhibitors” of the immunosensor.
The model shown in Figure 4.10 can be described by three equilibrium equations:
𝑘1[𝐴𝐼𝐶] = [𝐴𝐼][𝐶] (4.4)
𝑘2[𝐴𝐼𝐵] = [𝐴𝐼][𝐵] (4.5)
𝑘3[𝐶] = [𝐴𝑓𝑟𝑒𝑒][𝐵] (4.6)
where k1 and k2 are the affinity constants of the immobilized antibody for the large and small
antigens, respectively, while k3 is the affinity constant of the free antibody for the non-labelled
parathion. These equations contain six variables: concentrations of both immobilized and free
non-occupied antibodies (AI and Afree), both small and large antigens (B and C), and two antigen-
Figure 4.10. Scheme of equilibria. The immobilized antibody (AI) can bind either the native (B) or labelled
(C) form of parathion thus making two kind of antigen-antibody complexes (AIB and AIC, respectively). Also
the two forms of the antigen are at the equilibrium. k1, k2 and k3 are the kinetic constants characterizing the
three equilibria.

Chapter 4 Applications of PIT
60
antibody complexes (AIB and AIC). It is possible derive also three mass balance equations for
the two type of antibodies and for parathion:
[𝐴𝑓𝑟𝑒𝑒] + [𝐶] + [𝐴𝐼𝐶] = [𝐴𝑓𝑟𝑒𝑒]0 (4.7)
[𝐴𝐼] + [𝐴𝐼𝐶] + [𝐴𝐼𝐵] = [𝐴𝐼]0 (4.8)
[𝐵] + [𝐶] + [𝐴𝐼𝐵] + [𝐴𝐼𝐶] = [𝐵]0 (4.9)
where [Afree]0 is the initial concentration of free antibody used to label the organophosphate
compound (0.17 µM), [AI]0 is the effective concentration of the immobilized antibody onto the
sensor surface and [B]0 is the concentration of parathion sample used to calibrate the sensor
response.
Since [AIC] is directly proportional to the frequency variation of the QCM, an analytical
expression for this concentration should provide a good description of the experimental results.
However, the combination of the six equation results in a non-linear system which requires
much more experimental data and complex numerical procedures to be solved. For instance,
Schramm and Paek113 faced this problem by detecting both large and small antigens using two
different principles: fluorescence and radioactive labelling.
To overcome this issue, a different approach has been adopted. A standard Michaelis-
Menten type equation (like Equation 4.1) is expected to well describe the process when
[B]0<<[Abfree]0:
∆𝑓(𝐵0) =
(∆𝑓)𝑠𝑎𝑡𝐵0
𝐵0 + 𝐾𝑀 (4.10)
being B0 the initial concentration of the antigen. On the other side, an excess of analyte
concentration in the original solution ([B]0>>[Afree]0) rises the probability that immobilized
antibodies bind the free antigens (B) rather than the complexed analytes (C), but due to the
small mass of the molecule such a recognition does not lead to a measurable frequency shift.
Therefore, when [B] increases and the condition [B]0≈[Afree]0 is reached an “inhibition effect”
starts and further increase of [B] results in a reduction of Δf. The experimental evidence of this
phenomenon is clearly shown in Figure 4.11.
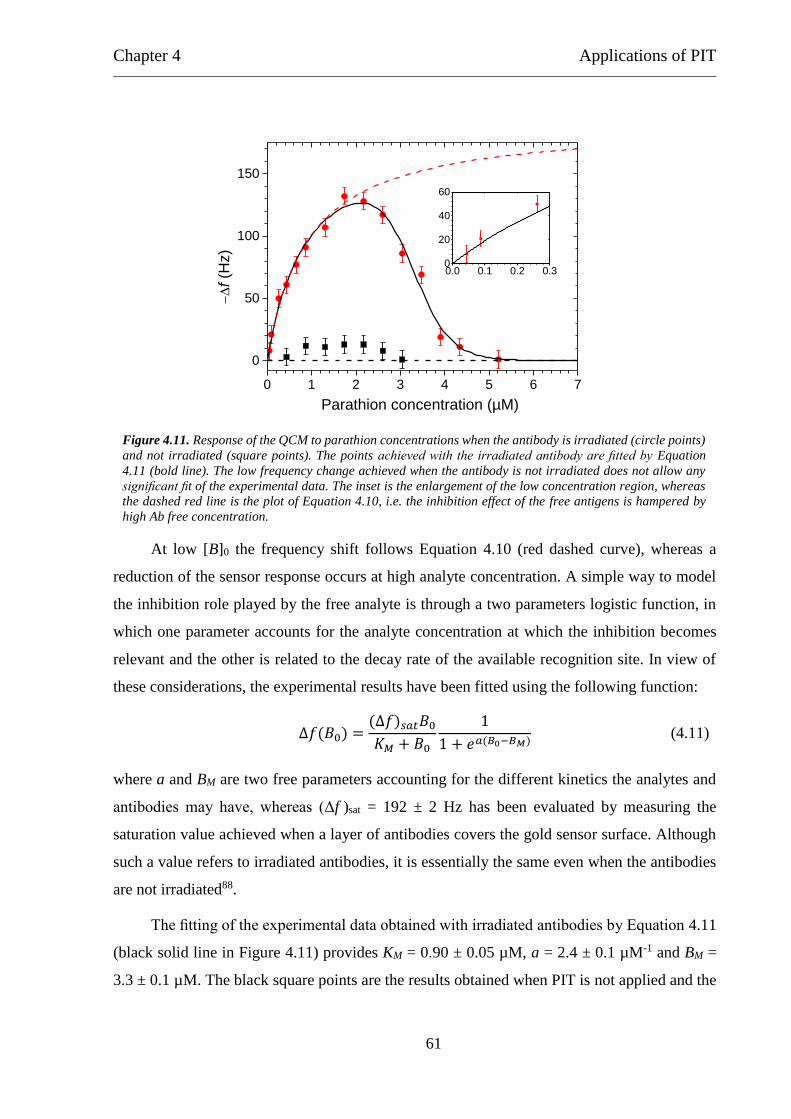
Chapter 4 Applications of PIT
61
At low [B]0 the frequency shift follows Equation 4.10 (red dashed curve), whereas a
reduction of the sensor response occurs at high analyte concentration. A simple way to model
the inhibition role played by the free analyte is through a two parameters logistic function, in
which one parameter accounts for the analyte concentration at which the inhibition becomes
relevant and the other is related to the decay rate of the available recognition site. In view of
these considerations, the experimental results have been fitted using the following function:
∆𝑓(𝐵0) =
(∆𝑓)𝑠𝑎𝑡𝐵0
𝐾𝑀 + 𝐵0
1
1 + 𝑒𝑎(𝐵0−𝐵𝑀) (4.11)
where a and BM are two free parameters accounting for the different kinetics the analytes and
antibodies may have, whereas (Δf )sat = 192 ± 2 Hz has been evaluated by measuring the
saturation value achieved when a layer of antibodies covers the gold sensor surface. Although
such a value refers to irradiated antibodies, it is essentially the same even when the antibodies
are not irradiated88.
The fitting of the experimental data obtained with irradiated antibodies by Equation 4.11
(black solid line in Figure 4.11) provides KM = 0.90 ± 0.05 µM, a = 2.4 ± 0.1 µM-1 and BM =
3.3 ± 0.1 µM. The black square points are the results obtained when PIT is not applied and the
0 1 2 3 4 5 6 7
0
50
100
150
0.0 0.1 0.2 0.30
20
40
60
Parathion concentration (µM)
f (H
z)
Figure 4.11. Response of the QCM to parathion concentrations when the antibody is irradiated (circle points)
and not irradiated (square points). The points achieved with the irradiated antibody are fitted by Equation
4.11 (bold line). The low frequency change achieved when the antibody is not irradiated does not allow any
significant fit of the experimental data. The inset is the enlargement of the low concentration region, whereas
the dashed red line is the plot of Equation 4.10, i.e. the inhibition effect of the free antigens is hampered by
high Ab free concentration.
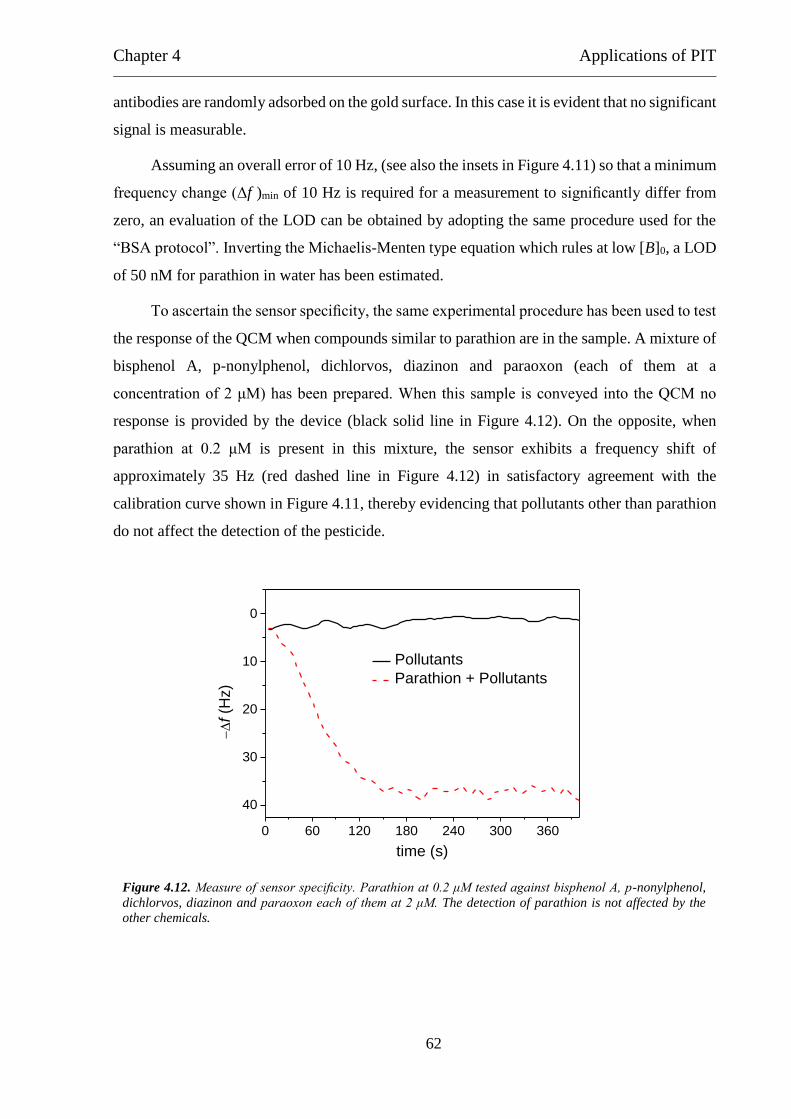
Chapter 4 Applications of PIT
62
antibodies are randomly adsorbed on the gold surface. In this case it is evident that no significant
signal is measurable.
Assuming an overall error of 10 Hz, (see also the insets in Figure 4.11) so that a minimum
frequency change (Δf )min of 10 Hz is required for a measurement to significantly differ from
zero, an evaluation of the LOD can be obtained by adopting the same procedure used for the
“BSA protocol”. Inverting the Michaelis-Menten type equation which rules at low [B]0, a LOD
of 50 nM for parathion in water has been estimated.
To ascertain the sensor specificity, the same experimental procedure has been used to test
the response of the QCM when compounds similar to parathion are in the sample. A mixture of
bisphenol A, p-nonylphenol, dichlorvos, diazinon and paraoxon (each of them at a
concentration of 2 μM) has been prepared. When this sample is conveyed into the QCM no
response is provided by the device (black solid line in Figure 4.12). On the opposite, when
parathion at 0.2 μM is present in this mixture, the sensor exhibits a frequency shift of
approximately 35 Hz (red dashed line in Figure 4.12) in satisfactory agreement with the
calibration curve shown in Figure 4.11, thereby evidencing that pollutants other than parathion
do not affect the detection of the pesticide.
0 60 120 180 240 300 360
40
30
20
10
0
f (H
z)
time (s)
Pollutants
Parathion + Pollutants
Figure 4.12. Measure of sensor specificity. Parathion at 0.2 μM tested against bisphenol A, p-nonylphenol,
dichlorvos, diazinon and paraoxon each of them at 2 μM. The detection of parathion is not affected by the
other chemicals.

Chapter 4 Applications of PIT
63
4.3 Patulin
The lack of portable detection tools for an extremely harmful food contaminant like
patulin makes valuable the realization of a PIT based immunosenor for revealing the presence
of this mycotoxin. Since patulin is a light molecule like parathion (it weighs only 154.12 Da),
its detection suffers of the same limitations of the organophosphate compound. To overcome
these issues, patulin has been quantified using a “one-step” sandwich method94. The results
achieved detecting the analyte using UV activated antibodies immobilized onto the QCM gold
surface are shown in Figure 4.13. The irradiation conditions are the same used for anti-parathion
antibodies. These experiments have been performed in collaboration with the Italian “Consiglio
per la ricerca e la sperimentazione in agricoltura (CRA) – Unità di ricerca per le colture
alternative al tabacco”.
When PIT is not applied no significant frequency shift is measured. The experimental
data have been fitted using Equation 4.11 (black solid line) which gives KM = 2.70 ± 0.05 µM,
a = 3.0 ± 0.1 µM-1 and BM = 2.3 ± 0.1 µM. This procedure allows to achieve a LOD for patulin
in aqueous environment of about 140 nM.
The sensor specificity has been verified by measuring the sensor response to real samples
of patulin extracted from apple puree provided by apple processing factories. To this end, a
commercial kit (Polyintell Affinimip® SPE cartridge) is used. The extraction is performed by
mixing 10 g of apple puree with 150 μL of a pectinase enzyme solution and 10 mL of deionized
0 1 2 3 4 5
0
20
40
60
80
100
120
0.0 0.1 0.2 0.30
20
non-irradiated
irradiated
Patulin concentration (µM)
f (H
z)
Figure 4.13. QCM responses using irradiated (circle points) and non-irradiated (square points) antibodies.
The responses obtained using PIT-based immonosensor have been fitted using Equation 4.11 (bold line).
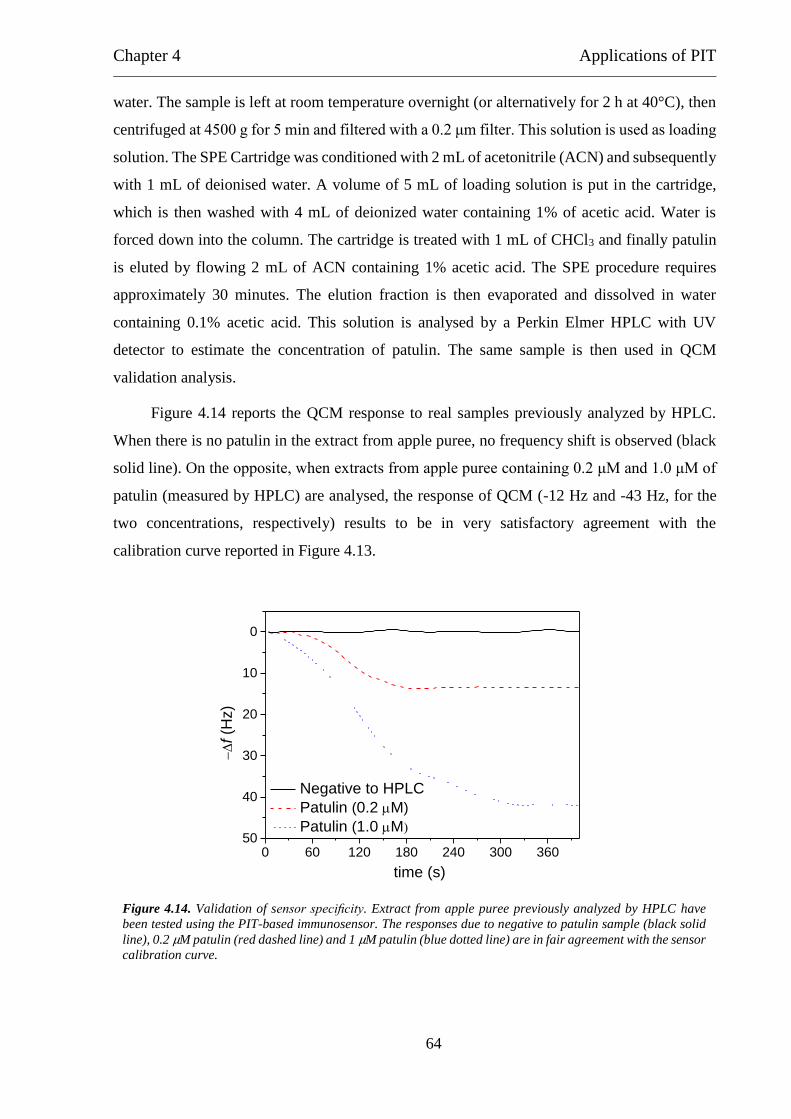
Chapter 4 Applications of PIT
64
water. The sample is left at room temperature overnight (or alternatively for 2 h at 40°C), then
centrifuged at 4500 g for 5 min and filtered with a 0.2 μm filter. This solution is used as loading
solution. The SPE Cartridge was conditioned with 2 mL of acetonitrile (ACN) and subsequently
with 1 mL of deionised water. A volume of 5 mL of loading solution is put in the cartridge,
which is then washed with 4 mL of deionized water containing 1% of acetic acid. Water is
forced down into the column. The cartridge is treated with 1 mL of CHCl3 and finally patulin
is eluted by flowing 2 mL of ACN containing 1% acetic acid. The SPE procedure requires
approximately 30 minutes. The elution fraction is then evaporated and dissolved in water
containing 0.1% acetic acid. This solution is analysed by a Perkin Elmer HPLC with UV
detector to estimate the concentration of patulin. The same sample is then used in QCM
validation analysis.
Figure 4.14 reports the QCM response to real samples previously analyzed by HPLC.
When there is no patulin in the extract from apple puree, no frequency shift is observed (black
solid line). On the opposite, when extracts from apple puree containing 0.2 μM and 1.0 μM of
patulin (measured by HPLC) are analysed, the response of QCM (-12 Hz and -43 Hz, for the
two concentrations, respectively) results to be in very satisfactory agreement with the
calibration curve reported in Figure 4.13.
0 60 120 180 240 300 36050
40
30
20
10
0
Negative to HPLC
Patulin (0.2 M)
Patulin (1.0 M)
f (H
z)
time (s)
Figure 4.14. Validation of sensor specificity. Extract from apple puree previously analyzed by HPLC have
been tested using the PIT-based immunosensor. The responses due to negative to patulin sample (black solid
line), 0.2 μM patulin (red dashed line) and 1 μM patulin (blue dotted line) are in fair agreement with the sensor
calibration curve.

Chapter 4 Applications of PIT
65
It is worth noticing that the extracts used for these tests contain analytes which could
potentially interfere with patulin detection, however, these results demonstrate that this QCM
based immunosensor is suitable for real sample analysis.
4.4 Gliadin
The high risk associated to contamination of gluten-free products supports the research
for user-friendly analytical tools for detecting gliadin in foods. To this end, a label-free PIT
based immunosensor has been realized in collaboration with the Italian “Consiglio per la
Ricerca e la Sperimentazione in Agricoltura (CRA) – Centro di ricerca per l'orticoltura”. For
anti-gliadin antibody, the irradiation conditions are λ = 258 nm, 10 kHz repetition rate, 250 mW
of average power and 1 minute irradiation time. In view of its low solubility in water, the gliadin
samples have been prepared in 20% acetonitrile aqueous solution. The calibration curve for this
detection tool is shown in Figure 4.15.
The sigmoidal behaviour of the sensor responses can been attributed to interactions
occurring between gliadins114,115. These proteins are classified into four subcategories, α-, β-, γ
-, and ω-gliadins (being α, γ, and ω-types responsible for the coeliac disease), which are
naturally assembled with glutenins in gluten. The bases of these connections are intermolecular
disulphide bridges, hydrophobic and hydrogen bonding interactions. In view of this effect, the
experimental results have been fitted using the so-called Hill equation, a mathematical model
quite similar to Michaelis-Menten law, which describes cooperative binding events110.
0 50 100 150 200 250 300 350
0
20
40
60
80
100 irradiated
non-irradiated
f (H
z)
Gliadin concentration (ppm)
Figure 4.15. Calibartion curves for gliadin detection using irradiated (red circles) and non-irradiated (black
squares) antibodies. The experimental responses have been fitted using the model described in the text.

Chapter 4 Applications of PIT
66
A biomolecule having a single binding site (M) interacting with a ligand (L) can be
described by the following equilibrium:
𝑀 + 𝐿 ⇄ 𝑀𝐿 (4.12)
𝐾𝑒𝑞 =
[𝑀𝐿]
[𝑀][𝐿] (4.13)
Keq being the equilibrium constant of the complex. The fraction of biomolecules bonded to a
ligand (i.e. fractional saturation) Y is written as:
𝑌 =
[𝑀𝐿]
[𝑀] + [𝑀𝐿]=
[𝐿]
𝐾𝐷 + [𝐿] (4.14)
where ML is the biomolecule-ligand complex and KD its dissociation constant (i.e. 1/Keq). This
mathematical formulation leads to the standard Michaelis-Menten equation where a certain
parameter (e.g. reaction rate) is described as function of the ligand concentration (e.g. substrate
concentration). Non-cooperative systems like an antigen-antibody model, where the antigen
binding sites are considered completely independent, are analysed using the same approach thus
resulting again in a Michaelis-Menten type equation (as shown by Equation 4.1).
On the other side, in cooperative systems, the binding of a ligand changes the other
binding sites on the biomolecule. Assuming that the biomolecule has n binding cavities and the
affinity for the remaining sites is hugely increased so that all the remaining ligands bind
simultaneously, this system can be described as:
𝑀 + 𝑛𝐿 ⇄ 𝑀𝐿 (4.15)
𝐾𝑒𝑞 =
[𝑀𝐿]
[𝑀][𝐿]𝑛 (4.16)
Thus making the fractional saturation:
𝑌 =
[𝑀𝐿]
[𝑀] + [𝑀𝐿]=
[𝐿]𝑛
𝐾𝐷 + [𝐿]𝑛 (4.17)
This relationship leads to the so-called Hill equation which is often represented in
literature as:
𝑣 =
𝑉𝑚𝐿𝑛
𝐾𝐷 + 𝐿𝑛 (4.18)

Chapter 4 Applications of PIT
67
where v is the reaction rate (i.e. for enzymatic reactions) and Vm is the saturation value. The
coefficient n (number of binding sites) corresponds, in this ideal model, to the so-called Hill
coefficient. In general, n is replaced with h, which usually is not an integer number thus showing
the lack of this model in describing a complex phenomenon like cooperativity. The most famous
example of cooperative binding concerns the haemoglobin. Even if this protein has four binding
sites for molecular oxygen, the measured Hill coefficient is 2.7. When h = 1, the Hill equation
reduces to the non-cooperative Michaelis-Menten law. If h < 1, an anti-cooperative binding
occurs.
In addition, in this model, √𝐾𝐷𝑛
corresponds to the concentration of ligand giving half of
fractional saturation, in analogy with KM in the Michaelis-Menten equation. This parameter,
commonly referred to as KH, is and average dissociation constant depending on all the binding
events.
The experimental results shown in Figure 4.15 have been fitted using the following Hill-
type equation:
∆𝑓(𝐺) =
(∆𝑓)𝑠𝑎𝑡𝐺ℎ
𝐾𝐻ℎ + 𝐺ℎ
(4.19)
being G the gliadin concentration. The best fit of the responses obtained when antibodies are
irradiated (red dashed line in Figure 4.15) provide (Δf )sat = 87 ± 5 Hz, KH = 51 ± 6 ppm and h
= 1.6 ± 0.3.This value of h (i.e. h > 1) is consistent with a cooperative effect resulting from
gliadin-gliadin interactions. This coefficient has been fixed while fitting the responses obtained
when PIT is not applied using Equation 4.19 (black solid curve in Figure 4.15). In this case,
(Δf )sat = 64 ± 5 Hz and KH = 77 ± 13 ppm. The increase of both saturation value and binding
affinity obtained by PIT-based immunosensor is due to the lower steric hindrance of the antigen
binding sites achieved when immobilized antibodies are better oriented onto the sensor surface.
By considering an overall error of about 10 Hz and inverting Equation 4.19 a LOD of
about 13 ppm is estimated. This value can be significantly reduced by introducing a labelling
procedure like what involved in a two-step sandwich method. These preliminary results confirm
again the role of PIT in enhancing sensing efficiency. After improving the detection procedure
and performing appropriate specificity tests, this PIT-based immunosensor could be used for
real sample analysis.

Conclusions
68
5 Conclusions
Photonic immobilization technique has been coupled with quartz crystal microbalance
technology with the aim to realize efficient and reliable detection tools for practical
applications. This functionalization procedure is fast, easy and provides the effective
immobilization of antibodies onto gold and thiol-reactive surfaces by exploiting the selective
photoreduction of the disulphide bridge in the closely spaced cysteine-cysteine/tryptophan
amino acidic triads. This structural motif is a typical characteristic of the immunoglobulin
family. The UV irradiation of proteins does not affect the recognition property of the antibodies.
On the other side, this activation procedure allows to achieve a better exposure of the sensitive
sites of the immobilized biomolecule (i.e. the antigen binding sites) thus resulting in a valuable
improvement in sensor sensitivity. The effects of this unconventional functionalization method
on antibodies have been studied and characterized exploiting several investigation approaches
like optical techniques, atomic force microscopy and Ellman’s assay.
Using this immobilization procedure, QCM-based immunosensors have been realized for
quantifying a group of analytes having significant differences in terms of size and
physiochemical properties. The case study IgG-anti-IgG shows that the more correct orientation
achieved when PIT is applied results in rising the maximum amount of detectable antigen as
well as increasing the binding affinity of the immobilized biomolecules.
The detection of light molecules is of paramount importance in a wide range of practical
applications including health diagnostic, environmental monitoring and food analysis. To this
aim, PIT-based immunosensors have been realized for quantifying parathion, an
organophosphorus pesticide, and patulin, a micotoxin. Since these molecules weigh only a few
hundreds of Da, achieving an effective detection using a mass-based transducer like a QCM is
challenging. This drawback has been overcome by adopting two strategies to increase the mass
of the analyte. The first is based on the complex formation between parathion and bovine serum
albumin. This big protein absorbs the small molecule through nonspecific interactions thus
allowing to achieve a LOD of about 200 nM in liquid environment. The second approach
mimics the sandwich configuration widely used in the ELISA assay. Basically, the antigen is
recognized by its own antibody and the resulting solution is conveyed to the balance. While
PIT is shown to largely increase the sensitivity of QCM, the sandwich protocol has two main
advantages: it weighs down the light molecules, so that they can be revealed by the QCM, and

Conclusions
69
it inherently increases the specificity of the whole device. A well-known issue of this procedure
is the decrease of the signal at high analyte concentration which can be easily solved by rising
antibody concentration in the mixing volume. These immunosensors provide LODs of 50 nM
and 140 nM for parathion and patulin, respectively. PIT has been involved also in developing
a label-free immunosensor for detecting gliadin, the protein responsible for the coeliac disease.
This QCM-based immunosensor achieves a LOD 13 ppm and can be significantly improved by
introducing a sandwich type labelling. It is worth noticing that QCM-based immunosensors
have non-negligible advantages in terms of rapidity in the response (only few minutes are
required), flexibility and portability, thus making themselves valuable tools for in situ analysis.
In view of the results presented in this work, PIT have proven to be an effective and
promising technology to couple biological sensitive elements with gold and thiol-reactive
surfaces. In principle, since other transduction principles involve gold surfaces (e.g.
electrochemical methods, SPR devices), PIT could be considered a valid alternative to more
complex and laborious surface functionalization procedures.
References
70
References
1. Ballantine, Jr., D. S. et al. Acoustic Wave Sensors: Theory, Design, and Physico-
Chemical Applications. (Academic Press, 1997).
2. Turner, A. P. F., Karube, I. & Wilson, G. S. Biosensors: Fundamentals and Applications.
(Oxford University Press, 1987).
3. Grieshaber, D., MacKenzie, R., Vörös, J. & Reimhult, E. Electrochemical Biosensors -
Sensor Principles and Architectures. Sensors 8, 1400–1458 (2008).
4. Guth, U., Vonau, W. & Zosel, J. Recent developments in electrochemical sensor
application and technology-a review. Meas. Sci. Technol. 20, 042002 (2009).
5. Long, F., Zhu, A. & Shi, H. Recent Advances in Optical Biosensors for Environmental
Monitoring and Early Warning. Sensors 13, 13928–13948 (2013).
6. Fan, X. et al. Sensitive optical biosensors for unlabeled targets : A review. Anal. Chim.
Acta 620, 8–26 (2008).
7. Arlett, J. L., Myers, E. B. & Roukes, M. L. Comparative advantages of mechanical
biosensors. Nat. Nanotechnol. 6, 203–215 (2011).
8. Alvarez-lcaza, M. & Bilitewski, U. Mass Production of Biosensors. Anal. Chem. 65,
525–533 (1993).
9. Clark, Jr., L. C. & Lyons, C. Electrode systems for continuous monitoring in
cardiovascular surgery. Ann. N. Y. Acad. Sci. 102, 29–45 (1962).
10. Cooper, M. A. & Singleton, V. T. Review A survey of the 2001 to 2005 quartz crystal
microbalance biosensor literature : applications of acoustic physics to the analysis of
biomolecular interactions. J. Mol. Recognit. 20, 154–184 (2007).
11. Becker, B. & Cooper, M. A survey of the 2006-2009 quartz crystal microbalance
biosensor literature. J. Mol. Recognit. 24, 754–787 (2011).
12. Vashist, S. K. & Vashist, P. Recent Advances in Quartz Crystal Microbalance-Based
Sensors. J. Sensors 2011, 1–13 (2011).
13. Deakin, M. R. & Buttry, D. A. Applications of the Quartz Crystal Micro balance. Anal.
Chem. 61, 1147A–1154A (1989).
14. Longobardi, S. et al. A simple MALDI plate functionalization by Vmh2 hydrophobin
for serial multi-enzymatic protein digestions. Anal. Bioanal. Chem. 407, 487–496
(2015).
15. Sauerbrey, G. Verwendung von Schwingquarzen zur Wäigung diinner Schichten und zur
Mikrowäigung. Z. Phys. 155, 206–222 (1959).
References
71
16. Kanazawa, K. K. & Gordon, J. G. Frequency of a Quartz Microbalance in Contact with
Liquid. Anal. Chem. 57, 1770–1771 (1985).
17. Voinova, M. V. On mass loading and dissipation measured with acoustic wave sensors:
a review. J. Sensors 2009, 943125 (2009).
18. Reviakine, I., Johannsmann, D. & Richter, R. P. Hearing What You Cannot See and
Visualizing What You Hear: Interpreting Quartz Crystal Microbalance Data from
Solvated Interfaces. Anal. Chem. 83, 8838–8848 (2011).
19. Jung, Y., Jeong, J. Y. & Chung, B. H. Recent advances in immobilization methods of
antibodies on solid supports. Analyst 133, 697–701 (2008).
20. Nicu, L. & Leichle, T. Biosensors and tools for surface functionalization from the macro-
to the nanoscale: The way forward. J. Appl. Phys. 104, 111101 (2008).
21. Trilling, A. K., Harmsen, M. M., Ruigrok, V. J. B., Zuilhof, H. & Beekwilder, J. The
effect of uniform capture molecule orientation on biosensor sensitivity: dependence on
analyte properties. Biosens. Bioelectron. 40, 219–226 (2013).
22. Wilson, D. S. & Nock, S. Functional protein microarrays. Curr. Opin. Chem. Biol. 6,
81–85 (2001).
23. Vijayendran, R. A. & Leckband, D. E. A quantitative assessment of heterogeneity for
surface-immobilized proteins. Anal. Chem. 73, 471–480 (2001).
24. Neves-Petersen, M. T., Gajula, G. P. & Petersen, S. B. in Molecular Photochemistry -
Various Aspects 125–158 (2012). doi:10.5772/37947
25. Wink, T., van Zuilen, S. J., Bult, A. & van Bennkom, W. P. Self-assembled monolayers
for biosensors. Analyst 122, 43R–50R (1997).
26. Gooding, J. J. & Darwish, N. The rise of self-assembled monolayers for fabricating
electrochemical biosensors-an interfacial perspective. Chem. Rec. 12, 92–105 (2012).
27. Caruso, F., Rodda, E. & Furlong, D. N. Orientational Aspects of Antibody
Immobilization and Immunological Activity on Quartz Crystal Microbalance Electrodes.
J. Colloid Interface Sci. 178, 104–115 (1996).
28. Přibyl, J., Hepel, M., Halámek, J. & Skládal, P. Development of piezoelectric
immunosensors for competitive and direct determination of atrazine. Sens. Actuators B
91, 333–341 (2003).
29. Hao, R. et al. Rapid detection of Bacillus anthracis using monoclonal antibody
functionalized QCM sensor. Biosens. Bioelectron. 24, 1330–1335 (2009).
30. Sharma, H. & Mutharasan, R. Half Antibody Fragments Improve Biosensor Sensitivity
without Loss of Selectivity. Anal. Chem. 85, 2472–2477 (2013).
References
72
31. Byrne, B., Stack, E., Gilmartin, N. & O’Kennedy, R. Antibody-based sensors: principles,
problems and potential for detection of pathogens and associated toxins. Sensors 9,
4407–4445 (2009).
32. Jiang, X. et al. Immunosensors for detection of pesticide residues. Biosens. Bioelectron.
23, 1577–1587 (2008).
33. Wang, Y., Knoll, W. & Dostalek, J. Bacterial pathogen surface plasmon resonance
biosensor advanced by long range surface plasmons and magnetic nanoparticle assays.
Anal. Chem. 84, 8345–8350 (2012).
34. Neves-Petersen, M. T., Snabe, T., Klitgaard, S., Duroux, M. E. G. & Petersen, S. B.
Photonic activation of disulfide bridges achieves oriented protein immobilization on
biosensor surfaces. Protein Sci. 15, 343–351 (2006).
35. Snabe, T., Røder, G. A., Neves-Petersen, M. T., Buus, S. & Petersen, S. B. Oriented
coupling of major histocompatibility complex (MHC) to sensor surfaces using light
assisted immobilisation technology. Biosens. Bioelectron. 21, 1553–1559 (2006).
36. Ioerger, T. R., Du, C. & Linthicum, D. S. Conservation of cys-cys trp structural triads
and their geometry in the protein domains of immunoglobulin superfamily members.
Mol. Immunol. 36, 373–386 (1999).
37. Parracino, A. et al. Arraying prostate specific antigen PSA and Fab anti-PSA using light-
assisted molecular immobilization technology. Protein Sci. 19, 1751–1759 (2010).
38. Correia, M., Neves-Petersen, M. T., Parracino, A., di Gennaro, A. K. & Petersen, S. B.
Photophysics, photochemistry and energetics of UV light induced disulphide bridge
disruption in apo-α-lactalbumin. J. Fluoresc. 22, 323–337 (2012).
39. Janeway, Jr., C. A., Travers, P., Walport, M. & Shlomchik, M. J. Immunobiology.
(Garland Science, 2001).
40. Harris, L. J., Skaletsky, E. & McPherson, A. Crystallographic structure of an intact IgG1
monoclonal antibody. J. Mol. Biol. 275, 861–872 (1998).
41. Köhler, G. & Milstein, C. Continuous cultures of fused cells secreting antibody of
predefined specificity. Nature 256, 495–497 (1975).
42. Roque, A. C. A., Lowe, C. R. & Taipa, M. Â. Antibodies and genetically engineered
related molecules: Production and purification. Biotechnol. Prog. 20, 639–654 (2004).
43. Geschwindner, S., Carlsson, J. F. & Knecht, W. Application of optical biosensors in
small-molecule screening activities. Sensors 12, 4311–4323 (2012).
44. Jones, A. M. et al. In vivo biochemistry: Applications for small molecule biosensors in
plant biology. Curr. Opin. Plant Biol. 16, 389–395 (2013).
45. Alberts, B. et al. Molecular Biology of the Cell. (Garland Science, 2002).

References
73
46. Milles, H. L., Salt, H. & B. Parathion Poisoning. Br. Med. J. 2, 444 (1950).
47. Jokanović, M. & Prostran, M. Pyridinium oximes as cholinesterase reactivators.
Structure-activity relationship and efficacy in the treatment of poisoning with
organophosphorus compounds. Curr. Med. Chem. 16, 2177–2188 (2009).
48. Balali-Mood, M. & Shariat, M. Treatment of organophosphate poisoning. Experience of
nerve agents and acute pesticide poisoning on the effects of oximes. J. Physiol. 92, 375–
378 (1998).
49. Johnson, M. K. et al. Evaluation of antidotes for poisoning by organophosphorus
pesticides. Emerg. Med. 12, 22–37 (2000).
50. Eddleston, M., Buckley, N. A., Eyer, P. & Dawson, A. H. Management of acute
organophosphorus pesticide poisoning. Lancet 371, 597–607 (2008).
51. Antonijevic, B. & Stojiljkovic, M. P. Unequal efficacy of pyridinium oximes in acute
organophosphate poisoning. Clin. Med. Res. 5, 71–82 (2007).
52. Kwakman, P. J. M., Vreuls, J. J., Brinkman, U. A. T. & Ghijsen, R. T. Determination of
Organophosphorus Pesticides in Aqueous Samples by On-Line Membrane Disk
Extraction and Capillary Gas Chromatography. Chromatographia 34, 41–47 (1992).
53. Carabias Martinez, R., Rodriguez Gonzalo, E., Amigo Moran, M. J. & Hernandez
Mendez, J. Sensitive method for the determination of organophosphorus pesticides in
fruits and surface waters by high-performance liquid chromatography with ultraviolet
detection. J. Chromatogr. 607, 37–45 (1992).
54. Blasco, C., Fernández, M., Picó, Y. & Font, G. Comparison of solid-phase
microextraction and stir bar sorptive extraction for determining six organophosphorus
insecticides in honey by liquid chromatography-mass spectrometry. J. Chromatogr. A
1030, 77–85 (2004).
55. Walker, J. P. & Asher, S. A. Acetylcholinesterase-Based Organophosphate Nerve Agent
Sensing Photonic Crystal. Anal. Chem. 77, 1596–1600 (2005).
56. Stoytcheva, M., Zlatev, R., Gochev, V., Velkova, Z. & Montero, G. Amperometric
biosensor precision improvement: application to organophosphorus pesticide
determination. Anal. Methods 6, 8232–8238 (2014).
57. Marrazza, G. Piezoelectric Biosensors for Organophosphate and Carbamate Pesticides:
A Review. Biosensors 4, 301–317 (2014).
58. Bi, X. & Yang, K.-L. On-line monitoring imidacloprid and thiacloprid in celery juice
using quartz crystal microbalance. Anal. Chem. 81, 527–532 (2009).
59. March, C., Manclús, J. J., Jiménez, Y., Arnau, a. & Montoya, a. A piezoelectric
immunosensor for the determination of pesticide residues and metabolites in fruit juices.
Talanta 78, 827–833 (2009).

References
74
60. Jia, K., Adam, P. M. & Ionescu, R. E. Sequential acoustic detection of atrazine herbicide
and carbofuran insecticide using a single micro-structured gold quartz crystal
microbalance. Sens. Actuators B 188, 400–404 (2013).
61. Fox, E. M. & Howlett, B. J. Secondary metabolism: regulation and role in fungal biology.
Curr. Opin. Microbiol. 11, 481–487 (2008).
62. Keller, N. P., Turner, G. & Bennett, J. W. Fungal secondary metabolism - from
biochemistry to genomics. Nat. Rev. Microbiol. 3, 937–947 (2005).
63. Puel, O., Galtier, P. & Oswald, I. P. Biosynthesis and toxicological effects of patulin.
Toxins 2, 613–631 (2010).
64. Shephard, G. S. et al. Developments in mycotoxin analysis: an update for 2009-2010.
World Mycotoxin J. 4, 3–28 (2011).
65. Pereira, V. L., Fernandes, J. O. & Cunha, S. C. Mycotoxins in cereals and related
foodstuffs: A review on occurrence and recent methods of analysis. Trends Food Sci.
Technol. 36, 96–136 (2014).
66. Vidal, J. C. et al. Electrochemical affinity biosensors for detection of mycotoxins: A
review. Biosens. Bioelectron. 49, 146–158 (2013).
67. Pohanka, M., Jun, D. & Kuca, K. Mycotoxin assays using biosensor technology: a
review. Drug Chem. Toxicol. 30, 253–261 (2007).
68. Prieto-Simón, B. & Campàs, M. Immunochemical tools for mycotoxin detection in food.
Monatsh. Chem. 140, 915–920 (2009).
69. De Champdoré, M. et al. A new competitive fluorescence assay for the detection of
patulin toxin. Anal. Chem. 79, 751–757 (2007).
70. Damián Chanique, G., Arévalo, A. H., Zon, M. A. & Fernandez, H. Eletrochemical
reduction of patulin and 5-hydroxymethylfurfural in both neutral and acid non-aqueous
media. Their electroanalytical determination in apple juices. Talanta 111, 85–92 (2013).
71. Starodub, N. F. & Slishek, N. F. Nano-Porous Silicon Based Immune Biosensor for the
Control of Level of Mycotoxins. Adv. Biosens. Bioelectron. 2, 7–15 (2013).
72. Pennacchio, A. et al. A surface plasmon resonance based biochip for the detection of
patulin toxin. Opt. Mater. 36, 1670–1675 (2014).
73. Pilolli, R., Monaci, L. & Visconti, A. Advances in biosensor development based on
integrating nanotechnology and applied to food-allergen management. Trends Anal.
Chem. 47, 12–26 (2013).
74. Leonard, P. et al. Advances in biosensors for detection of pathogens in food and water.
Enzyme Microb. Technol. 32, 3–13 (2003).

References
75
75. Mello, L. D. & Kubota, L. T. Review of the use of biosensors as analytical tools in the
food and drink industries. Food Chem. 77, 237–256 (2002).
76. Mowat, A. M. Coeliac disease - A meeting point for genetics, immunology, and protein
chemistry. Lancet 361, 1290–1292 (2003).
77. Beaudoin, K. & Willoughby, D. S. The Role of the Gluten-Derived Peptide Gliadin in
Celiac Disease. J. Nutr. Heal. Food Eng. 1, 1–4 (2014).
78. Tack, G. J., Verbeek, W. H. M., Schreurs, M. W. J. & Mulder, C. J. J. The spectrum of
celiac disease: epidemiology, clinical aspects and treatment. Nat. Rev. Gastroenterol.
Hepatol. 7, 204–213 (2010).
79. Allmann, M., Candrian, U., Höfelein, C. & Lüthy, J. Polymerase chain reaction (PCR):
a possible alternative to immunochemical methods assuring safety and quality of food
Detection of wheat contamination in non-wheat food products. Z. Lebensm. Unters.
Forsch. 196, 248–251 (1993).
80. Köppel, E., Stadler, M., Luthy, J. & Hubner, P. Detection of wheat contamination in oats
by polymerase chain reaction (PCR) and enzyme-linked immunosorbent assay (ELISA).
Z. Leb. Unters. Forsch. 206, 399–403 (1998).
81. Nicolas, Y., Martinant, J. P., Denery-Papini, S. & Popineau, Y. Analysis of wheat storage
proteins by exhaustive sequential extraction followed by RP-HPLC and nitrogen
determination. J. Sci. Food Agric. 77, 96–102 (1998).
82. Valdés, I., García, E., Llorente, M. & Méndez, E. Innovative approach to low-level
gluten determination in foods using a novel sandwich enzyme-linked immunosorbent
assay protocol. Eur. J. Gastroenterol. Hepatol. 15, 465–474 (2003).
83. De Stefano, L. et al. Glutamine-binding protein from Escherichia coli specifically binds
a wheat gliadin peptide. 2. Resonance energy transfer studies suggest a new sensing
approach for an easy detection of wheat gliadin. J. Proteome Res. 5, 1241–1245 (2006).
84. Nassef, H. M., Civit, L., Fragoso, A. & O’Sullivan, C. K. Amperometric immunosensor
for detection of celiac disease toxic gliadin based on fab fragments. Anal. Chem. 81,
5299–5307 (2009).
85. Chu, P.-T., Lin, C.-S., Chen, W.-J., Chen, C.-F. & Wen, H.-W. Detection of Gliadin in
Foods Using a Quartz Crystal Microbalance. J. Agric. Food Chem. 60, 6483–6492
(2012).
86. Maffini, M. V., Rubin, B. S., Sonnenschein, C. & Soto, A. M. Endocrine disruptors and
reproductive health: The case of bisphenol-A. Mol. Cell. Endocrinol. 254-255, 179–186
(2006).
87. Soares, A., Guieysse, B., Jefferson, B., Cartmell, E. & Lester, J. N. Nonylphenol in the
environment: A critical review on occurrence, fate, toxicity and treatment in
wastewaters. Environ. Int. 34, 1033–1049 (2008).

References
76
88. Della Ventura, B., Schiavo, L., Altucci, C., Esposito, R. & Velotta, R. Light assisted
antibody immobilization for bio-sensing. Biomed. Opt. Express 2, 3223–3231 (2011).
89. Neves-Petersen, M. T. et al. High probability of disrupting a disulphide bridge mediated
by an endogenous excited tryptophan residue. Protein Sci. 11, 588–600 (2002).
90. Kerwin, B. A. & Remmele, Jr., R. L. Protect from light: photo- degradation and protein
biologics. J. Pharm. Sci. 96, 1468–1479 (2007).
91. Bent, D. V & Hayon, E. Excited state chemistry of aromatic amino acids and related
peptides. III. Tryptophan. J. Am. Chem. Soc. 97, 2612–2619 (1975).
92. Neves-Petersen, M. T. et al. Flash photolysis of cutinase: Identification and decay
kinetics of transient intermediates formed upon UV excitation of aromatic residues.
Biophys. J. 97, 211–226 (2009).
93. Sherin, P. S., Snytnikova, O. a. & Tsentalovich, Y. P. Tryptophan photoionization from
prefluorescent and fluorescent states. Chem. Phys. Lett. 391, 44–49 (2004).
94. Funari, R. et al. Detection of Parathion Pesticide by Quartz Crystal Microbalance
Functionalized with UV-Activated Antibodies. Anal. Chem. 85, 6392–6397 (2013).
95. Funari, R. et al. Detection of parathion and patulin by quartz-crystal microbalance
functionalized by the photonics immobilization technique. Biosens. Bioelectron. 67,
224–229 (2015).
96. Ellman, G. L. Tissue sulfhydryl groups. Arch. Biochem. Biophys. 82, 70–77 (1959).
97. Riddles, P. W., Blakeley, R. L. & Zerner, B. Reassessment of Ellman’s reagent. Methods
Enzymol. 91, 49–60 (1983).
98. Riener, C. K., Kada, G. & Gruber, H. J. Quick measurement of protein sulfhydryls with
Ellman’s reagent and with 4,4'-dithiodipyridine. Anal. Bioanal. Chem. 373, 266–276
(2002).
99. Lettieri, S. et al. Nano- and femtosecond UV laser pulses to immobilize biomolecules
onto surfaces with preferential orientation. Appl. Phys. A 117, 185–190 (2014).
100. Garidel, P., Hegyi, M., Bassarab, S. & Weichel, M. A rapid, sensitive and economical
assessment of monoclonal antibody conformational stability by intrinsic tryptophan
fluorescence spectroscopy. Biotechnol. J. 3, 1201–1211 (2008).
101. Höök, F. et al. A comparative study of protein adsorption on titanium oxide surfaces
using in situ ellipsometry, optical waveguide lightmode spectroscopy, and quartz crystal
microbalance/dissipation. Colloids Surf. B 24, 155–170 (2002).
102. Wiseman, M. E. & Frank, C. W. Antibody adsorption and orientation on hydrophobic
surfaces. Langmuir 28, 1765–1774 (2012).
References
77
103. Trilling, A. K., Beekwilder, J. & Zuilhof, H. Antibody orientation on biosensor surfaces:
a minireview. Analyst 138, 1619–1627 (2013).
104. San Paulo, A. & García, R. High-resolution imaging of antibodies by tapping-mode
atomic force microscopy: attractive and repulsive tip-sample interaction regimes.
Biophys. J. 78, 1599–1605 (2000).
105. Müller, D. J. & Engel, A. The height of biomolecules measured with the atomic force
microscope depends on electrostatic interactions. Biophys. J. 73, 1633–1644 (1997).
106. Balmer, T. E., Christenson, H. K., Spencer, N. D. & Heuberger, M. The effect of surface
ions on water adsorption to mica. Langmuir 24, 1566–1569 (2008).
107. Moreno-Herrero, F., Colchero, J. & Baró, A. M. DNA height in scanning force
microscopy. Ultramicroscopy 96, 167–174 (2003).
108. Santos, S., Barcons, V., Christenson, H. K., Font, J. & Thomson, N. H. The intrinsic
resolution limit in the atomic force microscope: Implications for heights of nano-scale
features. PLoS One 6, e23821 (2011).
109. Crowther, J. R. ELISA: Theory and practice. (Humana Press, 1995).
110. Nelson, D. L. & Cox, M. M. Lehninger, Principles of Biochemistry. (Freeman, 2005).
111. Peluso, P. et al. Optimizing antibody immobilization strategies for the construction of
protein microarrays. Anal. Biochem. 312, 113–124 (2003).
112. Amarasiri Fernando, S. & Wilson, G. S. Studies of the ‘hook’ effect in the one-step
sandwich immunoassay. J. Immunol. Methods 151, 47–66 (1992).
113. Schramm, W. & Paek, S. H. Antibody-antigen complex formation with immobilized
immunoglobulins. Anal. Biochem. 205, 47–56 (1992).
114. Barak, S., Mudgil, D. & Khatkar, B. S. Biochemical and Functional Properties of Wheat
Gliadins: A Review. Crit. Rev. Food Sci. Nutr. 55, 357–368 (2015).
115. Paananen, A. et al. Nanomechanical Force Measurements of Gliadin Protein
Interactions. Biopolymers 83, 658–667 (2006).
List of publications
78
List of publications
1. R. Funari, B. Della Ventura, L. Schiavo, R. Esposito, C. Altucci and R. Velotta
- “Detection of Parathion Pesticide by Quartz Crystal Microbalance
Functionalized with UV-Activated Antibodies” Anal. Chem., 85, 6392–6397
(2013), DOI: 10.1021/ac400852c.
2. S. Lettieri, A. Avitabile, B. Della Ventura, R. Funari, A. Ambrosio, P.
Maddalena, M. Valadan, R. Velotta, C. Altucci - “Nano- and femtosecond UV
laser pulses to immobilize biomolecules onto surfaces with preferential
orientation” Appl. Phys. A, 117, 185-190 (2014), DOI: 10.1007/s00339-014-
8340-4.
3. R. Funari, B. Della Ventura, R. Carrieri, L. Morra, E. Lahoz, F. Gesuele, C.
Altucci, R. Velotta -“Detection of parathion and patulin by quartz-crystal
microbalance functionalized by the photonics immobilization technique” Bios.
Bioelectron., 67, 224-229 (2015), DOI: 10.1016/j.bios.2014.08.020.
4. S. Longobardi, A. M. Gravagnuolo, R. Funari, B. Della Ventura, F. Pane, E.
Galano, A. Amoresano, G. Marino, P. Giardina - “A simple MALDI plate
functionalization by Vmh2 hydrophobin for serial multi-enzymatic protein
digestions” Anal. Bioanal. Chem., 407, 487-496 (2015), DOI: 10.1007/s00216-
014-8309-3.
5. B. Della Ventura, R. Funari, Anoop K.K, S. Amoruso, F.Gesuele, R. Velotta,
and C. Altucci, “Nano-machining of bio-sensor electrodes through gold
nanoparticles deposition produced by femtosecond laser ablation” Appl. Phys. B,
(2015), In Press, DOI: 10.1007/s00340-015-6091-3.
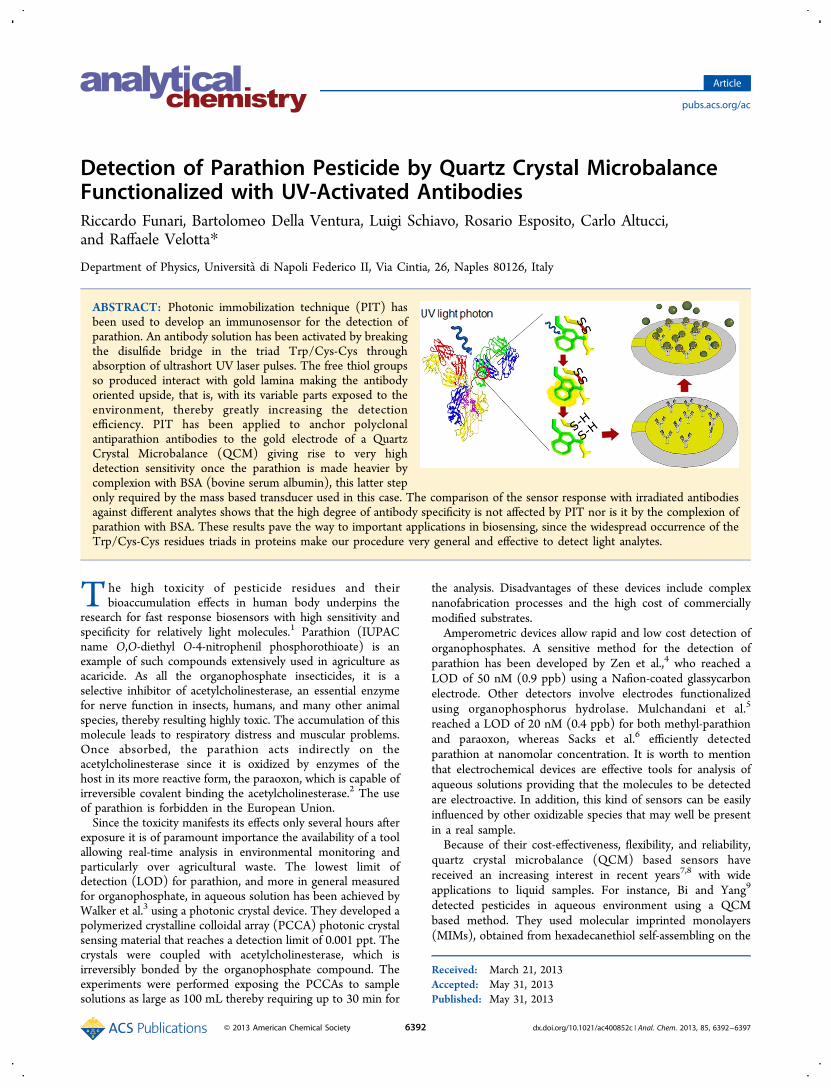
Detection of Parathion Pesticide by Quartz Crystal MicrobalanceFunctionalized with UV-Activated AntibodiesRiccardo Funari, Bartolomeo Della Ventura, Luigi Schiavo, Rosario Esposito, Carlo Altucci,and Raffaele Velotta*
Department of Physics, Universita di Napoli Federico II, Via Cintia, 26, Naples 80126, Italy
ABSTRACT: Photonic immobilization technique (PIT) hasbeen used to develop an immunosensor for the detection ofparathion. An antibody solution has been activated by breakingthe disulfide bridge in the triad Trp/Cys-Cys throughabsorption of ultrashort UV laser pulses. The free thiol groupsso produced interact with gold lamina making the antibodyoriented upside, that is, with its variable parts exposed to theenvironment, thereby greatly increasing the detectionefficiency. PIT has been applied to anchor polyclonalantiparathion antibodies to the gold electrode of a QuartzCrystal Microbalance (QCM) giving rise to very highdetection sensitivity once the parathion is made heavier bycomplexion with BSA (bovine serum albumin), this latter steponly required by the mass based transducer used in this case. The comparison of the sensor response with irradiated antibodiesagainst different analytes shows that the high degree of antibody specificity is not affected by PIT nor is it by the complexion ofparathion with BSA. These results pave the way to important applications in biosensing, since the widespread occurrence of theTrp/Cys-Cys residues triads in proteins make our procedure very general and effective to detect light analytes.
The high toxicity of pesticide residues and theirbioaccumulation effects in human body underpins the
research for fast response biosensors with high sensitivity andspecificity for relatively light molecules.1 Parathion (IUPACname O,O-diethyl O-4-nitrophenil phosphorothioate) is anexample of such compounds extensively used in agriculture asacaricide. As all the organophosphate insecticides, it is aselective inhibitor of acetylcholinesterase, an essential enzymefor nerve function in insects, humans, and many other animalspecies, thereby resulting highly toxic. The accumulation of thismolecule leads to respiratory distress and muscular problems.Once absorbed, the parathion acts indirectly on theacetylcholinesterase since it is oxidized by enzymes of thehost in its more reactive form, the paraoxon, which is capable ofirreversible covalent binding the acetylcholinesterase.2 The useof parathion is forbidden in the European Union.Since the toxicity manifests its effects only several hours after
exposure it is of paramount importance the availability of a toolallowing real-time analysis in environmental monitoring andparticularly over agricultural waste. The lowest limit ofdetection (LOD) for parathion, and more in general measuredfor organophosphate, in aqueous solution has been achieved byWalker et al.3 using a photonic crystal device. They developed apolymerized crystalline colloidal array (PCCA) photonic crystalsensing material that reaches a detection limit of 0.001 ppt. Thecrystals were coupled with acetylcholinesterase, which isirreversibly bonded by the organophosphate compound. Theexperiments were performed exposing the PCCAs to samplesolutions as large as 100 mL thereby requiring up to 30 min for
the analysis. Disadvantages of these devices include complexnanofabrication processes and the high cost of commerciallymodified substrates.Amperometric devices allow rapid and low cost detection of
organophosphates. A sensitive method for the detection ofparathion has been developed by Zen et al.,4 who reached aLOD of 50 nM (0.9 ppb) using a Nafion-coated glassycarbonelectrode. Other detectors involve electrodes functionalizedusing organophosphorus hydrolase. Mulchandani et al.5
reached a LOD of 20 nM (0.4 ppb) for both methyl-parathionand paraoxon, whereas Sacks et al.6 efficiently detectedparathion at nanomolar concentration. It is worth to mentionthat electrochemical devices are effective tools for analysis ofaqueous solutions providing that the molecules to be detectedare electroactive. In addition, this kind of sensors can be easilyinfluenced by other oxidizable species that may well be presentin a real sample.Because of their cost-effectiveness, flexibility, and reliability,
quartz crystal microbalance (QCM) based sensors havereceived an increasing interest in recent years7,8 with wideapplications to liquid samples. For instance, Bi and Yang9
detected pesticides in aqueous environment using a QCMbased method. They used molecular imprinted monolayers(MIMs), obtained from hexadecanethiol self-assembling on the
Received: March 21, 2013Accepted: May 31, 2013Published: May 31, 2013
Article
pubs.acs.org/ac
© 2013 American Chemical Society 6392 dx.doi.org/10.1021/ac400852c | Anal. Chem. 2013, 85, 6392−6397

QCM gold electrode, to detect imidacloprid and thiacloprid incelery juice reaching a LOD of 1 μM by using an extremelysensitive QCM apparatus with a resolution of 0.1 Hz. Marx etal.10 developed a sol−gel functionalization method based onMIP (molecularly imprinted polymer) films for the detection ofparathion. They applied this technique for the development ofboth cyclic voltammetry devices and QCM based sensors, butdespite their high sensitivity, sol−gel-based functionalizationscan be easily affected by cross-sensitivity phenomena.The sensor specificity is inherently warranted when antibod-
ies are used as linkers, but in this case, the surfacefunctionalization becomes a crucial phase in the realization ofthe sensor, the antibody orientation being one of the mainissues.11 Usually a biological molecule moves into aqueousenvironment and its functions are characterized by parameters,which can change significantly when the same molecule is,instead, immobilized. So, there is a strong interest in theresearch of new immobilization and functionalization techni-ques which allows better sensitivity and lower LOD aswitnessed by the vast literature on this topics.12,13
The most suitable functionalization procedure depends bothon the nature of the biological sensitive element and on thetransduction principle. Besides that, functionalization of goldlaminas entices many efforts in view of their use not only inQCM-based immunosensors14−17 but also in surface plasmonresonance (SPR).18−20 Moreover, gold is an inert metal havinga low tendency to oxidize and is biocompatible and easilycleaned by chemical treatments such as piranha solution (amixture of sulfuric acid and hydrogen peroxide). The stability ofgold−sulfur interaction is one of the mechanisms exploited toimmobilize molecules on a support, since the only requirementis the availability of a thiol group. To this end, it is possible bothto use a chemical marker of the molecule, usually easy to realizeby chemical synthesis, or to exploit existing thiol groups withinproteins and peptides.21
UV induced immobilization is a novel technology that resultsin spatially oriented and spatially localized anchoring ofbiomolecules onto thiol-reactive surfaces as demonstrated byNeves-Petersen et al.22 The reaction mechanism behind thisimmobilization technique involves the photonic activation ofdisulfide bridges, that is, the light-induced breakage of disulfidebridges in proteins through UV illumination of nearby aromaticamino acids.In a previous paper, we have demonstrated that no
pretreatment to the surface is necessary, the presence of thisstructural characteristic being the only condition required toapply this approach that we will refer as photonicimmobilization technique (PIT).23 The mechanism of photonicactivation of the Trp/Cys-Cys triads and the crystallographicstructure of a type G immunoglobulin (IgG)24 are shown infigure 1. Basically, the UV photon energy is absorbed byTryptophan and then transferred to the close Cys-Cys therebyforming free reactive thiol groups which interact with thiol-reactive surfaces (like gold plates or surfaces treated withalkanethiols). Thus, the “driving force” for a possible side-uporientation of the antibody onto the gold surface is provided bythe open disulfide bridges; these are produced in a selective waybecause the occurrence of a solvent accessible triad Try/Cys-Cys, which is required by PIT, is limited to interdomainregion.22
The UV radiation may reduce or vanish the biological activityof proteins and enzymes, causing also structural changes in thebiomolecules,25 but PIT preserves the native structure and the
functional properties of the immobilized proteins while favoringthe proper orientation of the biomolecule on the support,23 andthis is achieved by avoiding any chemical and thermaltreatment.One of the advantages of PIT relies in the wide field of
application since the closely spaced triad of residues Trp/Cys−Cys is present in all members of the immunoglobulinsuperfamily. Every IgG has twelve intradomain disulfide bridgesnear a tryptophan residue, one of them being present in everydomain of the protein. It is likely to induce the opening of thesedisulfide bonds through UV irradiation of the near aromaticresidue. With the breaking of these disulfide bridges there is anincrease of free thiol groups, which can react with a gold orthiol-rich surface. The same geometry of the Trp/Cys−Cystriad is observable in structures of several IgSF (immunoglo-bulin superfamily) molecules as well as in TCRs (T cellreceptors), MHCs (major histocompatibility complex),26 cellsurface antigens (CD4 and CD8), and various cell-adhesionmolecules. It is suggested that the conservation of thegeometrical relationship between this three aminoacids is dueto the role played by tryptophan in stabilizing or protecting thedisulfide bridge.27
The proof of principle of PIT reported in our previous paperconcerned the detection of murine immunoglobulin by QCMbased immunosensor for which the sensitivity improved only bya factor of 2.23 This result is in agreement with the findingsreported in a recent paper by Trilling et al.28 who show that theeffect of the antibody orientation on the capture of the analyteis strongly dependent on the mass of the analyte. In particular,lighter analytes are more sensitive to the side-up orientation ofthe antibodies, so that PIT can render effective severaltechniques (e.g., QCM) otherwise impractical.In this paper, we demonstrate how PIT improves the
sensitivity of a QCM by about 1 order of magnitude comparedto that achieved when the antibodies are tethered randomlyoriented. The main drawback of a mass-based transducer likeQCM in detecting light molecules (parathion weighs onlyabout 300 Da), is the small frequency shift associated with theirtethering to the antibody. We overcame this problem through aprocedure that makes the molecules heavier so that a LOD of 4ppb was achieved with an analysis requiring less than 10 min.We also demonstrate that PIT does not affect the specificity
Figure 1. UV photonic activation of a generic IgG (1IGY). (a) Theprotein solution is irradiated. (b) One UV photon is absorbed by atryptophan side-chain which transfers the energy to the near cysteines.(c) The disulfide bridge opens and the thiol groups so produced caneffectively interact with the gold surface.
Analytical Chemistry Article
dx.doi.org/10.1021/ac400852c | Anal. Chem. 2013, 85, 6392−63976393
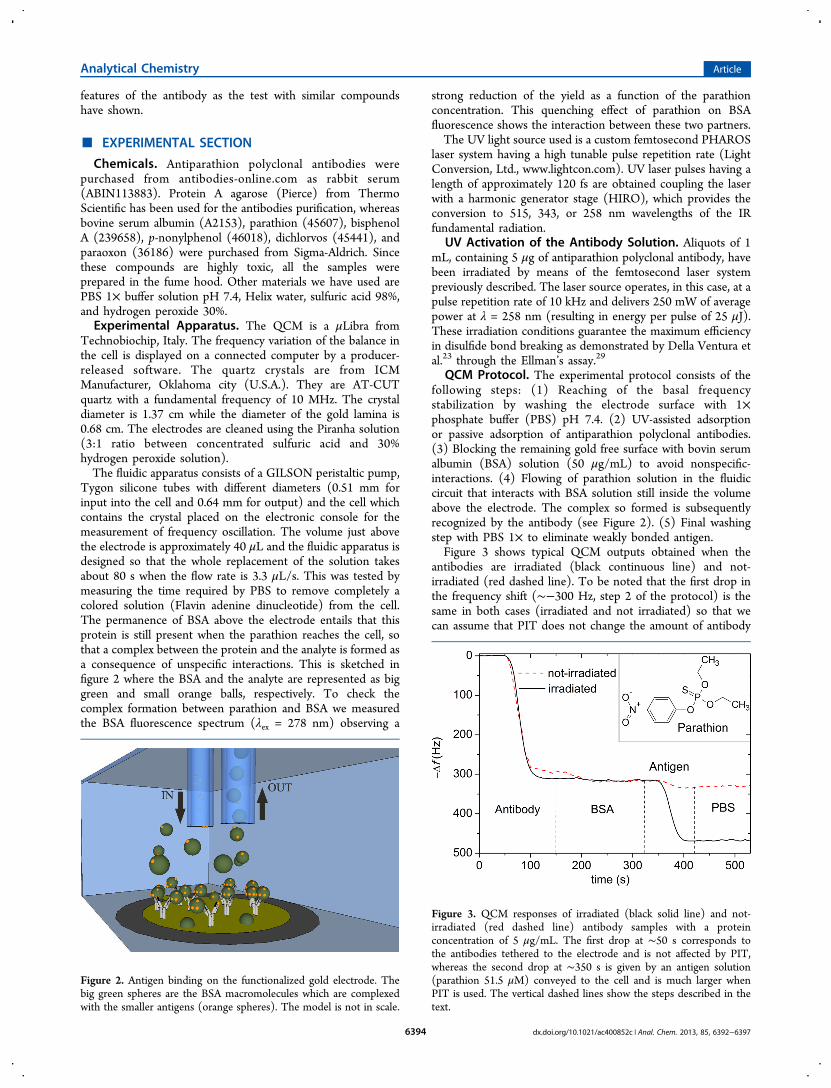
features of the antibody as the test with similar compoundshave shown.
■ EXPERIMENTAL SECTION
Chemicals. Antiparathion polyclonal antibodies werepurchased from antibodies-online.com as rabbit serum(ABIN113883). Protein A agarose (Pierce) from ThermoScientific has been used for the antibodies purification, whereasbovine serum albumin (A2153), parathion (45607), bisphenolA (239658), p-nonylphenol (46018), dichlorvos (45441), andparaoxon (36186) were purchased from Sigma-Aldrich. Sincethese compounds are highly toxic, all the samples wereprepared in the fume hood. Other materials we have used arePBS 1× buffer solution pH 7.4, Helix water, sulfuric acid 98%,and hydrogen peroxide 30%.Experimental Apparatus. The QCM is a μLibra from
Technobiochip, Italy. The frequency variation of the balance inthe cell is displayed on a connected computer by a producer-released software. The quartz crystals are from ICMManufacturer, Oklahoma city (U.S.A.). They are AT-CUTquartz with a fundamental frequency of 10 MHz. The crystaldiameter is 1.37 cm while the diameter of the gold lamina is0.68 cm. The electrodes are cleaned using the Piranha solution(3:1 ratio between concentrated sulfuric acid and 30%hydrogen peroxide solution).The fluidic apparatus consists of a GILSON peristaltic pump,
Tygon silicone tubes with different diameters (0.51 mm forinput into the cell and 0.64 mm for output) and the cell whichcontains the crystal placed on the electronic console for themeasurement of frequency oscillation. The volume just abovethe electrode is approximately 40 μL and the fluidic apparatus isdesigned so that the whole replacement of the solution takesabout 80 s when the flow rate is 3.3 μL/s. This was tested bymeasuring the time required by PBS to remove completely acolored solution (Flavin adenine dinucleotide) from the cell.The permanence of BSA above the electrode entails that thisprotein is still present when the parathion reaches the cell, sothat a complex between the protein and the analyte is formed asa consequence of unspecific interactions. This is sketched infigure 2 where the BSA and the analyte are represented as biggreen and small orange balls, respectively. To check thecomplex formation between parathion and BSA we measuredthe BSA fluorescence spectrum (λex = 278 nm) observing a
strong reduction of the yield as a function of the parathionconcentration. This quenching effect of parathion on BSAfluorescence shows the interaction between these two partners.The UV light source used is a custom femtosecond PHAROS
laser system having a high tunable pulse repetition rate (LightConversion, Ltd., www.lightcon.com). UV laser pulses having alength of approximately 120 fs are obtained coupling the laserwith a harmonic generator stage (HIRO), which provides theconversion to 515, 343, or 258 nm wavelengths of the IRfundamental radiation.
UV Activation of the Antibody Solution. Aliquots of 1mL, containing 5 μg of antiparathion polyclonal antibody, havebeen irradiated by means of the femtosecond laser systempreviously described. The laser source operates, in this case, at apulse repetition rate of 10 kHz and delivers 250 mW of averagepower at λ = 258 nm (resulting in energy per pulse of 25 μJ).These irradiation conditions guarantee the maximum efficiencyin disulfide bond breaking as demonstrated by Della Ventura etal.23 through the Ellman’s assay.29
QCM Protocol. The experimental protocol consists of thefollowing steps: (1) Reaching of the basal frequencystabilization by washing the electrode surface with 1×phosphate buffer (PBS) pH 7.4. (2) UV-assisted adsorptionor passive adsorption of antiparathion polyclonal antibodies.(3) Blocking the remaining gold free surface with bovin serumalbumin (BSA) solution (50 μg/mL) to avoid nonspecific-interactions. (4) Flowing of parathion solution in the fluidiccircuit that interacts with BSA solution still inside the volumeabove the electrode. The complex so formed is subsequentlyrecognized by the antibody (see Figure 2). (5) Final washingstep with PBS 1× to eliminate weakly bonded antigen.Figure 3 shows typical QCM outputs obtained when the
antibodies are irradiated (black continuous line) and not-irradiated (red dashed line). To be noted that the first drop inthe frequency shift (∼−300 Hz, step 2 of the protocol) is thesame in both cases (irradiated and not irradiated) so that wecan assume that PIT does not change the amount of antibody
Figure 2. Antigen binding on the functionalized gold electrode. Thebig green spheres are the BSA macromolecules which are complexedwith the smaller antigens (orange spheres). The model is not in scale.
Figure 3. QCM responses of irradiated (black solid line) and not-irradiated (red dashed line) antibody samples with a proteinconcentration of 5 μg/mL. The first drop at ∼50 s corresponds tothe antibodies tethered to the electrode and is not affected by PIT,whereas the second drop at ∼350 s is given by an antigen solution(parathion 51.5 μM) conveyed to the cell and is much larger whenPIT is used. The vertical dashed lines show the steps described in thetext.
Analytical Chemistry Article
dx.doi.org/10.1021/ac400852c | Anal. Chem. 2013, 85, 6392−63976394
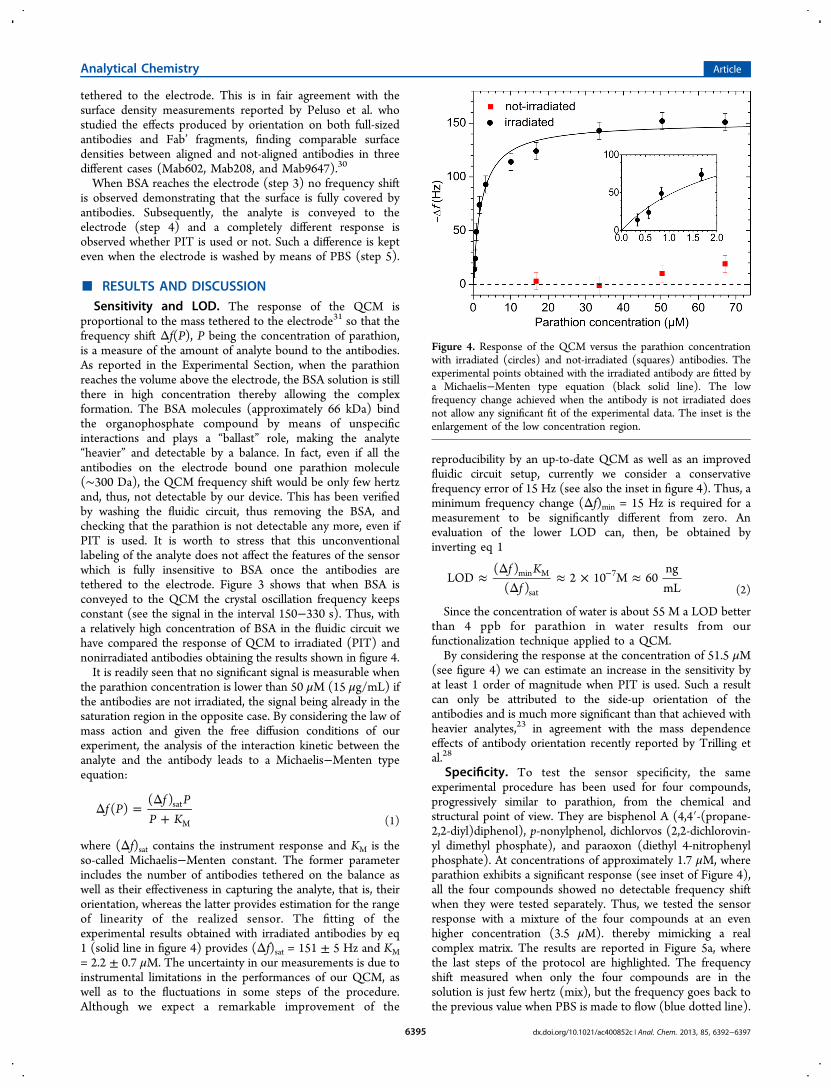
tethered to the electrode. This is in fair agreement with thesurface density measurements reported by Peluso et al. whostudied the effects produced by orientation on both full-sizedantibodies and Fab’ fragments, finding comparable surfacedensities between aligned and not-aligned antibodies in threedifferent cases (Mab602, Mab208, and Mab9647).30
When BSA reaches the electrode (step 3) no frequency shiftis observed demonstrating that the surface is fully covered byantibodies. Subsequently, the analyte is conveyed to theelectrode (step 4) and a completely different response isobserved whether PIT is used or not. Such a difference is kepteven when the electrode is washed by means of PBS (step 5).
■ RESULTS AND DISCUSSIONSensitivity and LOD. The response of the QCM is
proportional to the mass tethered to the electrode31 so that thefrequency shift Δf(P), P being the concentration of parathion,is a measure of the amount of analyte bound to the antibodies.As reported in the Experimental Section, when the parathionreaches the volume above the electrode, the BSA solution is stillthere in high concentration thereby allowing the complexformation. The BSA molecules (approximately 66 kDa) bindthe organophosphate compound by means of unspecificinteractions and plays a “ballast” role, making the analyte“heavier” and detectable by a balance. In fact, even if all theantibodies on the electrode bound one parathion molecule(∼300 Da), the QCM frequency shift would be only few hertzand, thus, not detectable by our device. This has been verifiedby washing the fluidic circuit, thus removing the BSA, andchecking that the parathion is not detectable any more, even ifPIT is used. It is worth to stress that this unconventionallabeling of the analyte does not affect the features of the sensorwhich is fully insensitive to BSA once the antibodies aretethered to the electrode. Figure 3 shows that when BSA isconveyed to the QCM the crystal oscillation frequency keepsconstant (see the signal in the interval 150−330 s). Thus, witha relatively high concentration of BSA in the fluidic circuit wehave compared the response of QCM to irradiated (PIT) andnonirradiated antibodies obtaining the results shown in figure 4.It is readily seen that no significant signal is measurable when
the parathion concentration is lower than 50 μM (15 μg/mL) ifthe antibodies are not irradiated, the signal being already in thesaturation region in the opposite case. By considering the law ofmass action and given the free diffusion conditions of ourexperiment, the analysis of the interaction kinetic between theanalyte and the antibody leads to a Michaelis−Menten typeequation:
Δ =Δ
+f P
f PP K
( )( )sat
M (1)
where (Δf)sat contains the instrument response and KM is theso-called Michaelis−Menten constant. The former parameterincludes the number of antibodies tethered on the balance aswell as their effectiveness in capturing the analyte, that is, theirorientation, whereas the latter provides estimation for the rangeof linearity of the realized sensor. The fitting of theexperimental results obtained with irradiated antibodies by eq1 (solid line in figure 4) provides (Δf)sat = 151 ± 5 Hz and KM= 2.2 ± 0.7 μM. The uncertainty in our measurements is due toinstrumental limitations in the performances of our QCM, aswell as to the fluctuations in some steps of the procedure.Although we expect a remarkable improvement of the
reproducibility by an up-to-date QCM as well as an improvedfluidic circuit setup, currently we consider a conservativefrequency error of 15 Hz (see also the inset in figure 4). Thus, aminimum frequency change (Δf)min = 15 Hz is required for ameasurement to be significantly different from zero. Anevaluation of the lower LOD can, then, be obtained byinverting eq 1
≈Δ
Δ≈ × ≈−f K
fLOD
( )( )
2 10 M 60ngmL
min M
sat
7
(2)
Since the concentration of water is about 55 M a LOD betterthan 4 ppb for parathion in water results from ourfunctionalization technique applied to a QCM.By considering the response at the concentration of 51.5 μM
(see figure 4) we can estimate an increase in the sensitivity byat least 1 order of magnitude when PIT is used. Such a resultcan only be attributed to the side-up orientation of theantibodies and is much more significant than that achieved withheavier analytes,23 in agreement with the mass dependenceeffects of antibody orientation recently reported by Trilling etal.28
Specificity. To test the sensor specificity, the sameexperimental procedure has been used for four compounds,progressively similar to parathion, from the chemical andstructural point of view. They are bisphenol A (4,4′-(propane-2,2-diyl)diphenol), p-nonylphenol, dichlorvos (2,2-dichlorovin-yl dimethyl phosphate), and paraoxon (diethyl 4-nitrophenylphosphate). At concentrations of approximately 1.7 μM, whereparathion exhibits a significant response (see inset of Figure 4),all the four compounds showed no detectable frequency shiftwhen they were tested separately. Thus, we tested the sensorresponse with a mixture of the four compounds at an evenhigher concentration (3.5 μM). thereby mimicking a realcomplex matrix. The results are reported in Figure 5a, wherethe last steps of the protocol are highlighted. The frequencyshift measured when only the four compounds are in thesolution is just few hertz (mix), but the frequency goes back tothe previous value when PBS is made to flow (blue dotted line).
Figure 4. Response of the QCM versus the parathion concentrationwith irradiated (circles) and not-irradiated (squares) antibodies. Theexperimental points obtained with the irradiated antibody are fitted bya Michaelis−Menten type equation (black solid line). The lowfrequency change achieved when the antibody is not irradiated doesnot allow any significant fit of the experimental data. The inset is theenlargement of the low concentration region.
Analytical Chemistry Article
dx.doi.org/10.1021/ac400852c | Anal. Chem. 2013, 85, 6392−63976395

The parathion alone at 3.5 μM gives rise to a frequency shift ofapproximately 90 Hz (red dashed line). The addition of thefour compounds (Pt + mix) produces a slightly larger shift(solid black line) that disappear after purging with PBS. Thus,the concentrations were increased by 2 orders of magnitude(170 μM) compared to the initial one (1.7 μM), but despitesuch high concentration, the QCM responses were alwayslower than those provided by parathion in the saturation regimeof the dose−response curve. It is also noticeable to look at thesensor response as a function of “similarity” with the parathion,reported in Figure 5b. Such data are internally consistentshowing once again that the recognition capability of antibodiesis unaffected by PIT.
■ CONCLUSIONSThe side-up orientation of antibodies is the most effective wayto improve the sensitivity of immunosensors designed for lightmolecules and becomes a necessary condition when QCMs aregoing to be used. By applying the novel photonicimmobilization technique to antibodies to be tethered to the
gold electrodes of a QCM, we have been able to achieve asensitivity that allows the detection of a light molecule likeparathion (291.26 Da) in water with a LOD lower than 4 ppb(60 ng/mL). This value has been reached with a QCM capableto detect frequency shift of approximately 10 Hz and, althoughthe resulting LOD is already competitive with those obtainedwith similar devices, we anticipate a significant improvement ifan up-to-date QCM capable to detect frequency shift as low aso.1 Hz is used.9 Thus, in principle, by adopting PIT, as well asthe complexion with a heavy molecule like BSA, we expect tobe able to reach LOD much better than 1 ppb. This kind ofimmunosensor is inherently highly specific and provides fastresponse (only few minutes are required for the wholeanalysis). Moreover, in view of its flexibility and portability,such a device is suitable for in situ analysis. On the basis of ourmicroscopic interpretation of the experimental findings andgiven the widespread presence of the triad Trp/Cys-Cys in allthe antibodies, PIT can be considered as a general technique toanchor oriented antibodies on thiol reactive surfaces therebypaving the way to use this cost-effective technology for thedetection of a variety of analytes.
■ AUTHOR INFORMATIONCorresponding Author*E-mail: [email protected] authors declare no competing financial interest.
■ REFERENCES(1) Liu, S.; Zheng, Z.; Li, X. Anal Bioanal. Chem. 2013, 405, 63−90.(2) Milles, H. L.; Salt, H. Br. Med. J. 1950, 2, 444.(3) Walker, J. P.; Asher, S. A. Anal. Chem. 2005, 77, 1596−1600.(4) Zen, J.-M.; Jou, J.-J.; Senthil Kumar, A. Anal. Chim. Acta 1999,396, 39−44.(5) Mulchandani, P.; Chen, W.; Mulchandani, A. Environ. Sci.Technol. 2001, 35, 2562−2565.(6) Sacks, V.; Eshkenazi, I.; Neufeld, T.; Dosoretz, C.; Rishpon, J.Anal. Chem. 2000, 72, 2055−2058.(7) Cooper, M. A.; Singleton, V. T. J. Mol. Recognit. 2007, 20, 154−184.(8) Becker, B.; Cooper, M. J. Mol. Recognit. 2011, 24, 754−787.(9) Bi, X.; Yang, K.-L. Anal. Chem. 2009, 81, 527−532.(10) Marx, S.; Zaltsman, A.; Turyan, I.; Mandler, D. Anal. Chem.2004, 76, 120−126.(11) Trilling, A. K.; Beekwilder, J.; Zuilhof, H. Analyst 2013, 138,1619−1627.(12) Nicu, L.; Leïchle, T. J. Appl. Phys. 2008, 104, 111101.(13) Jung, Y.; Jeong, J. Y.; Chung, B. H. Analyst 2008, 133, 697−701.(14) Caruso, F.; Rodda, E.; Furlong, D. N. J. Colloid Interface Sci.1996, 178, 104−115.(15) Pribyl, J.; Hepel, M.; Halamek, J.; Skladal, P. Sens. Actuators, B2003, 91, 333−341.(16) Hao, R.; Wang, D.; Zhang, X.; Zuo, G.; Wei, H.; Yang, R.;Zhang, Z.; Cheng, Z.; Guo, Y.; Cui, Z.; Zhou, Y. Biosens. Bioelectron.2009, 24, 1330−1335.(17) Sharma, H.; Mutharasan, R. Anal. Chem. 2013, 85, 2472−2477.(18) Byrne, B.; Stack, E.; Gilmartin, N.; O’Kennedy, R. Sensors 2009,9, 4407−4445.(19) Jiang, X.; Li, D.; Xu, X.; Ying, Y.; Li, Y.; Ye, Z.; Wang, J. Biosens.Bioelectron. 2008, 23, 1577−1587.(20) Wang, Y.; Knoll, W.; Dostalek, J. Anal. Chem. 2012, 84, 8345−8350.(21) Karyakin, A. A.; Presnova, G. V; Rubtsova, M. Y.; Egorov, A. M.Anal. Chem. 2000, 72, 3805−3811.(22) Neves-Petersen, M. T.; Snabe, T.; Klitgaard, S.; Duroux, M. E.G.; Petersen, S. B. Protein Sci. 2006, 15, 343−351.
Figure 5. Sensor specificity i.e. sensor responses against differentpollutants similar to parathion (their structures are reported in thepanel b). (a) QCM response to parathion (PT) (red dashed line), to amixture (mix) of bisphenol A (BPA), p-nonylpheno (NP), dichlorvos(DC), paraoxon (PO) (blue dotted line), and to PT + mix (solid blackline). The concentration of all the compounds is 3.5 μM. (b)Frequency shift of the single compounds at the concentration of 172μM, that is, one hundred times higher than that for which theparathion yields approximately 70 Hz.
Analytical Chemistry Article
dx.doi.org/10.1021/ac400852c | Anal. Chem. 2013, 85, 6392−63976396

(23) Della Ventura, B.; Schiavo, L.; Altucci, C.; Esposito, R.; Velotta,R. Biomed. Opt. Express 2011, 2, 3223−3231.(24) Harris, L. J.; Skaletsky, E.; McPherson, A. J. Mol. Biol. 1998, 275,861−72.(25) Neves-Petersen, M. T.; Gryczynski, Z.; Fojan, P.; Pedersen, S.;Petersen, E.; Petersen, S. B. Protein Sci. 2002, 11, 588−600.(26) Snabe, T.; Røder, G. A.; Neves-Petersen, M. T.; Buus, S.;Petersen, S. B. Biosens. Bioelectron. 2006, 21, 1553−1559.(27) Ioerger, T. R.; Du, C.; Linthicum, D. S. Mol. Immunol. 1999, 36,373−386.(28) Trilling, A. K.; Harmsen, M. M.; Ruigrok, V. J. B.; Zuilhof, H.;Beekwilder, J. Biosens.Bioelectron. 2013, 40, 219−226.(29) Ellman, G. L. Arch. Biochem. Biophys. 1959, 82, 70−77.(30) Peluso, P.; Wilson, D. S.; Do, D.; Tran, H.; Venkatasubbaiah,M.; Quincy, D.; Heidecker, B.; Poindexter, K.; Tolani, N.; Phelan, M.;Witte, K.; Jung, L. S.; Wagner, P.; Nock, S. Anal. Biochem. 2003, 312,113−124.(31) Sauerbrey, G. Z. Phys. 1959, 155, 206−222.
Analytical Chemistry Article
dx.doi.org/10.1021/ac400852c | Anal. Chem. 2013, 85, 6392−63976397
Nano- and femtosecond UV laser pulses to immobilizebiomolecules onto surfaces with preferential orientation
S. Lettieri • A. Avitabile • B. Della Ventura •
R. Funari • A. Ambrosio • P. Maddalena •
M. Valadan • R. Velotta • C. Altucci
Received: 4 November 2013 / Accepted: 23 February 2014
� Springer-Verlag Berlin Heidelberg 2014
Abstract By relying on the photonic immobilization
technique of antibodies onto surfaces, we realized portable
biosensors for light molecules based on the use of quartz
crystal microbalances, given the linear dependence of the
method on the laser pulse intensity. Here, we compare the
quality of the anchoring method when using nanosecond
(260 nm, 25 mJ/pulse, 5 ns, 10 Hz rep. rate) and femto-
second (258 nm, 25 lJ/pulse, 150 fs, 10 kHz rep. rate) laser
source, delivering the same energy to the sample with the
same average power. As a reference, we also tethered
untreated antibodies by means of the passive adsorption. The
results are striking: When the antibodies are irradiated with
the femtosecond pulses, the deposition on the gold plate is
much more ordered than in the other two cases. The effects
of UV pulses irradiation onto the antibodies are also ana-
lyzed by measuring absorption and fluorescence and suggest
the occurrence of remarkable degradation when nanosecond
pulses are used likely induced by a larger thermal coupling.
In view of the high average power required to activate the
antibodies for the achievement of the photonic immobili-
zation technique, we conclude that femtosecond rather than
nanosecond laser pulses have to be used.
1 Introduction
The quest for developing more and more sophisticated and
efficient techniques for surface functionalization is of
extreme importance in the current scenario of applied sci-
ences, ranging from sensing [1, 2] to bioelectronics [3].
Here, we report on the role played by a pulsed UV radiation
source in the surface functionalization of a quartz crystal
microbalance (QCM) by means of the Photonic Immobili-
zation Technique (PIT) for the detection of a light pesticide
such as parathion (IUPAC name O,O-diethyl O-4-nitrophe-
nil phosphorothioate) [2, 4]. In QCMs, the detection of the
analyte occurs thanks to its specific recognition by bio-
receptors (antibodies) immobilized on the sensor surface.
The strategy to anchor bio-receptors on a metallic surface
element is a key issue to improve the sensor performances
and for any requirement of surface functionalization. We
demonstrated an increase in the QCM sensitivity and its
linear range extension when antibodies were irradiated with
258-nm laser pulses [2, 5]. It is important stressing that the
increase in the antibodies efficiency due to laser pulse irra-
diation is linear with the peak intensity, namely the pulse
power per unit surface, of the UV laser pulses in the
investigated intensity range, as demonstrated in [2]. This has
the consequence to rule out any nonlinear phenomenon
essentially based on two-photon absorption in the antibody
response, thus indicating the delivered energy dose as the
laser source key parameter for antibody treatment. Such
linear response, moreover, would somehow entail that any
source delivering the same energy dose to the target, even
S. Lettieri � A. Avitabile � R. Funari � A. Ambrosio �P. Maddalena � M. Valadan � R. Velotta � C. Altucci (&)
Dipartimento di Fisica, Universita degli Studi di Napoli Federico
II, Complesso Universitario Monte S. Angelo, Via Cintia,
Naples 80126, Italy
e-mail: [email protected]
S. Lettieri � A. Ambrosio
CNR-SPIN, UOS Napoli, Complesso Universitario Monte S.
Angelo, Via Cintia, Naples 80126, Italy
B. Della Ventura
Dipartimento di Fisica, Universita di Roma, La Sapienza, Rome,
Italy
R. Velotta � C. Altucci
Consorzio Nazionale Interuniversitario per le Scienze Fisiche
della Materia, Naples, Italy
123
Appl. Phys. A
DOI 10.1007/s00339-014-8340-4
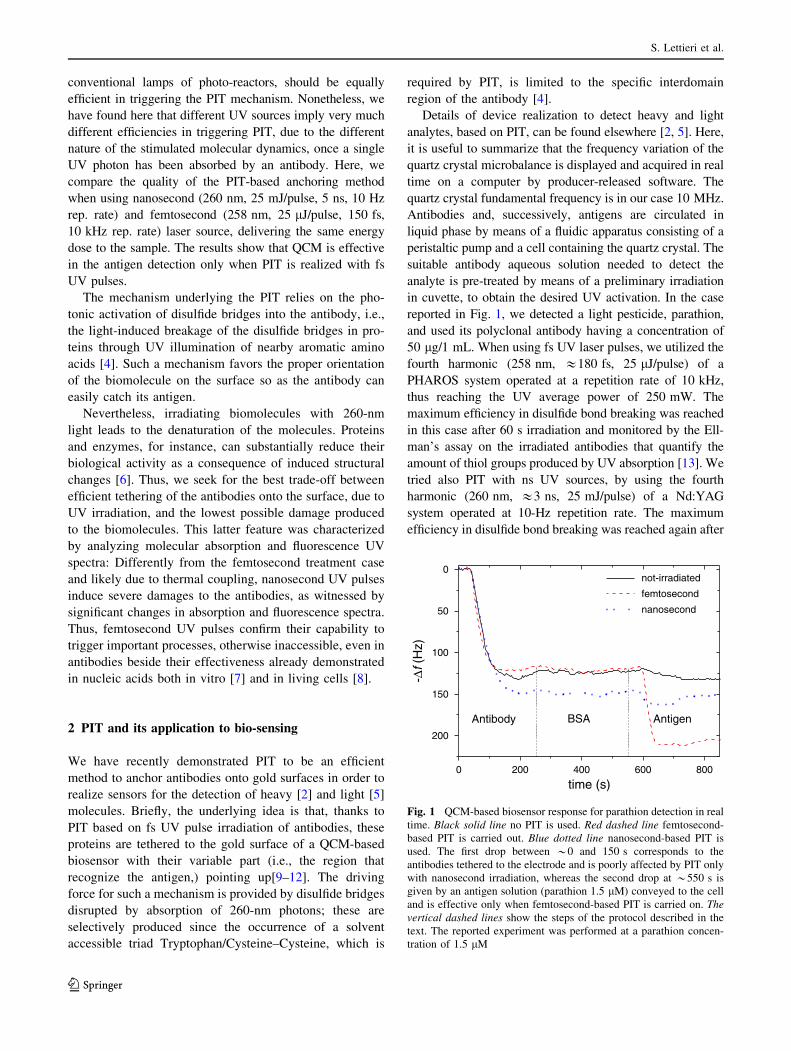
conventional lamps of photo-reactors, should be equally
efficient in triggering the PIT mechanism. Nonetheless, we
have found here that different UV sources imply very much
different efficiencies in triggering PIT, due to the different
nature of the stimulated molecular dynamics, once a single
UV photon has been absorbed by an antibody. Here, we
compare the quality of the PIT-based anchoring method
when using nanosecond (260 nm, 25 mJ/pulse, 5 ns, 10 Hz
rep. rate) and femtosecond (258 nm, 25 lJ/pulse, 150 fs,
10 kHz rep. rate) laser source, delivering the same energy
dose to the sample. The results show that QCM is effective
in the antigen detection only when PIT is realized with fs
UV pulses.
The mechanism underlying the PIT relies on the pho-
tonic activation of disulfide bridges into the antibody, i.e.,
the light-induced breakage of the disulfide bridges in pro-
teins through UV illumination of nearby aromatic amino
acids [4]. Such a mechanism favors the proper orientation
of the biomolecule on the surface so as the antibody can
easily catch its antigen.
Nevertheless, irradiating biomolecules with 260-nm
light leads to the denaturation of the molecules. Proteins
and enzymes, for instance, can substantially reduce their
biological activity as a consequence of induced structural
changes [6]. Thus, we seek for the best trade-off between
efficient tethering of the antibodies onto the surface, due to
UV irradiation, and the lowest possible damage produced
to the biomolecules. This latter feature was characterized
by analyzing molecular absorption and fluorescence UV
spectra: Differently from the femtosecond treatment case
and likely due to thermal coupling, nanosecond UV pulses
induce severe damages to the antibodies, as witnessed by
significant changes in absorption and fluorescence spectra.
Thus, femtosecond UV pulses confirm their capability to
trigger important processes, otherwise inaccessible, even in
antibodies beside their effectiveness already demonstrated
in nucleic acids both in vitro [7] and in living cells [8].
2 PIT and its application to bio-sensing
We have recently demonstrated PIT to be an efficient
method to anchor antibodies onto gold surfaces in order to
realize sensors for the detection of heavy [2] and light [5]
molecules. Briefly, the underlying idea is that, thanks to
PIT based on fs UV pulse irradiation of antibodies, these
proteins are tethered to the gold surface of a QCM-based
biosensor with their variable part (i.e., the region that
recognize the antigen,) pointing up[9–12]. The driving
force for such a mechanism is provided by disulfide bridges
disrupted by absorption of 260-nm photons; these are
selectively produced since the occurrence of a solvent
accessible triad Tryptophan/Cysteine–Cysteine, which is
required by PIT, is limited to the specific interdomain
region of the antibody [4].
Details of device realization to detect heavy and light
analytes, based on PIT, can be found elsewhere [2, 5]. Here,
it is useful to summarize that the frequency variation of the
quartz crystal microbalance is displayed and acquired in real
time on a computer by producer-released software. The
quartz crystal fundamental frequency is in our case 10 MHz.
Antibodies and, successively, antigens are circulated in
liquid phase by means of a fluidic apparatus consisting of a
peristaltic pump and a cell containing the quartz crystal. The
suitable antibody aqueous solution needed to detect the
analyte is pre-treated by means of a preliminary irradiation
in cuvette, to obtain the desired UV activation. In the case
reported in Fig. 1, we detected a light pesticide, parathion,
and used its polyclonal antibody having a concentration of
50 lg/1 mL. When using fs UV laser pulses, we utilized the
fourth harmonic (258 nm, &180 fs, 25 lJ/pulse) of a
PHAROS system operated at a repetition rate of 10 kHz,
thus reaching the UV average power of 250 mW. The
maximum efficiency in disulfide bond breaking was reached
in this case after 60 s irradiation and monitored by the Ell-
man’s assay on the irradiated antibodies that quantify the
amount of thiol groups produced by UV absorption [13]. We
tried also PIT with ns UV sources, by using the fourth
harmonic (260 nm, &3 ns, 25 mJ/pulse) of a Nd:YAG
system operated at 10-Hz repetition rate. The maximum
efficiency in disulfide bond breaking was reached again after
0 200 400 600 800
200
150
100
50
0
AntigenBSAAntibody
time (s)
not-irradiated
femtosecond
nanosecond
-Δf (
Hz)
Fig. 1 QCM-based biosensor response for parathion detection in real
time. Black solid line no PIT is used. Red dashed line femtosecond-
based PIT is carried out. Blue dotted line nanosecond-based PIT is
used. The first drop between *0 and 150 s corresponds to the
antibodies tethered to the electrode and is poorly affected by PIT only
with nanosecond irradiation, whereas the second drop at *550 s is
given by an antigen solution (parathion 1.5 lM) conveyed to the cell
and is effective only when femtosecond-based PIT is carried on. The
vertical dashed lines show the steps of the protocol described in the
text. The reported experiment was performed at a parathion concen-
tration of 1.5 lM
S. Lettieri et al.
123
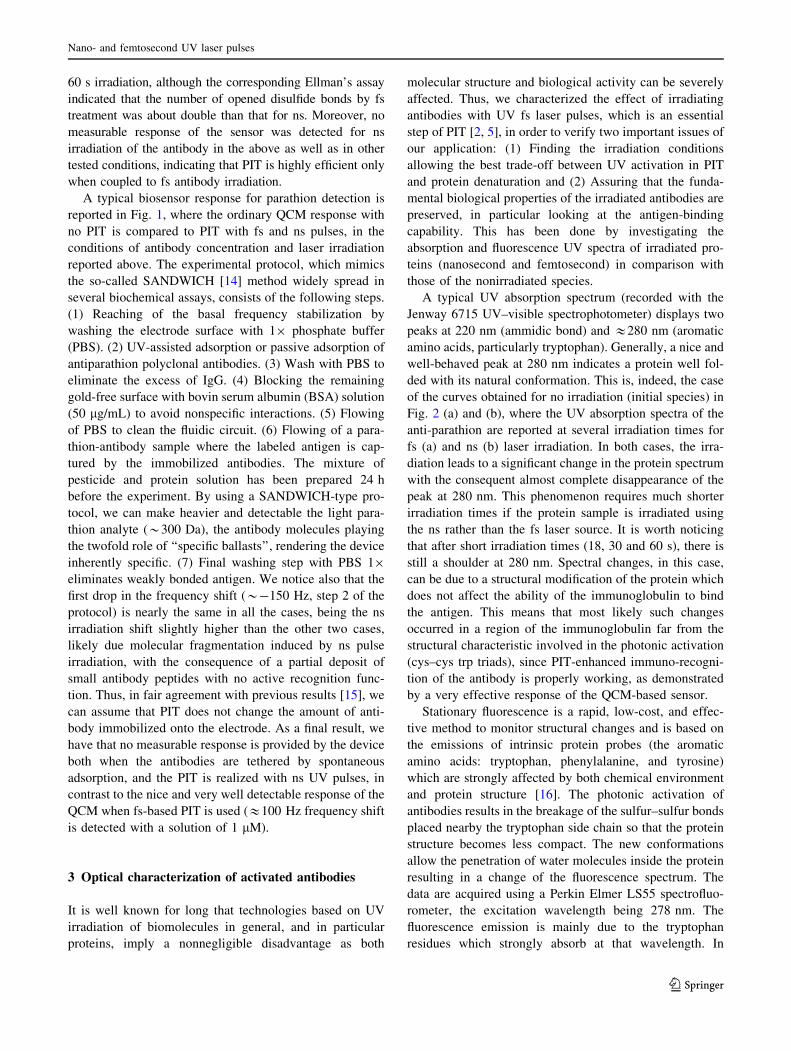
60 s irradiation, although the corresponding Ellman’s assay
indicated that the number of opened disulfide bonds by fs
treatment was about double than that for ns. Moreover, no
measurable response of the sensor was detected for ns
irradiation of the antibody in the above as well as in other
tested conditions, indicating that PIT is highly efficient only
when coupled to fs antibody irradiation.
A typical biosensor response for parathion detection is
reported in Fig. 1, where the ordinary QCM response with
no PIT is compared to PIT with fs and ns pulses, in the
conditions of antibody concentration and laser irradiation
reported above. The experimental protocol, which mimics
the so-called SANDWICH [14] method widely spread in
several biochemical assays, consists of the following steps.
(1) Reaching of the basal frequency stabilization by
washing the electrode surface with 19 phosphate buffer
(PBS). (2) UV-assisted adsorption or passive adsorption of
antiparathion polyclonal antibodies. (3) Wash with PBS to
eliminate the excess of IgG. (4) Blocking the remaining
gold-free surface with bovin serum albumin (BSA) solution
(50 lg/mL) to avoid nonspecific interactions. (5) Flowing
of PBS to clean the fluidic circuit. (6) Flowing of a para-
thion-antibody sample where the labeled antigen is cap-
tured by the immobilized antibodies. The mixture of
pesticide and protein solution has been prepared 24 h
before the experiment. By using a SANDWICH-type pro-
tocol, we can make heavier and detectable the light para-
thion analyte (*300 Da), the antibody molecules playing
the twofold role of ‘‘specific ballasts’’, rendering the device
inherently specific. (7) Final washing step with PBS 19
eliminates weakly bonded antigen. We notice also that the
first drop in the frequency shift (*-150 Hz, step 2 of the
protocol) is nearly the same in all the cases, being the ns
irradiation shift slightly higher than the other two cases,
likely due molecular fragmentation induced by ns pulse
irradiation, with the consequence of a partial deposit of
small antibody peptides with no active recognition func-
tion. Thus, in fair agreement with previous results [15], we
can assume that PIT does not change the amount of anti-
body immobilized onto the electrode. As a final result, we
have that no measurable response is provided by the device
both when the antibodies are tethered by spontaneous
adsorption, and the PIT is realized with ns UV pulses, in
contrast to the nice and very well detectable response of the
QCM when fs-based PIT is used (&100 Hz frequency shift
is detected with a solution of 1 lM).
3 Optical characterization of activated antibodies
It is well known for long that technologies based on UV
irradiation of biomolecules in general, and in particular
proteins, imply a nonnegligible disadvantage as both
molecular structure and biological activity can be severely
affected. Thus, we characterized the effect of irradiating
antibodies with UV fs laser pulses, which is an essential
step of PIT [2, 5], in order to verify two important issues of
our application: (1) Finding the irradiation conditions
allowing the best trade-off between UV activation in PIT
and protein denaturation and (2) Assuring that the funda-
mental biological properties of the irradiated antibodies are
preserved, in particular looking at the antigen-binding
capability. This has been done by investigating the
absorption and fluorescence UV spectra of irradiated pro-
teins (nanosecond and femtosecond) in comparison with
those of the nonirradiated species.
A typical UV absorption spectrum (recorded with the
Jenway 6715 UV–visible spectrophotometer) displays two
peaks at 220 nm (ammidic bond) and &280 nm (aromatic
amino acids, particularly tryptophan). Generally, a nice and
well-behaved peak at 280 nm indicates a protein well fol-
ded with its natural conformation. This is, indeed, the case
of the curves obtained for no irradiation (initial species) in
Fig. 2 (a) and (b), where the UV absorption spectra of the
anti-parathion are reported at several irradiation times for
fs (a) and ns (b) laser irradiation. In both cases, the irra-
diation leads to a significant change in the protein spectrum
with the consequent almost complete disappearance of the
peak at 280 nm. This phenomenon requires much shorter
irradiation times if the protein sample is irradiated using
the ns rather than the fs laser source. It is worth noticing
that after short irradiation times (18, 30 and 60 s), there is
still a shoulder at 280 nm. Spectral changes, in this case,
can be due to a structural modification of the protein which
does not affect the ability of the immunoglobulin to bind
the antigen. This means that most likely such changes
occurred in a region of the immunoglobulin far from the
structural characteristic involved in the photonic activation
(cys–cys trp triads), since PIT-enhanced immuno-recogni-
tion of the antibody is properly working, as demonstrated
by a very effective response of the QCM-based sensor.
Stationary fluorescence is a rapid, low-cost, and effec-
tive method to monitor structural changes and is based on
the emissions of intrinsic protein probes (the aromatic
amino acids: tryptophan, phenylalanine, and tyrosine)
which are strongly affected by both chemical environment
and protein structure [16]. The photonic activation of
antibodies results in the breakage of the sulfur–sulfur bonds
placed nearby the tryptophan side chain so that the protein
structure becomes less compact. The new conformations
allow the penetration of water molecules inside the protein
resulting in a change of the fluorescence spectrum. The
data are acquired using a Perkin Elmer LS55 spectrofluo-
rometer, the excitation wavelength being 278 nm. The
fluorescence emission is mainly due to the tryptophan
residues which strongly absorb at that wavelength. In
Nano- and femtosecond UV laser pulses
123
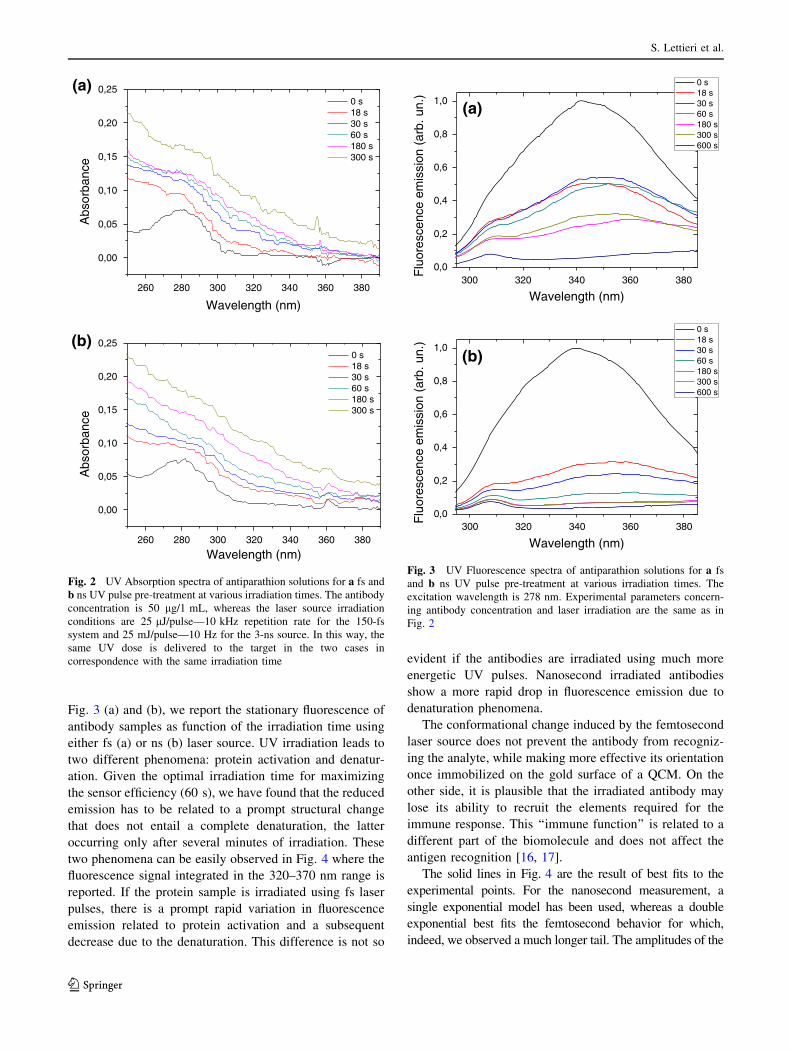
Fig. 3 (a) and (b), we report the stationary fluorescence of
antibody samples as function of the irradiation time using
either fs (a) or ns (b) laser source. UV irradiation leads to
two different phenomena: protein activation and denatur-
ation. Given the optimal irradiation time for maximizing
the sensor efficiency (60 s), we have found that the reduced
emission has to be related to a prompt structural change
that does not entail a complete denaturation, the latter
occurring only after several minutes of irradiation. These
two phenomena can be easily observed in Fig. 4 where the
fluorescence signal integrated in the 320–370 nm range is
reported. If the protein sample is irradiated using fs laser
pulses, there is a prompt rapid variation in fluorescence
emission related to protein activation and a subsequent
decrease due to the denaturation. This difference is not so
evident if the antibodies are irradiated using much more
energetic UV pulses. Nanosecond irradiated antibodies
show a more rapid drop in fluorescence emission due to
denaturation phenomena.
The conformational change induced by the femtosecond
laser source does not prevent the antibody from recogniz-
ing the analyte, while making more effective its orientation
once immobilized on the gold surface of a QCM. On the
other side, it is plausible that the irradiated antibody may
lose its ability to recruit the elements required for the
immune response. This ‘‘immune function’’ is related to a
different part of the biomolecule and does not affect the
antigen recognition [16, 17].
The solid lines in Fig. 4 are the result of best fits to the
experimental points. For the nanosecond measurement, a
single exponential model has been used, whereas a double
exponential best fits the femtosecond behavior for which,
indeed, we observed a much longer tail. The amplitudes of the
0,00
0,05
0,10
0,15
0,20
0,25A
bsor
banc
e
Wavelength (nm)
0 s 18 s 30 s 60 s 180 s 300 s
(a)
260 280 300 320 340 360 380
260 280 300 320 340 360 380
0,00
0,05
0,10
0,15
0,20
0,25
Abs
orba
nce
Wavelength (nm)
0 s 18 s 30 s 60 s 180 s 300 s
(b)
Fig. 2 UV Absorption spectra of antiparathion solutions for a fs and
b ns UV pulse pre-treatment at various irradiation times. The antibody
concentration is 50 lg/1 mL, whereas the laser source irradiation
conditions are 25 lJ/pulse—10 kHz repetition rate for the 150-fs
system and 25 mJ/pulse—10 Hz for the 3-ns source. In this way, the
same UV dose is delivered to the target in the two cases in
correspondence with the same irradiation time
0,0
0,2
0,4
0,6
0,8
1,0
Flu
ores
cenc
e em
issi
on (
arb.
un.
)
Wavelength (nm)
0 s 18 s 30 s 60 s 180 s 300 s 600 s
(a)
300 320 340 360 380
300 320 340 360 3800,0
0,2
0,4
0,6
0,8
1,0
Flu
ores
cenc
e em
issi
on (
arb.
un.
)
Wavelength (nm)
0 s 18 s 30 s 60 s 180 s 300 s 600 s
(b)
Fig. 3 UV Fluorescence spectra of antiparathion solutions for a fs
and b ns UV pulse pre-treatment at various irradiation times. The
excitation wavelength is 278 nm. Experimental parameters concern-
ing antibody concentration and laser irradiation are the same as in
Fig. 2
S. Lettieri et al.
123

two exponential decays turn out to be Ashort = 0.44 ± 0.03
and Along = 0.7 ± 0.1 for the short- and for long-lived decay,
respectively. Most likely, such a substantial difference
between nanosecond and femtosecond irradiation indicates a
conformational change in the antibody occurring when fem-
tosecond rather than nanosecond pulses are used for PIT. It is
well known the fluorescence of proteins in the UV is mostly
due to aromatic amino acids, and in particular to tryptophan,
which has a fluorescence quantum yield about one order of
magnitude higher than that of the tyrosine and phenylalanine
[18]. It is also known that in a large number of cases, tryp-
tophan fluorescence yield and dynamics in proteins are clo-
sely related to the molecular conformation as demonstrated
for the electron transfer in myoglobins [19], for protein photo-
activation in bacteria [20], and for the influence of tryptophan
in ligand recognition of nicotinic receptors [21]. Such a
change might be induced in the antibody only by shining
femtosecond and not nanosecond pulses, as tryptophan
exhibits two fluorescence lifetimes in the UV equal to &0.4
and &2.8 ns [22], in correspondence with the S0 ? 1La and
S0 ? 1Lb transitions. These lifetimes are much longer than
our femtosecond pulses, whereas they are shorter than the
used nanosecond pulses. As a consequence, conformational
changes induced in the antibody by the dynamics triggered by
the S0 ? 1La and S0 ? 1Lb transitions in tryptophan can be
observed only when using femtosecond pulse irradiation,
since our relatively long nanosecond pulses will likely also
deplete the excited 1La and 1Lb states due to stimulated
emission. This has the natural counterpart, typical of the
nanosecond regime, of inducing stronger damages than in the
femtosecond case, due to thermal coupling.
4 Conclusions
We have shown here a successful application of fs pulse-
based PIT to the realization of a portable immune-sensor
for the detection of a light pesticide such as parathion. In
particular, the application of fs pulse-based PIT to func-
tionalize the electrode of a QCM sensor makes the differ-
ence between the possibility of a good sensing against no
response at all from the device. Such a negative result
occurs indeed both when passive adsorption and nanosec-
ond PIT are used to functionalize the gold electrode.
We then characterized the effects of a robust 260-nm pulse
irradiation onto the antiparathion molecules by measuring
absorption and fluorescence spectra for initial and irradiated
species in several different experimental conditions. We
found that using fs pulse irradiation of the antibodies repre-
sents the best trade-off between efficient tethering of the
antibodies onto the surface and the lowest possible damage
induced to the biomolecules by UV radiation. This finding
strongly suggests to carry on a dynamic study of the trypto-
phan UV photo-excitation into the antibody with the conse-
quent relaxation and related conformational dynamics.
Acknowledgments Partial funding for this research was provided
by the Italian Ministry for Research and Education through the Grant
PON01_01517.
References
1. J.L. Arlett, E.B. Myers, M.L. Roukes, Nat. Nanotechnol. 6(4),
203–215 (2011)
2. B. Della Ventura, L. Schiavo, C. Altucci, R. Esposito, R. Velotta,
Biomed. Opt. Expr. 2(11), 3223–3231 (2011)
3. J. Cheng, G. Zhu, L. Wu, X. Du, H. Zhang, B. Wolfrum, Q. Jin, J.
Zhao, A. Offenhauser, Y. Xu, J. Neurosci. Methods 213(2),
196–203 (2013)
4. M.T. Neves-Petersen, T. Snabe, S. Klitgaard, M. Duroux, S.B.
Petersen, Protein Sci. 15(2), 343–351 (2006)
5. R. Funari, B. Della Ventura, L. Schiavo, R. Esposito, C. Altucci,
R. Velotta, Anal. Chem. 85, 6392–6397 (2013)
6. M.T. Neves-Petersen, Z. Gryczynski, Z. Fojan, S. Pedersen, E.
Petersen, S.B. Petersen, Protein Sci. 11, 588–600 (2002)
7. C. Russmann, M. Beato, J. Stollhof, C. Weiss, R. Beigang, Nucl.
Acid Res. 26, 3697 (1998)
8. C. Altucci, A. Nebbioso, R. Benedetti, R. Esposito, V. Carafa, M.
Conte, M. Micciarelli, L. Altucci, R. Velotta, Laser Phys. Lett. 9,
234–239 (2012)
9. F. Caruso, E. Rodda, D.N. Furlong, J. Colloid Interface Sci. 178,
104–115 (1996)
10. J. Pribyl, M. Hepel, J. Halamek, P. Skladal, Sens. Actuators, B
91, 333–341 (2003)
11. R. Hao, D. Wang, X. Zhang, G. Zuo, H. Wei, R. Yang, Z. Zhang,
Z. Cheng, Y. Guo, Z. Cui, Y. Zhou, Biosens. Bioelectron. 24,
1330–1335 (2009)
12. H. Sharma, R. Mutharasan, Anal. Chem. 85, 2472–2477 (2013)
13. G.L. Ellman, Arch. Biochem. Biophys. 82, 70–77 (1959)
0 100 200 300 400 500 6000,0
0,2
0,4
0,6
0,8
1,0 Femtosecond Nanosecond
Flu
ores
cenc
e yi
eld
(arb
. un.
)
Irradiation time (s)
Fig. 4 Integrated fluorescence emission in the 320–370 nm spectral
window for antiparathion activated with fs (black squares) and ns (red
triangles) pulses versus the UV laser irradiation time. Red bold lines:
best fits using a double exponential model for (a) and a single
exponential model for (b)
Nano- and femtosecond UV laser pulses
123

14. C. Davies, The immunoassay handbook (Stockton Press, New
York, 1994)
15. P. Peluso, D.S. Wilson, D. Do, H. Tran, M. Venkatasubbaiah, D.
Quincy, B. Heidecker, K. Poindexter, N. Tolani, M. Phelan, K.
Witte, L.S. Jung, P. Wagner, S. Nock, Anal. Biochem. 312,
113–124 (2003)
16. P. Garidel, M. Hegyi, S. Bassarab, M. Weichel, Biotechnol. J. 3,
1201–1211 (2008)
17. C.A. Janeway Jr., P. Travers, M. Walport, and M.J. Schlomchi-
ket, Immunobiology, Garland Science Ed. (2001)
18. J.R. Lakowicz, Principles of fluorescence spectroscopy, 3rd edn.
(Springer, New York, 2006)
19. C. Consani, G. Aubock, F. van Mourik, M. Chergui, Science 339,
1586–1589 (2013)
20. J. Leonard, E. Portuondo-Campa, A. Cannizzo, F. Van Mourik,
G. Van der Zwan, J. Tittor, S. Haacke, M. Chergui, Proc. Nat. Ac.
Sci. 106, 7718–7723 (2009)
21. S.B. Hansen, Z. Radi¢, T.T. Talley, B.E. Molles, T. Deerinck, I.
Tsigelny, P. Taylor, J. Biol. Chem. 277, 41299–41302 (2002)
22. J.R. Albani, J. Fluoresc. 19, 1061–1071 (2009)
S. Lettieri et al.
123

Detection of parathion and patulin by quartz-crystal microbalancefunctionalized by the photonics immobilization technique
Riccardo Funari a, Bartolomeo Della Ventura a, Raffaele Carrieri b, Luigi Morra b,Ernesto Lahoz b, Felice Gesuele a, Carlo Altucci a, Raffaele Velotta a,n
a CNISM and Dipartimento di Fisica, Università di Napoli “Federico II”, Via Cintia, 26, Naples 80126, Italyb Consiglio per la Ricerca e la Sperimentazione in Agricoltura – Unità di Ricerca per le Colture Alternative al Tabacco, Via P. Vitiello, 108, Scafati 84018, Italy
a r t i c l e i n f o
Article history:Received 6 June 2014Received in revised form28 July 2014Accepted 8 August 2014Available online 19 August 2014
Keywords:ParathionPatulinImmunosensorQuartz crystal microbalancePhotonics immobilization technique
a b s t r a c t
Oriented antibodies are tethered on the gold surface of a quartz crystal microbalance through thephotonics immobilization technique so that limit of detection as low as 50 nM and 140 nM are achievedfor parathion and patulin, respectively. To make these small analytes detectable by the microbalance,they have been weighed down through a “sandwich protocol” with a second antibody. The specificityagainst the parathion has been tested by checking the immunosensor response to a mixture ofcompounds similar to parathion, whereas the specificity against the patulin has been tested with a realsample from apple puree. In both cases, the results are more than satisfactory suggesting interestingoutlook for the proposed device.
& 2014 Elsevier B.V. All rights reserved.
1. Introduction
The effective detection of small molecular weights analytes isof paramount importance in a wide range of scientific topics likeinvestigating the molecular recognition phenomena and sensing oftoxic molecules (Cooper and Singleton, 2007; Geschwindner et al.,2012; Jones et al., 2013; Vashist and Vashist, 2011). In particular, inthe field of environmental monitoring it would be of greatimportance the availability of cost-effective and sensitive toolsallowing the detection of low soluble and harmful compounds likesteroids, herbicides, pesticides, toxins and combustion productslike polycyclic aromatic hydrocarbon (PAH). As case studies to testour approach, we focused on parathion (IUPAC name O,O-diethylO-4-nitrophenil phosphorothioate, MW¼297 Da) and patulin (IU-PAC name 4-hydroxy-4,6-dihydrofuro[3,2-c]pyran-2-one, MW¼154 Da), which share a relatively low molecular weight and highinterest for environment and health safety. Parathion is anorganophosphate pesticide widely used to enhance agriculturalproduction, but for its toxicity (Milles and Salt, 1950) it is nowforbidden within the European Union which sets the limits ofpesticide residues in food between 50 and 100 μg/kg (CommissionRegulation (EC) no. 839/2008). Patulin is an example of mycotoxinwhich is most likely to be found in crops as a result of fungal
infection. Both molecules are highly resistant to degradation andthe patulin high toxicity for human and animal health has beenrecently pointed out in a review by Puel et al. (2010). Patulin levelin food is strictly regulated in European countries (CommissionRegulation (EC) no. 1881/2006) which set a maximum level of50 μg/kg for fruit juices and derived products, 25 μg/kg for solidapple products and 10 μg/kg for baby foods. Both parathion andpatulin are usually quantified by exploiting expensive, time con-suming and relatively complex techniques like high-performance-liquid-chromatography (HPLC) and/or mass spectrometry [see(Blasco et al., 2004; Carabias Martinez et al., 1992; Kwakmanet al., 1992) for parathion and (Berthiller et al., 2014; Pereira et al.,2014) for patulin]. Thus, the lack of any commercial and standardimmunochemical methods underpins the research for biosensorbased detection allowing in situ and real-time analysis for envir-onmental monitoring and food quality control.
Amperometric devices are used for parathion in view of theirfeature to provide cheap, rapid and effective analysis of aqueoussamples if the molecules to be detected are electroactive. Zen et al.(1999) developed a sensitive technique for the detection ofparathion using a Nafion-coated glassycarbon electrode thusreaching a limit of detection (LOD) of 50 nM. Other sensingstrategies are based on electrodes functionalized using enzymeslike organophosphorus hydrolase. Exploiting this principleMulchandani et al. (2001) were able to detect methyl-parathionand paraoxon with a LOD of 20 nM. Even if this kind of devices
Contents lists available at ScienceDirect
journal homepage: www.elsevier.com/locate/bios
Biosensors and Bioelectronics
http://dx.doi.org/10.1016/j.bios.2014.08.0200956-5663/& 2014 Elsevier B.V. All rights reserved.
n Corresponding author. Tel.: þ39 081 6 76148.E-mail address: [email protected] (R. Velotta).
Biosensors and Bioelectronics 67 (2015) 224–229

offers several advantages for water analysis, electrochemicaldetection can be easily influenced by other oxidizable moleculeseventually present in a real sample.
Electrochemical (Vidal et al., 2013), optical (Pereira et al., 2014)and piezoelectric (Pohanka et al., 2007; Prieto-Simón and Campàs,2009), sensors and biosensors for the detection of mycotoxins arereported in literature, but quite few results are reported for patulindetection. A fluorescence assay was proposed by De Champdoréet al. (2007) with a LOD of 10 μg/L (less than 0.1 μM), but no teston a real sample was carried out. Damián Chanique et al. (2013)have developed a detection method based on the electrochemicalreduction of patulin using glassy carbon electrodes. With thisstrategy they reached a LOD of 300 nM quantifying patulin incommercial apple juices. Starodub and Slishek (2012) proposed anano-porosus silicon based immunosensor for measuring the levelof patulin and T2 mycotoxin in real samples reaching a sensitivityof about 10 ng/mL for both pollutants. More recently, Pennacchioet al. (2014) proposed a competitive surface plasmon resonance(SPR) based bioassay with an estimated LOD of 0.1 nM, but it isworth noticing that the accuracy of SPR measurements can beinfluenced by interfering effects like temperature and samplecomposition fluctuation which produce a change in the refractiveindex not related to the analyte binding.
In view of their robustness, flexibility and cost-effectiveness,quartz crystal microbalance (QCM) technology has achieved animportant role in fields like sensing, material science, environ-mental monitoring and protein studying (Vashist and Vashist,2011). It is possible use QCM devices for small molecule detectionexploiting several principles and configurations (Cooper andSingleton, 2007). All these advantages led to a wide range ofpublications involving QCM based detection of both pesticides andmycotoxins. For instance, Bi and Yang (2009) used molecularimprinted monolayers (MIMs) self-assembled onto the QCM goldelectrode to effectively detect imidacloprid and thiacloprid pesti-cides in celery juice. They used an extremely sensitive QCM devicegetting a LOD of 1 μM. Concerning mycotoxin detection an indirectcompetitive immunological strategy has been adopted by Jin et al.(2009) for the quantification of aflatoxin B1. They significantlyimproved the sensitivity of the QCM based biosensor coupling theindirect competitive immunoassay with biocatalyzed depositionamplification using enzyme labeled secondary antibodies. Horse-radish peroxidase was used to catalyze the oxidation of 4-chloro-1-naphthol to form an insoluble product which deposits onto theQCM electrode thus resulting in a huge increase in the sensorresponse. This procedure requires several time consuming incuba-tion steps and allows to reach a LOD of about 32 pM.
Surface functionalization is one the main issue in biosensordevelopment, in fact, recent publications show the strong interestin the research of innovative immobilization and functionalizationstrategies which provide better sensitivity and lower LOD (Junget al., 2008; Nicu and Leichle , 2008). In particular, proteinorientation is of paramount importance for immobilized antibo-dies which have to well expose their sensitive parts, the so calledantigen binding sites, to effectively capture the antigens. Trillinget al. (2013) have recently investigated the relationship betweenanalyte characteristics and capture molecule anchoring showingthat the uniform orientation of the recognition elements providesa huge systematic improvement in sensitivity for weak interac-tions. They observed that the smaller the molecule, the lower theepitope number per analyte and, hence, the more important is theorientation of the sensitive biomolecule. By an appropriate anti-body surface functionalization, Funari et al. (2013) were able to usea simple transducer like quartz-crystal microbalance (QCM) todetect a concentration of about 200 nM of parathion. This resultwas achieved by adopting the photonic immobilization technique(PIT) (Della Ventura et al., 2011), so that a gold surface fully
covered by oriented antibodies was realized, but also by “weighingdown” the molecule through the complexion of parathion withbovine serum albumin (BSA). Since not all the molecules are ableto complex with BSA, in this paper we propose a more generalapproach leading to higher sensitivity and specificity. Essentially,parathion and patulin are “weighed down” by the same antibodiesused for the detection onto QCM, mimicking the so calledsandwich configuration widely used in the ELISA assays. To thisend, the pollutant sample is mixed with an antibody solutionbefore the latter is conveyed to the QCM and LODs of approxi-mately 50 nM and 140 nM are achieved for parathion and patulin,respectively.
2. Materials and methods
2.1. Chemicals
Parathion (45607) and patulin (P1639) were purchased fromSigma-Aldrich. Anti-parathion (ABIN113883) and anti-patulin(AS11-1699) polyclonal antibodies were purchased as rabbit serafrom antibodies-online.com and Agrisera respectively. The type Gimmunoglobulins were purified using the Protein A AntibodyPurification Kit (PURE1A) from Sigma-Aldrich. 5,5′-dithiobis-(2-nitrobenzoic acid) also known as Ellman's reagent (D8130), bovineserum albumin (A2153) and the compounds used for the specifi-city tests, bisphenol A (239658), p-nonylphenol (46018), dichlor-vos (45441), diazinon (45428) and paraoxon (36186), were fromSigma-Aldrich. The pollutant samples were prepared using PBS1� buffer solution in the fume hood. Helix water, sulfuric acid98% and hydrogen peroxide 40% were used for the cleaningprocedure of the QCM gold surfaces.
2.2. Patulin extraction from real sample
For the specificity test, we used real samples of patulinextracted from apple puree obtained from apple processing plant.To this end a commercial kit (Polyintell Affinimips SPE cartridges)was used. The extraction was performed as follows: 10 g of applepuree were treated with 150 μL of a pectinase enzyme solutionfollowed by 10 mL water and mixed. Solution was left at roomtemperature overnight, or for 2 h at 40 °C, centrifuged at 4500g for5 min and then filtered with a 0.2 μM filter. This solution is used asthe loading solution. SPE Cartridge was conditioned with 2 mL ofacetonitrile (ACN), then with 1 mL of deionised water. 5 mL of theloading solution was put in the cartridge, which was subsequentlywashed with 4 mL of deionized water containing 1% of acetic acid.Water was forced down into the cartridge. The cartridge wastreated with 1 mL of CHCl3 and patulin was eluted with 2 mL ofACN containing 1% acetic acid. The SPE procedure lasted approxi-mately 30 min. The elution fraction was then evaporated anddissolved in water containing 0.1% acetic acid. This fraction wassubmitted to a Perkin Elmer HPLC with UV detector to determinethe patulin concentration. The same sample was used in QCMvalidation analysis.
2.3. UV laser source
The immunoglobulin samples were irradiated using the UVlaser pulses provided by a custom femtosecond PHAROS lasersystem with high tunable pulse repetition rate coupled with aharmonic generator stage (HIRO) which allows the conversion to515 nm, 343 nm and 258 nm wavelengths of the IR fundamentalradiation. Both PHAROS and HIRO were from Light Conversion Ltd.
R. Funari et al. / Biosensors and Bioelectronics 67 (2015) 224–229 225

2.4. Quartz crystals
The quartz oscillators (151218) are from ICM, Oklahoma city(USA). They are AT-CUT quartz with a fundamental frequency of10 MHz. The crystal and the gold electrode diameters are 1.37 cmand 0.68 cm respectively. The gold surfaces are cleaned by immer-sing the oscillators for 1 min in a glass beaker containing Piranhasolution (5:1 ratio between concentrated sulfuric acid and 40%hydrogen peroxide solution), then the quartzes are washed withhelix water. The whole cleaning procedure is performed in thehood and can be repeated 3–4 times before the quartz needs to bechanged. The QCM device is a mLibra from Technobiochip, Italy.The gold-quartz wafer is placed on the electronic console and theresonance frequency of the oscillator is monitored by producerreleased software. The QCM is integrated in a microfluidic circuitconsisting of the cell which contains the oscillator, platinumthreated silicon tubes and a GILSON peristaltic pump. The volumeof the circuit is about 300 μL and the flow rate is 3 μL/s. A gentlecleaning with glycine HCl 0.2 M at pH 2.8 allows the removal ofonly the antigen without significant loss of the tethered antibodiesthus leading to the regeneration of the functionalized gold surface.This procedure can be safely applied approximately three times.
2.5. UV activation of antibody solution
Photonic immobilization technique (PIT) (Della Ventura et al.,2011) is a method to immobilize antibodies onto gold based on thephotonic reduction of disulfide bridges in proteins by UV illumina-tion of near aromatic amino acid (Neves-Petersen et al., 2002). PITleads to antibodies oriented side-up i.e. they expose the Fab ontothiol-reactive surfaces like gold plates. The only requirement forapplying this technique is the presence into the protein of a closelyspaced tryptophan/cysteine–cysteine (Trp/Cys–Cys) triad which isa typical structural characteristic of the immunoglobulin family(Ioerger et al., 1999). The details of this photonic activation havebeen recently reported by Neves-Petersen et al. (2012). Basicallythe UV-excitation of tryptophan can result in its photoionizationthus generating solvated electrons which are captured by the nearelectrophillic species like cystines. In this case the result is thebreakage of the disulfide bridge thereby generating new thiolfunctions (red part in the constant region of the antibody) whichcan easily react with other free thiol groups or with thiol reactivesurfaces like gold plates. The rise of the number of the SH groupsonto the protein allows new structural conformation for theimmobilized immunoglobulin which are characterized by a wellexposure of the antigen binding sites thus greatly improvingsensor sensitivity. It is well known that UV radiation stronglyaffects both structure and activity of biomolecules, but we haverecently demonstrated that the photonic activation of immuno-globulins by femtosecond UV pulses does not affect their ability tocapture the antigen (Funari et al., 2013; Lettieri et al., 2014).
To realize the PIT, antibody samples of 500 μL with a proteinconcentration of 50 μg/mL were activated using the UV lasersource previously described (Fig. 1). In order to find the irradiationconditions which maximize the number of thiol groups permolecule we exploited the so called Ellman's assay (Ellman,1959) (data not shown). For both anti-parathion and anti-patulinantibodies, the irradiation conditions are λ¼258 nm, 10 kHzrepetition rate, 250 mW of average power, and 1 min irradiationtime.
2.6. QCM measurements
Before the experiment each pollutant sample has been incu-bated for 30 min with the same volume of immunoglobulinsolution at a fixed concentration (25 μg/mL), corresponding to an
initial concentration of Abfree (free antibody in solution) of[Abfree]0E0.17 μM. This mixture is then tested by the QCM basedimmunosensor. The experimental procedure consists in the flow-ing of different solutions onto the gold sensitive surface of thecrystal using the fluidic apparatus previously described. TypicalQCM outputs involving either irradiated or non-irradiated anti-bodies in the detection of parathion are shown in Fig. 2.
The first step is the reaching of the basal frequency stabilizationby flowing PBS solution. Then the surface is functionalized usingeither irradiated or non-irradiated antibody sample. This stepgives rise to a first frequency drop of about 140 Hz, which is thesame in both conditions showing that PIT does not affect sig-nificantly the total amount of tethered antibodies. This result is infair agreement with the surface density measurements reportedby Peluso et al. (2003) and can be explained by considering thateven oriented side up the antibodies can tether with an arbitraryazimuthal, which prevents the possibility to line them up. Subse-quently, a washing step with PBS is used to purge the circuit fromthe excess of immunoglobulins. Then a BSA solution (50 mg/mL)flows into the cell filling the remaining free space on the goldsurface. This blocking step is crucial in order to avoid non-specific
Fig. 1. Experimental layout for PIT. The antibodies are “activated” in the cuvette(1) and conveyed through a peristaltic pump (2) to the QCM (3). The electronics ofthe QCM is interfaced with a PC (4) so that the frequency shift due to the antibodytethering is controlled in real time. The white end of the antibodies in the pipe isthe antigen binding site, whereas the red part highlights the region where the freethiols are produced. (For interpretation of the references to color in this figurelegend, the reader is referred to the web version of this article.)
Fig. 2. QCM-based immunosensor outputs for parathion detection using eitherirradiated (black solid line) or non-irradiated (red dashed line) antibodies. The firstfrequency shift at about 150 s corresponds to the antibody immobilization onto thesensor surface, while the second drop at about 550 s is due to the detection ofanalyte–antibody complex (parathion 0.85 μM). The vertical dashed lines highlightthe phases of the protocol described in the text. (For interpretation of thereferences to colour in this figure legend, the reader is referred to the web versionof this article.)
R. Funari et al. / Biosensors and Bioelectronics 67 (2015) 224–229226

interactions between the further flowing molecules and the goldplate. It is worth notice that this phase results in a negligiblechange in the resonance frequency, therefore proving that the goldsurface is quite completely covered by the antibodies. Afteranother cleaning step with PBS, the analyte–antibody sampleflows into the circuit and the labeled antigens are captured bythe immobilized antibodies, thus resulting in the second frequencyshift. This signal is much bigger when the sensor surface isfunctionalized using UV activated antibodies. A final washing stepis then used to remove weakly bonded analytes.
It is important to highlight that in this scheme three speciescan interact with the sensor (Fig. 3): A (antigen), A–Abfree (anti-gen–antibody complex) and Abfree (antibody).
The advantage of the simultaneous injection of the threespecies (A, Abfree and A–Abfree) rather than the sequential injectionof A and Abfree, as it occurs in the “standard sandwich ELISA”protocol (Crowther, 1995), relies in the higher effective concentra-tion of the analyte in the interaction volume. In fact, due to thestationary equilibrium conditions occurring in the interactionvolume of the QCM, when the antibodies are mixed with thesolution to be analyzed, the effective antigen concentration in theinteraction volume coincides with the antigen concentration in theoriginal solution. On the opposite, when the original solution isinjected first into QCM and the antibody is injected in a second
step after a necessary washing (as in the “standard sandwichELISA” protocol), the effective antigen concentration is lower sincethere are no free antigens that could replace those detached fromthe QCM plate by the free antibodies. This, in turn, leads to areduction of the QCM frequency shift which we measured to beapproximately two. Since the aim of this work was the search forthe highest sensitivity, the injection of the solution mixed withantibodies was preferred. The drawback of such an approach reliesin the need of high antibody concentration in the original solutionso that virtually all the antigens are bound and the probability offinding free antigen is negligible. At antigen concentration muchhigher than the antibody concentration there will be free antigensthat would bind the antibodies tethered to the gold plate. In thiscase the QCM will not provide a detectable signal because of thelow antigen mass giving rise to the so-called “hook effect” whichcan be shifted to high analyte concentration by simply increasingthe antibody concentration (Amarasiri Fernando and Wilson,1992).
3. Results and discussion
The response of the QCM is proportional to the mass tetheredto the electrode (Sauerbrey, 1959) so that through the measure-ment of the frequency shift Δf ([A] )0 , we measure the concentra-tion of the analyte in the solution. While a detailed description ofthe process in terms of chemical kinetic would require a complexanalysis which should also include the diffusion of the severalspecies, we can easily model the observed dynamics by consider-ing the law of mass action and the free diffusion conditions of ourexperiment. In fact, in this case a Michaelis–Menten type equationis expected to well describe the process when [A]0{[Abfree]0:
Δ =Δ
+f
fK
([A] )( ) [A]
[A] (1)0sat 0
M 0
In Eq. (1) Δf( )sat contains the instrument response and KM is theso-called Michaelis–Menten constant. The former parameter in-cludes the number of antibodies tethered on the balance as well astheir effectiveness in capturing the analyte, i.e. their orientation,whereas the latter provides an estimation of the linear range ofthe sensor. As explained in Section 2.6, an excess of analyteconcentration in the original solution ([A]0c[Abfree]0) makes highthe probability that tethered antibodies bind the analytes(A) rather than the complexed analytes (A–Abfree), but due to thesmall mass of the analyte such a recognition does not lead to ameasurable frequency shift. Thus, when [A] increases and the
Fig. 3. Sketch of the cell containing the surface detector. The antibodies activatedby the PIT are shown with their lower part in red and are tethered side-up on thegold electrode. The solution flowing through the cell contains analyte (small yellowparticles) bound to the Ab (green Y-shape), but also “free” Ab and “free” analytes.When a free analyte is recognized by the Ab tethered to the gold, there is no effecton the QCM frequency since the deposited mass is too small. Only when the“sandwich” configuration is realized there is a detectable response. (For interpreta-tion of the references to colour in this figure legend, the reader is referred to theweb version of this article.)
0 1 2 3 4 5 6 70
50
100
150
0.0 0.1 0.2 0.30
20
40
60
Parathion concentration (µM)
−Δf (
Hz)
a
0 1 2 3 4 5
0
20
40
60
80
100
120
0.0 0.1 0.2 0.30
10
20
Patulin concentration (µM)
−Δf (
Hz)
b
Fig. 4. Response of the QCM to (a) parathion and (b) patulin concentrations when the antibody is irradiated (circle points) and not irradiated (square points). The pointsachieved with the irradiated antibody are fitted by Eq. (2) (bold line). The low frequency change achieved when the antibody is not irradiated does not allow any significantfit of the experimental data. The inset is the enlargement of the low concentration region, whereas the dashed red lines are the plots of Eq. (1), i.e. the inhibition effect of thefree antigens is hampered by high Abfree concentration. (For interpretation of the references to color in this figure legend, the reader is referred to the web version of thisarticle.)
R. Funari et al. / Biosensors and Bioelectronics 67 (2015) 224–229 227
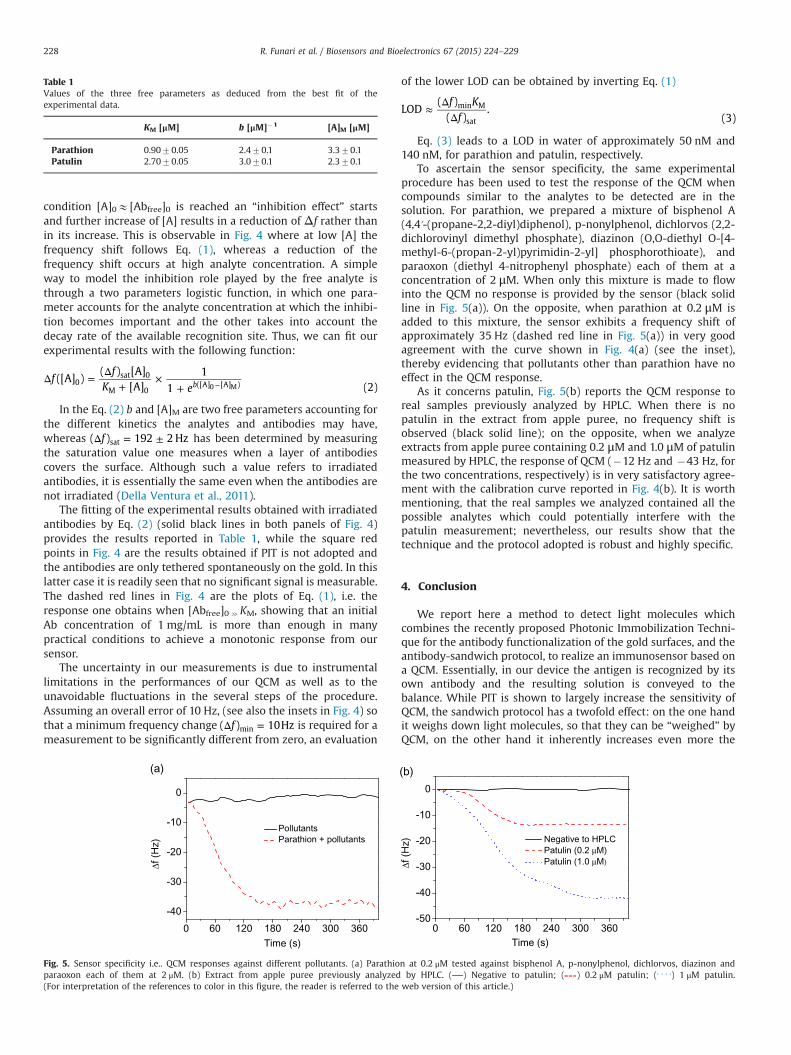
condition [A]0E[Abfree]0 is reached an “inhibition effect” startsand further increase of [A] results in a reduction of Δf rather thanin its increase. This is observable in Fig. 4 where at low [A] thefrequency shift follows Eq. (1), whereas a reduction of thefrequency shift occurs at high analyte concentration. A simpleway to model the inhibition role played by the free analyte isthrough a two parameters logistic function, in which one para-meter accounts for the analyte concentration at which the inhibi-tion becomes important and the other takes into account thedecay rate of the available recognition site. Thus, we can fit ourexperimental results with the following function:
Δ =Δ
+×
+ −f
fK e
([A] )( ) [A]
[A]1
1 (2)b0sat 0
M 0([A] [A] )0 M
In the Eq. (2) b and [A]M are two free parameters accounting forthe different kinetics the analytes and antibodies may have,whereas Δ = ±f( ) 192 2 Hzsat has been determined by measuringthe saturation value one measures when a layer of antibodiescovers the surface. Although such a value refers to irradiatedantibodies, it is essentially the same even when the antibodies arenot irradiated (Della Ventura et al., 2011).
The fitting of the experimental results obtained with irradiatedantibodies by Eq. (2) (solid black lines in both panels of Fig. 4)provides the results reported in Table 1, while the square redpoints in Fig. 4 are the results obtained if PIT is not adopted andthe antibodies are only tethered spontaneously on the gold. In thislatter case it is readily seen that no significant signal is measurable.The dashed red lines in Fig. 4 are the plots of Eq. (1), i.e. theresponse one obtains when [Abfree]0cKM, showing that an initialAb concentration of 1 mg/mL is more than enough in manypractical conditions to achieve a monotonic response from oursensor.
The uncertainty in our measurements is due to instrumentallimitations in the performances of our QCM as well as to theunavoidable fluctuations in the several steps of the procedure.Assuming an overall error of 10 Hz, (see also the insets in Fig. 4) sothat a minimum frequency change Δ =f( ) 10Hzmin is required for ameasurement to be significantly different from zero, an evaluation
of the lower LOD can be obtained by inverting Eq. (1)
≈Δ
Δf K
fLOD
( )( )
.(3)
min M
sat
Eq. (3) leads to a LOD in water of approximately 50 nM and140 nM, for parathion and patulin, respectively.
To ascertain the sensor specificity, the same experimentalprocedure has been used to test the response of the QCM whencompounds similar to the analytes to be detected are in thesolution. For parathion, we prepared a mixture of bisphenol A(4,4ʹ-(propane-2,2-diyl)diphenol), p-nonylphenol, dichlorvos (2,2-dichlorovinyl dimethyl phosphate), diazinon (O,O-diethyl O-[4-methyl-6-(propan-2-yl)pyrimidin-2-yl] phosphorothioate), andparaoxon (diethyl 4-nitrophenyl phosphate) each of them at aconcentration of 2 μM. When only this mixture is made to flowinto the QCM no response is provided by the sensor (black solidline in Fig. 5(a)). On the opposite, when parathion at 0.2 μM isadded to this mixture, the sensor exhibits a frequency shift ofapproximately 35 Hz (dashed red line in Fig. 5(a)) in very goodagreement with the curve shown in Fig. 4(a) (see the inset),thereby evidencing that pollutants other than parathion have noeffect in the QCM response.
As it concerns patulin, Fig. 5(b) reports the QCM response toreal samples previously analyzed by HPLC. When there is nopatulin in the extract from apple puree, no frequency shift isobserved (black solid line); on the opposite, when we analyzeextracts from apple puree containing 0.2 μM and 1.0 μM of patulinmeasured by HPLC, the response of QCM (�12 Hz and �43 Hz, forthe two concentrations, respectively) is in very satisfactory agree-ment with the calibration curve reported in Fig. 4(b). It is worthmentioning, that the real samples we analyzed contained all thepossible analytes which could potentially interfere with thepatulin measurement; nevertheless, our results show that thetechnique and the protocol adopted is robust and highly specific.
4. Conclusion
We report here a method to detect light molecules whichcombines the recently proposed Photonic Immobilization Techni-que for the antibody functionalization of the gold surfaces, and theantibody-sandwich protocol, to realize an immunosensor based ona QCM. Essentially, in our device the antigen is recognized by itsown antibody and the resulting solution is conveyed to thebalance. While PIT is shown to largely increase the sensitivity ofQCM, the sandwich protocol has a twofold effect: on the one handit weighs down light molecules, so that they can be “weighed” byQCM, on the other hand it inherently increases even more the
Table 1Values of the three free parameters as deduced from the best fit of theexperimental data.
KM [μM] b [μM]�1 [A]M [μM]
Parathion 0.9070.05 2.470.1 3.370.1Patulin 2.7070.05 3.070.1 2.370.1
0 60 120 180 240 300 360
-40
-30
-20
-10
0
Δf (
Hz)
Time (s)
PollutantsParathion + pollutants
(a)
0 60 120 180 240 300 360-50
-40
-30
-20
-10
0
Negative to HPLC Patulin (0.2 μM) Patulin (1.0 μM)Δf
(H
z)
Time (s)
(b)
Fig. 5. Sensor specificity i.e.. QCM responses against different pollutants. (a) Parathion at 0.2 μM tested against bisphenol A, p-nonylphenol, dichlorvos, diazinon andparaoxon each of them at 2 μM. (b) Extract from apple puree previously analyzed by HPLC. ( ) Negative to patulin; ( ) 0.2 μM patulin; ( ) 1 μM patulin.(For interpretation of the references to color in this figure, the reader is referred to the web version of this article.)
R. Funari et al. / Biosensors and Bioelectronics 67 (2015) 224–229228
specificity of the whole device. The sandwich protocol proposedhere considers the inclusion of free antibody in the solution to beanalyzed, so that the formation of the analyte-antibody complextakes place in the cuvette, and a subsequent injection of the wholesolution into QCM. Compared to the typical sandwich ELISAprotocol, in which the solution is conveyed as it is to the tetheredantibodies and the second antibody is added after a washing, ourapproach leads to higher sensitivity, the drawback of the decreaseof the signal in presence of high analyte concentration being easilyovercome by using higher antibody concentration in the mixingvolume. On the opposite, one of the advantages of our immuno-sensors relies in its generality, since in practice antibodies can beproduced for any analyte. We have applied our device to parathionand patulin for which LODs of 50 nM and 140 nM were achieved,respectively. In a scenario with lack of simple and reliableimmunochemical analysis for two important analytes such asparathion and patulin, our QCM based immunosensor has notice-able advantages in terms of rapidity in the response (only fewminutes are required), flexibility and portability, lending itselfappropriate for in situ analysis.
Acknowledgments
We acknowledge the financial support of the “Fondazione conil Sud” (Project no. 2011-PDR-18, “Biosensori piezoelettrici arisposta in tempo reale per applicazioni ambientali e agro-alimen-tari”) and the Italian Ministry for Reaserch (MIUR) under the Grantno. PON_0101517.
References
Amarasiri Fernando, S., Wilson, G.S., 1992. J. Immunol. Methods 151, 47–56.Berthiller, F., Burdaspal, P.A., Crews, C., Iha, M.H., Krska, R., Lattanzio, V.M.T.,
MacDonald, S., Malone, R.J., Maragos, C., Solfrizzo, M., Stroka, J., Whitaker, T.B., 2014. World Mycotoxin J. 7, 3–33.
Bi, X., Yang, K.-L., 2009. Anal. Chem. 81, 527–532.Blasco, C., Fernández, M., Picó, Y., Font, G., 2004. J. Chromatogr. A 1030, 77–85.Carabias Martinez, R., Rodriguez Gonzalo, E., Amigo Moran, M.J., Hernandez
Mendez, J., 1992. J. Chromatogr. A 607, 37–45.Cooper, M.A., Singleton, V.T., 2007. J. Mol. Recognit. 20, 154–184.
Crowther, J.R., 1995. ELISA: Theory and Practice. Humana Press, Totowa, NJ.Damián Chanique, G., Heraldo Arévalo, A., Alicia Zon, M., Fernández, H., 2013.
Talanta 111, 85–92.De Champdoré, M., Bazzicalupo, P., De Napoli, L., Montesarchio, D., Di Fabio, G.,
Cocozza, I., Parracino, A., Rossi, M., D’Auria, S., 2007. Anal. Chem. 79, 751–757.Della Ventura, B., Schiavo, L., Altucci, C., Esposito, R., Velotta, R., 2011. Biomed. Opt.
Express 2, 3223–3231.Ellman, G.L., 1959. Biophysics 82, 70–77.Funari, R., Della Ventura, B., Schiavo, L., Esposito, R., Altucci, C., Velotta, R., 2013.
Anal. Chem. 85, 6392–6397.Geschwindner, S., Carlsson, J.F., Knecht, W., 2012. Sensors 12, 4311–4323.Ioerger, T.R., Du, C., Linthicum, D.S., 1999. Mol. Immunol. 36, 373–386.Jin, X., Jin, X., Liu, X., Chen, L., Jiang, J., Shen, G., Yu, R., 2009. Anal. Chim. Acta 645,
92–97.Jones, A.M., Grossmann, G., Danielson, J.Å., Sosso, D., Chen, L.-Q., Ho, C.-H.,
Frommer, W.B., 2013. Curr. Opin. Plant Biol. 16, 389–395.Jung, Y., Jeong, J.Y., Chung, B.H., 2008. Analyst 133, 697–701.Kwakman, P.J.M., Vreuls, J.J., Brinkman, U.A.T., Ghijsen, R.T., 1992. Chromatographia
34, 41–47.Lettieri, S., Avitabile, A., Della Ventura, B., Funari, R., Ambrosio, A., Maddalena, P.,
Valadan, M., Velotta, R., Altucci, C., 2014. Appl. Phys. A, http://dx.doi.org/10.1007/s00339-014-8340-4, in press.
Milles, H.L., Salt, H.B., 1950. Brit Med. J. 2, 444.Mulchandani, P., Chen, W., Mulchandani, A., 2001. Sci. Technol. 35, 2562–2565.Neves-Petersen, M.T., Petersen, S., Gajula, G.P., 2012. In: Satyen Saha (Ed.). UV Light
Effects on Proteins: From Photochemistry to Nanomedicine in Molecular Photo-chemistry: Various Aspects. Tech-Open Access Company. http://dx.doi.org/10.5772/37947. Available from: http://www.intechopen.com/books/molecular-photochemistry-various-aspects/uv-light-effects-on-proteins-from-photochemistry-to-nanomedicine.
Neves-Petersen, M.T., Gryczynski, Z., Lakowicz, J., Fojan, P., Pedersen, S., Petersen, E.,Bjørn Petersen, S., 2002. Protein Sci. 11, 588–600.
Nicu, L., Leichle, T., 2008. J. Appl. Phys. 104, 111101.Peluso, P., Wilson, D.S., Do, D., Tran, H., Venkatasubbaiah, M., Quincy, D., Heidecker,
B., Poindexter, K., Tolani, N., Phelan, M., Witte, K., Jung, L.S., Wagner, P., Nock, S.,2003. Anal. Biochem. 312, 113–124.
Pennacchio, A., Ruggiero, G., Staiano, M., Piccialli, G., Oliviero, G., Lewkowicz, A.,Synak, A., Bojarski, P., D’Auria, S., 2014. Opt. Mater. (Amst) 36, 1670–1675.
Pereira, V.L., Fernandes, J.O., Cunha, S.C., 2014. Trends Food Sci. Technol. 36, 96–136.Pohanka, M., Jun, D., Kuca, K., 2007. Drug Chem. Toxicol. 30, 253–261.Prieto-Simón, B., Campàs, M., 2009. Monatshefte für Chem. – Chem. Mon. 140, 915–
920.Puel, O., Galtier, P., Oswald, I.P., 2010. Toxins 2, 613–631.Sauerbrey, G., 1959. Z. Phys. 155, 206–222.Starodub, N.F., Slishek, N.F., 2012. Adv. Biosens. Bioelectron. 2, 7–15.Trilling, A.K., Harmsen, M.M., Ruigrok, V.J.B., Zuilhof, H., Beekwilder, J., 2013.
Biosens. Bioelectron. 40, 219–226.Vashist, S.K., Vashist, P., 2011. J. Sensors 2011, 1–13.Vidal, J.C., Bonel, L., Ezquerra, A., Hernández, S., Bertolín, J.R., Cubel, C., Castillo, J.R.,
2013. Biosens. Bioelectron. 49, 146–158.Zen, J.-M., Jou, J.-J., Senthil Kumar, A., 1999. Anal. Chim. Acta 396, 39–44.
R. Funari et al. / Biosensors and Bioelectronics 67 (2015) 224–229 229
RESEARCH PAPER
A simple MALDI plate functionalization by Vmh2 hydrophobinfor serial multi-enzymatic protein digestions
Sara Longobardi & Alfredo Maria Gravagnuolo & Riccardo Funari &Bartolomeo Della Ventura & Francesca Pane & Eugenio Galano &
Angela Amoresano & Gennaro Marino & Paola Giardina
Received: 10 September 2014 /Revised: 28 October 2014 /Accepted: 30 October 2014 /Published online: 14 November 2014# Springer-Verlag Berlin Heidelberg 2014
Abstract The development of efficient and rapid methods forthe identification with high sequence coverage of proteins isone of the most important goals of proteomic strategies today.The on-plate digestion of proteins is a very attractive approach,due to the possibility of coupling immobilized-enzymatic di-gestion with direct matrix-assisted laser desorption/ionization(MALDI)-time of flight (TOF)-mass spectrometry (MS) anal-ysis. The crucial step in the development of on-plate immobi-lization is however the functionalization of the solid surface.Fungal self-assembling proteins, the hydrophobins, are able toefficiently functionalize surfaces. We have recently shown thatsuch modified plates are able to absorb either peptides orproteins and are amenable to MALDI-TOF-MS analysis. Inthis paper, the hydrophobin-coatedMALDI sample plates wereexploited as a lab-on-plate for noncovalent immobilization ofenzymes commonly used in protein identification/characteriza-tion, such as trypsin, V8 protease, PNGaseF, and alkalinephosphatase. Rapid and efficient on-plate reactions were per-formed to achieve high sequence coverage of model proteins,particularly when performing multiple enzyme digestions. Thepossibility of exploiting this direct on-plate MALDI-TOF/TOFanalysis has been investigated on model proteins and, as proofof concept, on entire whey milk proteome.
Keywords Functional surface . Deglycosylation .Massspectrometry . Posttranslational modifications .
Self-assembling protein . Enzyme immobilization
Introduction
Mass spectrometry-based proteomics is currently the mostvaluable analytical tool for identification of proteins presentin complex biological samples such as cell lysates, bodyfluids, or tissues [1]. In a typical bottom-up analytical strategy,proteins are enzymatically digested into peptide fragments,before a mass spectrometric (MS) analysis. Peptide massmapping and MS/MS sequence analysis are key methodscurrently used in protein identification [2, 3]. It is generallyconsidered that the in-solution digestion is the most time-consuming step in this workflow. The enzyme/substrate ratiohas to be kept low (generally 1:50) to prevent proteaseautodigested products. For this reason, the incubation withfree proteases is usually performed for 12–24 h at 37 °C toachieve an efficient proteolysis.
To try to address the demands of reducing digestion times,while maintaining high sequence coverage, immobilization ofproteases onto a solid support has emerged as a promisingalternative to the in-solution digestion. Immobilization leadsto increased enzyme stability, reduced autolysis, and im-proved digestion efficiency due to the increased enzyme-to-protein ratio [4–6]. Trypsin is the most widely used enzyme inproteomics [7–10], particularly due to its restricted specificity(Arg-X, Lys-X) [11]. Several methods for trypsin immobili-zation have been explored, such as adsorption [12–15], en-capsulation [16, 17], and covalent binding [18, 19]. Differentmaterials (such as silica, PTFE, magnetic nanoparticles, andso on) have also been tested for both offline digestion andmicrofluidic devices [20–23].
This article is dedicated to the memory of Prof. Alessandro Ballio, aMaster of Life and Science.
Electronic supplementary material The online version of this article(doi:10.1007/s00216-014-8309-3) contains supplementary material,which is available to authorized users.
S. Longobardi (*) :A. M. Gravagnuolo : F. Pane : E. Galano :A. Amoresano :G. Marino : P. GiardinaDepartment of Chemical Sciences, University of Naples “FedericoII”, Via Cintia 4, 80126 Naples, Italye-mail: [email protected]
R. Funari : B. Della VenturaDepartment of Physics, University of Naples “Federico II”, ViaCintia 4, 80126 Naples, Italy
Anal Bioanal Chem (2015) 407:487–496DOI 10.1007/s00216-014-8309-3
Despite the many advantages of trypsin, the use of otherproteases or other enzymes is often necessary. Tryptic diges-tion can often result in limited sequence coverage [24] be-cause of the following: (i) lack or excess of Lys and Argresidues, (ii) length of the digested fragments due to missedcleavages, and (iii) the presence of posttranslational modifi-cation (i.e., phosphorylation and glycosylation) which canaffect the extent of digestion and/or lower the ionizationefficiency. To overcome these potential issues, the use of otherenzymes, including pepsin [25, 26] chymotrypsin [27, 28],and alkaline phosphatase [28], has been suggested.
The application of matrix-assisted laser desorption/ionization (MALDI)-time of flight (TOF) on-plate digestionis a very attractive strategy due to the possibility of couplingimmobilized-enzymatic reactions with direct mass spectrom-etry analysis [29–31]. However, to the best of our knowledge,no multi-enzymatic digestion directly on MALDI plate has sofar been reported. The crucial step in development of on-plateenzyme immobilization is in reality the functionalization ofthe solid surface.
Design and realization of stable bio/non-biointerfaces ableto immobilize biomolecules are key features in several pro-cesses. In particular, protein immobilization on surfaces iscurrently a hot topic in biotechnology, since commercial so-lutions are of limited availability. It is worth considering that itis extremely difficult to find a common surface suitable for theadsorption of different proteins having a broad range of mo-lecular weights and physicochemical properties, such ascharge and hydrophobicity [32].
Recent studies from our research group have demonstratedan efficient surface functionalization by means of a nanostruc-tured layer of amphiphilic proteins, named hydrophobins [33].
Hydrophobins are a family of small amphipathic proteinsproduced by filamentous fungi, able to self-assemble on hy-drophobic or hydrophilic solid surfaces [34]. Due to theirinteresting properties, several biotechnological applicationshave been reported [35–37]. In particular, hydrophobin coat-ing has been used as an intermediate layer to attach cells,proteins, or other biomolecules to surfaces for developmentof several biotools such as biosensors [38–41]. However, themechanism of binding of proteins to hydrophobin-coatedsurfaces is still a matter of discussion [40].
A class I hydrophobin secreted by the basidiomycete fun-gus Pleurotus ostreatus (Vmh2) has been extensively studiedin our lab [42]. We have demonstrated that Vmh2 spontane-ously forms a stable and homogeneous layer on hydrophilic orhydrophobic surfaces, which are able to strongly bind pro-teins, including enzymes in their active form [33]. Recently,we reported a novel surface biofunctionalization of steelMALDI sample plates by self-assembling of Vmh2, for on-plate high-throughput desalting of proteins and peptides inreal samples and offline coupled with MS analysis [43]. Nobackground interference due to Vmh2 molecular ion signals
was detected in any mass range, possibly because of the lowamount of protein in the nanometric layer. This low-cost, fast,and environmentally friendly strategy allows a remarkableincrease of the signal-to-noise ratio of the MALDI massspectra. Following on from these results, we have investigateda strategy aimed at including the proteolytic steps on thehydrophobin-coated MALDI sample plate. It is worth consid-ering that only few examples of phosphatase or deglycosidaseimmobilization are reported [28, 44, 45] in comparison withthe ample literature concerning trypsin immobilization. Asproof of concept, we have used trypsin, V8 protease,PNGaseF, and alkaline phosphatase to achieve high sequencecoverage of model proteins, particularly when performingmultiple enzyme digestions. Moreover, the possibility ofexploiting this technique coupled to MALDI-TOF/TOF se-quencing has been applied on both model proteins and on theentire whey milk proteome.
Experimental section
Materials Nα-p-tosyl-L-arginine methyl ester hydrochloride(TAME), lysozyme from chicken egg white, ovalbumin fromchicken egg white, α-casein and β-casein from bovine milkwere purchased from Sigma (St. Louis, MO, USA). Recombi-nant human erythropoietin (rhEPO) was purchased in pharmacy(α-darbepoetin from Amgem). Laccase phenol oxidase C(POXC) was purified from cultural broth of P. ostreatus (type:Florida no. MYA-2306) [46]. PD-10 desalting columns werepurchased from GE Healthcare (Milan, Italy). Calibration mix-tures were obtained fromABSCIEX (Framingham,MA,USA).
Stock enzyme solutions Trypsin from bovine pancreas, bovinealkaline phosphatase, and V8 protease were purchased fromSigma (St. Louis, MO, USA). PNGaseF was purchased fromRoche. Trypsin stock solution was prepared at 6 mg mL−1 in0.1 % formic acid. The specific activity using TAME assubstrate was about 500 U mg−1. Alkaline phosphatase wasdiluted at 1 U μL−1 in 5 mM Tris, 5 mMMgCl2, and 0.1 mMZnCl2, pH 7.0. PNGaseF was used undiluted (1 U μL−1). V8protease was dissolved in 0.1 M ammonium bicarbonate, pH8.0, at 0.5 U μL−1. One unit is defined as the amount ofenzymatic activity converting 1 μmol of substrate per minute.
Vmh2 purification Vmh2 was prepared from P. ostreatusmycelia as previously described [42]. Preparation basicallyconsists in growing mycelia at 28 °C in static cultures in 2-Lflasks containing 500 mL of potato dextrose (24 g/L) brothwith 0.5 % yeast extract. After 10 days of fungal growth,hydrophobins released into the medium were aggregated byair bubbling using a Waring blender and collected by centri-fugation at 4,000×g. The precipitate was freeze dried, left todissolve under mechanical agitation with trifluoroacetic acid
488 S. Longobardi et al.
(TFA) for 2 h, and treated in bath sonicator (operating at35 kHz and at 240 W) for 30 min. The TFA solution wasdried in a stream of air and Vmh2 dissolved in 60 % ethanol,resulting in a stock solution (100 μg mL−1) which was usedfor further experiments.
Functionalization of steel surface Vmh2-coated steel wasprepared and characterized as previously reported [43]. Brief-ly, 1 μL of Vmh2 solution was spotted on each MALDI platewell. After 1 h, samples were dried for 10 min at 80 °C andwashed with 60% ethanol. Deposition was repeated twice andfinally the plate was washed with 2 % SDS at 100 °C for10 min. The coated MALDI wells were used to noncovalentlyimmobilize a set of four enzymes, usually employed in prote-omics. In our current experience, the same coated plate hasbeen used still after 3 weeks storage at room temperature. Fortrypsin adsorption, the enzyme was diluted in 0.1 % formicacid at different concentrations (from 0.3 to 6 mg mL−1 corre-sponding to 0.15–3 UmL−1). One microliter of these solutionswas spotted on Vmh2-coated wells. After 5-min incubation atroom temperature, wells were washed three times to removethe excess of enzyme. The adsorbed trypsin was characterizedand employed for further experiments. For alkaline phospha-tase, PNGaseF, and V8 protease, 1 μL of enzyme stock solu-tions was spotted on Vmh2-coated wells and immobilizedfollowing an identical procedure. Since the immobilization isa very rapid step, we have routinely used freshly immobilizedenzymes, to perform the required hydrolytic reaction.
Mass spectral determination of immobilized trypsinactivity The enzymatic activity of trypsin in solution wasspectrophotometrically determined at 247 nm with 10 mMTAME as a substrate in 50 mM Tris–HCl pH 8.0, by usingBeckman DU 7500 spectrophotometer (Beckman Instru-ments). For quantitative analysis of TAME converted by on-plate trypsin, liquid chromatography–tandem quadrupolemass spectrometry (LC–MS/MS) in the multiple reactionmonitoring (MRM) was performed by using a 6420 triple Qsystem with a HPLC 1100 series binary pump (Agilent,Waldbronn, Germany). The analytical column was aPhenomenex Kinetex 5u 100 A C18. The mobile phase wasgenerated by mixing eluent A (2 % acetonitrile (ACN) and0.1 % formic acid) and eluent B (95 %ACN and 0.1 % formicacid) and the flow rate was 0.200 mL min−1. The HPLCgradient was from 5 to 95 % B in 8 min then to 100 % for2 min. Standard solutions were prepared by dissolving theequivalent of 1 mg of TAME in 1 mL of methanol. A standardsolution of 500 pg μL−1 of each metabolite was used foroptimization of the MRM transition. The ideal mass spectro-metric parameters for detection were determined viaMassHunter Optimizer software, resulting in 343.43 m/z asprecursor ion, 91.1 and 65.1 m/z product ions, and 48 and92 Voptimized voltages.
Quartz crystal microbalance (QCM) determination ofimmobilized trypsin amount The QCM device is a μLibrafrom Technobiochip, Italy, and the resonance frequency ofthe oscillating crystal is monitored by a producer-releasedsoftware. The oscillators (151218) are AT-CUT quartz witha fundamental frequency of 10 MHz purchased from ICMOklahoma City (USA). The diameters of the crystal and of thegold sensitive surface are 1.37 and 0.68 cm, respectively.Before the functionalization with Vmh2, the electrodes werecleaned using piranha solution (5:1 sulfuric acid/40 % hydro-gen peroxide solution) thus removing any impurity and or-ganic compound from the gold plates. Then, in order to testthe Vmh2–trypsin interaction, the protein-coated oscillator isplaced in a microfluidic apparatus consisting of the cell whichcontains the crystal, a GILSON peristaltic pump, and Tygonsilicone tubes. The volume of the circuit is 300 μL, while theflow rate is about 50 μL min−1. The volume of the sample totest is 1 mL. Using this experimental setup, it was possible toestimate the amount of trypsin adsorbed onto the Vmh2-coated gold surface at several enzyme concentrations.
Substrate preparation Lysozyme, ovalbumin, POXC, α-darbepoetin, and whey milk proteins were dissolved at 5 μMin 0.5 M Tris–HCl pH 8.0 containing 6 M guanidiniumchloride, then reduced in 10 mM dithiothreitol for 2 h at37 °C, and carboxamidomethylated in 50 mM iodoacetamidefor 30 min, in the dark, at room temperature. Samples weredesalted on a PD10 column using 10 mM NH4HCO3
(AMBIC) as eluting buffer. Fractions containing proteins werepooled and lyophilized before the analyses.
In-solution hydrolysis Trypsin (substrate/enzyme ratio, 50:1w/w) was added to the aliquots of denatured proteins andincubated for 18 h at 37 °C. Then, the reactions were stoppedby adding 0.1 % formic acid. Three microliters of stockenzyme solutions was added to the aliquots of boiled tryptichydrolyzed samples.
Setting up on-plate hydrolysis One microliter of denaturedproteins in 10 mM AMBIC was spotted on Vmh2-adsorbedenzyme wells. In the case of trypsin, reaction was carried outfor 5 min, 10 min, 3 h, 6 h, or 18 h at room temperature, in awet atmosphere. The reaction was stopped by addition ofmatrix solution, α-cyano-4-hydroxycinnamic acid (CHCA)(10 mg mL−1 in acetonitrile/0.1 % TFA 7/3 (v/v)). Oncehaving set up the best reaction time (see “Results and discus-sion” section), the serial reactions (trypsin-alkaline phospha-tase, trypsin-PNGaseF, and trypsin-V8 protease) were carriedout as above described for trypsin (1 μL, 5 min).
MALDI-MS analysis MALDI-TOF/MS spectra were ac-quired by a Voyager-DE STR MALDI-TOF mass spectrome-ter (Applied Biosystems, Framingham, MA, USA) equipped
MALDI plate functionalization by Vmh2 hydrophobin 489
with a nitrogen laser (337 nm). Peptides were detected inreflector mode using CHCA as matrix. Spectra were acquiredusing a mass range of 500–5,000 amu. Acceleration andvoltages were set up as follows: target voltage at 20 kV, gridat 66 % of target voltage, and delayed extraction at 150 ns toobtain the best signal-to-noise (S/N) ratios and the best possi-ble isotopic resolution. Spectra were accumulated in multiplesof 50 laser shots, with 50–2,000 shots in total. The molecularweight standards for the calibration of the Voyager-DE STRsystem were AB SCIEX calibration mixtures 1 and 2.
MS/MS experiments were carried out on a 4800 PlusMALDI-TOF/TOF™ Analyzer AB SCIEX. All acquisitionswere generated automatically in the instrument software andbased on averaging 500 shots per spectrum, with 1,000–2,000shots in total.
Results and discussion
Trypsin immobilization on hydrophobin-coated MALDIsample wells
The ability of the Vmh2-coated MALDI sample plates to bindpeptides and proteins has been previously demonstrated [43].In this work, the most commonly used enzymes in proteomicresearch, including posttranslational demodifying enzymes,have been adsorbed on this layer and their performances havebeen exploited.
Preliminary experiments were aimed at evaluating the cat-alytic activity of the enzyme which was actually adsorbed.Because of the low sensitivity of the spectrophotometric as-say, a mass spectrometry method was set up, by using LC–MS/MSMRM ionmode [47]. Twomicrograms of trypsin wasdeposited on the Vmh2 layer and left standing for 5 min. Afterthoroughly washing the wells with repeated aliquots of 0.1 %formic acid followed by equilibration with AMBIC, theTAME assay was performed. TAME was completely convert-ed in less than 30 s, thus qualitatively indicating that theadsorbed trypsin was fully active. Since we reached theTAME solubility limit (40 mg mL−1), quantitative activitydata were obtained by depositing 1 μg of enzyme. Resultsdemonstrated that about 0.1 μmol of substrate was hydrolyzedin 1 min, indicating that 0.1 U of trypsin per well wasimmobilized. Since Vmh2-coated well surface was equivalentto 7 mm2, the activity/surface ratio was 14 mU mm−2.
To evaluate the actual amount of trypsin adsorbed on aVmh2 layer, QCM was used [48]. The QCM gold sensor wascoated with hydrophobin, taking into consideration that thephysical characteristics of the Vmh2 layer on the gold surfaceare quite similar to those observed on the steel plate (data notshown). After coating, three different amounts of trypsin (1, 3,and 5 μg in 1 mL of 0.1 % formic acid) were tested by
monitoring the resonance frequency of the crystal after theinjection of the sample in the fluidic circuit. Since the frequen-cy shifts (Δf) are related to the amount of material adsorbed onsensor [49], we were able to extrapolate the weight of enzymeimmobilized. Results (see Electronic Supplementary Material(ESM) Fig. S1) indicated that 100, 220, and 250 ng of enzymewere, respectively, adsorbed, corresponding to 3, 6, and7 ngmm−2, thus suggesting that the latter value approximatelycorresponds to that of saturation of the functionalized surface.
In order to evaluate the enzyme-specific activity, we tookinto account that the QCM gold sensor surface (36 mm2) isabout fivefold wider than that of the MALDI sample platewell (7 mm2). The specific activity was calculated by dividingthe enzyme activity measured by MRM analysis(14 mU mm−2) with the weight measured by QCM(7 ng mm−2), values obtained incubating the same amountof enzyme per square millimeter. Hence, the specific activityof immobilized trypsin was considered to be about2,000 Umg−1, some fourfold higher than that of the free form.This increase may be ascribed to a greater accessibility ofsubstrate molecules to active sites of immobilized enzyme asreported elsewhere [50, 51].
Protein digestion by on-plate immobilized trypsin
To test the performance of trypsin immobilized on Vmh2-coated MALDI wells, lysozyme and ovalbumin were used asreference proteins. After reduction, carbamidomethylation,and desalting, protein samples were spotted on the trypsin-immobilized wells and incubated for 5min, 10min, 3 h, 6 h, or18 h at room temperature.
Spectra obtained (Fig. 1) showed that the on-plateimmobilized trypsin was able to extensively hydrolyze thedenatured proteins after 5 min of incubation. As expected,no digestion was observed in the absence of the Vmh2 coat-ing. Eleven unique peptides for lysozyme and 15 unique forovalbumin (ESM Table S1) were identified, allowing 90 and60 % of sequence coverage, respectively (ESM Table S2). Noimprovement of sequence coverage was observed with in-creases in incubation time, even after incubating for 18 h. Itis noteworthy that the spectra used for peptide mapping wererecordedwithout any further samplemanipulation. Indeed, thereaction was stopped by addition of the appropriate matrixsolution, and spectra were recorded immediately after dryingin ambient atmosphere. Therefore, the performance of on-plate trypsin was comparable to that of conventional in-solution digestion (18 h at 37 °C) (ESM Fig. S2) but with avery significant reduction in reaction and sample workup time(about 2 h for plate preparation, which can be used even for100 hydrolysis, and 5 min for the reaction). These resultscould be ascribed to the in situ high enzyme/substrate ratios(about 1:1) with respect to those commonly used. In theconventional (in solution) method, this ratio is kept low
490 S. Longobardi et al.

(generally 1:50 w/w) to prevent excessive formation ofautodigested products. In the reported on-plate method, rapidand efficient proteolysis was achieved with undetectableautodigestion products. As matter of fact, no detectableautoproteolysis product or Vmh2 tryptic peptides were ob-served in any of the tested conditions (ESM Fig. S3). Theabsence of autoproteolysis products can be due to the restrict-ed accessibility of an immobilized trypsin molecule to theactive site of another one. As expected, Vmh2 was notdigested by trypsin because the lone basic amino acid residueis probably hidden in the very compact structure of the layer.
In order to evaluate the reproducibility of the methodology,10 replicates of each sample were prepared and the MALDImass spectrometer was set in automatic mode. Spectra accu-mulated in multiples of 200 laser shots in 10 random positionsof the well (2,000 shots in total) were compared. Peaks/spectrum (12.1±0.6) related to lysozyme were detected (1.8standard deviation). Moreover, all the replicate allowed toobtain the same sequence coverage, thus indicating the repro-ducibility of these analyses.
Immobilization of other enzymes and on-plate serial reactions
The ionization efficiency of a digested fragment depends onits size, sequence, and, possibly, posttranslational modifica-tions, all factors affecting sequence coverage of the targetprotein by MS analysis. Therefore, digestion with other pro-teases, the removal of posttranslational modifications by suit-able enzymes, such as phosphatases or deglycosidase oftenhave to be performed to increase the sequence coverage and/orthe general sensitivity of the analysis.
Our previous results suggest that the Vmh2 layers are ableto bind proteins irrespective of their molecular weights orphysicochemical properties [43]. Therefore, once the use ofimmobilized trypsin was assessed, the on-plate immobiliza-tion of other enzymes commonly used in proteomic researchwas tested in order to further improve sequence coverage,
eventually exploiting multiple hydrolysis experiment on thesame plate.
V8 protease, N-glycosidase F, and alkaline phosphatase(1 μL of stock solutions) were loaded on Vmh2-coatedMALDI wells, using the same procedure described for tryp-sin. We did not attempt any further investigation on the on-plate enzyme activity as we did in the case of trypsin anddirectly tested the performance of these enzymes on proteinsubstrates: ovalbumin for V8, ovalbumin and POXC laccasefor PNGaseF, andα-casein and β-casein from bovine milk foralkaline phosphatase. Substrate proteins were hydrolyzed firstby on-plate immobilized trypsin and then the tryptic digestswere transferred by pipetting about 0.8÷0.9 μL on the appro-priate immobilized enzyme wells and incubated for 5 min.
Results of V8 activity on the ovalbumin tryptic hydrolyzedare shown in Fig. 2. The detection of 11 new peaks (markedwith asterisks) due to the expected hydrolysis after Asp andGlu demonstrated that the enzyme was active and able tohydrolyze the substrate in some 5 min.
Fig. 1 MALDI spectra of lysozyme (A) and ovalbumin (B) after 5 min of on-plate hydrolysis. The assigned signals are marked with asterisks. List ofpeptides with their m/z values is reported in ESM Table S1
Fig. 2 MALDI-TOF spectra of ovalbumin after trypsin-V8 on-platehydrolysis. Eleven new peptides that appeared after V8 digestion aremarked with asterisks and reported in the inset table
MALDI plate functionalization by Vmh2 hydrophobin 491

The performance of immobilized PNGaseF was testedusing ovalbumin and POXC laccase (Fig. 3). In the case ofovalbumin, a new signal appeared at 3,294.44 m/z which canbe attributed to the peptide 292-323 lacking the glycosidicmoiety, where Asn293 has been converted into Asp by thePNGaseF reaction. Similarly, in the case of laccase POXC, anew signal appeared at 1,646.77 m/z which can be attributedto the peptide 433-448 without glycosidic moiety and withAsn 444 converted into Asp46. The identity of these peptideswas confirmed byMALDI-TOF/TOF analysis (an example ofMS/MS spectra is reported in ESM Fig. S4).
Caseins from bovine milk are phosphoproteins with well-characterized phosphorylated sites [52]. Phosphopeptides arenot easily detectable by using MALDI mass spectrometer inpositive ion mode, due to the presence of negative charges.Spectra recorded after 5 min of phosphatase reaction on thetryptic peptides showed the presence of the α-casein peptidescontaining the Ser130-dephosphorylated, 119-134 and 121-134 (1,871.92 and 1,580.76 m/z, respectively), and β-casein-dephosphorylated peptide 1-25 (2,802.34 m/z) (Fig. 4), con-firmed by MALDI-TOF/TOF analysis. Even in this case,
tryptic digestion and dephosphorylation were performed in atotal time of 10 min.
Since the setup method gives us the opportunity to performa number of on-plate reactions in very short times, it can beexploited to achieve an even higher sequence coverage ofproteins by multiple hydrolytic steps. In addition to the N-glycosylation site at Asn293, ovalbumin has a phosphoryla-tion site at Ser69. As reported above, a 60 % of sequencecoverage was achieved after trypsin hydrolysis. When trypsin-digested samples were incubated for 5 min on V8, PNGaseF,and phosphatase-immobilized wells, respectively, new pep-tides were generated: four new unique peptides (605.43,850.50, 2,741.48, 3,031.64 m/z; peptides 201-205, 258-264,204-227, 230-257, respectively) by V8 reaction (see Fig. 2),one peptide (3,294.45 m/z; peptide 292-323) by PNGaseFreaction, and one peptide (2,282.45 m/z; peptide 60-85) byphosphatase reaction, allowed to increase the sequence cov-erage to some 85 %.
The effectiveness of the setup method has also been testedon a real sample of pharmaceutical interest. α-Darbepoetin isa second-generation rhEPO with five modified amino acids
Fig. 3 Section of MALDI-TOF spectra of ovalbumin (on the left) and POXC (on the right) tryptic peptides, before (A) and after (B) on-platedeglycosylation. Deglycosylated peptides are marked with asterisks
492 S. Longobardi et al.

Fig. 4 Section of MALDI-TOF spectra of β-casein (on the left) and α-casein (on the right) tryptic peptides, before (A) and after (B) on-platedephosphorylation. Dephosphorylated peptides are marked with asterisks
Table 1 List of unique peptides of rhEPO obtained by on-plate coupled hydrolysis
Signals (m/z) Start End Sequences Trypsin Trypsin + PNGase PNGase + trypsin
1,184.68 1 10 (−)APPRLIC*DSR(V) + + +
516.42 11 14 (R)VLER (Y) + + +
736.48 15 20 (R)YLLEAK (E) + + +
2,815.66 21 45 (K)EAENITTGC*NETC*SLNENITVPDTK(V) +
1,083.90 46 53 (K)VNFYAWKR(M) +
2,526.70 54 76 (R)MEVGQQAVEVWQGLALLSEAVLR (G) + + +
2,295.27 77 97 (R)GQALLVNSSQVNETLQLHVDK (A) + +
602.45 98 103 (K)AVSGLR(S) +
803.60 104 110 (R)SLTTLLR(A) +
1,465.93 117 131 (K)EAISPPDAASAAPLR(T) +
1,052.68 132 140 (R)TITADTFRK(L) + + +
2,481.24 117 140 (K)EAISPPDAASAAPLRTITADTFRK(L) + + +
563.44 140 143 (R)KLFR(V) + + +
2,274.32 144 162 (R)VYSNFLRGKLKLYTGEAC*R(T) + + +
Glycosylation sites are presented in bold
MALDI plate functionalization by Vmh2 hydrophobin 493
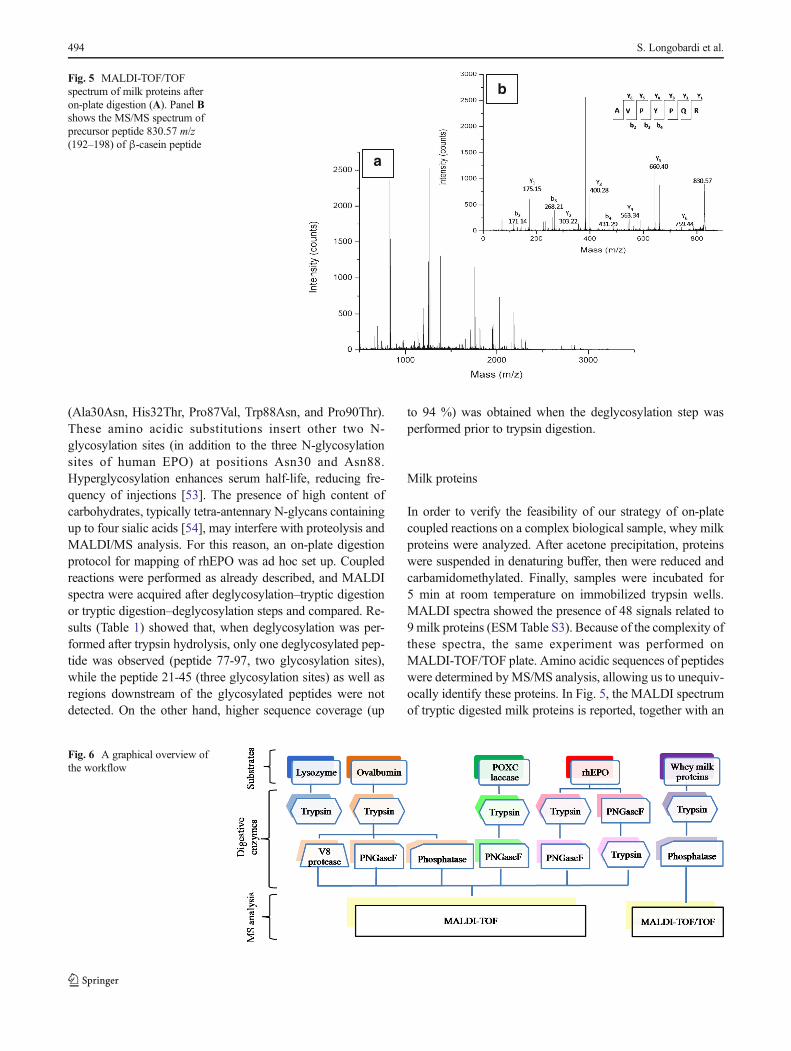
(Ala30Asn, His32Thr, Pro87Val, Trp88Asn, and Pro90Thr).These amino acidic substitutions insert other two N-glycosylation sites (in addition to the three N-glycosylationsites of human EPO) at positions Asn30 and Asn88.Hyperglycosylation enhances serum half-life, reducing fre-quency of injections [53]. The presence of high content ofcarbohydrates, typically tetra-antennary N-glycans containingup to four sialic acids [54], may interfere with proteolysis andMALDI/MS analysis. For this reason, an on-plate digestionprotocol for mapping of rhEPO was ad hoc set up. Coupledreactions were performed as already described, and MALDIspectra were acquired after deglycosylation–tryptic digestionor tryptic digestion–deglycosylation steps and compared. Re-sults (Table 1) showed that, when deglycosylation was per-formed after trypsin hydrolysis, only one deglycosylated pep-tide was observed (peptide 77-97, two glycosylation sites),while the peptide 21-45 (three glycosylation sites) as well asregions downstream of the glycosylated peptides were notdetected. On the other hand, higher sequence coverage (up
to 94 %) was obtained when the deglycosylation step wasperformed prior to trypsin digestion.
Milk proteins
In order to verify the feasibility of our strategy of on-platecoupled reactions on a complex biological sample, whey milkproteins were analyzed. After acetone precipitation, proteinswere suspended in denaturing buffer, then were reduced andcarbamidomethylated. Finally, samples were incubated for5 min at room temperature on immobilized trypsin wells.MALDI spectra showed the presence of 48 signals related to9 milk proteins (ESMTable S3). Because of the complexity ofthese spectra, the same experiment was performed onMALDI-TOF/TOF plate. Amino acidic sequences of peptideswere determined byMS/MS analysis, allowing us to unequiv-ocally identify these proteins. In Fig. 5, the MALDI spectrumof tryptic digested milk proteins is reported, together with an
a
bFig. 5 MALDI-TOF/TOFspectrum of milk proteins afteron-plate digestion (A). Panel Bshows the MS/MS spectrum ofprecursor peptide 830.57 m/z(192–198) of β-casein peptide
Fig. 6 A graphical overview ofthe workflow
494 S. Longobardi et al.

example of MS/MS spectrum. It is worth noting that some ofthem are among the less abundant milk proteins.
Whey milk is rich in phosphoproteins (caseins); thus, de-natured samples were incubated on trypsin-immobilized welland then on alkaline phosphatase-immobilized well. Spectraacquired after double-reaction steps showed the presence ofthe expected dephosphorylated peptides for α-casein(1,871.92 m/z), and β-casein (2,802.34 m/z), confirmed byMS/MS analysis. Results showed that both immobilized en-zymes were able to carry out their function in 10 min even incomplex samples.
Conclusions
Efficient, fast, and reproducible protein digestion is of utmostimportance in bottom-up proteomics. Albeit several trypsin-immobilized systems have been developed for proteolysis, onlyfew studies have described multi-enzymatic immobilized sys-tems [28] and analysis of posttranslational modification inproteins [44, 45]. Our approach is based on the formation ofa protein layer on the MALDI sample plate formed by the self-assembling fungal protein hydrophobin.We have demonstratedthat this layer is able to immobilize different enzymes involvedin proteomic studies, providing a simple and rapid procedurefor the analysis of protein sequences, including posttranslation-al modifications. Several advantages of this in situ procedurecan easily be envisaged: (i) rapid analysis, with a reduction ofdigestion time to fewmin; (ii) use of very low sample volumes,in the order of magnitude of some microliters; (iii) multi-proteolysis steps directly on the same MALDI sample plate,and (iv) posttranslational modification analysis, thanks to theopportunity of immobilization of different enzymes on thesame system. As a consequence, very high sequence coveragehas been obtained. Using MALDI-TOF/TOF, the strategy canbe extended to protein identification/characterization in com-plex proteomes, through peptide mass fingerprinting or(selected) peptide sequencing. The potential of this methodcan be greatly exploited by immobilizing other enzymes and/or setting ad hoc protocols for specific proteins using a combi-nation of proteases and other posttranslational demodifyingenzymes (Fig. 6). The demonstration of achieving an almostcomplete sequence coverage of rhEPO merely by using twoimmobilized enzymes is highly significant. The strategy dem-onstrated in this paper can be further developed to be fullyautomated thus leading to a high-throughput proteome lab-on-plate platform.
Acknowledgments Thisworkwas supported by grant from theMinisterodell’Università e della Ricerca Scientifica-Industrial Research Project “Inte-grated agro-industrial chains with high energy efficiency for the develop-ment of eco-compatible processes of energy and biochemicals productionfrom renewable sources and for the land valorization (EnerbioChem)”
PON01_01966, funded in the frame of Operative National ProgrammeResearch and Competitiveness 2007–2013 D. D. Prot. n. 01/Ric. 18.1.2010.
References
1. Angel TE, Aryal UK, Hengel SM et al (2012) Mass spectrometry-based proteomics: existing capabilities and future directions. ChemSoc Rev 41:3912–3928. doi:10.1039/c2cs15331a
2. Yamaguchi H, Miyazaki M (2013) Enzyme-immobilized reactors forrapid and efficient sample preparation in MS-based proteomic stud-ies. Proteomics 13:457–466. doi:10.1002/pmic.201200272
3. Aebersold R, Mann M (2003) Mass spectrometry-based proteomics.Nature 422:198–207. doi:10.1038/nature01511
4. Switzar L, Giera M, Niessen WMA (2013) Protein digestion: anoverview of the available techniques and recent developments. JProteome Res 12:1067–1077. doi:10.1021/pr301201x
5. Massolini G, Calleri E (2005) Immobilized trypsin systems coupledon-line to separation methods: recent developments and analyticalapplications. J Sep Sci 28:7–21. doi:10.1002/jssc.200401941
6. Girelli AM, Mattei E (2005) Application of immobilized enzymereactor in on-line high performance liquid chromatography: a review.J Chromatogr B Analyt Technol Biomed Life Sci 819:3–16. doi:10.1016/j.jchromb.2005.01.031
7. Vestling MM, Fenselau C (1994) Poly(vinylidene difluoride) mem-branes as the interface between laser desorption mass spectrometry,gel electrophoresis, and in situ proteolysis. Anal Chem 66:471–477.doi:10.1021/ac00076a009
8. Sun J, Hu K, Liu Y et al (2013) Novel superparamagneticsanoparticles for trypsin immobilization and the application for effi-cient proteolysis. J Chromatogr B Analyt Technol Biomed Life Sci942–943:9–14. doi:10.1016/j.jchromb.2013.10.015
9. Bao H, Zhang L, Chen G (2013) Immobilization of trypsin viagraphene oxide-silica composite for efficient microchip proteolysis.J Chromatogr A 1310:74–81. doi:10.1016/j.chroma.2013.08.040
10. Fan C, Shi Z, Pan Y et al (2014) Dual matrix-based immobilizedtrypsin for complementary proteolytic digestion and fast proteomicsanalysis with higher protein sequence coverage. Anal Chem 86:1452–1458. doi:10.1021/ac402696b
11. Brownridge P, Beynon RJ (2011) The importance of the digest:proteolysis and absolute quantification in proteomics. Methods 54:351–360. doi:10.1016/j.ymeth.2011.05.005
12. Liu Y, Lu H, Zhong W et al (2006) Multilayer-assembled microchipfor enzyme immobilization as reactor toward low-level protein iden-tification. Anal Chem 78:801–808. doi:10.1021/ac051463w
13. Liu Y, Zhong W, Meng S et al (2006) Assembly-controlled biocom-patible interface on a microchip: strategy to highly efficient proteol-ysis. Chemistry 12:6585–6591. doi:10.1002/chem.200501622
14. Gao J, Xu J, Locascio LE, Lee CS (2001) Integrated microfluidicsystem enabling protein digestion, peptide separation, and proteinidentification. Anal Chem 73:2648–2655
15. Qiao L, Liu Y, Hudson SP et al (2008) A nanoporous reactor forefficient proteolysis. Chemistry 14:151–157. doi:10.1002/chem.200701102
16. Min Q, Zhang X, Wu R et al (2011) A novel magnetic mesoporoussilica packed S-shaped microfluidic reactor for online proteolysis oflow-MW proteome. Chem Commun (Camb) 47:10725–10727. doi:10.1039/c1cc13969j
17. Qu H,Wang H, Huang Yet al (2004) Stable microstructured networkfor protein patterning on a plastic microfluidic channel: strategy andcharacterization of on-chip enzyme microreactors. Anal Chem 76:6426–6433. doi:10.1021/ac049466g
18. Lee J, Musyimi HK, Soper SA, Murray KK (2008) Development ofan automated digestion and droplet deposition microfluidic chip for
MALDI plate functionalization by Vmh2 hydrophobin 495
MALDI-TOF MS. J Am Soc Mass Spectrom 19:964–972. doi:10.1016/j.jasms.2008.03.015
19. KimBC, Lopez-Ferrer D, Lee S-M et al (2009) Highly stable trypsin-aggregate coatings on polymer nanofibers for repeated protein diges-tion. Proteomics 9:1893–1900. doi:10.1002/pmic.200800591
20. Dodds ED, Seipert RR, Clowers BH et al (2009) Analytical perfor-mance of immobilized pronase for glycopeptide footprinting andimplications for surpassing reductionist glycoproteomics. JProteome Res 8:502–512. doi:10.1021/pr800708h
21. López-Ferrer D, Hixson KK, SmallwoodH et al (2009) Evaluation ofa high-intensity focused ultrasound-immobilized trypsin digestionand 18O-labeling method for quantitative proteomics. Anal Chem81:6272–6277. doi:10.1021/ac802540s
22. Casadonte F, Pasqua L, Savino R, Terracciano R (2010) Smart trypsinadsorption into N-(2-aminoethyl)-3-aminopropyl-modified mesopo-rous silica for ultra fast protein digestion. Chemistry 16:8998–9001.doi:10.1002/chem.201000120
23. Lim LW, Tomatsu M, Takeuchi T (2006) Development of an on-lineimmobilized-enzyme reversed-phase HPLC method for protein di-gestion and peptide separation. Anal Bioanal Chem 386:614–620.doi:10.1007/s00216-006-0458-6
24. Guo X, Trudgian DC, Lemoff A et al (2014) Confetti: amultiprotease map of the HeLa proteome for comprehensiveproteomics. Mol Cell Proteomics 13:1573–1584. doi:10.1074/mcp.M113.035170
25. Cingöz A, Hugon-Chapuis F, Pichon V (2010) Total on-line analysisof a target protein from plasma by immunoextraction, digestion andliquid chromatography-mass spectrometry. J Chromatogr B AnalytTechnol Biomed Life Sci 878:213–221. doi:10.1016/j.jchromb.2009.07.032
26. Geiser L, Eeltink S, Svec F, Fréchet JMJ (2008) In-line system con-taining porous polymer monoliths for protein digestion withimmobilized pepsin, peptide preconcentration and nano-liquid chroma-tography separation coupled to electrospray ionization mass spectros-copy. J Chromatogr A 1188:88–96. doi:10.1016/j.chroma.2008.02.075
27. Temporini C, Calleri E, Campèse D et al (2007) Chymotrypsinimmobilization on epoxy monolithic silica columns: developmentand characterization of a bioreactor for protein digestion. J Sep Sci30:3069–3076. doi:10.1002/jssc.200700337
28. Yamaguchi H, Miyazaki M, Kawazumi H, Maeda H (2010)Multidigestion in continuous flow tandem protease-immobilizedmicroreactors for proteomic analysis. Anal Biochem 407:12–18.doi:10.1016/j.ab.2010.07.026
29. Urban PL, Amantonico A, Zenobi R (2011) Lab-on-a-plate: extend-ing the functionality of MALDI-MS and LDI-MS targets. MassSpectrom Rev 30:435–478. doi:10.1002/mas.20288
30. Jiang B, Yang K, Zhang L et al (2014) Dendrimer-grafted grapheneoxide nanosheets as novel support for trypsin immobilization toachieve fast on-plate digestion of proteins. Talanta 122:278–284.doi:10.1016/j.talanta.2014.01.056
31. Li Y, Yan B, Deng C et al (2007) On-plate digestion of proteins usingnovel trypsin-immobilized magnetic nanospheres for MALDI-TOF-MS analysis. Proteomics 7:3661–3671. doi:10.1002/pmic.200700464
32. De Stefano L, Rea I, Rendina I et al (2011) Organic–inorganicinterfaces for a new generation of hybrid biosensors. BiosensHealth Environ Biosecurity
33. De Stefano L, Rea I, De Tommasi E et al (2009) Bioactive modifi-cation of silicon surface using self-assembled hydrophobins fromPleurotus ostreatus. Eur Phys J E Soft Matter 30:181–185. doi:10.1140/epje/i2009-10481-y
34. Linder MB (2009) Hydrophobins: proteins that self assemble atinterfaces. Curr Opin Colloid Interface Sci 14:356–363. doi:10.1016/j.cocis.2009.04.001
35. Hektor HJ, Scholtmeijer K (2005) Hydrophobins: proteins withpotential. Curr Opin Biotechnol 16:434–439. doi:10.1016/j.copbio.2005.05.004
36. Zampieri F, Wösten HAB, Scholtmeijer K (2010) Creating surfaceproperties using a palette of hydrophobins. Materials (Basel) 3:4607–4625. doi:10.3390/ma3094607
37. Wohlleben W, Subkowski T, Bollschweiler C et al (2010)Recombinantly produced hydrophobins from fungal analogues ashighly surface-active performance proteins. Eur Biophys J 39:457–468. doi:10.1007/s00249-009-0430-4
38. Sun T, Qing G, Su B, Jiang L (2011) Functional biointerface mate-rials inspired from nature. Chem Soc Rev 40:2909–2921. doi:10.1039/c0cs00124d
39. Qin M, Wang L-K, Feng X-Z et al (2007) Bioactive surface modifica-tion of mica and poly(dimethylsiloxane) with hydrophobins for proteinimmobilization. Langmuir 23:4465–4471. doi:10.1021/la062744h
40. Wang Z, Lienemann M, Qiau M, Linder MB (2010) Mechanisms ofprotein adhesion on surface. Films Hydrophobin 57:8491–8496. doi:10.1021/la101240e
41. Zhao Z-X, Wang H-C, Qin X et al (2009) Self-assembled film ofhydrophobins on gold surfaces and its application to electrochemicalbiosensing. Colloids Surf B Biointerfaces 71:102–106. doi:10.1016/j.colsurfb.2009.01.011
42. Armenante A, Longobardi S, Rea I et al (2010) The Pleurotusostreatus hydrophobin Vmh2 and its interaction with glucans.Glycobiology 20:594–602
43. Longobardi S, Gravagnuolo AM, Rea I et al (2014) Hydrophobin-coated plates as matrix-assisted laser desorption/ionization samplesupport for peptide/protein analysis. Anal Biochem 449:9–16
44. Weng Y, Qu Y, Jiang H et al (2014) An integrated sample pretreat-ment platform for quantitative N-glycoproteome analysis with com-bination of on-line glycopeptide enrichment, deglycosylation anddimethyl labeling. Anal Chim Acta 833:1–8. doi:10.1016/j.aca.2014.04.037
45. Krenkova J, Szekrenyes A, Keresztessy Z et al (2013) Orientedimmobilization of peptide-N-glycosidase F on a monolithic supportfor glycosylation analysis. J Chromatogr A 1322:54–61. doi:10.1016/j.chroma.2013.10.087
46. Giardina P, Aurilia V, Cannio R et al (1996) The gene, protein andglycan structures of laccase from Pleurotus ostreatus. Eur J Biochem235:508–515
47. Luo B,Groenke K, Takors R et al (2007) Simultaneous determinationof multiple intracellular metabolites in glycolysis, pentose phosphatepathway and tricarboxylic acid cycle by liquid chromatography-massspectrometry. J Chromatogr A 1147:153–164. doi:10.1016/j.chroma.2007.02.034
48. Cooper MA, Singleton VT (2001) A survey of the 2001 to 2005quartz crystal microbalance biosensor literature: applications ofacoustic physics to the analysis of biomolecular interactions. J MolRecognit 20:154–184. doi:10.1002/jmr.826
49. Sauerbrey SG (1959) Verwendung von Schwingquarzen zurWägungdünner Schichten und zur Mikrowägung. Z Phys 155:206–222
50. Kannan K, Jasra RV (2009) Immobilization of alkaline serine endo-peptidase from Bacillus licheniformis on SBA-15 and MCF bysurface covalent binding. J Mol Catal B: Enzym 56:34–40. doi:10.1016/j.molcatb.2008.04.007
51. Li S,WuZ, LuM et al (2013) Improvement of the enzyme performanceof trypsin via adsorption in mesoporous silica SBA-15: hydrolysis ofBAPNA. Molecules 18:1138–1149. doi:10.3390/molecules18011138
52. Han G, Ye M, Jiang X et al (2009) Comprehensive and reliablephosphorylation site mapping of individual phosphoproteins by combi-nation of multiple stage mass spectrometric analysis with a target-decoydatabase search. Anal Chem 81:5794–5805. doi:10.1021/ac900702g
53. Egrie JC, Browne JK (2001) Development and characterization ofnovel erythropoiesis stimulating protein (NESP). Br J Cancer84(Suppl 1):3–10. doi:10.1054/bjoc.2001.1746
54. Llop E, Gallego RG, Belalcazar V et al (2007) Evaluation of proteinN-glycosylation in 2-DE: erythropoietin as a study case. Proteomics7:4278–4291. doi:10.1002/pmic.200700572
496 S. Longobardi et al.
1 3
DOI 10.1007/s00340-015-6091-3Appl. Phys. B
Nano‑machining of biosensor electrodes through gold nanoparticles deposition produced by femtosecond laser ablation
B. Della Ventura1 · R. Funari1 · K. K. Anoop1,2 · S. Amoruso1,2 · G. Ausanio1,2 · F. Gesuele1 · R. Velotta1 · C. Altucci1
Received: 10 October 2014 / Accepted: 17 March 2015 © Springer-Verlag Berlin Heidelberg 2015
thus allowing to measure its mass. The sensor surface can be functionalized with appropriate bio-receptors capable of recognizing a specific analyte, thus gaining a high specific-ity thanks to immune recognition. Usually, analyte detec-tion with QCM biosensors occurs in liquid phase.
It has been recently demonstrated that QCM sensor sen-sitivity can be increased through deposition of nanoparti-cles (NPs) on its electrode surface. This was explained by considering that NPs can enhance the effective surface of the QCM electrode where the bio-receptor is anchored and the analyte is caught. The QCM modification was achieved by means of a chemical approach based on precipitation of 50-nm gold NPs onto the QCM gold lamina [1].
Here, we report on the application of femtosecond laser ablation (fs-LA) as a possible alternative to improve the sensitivity of a QCM biosensor. In particular, in the present work we choose as analyte the IgG from mouse and as bio-element the IgG antibody (anti-IgG from goat), because it is characterized by a high specificity for the analyte. More-over, this complex represents a good case study, since we have used it in previous experiments exploiting standard QCM electrodes [2].
Fs-LA is a viable and versatile physical method to generate NPs and NPs-assembled film of a number of materials [3, 4]. In particular, it has been shown that NPs form as a result of the relaxation dynamics of the irradi-ated target driven into a high non-equilibrium state [4, 5]. One advantage of fs-LA is the generation and subsequent expansion of the produced NPs in high vacuum condi-tions, which allows avoiding all the complications intro-duced by the presence of a background gas or a liquid environment typical of other methods of NPs production. This, in turn, precludes any possible effect related to pos-sible environmental impurities that could influence the biosensor response.
Abstract We report an application of femtosecond laser ablation to improve the sensitivity of biosensors based on a quartz crystal microbalance device. The nanoparticles produced by irradiating a gold target with 527-nm, 300-fs laser pulses, in high vacuum, are directly deposited on the quartz crystal microbalance electrode. Different gold elec-trodes are fabricated by varying the deposition time, thus addressing how the nanoparticles surface coverage influ-ences the sensor response. The modified biosensor is tested by weighting immobilized IgG antibody from goat and its analyte (IgG from mouse), and the results are compared with a standard electrode. A substantial increase of biosen-sor sensitivity is achieved, thus demonstrating that femto-second laser ablation and deposition is a viable physical method to improve the biosensor sensitivity by means of nanostructured electrodes.
1 Introduction
A biosensor is an analytical device used for the detection of an analyte combining biological components with a physical and/or chemical detector and a signal transducer. A biosensor based on a quartz crystal microbalance (QCM) registers the variation of the quartz crystal resonance fre-quency upon deposition of an analyte on the sensor surface,
* S. Amoruso [email protected]
1 Dipartimento di Fisica, Università degli Studi di Napoli Federico II, Complesso Universitario di Monte S. Angelo, Via Cintia, 80126 Naples, Italy
2 CNR-SPIN, UOS Napoli Complesso Universitario di Monte S. Angelo, Via Cintia, 80126 Naples, Italy

B. Della Ventura et al.
1 3
Fs-LA is used to generate and deposit gold NPs on the QCM lamina, thus addressing the possible improvement of the device sensitivity due to the modified surface of gold electrodes. A larger available surface induced by the pres-ence of gold NPs might increase the number of bio-recep-tors onto the gold transducers, which should allow catching a larger quantity of analytes, hence enhancing the sensitiv-ity of the biosensor. Our experimental findings address an interesting fourfold increase in detection efficiency of NPs-modified QCM (Nm-QCM) compared to standard QCM electrodes.
2 Experimental methods
Figure 1a reports a schematic layout of the system used for QCM measurements. The QCM is integrated in a microfluidic circuit consisting of a cuvette, containing the sample under study, a Gilson peristaltic pump, and a cell, which contains the gold-quartz oscillator of the QCM. The QCM oscillator is placed on an electronic con-sole that monitors its resonance frequency. The volume of the circuit is about 300 μL, and the flow rate is 3 μL/s. The quartz oscillators (151218) are from ICM, Oklahoma City (USA). They are AT-cut quartz with a fundamen-tal frequency of 10 MHz. The crystal and the gold elec-trode diameters are 1.37 and 0.68 cm, respectively. The gold surfaces are cleaned by immersing the oscillators for 1 min in a glass beaker containing piranha solution (3:1 ratio between concentrated sulfuric acid and 40 % hydrogen peroxide solution). Then, the quartz crystals are washed with Elix water, i.e., a purified water with a certi-fied standard of purity [6]. The whole cleaning procedure is performed in the hood and can be repeated 3–4 times before the quartz needs to be changed. The QCM device is a µLibra from Technobiochip, Italy.
Figure 1b shows a typical output of the QCM device separated in the three regions I–III, while the cartoon on the right side of panel (b) schematically illustrates the diverse steps of the measurement procedure. A frequency downshift of about 140 Hz is observed in region I, due to the linkage of anti-IgG from goat to the sensitive gold surface. The passage to region II corresponds to washing with PBS 1X followed by circulation of BSA solution (50 µg/mL). PBS 1X purges the fluidic circuit and fluidic cell from the excess of immunoglobulins anti-IgG from goat, while BSA fills possible free sites still available on gold surface to avoid specific interactions between the antigen and the gold surface. In the case shown in Fig. 1d, a negligible variation of the frequency shift is observed in region II, suggesting that the surface is fully covered with antibodies. Finally, an antigen solution of IgG from
mouse (25 µg/mL), which is recognized by IgG from goat, flows through the fluidic circuit. This induces the frequency shift observed in region III resulting from the tethering of IgG from mouse to anti-IgG from goat, due to the antigen–antibody interaction.
The QCM gold lamina is modified by deposition of gold NPs produced during fs-LA of an Au bulk target, in high vacuum [3] (see Fig. 2a). LA is induced by irradiat-ing bulk gold sample with ≈300 fs laser pulses at 527 nm from a Nd:glass laser system, at a repetition rate of 33 Hz [4]. The target sample is mounted on a rotating holder in a high vacuum chamber (residual pressure p ≤ 10−6 mbar). The laser beam is focused on the target sample to a spot size of ≈6 × 10⁻⁴ cm2, at a fluence of ≈1 J/cm2. The QCM is mounted on a substrate holder located at 40 mm in front of the target surface (see Fig. 2a). During deposition, the laser beam on the target is rastered over an annulus with a thickness of ≈2 mm to avoid possible consequences on NPs generation due to the formation of deep craters on the target surface after many laser pulses.
Fig. 1 a Experimental layout for QCM measurements. The anti-bodies in the cuvette are conveyed through a peristaltic pump to the QCM device. The electronics of the QCM is interfaced with a PC to register the frequency shifts due to the surface changes. b QCM-based immune-sensor output signal. The first frequency shift in region I corresponds to the antibody immobilization onto the sensor surface. In the second phase of the measurement (region II), BSA is conveyed to the Nm-QCM in order to fill possible free spaces onto the gold electrode and to avoid non-specific interactions of the ana-lyte with the surface. The lack of any frequency shift in region II demonstrates that the surface is fully covered by antibodies. The fre-quency drop observed in region III, at about 550 s, is due to the detec-tion of the antigen. The vertical lines highlight the three phases of the measurement protocol described in the text. The cartoon on the right side of panel (b) sketches the phases of the measurement procedure
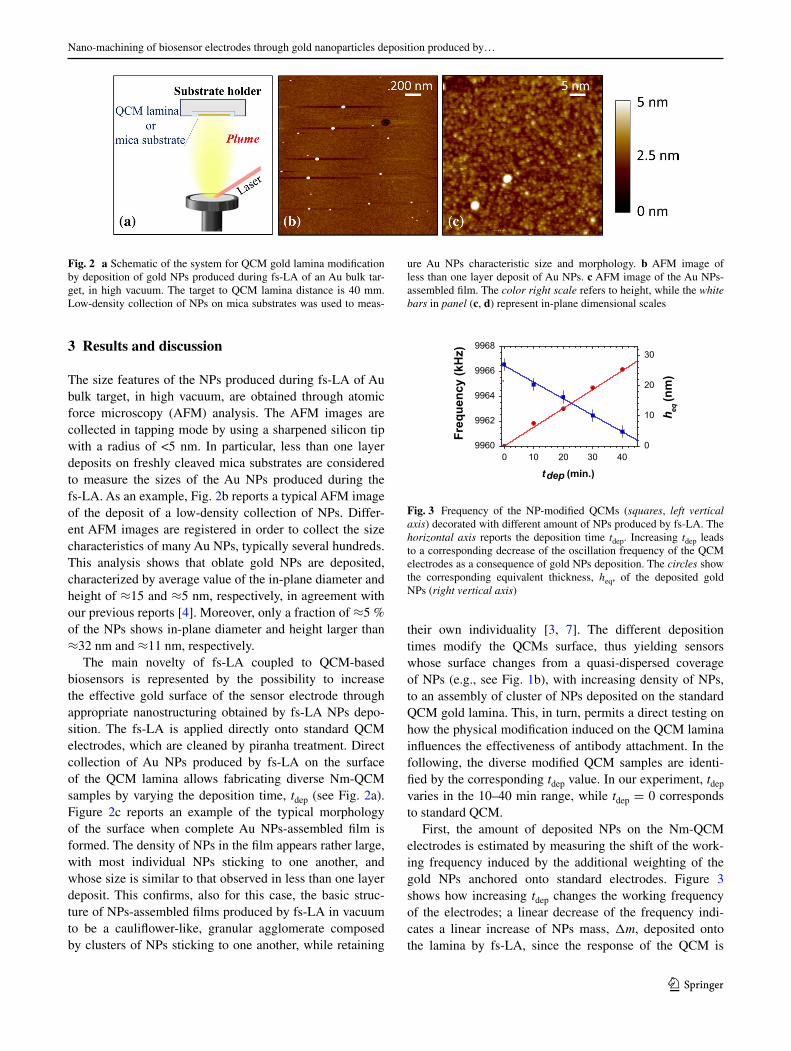
Nano-machining of biosensor electrodes through gold nanoparticles deposition produced by…
1 3
3 Results and discussion
The size features of the NPs produced during fs-LA of Au bulk target, in high vacuum, are obtained through atomic force microscopy (AFM) analysis. The AFM images are collected in tapping mode by using a sharpened silicon tip with a radius of <5 nm. In particular, less than one layer deposits on freshly cleaved mica substrates are considered to measure the sizes of the Au NPs produced during the fs-LA. As an example, Fig. 2b reports a typical AFM image of the deposit of a low-density collection of NPs. Differ-ent AFM images are registered in order to collect the size characteristics of many Au NPs, typically several hundreds. This analysis shows that oblate gold NPs are deposited, characterized by average value of the in-plane diameter and height of ≈15 and ≈5 nm, respectively, in agreement with our previous reports [4]. Moreover, only a fraction of ≈5 % of the NPs shows in-plane diameter and height larger than ≈32 nm and ≈11 nm, respectively.
The main novelty of fs-LA coupled to QCM-based biosensors is represented by the possibility to increase the effective gold surface of the sensor electrode through appropriate nanostructuring obtained by fs-LA NPs depo-sition. The fs-LA is applied directly onto standard QCM electrodes, which are cleaned by piranha treatment. Direct collection of Au NPs produced by fs-LA on the surface of the QCM lamina allows fabricating diverse Nm-QCM samples by varying the deposition time, tdep (see Fig. 2a). Figure 2c reports an example of the typical morphology of the surface when complete Au NPs-assembled film is formed. The density of NPs in the film appears rather large, with most individual NPs sticking to one another, and whose size is similar to that observed in less than one layer deposit. This confirms, also for this case, the basic struc-ture of NPs-assembled films produced by fs-LA in vacuum to be a cauliflower-like, granular agglomerate composed by clusters of NPs sticking to one another, while retaining
their own individuality [3, 7]. The different deposition times modify the QCMs surface, thus yielding sensors whose surface changes from a quasi-dispersed coverage of NPs (e.g., see Fig. 1b), with increasing density of NPs, to an assembly of cluster of NPs deposited on the standard QCM gold lamina. This, in turn, permits a direct testing on how the physical modification induced on the QCM lamina influences the effectiveness of antibody attachment. In the following, the diverse modified QCM samples are identi-fied by the corresponding tdep value. In our experiment, tdep varies in the 10–40 min range, while tdep = 0 corresponds to standard QCM.
First, the amount of deposited NPs on the Nm-QCM electrodes is estimated by measuring the shift of the work-ing frequency induced by the additional weighting of the gold NPs anchored onto standard electrodes. Figure 3 shows how increasing tdep changes the working frequency of the electrodes; a linear decrease of the frequency indi-cates a linear increase of NPs mass, Δm, deposited onto the lamina by fs-LA, since the response of the QCM is
Fig. 2 a Schematic of the system for QCM gold lamina modification by deposition of gold NPs produced during fs-LA of an Au bulk tar-get, in high vacuum. The target to QCM lamina distance is 40 mm. Low-density collection of NPs on mica substrates was used to meas-
ure Au NPs characteristic size and morphology. b AFM image of less than one layer deposit of Au NPs. c AFM image of the Au NPs-assembled film. The color right scale refers to height, while the white bars in panel (c, d) represent in-plane dimensional scales
0 10 20 30 409960
9962
9964
9966
9968
tdep (min.)Fr
eque
ncy
(kH
z)0
10
20
30
h eq(n
m)
Fig. 3 Frequency of the NP-modified QCMs (squares, left vertical axis) decorated with different amount of NPs produced by fs-LA. The horizontal axis reports the deposition time tdep. Increasing tdep leads to a corresponding decrease of the oscillation frequency of the QCM electrodes as a consequence of gold NPs deposition. The circles show the corresponding equivalent thickness, heq, of the deposited gold NPs (right vertical axis)

B. Della Ventura et al.
1 3
proportional to the mass tethered to the electrode through the Sauerbrey equation [8]:
where Δf is the frequency shift, f0 the resonance frequency, A the piezoelectric active area, ρq the density of quartz, μq the shear modulus of AT-cut quartz crystal, and Δm the deposited mass.
In order to test the proposed method and the sensitivity improvements of the QCM device, the different Nm-QCM sensors are used following the measurement procedure already illustrated above and shown in Fig. 1. Figure 4a reports the frequency variation occurring when the anti-IgG from goat flows in the QCM device, i.e., step I of the exper-imental procedure (see Fig. 1b). We clearly observe that the modification induced to the QCM lamina effectively influ-ences the amount of anti-IgG tethered to the electrode sur-face. In particular, for tdep ≤ 10 min, the frequency shift is negligible. As tdep increases above 10 min, the NPs cover-age progressively improves the available gold surface for IgG attachment, and a threefold increase of the frequency shift, Δf, is achieved at tdep = 40 min, with respect to the value obtained by a standard QCM electrode. Hence, this indicates that four times bigger mass of IgG from goat is attached to the Nm-QCM, which represents a notice-able improvement in the sensor performance due to better functionalization.
Subsequently, the IgG antigen recognition is analyzed (i.e., step III of the procedure in Fig. 1b), and the result-ing frequency shift is shown in Fig. 4b. As expected, the improved performance of the sensor consisting in a higher amount of tethered anti-IgG results in a corresponding enhancement of the Δf values, registered by Nm-QCM for tdep ≥ 10 min. Interestingly, the frequency shift at tdep = 40 min is increased by about four times, compared to the standard QCM electrode.
To associate the deposition time to the Nm-QCM char-acteristics, one can estimate from the corresponding depos-ited mass, Δm, the related equivalent thickness heq, i.e., the height of a column that would contain the same mass with a section S equal to the sensitive area of the QCM electrode (as typically done when QCM is used as a thickness moni-tor) [9]:
The corresponding values of heq obtained from Eq. (2) for the different Nm-QCM are reported in Fig. 3 (circles, right scale). We observe that the values of tdep exploited cor-respond to an equivalent thickness heq varying from few nm, at low deposition time, up to ≈25 nm, for the longest tested deposition time. Then, taking into account the size
(1)�f = −2f0
A√
ρqµq
�m
(2)heq =�m
SρAu
characteristics of the gold NPs measured in less than one layer deposit (i.e., an average height of ≈5 nm and only 5 % of NPs counted for a height larger than ≈11 nm), one can draw out the following two remarks. First, the mor-phology of the QCM surface is a quasi-dispersed coverage of NPs at tdep ≤ 10 min and a complete layer with clus-ter of NPs start forming for 10 nm < tdep < 20 nm. This, in turn, explains the experimental observation of an increased amount of anti-IgG from goat attached to the Nm-QCM during its functionalization with respect to a standard QCM electrode (tdep = 0), as shown in Fig. 3a. Second, further increase of tdep leads to the deposition of more than one layer of NPs with correlated formation of cluster of NPs on the surface, which enhances the available surface. Corre-spondingly, when Nm-QCM is exploited to recognize anti-gen IgG from mouse, the higher number of anti-IgG from goat tethered to the Nm-QCM surface rises the capturing efficiency as shown in Fig. 3b, eventually resulting in a 4× larger variation of the frequency shift for Nm-QCM elabo-rated with tdep = 40 min with respect to a standard QCM.
Our experimental findings clearly demonstrate that the Nm-QCM can be a suitable route to consistently improve the sensitivity of QCM-based biosensors. However, it is worth noticing the diverse trends of the frequency shift dependence on tdep. In fact, while for anti-IgG function-alization, Δf steadily increases with tdep (see Fig. 4a), for IgG antigens, a progressive reduction of the slope in the dependence of the frequency shift on tdep is observed (see Fig. 4b). This is likely due to the fact that the progressively more nanostructured morphology of the NPs-assembled films produced by fs-LA does not allow complete antigen linkage with the anti-IgG present on the Nm-QCM sur-face, at large coverage of the electrode. While the com-plex dynamics of antigen–antibody interaction on the
0 10 20 30 40100
200
300
400
500
(a)
∆f (
Hz)
∆f (
Hz)
tdep (min)0 10 20 30 40
50
100
150
200
250
(b)
tdep (min)
Fig. 4 Frequency shift, Δf, measured for the different Nm-QCM samples. a refers to the electrode functionalization with anti-IgG from goat, while b corresponds to the recognition of the IgG antigen from mouse. The effects of the different deposition time are visible for tdep larger than ≈10 min, indicating that the sensitivity of the Nm-QCM starts increasing when an almost complete layer of NPs begins forming on the gold lamina. The solid lines are guides to the eye
Nano-machining of biosensor electrodes through gold nanoparticles deposition produced by…
1 3
Nm-QCM surface needs further investigation, our experi-mental findings effectively prove that fs-LA NPs deposi-tion can provide a useful method to improve the sensitiv-ity of biosensors. We believe that the biosensor sensitivity can be enhanced even further by coupling the Nm-QCM to the photonic immobilization technique (PIT). In fact, as demonstrated by some of the authors [2, 10, 11], when using the PIT technique, the antibody solution is activated by breaking the disulfide bridge in the triad Trp/Cys–Cys through absorption of ultrashort UV laser pulses. The free thiol groups so produced interact with gold lamina mak-ing the antibody orients upside, i.e., with its variable parts exposed to the environment, thereby greatly increasing the detection efficiency. Hence, one can guess that combin-ing Nm-QCM and PIT will possibly result in a substantial improvement of QCM-based biosensor sensitivity, which will be the topic of our future experiments.
4 Summary
An application of fs-LA to modify QCM electrodes and improve sensitivity of a biosensor was discussed. Gold NPs produced by fs-LA, in high vacuum, were deposited on a standard QCM electrode, thus enhancing the avail-able surface. We demonstrated that the Nm-QCM offers a viable route to improve the biosensor sensitivity. In par-ticular, the modified biosensor was applied to the anti-IgG from goat that recognized IgG from mouse, achieving a fourfold increase in detection compared to standard QCM electrodes. While this improvement is already sizeable, we
foresee a further progress by a combined use of the two technologies Nm-QCM and PIT that will be addressed in future experiments.
Acknowledgments We acknowledge the financial support of the Fondazione con il Sud (Project No. 2011-PDR-18, “Biosensori pie-zoelettrici a risposta in tempo reale per applicazioni ambientali e agro-alimentari”).
References
1. A. Makaraviciute, T. Ruzgas, A. Ramanaviciuscd, A. Ramana-viciene, Anal. Methods 6, 2134 (2014)
2. B. Della Ventura, L. Schiavo, C. Altucci, R. Esposito, R. Velotta, Biomed. Opt. Express 2, 3223 (2009)
3. S. Amoruso, G. Ausanio, R. Bruzzese, M. Vitiello, X. Wang, Phys. Rev. B 71, 033406 (2005)
4. S. Eliezer, N. Eliaz, E. Grossman, D. Fisher, I. Gouzman, Z. Henis, S. Pecker, Y. Horovitz, M. Fraenkel, S. Maman, Y. Lereah, Phys. Rev. B 69, 144119 (2004)
5. S. Amoruso, N.N. Nedyalkov, X. Wang, G. Ausanio, R. Bruzz-ese, P.A. Atanasov, Thin Solid Films 550, 190 (2014)
6. See for instance, for elix water. http://www.emdmillipore.com/US/en/product/Elix-Reference-Water-Purification-system,MM_NF-C84762
7. S. Amoruso, G. Ausanio, R. Bruzzese, L. Lanotte, P. Scardi, M. Vitiello, J. Phys. Condens. Matter 18, L49 (2006)
8. G.Z. Sauerbrey, Z. Phys. 155, 206 (1959) 9. M. Ohring, The Materials Science of Thin Films (Academic
Press, New York, 1992) 10. R. Funari, B. Della, Ventura, L. Schiavo, R. Esposito, C. Altucci,
R. Velotta. Anal. Chem. 85, 6392 (2013) 11. R. Funari, B. Della Ventura, R. Carrieri, L. Morra, E. Lahoz, F.
Gesuele, C. Altucci, R. Velotta, Biosens. Bioelectron. 67, 224–229 (2015)