doctor of philosophyshodhganga.inflibnet.ac.in/bitstream/10603/21625/2/...doctor of philosophy...
TRANSCRIPT

GEOMORPHIC RESOURCE CHARACTERISATION USING RS-GIS FOR EVALUATION OF LAND USE LAND COVER IN WATER STRESSED AREAS OF
AUSGRAM BLOCK I & II, BURDWAN DISTRICT, WEST BENGAL
Thesis Submitted for the Award of the Degree of
Doctor of Philosophy
Supervised By Submitted By Dr. BIPLAB BISWAS C. PRAKASAM Assistant Professor
Department of Geography The University of Burdwan
Golapbag, Burdwan, West Bengal – 713104,
INDIA March 2012

GEOMORPHIC RESOURCE CHARACTERISATION USING RS-GIS FOR EVALUATION OF LAND USE LAND COVER IN WATER STRESSED AREAS OF
AUSGRAM BLOCK I & II, BURDWAN DISTRICT, WEST BENGAL
Thesis Submitted for the Award of the Degree of
Doctor of Philosophy
Supervised By Submitted By Dr. BIPLAB BISWAS C. PRAKASAM M.A(Geo)., M.Phil., Ph.D. M.Sc (Geo)., M.Tech., M.Phil., Assistant Professor Fulltime Research Scholar
Department of Geography
The University of Burdwan Golapbag, Burdwan,
West Bengal – 713104, INDIA
March 2012

Dr.BIPLAB BISWAS THE UNIVERSITY OF BURDWAN M.A (Geo), M.Phil, Ph.D. GOLAPBAG, BURDWAN ASSISTANT PROFESSOR WEST BENGAL – 713104, INDIA DEPARTMENT OF GEOGRAPHY PHONE: 0342-2533-913,914,917,918,919
(O) 033-2532-9567, 9433506568 ® Email: [email protected]
Date:
This is to certify that Sri C. Prakasam, M.Sc (Geo)., M.Tech., M.Phil.,
Fulltime Research Scholar, Department of Geography, The University of
Burdwan (West Bengal) has done research work on “GEOMORPHIC
RESOURCE CHARACTERISATION USING RS-GIS FOR EVALUATION
OF LAND USE LAND COVER IN WATER STRESSED AREAS OF
AUSGRAM BLOCK I & II, BURDWAN DISTRICT, WEST BENGAL”
under my supervision and guidance for the award of Ph.D. Degree in
Geography (Science) from The University of Burdwan. He has fulfilled all
conditions of the rules and regulation relating to the nature and period of
doctoral research in The University of Burdwan and University Grants
Commission including presentation of one seminar lecture and one
research paper published in refereed journal on the subject mater of the
thesis and on allied fields.
This is also certify the no research work in such a format has, to the best
my knowledge, been done on this topic in any Indian or foreign
University and the work has been done by research scholar himself.
Supervisor of Sri C. Prakasam Head
Department of Geography
The University of Burdwan
Golapbag, Burdwan - 713104
{Dr. BIPLAB BISWAS}

DECLARATION I do hereby declare that the thesis entitled “GEOMORPHIC RESOURCE
CHARACTERISATION USING RS-GIS FOR EVALUATION OF LAND USE
LAND COVER IN WATER STRESSED AREAS OF AUSGRAM BLOCK I &
II, BURDWAN DISTRICT, WEST BENGAL” which I am submitting for the
award of the Degree of Doctor of Philosophy to The University of
Burdwan, is the original work carried out by me as a fulltime research
scholar, in the Department of Geography, The University of Burdwan,
Golapbag, Burdwan – 713104, West Bengal, under the guidance and
supervision of Dr. Biplab Biswas.
I further declare that this work has not been submitted earlier in this or
any other University and does not form the basis for the award of any
other degree or diploma.
Place: Burdwan Date: (C. PRAKASAM) Research Scholar

ACKNOWLEDGEMENTS I wish to deliver my deep sense of gratitude to my research supervisor and
advisor Dr. Biplab Biswas for his kind supervision, instruction and valuable
support in the planning, presentation and constant encouragement for this
thesis work.
I am extremely thankful to Dr. Narayan Chandra Jana Reader and Head,
Department of Geography, The University of Burdwan for his help.
I thank Professor Nageshwar Prasad, Professor Kamala Bhattacharyya, Dr. Sanat
Kumar Guchhait, Dr. Lakshmi Sivaramkrishnan, Dr. Gopa Samanta, Mr.
Biswaranjan Mistri and Ms. Namita Chakma, Department of Geography, The
University of Burdwan, Burdwan for their help.
I would like to express my sincere thanks to Mr. Deb Prakash Pahari for his
technical help in the computer lab. I also thank the department librarians and
other non-teaching staffs of the Department of Geography, The University of
Burdwan for their help.
I express my respect to the authorities of Burdwan University, West Bengal for
the completion of the research work.
I express my respect to the authorities of Department of Science and
Technology, West Bengal for the financial support provided towards the works.
Finally, I wish to express my deep sense of respect to my parents and family
members for their kind interest, where my work and sustainability is
concerned.
Place: Burdwan Date: C. Prakasam
i

CONTENTS Page No
ACKNOWLEDGMENTS i
LIST OF FIGURES viii
LIST OF TABLES x
ACRONYMS xi
Chapter 1: INTRODUCTION 1 - 12
1.1 Understanding the Meaning of Geomorphic Resources 2
1.2 Understanding the Meaning of Land Use Land Cover 3
1.3 Land Use Land Cover and Geomorphic Resource 4
1.4 Importance of RS-GIS in Land Use Land Cover Studies 6
1.5 Importance of Land Use Land Cover Change Studies 8
ii

Chapter 2: LULC STUDIES AND GEOMORPHIC RESOURCE
CHARACTERISATION-PAST AND PRESENT STUDIES 13 -39
2.1 Geomorphic Studies: A historical perspective 14
2.1.1. Development to Geomorphic Studies in India 20
2.2 Land Use Land Cover Studies: A Historical Perspective 23
2.3 Water Stressed Studies 27
2.4 Geomorphology and Land Use Land Cover Study 32
2.5 Remote Sensing and GIS for Geomorphic Study 33
2.6 Identified Research Gap 37
2.7 Objectives 38
2.8 Limitation of the Present Study 38
Chapter 3: BACKGROUND OF THE STUDY AREA AND
METHODOLOGY 40-59
3.1 Geographical Setup of the Study Area 40
3.1.1 Climate 44
3.1.2 Surface Water Bodies 44
3.1.3 Geology 46
3.1.4 Soil 48
3.1.5 Population 48
3.1.6 Transport and Settlements 51
iii

3.2 Data Base 53
3.3 Technology use 53
3.4 Methodology 54
3.4.1 Geomorphic Resources Characterisation 54
3.4.2 Land use land cover study 54
3.4.3 Identification of Surface water Potential zone 55
3.4.4 Identification of Surface water Harvesting Potential zone 56
3.4.5 Seasonal Land use Land cover Plan 56
3.5 Organisation of the Thesis 58
Chapter 4: GEOMORPHIC RESOURCE CHARACTERISATION 60-78
4.1 Absolute Relief (AR) 61
4.2 Relative Relief (RR) 63
4.3 Dissection Index (DI) 65
4.4 Slope (Raisz and Henry method) 68
4.5 Frequency of Surface Water Bodies 71
4.6 Drainage Density (DD) 73
4.7 Ruggedness Index (RI) 76
4.8 Conclusion 78
iv

Chapter 5: LAND USE LAND COVER OF AUSGRAM BLOCK I & II: AN
OVERVIEW 79-97
5.1 Land use land cover change 80
5.2 LULC Classification System 80
5.2.1 Digital Classification 81
5.3 Land use Land cover 1972, 2002 (September) and 2008 (April) 83
5.3.1 Agricultural land 83
5.3.2 Current fallow or Pasture 88
5.3.3 Forest 89
5.3.4 Built-up / Settlement and Communication 90
5.3.5 Water Bodies 92
5.3.6 Barren land 95
5.4 Conclusion 97
Chapter 6: POTENTIALITY OF WATER RESOURCES IN THE REGION 98-109
6.1 Water as a Determinig Factor of LULC of the Block 99
6.1.1 Need for Water Resources Management 99
6.1.2 Watershed Management 100
6.1.3 Water Harvesting 101
6.2 Surface Water potential zone identification 101
v
6.3 Identification of Suitable Water Harvesting Zones 105
6.4 Conclusion 108
Chapter 7: LAND USE AND LAND COVER PLANNING 110-56
7.1 Evaluations of geomorphic resources for the villages 114
7.1.1 Relative Relief 114
7.1.2 Slope 116
7.1.3 Frequency of Surface Water Bodies 118
7.1.4 Drainage Density 120
7.2 Soil 122
7.2.1 pH (Puissance de Hydrogen) 123
7.2.2 Electrical Conductivity (EC) 125
7.2.3 Organic Carbon (OC) 129
7.2.4 Nitrogen (N) 132
7.2.5 Phosphorus (P) 135
7.2.6 Potassium (K) 138
7.3 Land Use Land Cover of the Selected Villages 141
7.4 Alternative agriculture 145
7.4.1 Cashew 150
7.4.2 Groundnut 151
7.4.3 Millets 151
vi

7.4.4 Papaya 152
7.5 Conclusion 155
Chapter 8: CONCLUSION 157-161
8.1 Major Findings 158
8.2 Policy Suggestions 159
8.3 Further Research 161
Bibliography 162-196
vii

LIST OF FIGURES Figure No Figure Name Page No
2.1 Seasonal Rainfall in India 31
3.1 Location of Study area 43
3.2 Distribution of Surface water Bodies 45
3.3 Geology 47
3.4 Population Distribution 50
3.5 Transport and Settlement 52
4.1 Absolute Relief 62
4.2 Relative Relief 64
4.3 Dissection Index 67
4.4 Slope (Raisz and Henry Method) 70
4.5 Frequency of Surface Water Bodies 72
4.6 Drainage Density 75
4.7 Ruggedness index 77
5.1 Land Use Land Cover - 1972 85
5.2 Land Use Land Cover September - 2002 86
5.3 Land Use Land Cover April - 2008 87
5.4 Land Use Land Cover of Ausgram Block I & II 97
6.1 Surface Water Potential Zone 104
6.2 Surface Water Harvesting Potential Zone 107
7.1 Geology 113
7.2 Relative Relief 115
7.3 Slope 117
7.4 Frequency of Surface Water Bodies 119
7.5 Drainage Density 120
7.6 Puissance Hydrogen (ph) 125
7.7 Electric Conductivity (EC) 128
viii

7.8 Organic Carbon (OC) 131
7.9 Nitrogen (N) 134
7.10 Phosphorous (P2O5) 197
7.11 Potassium (K2O) 140
7.12 Existing Land Use Land Cover 143
7.13 Existing Land Use Land Cover and Cropping Pattern 144
7.14 Alternative Crops Zones 146
7.15 Suggest New Land Use Planning 153
7.16 Suggested New Seasonal Land Use Land Cover Plan 154
ix

LIST OF TABLES
Table No Table name Page No 1.1 Development of Fluvial Geomorphology in 19th Century 19
3.1 Population Distribution of Ausgram Block I & II, 2001 49
5.1 Classified land use land cover of Ausgram Block I & II 88
5.2 Details of Surface Water Bodies of Ausgram Block I & II 94
6.1 Identification of the Surface Potential Water Zones 102
6.2 Water Harvesting Potential Zones 105
7.1 Relative Relief 116
7.2 Slope 116
7.3 Frequency of Surface water bodies 118
7.4 Drainage Density 120
7.5 Soil Samples and their Chemical Properties 122
7.6 pH (puissance de Hydrogen) 124
7.7 Electrical conductivity 127
7.8 Organic Carbon (OC) 130
7.9 Nitrogen Status in Soil 132
7.10 Phosphorous Statuses 136
7.11 Potassium Status 138
7.12 Exiting Land Use Land Cover 142
7.13 Alternative Crops Zone 147
7.14 Suggested new agricultural pattern 148
7.15 Suggest New Land Use Planning 153
x

ACRONYMS
DEM - Digital Elevation Model
GCP - Ground Control Pont
GIS - Geographic Information System
GPS - Global Positioning System
JFM - Joint forest management
LISS_IV_Mx - Linear Imaging Self Scanning Sensor
LULC - Land Use Land Cover
MODIS - Moderate-resolution Imaging Spectroradiometer
NASA - National Aeronautics and Space Administration
NDVI - Normalized Difference Vegetation Index
SOI - Survey of India
SPOT - Satellite Probatoire d'Observation de la Terre
SRTM - Shuttle Radar Topography Mission
xi

1
Chapter: – One
INTRODUCTION
Understanding, analysis and application of the geomorphic knowledge is
essential for the solution of problems concerning land use land cover, resource
exploitation, environmental management and planning (Jones, 1980).
Geomorphology has been considered as an aid to resource evaluation,
engineering construction and planning. It is concerned with resource
inventories, environmental management, soil and land use land cover
evaluation (Dent and Young, 1981). Geomorphic knowledge has been used for
the production of maps for hydrological, erosional & stability control,
geomorphic mapping, the mapping of land system and terrain evaluation
(Mitchell, 1973).
2
1.1 Understanding the Meaning of Geomorphic Resources
Geomorphology is defined as the scientific study of the earth’s surface features
involving interpretive description of land forms, their origin, development,
nature and mechanism of geomorphic processes which evolve the landforms
(Goudie, 2004). Geomorphology is the science which studies the land surface of
any part of the earth in relation to geological structure, tectonic history and
erosional force. Geomorphology is essentially an explanatory subject
emphasizing the interpretation of the upper surface of land areas in relation to
the different causes which have shaped it (Gupta, 2004).
Geomorphology attempts to explain features found and processes operating
upon the surface of the earth. Formal researches in geomorphology are carried
out within the rational, empirical and analytical tradition of modern science.
The approaches include information gathering in the field and testing of
hypotheses. Efforts are made to replicate and to generalise the results. Other
disciplines and human endeavours make use of the results of geomorphic
researches. Geomorphology is primarily concerned with landforms and their
processes of change but in a broader sense it is important to see that there is
an environmental conservation imperative shared among geomorphology,
geology and soil studies. The approach of looking to reserve, preserve and
conserve representative elements of bedrock, landform and soil is now referred
to as geo-conservation. It is the study of landform history and dynamics and
also to predict future changes through field observation, experimenting and
numerical modelling.
Geomorphology has its role on the identification and description of the
landforms, the explanation of their origin and the prediction of their future
changes. Identification of the landforms are the simple quantitative description
of a river or drainage basin characteristics, but the main objective behind such
description are related to the evaluation of the geologic, hydrologic, climatic and
land use land cover of the drainage basin region.
The present section is interested to study and characterise the geomorphic
conditions of the study region and to relate the land use land cover and water
resources of the region with it. Characterisations of different geomorphic

3
features and evaluation of their conditions for land use land cover planning has
been termed as geomorphic resource. It has already been established and will
be discussed later in details that geomorphic conditions determine the land use
land cover and water resource availability of any region to a great extent.
1.2 Understanding the Meaning of Land Use Land Cover Land use land cover (LULC) characterised the bio-physical and economic
attributes of the earth’s surface. Land use refers to man’s economic activities on
land. Land cover, on the other hand, describes the vegetation and artificial
constructions covering the land surface (Burgess and Pairman, 1997). It
“describes the physical state of the land surface: as in cropland, mountains or
forest” (Meyer and Turner, 2002) and is related to visual features. The resource
managers and planners for agricultural land use need detailed, timely accurate
and reliable data on the extent, location and quality of land and water
resources and climatic characteristics. The data on land use land cover may be
needed to estimate the potentiality of development and necessity for the
conservation of the earth’s resources.
Land cover refers to vegetation, water bodies, rock/soil, artificial cover and
others noticed on the land (NRSA, 1995). Land cover, defined as the assemblage
of biotic and abiotic components on the earth’s surface is one of the most
crucial properties of the earth’s system. Land use includes agricultural land,
built up land, recreation area, wildlife management area etc.
Land use strongly human related, denotes “the human employment of land”
and implies “the way in which and the purpose for which, human beings
employ the land and its resources” (Meyer and Turner, 2002; Meyer, 1995). It is
not only related to visible features but also the intention or purpose of the land
use.
Land use is the use actually made up of any parcel of land (Mandal, 1982).
Land use of any region is the result of the inhabitant's impact on the land in
the light of their perception of landscape ecological factors in that region,
developed through generations along with their capacity for absorption of
technological skills. Land use is the surface utilization of all developed and
vacant land on a specific point, at a given time and space.

4
Agriculture is the most fundamental activity of man which is based on the
utility of land. Land being the carrier as well as part of the ecosystem, acts as
the interface of all the interacting systems and therefore it displays the
phenomenological expressions of their interaction in land use conditions (Vink,
1975). Since land helps in providing basic primary requirements for the survival
of the human society especially in the case of food, agriculture should be given
special attention for study. Land use study provides relevant information
related to the crops and cropland use-pattern. The study enables us to utilise
the land scientifically and to its maximum efficiency. It also deals with the
issues of conversion of land from one major use to another use. For example,
whether a particular piece of land should be put under cultivation by cutting
the forest can be assessed properly only when proper land survey has been
carried out. Thus, land utilization study deals with the study of problems
arising in the process of deciding between the types of land and putting land
into its right use. Man in various ways, is using land and he changes its use
according to his changing needs. Changes in socio-economic conditions lead to
changes in land utilisation. Scientific and technological developments promote
better ways of using the land. Therefore, researches on finding the most
suitable ways of land utilization have always to be revised. Diverse land uses
are not only due to the changing socio-economic conditions but different
climatic and geomorphic conditions are also responsible for it.
1.3 Land Use Land Cover and Geomorphic Resource Land use land cover (LULC) of any region is largely determined by the
geomorphic condition and then by climatic and other factors. Geomorphic
resources immensely affect nature and extent of agriculture on macro, meso
and micro scales. This is evident in the marked difference in technique and
problems of agriculture in mountain, plateau or in plain. On the meso regional
scale we see difference in the agriculture on the flood plains, ridges, valley
flanks, basins pediments and on scraps. Geomorphic resources can provide the
basis of agriculture and have set out the pattern that could be feasible and
fruitful in the different landscapes, like arid and semiarid fluvial plain, karst
landscape, coastal topography, periglacial region and volcanic region.

5
Geomorphology and geomorphic processes influence the formation of soil and
sediment. They determine the nature of ground water reservoir. It is the
geomorphic condition that determines the possibility of irrigation extensions,
use of heavy machineries, consolidation of holdings, agricultural operations in
the field.
Old age landscape of the geomorphic cycle, with stabilized slope is obviously
more suitable for roads than younger landscapes. The landslides are so
dangerous to roads, railways, settlements and other structures that a detailed
geomorphic study of the region where they occur is essential.
Geomorphic resources are ready to respond to the socio-economic needs to the
world today and thus a great demand for gomorphologists to participate in
diversified projects leading towards economic development and a balanced
appropriate use of the natural environment.
Rapid growth of population especially pressure on land resources, and large
scale deforestation and extension of agriculture to hilly and marginal lands
have resulted in widespread and recurring man induced geomorphic hazards
like soil erosion, landslides, floods and sedimentation.
Geomorphic distinctiveness and land use land cover of any part of the land can
be classified as terrain. The landforms of a terrain consists of assemblages of
smaller landscapes units such as ridge tops, midslopes, valley floors etc. If the
landscape units have correlation with some economic aspects of land, then the
inventory of terrain information can be used on a predictive tool.
Geomorphic resource investigation helps in delineation of large geomorphic
units such as aluvial flood plains, pediment plains, outwash plains etc.
Siutability for irrgitaion and ground water studies can also be done by studying
geomophology of a region. Hydrographic problems in limestone terrain are best
understood when geomorphology of such areas is fully comprehended.
Geomorphic condition may be very important determinant factor for LULC but
the availability of water resource is no less important to determine the same.

6
1.4 Importance of RS-GIS in Land Use Land Cover Studies Remote sensing has been very useful technology for the production of land use
land cover statistics which can be useful to determine the distribution of land
uses in the study region. The modern technology of remote sensing includes
both aerial as well as satellite based systems. It allows us to collect lot of
physical data rather easily, with speed and on repetitive basis. Remote sensing
together with GIS helps us to analyze the data spatially, offering possibilities of
generating various options (modeling), there by optimizing the whole planning
process. These information systems also offer interpretation of physical (spatial)
data with other socio-economic data and thereby providing an important
linkage in the total planning process and making it more effective and
meaningful. Recent technological advances made in the domain of spatial
technology cause considerable impact in planning activities. This domain of
planning is of prime importance for a country like India with varied geographic
patterns, cultural activities etc.
One of the most effective information synthesis and analysis tools for
incorporating detailed spatial information for planning is provided by
Geographic Information Systems (GIS) (Yeh, 1999). GIS allows for the synthesis
and integrated analysis of an extremely varied range of spatial, temporal and
attribute information related to hydrology, land use land cover, utilities,
protected areas, political boundaries, economic patterns, transportation,
telecommunications, biodiversity, resource extraction, agriculture etc.
Sectors and activities that stand to benefit from RS-derived information for
planning and management include agriculture (e.g. irrigation, cropping,
fertilizing, harvesting), forestry (e.g. harvesting, silviculture, pest management,
and distribution), urban planning (e.g. transportation, telecommunications,
housing development), oil and gas (e.g. exploration, pipeline development,
drilling, refining), conservation (e.g. species at risk, protected areas, habitat
monitoring, rehabilitation), and environmental monitoring (e.g. ice extent,
biomass, urbanization, drought). Even with just these few examples it is evident
that the specific nature of the land-surface change information required is likely
to vary considerably between planning and management contexts.
7
The concept of ‘time’ is central component of any planning process. A second
important aspect for planning activities is the concept of ‘space’. Remote
sensing data are able to address both time and space considerations at a range
of spatio-temporal scales. From a spatial remote sensing perspective, frequency
refers to pixel resolution while range refers to image coverage. From a temporal
remote sensing perspective, frequency refers to temporal intervals at which
images are obtained and range refers to the time period spanned by the image
data set. Spatial frequency, spatial range, temporal frequency and temporal
range have a fundamental bearing on how RS-based change analysis is
performed in relation to planning objectives.
The integration of the various thematic maps and attribute data, and further
manipulation/analysis for identifying alternatives for development are carried
out using the state-of-art Geographic Information System. The digitally
classified outputs corresponding to geology, geomorphology, soils, land use and
their derivative are feature-coded and stored in the map information system.
These individual maps from corresponding map files are integrated to arrive at
"Composite Mapping Units" (CMUs). The socio-economic, institutional and other
statistical data are entered into attribute database.
Remotely sensed data both from aerial photographs and satellite images in
combination with GIS have scientific value not only in the study of land use
land cover change (e.g., decrease in open green areas, increase in impervious
areas), but also for the study of depletion of surface, ground water, increasing
air pollution and land surface temperature. Using of satellite data can increase
accuracy (vis-à-vis ground measurements), and also take less time and lower
the costs of doing research.
Maps and measurements of land cover can be derived directly from remotely
sensed data by a variety of analytical procedures, including statistical methods
and human interpretation. Conventional LULC maps are categorical, dividing
land into categories of land use land cover (thematic mapping; land
classification), while recent techniques allow the mapping of LULC or other
properties of land as continuous variables or as fractional cover of the land by
different LULC categories, such as tree canopy, herbaceous vegetation and
barren land (continuous fields mapping). Both types of LULC datasets may be
8
compared between time periods using geographic information systems (GIS) to
map and measure LULC at local, regional, and global scales.
Land use land cover change is a key driver of global change (Vitousek, 1992)
and has significant implications for many international policy issues (Nunes
and Auge, 1999). In particular, land use land cover (LULC) changes in tropical
regions are of major concern due to the widespread and rapid changes in the
distribution and characteristics of tropical forests (Myers 1993; Houghton
1994). However, changes in land cover and in the way people use the land have
become recognized over the last 15 years as important global environmental
changes in their own right (Turner, 2002). To understand how LULC change
affects and interacts with global earth systems, information is needed on what
changes has occurred, where and when they occurred, the rates at which they
occurred and the social and physical forces that drive those changes (Lambin,
1997). The information needs for such a synthesis are diverse. Remote sensing
has an important contribution to make in documenting the actual change in
land use land cover on regional and global scales from the mid-1970s (Lambin
et al., 2003).
1.5 Importance of Land Use Land Cover Change Studies Land use land cover is closely linked to climate in complex ways and is critical
input for modeling greenhouse gas emissions, carbon balance and ecosystems.
Land-use land cover change (LULCC) studies have provided critical inputs to
large-scale biomass and forest cover assessments; future LULCC goals include
reducing uncertainties in biomass estimates, understanding regional
heterogeneities in changes, and quantifying linkages and feedbacks between
LULCC, climate change and other human and environmental components.
Research that examines historic, current and future LULCC, its drivers,
feedbacks to climate and its environmental, social, economic and human health
consequences are therefore of utmost importance and often requires
interagency and intergovernmental cooperation. Research plans focus on how
management practices may change as climate and conservation policies change
and on feedbacks related to environmental, social, economic and human health.
The global climate system is affected by land use land cover changes through
biogeophysical, biogeochemical and energy exchange processes. These changes

9
in turn affect climate at local, regional and global scales. Key processes include
uptake and release of greenhouse gases by the land cover of the terrestrial
biosphere to and from the atmosphere through photosynthesis, respiration and
evapotranspiration; the release of aerosols and particulates from surface land
cover change perturbations; variations in the exchange of sensible heat between
the surface and atmosphere due to land-cover changes; variations in
absorbance and reflectance of radiation as land-cover changes affect surface
albedo; and surface roughness effects on atmospheric momentum that are land
cover-dependent. While human activity can alter many of these processes but
weather, climate and geological processes are also important.
Land use land cover change studies also provide valuable information for large
scale vegetation biomass and forest cover assessments that are key components
of the carbon cycle. Future land use land cover change goals include very
accurate biomass estimates, thus refining knowledge of carbon storage in
vegetation, (2) understanding regional land use changes that affect biomass,
and (3) quantifying linkages and feedbacks between land use land cover
change, climate change forces, climate change and other related human and
environmental components.
Land use land cover change is significant to a range of themes and issues
central to the study of global environmental change. The alterations effect
sustainable development and livelihood systems and also contribute to changes
in the biogeochemical cycles of the earth, affecting the atmospheric levels of
greenhouse and other gases. Understanding the nature of land use land cover
change and its impacts requires the joint efforts of natural and social science
because of the expertise of each in certain key faces of the topic.
Scientists estimated that about one-third to one-half of our planet’s land
surfaces has been transformed by human development. Unsustainable changes
in land use are recognized as main drivers of environmental change which
result in severe degradation and/or losses of ecosystem services at the global
scale.
Change in the land use land cover may have regional effect significantly by
altering regional climate outcomes associated with global warming. Beyond
local impacts, tropical land cover change can potentially affect extra-tropical

10
climates and nearby ocean conditions through atmospheric teleconnections
(Feddema et. al., 2005).
Land use land covers are linked to climate and other environmental changes in
complex ways, such as the exchange of greenhouse gases among plants and
soils and the atmosphere. The effects of changes in land use land cover are feit
on earth's heat balance and the impacts of changing environmental conditions
on terrestrial ecosystems and biodiversity. Past land cover changes are
important to understand past climate variability, change and projections of
future land cover change are needed as input to model the future climate
changes. Changes in land use land cover affect ecosystems, biodiversity,
agricultural productivity, and other goods and services of value to society.
Biodiversity is often reduced dramatically by LULC change. When land is
transformed from a primary forest to a farm, the loss of forest species within
deforested areas is immediate and complete. Even when unaccompanied by
apparent changes in land cover, similar effects are observed whenever relatively
undisturbed lands are transformed to more intensive uses, including livestock
grazing, selective tree harvest and even fire prevention. The habitat suitability of
forests and other ecosystems surrounding those under intensive use are also
impacted by the fragmenting of existing habitat into smaller pieces (habitat
fragmentation), which exposes forest edges to external influences and decreases
core habitat area. Smaller habitat areas generally support fewer species (island
biogeography) and for species requiring undisturbed core habitat, fragmentation
can cause local and even general extinction. Research also demonstrates that
species invasions by non-native plants, animals and diseases may occur more
readily in areas exposed by LULCC, especially in proximity to human
settlements.
Changes in LULC are important drivers of water, soil and air pollution. Perhaps
the oldest of these is land clearing for agriculture and the harvest of trees and
other biomass. Vegetation removal leaves soils vulnerable to massive increases
in soil erosion by wind and water. This not only degrades soil fertility over time,
reducing the suitability of land for future agricultural use, but also releases
huge quantities of phosphorus, nitrogen and sediments to streams and other
aquatic ecosystems, causing a variety of negative impacts (increased
11
sedimentation, turbidity, eutrophication and coastal hypoxia). Mining can
produce even greater impacts, including pollution by toxic metals exposed in
the process. Modern agricultural practices, which include intensive inputs of
nitrogen and phosphorus fertilizers and the concentration of livestock and their
manures within small areas, have substantially increased the pollution of
surface water by runoff and erosion and the pollution of groundwater by
leaching of excess nitrogen (as nitrate). Other agricultural chemicals, including
herbicides and pesticides are also released to ground and surface waters by
agriculture and in some cases remain as contaminants in the soil. The burning
of vegetation biomass to clear agricultural fields (crop residues, weeds) remains
a potent contributor to regional air pollution wherever it occurs.
Other environmental impacts of LULC change include the destruction of
stratospheric ozone by nitrous oxide release from agricultural land and altered
regional and local hydrology (dam construction, wetland drainage, irrigation
projects, increased impervious surfaces in urban areas). Perhaps the most
important issue for most of earth’s human population is the long-term threat to
future production of food and other essentials by the transformation of
productive land to nonproductive uses, such as the conversion of agricultural
land to residential use and the degradation of rangeland by overgrazing.
In the present research area land use land cover are changing. This is mainly
due to increasing human population, deforestation and colonisation. During the
past three decades, lots of natural forest lands are converted to built up and
agriculture purpose. Especially forest land in day by day is reducing in the
Ausgram blocks. The newly reclaimed agricultural lands from forest and water
bodies are underutilized due to lack of water resources. The increasing rate of
soil erosion as well as poor soil fertility making the agricultural situation of the
region even poorer day by day. The undulating topography of the region adding
more burden on the negative aspects of the region. A thorough study of land
use land cover study and its change over time is very important and much
needed for the present study region. A study is also required how the water
resource is restricting the expansion and intensification of the agricultural
activities of the region. The soil nutrient status of the region is poor for
traditional crops but still the local farmers continue to cultivate the much water

12
demanding crops like rice etc. A research is needed to assess whether with the
current available geomorphic resources, water resources and fertility any other
more profitable cultivation is possible or not.

13
Chapter: – Two
GEOMORPHIC RESOURCE CHARACTERISATION AND LULC STUDIES: - PAST AND PRESENT STUDIES
Geomorphology is the subject to study landforms, their origin and distribution.
It is a science that deals with discovery and scientific experiments centred on
expanding scales of concern in both time and space (Hironi, 1991). The surface
form study may be the main aspect of Geomorphology, but almost all the
anthropogenic activities and developments are determined or modified to a
great extent based on the surface morphology of any region; so, role of
geomorphology on human development has been gaining importance in recent
decades. The spatial and temporal distributions of human impacts on the
landscape have been heterogeneous and the main geomorphic effects have been
caused mostly by forest removal and by cropping based on slope. Land Use
Land Cover (LULC) of any region is directly modified by the geomorphic
condition of earth’s surface. LULC is further modified with the nature and
availability of water resources to any region.
Review works have been done in this section to evaluate the close interaction of
morphometric conditions and water resources in shaping the LULC of any
region. The present analysis is divided into three parts. Fist part will deal with
the evaluation of previous studies on the importance of geomorphic resource

14
analysis. Second part will deal with the pervious studies on the understanding
of existing land use land cover analysis and the final part will look for studies
on water stressed area identification and its importance on LULC of the region.
Efforts have been made to critically asses and conclude the close interaction
and interrelation among these attributes. Worldwide studies in general and
Indian studies in particular are reviewed in this present section.
2.1 Geomorphic Studies: A historical perspective From the ancient time to the present day, the landforms and their study have
been the matter of great interest for the researchers. Herodotus (4th Century
B.C.), Aristotle (384 – 322 B.C.), Strabo (54 B.C. - A.D. 25), Seneca (1 B.C –
A.D. 65) are some of the eminent names worth to be mentioned as the ancient
pioneers of landforms study.
The basic foundation of geomorphology was laid in America in the later half of
19th Century by Major J.W. Powell, 1834-1902; Dutton, 1841-1912; and
Gilbert 1843-1918. Powell’s studies an Unita Mountain emphasized the
importance of geologic structure in the classification of landforms. He also
introduced the concept of the limiting level to which the land-level would reduce
and called it ‘base level’ (Garde, 2005). Col. George Greenwood earlier used this
concept in Europe in 1857. Powell recognized that the process of erosion, if
carried undisturbed on land, would reduce it eventually to a level little above
sea level. He was able to correctly interpret that various unconformities in rocks
in the Grand Canyon, Colorado (U.S.A.) correspond to ancient periods of land
erosion (Garde, 2005).
Gilbert’s (1914) contribution in experimental work carried out in California was
a pioneer in studying hydraulic mining and its effect on stream morphology. His
other contributions include recognizing the importance of lateral planation by
streams in the development of valleys and his explanation of Henry Mountains
of Utah (U.S.A.) was the resultant product of erosion of intrusive bodies. Dutton
gave a penetrating analysis of individual landform. Gilbert and Dutton are given
credit for initiating the concept of erosional unloading of the earth’s crust
technically known as isostasy (Garde, 2005). Davis (1850–1934) putted greater
impact on the development of geomorphology than any one else. Of all the

15
contributions to geomorphology, Davis is remembered for introducing the
concept of ‘Geomorphic Cycle’. According to this concept evolution of landscape
is a systematic sequence that enables one to recognize the stages of
development of landforms. The sequences are termed by him as youth, maturity
and old stages of development. These landforms are explainable in terms of
differences in geologic structures, geomorphic processes and the stages of
development. Penck (1953) and his followers questioned Davis’ idea of
geomorphic cycle during 1920’s and 30’s. In spite of these objections the
Davisian geomorphic cycle is still considered a reasonable model primarily
because of the absence of a plausible alternative (Garde, 2005). Davision model
of drainage development leads to the generation of a new paradigm of
geomorphic study of any region.
Since the end of the Second World War, a large number of aspects about river
morphology have been or are being studied. These include channel geometry,
mathematical modelling, effect of neo-tectonics and mass movements on
channel morphology and fluvial system. Experimental fluvial morphology, paleo
climatic and paleo hydrologic effects were another paradigm of the fluvial
geomorphology. Scientists working at U.S. Geological Survey have studied
short-term morphology of river channels. Langbein (1947), Leopold et. al.,
(1964), Weaver (1987) studied fluvial system and performed several experiments
in the laboratory to study river morphology. Allen (1978) had done extensive
works on the characteristics and classification of bed forms and sedimentary
structures with respect to deltas, meanders and floodplains. Many investigators
including Gregory, Lewin, Baker and Starkel (Garde, 2005) have studied paleo
climatic and paleo hydrologic effects on river channels. Geographers in U.K.
had given impetus to the researches in gravel-bed rivers and these works are
now being continued in Canada, U.S.A. and New Zealand (Garde, 2005).
Majority of the researches were done primarily during the field surveys. In the
later half of 19th Century different kinds of thematic maps were used to
investigate fluvial geomorphology.
Topographical maps were in use intensively and gave impetus to
geomorphological researches. In 1873, Sonclar determined twelve characteristic
values for each of several mountain ranges. The most noteworthy being the

16
mean relative altitude of ridge lines. His example was followed in 1886 by
Neumann who, while carrying out a detailed study of the Schwarzwald
Mountains, calculated among other parameters seven characteristic values for
each of a large number of valleys. From a comparison between the Schwarzwald
Mountains, the Thuringerwald Mountains and the Northern Ca’lcareous and
Eastern Alps, he noted that levelling in the old Hercynian massif was in a much
more advanced stage (Baulig, 1959).
Martonne (1926) worked for more than a year in determining the mean altitude
of France and its major geographical regions. Morphometric computations were
used as bases of regional identification. Between 1918 and 1938, several works
on the French Alps, computing morphometric indices and carving coefficient for
mountain relief were done (Zavoianu, 1985).
The genetic explanation of hydrological phenomena has benefited considerably
by the introduction of the classification system for channel networks proposed
by Horton (1945) and the establishment of laws of development for river
networks. Thorough mathematical training and theoretical mastery enabled
Horton to arrive at a number of valid mathematical relationships. Horton
summarized his results in four laws: the law of stream numbers, the law of
stream lengths, limiting infiltration capacity and the runoff-detention-storage
relation. He showed that the most important factor for aqueous erosion was the
minimum length of overland flow required to produce sufficient runoff to initiate
erosion
Development of river valley was another long debatable issue for the scientists.
In Eighteenth Century, Neptunits proposed a very crude theory of erosion which
invokes great floods (Davi, 2000). But in the nineteenth century Plutonist’s
theories tried to prove that the upper fissures during mountain uplift were
modified in detail by water to form valleys. The forces of weathering and
degradation, gained the upper hand to modify them (Hettner, 1928). However,
both the theories of Hutton and Hettner were rejected by Lyell (1872), who took
the features as products of marine action. In England, Greenwood (1857) and
Jukes (1862) put forward the view that valleys had been carved out by the
17
rivers that occupy them by the process which continued over thousands years
(Hettner, 1928).
The complete analysis of river network development and morphometric study
follows Chorley’s (1967) scheme of analysis of drainage basin. However, impacts
of some other models (Horton, 1932; Langbein, 1947; Strahler, 1964) are also
visible in Chorley’s research. Horton defined stream order and discussed the
relation among the stream order, stream number and stream length. The
subject fluvial geomorphomlogy has been enriched substantially by the works of
numerous American researchers, among whom Strahler (1952, b, 1953, 1956,
1957, 1958, 1964, 1966), Schumm (1954, 1956, 1977, 1979), Maxwell (1955,
1960), Hack (1957), Melton (l957, 1958a, b, 1960), Morisawa (1957, 1958,
1959, 1962, 1967, 1968), Leopold, et. al., (1964), Bowden and Wallis (1964,
1966), Shreve (1966, 1967, 1969) and Smart (1968a, b, 1969) are worth of
mentioning.
The landform classification system developed by Horton was applied in
Romania to the characterization of the river network between the Ialomita and
Trotug Rivers, for which besides other morphometric features, a dependence of
the mean multi-annual flow (calculated from data covering a period of several
years) on the river size in various sectors have been established (Platagea et. al.,
1963).
Hutton (1932) was the man who laid the foundation of scientific study of
landforms as originated by different geomorphic processes. His works were
extended by Playfair, Charles Lyell, Powell, Gilbert and Dutton. They mainly
worked on geological modifications of morphometry (Pande, 1990). Davis and
his contemporaries paid special attention to the study of rivers and valley
development because of their significance in the development of landforms
The geometric classification and evaluation of fluvial landforms can be
attempted by selecting an area unit which expresses all the terrain attributes.
Physiographic regions (Fenneman, 1914) and physiographic atoms (Wooldridge,
1932; Savigear, 1965) are examples of such satisfactory units. Both Playfair
and Davis have considered the drainage basin as the most satisfactory unit for
landform evolution. According to Davis, a drainage basin, with its primary,

18
secondary and tertiary tributaries exhibits a leaf like structure. However it was
Horton (1932), who first sponsored the study of a drainage basin as a
geomorphic unit. Subsequently, Strahler (1958), adopting Horton’s terminology,
made notable contributions in the study of drainage basins.
A systematic description of the geometry of a drainage basin and its stream
channel system requires measurement of linear properties, areal properties and
relief properties of drainage basin. Whereas the first two categories of
measurement are planimetric the third category treats the vertical inequalities
of the drainage basin forms (Strahler, 1958). Jha (1996) considered drainage
basin as a unit of study and included basin morphology, terrain morphology,
relief and drainage for morphological evolution of the Himalayan Ramganga
Drainage Basin.
The study of quantitative drainage network analysis has advanced and seen
vast strides in America and European countries in a short stipulated period of
last three decades. Contrary to it, the progress of it remains comparatively slow
in our country. The studies of Indian geomorphologists like Varma (1957);
Singh (1961); Bose (1961); West (1962, 1964); Das et. al. (1964); Sen (1965);
Chaubey (1966, 1967); Desai (1968); Ahmed (1968); Sharma (1969, 1970,
1981); Mukhopadhyay (1969, 1974); Dutt (1970); Kherkwal (1970); Rai (1971);
Bandhopadhyay (1972); Mukerjee (1975); Padmaja (1975) and Singh (1977) are
worth mentioning.
Nanshan (1987) provided the terms ‘geomorphic entropy’ and ‘surpass entropy’,
and took the terms as quantitative indices for growth stages and stability. The
development of drainage landforms were products of ground objects which were
eroded, transported and accumulated.
Merlin (1965) published studies concerning the methods used and the results
obtained in morphometrical analysis of several North African massifs, using
hypsographic curves and mean altitudes. He also revived the method of decimal
profiles used by Jovanovib, on the basis of which he calculated and analyzed
critically a series of mean durability indices computed for various geological
formations.

19
We can classify the major works of 19th century in the field of Fluvial
Geomorphology in flowing table.
Table: 1
Development of Fluvial Geomorphology in 19th Century
Phenomenon Authors Year
Fluvial
River Sediment movement Gilbert 1914
Knickpoints Lewis 1944
Meanders Friedkin 1945
Networks Schumm 1977
Channel patterns Schumm and Khan 1971
Overland flow erosion Moss and Walker 1978
Confluences Best 1986
Rainsplash Noble and Morgan 1983
Slopes
Frost heave Taber 1930
Angle of repose Van Burkalow 1945
Angle of sliding friction Van Burkalow 1945
Liquefaction De Ploey 1971
Screes Statham 1973
Drainage Anderson and Burt 1977
Dye tracing and permeability Anderson and Burt 1978
Leaching Trudgill et al. 1984
Source: Goudie Andrew, et. al., 1990
Study of landscape evolution depends on understanding the present
geomorphic processes, their rates, links between erosional and depositional
components and comparison of spatial versus temporal changes and appraisal
of stratigraphic records. The Binghamton Symposia (May, 1980) were
concentrated on ‘Space and Time in Geomorphology’. Significance of the process

20
studies lies, as Johnson (1982) pointed out, on understanding the mechanics
and control of geomorphic processes and short-term variability and behaviour
of geomorphic systems and landforms. Responses of the processes can be
captured spatially by identifying different landforms or terrain units. Mabbutt
(1968) and Gardiner (1976) emphasised on land as an end product of complex
ecological interactions. Moss (1981, 1983) proposed land classification methods
by incorporating processed data. The land system classification approach was
adopted by CSIRO, Australia and the terrain system approach incorporated in
the geomorphic process studies (Chattopadhyay et. al., 1998; Meijerink, 1988).
As process study is related to dynamic system approach, it is necessary to
investigate within a framework of a river basin which collects, concentrates and
coordinates the movement of water and sediment. Gregory (1976) reviewed the
drainage basin studies since 1700 and identified seven approaches;
morphometry (spatial and topology), basin characteristics, channel pattern,
channel geometry, theory, dynamics and paleo studies. From Horton’s (1945)
morphometric analysis to Chorley (1962) and Schumm’s (1977) emphasis on
paleo-hydrology and metamorphosis of rivers and river channels, the primary
concern was to understand the process variation in water and sediment
production over time and effects of processes over landforms at present, in the
past and also to predict for the future.
2.1.1. Development to Geomorphic Studies in India In India, the geologists have to be given credit for initiating researches in
geomorphology. The works of Dunn (1929), Wadia (1937), Chatterjee (1945),
Radhakrishna (1952), Krishnan (1953), Auden (1954), Arogyaswamy (1967) are
noteworthy. Geographers like Bagchi (1960), and Chibber (1953) have pioneered
works in geomorphology.
The geomorphological studies pertaining to the highlands of Chotanagpur, in
general, have been initiated by geologists along with geographers. Detailed
geological pieces of information have been recorded by eminent geologists
notably Oldham (1893), Fox (1930, 1931, 1934), Gee (1932), Pascoe (1950),
Krishanan (1953, 1956) and Wadia (1975).

21
At first, Dunn (1939) interpreted the evolution of the four erosion surfaces in
Chotanagpur plateau. He propounded that uplifts were the root causes of the
different erosional surfaces and supported his next works in 1941, 1942. He
was of the opinion that the different erosional surfaces of the area are
peniplains uplifted during the Himalayan movements.
Chatterji (1945) discussed some aspects of geomorphology of Ranchi Plateau.
He (1946) had traced the physiographic evaluation of Chotanagpur Plateau. He
contradicted the uplift theory of Dunn and proposed a differential erosion
theory for geomorphic interpretation of Pat Region. Singh (1956) was awarded
Ph.D. degree by the London University on his seminal work on
geomorphological evolution of the highlands of Chotanagpur Plateau and the
adjoining district in Bihar. He (1957) traced the structure, stages of drainage
and morphology of Chotanagpur Highlands. Singh (1970) gave an excellent
treatment of topography and towns in the Chotanagar Highland by tracing the
significance of rock and surface in the distribution of urban settlements. Ahmed
and Debi (1965) traced the evolution of scarps of Chotanagpur Plateau. Prasad
(1965) presented an excellent paper on the physical landscape of Chotanagpur
Plateau. The article with one map provided a detailed account of the regional
units of Chotanagpur Plateau. Prasad (1971) prepared a bibliography on
Geomorphology of Chotanagpur Plateau. He presented number of papers (1973,
1974, 1977, 1979, and 1980) which are considered as important contributions
in the field of geomorphology. Satpathi (1970, 1972 & 1973) presented a broad
outline of geomorphology of Singhbum through quantitative analysis of
landform with particular reference to the Deo River Basin, Singhbhum. Satpathi
also (1975, 1976) discussed the landscape cycle of Singhbhum and made a
unique and systematic study of meander mechanisms, geometry of meanders
and sinuosity indices of major rivers of Singhbum. Gupta (2004) has published
a book on Geomorphology of Damodar Basin; in this book he has done
evolution of the drainage system, morphometric analysis and models of
landscape evolution.
Mache and Peshwa (1978) made an interesting photo-geological interpretation
of the controls on drainage in Gondwana and Bijawaras of the Son Valley,
Shahdol District, Madhya Pradesh. Davi (2000) has published a book on river

22
basin morphology. In this book she has done several aspects of quantitative
geomorphic analysis. It is well known that hydrologic processes are influenced
by geomorphic properties like slope, drainage density (Gregory et. al., 1973;
Rodriguez-Iturbe et. al., 1979; Sharma et. al., 1996). There exist some
approaches quantifying these relations through drainage basin parameters
(Babar, 1998; Balasundram, 1977; Bhattacharya, 1996; Kale et. al., 1994;
Moore et. al., 1991 and Singh, 1981) and model simulation like the unit
hydrograph (Bloschl et. al., 1995; Moore et. al., 1991 and Tarboton 1997).
However, a general quantification of these effects is still a research task. Recent
advances in the analysis of landform morphometry through the availability of
high resolution Digital Elevation Models (DEMs), powerful Geographic
Information System (GIS) techniques (Lawrence, 1985; Tarboton, 1997 and
Tarboton et. al., 1991) and Remote Sensing applications (Sharma et. al., 1992
and Tiwari et. al., 1996; Babar 2001, 2002a, b) enhanced the research efforts.
In the early 1930s, it was not unusual for whole regions to be considered in one
paper (e.g. Mackin, 1936), whereas more recently, in fluvial geomorphology for
example, landforms are considered at no more than the scale of a drainage
basin (Chorley, 1969). At a far smaller scale, for instance, differences between
the processes operating on individual hill slope segments have also been
identified (Anderson et. al., 1977). Hunday et. al., (1967) had traced the
geomorphological evolution of eastern part of India. Chakraborty (1970) had
dealt with some problems of the evolution of the Bengal Delta. Sengupta (1972)
had analysed the geomorphology of the Bhagirathi-Hooghly River Basin.
The drainage basin analysis has remained an important unit of investigation in
any hydrological study like assessment of groundwater potential, groundwater
management. Hydrologists and geomorphologists have recognized that certain
relations are most important between runoff characteristics and geographic and
geomorphic characteristics of drainage basin system. Various important
hydrologic phenomena can be correlated with the physiographic characteristics
of drainage basins such as size, shape, slope, drainage density and length of
the tributories etc. (Rastogi et. al., 1976).

23
Quantitative Geomorphological studies came late in India. Singh (1990) studied
the Geomorphology of the Tawi Basin and concluded that the basin has been
affected by intermittent tectonic events from Tertiary to Pleistocene periods and
their imprints are evident in the surface morphology. The region has also
witnessed Pleistocene Glaciations which has also played a significant role in
shaping the geomorphic forms of the basin.
With the advancement of the knowledge and technology, the methodology of
landform studies has been changed. The changes are perceived even in
studying the scale of landforms being examined. It is partly because processes
and forms are best related and studied at smaller scales. The synoptic coverage
and high precision of remotely sensed data coupled with marked cost
effectiveness and time efficiency in data acquisition and analysis procedures
have made geomorphological mapping an extremely effective tool for
management of natural resources and environment (Srinivasan, 1998). Detailed
geomorphological mapping is one of the principal means of studying the
morphology, genesis, distribution and age of forms which in turn helps to
interpret the geomorphic history of any evolved landscape (Blarzcsynski, 1997).
Sophisticated GIS software makes the investigations of geographical processes
and offers a new approach to problem analysis. However, publications about
geomorphologic problems and processes easier solved by GIS software and
database still come out occasionally (Telbisz, 1999). More studies are needed in
this field of geomorphic research.
2.2 Land Use Land Cover Studies: A Historical Perspective According to de Sherbinin (2002), land use is the term that is used to describe
human uses of land or immediate actions modifying or converting land covers.
On the other hand, land cover refers to the natural vegetative cover types that
characterised over a particular area. Land use change is the proximate cause of
land cover change. The driving forces to this activity could be economic,
technological, demographic, scenic and or other factors. Hence, Land Use Land
Cover dynamics is a result of complex interactions between several biophysical
and socio-economic conditions which may occur at various temporal and
spatial scales (Reid et. al., 2000). Land cover is a fundamental parameter

24
describing the earth’s surface. This parameter has considerable impacts on and
links many parts of the human and physical environments (Foody, 2002).
Change detection is useful in many applications related to land use land cover
(LULC) changes, such as shifting cultivation and landscape changes (Imbernon,
1999; Serra et.al., 2008), land degradation and desertification (Adamo
et.al.,2006; Gao & Liu, 2010), coastal change and urban sprawl (Shalaby &
Tateishi, 2007), urban landscape pattern change (Batisani & Yarnal, 2009;
Dewan & Yamaguchi, 2009; Long-qian et. al,. 2009), deforestation (Schulz
et.al., 2010; Wyman et.al., 2010), quarrying activities (Mouflis et.al., 2008) and
landscape and habitat fragmentation and other cumulative changes (Munroe
et.al., 2005; Nagendra et.al., 2006). Continued, historical and precise
information about the LULC changes of the earth’s surface is extremely
important for any kind of sustainable development program, in which LULC
serves as one of the major input criteria. Thus, analyzing and mapping both the
present LULC situation, as well as the changes in LULC over time is recognized
as important parameter to better understand and provide solutions for many
social, economic and environmental problems (Das, 2009; Lu et.al., 2004;
Pelorosso et.al., 2009).
Satellite remote sensing is the most common data source for detection,
quantification, and mapping of LULC patterns and changes because of its
repetitive data acquisition digital format which is suitable for computer
processing and accurate referencing procedures (Chen et.a., 2005; Jensen,
1996; Lu et. al., 2004). Change detection and monitoring by remote sensing
involves the use of several multi-dated images to evaluate the differences
occurring in LULC between the acquisition dates of images that are due to
various environmental conditions and human actions (Singh, 1989). The
successful use of satellite remote sensing for LULC change detection depends
upon an adequate understanding of landscape features, imaging systems and
methodology employed in relation to the aim of analysis (Yang & Lo, 2002).
Many change detection techniques have been developed and used for
monitoring changes in LULC from remotely sensed data, such as post-
classification comparison (PCC), image differencing, principle components

25
analysis and vegetation index differencing (Lu et. al., 2004). The PCC method,
which is recognized as the most accurate change detection technique, detects
land cover changes by comparing independently produced classifications of
images from different dates (Singh, 1989; Yuan, Elvidge, & Lunetta, 1998).
Using the PCC method, problems associated with multi-temporal images
recorded under different atmospheric and environmental conditions has been
reduced. Data from different dates are separately classified and hence,
reflectance data from multi-dates do not require adjustment for direct
comparability (Coppin et.al., 2004; Rivera, 2005; Singh, 1989; Warner &
Campagna, 2009; Zhou et.al., 2008). The PCC method also has the additional
advantage of indicating the nature of change (Mas, 1999; Yuan et.al., 2005).
There are currently numerous satellite programs in operation. For change
detection studies, the Landsat program is unique because it provides an
historical and continuous record of imagery. Landsat images can be processed
to represent land cover over large areas and over long time spans which is
unique and absolutely indispensable for monitoring, mapping and management
of LULC (Wulder et. al., 2008). A number of studies have attempted to use
Landsat data to address LULC changes, some of which focused on semi-arid
and arid regions. For instance, Shalaby and Tateishi (2007) identified the LULC
types in the coastal zone of Egypt from Landsat images. The use of a
combination of supervised classification techniques and visual interpretation
analysis was found to increase the overall classification accuracy by
approximately 10%. Gao and Liu (2010) digitally analyzed two Landsat images
recorded at an interval of 10 years and detected a long-term trend of land
degradation caused by water logging and soil salinization in northeast China.
Bakr et. al., (2010) used five Landsat images to monitor the land cover changes
from 1984 to 2008 in a newly reclaimed area in Egypt using a hybrid
unsupervised and supervised classification approach, in addition to the use of
normalized difference vegetation index (NDVI).
Land cover mapping has seen a great amount of development in recent years.
Advances in sensor technology (Lawrence et. al., 2006; Wiesmann et. al., 2005;
Friedl et. al., 2002; Masek et. al., 2001) have caused an increase in the quantity
of data acquired. Increases in computing power (Holland et. al., 2006) have

26
allowed this information to be processed more rapidly, while novel analytical
methods (Amarsaikhan et. al., 2007; Bork & Su, 2007; Nguyen et. al., 2006)
have enabled us to produce land cover maps faster, more cheaply and with
greater accuracy.
Classification of different land cover regions of remote sensing images is
essential for efficient interpretation of them. Normally, the images acquired
from satellite mounted cameras suffer from lot of problems including low
illumination quality and rapid changes in environmental conditions. Also many
times the spatial resolution is not very high. This makes the analysis of remote
sensing images more complex and difficult. Basically the regions like vegetation,
soil, water body, concrete structure etc. of a natural scene are often not well
separated leading to overlapping regions. Moreover, the gray value assigned to a
pixel is an average reflectance of different types of land cover classes present in
the corresponding pixel area. Therefore, a pixel may represent more than one
class with varying degree of belonging. Thus assigning unique class label to a
pixel with certainty is a difficult problem. Conventional methods (particularly
non-fuzzy methods) cannot deal with the imprecise information. To improve the
representation, a graded belonging approach like fuzzy sets, a soft computing,
is used which provide an effective solution to this problem.
In remotely sensed data, texture analysis is used for classification of land cover
types and land use categories such as water, agricultural areas, mountain
areas and urban regions (Tuceryan and Jain, 1993). Land cover may be
classified with the help of uniform intensity of spectral reflectance or uniform
texture. Texture measures can be used to map land cover types and enhance
classification accuracy on high and very high resolution satellite imagery.
Texture analysis at coarser resolution (250 m) can be done to meet the need of
global change research, early warning of human-induced land cover changes,
such as urbanization and deforestation, detection of oil spills, phytoplankton
blooms and clear cuts in the boreal forest (Bucha and Stibig, 2008). The MODIS
(Moderate Resolution Imaging Spectroradiometer) instrument has been planned
to provide global coverage at 250 m resolution in the red and infrared bands
and to capture every day images at 250 m, 500 m and 1 km spatial resolution
concerning the protection of our environment.

27
The detection and analysis of land use land cover change has been applied
successfully in many different countries and ecosystems of the world, for
example, in Canada (Panet.al.,1999), United States of America (Rogan et. al.,
2003); Kenya (Serneels & Lambin, 2001); Thailand (Crews-Meyer, 2004);
Cameroon (Mertens & Lambin, 1997) or in Madagascar (Laney, 2004). Different
modelling approaches have been used to understand where LULC changes are
occurring and to study the driving forces of these changes (Turner II et. al.,
1990).
2.3 Water Stressed Studies A recent assessment of Europe’s environment by the European Environment
Agency warns that high levels of water stress, i.e. pressure on both quantity
and/or quality of water resources, exists in many places throughout Europe
and identifies several significant continuing pressures on water resources on
the European scale (Stanners and Bourdeau, 1995). Growing demand for water
in the domestic, industrial and agricultural sectors has led to increase
withdrawals and may lead to even higher withdrawals in the future. At the
same time climate change may reduce water availability at some locations.
UK Environmental Agency has published a report (2007), where they have
classified the water stress, principle and cause of water stress. Water stress is
one of major environmental constraints that limit crop productivity throughout
the world (Araus et. al., 2002; Boyer, 1982). Pakistan also faces serious
problems of shortage of water due to low and irregular rain fall, (less than100
mm) this resulted in heavy crop losses.
Water resource in its natural hydrological cycle is tapped for human activities
from both surface and ground water segments. The utilizable surface and
ground water are developed for agricultural, industrial and domestic purposes.
The agricultural need is much higher than the combined need for industrial
and domestic purpose.
The ultimate source for all the water is precipitation. In India, about 97%
precipitation occurs in the monsoon season which operates between July to
September. The surface and ground water reserves used to be full during the
monsoon and post monsoon periods and goes on depleting with time. The

28
resource comes to almost exhausted in the mid summer and in the pre-
monsoon. Due to over exploitation for multifaceted activities, the situation of
depletion of the water resource in the recent decades is much grimmer than
ever before. In the post-Green Revolution periods, the agricultural activities in
India have got tremendous growth. Irrigation has been the most crucial factor
for such growth.
Groundwater is the primary source of fresh water in many parts of the world.
Some regions are becoming over dependent on it, consuming groundwater
faster than it is naturally replenished and causing water tables to decline
unremittingly. Indirect evidences suggest that this is the case in northwest
India. The available evidence suggests that unsustainable consumption of
groundwater for irrigation and other anthropogenic uses are likely to be the
cause of water stress. (Rodell, et. al., 2009)
Groundwater responds more slowly to meteorological conditions than the near-
surface components of the terrestrial water cycle. Its residence time ranges from
months in shallow aquifers to a million or more years in deep desert aquifers.
Hence, groundwater can be slow to recover from perturbations to its state of
dynamic equilibrium. In particular, withdrawals can easily surpass net
recharge in arid and semi-arid regions where people depend on fresh
groundwater for domestic needs and irrigation. Despite the increasing pressure
placed on water resources by population growth and economic development, the
laws governing groundwater rights have not changed accordingly, even in
developed nations. Groundwater depletion is not limited to dry climates.
Pollution and mismanagement of surface waters can cause over-reliance on
groundwater in regions where annual rainfall is abundant.
India now suffers severe water shortages in many of its states. It averages about
120cmyr-1 of precipitation, which is more than any other country of comparable
size, but the rain is unevenly distributed. In New Delhi, India's capital city,
most middle-class residents do not have a dependable source of clean water
(Sengupta, 2006). The World Bank has warned that India is on the brink of a
severe water crisis. Nationally, groundwater accounts for about 50–80% of
domestic water use and 45–50% of irrigation. Total irrigated area in India nearly
29
tripled to 33,100,000 ha from 1970 to1999. In neighbouring Pakistan, which is
largely arid, groundwater is essential for much of the country's agriculture.
Competition for precious water in trans-boundary aquifers is likely to
exacerbate already strained relations between the two nations.
India government is aware that groundwater is being withdrawn at
unsustainable rates in some areas and in 1986 it established a Central Ground
Water Authority with the power to regulate groundwater development. However,
as in other nations composed of smaller sovereignties and encompassing
competing interests that have become dependent on a certain level of water
availability, it is difficult to implement a coordinated and appropriately
stringent response. Political and aquifer boundaries bear no resemblance to
each other and aquifers themselves are interconnected, so that one state's (or
country's) groundwater management practices are likely to affect its neighbour.
Holistic regional groundwater assessments would be valuable in promoting
appropriate policies and for hydrologic research, but such assessments are
difficult to generate on the basis of well surveys, which are typically
unsystematic.
Rajasthan, Punjab and Haryana are semi-arid to arid, averaging about 50 cm of
annual rainfall overall and encompass the eastern part of the Thar Desert. A
massive agricultural expansion fuelled largely by increased production of
groundwater for irrigation, began in the 1960s. Wheat, rice and barley are the
major crops. The region is underlain by the Indus River plain aquifer, a 560,000
km2 unconfined-to-semi confined porous alluvial formation that straddles the
border between India and Pakistan.
In India, according to an estimate by the Central Ground Water Board,
Government of India (2005), only 162 billion cubic metres (BCM)/yr of
groundwater is available for future irrigation, out of which around 40 BCM/yr
is available in the agriculture cultivating states (this groundwater will be
utilized for producing crops as well). India’s average water utilization for the 5.2
m ha of monsoon corps produced is around 104 BCM/yr (20 BCM/m ha/yr).
NASA’s Gravity Recovery and Climate Experiment Satellites have revealed faster

30
depletion of groundwater stocks in India, especially in the north and north
western parts of the country (18 BCM/yr) (Shrivastava, et. al.,2011 ).
The massive expansion of private sector tube-well irrigation schemes (in
Bangladesh, India and Pakistan) has led to the rapid depletion of groundwater.
With zero or negligible tariff on farm power in some states in India (no
additional costs for extracting extra water) and inadequate canal water; the
cultivation of crops with high water requirement (e.g. rice and sugarcane) in low
rainfall regions has led to over-exploitation of groundwater resources. Depletion
of groundwater levels over the years in some states is self-explanatory. The
Inter-Governmental Panel on Climate Change has projected that global mean
annual surface air temperature is likely to increase in the range 1.8–4.0°C by
the end of this century. Rising temperatures associated with climate change will
also affect water resources by decreasing snow cover and accelerating the rate
of snow melt. Under the climate-change scenario, delayed and/or uncertain
onset of the southwest monsoon will also have a direct bearing not only on
rainfed crops, but also on water storage putting additional stress on water
availability for irrigation. Depleting water resources create conditions analogous
to drought. Thus, relatively less water-requiring or drought tolerant varieties
could be a plausible solution to sustain crop productivity under such
conditions. The All India Coordinated Research Project (AICRP) on crop
cultivation have released varieties as drought-tolerant/less input requiring/for
rainfed conditions/widely adaptable varieties of crops based on multi-location
testing in diverse agro climatic conditions. (Shrivastava, et. al.,2011)
Rainfall Distribution in India is irregular. According to the amount of rainfall
received, the country can be divided into different zones. The numbers of rainy
months vary from one zone to another. Rainfall distribution in India is uneven.
The world’s highest annual rainfall 1141.90 cm has been recorded at
Cherrapunji in Meghalaya. On the other hand, the western part of Jaisalmer
District of Rajasthan is one of the driest parts of the country recording around
9 cm of rainfall in a year.
(http://www.indianetzone.com/45/rainfall_distribution_india.htm). Thus, it is
evident that there is a wide contrast in the amount of rainfall received by
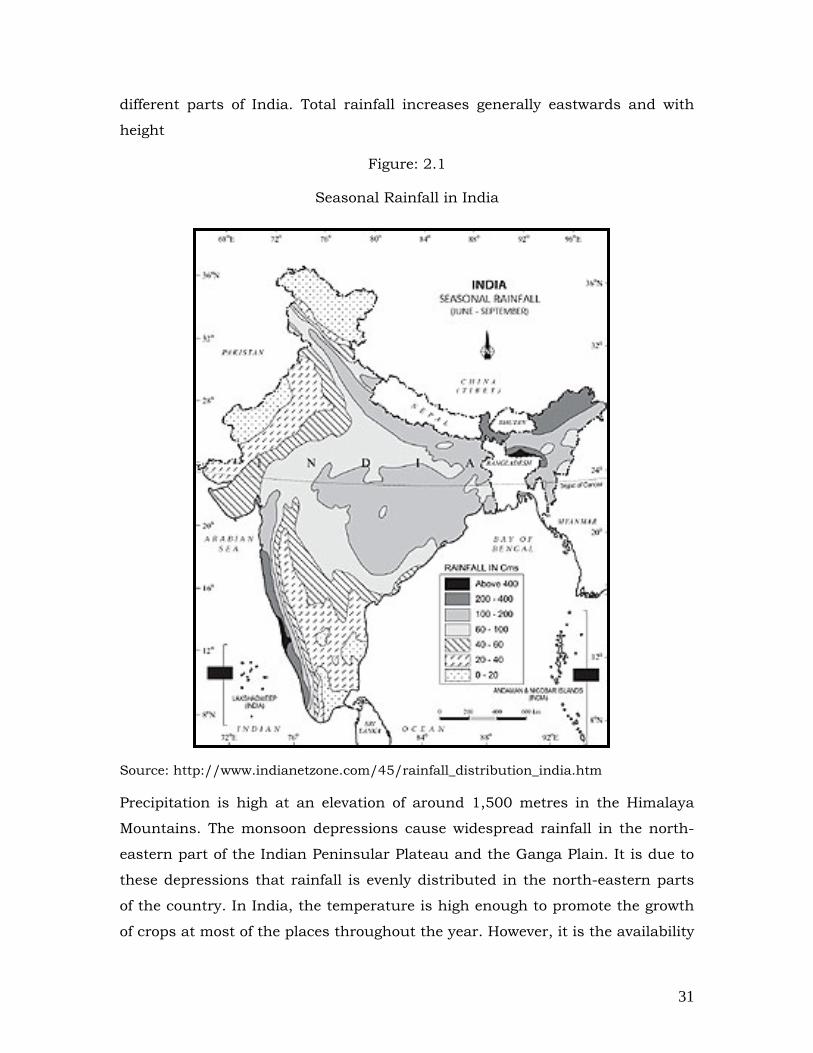
31
different parts of India. Total rainfall increases generally eastwards and with
height
Figure: 2.1
Seasonal Rainfall in India
Source: http://www.indianetzone.com/45/rainfall_distribution_india.htm
Precipitation is high at an elevation of around 1,500 metres in the Himalaya
Mountains. The monsoon depressions cause widespread rainfall in the north-
eastern part of the Indian Peninsular Plateau and the Ganga Plain. It is due to
these depressions that rainfall is evenly distributed in the north-eastern parts
of the country. In India, the temperature is high enough to promote the growth
of crops at most of the places throughout the year. However, it is the availability

32
of water that determines to a great extent the success of crops, zones of
vegetation and crop patterns. In this country, around 75 per cent of the total
area sown is with rainfall. Thus, the total yearly rainfall as well the number of
rainy months of an area is very significant in the country.
Topography is one of the main controlling factors of availability of water
resources because where the land surface is plain and delta region more
surface as well as ground water resource will be present. If it is a plateau, may
be surface water will be present during rainy season but in other times
availability of both the surface and ground water will be minimum. Hilly or
mountain or catchments areas will have minimum availability of surface and
ground water resources.
Unscientific methods of crop cultivation are also factors of water stress. Farmer
must use new types of irrigation techniques. The new method intends to supply
water in such a way that each plant has the amount of water it needs neither
too much nor too little. The modern methods are efficient enough to achieve
this goal.
Another method of managing the water stressed situation is to cultivate drought
resistant variety of crops or those crops which can be cultivated within short
period of time. (International Rice Research Institute, 1975).
2.4 Geomorphology and Land Use Land Cover Study The significance of geomorphological research is indicated by the fact that an
international organization of Geomorphologists’ has been formed. The first
International Geomorphological Conference, held at Manchester in 1985, was a
major event, in which specific emphasis was laid on the application of
geomorphology in land use planning. Out of 25 sessions, half of the sessions
were concerned with applied geomorphology. Therefore, the utility of
geomorphology in planning especially in land use planning is beyond doubt
(Hironi, 1991).
Land use planning has been carried out in different parts of our country.
Kumar et. al., (2009) published a paper on importance of geomorphological
mapping for urban planning and development for Korba City, using remote

33
sensing technology. National Research Council of India presented their research
on the impact of agricultural activities on the modification of the flood plain
geomorphology and the equilibrium state of the river.
The variations in spatial distribution of different land uses land cover may be
attributed to climate on the one hand and Geomorphology on the other as well.
According to Meyer, 1999 every parcel of land on the earth’s surface is unique
in its land cover.
Most of the works on land use land cover analysis in India were initiated
following Dudley Stamps land use survey of U.K. in the beginning of 1940s. It
was at the 1940 session of the Indian Science Congress held at Madras that
Prof. S.P. Chatterjee pointed out the necessity of undertaking the land use
survey in India. Dayal (1947) prepared a thesis on agriculture geography of
Bihar. He discussed the influence of soil and climate on land utilization, the
pressure of population on land and the nature of land utilization. Chatterjee
(1952) undertook more detailed land utilization survey in Howrah district and
1200 land use maps at the scale of 1:3690 covering 813 villages were prepared.
Rao (1947) has emphasized the techniques of soil survey for analysis of land
use in the Godavari Region. Roy (1968) documented rural land use pattern in
Azamgarh. Singh (1971) dealt with the optimum carrying capacity of the land in
Punjab. Deshmukh (1975) studied rural land use of Lonkhede. Models in land
utilization were well documented by Mandal (1980). Sustainable development
initiative was well documented by Singh (1996). Planning for sustainability on
natural resources and bio-energy was attempted by Maheshwari et. al. in 1996.
Most of the researches were mainly concentrated on the land use land cover
mapping of the current time. The studies on the influence of geomorphology on
the land use land cover are limited and needs more and more studies especially
in the Indian condition.
2.5 Remote Sensing and GIS for Geomorphic Study In the last decade, many efforts have been made in the development of satellite
sensors capable to produce data for digital elevation models generation. One of
the first constellations designed for this aim was the SPOT (Satellite Probatoire
d'Observation de la Terre) by CNES (Centre National d'Etudes Spatiales). The

34
satellites provided across-track stereo images of 10 and 20m ground resolution.
DEMs (Digital Elevation Model) with sub-pixel accuracy were extracted (Gugan
et. al., 1988, Baltsavias et. al., 1992) and used for the first GIS applications
(Welch, 1990). Since then, many new satellites have been launched, carrying
sensors that can achieve less then 1m ground resolution (Quickbird, Cartosat).
The largest parts of the sensors are currently in use for the acquisition of
images for DEM generation.
Geology, relief and climate are the primary determinants of running water
ecosystems functioning at the basin scale (Mesa, 2006). Detailed morphometric
analysis of a basin is a great help in understanding the influence of drainage
morphometry on landforms and their characteristics. The drainage
characteristics of Wailapalli Basin and sub-basins were studied to describe and
evaluate their hydrological characteristics by analyzing topographical map and
remote sensing (Shuttle Radar Topography Mission) SRTM data. Use of SRTM
data and GIS techniques is a quick, precise and inexpensive way for
morphometric analysis (Farr et. al., 2000; Smith et. al., 2003; Grohmann, 2004;
Grohmann et. al., 2007).
Digital elevation data form remote sensing substantially helps for Hydrologic
modelling. In this regard, GIS offer potential resources for the application of
such techniques, particularly for large scale distributed terrain modelling. Most
of the algorithms used to analyse DEM work on regular grid DEM structure
because of its wide availability and the ease of its computer implementation and
treatment. The basic framework for grid DEM analysis in GIS is incorporated
within ArcGIS software. This mainly yields the delineation of flow paths and the
extraction of river basins and their different morphologic characteristics.
Identification of drainage networks within basins or sub-basins can be achieved
using traditional methods such as field observations and topographic maps or
alternatively with advanced methods using remote sensing and DEMs
(Verstappen, 1983; Mark, 1983; O’Callaghan et. al., 1984; Rinaldo et. al., 1998;
Macka, 2001; Maidment, 2002). Whilst providing a first hand analysis, it is
difficult to examine all drainage networks from field observations due to their
extent throughout rough terrain and/or vast areas. Blue lines, representing
35
fluvial channels on topographic maps, have been widely used to describe the
drainage networks (Schumm, 1956; Abrahams and Campbell, 1976; Mark,
1983). However, they do not represent real drainage networks on the ground
due to cartographic generalizations and subjective judgment of the
cartographers (Chorley and Dale, 1972; Drummond, 1974; Mark, 1983).
Furthermore, there are often numerous valleys, which are not cartographically
marked as fluvial channels despite their ability to collect and transport water
flow. For these reasons, these first order streams, called ‘fingertip’ by Horton
(1945) or ‘exterior links’ by Shreve (1966). In this respect, DEM can be used to
extract the drainage networks which include all exterior links.
Digital elevation models (DEMs) are increasingly being used for visual and
mathematical analysis of topography, landscape and landform, as well as
modeling of surface processes (Bishop & Shroder, 2000; Dikau et. al., 1995;
Giles, 1998; Millaresis et. al., 2000; Tucker et. al., 2001). Bishop et. al., (2001)
used a DEM of Nanga Parbat to map glaciers in the rough mountain terrain of
the western Himalayas. DEM offers the most common method for extracting
vital topographic information. To accomplish this, the DEM must represent the
terrain as accurately as possible, since the accuracy of the DEM determines the
reliability of the morphometric analysis. Currently, the automatic generation of
DEM from remotely sensed data with sub-pixel accuracy is possible (Krzystek
1995).
From the previous discussion we understand that the land use land cover
mapping, water resource mapping and the geomorphic mapping is possible
using remote sensing and geographic information system. Land use land cover
analysis and change detection have been done on several places of the world
including our country India, using remote sensing, GIS and other conventional
methods. Different types of data including satellites images have been used.
But unfortunately very few studies are there indicating the influence of
geomorphology in shaping the land use land cover of any region and how the
changing geomorphology is moderating the nature and growth of land use land
cover of any region. In the present research proposal land use land cover
analysis and change detection (NRSC method) will be done in the one had and
secondly, the role of geomorphology will be analyzed in shaping the land use

36
land cover of the region. We understand the land use land cover of any region is
determined by the climate, especially by the availability of water resources. The
present study region is falling under water stressed situations. Water stress
occured as a result of more demand for water than its availability and restricts
its use. Water stress causes deterioration of fresh water resources in terms of
quantity (aquifer over-exploitation, dry rivers, etc.) and quality (eutrophication,
organic matter pollution, saline intrusion, etc.; Tucker et. al., 1994).
Almost all of the previous geomorphologic studies were made by considering
drainage basin, catchment and mountain area as a unit of investigation. But
the present study is intended to be done through administrative approach.
Catchment and mountain area approaches of geomorphic studies are made for
dam constriction, flood controlling and for the land slide studies. Here, the
administrative approach of geomorphic study is intended for the land use land
cover planning purpose. If any government or any other organisation wants to
implement any types of planning, they may use this approach.
In the present research proposal we are interested to do the geomorphic
resource analysis, land use land cover analysis and water stress area
identification and their management. Local administration is the body who can
implement any planning to reality. The water stress study will be done through
geomorphic approach. Geomorphic resources are the natural phenomena of the
earth’s surface. It influences the agricultural activities and other land use land
cover, surface water resources of any region and so for our study area abo.
Agriculture has been the major economic activity of India. It comprises more
than 58% working population of India. In Burdwan district 14.76% main
workers are cultivator and 29.94% main workers are agricultural labours
(Census of India 2001). Burdwan is one of the best agricultural regions of India
and it produces variety of crops. The main varieties are rice and potato. It plays
a major role in achieving food security in this part. In doing so the district has
develop the ground water in its highest level. Some parts of the district are rich
enough in terms of water resources both in surface and ground resources. But
some parts of the district are facing acute shortage in water resources.
Intensive development of the ground water for agricultural development put

37
heavy stress on its water resource availability. Ausgram I & II blocks where the
situation is worse, immediate planning and management is needed for the
sustainable development of the water resource of the region. Or in other words
we need better plan and care to manage the water resources so that the region
can develop in sustainable manner. The planning to manage water stress
condition may be done with the help of the geomorphic resources in accordance
with the means of same alternative land use land cover, specifically agricultural
land use planning.
The Government of West Bengal defined an area for alternative agricultural
policy (2003, http://www.ibef.org/download/west_bengal_190111.pdf). Main
objectives of the policy are to sustainable increase in the agricultural
production and income of the farmers, agricultural labours and poor villagers.
The policy could be applied in those regions, where either the agricultural
activities are in very low extent or in the region where water resource is putting
stress on the sustainable development. Based on this policy we have selected
present study area which is water stressed area.
2.6 Identified Research Gap The literatures we have identified and studied have been reviewed and we find
that drainage basin has been considered as a unit of investigate and planning.
Beside this, same specific coastal or mountain areas were considered as unit of
geomorphic study. Several satellite sensors have also been used for variety of
applications in world wide, national wide, sate wide, district wide. But very few
studies are done to handle the water stressed situation using geomorphology
and alteration & planning for land use land cover to sustain the water stressed
condition.
Since Independence, river valley has been considered as very important aspect
of economic planning and development in India. Domodar Valley Corporation
(DVC) is one of them. Here, the Domodar River Basin has been considered as a
primary unit for planning. But in reality the planning has been implemented by
incorporating the administrative units of different blocks of the respective
districts of Jharkhand and West Bengal.

38
In the present research proposal we are going to do the geomorphic resource
analysis, land use land cover analysis and water stress area identification and
its management. The plans will be studied through administrative approach.
Because any land use planning can be implemented administrative boundary
wise. Advance geographical research tools to be used here for analysis of data
and drawing the maps. Satellite remote sensing and GIS technology will be
intensively used for the geomorphic resource analysis, land use land cover
analysis, water stressed area identification and planning.
2.7 Objectives Major objective of the present research are:-
• To study of geomorphic resources in the Ausgram I & II Blocks;
• To study of land use land cover analysis and influencing factors behind
that;
• To estimate the available surface water resources in Ausgram I & II
Blocks, using multi-temporal satellite data and SOI topographical maps;
• To classify the water stressed zone based on the geomorphic resources;
• Importance of surface water resource for determination of land use land
cover of this region will be evaluated;
• Based on geomorphic resources, identification of the surface water
resource potential zones and surface water harvesting zones will be done;
• Importance of surface water for social and economic activities will be
evaluated; and
• The final aim of the present study is to suggest and formulation the
development and management plans for the region so as to formulate a
new seasonal land use plan.
2.8 Limitation of the Present Study This study is essentially focused upon the geomorphic resources, land use land
cover and water resource analysis. Based on theses parameters we made land
use land cover plan for water stressed region. The surface runoff has been given
more emphasis and importance. Present study area covers 493 sq. km. The

39
study area may be small but this plan may be needed for huge available similar
other parts of the state also. The accuracy of the used remote sensing
technology may not be 100% as spatial resolution of used satellite image is 30
m. But finer resolution may be used for smaller region and for more detailed
studies.
40
Chapter: - Three
BACKGROUND OF THE STUDY AREA AND METHODOLOGY
3.1 Geographical Setup of the Study Area The selected study area Ausgram (Bengali: আuসgাম), a block town and a
Community Development Block in the Sadar Subdivision of Burdwan district,
West Bengal, India.
In 1846, when Burdwan subdivision was created, Ausgram was one of the three
police stations along with Bud Bud and Sonamukhi. In Peterson’s District
Gazeteer of 1910, Ausgram is mentioned as one of the police stations of
Bardhaman subdivision.
Gram panchayats under Ausgram I Panchayat Samiti are: Ausgram, Berenda,
Ukta, Dignagar I, Dignagar II, Guskara and Billagram. Gram panchayats under
Ausgram II Panchayat Samiti are: Bhalki, Kota, Debsala, Amarpur, Ramnagar
and Bhedia.
The uneven laterite territory in the western part of Bardhaman district extends
up-to Ausgram and then the alluvial flood plain commences. The entire
Durgapur-Kanksa-Faridpur-Ausgram area was densely forested even in more
recent times. The influx of refugees from East Pakistan (presently Bagladesh)

41
rehabilitated in the area and irrigation facilities extended by Damodar Valley
Corporation led to destruction of much of the forests in the area, but some still
remain. With water from several small streams swelling it during the monsoons,
Kunur River often floods large areas of Ausgram and Mangalkot police stations.
In 1962, excavation was initiated at Rajpotadanga village, near the southern
bank of the Ajay River in the area and it was extended upto 1965. The
excavations have revealed the traces of a 3,500 year-old civilisation similar to
that of Harappa-Mohenjo-daro. Indications are also there to show of links with
the Minoan Civilization of Crete. The excavated items have been added to the
collection of the State Archaeological Gallery.
Further excavations were carried out in 1985 by the State Department of
Archaeology. The main mound at ‘Pandu Rajar Dhibi’ is associated with King
Pandu mentioned in Mahabharata. The 1985 Excavation has clearly shown that
there were six periods of occupation at the sites. There were two main periods –
the Chalcolithic period around 1600 BC – 750 BC, and the Iron Age. The
excavation at Pandu Rajar Dhibi has provided evidences for the gradual growth
of a Chalcolithic Culture and its displacement by iron-using people. The area
between the Damodar and Ajay was known as ‘Gopbhum’, where the ‘Sadgope
Kings’ ruled for many centuries, prior to the advent of the Muslims. The ‘Sur
Kings’ also occupied a somewhat mythical position in the region. Adi Sur of this
dynasty is credited with having brought the five Brahmins and Kayasthas (two
important upper castes in Bengal) from Kannauj in what is now in Uttar
Pradesh.
The study area, Ausgram I and II blocks are located in the central part of
Budrwan District. The blocks are surrounded by Birbhum District in the north,
Manglkote and Bhatar Blocks, Galsi Block and Kanksa Blocks of Burdwan
district in the west, south and east (Figure : 3.1). Its geographical area is
distributed between 230 21’47” N to 230 37’ 04” N latitude and 870 28’ 57” E to
870 47’ 07” E longitude, covering 493 sq.km of area. Total population of the
Block is 2, 43,113 (Census of India, 2001). Agriculture is main economic
activity of the region. The altitude varies between 40m to 60m above MSL. Slope
gradually decreases from south west to north east. Its maximum area is covered

42
with clay with caliche concretion, laterite and clay alternating with silts and
sand is another extensive soil cover of the region.

43
Figure: 3.1
Location of Study area

44
3.1.1 Climate The blocks experience a climate which is transitional between CWg3 and AW1
types, where 'C' stands for 'warm temperate rainy climates with mild winter', 'W'
for 'dry winter not compensated for by total rain in the rest of the year', 'g3' for
'eastern Ganges type of temperature trend' and 'AW1' for 'tropical savanna
climates' (http://bardhaman.nic.in/home.htm). Average temperature in hot
season is 300C while at the cold season is 200 C. And average rainfall is 1500
millimetre. The cold season starts from about the middle of November and
continues till the end of February. March to May is dry summer intervened by
tropical cyclones and storms. June to September is wet summer while October
and November is autumn.
3.1.2 Surface Water Bodies Lots of surface water bodies like river, stream, nadi, canals, ponds, tanks, lakes
are present over the study area. About 1670 numbers of surface water bodies
are present here. The important rivers are Ajoy, Kunur and Khari. The
important canals are Durgapur Branch Canal, Damodar Branch Canal,
Panagarh Branch Canal (Figure: 3.2).

45
Figure: 3.2
Distribution of Surface water Bodies

46
3.1.3 Geology Ausgram Block I and II, with their varied tectonic elements and riverine
features are contiguous transitional zone between the Jharkhand Plateau which
constitute a portion of Peninsular shield in the west and Ganga-Brahamaputra
alluvial plain in the north and east. In general the Jharkhand Plateau consists
of the met-sedimentary rocks of Precambrian Age, Gondwana Sedimentary
rocks, Rajmahal Basalts and upper Tertiary Sediments. Laterite has developed
on these older rocks as well as on early Quaternary Sediments. Towards south,
the alluvial plain merges with Damodar-Kasain-Subarnarekha deltaic plains.
The western half of the district resembles a promontory, jutting out from the
hill ranges of Chotonagpur Plateau and consists of barren, rocky and rolling
country with a laterite soil rising into rocky hillocks. The gradient is from the
west to east. It is northerly towards Ajay and southerly towards Damodar below
the latitude. The Ajoy- Damodar inter-stream tract is made up of several stows
consisting of vales and low convex spurs which run in almost all directions thus
lends a very complicated character to local relief.
Present study area is covered with clay alternating with silt & sand. It covers
south-west part and laterite covers south and north central parts, Clay with
caliche concretion covers north and central parts of the Ausgram Block (Figure :
3.3)

47
Figure 3.3 Geological Map

48
3.1.4 Soil Different types of soils are found in different topographical, biological and
hydrological as well as geological conditions within the Ausgram Block. In the
west, coarse gritty soil blended with rock fragments is formed from pegmatites,
quartz veins and conglomeratic sandstones, where as sandy soil characteristic
of granitic rocks and sandstones. This soil is of reddish in colour; medium to
course in texture; acidic in reaction; low in nitrogen, calcium, phosphate and
other plant nutrients. Water holding capacity of this soil increases with depth
as well as with the increase of clay proportions. Towards the east, alluvial soil
attains an enormous thickness. This alluvial soil is formed of alluvium brought
down by the rivers Ajay, Damodar and Bhagirathi-Hooghly. These soils are
sandy, well drained and slightly acidic in nature.
3.1.5 Population Present study area carries a total population of 2, 43,113. Main economic
activity and major occupation of the people is based on agriculture. It covers
149 villages. Village population is classified on the basis of Census of India.
There are seven categories of village population size i.e,. Un-inhabited, < 200,
200 – 499, 500 – 1999, 2000 – 4999, 5000 – 9999 and > 10000 (Figure: 3.4 &
Table: 3.2).

49
Table: 3.2 Population Distribution of Ausgram Block I & II, 2001
Source: Census of India 2001
Population
Category
Village Name
Urban
Harinarayanpur, Srichandrapur, Chak Tliang, Salko, Hedogarya, Majacha,
Pancbarabhali, Khalnagar, Aleinagar, Ausgram, Sibbati, Keleti, Dharampur,
Itachanda, Turukdanga, Sibada, Goalpota, Sevli, Sae, Bijaypur, Bara,
Kairapur, R.S Bhedia, Punnaga, Danaipur, Kamainagar, Guskara,
Kantatikuri, Kunjanagar and Srinagar
< 200 Tilang, Banktara, Radhamohanpur, Alutia and Jalajpur
200 - 499 Dombandi, Bahaadurpur, Nabagram, Purucha, Lachhminarayanpur,
Baburbandh and Soara
500 - 1999
Phanri Jangal, Dhantor, Radhaballabhur, Chonari, Kuldiha, Ramharipur,
Bhatgonna, Nripatigram, Premganja, Budra, Bara Chatra, Akulia, Jalikandar,
Harispur, Chhota Ramchandrapur, Chak Radhamahanpur, Bagbatti, Reora,
Kural, Khorda Dwarjapur, Gohalara, Majuria, Karanji, Brajapur, Nrisinhapur,
Asinda, Bilshanda, Gobindapur Purba, Beluti, Samantapara, Kalaijhuti, Satla,
Sundalpur, Ramnagar, Ramnagar Uttar, Dhonkora, Bhiti, Maliara, Bhada,
Goswamkhanda Mellikpur, Digha, Nawapara, Baksibad Pogram,
Srikrishnapur, Gonna, Rangakhila, Aduria, Ramchandrapur, Sahapur,
Pratappur, Belgram, Jayrampur, Aligram, Abhirampur, Suata, Silut, Bankul,
Genrai, Babuisal, Amarpur, Chandipur, Aogram, Majhergram, Warispur and
Beranda.
2000 - 4999
Deasa, Sitalgram, Bishnupur, Gangarampur, Jaykrishnapur, Kayanpur,
Pichkuri, Takipur, Harinathpur, Maukhira, Jadabganj, Somaipur,
Lakshmiganj, Kurumba, Ukta, Bhalki, Panduk, Dwariapur, Jamtara,
Brahmandihi, Bhuyara, Karatia, Belari, Batageam, Bhota, Pubar, Ban
Nabagram, Eral, Amrargar, Chhora and Ausgram Chak.
5000 - 9999 Bhedia and Dignagar.
> 10000 Nil

50
Figure 3.4 Population Distribution

51
3.1.6 Transport and Settlements The villages of the study region are well connected by Kuchha and Pucca roads.
Eastern Railway lines are passing by the region. Total length of the important
road and railway networks of the region is 549.50 km and 39.04 km. Road
network has connected almost all the villages of present study area (Figure :
3.5).

52
Figure: 3.5
Transport and Settlement

53
3.2 Data Base • Survey of India (SOI) topographical sheets (1972), scale 1: 50000
o No- 73 M/6, 10, 11, 14 &15
• Land Sat satellite data
o Enhanced Thematic Mapper +, Dated: 26. September 2002
o Thematic Mapper, Dated: 16, April 2008
• Resourcesat 1
o IRS LISS_IV_Mx, pre monsoon (03 April 2007), post-monsoon (04
December 2006)
• Census of India
o Primary Census Abstract: Burdwan District Hand Book 2001.
• Cadastral Maps (1:4000 Appx.)
o Bhalki (5 Sheets, J.L. No. 101, Revenue Surveys 2114);
o Dombandhi (2 Sheets, J.L. No. 58, Revenue Surveys 2100); and
o Radhamohanpur (4 Sheets, J.L. No. 60, Revenue Surveys 2101)
• Field data
3.3 Technology use • Satellite Data in various sensors
o Enhanced Thematic Mapper + (30m)
o Thematic Mapper (30m)
o LISS_IV_Mx (5.8m)
• Geographical Information System (GIS) software
o ArcGIS 10.0
o Mapinfo 9.0
• Digital Image Processing (DIP) soft ware
o Erdas Imagine 9.3
• Global Positioning System (GPS) Instrument
o Leica SR 20
• Field verification

54
3.4 Methodology Main objectives of the present study are to study the water stressed situation,
assessment of surface water potential, identification of surface water harvesting
sites. Most of the studies are made through geomorphic resource
characterisation, analysis and land use land cover analysis. Remote Sensing
and Geographical Information System technologies have been used intensively
to get the desired objectives. We also intended to proposed new seasonal land
use land cover plan (case study) for some specific selected areas.
3.4.1 Geomorphic Resources Characterisation For geomorphic resource characterisation and study we used Survey of India
(SOI) topographical sheets (73 M/06, 10, 11, 14 and 15; published in 1972) as
a base data base at 1:50000 scale. Physical informations are extracted from
every one square kilometer grid. Features like contours, spot heights, bench
marks, drainage lines and surface water bodies (pond, tank, lake) are taken into
consideration for characterisation of the physical resources of the region. These
phenomena were measured and analysed to generate information on Absolute
Relief (AR), Relative Relief (RR), Drainage Density (DD), Dissection Index (DI),
Ruggedness Index (RI), Slope and Frequency of surface water bodies.
These geomorphic resources are considered important parameters for their
deterministic role in seasonal land use land cover of the region. These resources
are directly or indirectly controlling and influencing the availability of surface
water resources which in turn dictate the land use land cover, water stressed
situation and agriculture resources in Ausgram I and II Block.
3.4.2 Land use land cover study This historic land use land cover analysis and mapping is done using Survey of
India topographical sheets (1:50000 scale; 1972). Land use land cover database
has been generated from Survey of India topographical map through visual
interpretation techniques based on empirical knowledge and with the help of
local people.

55
Digital ‘Supervised Classification’ was done on the satellite images to prepare
land use land cover maps. Satellite data of Land Sat 5 (Thematic Mapper) and
Land Sat 7 (Enhancement Thematic Mapper +) were used of the year of
September 2002 and April 2008.
From these three periods data sets, 1972, 2002 and 2008 we have studied the
changes in the land use land cover of the region. We have classified into six
categories. They are Agricultural land use, Current Fallow land, Forest cover,
Built-up area, Surface Water Bodies and Barren land or Fallow land. The
classified thematic layers were compared, analysed and interpreted accordingly.
3.4.3 Identification of Surface water Potential zone Most of the areas of Ausgram I & II Blocks are affected by water stress
condition. As a result, the cultivation of the region suffers each season. Due to
paucity of water, cultivation is done only once in a year in majority of the areas.
We tried to identify and map the surface water potential zones using the
geomorphic resources.
The basic methodologies to identify the surface water potential zone are as
follow:-
1. Minimum Ruggedness Index + Minimum Relative Relief +
Maximum Drainage Density + Maximum Surface Water bodies + Minimum
Slope = Maximum Surface Water Potential Zone.
2. Moderate Ruggedness Index + Moderate Relative Relief + Moderate
Drainage Density + Moderate Surface Water bodies +Moderate Slope =
Moderate Surface Water Potential Zone.
3. Maximum Ruggedness Index + Maximum Relative Relief +
Minimum Drainage Density + Minimum Surface Water bodies + Maximum
Slope = Minimum Surface Water Potential Zone.
With the help of the above mentioned methodology, we identified and classified
the surface water potential zones in three categories. GIS (Arc GIS 10.0)
technology has been used for identification through overlay analysis method.
56
3.4.4 Identification of Surface water Harvesting Potential zone The basic methodologies to identify the surface water potential zone are as
follow:-
Geomorphic resource layers (Drainage Density, Slope, Relative Relief,
Ruggedness Index, Frequency of Water Bodies) and Land Use land Cover layers
are superimpose over each other and we have identified the suitable places for
surface water harvesting based on this methodology.
1. Minimum Ruggedness Index + Minimum Relative Relief + Maximum
Drainage Density + Minimum Slope + Land Cover (Water Bodies) = Maximum
Water Harvesting Potential Zone.
2. Moderate Ruggedness Index + Moderate Relative Relief + Moderate
Drainage Density + Moderate Slope + Land Cover (Forest) + Moderate Surface
Water Bodies = Moderate Water Harvesting Potential Zone.
3. Maximum Ruggedness Index + Maximum Relative Relief + Minimum
Drainage Density + Maximum Slope + Land Cover (Current Fallow or fallow) +
Minimum Surface Water Bodies = Minimum Water Harvesting Potential
Zone.
3.4.5 Seasonal Land use Land cover Plan Seasonal land use land cover planning has been done. We have selected some
villages (Bhalki, Dombandi and Radhamohanpur) in Ausgram Block where
water stressed condition is there.
A. Image Analysis and Geo-referencing of the Village Map in respect
to the District Map in GIS environment.
1. The geocoded satellite image of Resourcesat 1, LISS_IV_Mx, pre monsoon
and post-monsoon seasons have been analyzed and LULC maps have
been prepared with proper annotation.

57
2. Several Ground Control Points (GCPs) have been identified/collected
within images and in the Cadastral Maps.
3. Ground verification of the Villages maps were done with the help of the
GPS, (Leica SR 20), Total Station with infrared distance measurer and
other surveying instruments.
4. The cadastral maps were superimposed on the LULC map. Trial and
error methods were employed to generate error free best fit condition
towards Geo-referencing of the Villages level LULC map in respect to the
satellite image.
5. Intensive ground verification of the image based LULC maps were done to
finalise the classification of the LULC and confirmation of the plot to plot
LULC information.
6. Final LULC maps composition of all the Villages with plot/parcel wise
information have been be generated on the scale of 1: 4000 (appx.).
7. Subsequently the geo-referenced Villages maps were superimposed over
Police Station / Block map. Best fit superimpositions of the maps were
be the prime objective of the study.
8. As the superimpositions were at their best fit conditions, the Village
maps were placed over the SOI topographical sheet ultimately to get the
District, Block/Police Station, Villages and the Plot/Dag number
information under the RDBMS platform/environment.
B Utilization of the geocoded Map
1. The geocoded LULC maps of the Villages were used to collect sufficient
number of soil samples, from the agricultural land and as well as the
areas may be available for cultivation, so it represented the whole study
area;
2. The collected soil samples have been tested in the laboratory to study the
physical and chemical properties of soil;
3. Different thematic layers (GIS) of soil properties of the village have been
prepared;
4. The thematic layers of the soil properties were super imposed to prepare
soil zone map of the villages.

58
C Suggestion for alternative crops
1. Intensive study of LULC and Soil Zone Maps were done for the evaluation
of the existing agricultural land use of the villages.
2. Socio-economic conditions of the village were studied through primary
sample survey.
3. Sustainability of the suggested crops was studied.
4. Based on the geo-referenced village maps, LULC maps, soil zone maps,
socio-economic conditions and sustainability of the crops, alternative
cropping patterns were suggested.
Based on the geomorphic resources, soil characteristics, water potential zones
and current land use land cover we have suggested some suitable crops for
present case study regions.
3.5 Organisation of the Thesis This thesis is designed and divided in seven chapters. The first chapter gives a
general introduction on land use land cover, geomorphic resources, water
resources, remote sensing, Geographical Information System (GIS) and
importance of land use land cover change studies.
Past studies on geomorphological resource characterisation, land use land
cover and on water stressed are evaluated. Studying the literatures, existing
research gaps are identified and objectives of the present research are set. This
is included in the second chapter.
Third chapter includes the geographical setup of the study region. It includes
the methodology, data base and technology used for the successful completion
of the present research.
Fourth chapter is exclusively on the geomorphic resource characterization,
analysis and it included the study and analysis of drainage density, frequency
of surface water body, absolute relief, relative relief, slope, dissection index and
ruggedness index.
Evaluation of the land use land cover (LULC) and its changes in the past 36
years have been done using remote sensing and GIS approach. Determining
59
role of geomorphic characters on land use land cover including agricultural
land extension is included in the fifth chapter.
Sixth chapter is covered by the study to evaluate the potentiality of surface
water resources. Potentiality of the sites or zones of surface water harvesting
regions have been identified. The regionalisation is done on the basis of the
geomorphic resources and the existing land use land cover of the region.
Seventh chapter is on the case study of selected villages for which alternative
agriculture planning has been done. The planning is based on the nature of
geomorphic resources, water harvesting zones and current land use land cover.
GIS and Remote Sensing technology have been used intensively for the study.
Finally, the eighth chapter includes the major findings of the study. Suggestions
for sustainable improvement and further research of the study have been made
in this section.

60
Chapter: - Four
GEOMORPHIC RESOURCE CHARACTERISATION
Evaluation of the geomorphic processes is the fundamental key to understand
the surface forms. Surface forms include all the erosional, transportianal and
depositional characteristics as well as endogenic forces by which the earth’s
surface undergoes modification. Individual landforms on the earth’s surface are
the resultant products of both the endogenetic and exogenetic processes. The
landforms go through modification by several geomorphic processes. The end
products influence and determine several human activities and availability of
several other natural resources like water, forest, agricultural land etc.
Geomorphic resources are the natural phenomena on the earth’s surface, which
have originated due to the active geomorphic processes. The resources directly
or indirectly control various anthropogenic activities to a great extent.
Geomorphic resource study and analysis are very much essential to understand
the availability of natural resources which in turn influence the probability of
economic and social development of the region as well. Absolute Relief, Relative
Relief, Slope, Frequency of surface water bodies, Drainage Density (DD),
Dissection Index (DI) and Ruggedness Index (RI) are considered very important
indicators and they are used to evaluate geomorphic parameters of the present
study area. Evaluations of these resources are considered essential for
implementation of any type of regional and economic planning.

61
Geomorphic resources are measured and analysed using Survey of India (SOI)
topographical maps. One square kilometre grids are generated and grid wise
information are measured and collected for analysis. The importances of
geomorphic resources are discussed and they are evaluated as per objective of
the present research.
4.1 Absolute Relief (AR)
The absolute relief, a function of the geotectonics, provides clue towards
estimating the intensity of forces at work (Singh, 1980). It is the maximum
elevation of any area with reference to the mean sea level (MSL). The main
objective of this study is to determine how much erosion has taken place in
relation to the present summits or hilltops of the study area, because hilltops or
summits are generally the last vestige of vanishing relief (Prasad, 1985). It is
useful in delineating the terrain morphology, including the existence of erosion
surfaces.
The maximum elevation in each one sq.km grid has been noted. Isopleths have
been drawn to mark the separate zones. Absolute relief of the Ausgram I & II
has been classified in four categories like <20, 20-40, 40-60 and > 60 m per
sq.km. For the entire region, contours of 20 m, 40 m and 60 m are available. In
the west-central part of the region > 60 m absolute relief is found and it
coverers 8% of the total study area. In all the other categories i.e. < 20, 20 – 40
and 40 – 60m region, land area is more of less uniformly distributed i.e. about
30 %, 28 % and 35 % respectively. The relief is gradually decreasing from west
to east conforming to the entire regional relief (Figure: 4.1).
Where the absolute relief is high (>40m), those places are covered by natural
forest and very minimum surface water resources are present there. Absolute
relief influences the distribution and availability of surface water resources.
Where the absolute relief is less than 40m, surface water resources are
available there.

62
Figure: 4.1
Absolute Relief

63
4.2 Relative Relief (RR)
Relative relief is one of the various methods evolved to measure the average
slope. The term was invented and used by Smith (1935) to ascertain the
amplitude of available relief to relate the altitude of the highest and the lowest
points of any particular area. The study of relative relief depicts the relief of an
area in relation to the surrounding areas; probably so, it is called relative relief.
The relative relief map gives a clear conception of the nature and amount of the
slope of the area under study.
Relative Relief = Maximum Elevation (M) – Minimum Elevation (M)
Relative relief is one of the methods to depict the local relief of any part of the
earth’s surface. The study area is having less drainage development and it will
generate lower relative relief. Highest relative relief is only 11.20 m/sq.km. It is
found at the west central part conforming to the maximum drainage density.
We classified the relative relief of the study area in four relative relief zones, like
<3, 3 – 6, 6 – 9 and >9 m/sq.km. Around 84 % of the total study area is under
< 3 m relative relief category. Next category of relative relief zone is 3 – 6
m/sq.km and it covers13 % of total study area. This zone is distributed over the
south central, central, west central, north west and north east parts of study
area. The third category of relative relief is 6 -9 m/sq.km. It covers about 3 % of
study area. This zone is distributed in west central, north west central and
central parts of study area. Last category is more than 9 m/sq.km. It covers
less than one per cent (0.42%) part of the study area and it is located in central
part of study area (Figure: 4.2). The lower relative relief indicates that the region
is almost flat land and appearing mature stage of geomorphic evolution. Lower
relative relief suggests that if availability of water is made, the region can be
converted to a very good agricultural region.
Although maximum area is covered under <3m/sq.km relative relief zone but
the presence of surface water resources are few. As a result, the low relative
relief zone has not been converted into good agricultural zone.
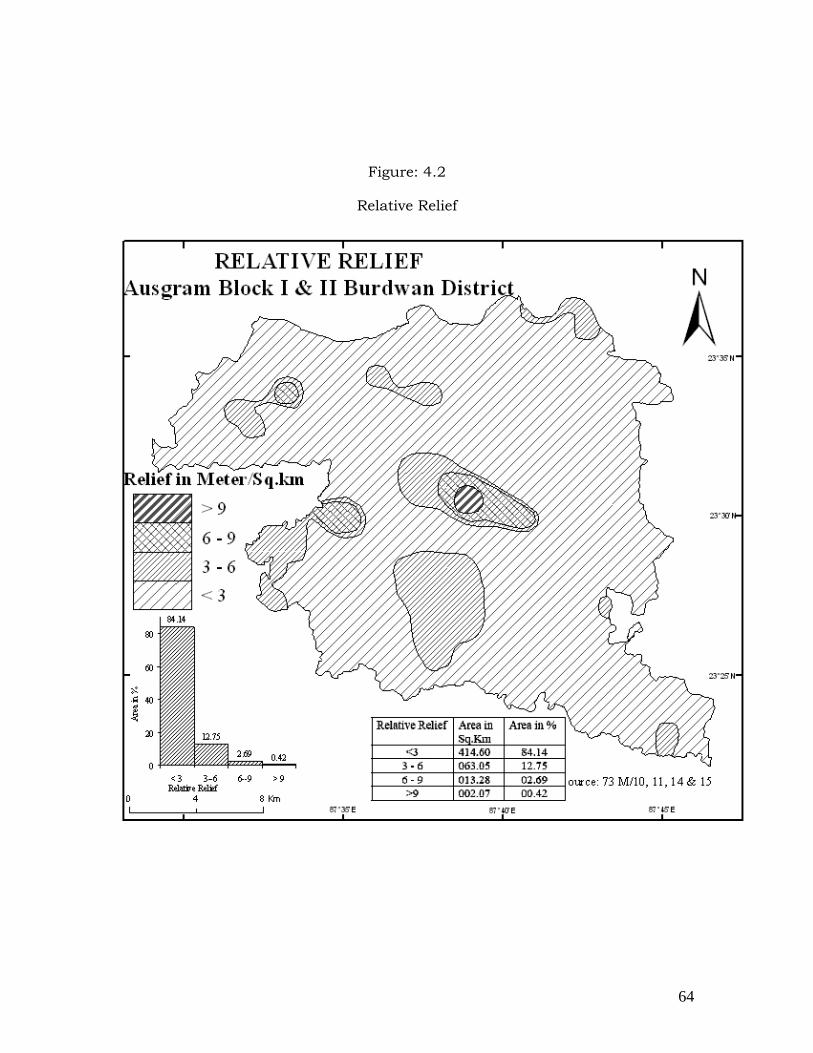
64
Figure: 4.2
Relative Relief

65
4.3 Dissection Index (DI)
Dissection Index is defined as the ratio between the relative relief and absolute
relief. It is an important geomorphological tool for estimating vertical balance of
erosion (Sen, 1993). It is an important parameter of any region and useful in
the study of the terrain, dynamics and stages of landscape evolution
(Mukhopadhyay, 1984).
The dissection index gives clue to the development of landforms under the
purview of fluvial geomorphic cycle of erosion (Prasad, 1985). The extra merit of
dissection index is that it is related not only to the elevation, but also to relief,
dissection and slopes. It means that area of lower elevation may be
characterised by high degree of dissection index, if the area is dissected by deep
river-valleys or is characterised by frequent and isolated hilltops. There is every
possibility of obtaining equal relative reliefs for two areas with variable
characters. But the dissection index varies very much in such circumstances.
The study of dissection index (DI) determines the nature and availability of
water resources for agricultural land.
Dissection Index (DI) = Maximum Elevation - Minimum Elevation
Maximum Elevation
Dissection index map of Ausgram I and II blocks shows a maximum value of
0.23. It is located almost in the central part of the study area. Minimum
dissection index value is 0.0001. The whole region is divided into four
categories i.e. below 0.075, 0.075 – 0.150, 0.150 – 0.225 and more than 0.225
per sq.km. Maximum portion of the study area is under <0.075 dissection index
and the zone is distributed in north central, north west central, south west
central and south east central part of the study area. It covers 92 % area of the
blocks. 0.075 – 0.150 dissection index per sq.km value is distributed in central
part of study area and it covers 6% area of total area. 0.150 – 0.225 dissection
index per sq.km value is distributed in central part of study area and it covers
1% of the total area. Maximum dissection index value >0.225 is distributed in
central part of study area. It covers less than 1% of the total area (Figure: 4.3).
Low dissection index value suggests that the river erosion is very low and the

66
total area is growing towards the mature stage of development in the cycle of
erosion.
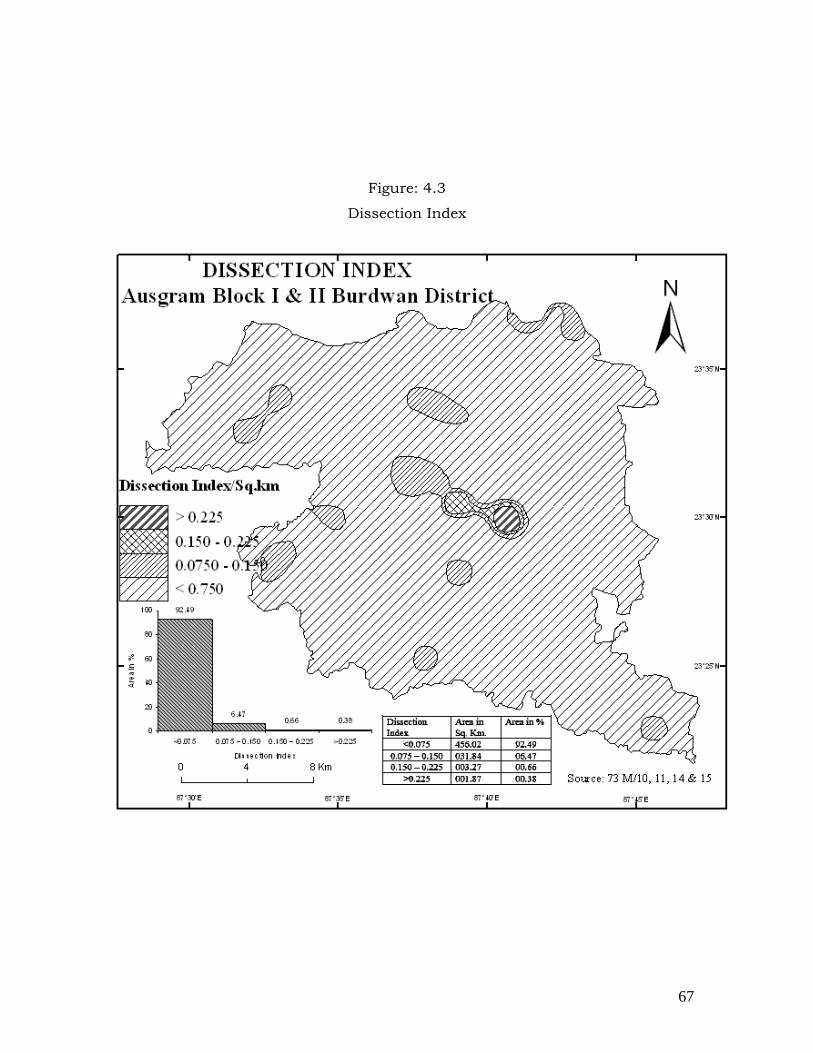
67
Figure: 4.3
Dissection Index

68
4.4 Slope (Raisz and Henry method)
The term slope in its broadest sense means an element of earth’s solid surface,
including both terrestrial and submarine surfaces (Strahler, 1956). Terrain
morphology is characterized by slope condition which is governed by a number
of factors including climatic, geologic and tectonic condition. There is also a
close relationship between slope condition and morphometric attributes of
terrain i.e. absolute relief, relative relief, dissection index, drainage density and
drainage frequency. Slopes are ubiquitous elements of the landscape (King,
1962). Slopes are the fundamental types of landscape feature. Slope may be
defined as the tangent of the angle of inclination of a line or plane defined by a
land surface. It is the result of a complex and continuous interaction between
internal and external forces acting upon the earth's surface. It depends on rock
and climatic conditions, which may in certain regions be constant over long
periods of time and on the thickness, texture and mobility of surface layers of
soil, organic matter etc. (Baulig, 1959). In a drainage system, valley side and
channel slopes control directly the potential and kinetic energy of water flows
and thus the intensity of runoff, erosion and transport processes. These factors
tend to be in a state of equilibrium in relation to overall local geographical
conditions. The slope angle indicates the magnitude of the component of the
gravitational surface acting to produce movement of solid bodies, water or soil
particles down a slope (Strahler, 1956). Slope also plays an important role in
river processes. Neither the formation of runoff, the movement of floods, the
power potential of river courses, the modeling and evolution of river channels,
nor the erosion and transport processes occurring in the latter can be
approached without knowing the slopes of the land surface and river network
(Zavoianu, 1985).
Slope (Raisz and Henry method) = VerticalTan =
Baseθ
(F.J.Monkhouse and H.R. Wilkinson, 1994)

69
An understanding of slope distribution is essential, as a slope map provides
data for planning, settlement, mechanization of agriculture, reforestation,
engineering structures, conservation practices etc. Though various methods are
used to carry-out the slope analysis, here we have used Raisz and Henry
method (F.J.Monkhouse and H.R. Wilkinson, 1994) of slope analysis. Raisz and
Henry has divided the large scale topographical map into small region, within
each of which the contour lines have the same standard spacing.
According to Raisz and Henry method we have divided the present study area
into five slope category zones i.e. <10’, 10’ – 20’, 20’ – 30’, 30’ - 10 and >10 . In
this study area maximum slope is found in the south west central part and
minimum slope is found in the north east and south east part. Fist category,
<10’ slope is distributed in north east and south east part of study area. It
covers 28 % of the total area. Second category 10’ – 20’ slope zone distributed in
south and north parts of the study area and it covers maximum area, about
52% of the total area. Third category, 20’ – 30’ slope zone is distributed in
central, central east and west parts of the study area. It covers 13 % of land of
the total study area. Fourth category zone, 30’ - 10 is distributed in west central
and north central part of study area. It covers 5 % of the land area. Last
category more than one degree slope zone is distributed in south west central
and north west central part of the study area. It covers one per cent of land.
Generally slope is from west to east and from south west to north east direction
(Figure: 4.4).
This Slope is controlling the nature and distribution of surface water resources.
Where the slope is <30’ in the Ausgram I and II blocks, those parts have lots of
surface water bodies (ponds, tanks, river and canals). Where the slope is 10 or
more, relatively the surface water bodies are few in these areas.

70
Figure: 4.4
Slope (Raisz and Henry Method)

71
4.5 Frequency of Surface Water Bodies
Frequency of surface water bodies can be defined as the number of water bodies
per sq.km area. Water is an important locating factor for settlement and it
remains present on the earth’s surface in the form of rivers, ponds and lakes.
The quantity of water directly used by man is comparatively small, but the
quantitative used by man for agriculture in the form of irrigation is very large.
In Ausgram I and II blocks availability of surface water bodies are calculated
using frequency of surface water bodies per sq.km. Distributions of surface
water bodies are very much irregular in Ausgram I and II blocks. As we have
already stated that data has been generated using one square kilometre grid,
here also the same methodology has been followed. Isolines have been drawn to
analysis the data in better way. It has been observed that some region is having
more than 30 number of surface water bodies per sq.km area and in some
cases it is an less than two surface water bodies per sq.km area. Using isolines,
we have divided the study area in four zones i.e. < 2, 02 – 10, 10-15, and >15
water bodies per square kilometre. Maximum concentration of water bodies
with in one square kilometre area is located in north east central part (36 water
bodies /sq.km) of the study area. They altogether cover about one sq.km area.
The first zone of surface water frequency, <2 number of water bodies per square
kilometre, covers about 42 % of the total study area. 2- 10 number of water
bodies/km2 covers about 39% of the total study area. More than 15 water
bodies/km2 zone is distributed in north east, north east central, south east and
north west parts of the present study area (Figure : 4.5). It covers 10% of the
total study area. Generally in Ausgram I and II blocks many water bodies area
present but water is not available from those water bodies in most of time of a
year. The ground reality shows that these water bodies add little water to the
region in drier periods.

72
Figure: 4.5
Frequency of Surface Water Bodies

73
4.6 Drainage Density (DD)
Drainage density is defined as the total length of streams/km2. Density factor is
related to climate, rock type, relief, infiltration capacity, vegetation cover,
surface roughness and run-off intensity index. The drainage density explains
the stage of fluvial eroded landscape. The importance of drainage density in this
analysis is due to two reasons. Firstly, it reflects the potential rate of discharge
of water to be transmitted through the respective region or basin and secondly,
it reflects climatic conditions of particular area. The drainage density indicates
the closeness of spacing of channels (Horton, 1932).
Drainage density (D) = LuA
⎛ ⎞⎜ ⎟⎝ ⎠
Lu = Total length of stream channels per unit area (Km)
A = Area of the unit (Km2)
(Horton, 1932)
Drainage density map of Ausgram I and II blocks have been prepared and
analyzed. We have already said that Blocks are located in relatively drier part of
the district Burdwan. The region falls in the water stressed part and expected
that the region is having very low drainage development.
Again, the region is located in moderately higher relief zone and many first
order streams area there. As a result, same parts of the Blocks may have higher
drainage density, but in reality it may have no significant contribution towards
the availability of water resources. Using isolines of drainage density, we have
divided the whole study area in four categories i.e. <1, 1- 2, 2 – 3 and > 3 km
length of stream (km)/sq.km. The data revels that the regions is poorly drained
and 47 per cent of the total land has drainage density < 1 km/sq.km. The other,
highest drainage density i.e. >3 km/sq.km covers negligible percentage of land
of the study region. Highest drainage density, 3.63 km/sq.km is observed in the
central part of the study area (Figure: 4.6). The central part of the study area is
characterised by high land and resulted the origin of some ephemeral drainage
lines. This has resulted maximum drainage density in this part of the region.
74
But the ground reality shows that the highest drainage density does not add
significantly to the availability of water in the region.
About 10 per cent land of the block is having drainage density of 2-3km/sq.km.
It has been observed that this portion of the block is having significantly good
amount available surface water resources.

75
Figure: 4.6
Drainage Density

76
4.7 Ruggedness Index (RI)
Ruggedness Index describes the complexity of the topography and the
roughness of the terrain. The ruggedness indicates the degree of dissection of a
region where drainage has also been taken as an important parameter. Chorley
(1972) has devised the formula of ruggedness index as:-
Ruggedness Index = Relative Relief(M) * Drainage density (km/km2)
1000
(Chorley.R.J, 1972)
This index is being widely used by the earth scientists in connection with the
morphological studies of terrain and it leads to better understanding of the
surface configuration evolved under complex geomorphic processes. Actually, it
is more than development of slope or dissection index as it incorporates a
number of determinant factors related to the development of landforms. This
index reflects the combined effects of evolutionary rhythmic processes in the
development of relief (Mukhopadhyay, 1984).
Roughness index follows the same trend and indicates a close relationship with
other morphometric attributes like relative relief, slope and dissection index
(Mukhopadhya, 1973, 1979).
Ruggedness index value has been generated using the one sq.km grid as like
other morphometric parameters and isolines are drown for the whole region. We
divided the ruggedness index in three categories with the help of isolines. The
zones are <0.0078, 0.0078 – 0.0157 and > 0.0157. Minimum ruggedness value
is distributed over maximum study area and it covers 99% of the total area.
0.0078 – 0.0157 ruggedness value is distributed over the central west and
central part of study area and it covers 0.52 per cent of total area. More than
0.0157 ruggedness index value is distributed over central part of the study area
and it covers 0.33 per cent area of land only. With the low ruggedness index
value, minimum effort is needed to manage surface water which can make the
region a good agricultural region.

77
Figure: 4.7
Ruggedness index

78
Conclusion
From the above discussion, it can be concluded that the region in approaching
old stage of landscape evolution. Still some absolute relief are there and they
make the area undulating. Where the absolute relief is high, those places are
covered by natural forest and very minimum surface water resources are
present there. Absolute relief influence the distribution and availability of
surface water resources. Where the absolute relief in less than 40m, surface
water resources are available there. Maximum area of the blocks area covered
under <3m/sq.km relative relief zone but the presence of surface water
resources are few. As a result, the low relative relief zone has not been
converted into good agricultural zone. Dissection index value shows the river
erosion is very low and the total area is growing towards the old stage of
development in the cycle of erosion. Slope is controlling the nature and
distribution of surface water resources. Where the slope is <30’ in the Ausgram
I and II blocks, those parts have lots of surface water bodies (ponds, tanks, river
and canals). Where the slope is 10 or more, the surface water bodies are few in
these areas. Frequency of surface water bodies shown maximum area covered
low number of surface water bodies (<2/sq.km), but some areas show high
water bodies (30 / sq.km) also. The ground reality shows that the water bodies
may be present but there is no water in maximum time of a year. The drainage
density shows that this portion of the block is having significantly good amount
of available surface water resources. But maximum time of a year the water
bodies remains dry. Ruggedness index is low in present study area and
minimum effort is needed to manage the surface water which can make it a
good agricultural region. The higher relief does not allow the rivers of the region
to from flood plain features and so the amount of surface water resources are
low. Similarly the undulating surface restricts the extension of agricultural
land. The high relief zone creates forested land. Proper land evaluation and
management practices are needed to convert the waste fallow land into good
agricultural land.

79
Chapter: - Five
LAND USE LAND COVER OF AUSGRAM BLOCK I & II : AN OVERVIEW
Land cover is defined as “the bio-physical state of the earth’s surface and
immediate subsurface” (Turner et al., 1995). It “describes the physical state of
the land surface: as in cropland, mountains or forest” (Meyer and Turner, 1994)
and is related to visual features.
Land use is strongly human related and it denotes “the human employment of
land” (Meyer and Turner, 1994) and implies “the way in which, and the purpose
for which, human beings employ the land and its resources” (Meyer, 1995). In
this respect it is not related to visible features but to intention or purpose.
These definitions differentiate clearly between land cover classes (e.g. grassland,
forest and concrete) and types of land use (e.g. cattle raring, recreation and
urban residence) by focusing on purpose and use through human beings.
A modern nation, as a modern business, must have adequate information on
many complex interrelated aspects of its activities in order to make decisions.
Land use is only one of such aspects, but knowledge about different categories
of land use land cover has become increasingly important as the Nation plans
to overcome the problems of haphazard, uncontrolled development,

80
deteriorating environmental quality, loss of prime agricultural lands,
destruction of important wetlands and loss of fish and wildlife habitat.
Classified land use data are needed in the analysis of environmental processes
and problems that must be understood if living conditions and standards are to
be improved or maintained at current levels. In this dynamic situation,
accurate, meaningful, current data on land use are essential to make sound
plans for their own future action, and then reliable information is critical.
5.1 Land use land cover change Land use land cover change (LULCC), also known as land change is a general
term for the human modification of earth's terrestrial surface. Though human
have been modifying land to obtain food and other essentials for thousands of
years, current rates, extents and intensities of LULCC are far greater than ever
in history, driving unprecedented changes in ecosystems and environmental
processes at local, regional and global scales. These changes encompass the
greatest environmental concerns of human population today, including climate
change, biodiversity loss and the pollution of water, soil and air. Monitoring and
mediating the negative consequences of LULCC while sustaining the production
of essential resources has therefore become a major priority of researchers and
policymakers around the world.
In this thesis, we have classified three time periods data to derive the LULC of
the region and its change over time. We have derived information from Survey
of India topographical map (1972). Land sat imageries of 2002 September and
2008 April. The LULC of past 36 years have been studies and how the land use
land cover changes happened what are the factors behind that are investigated.
5.2 LULC Classification System In order to address the issues associated with classification of land use land
cover using Remote Sensing, Anderson (1971) developed some criteria for
classification systems.
• The minimum level of interpretation accuracy in the identification of
land use land cover categories from remote sensing data should be at
least 85 percent;

81
• The accuracy of interpretation for the several categories should be
equal;
• Repetitive results should be obtainable from one interpreter to
another and from one time of sensing to another;
• The classification system should be applicable over extensive areas;
• The categorization should permit vegetation and other types of land
cover to be used as surrogates for activity;
• The classification system should be suitable for use with remote
sensing data obtained at different times of the year;
• Effective use of subcategories that can be obtained from ground
surveys or from the use of larger scale or enhanced remote sensor
data should be possible;
• Aggregation of categories must be possible;
• Comparison with future land use data should be possible; and
• Multiple uses of land should be recognized when possible.
5.2.1 Digital Classification Numerical techniques for satellite image classification have a long tradition,
dating back to early 70’s; two types of approaches have evolved. In supervised
classification, a priori knowledge of all cover types to be mapped within the
scene is assumed. This knowledge is used to define signatures of the classes of
interest to be applied to the entire scene. And in unsupervised classification, no
prior information about the land cover types or their distribution is required.
Unsupervised classification methods divide the scene into more or less pure
spectral clusters, typically constrained by pre-defined parameters
characterizing the statistical properties of these clusters and the relationships
among adjacent clusters. The assignment of land cover labels to individual
spectral clusters are made subsequently on the basis of ground information,
obtained in the locations indicated by the resulting clusters. In recent years,
numerous variants of these two basic classification methods have been
developed. These include decision trees (Hansen et. al., 1996); neural networks
82
(Foody et. al., 1997), fuzzy classification (Foody, 1998, Mannan et. al., 1998)
and mixture modelling (van der Meer, 1995) for supervised classification and
classification by progressive generalization (Cihlar et. al., 1998), classification
through enhancement and post- processing adjustments (Lark, 1995 a, b) for
unsupervised techniques.
Numerous algorithms have been developed to quantify spatial relations within
images such as texture (Gong et. al., 1992), segment homogeneity (Kartikeyan
et. al., 1998) and various others. But the spatial dimension has not been used
effectively in image classification so far. Spatial measures can be employed in
supervised or unsupervised classification as additional channels. In
unsupervised classification cluster merging as a pre-classifying step can be
used which will result homogenous patches (perfield classifiers). This will be
used as additional aid for land cover classification. A recent interest in effective
use of spatial and spectral information (Kartikeyan et. al., 1998) is therefore
encouraging.
Frequent mapping using high spatial resolution satellite data for large areas are
rare at the present time. High resolution satellite data are being employed over
large areas, e.g., for annual crop assessment (de Boissezon et. al., 1993), but in
a sampling mode. The minimum required temporal frequency for land cover
mapping at present appears to be about 5 years (Ahern et. al., 1998; GCOS,
1997). Nevertheless, it is desirable to know about the changes in land cover
composition, though not the location of these changes for policy purposes, to
satisfy reporting requirements, to assess the impact of management measures
or for other reasons.
The land use land cover (LULC) of the present study area, Ausgram I and II
blocks have been studied. The important identified land use land covers are
forest, agricultural land, current fallow, built-up, water bodies and barren land
of fallow land. It has been observed that the land use land covers are changing
through time and space. The changes are both qualitative and quantitative. The
following section will evaluate such changes.

83
5.3 Land use Land cover 1972, 2002 (September) and 2008 (April)
5.3.1 Agricultural land Agricultural land may be defined as land used primarily for production of food
and fibre. Agricultural lands are croplands, orchards, groves, vineyards,
nurseries and ornamental horticultural areas.
India is dominated by agricultural activities and the main land use of the
country is agricultural land use. According to the Census of India, the
agricultural land use is divided into two categories- the irrigated land and un-
irrigated land. With increasing population of the country, the demand and
requirement for food is also increasing. As a result, more lands are being
converted to agricultural lands. The development of the irrigation system by
controlling structures, dams / reservoirs have also contributed to the rise in the
area of agricultural land. Irrigated area is assumed to be irrigated for cultivation
through such sources as canals (Government & Private), tanks, tube-wells,
other wells and other sources. It is divided into net irrigated and gross irrigated
area. Net irrigated area refers to the area irrigated through any source once in a
year for a particular crop. Total/Gross irrigated area is the total area of crops,
irrigated once and/or more than once in a year. It is counted as many times as
the number of times the areas are cropped and irrigated in a year.
In the present study area, as like rest of the area of our country, agriculture is
the main economic activity. Rice is the most important crop of the blocks and in
this part of the world little else is grown. The rice grown with its numerous
varieties can broadly be grouped under the three primary classes- the Aus or
autumn rice, the Aman or winter rice and the Boro or the summer rice. In the
year of 1972 paddy covered maximum of the gross cropped area and it covered
49 % of the total study area. The area was distributed in east, south, southeast
central, central parts of the study area (Figure: 5.1).
Satellite data of 2002 September, Enhanced Thematic Mapper plus (ETM+), of
Land sat has been analysed to study of land use land cover of the region. The
classified data has been compared with 1972 land use land cover data. Paddy
covered maximum area of the cropped land in 2002 also. Some land also had
some vegetables. This agricultural land use covered around 60 % of total land of

84
the blocks. Agricultural land was distributed in southeast, east, central,
northeast parts of the region. Along with Kunur Nadi flourishing agricultural
land with standing crops were identified and mapped (Figure: 5.2).
Satellite data of 2008 (April), Thematic Mapper image has been used to study
the land use land cover of the region. As like the earlier two period’s data, this
data also recorded maximum area under the agricultural land. Paddy is the
main verity of crop. Few per cent of land have shown vegetables cultivation. It
covered around 51% of land. The agricultural land was distributed in
southeast, east, central, northeast parts of the blocks (Figure: 5.3).

85
Figure: 5.1
Land Use Land Cover 1972

86
Figure: 5.2
Land Use Land Cover September - 2002
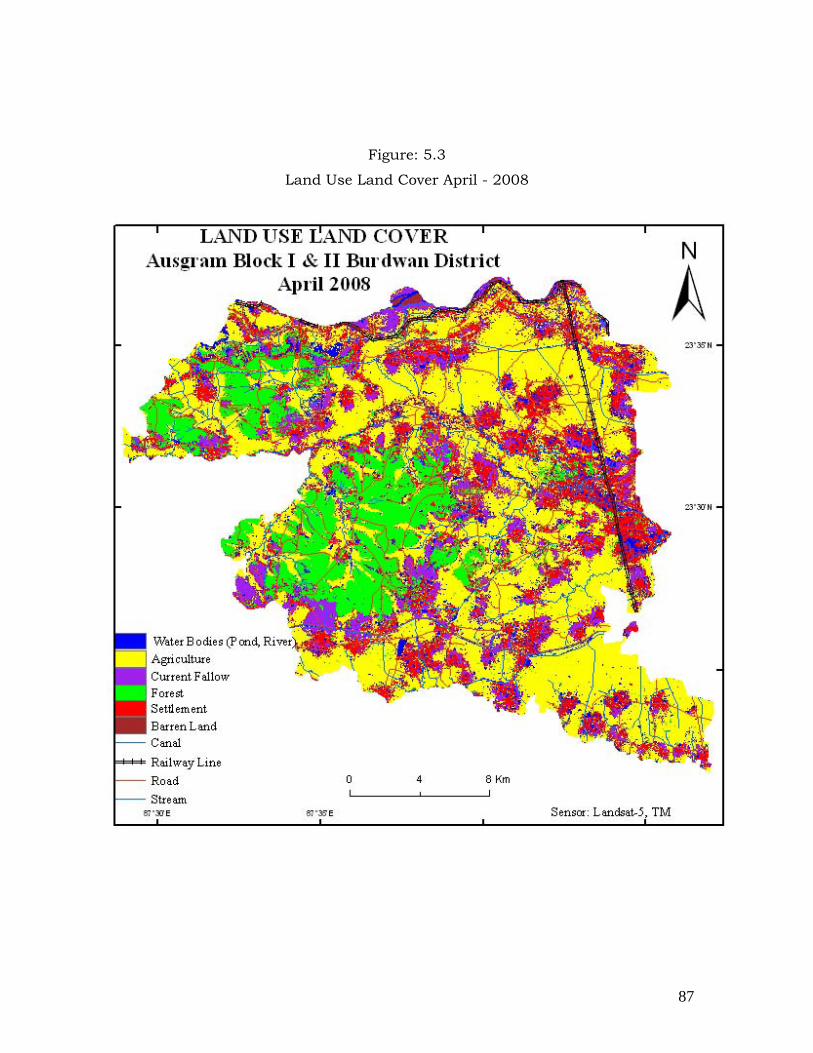
87
Figure: 5.3
Land Use Land Cover April - 2008
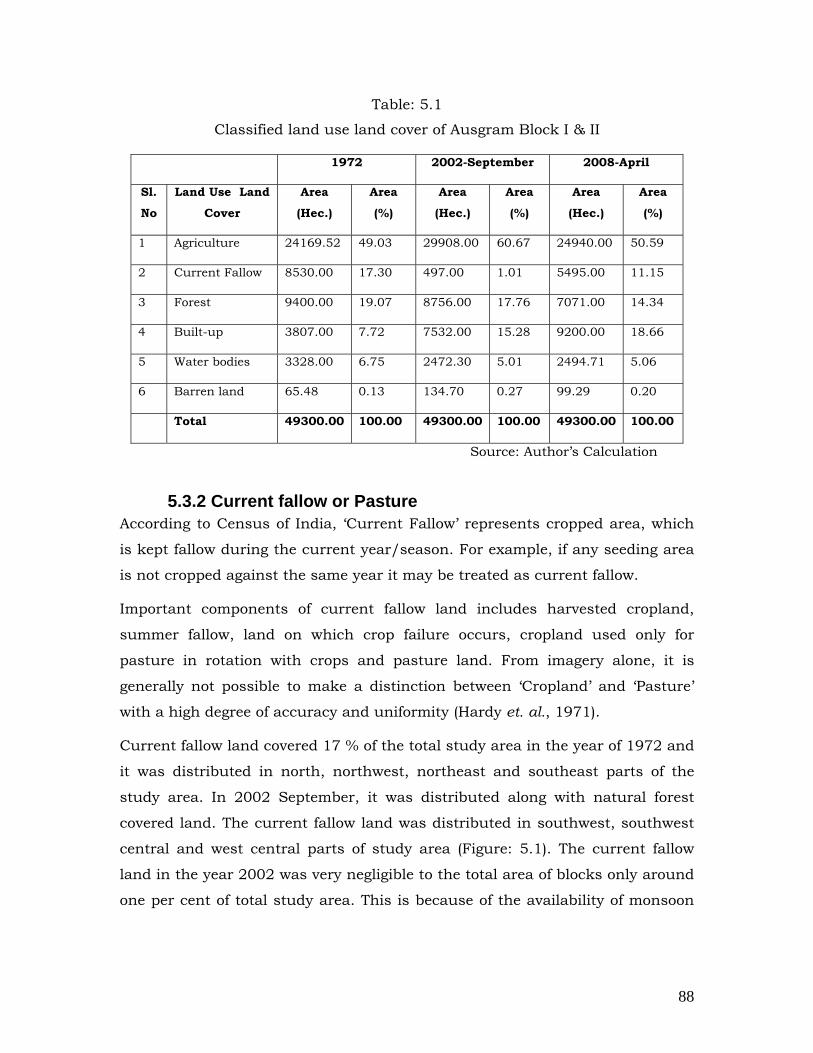
88
Table: 5.1
Classified land use land cover of Ausgram Block I & II
1972 2002-September 2008-April
Sl.
No
Land Use Land
Cover
Area
(Hec.)
Area
(%)
Area
(Hec.)
Area
(%)
Area
(Hec.)
Area
(%)
1 Agriculture 24169.52 49.03 29908.00 60.67 24940.00 50.59
2 Current Fallow 8530.00 17.30 497.00 1.01 5495.00 11.15
3 Forest 9400.00 19.07 8756.00 17.76 7071.00 14.34
4 Built-up 3807.00 7.72 7532.00 15.28 9200.00 18.66
5 Water bodies 3328.00 6.75 2472.30 5.01 2494.71 5.06
6 Barren land 65.48 0.13 134.70 0.27 99.29 0.20
Total 49300.00 100.00 49300.00 100.00 49300.00 100.00
Source: Author’s Calculation
5.3.2 Current fallow or Pasture According to Census of India, ‘Current Fallow’ represents cropped area, which
is kept fallow during the current year/season. For example, if any seeding area
is not cropped against the same year it may be treated as current fallow.
Important components of current fallow land includes harvested cropland,
summer fallow, land on which crop failure occurs, cropland used only for
pasture in rotation with crops and pasture land. From imagery alone, it is
generally not possible to make a distinction between ‘Cropland’ and ‘Pasture’
with a high degree of accuracy and uniformity (Hardy et. al., 1971).
Current fallow land covered 17 % of the total study area in the year of 1972 and
it was distributed in north, northwest, northeast and southeast parts of the
study area. In 2002 September, it was distributed along with natural forest
covered land. The current fallow land was distributed in southwest, southwest
central and west central parts of study area (Figure: 5.1). The current fallow
land in the year 2002 was very negligible to the total area of blocks only around
one per cent of total study area. This is because of the availability of monsoon

89
rain water. The water resource helped to use maximum possible land into
agricultural land use.
The pre-monsoon season satellite image of 2008 (April) showed increased
amount of current fallow land. About 11% of total study area was under this
category of land use land cover (Figure: 5.2). The limitation of water resources
restricted the growth of agricultural land resulted increased amount of current
fallow land.
Current fallow land or cultivable waste land covered 17% of total surface area of
the blocks in 1972. In 2002 September, during the monsoon season, the fallow
land decreased to one percent area of the blocks (Figure: 5.3). It has increased
in spatial extent in the summer or pre-monsoon months due to water stressed
problem. If the water resources are properly be managed and used in the drier
month, vast areas can be converted into good agricultural land use.
5.3.3 Forest Forest lands have a tree-crown areal density (crown closure percentage) of 10 %
or more, are stocked with trees capable of producing timber or other wood
products and exert an influence on the climate or water regime.
Lands from which trees have been removed to less than 10 percent crown
closure but which have not been developed for other uses are included in the
forest category also. For example, lands on where there are rotation cycles of
clear-cutting and block planting are part of forest land. On such lands, when
trees reach marketable size, there may be large areas that have little or no
visible forest growth. The pattern can sometimes be identified by the presence
of cutting operations in the midst of a large expanse of forest. Unless there is
evidence of other use, such areas of little or no forest growth should be included
in the forest land category.
Forest is very important and environmentally significant land use land cover of
the study area. A significant amount of the land is under the forestland of the
blocks distributed in the west, southwest and south west central parts of the
study area. It covered 19 % of the total study area in 1972. Important verity of
forest is Sal trees. From the topographical sheets, few villages are identified
inside the forest. The field visits revealed that those villagers are directly

90
dependent on the forest for their livelihood. They collect forest leaves (Sal
leaves), honey and other products and sustain their livelihood.
Throughout the history there has been conflict between environment and
development. Forest cover has remained very soft and easy target for the
development and extension of agriculture land or industrialization or for
urbanization. The Ausgram I and II blocks are in no exception and showing
depleting forest covers. This forest covered land at year of 2002 (September)
reduced to 17% of total study area compared to 1972. This has further been
reduced to 14% in 2008.
Fortunately, very recently it is observed that some villages have new man made
forest (eucalyptus). The forests are distributed at the western and southern part
of the study area. Some of the important forests are located at Premeani,
Ruldiha, Lakshminarayanpur, Radhballavpur, Dariapur, Lakshmiganj and
Alutia. The decrease of the ecologically sensitive resources may be due to
conversion for agricultural lands, settlements and new roads. The decrease in
the forest cover from 19% to 17 % took 30 years. But it is unfortunate to
observe that from 17% (2002) it reduced to 14% (2008) within six years (Figure:
5.1, 5.2, and 5.3). We feel it is very much alarming and immediate checks are to
be made from government initiative.
5.3.4 Built-up / Settlement and Communication Built-up land is comprised of areas of the land covered by structures. Cities,
towns, villages, strip developments along highways, transportation, power and
communication facilities and areas such as those occupied by mills, shopping
centres, industrial, commercial complexes and institutions are included in this
category. As development progresses, land having less intensive or
nonconforming use may be located in the midst of urban or built-up areas will
generally be included in this category. Agricultural land, forest, wetland or
water bodies on the fringe of urban or built-up areas will not be included except
where they are surrounded and dominated by urban development. The urban or
built-up category takes precedence over others when the criteria for more than
one category are met. For example, residential areas that have sufficient tree
cover to meet forest land criteria will be placed in the residential category.

91
Residential land uses range from high density, represented by the multiple unit
structures of urban cores, to low density, where houses are on lots of more than
an acre, on the periphery of urban expansion.
Areas of sparse residential land use, such as farmsteads will be included in this
category. Rural residential and recreational subdivisions are also included in
this category. Residential sections which are integral parts of other uses may be
difficult to identify. Housing situations such as those existing on military bases,
at colleges and universities, living quarters for labourers near a work base, or
lodging for employees of agricultural field operations or resorts thus would be
placed within the Industrial, Agricultural, or Commercial and Services
categories.
According to Indian land use lands cover classification system built-up land
includes all lands occupied by buildings, roads, railways, all residential,
commercial and industrial development.
For the present study the ‘Built-up’ land includes settlements, mud roads,
metal roads, railway lines, footpaths, religious places and parks. Settlements
generally distributed all over the study area but most of the major settlements
are located in Dig Nagar, Dwariapur, Bhedia, Amrargar, Ausgram, Eral,
Belgram, Sar, Bhota, Bagram, Bhuyera, Karatia, Pubar, Brahman Dihi, Ukta
and Bataaram villages. Almost all 149 villages connected by mud roads, metal
roads, railway lines and by footpaths. In 1972, the transport system was not
developed that much. Very few metalled roads were there and maximum
villages were connected by mud roads and foot paths. Religious places were
distributed in almost all villages. Railway lines crossed the study area through
the north and eastern parts (Eastern Railway, Sahibganj Loop line) of the study
area. In 1972, built-up land covered about 8% of the total land of the study
area.
In 2002, the built-up land coverage increased its total covered area to 15% of
the total land of Ausgram I and II blocks. The increased area under settlement
and communication land increased in response to the decreasing amount of
land coverage from agricultural land and forest coverage. Further in 2008, the
built-up land coverage has increased from 15% to 19%. Rapid growth of human

92
population and settlement attributed the increased growth in settlement
coverage. The communication lines have also increased in total length and so
the density of road in the blocks has increased (Figure: 5.1, 5.2, and 5.3).
5.3.5 Water Bodies “Water body” means an area that, during a year with normal patterns of
precipitation, has standing water for sufficient duration to establish an ordinary
high water mark and a depth of more than two meters. Water on the surface of
the earth is an open body of water, such as a river, stream or lake. All water
naturally open to the atmosphere (rivers, lakes, reservoirs, streams,
impoundments, seas, estuaries, etc.) and all springs, wells or other collectors
which are directly influenced by surface water.
“Surface water” means perennial and seasonal streams, lakes, ponds, and tidal
waters, marshes, water courses and other bodies of water, natural or artificial.
The water in most rivers and lakes is called freshwater because it is low in
salts. This makes it drinkable by people although it is often not safe to drink
because of chemical or biological contamination. Seawater, which is rich in
salts, is not readily drinkable.
“Wetland” means an open body of water; an area that is inundated or saturated
by surface water or groundwater at a frequency and duration sufficient to
support and that under normal circumstances will support a prevalence of
vegetation typically adapted for life in saturated soil conditions, commonly
known as hydrophytic vegetation. Wetlands generally include swamps,
marshes, bogs and similar areas.
There are different kinds of surface water bodies in Ausgram I and II Blocks.
They are rivers, nadis, streams, ponds, lakes, canals, tanks etc. Ajay River is
flowing and forming northern boundary of the blocks. Kunur Nadi is flowing
through the central part of the blocks. Kanakhori Nadi and Kandor Nadi are
flowing through southwest and Kandar Nadi is flowing through southeast parts
of the study area. In the year 1972, surface water bodies covered 7% of the total
land of study area. It gradually decreased to 5% in 2008. From 1972 to 2008
water bodies are reduced by 2% of total land cover (Figure: 5.1, 5.2, and 5.3.

93
Human activates are mainly responsible for converting the water bodies into
agriculture and built-up land use.
• Lakes
Lakes are moderate to large bodies of water. Ponds are usually considered to be
small, shallow bodies of water, typically with an area of less than one acre (0.4
ha), in which sunlight penetrates to the bottom across the entire area. Lakes
are larger and deeper and sunlight may not penetrate all the way to the lake
bottom. Ponds respond to environmental changes particularly sunlight,
temperature and wind this in turn has an influence on the animals and plants
that live there. Lakes covered 192.6 hectares of land on the study area.
• Rivers and Streams
“Stream” means an open, relatively natural channel that collects and drains
flows within a watershed. A stream can be perennial, intermittent or ephemeral
and is defined generally by the bank full width of the channel. Streams do not
include man-made channels constructed solely for the purpose of delivering
adjudicated water rights or trans-basin diversions or for collecting and
conveying storm water from properties into the municipal storm water collection
system.
Rivers and streams form a network of channels that drain water from a large
area of land called the drainage basin. Within a drainage basin, the river
network usually looks like the branches of a tree, with many smaller channels,
called tributaries, draining into a final main river.
In the present study, we considered water bodies where the surface water or
rain water stores or moves continuously more than three month per year. Major
rivers and streams length in present study is 263.68 km (Table: 5.2 and Figure:
3.2).

94
Table: 5.2
Details of Surface Water Bodies of Ausgram Block I & II
Sl.No Water bodies Name Length(K.M.)
1 Ajay River 37.95
2 Kunur Nadi 166.3
3 Kanakhori Nadi 3.142
4 Kandor Nadi 13.09
5 Kandar Nadi 23.77
6 Khari Nadi 19.42
7 Durgapur Branch Canal 48.32
8 Damodar Branch Canal 21.383
9 Panagarh Branch Canal 38.30
10 Distributary No. 7ABC 4.771
11 Distributary No. 7BC 3.005
12 Distributary No. 8BC 2.064
Source: Author’s Calculation
• Canal
Canals are constructed by man to divert water. There are many canals flowing
through the blocks, Durgapur Branch Canal, Panagarh Branch Canal,
Damodar Branch Canal are flowing through the blocks. They are flowing mainly
from the west to central parts of the blocks. Some of canals provide crucial
water needed for irrigation. Those areas of the blocks having canal irrigation are
being cultivated three times in a year. Total length of the canals in the study
region is 117.84 km (Table: 5.2 and Figure: 3.2).
Tanks, lakes and small streams are also distributed all over the study area.
These water bodies are very important source of water for Ausgram I and II
Blocks for agricultural as well as for domestic purposes.

95
In the year 1972, 7% of the total land of the blocks was under the surface water
bodies. In 2002, it reduced to about 5% of the land in Ausgram I and II Blocks.
From satellite imageries and through field verification it has been noticed that
some ponds are being converted to agricultural lands and even to settlements.
Fortunately there was no further reduction of the water bodies and it remained
to about 5% to total land in 2008 also.
5.3.6 Barren land Barren Land is the land of limited ability to support life and over which less
than one-third of the area has vegetation or other cover. In general, it is an area
of thin soil, sand or rocks. Vegetation, if present, is more widely spaced and
scrubby than that in the shrub and bush category of rangeland. Unusual
conditions, such as a heavy rainfall, occasionally result in growth of a short-
lived, more luxuriant plant cover. Wet, non-vegetated barren lands are included
in the non-forested wetland category.
Land may appear barren because of man’s activities. When it may reasonably
be inferred from the data source that the land will be returned to its former use,
it is not included in the barren category but classified on the basis of its site
and situation. Agricultural land, for example, may be temporarily without
vegetative cover because of cropping season or tillage practices. Similarly,
industrial land may have waste and tailing dumps and areas of intensively
managed forest land may have clear-cut blocks evident. When neither the
former nor the future use can be discerned and the area is obviously in a state
of land use transition, it is considered to be barren Land.
According to the Indian land use land cover classification system, the barren
land includes all barren and un-cultivable land like mountains, deserts, etc.
Land which cannot be brought under cultivation except at an exorbitant cost
should be classed as un-cultivable. Barren or sparsely vegetated areas most
often representatives of bare earth or soil. These lands are the rock exposures
and devoid of soil cover and vegetation and not suitable for cultivation. It is
mainly marked on the granite exposures which are outside the notified forest
boundary.

96
In the present study area few barren lands are available. Ajay River has
deposited sands over some places in northern part, along with railway lines. In
1972, it covered 0.13 per cent of land to total study area. It covered 0.27 per
cent of total study area land in 2002 and 0.20 per cent in 2008 (Figure: 5.1,
5.2, and 5.3.
Land use land cover of Ausgram I and II blocks has changes over the past 36
years. Several ways of modification are there. Forest cover shows a gradual
reduction. The reduced forest cover has mainly been added to agricultural,
built-up and current fallow land. Agricultural land also shows changes due to
pre-monsoon, monsoon time and some agricultural lands are converted to
built-up, man made forest and current fallow land. Specifically agricultural
land has been converted to current fallow land mainly due to water stressed
problem. Current fallow land converted to built-up, man-made forest and to
agricultural land. Surface water bodies converted to agricultural land, current
fallow and built-up land due to population growth (Figure: 5.4 & Table: 5.1).
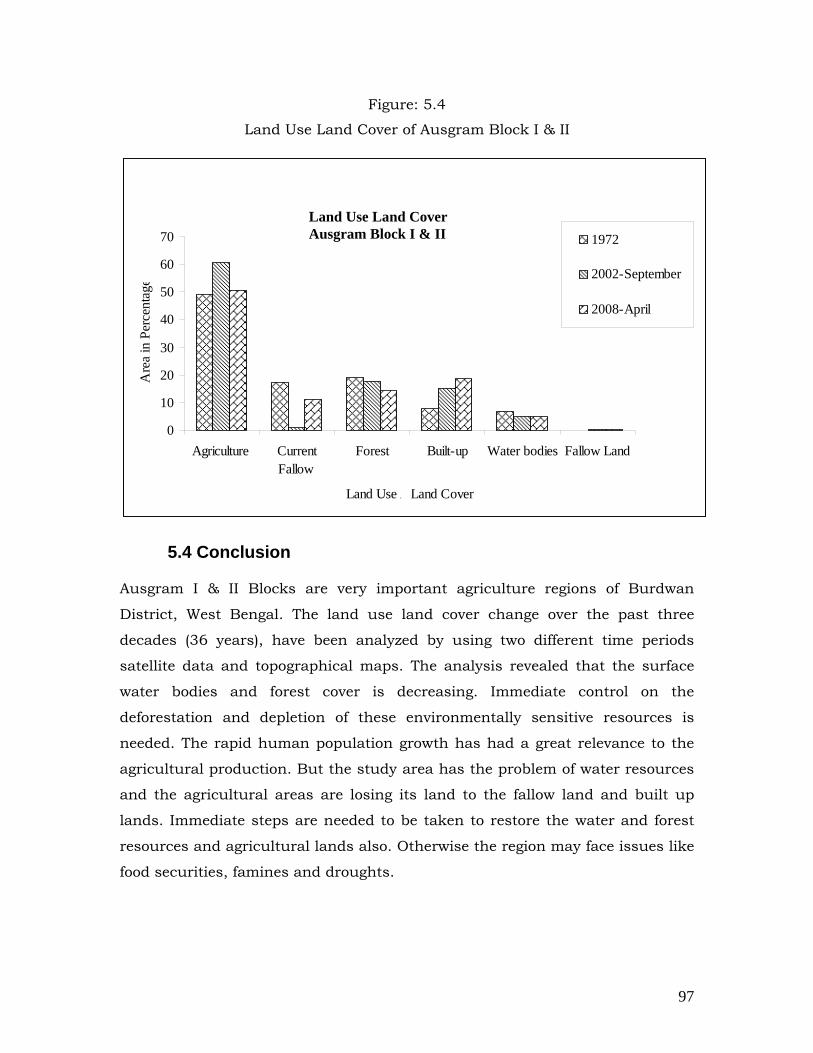
97
Figure: 5.4
Land Use Land Cover of Ausgram Block I & II
Land Use / Land CoverAusgram I & II Blocks
0
10
20
30
40
50
60
70
Agriculture CurrentFallow
Forest Built-up Water bodies Fallow Land
Land Use / Land Cover
Are
a in
Per
cent
age
1972
2002-September
2008-April
5.4 Conclusion
Ausgram I & II Blocks are very important agriculture regions of Burdwan
District, West Bengal. The land use land cover change over the past three
decades (36 years), have been analyzed by using two different time periods
satellite data and topographical maps. The analysis revealed that the surface
water bodies and forest cover is decreasing. Immediate control on the
deforestation and depletion of these environmentally sensitive resources is
needed. The rapid human population growth has had a great relevance to the
agricultural production. But the study area has the problem of water resources
and the agricultural areas are losing its land to the fallow land and built up
lands. Immediate steps are needed to be taken to restore the water and forest
resources and agricultural lands also. Otherwise the region may face issues like
food securities, famines and droughts.
Ausgram Block I&II
Land Use Land Cover Ausgram Block I & II

98
Chapter: - Six
POTENTIALITY OF WATER RESOURCES IN THE REGION
Availability of water plays very important role in deciding the nature and extent
of land use land cover (LULC) of any region. LULC, the assemblage of biotic and
abiotic components and their modification for beneficial output, is one of the
most crucial properties of the earth’s system. In present days, the LULC are
severely being affected due to depletion of much needed water.
Since time immemorial, farmers in dry areas ‘harvested’ surface water for
irrigation. ‘Water harvesting’ is here defined as the collection of surface runoff
mainly for agricultural and domestic purposes. Presently ‘watershed’ approach
has been adopted to collect water. It is worth to mention that ‘watershed’ is that
area which catches the water from precipitation. It is a “resource region” where
the eco-system is closely interconnected with basic resource ‘water’. A
watershed or river basin is considered as an ideal water management unit
(Prinz, 1995, 1996).
Water resource study has taken a new dimension with the use of Geographic
Information System (GIS). Several researchers have utilized GIS and RS data for

99
water resource management and hydrological modelling. Tauer & Humborg
(1992) used RS data and a GIS to determine the potential sites for water
harvesting.
In all the above studies, morphometric analysis of the concerned drainage basin
was the key aspect for the study. In almost all the cases the unit of study was
river basin but seldom the drainage basin confined within the administrative
region and hence it becomes difficult for the administrators for implementation
of the developmental plans. In the present study we have done morphometric
analysis of an administrative region for identification of the water harvesting
potential zone. Here we have considered Relative Relief, Ruggedness Index,
Slope, Drainage Density, Land Use Land Cover of Ausgram I and II Blocks of
Burdwan District, West Bengal as geomorphic resources. The geomorphic
resources have been evaluated and the potentiality of surface water in this
administrative region is identified and further suggestions are made for the
suitable zones for water storing or harvesting.
6.1 Water as a Determinig Factor of LULC of the Block The availability of water resources have been the determining factor of land use
land cover of the study region. The part of the block where the irrigation from
canal is available throughout the year, agriculture has been the main form of
LULC of that part. Cultivation is happening there, at least thrice a year. On the
other hand, the part, with little rugged terrain and availability of irrigation is
not there, agriculture is fully dependent on the rainfall and it happens once in a
year.
6.1.1 Need for Water Resources Management Investment and development of irrigation infrastructure has been long and
continued priority in India. In 1950-1951 the net irrigated area in India was 21
million hectare which expanded close to 100 million ha by 2006 in (30.56 per
cent to total Agricultural Land) in India. It reduced output instability and
provided protection against periodic droughts. Programs such as ‘Bharat
Nirman’ accelerate the irrigation potential creation and efforts are on for
improving the performance of existing irrigation systems to bridge the gap
between potential created and utilized and to improve overall water use

100
efficiency/productivity. The growth of irrigation is the key to the success of the
increasing agricultural production and food security of India.
Advances in remote sensing satellites and communications provided many new
opportunities to generate and transmit information on weather, water and
agriculture. Use of satellite remote sensing data in many studies addressing
base line inventory, performance assessment & monitoring it provids in-season
inputs, monitoring physical progress of potential creation, generating inputs for
feasibility assessment of new projects, environmental impacts such as water
logging & soil salinity, reservoir management etc. This would support the field
departments to cope up with water scarcity and augmenting the water use
efficiency through integration of geo-spatial information with their conventional
practices.
6.1.2 Watershed Management Watershed is a natural hydrologic unit, considered as the most appropriate
basis for sustainable integrated management of the land and water resources.
Judicious management and conservation of soil and water resources on
watershed basis is perquisite for sustaining the productivity. Characterization
and prioritization of watersheds are essential steps in the integrated
management of land resources. Watershed characterization involves
measurement of related parameters such as geological, hydro-geological,
geomorphological, hydrological, soil, land use land cover etc. Remote sensing
technology can effectively be used for watershed characterization and assessing
watershed priority, evaluating problems, potentials, management requirements
and periodic monitoring. Remote sensing data greatly facilitates mapping of
forest, vegetation cover, geology and soils over watershed, which would assist in
the study of land use, watershed potential, degradation etc. This, along with
ground based information can be used for broad and reconnaissance level
interpretations for land capability classes, irrigation suitability classes,
potential land uses, responsive water harvesting areas, monitoring the effects of
watershed conservation measures, correlation for runoff and sediment yields
from different watersheds and monitoring land use changes and land
degradation.

101
6.1.3 Water Harvesting Water harvesting for dry-land agriculture is a traditional water management
technology to ease future water scarcity in many arid and semi-arid regions of
world. The appropriate choice of technique depends on the amount of rainfall
and its distribution, land topography, soil type and soil depth and local socio-
economic factors. The water harvesting methods include widely differing
practices as bunding, pitting, micro catchment water harvesting, flood water
and ground water harvesting.
The study Ausgram I and II Blocks are considered as water stressed region.
Average annual rain fall of the region is 117mm, below the national average.
Average annual temperature is 21.290C. Maximum rainfall occurs in the
months of July (314mm) and the minimum occurs in the months of December
(4 mm). The present study area covers 7% of it total land by surface water
bodies (Table: 5.2). Existing geomorphic resources and surface water bodies are
measured and analysed using Survey of India (SOI) topographical maps and it
has already been discussed in the chapter four. The analysis helps to identify
the surface water potential zone. The zones can be used to store excess rainfall
for the use in the drier periods.
6.2 Surface Water potential zone identification Most of the areas of Ausgram I & II Blocks are affected by water stressed
condition. As a result cultivation of the study region suffers almost every year.
Most of the agricultural land are being cultivating only once in a year. An
attempt has been made to identify the surface water potential zones of the
study region. The geomorphic resources (Relative Relief, Ruggedness Index,
Slope, Frequency of surface water bodies and Drainage Density) are used to
prepare the zones.

102
Table: 6.1
Identification of the Surface Potential Water Zones
Sl.No Geomorphic Resources Value Zones Minimum Ruggedness Index <0.0078 RI/sq.km
Minimum Relative Relief < 3.00 M/sq.km
Maximum Drainage Density 3.00 Km Length of River / Sq.km
Minimum Slope < 20.00’
1
Maximum Surface Water bodies > 15 / sq.km
Maximum Surface Water Potential Zone
Moderate Ruggedness Index 0.0078 – 0.0157 RI/sq.km
Moderate Relative Relief 3.00 – 6.00 M/sq.km
Moderate Drainage Density 2.00 - 3.00 Length of River (Km)/ Sq.km
Moderate Slope 20.00 – 30.00’
2
Moderate Surface Water bodies 10 – 15 / sq.km
Moderate Surface Water Potential Zone
Maximum Ruggedness Index > 0.0157 RI/sq.km
Maximum Relative Relief > 6 M/sq.km
Minimum Drainage Density <1.00 Length of River (Km)/ Sq.km
Maximum Slope >30.00’
3
Minimum Surface Water bodies < 10 / sq.km
Minimum Surface Water Potential Zone
Source: Author’s Calculation
With the help of the above criteria (Table: 6.1), we have identified and classified
the surface water potential zones in three categories i.e. Maximum Surface
Water Potential Zone, Moderate Surface Water Potential Zone and Minimum
Surface Water Potential Zone of Ausgram I & II Blocks (Figure: 6.1).
In this study area, Maximum Surface Water Potential Zone covered 8% of land
surface and it is distributed in central, south east, north west and north east
parts of the study area. Moderate Surface Water Potential Zone covered 2% of
the land surface and it is distributed in north west, south central, south east
parts of the study area. Minimum Surface Water Potential Zone covered 89% of
103
the land surface and it is distributed in maximum study area land. The surface
water potential zone map (Figure: 6.1) shows maximum area is affected by
water stressed problem (around 89%). Generally, we can say that surface water
resource is poor in the study area.
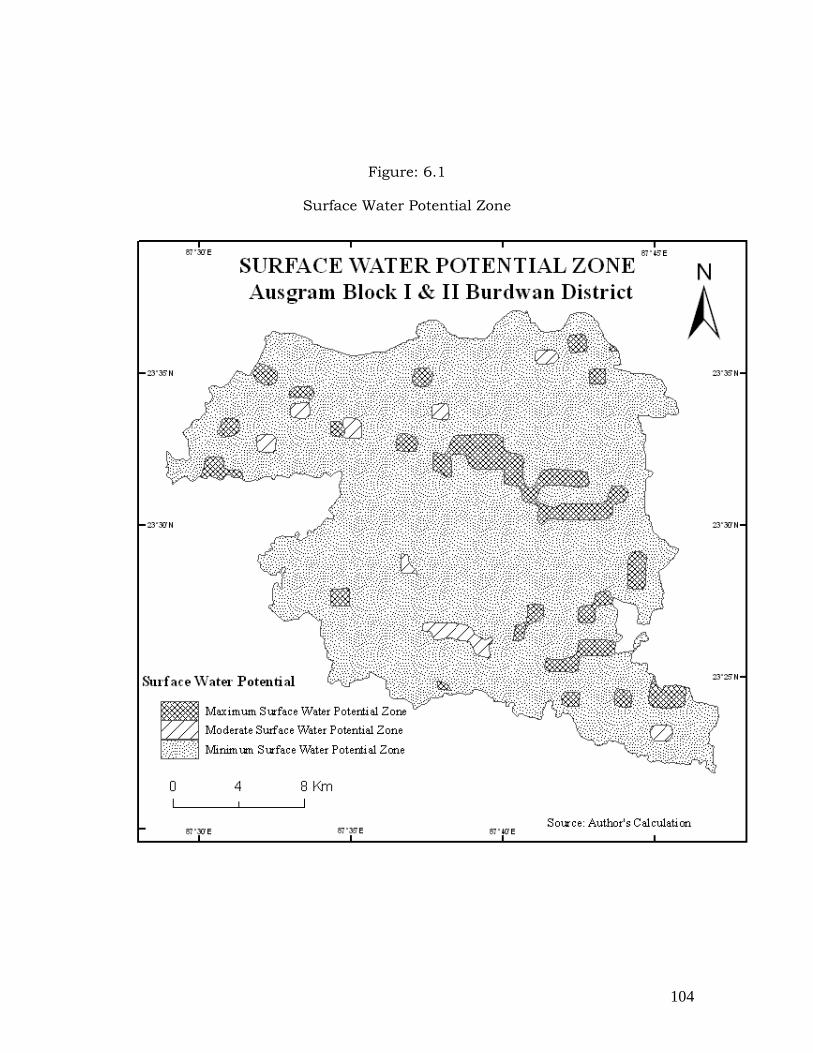
104
Figure: 6.1
Surface Water Potential Zone

105
6.3 Identification of Suitable Water Harvesting Zones Along with the geomorphic resource layers we superimposed the land use land
cover of the block and an attempt has been made to identify the suitable places
of water harvesting (Table: 6.2).
Table: 6.2
Water Harvesting Potential Zones
Sl.No Geomorphic Properties Value Zone
Minimum Ruggedness Index <0.0078 RI/sq.km
Minimum Relative Relief < 3.00 M/sq.km
Maximum Drainage Density 3.00 Km Length of River /
Sq.km
Minimum Slope < 20.00’
Land Cover (Water Bodies) River, Ponds
Maximum Surface Water bodies > 15 / sq.km
1
Maximum Surface Water Potential Zone
Maximum Water
Harvesting Potential
Zone.
Moderate Ruggedness Index 0.0078 – 0.0157 RI/sq.km
Moderate Relative Relief 3.00 – 6.00 M/sq.km
Moderate Drainage Density 2.00 - 3.00 Length of River
(Km)/ Sq.km
Moderate Slope 20.00 – 30.00’
Land Cover (Current Fallow) Deforestation
2
Moderate Surface Water bodies 10 – 15 / sq.km
Moderate Surface Water Potential Zone
Moderate Water
Harvesting Potential
Zone
Maximum Ruggedness Index > 0.0157 RI/sq.km
Maximum Relative Relief > 6 M/sq.km
Minimum Drainage Density <1.00 Length of River (Km)/
Sq.km
3
Maximum Slope >30.00’
Minimum Water
Harvesting Potential
Zone
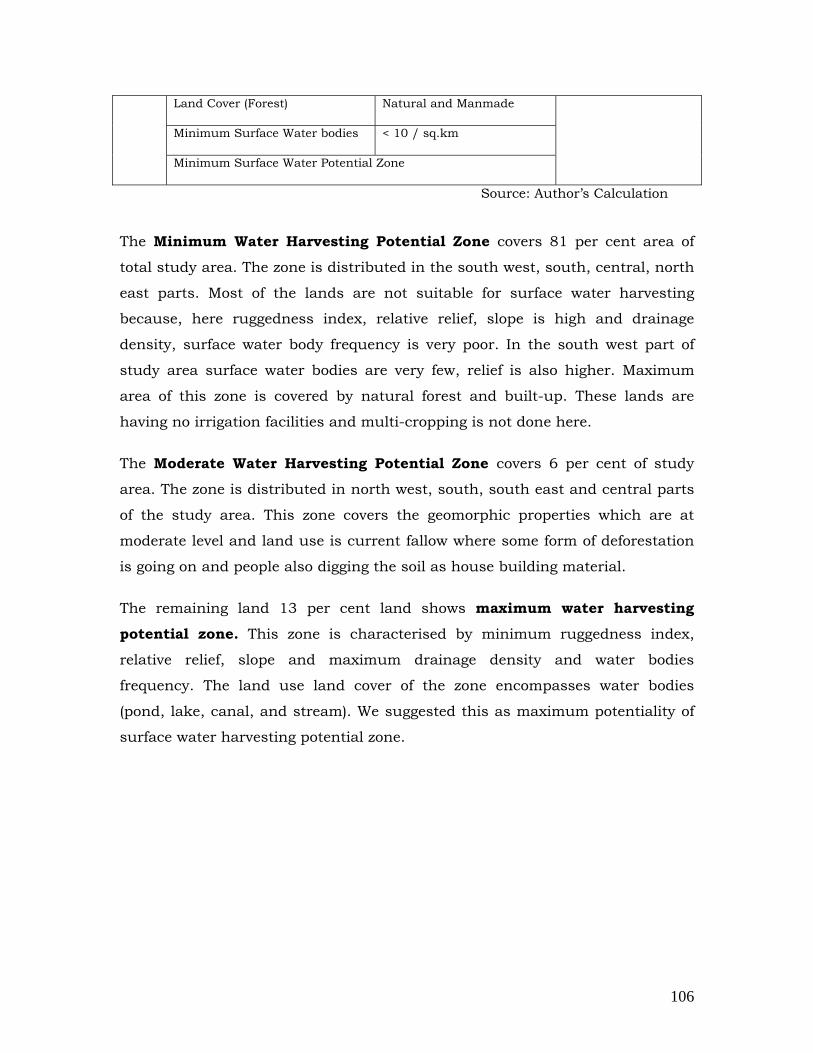
106
Land Cover (Forest) Natural and Manmade
Minimum Surface Water bodies < 10 / sq.km
Minimum Surface Water Potential Zone
Source: Author’s Calculation
The Minimum Water Harvesting Potential Zone covers 81 per cent area of
total study area. The zone is distributed in the south west, south, central, north
east parts. Most of the lands are not suitable for surface water harvesting
because, here ruggedness index, relative relief, slope is high and drainage
density, surface water body frequency is very poor. In the south west part of
study area surface water bodies are very few, relief is also higher. Maximum
area of this zone is covered by natural forest and built-up. These lands are
having no irrigation facilities and multi-cropping is not done here.
The Moderate Water Harvesting Potential Zone covers 6 per cent of study
area. The zone is distributed in north west, south, south east and central parts
of the study area. This zone covers the geomorphic properties which are at
moderate level and land use is current fallow where some form of deforestation
is going on and people also digging the soil as house building material.
The remaining land 13 per cent land shows maximum water harvesting
potential zone. This zone is characterised by minimum ruggedness index,
relative relief, slope and maximum drainage density and water bodies
frequency. The land use land cover of the zone encompasses water bodies
(pond, lake, canal, and stream). We suggested this as maximum potentiality of
surface water harvesting potential zone.

107
Figure: 6.2
Surface Water Harvesting Potential Zone

108
6.4 Conclusion India is facing the problem of water scarcity for agriculture, domestic and other
proposes in almost every year. The problem varies both in its spatial and
temporal scale. In the present study, only agriculture has been taken into
consideration because agriculture is the main source of income for the local
people. The chemical properties of the lands are sufficiently good for cultivation.
We have selected some geomorphic attributes and analysed them. The basic
morphometric attributes considered for the present study are Relative Relief,
Slope, Frequency of surface water bodies, Drainage Density, Ruggedness Index
and land use land cover of the region.
Land use land cover is considered as an important indicator of the availability
of water resources. The presence of water resource dictates the nature and
extension of primary economic activities. Some part of the study area is falling
directly in the water stresses condition and agriculture is affected severely due
to non-availability of water. If water resource is secured, the region can easily
be converted to a good agricultural region.
Based on the geomorphic resources, we have suggested some surface water
harvesting potential zones. In these zones, we consider excess water of rainy
season can be stored for future use. These zones can be of immense help to
increase the intensity of agriculture and be able to increase the earnings of the
people dependent on the agricultural activities.
Maximum water harvesting potential zones are highly suitable for the water
harvesting during the rainy season. Through field verification we have
confirmed that the region is having the river Kunur. It is an ephemeral river but
carries lots of water resources during the rainy season. The region is having
undulating topography and has efficient drainage system. If the running water
is made to be delayed or stored in the existing depressions, ponds for future
usage, the running water can be converted into much more usable resources.
Maximum water harvesting potential zones are distributed throughout the
blocks. The zone covers about 13.08 per cent area of total study area. Moderate
water harvesting potential zone covers about 2 per cent of the total study area.
So, if about 15 per cent of the total study area can be used as water storage

109
zone, the economy of the region can positively be changed. The dry ponds can
be converted into permanent water storage zones, which may have much, more
other economic possibility along with the much-needed ecological importance.
The evaluation of the geomorphic resources and the reassessment of the
existing land use land cover of the region is also needed for the planning and
management of the more beneficial land use land cover.

110
Chapter: - Seven
LAND USE AND LAND COVER PLANNING
Agriculture is by far the most important economic activity of the world. It uses
one-third of the total land surface and employs 45 per cent of the working
population. Agriculture has been described as the purposive raising of livestock
and crops for human needs. The word ‘purposive’ excludes hunters and
gatherers who have not domesticated the plants and animals they use for food
(Grigg David, 1995).
Nearly three fourths of the population in India lives in villages and is directly or
indirectly dependent upon the agricultural pursuits for livelihood. Agriculture in
India is the means of livelihood of almost two thirds of the work force in the
country. It has always been India's most important economic sector. Since
1970s, India saw a huge increase in wheat production that brought the “Green
Revolution” in the country. The increase in post-Independence agricultural
production has been brought about by bringing additional areas under
cultivation, extension of irrigation facilities, use of better seeds, better
techniques, water management and plant protection (Agriculture in India Study
report, 2001).

111
Agriculture provides the principal means of livelihood for over 58.4% of India's
population (National Portal Content Management Team, Reviewed on: 29-04-
2011). It contributes approximately one-fifth of total gross domestic product
(GDP). Agriculture accounts for about 10 per cent of the total export earnings
and provides raw material to a large number of industries. Low and volatile
growth rates and the recent escalation of agrarian crisis in several parts of the
Indian countryside, however, are a threat not only to national food security, but
also to the economic well-being of the nation as a whole.
Agriculture is the main source of income for the people of West Bengal as like
the rest of India. About 70% of the total population depends on farming for their
livelihood. The state has 3% of the total cultivable land of India but it accounts
for 8% of the total food grains produced in the nation. The major crops grown in
the state include Rice, Wheat, Jute, Tea, Potato, Sugarcane, Pulses and
Oilseeds etc.
Barddhaman is the district in the state of West Bengal that is fortunate by
having both by the industry and agricultural concentration within it. On an
average about 58 % of the total population belongs to the agricultural
population while the non agricultural sector accounts for the remaining 42
percent.
The eastern, northern, southern and central areas of the district are intensively
cultivated but the soil of the western portion being of extreme lateritic type is
unfit for cultivation except in the narrow valleys and depressions having rich
soil and good moisture.
Ausgram is one of the blocks of Burdwan District which is located in the
transition zone between the lateritic western part and the fertile Gangetic Plain
in the east. It has already been said that the land use land cover of the block is
not economically sustainable. The availability of water resource is also not
satisfactory for the region. But lot of scope of improvement of the land and
water resources of the region is possible through proper investigation of the
land and soil resources. A much needed attempt is made here to evaluate the
land and soil resources for improved land use land cover planning. This plan is

112
believed to be beneficial for the economic benefit of the local villagers and at the
same time ecological benefit is also be gained.
The present study aims to evaluate the geomorphic resources, availability of
water and nutrition status of soil of some selected villages of Ausgram Block of
Burdwan. The villages are selected as per the list of backward villages of Govt.
of West Bengal. The selected three villages from Ausgram are Dombandi, Bhalki
and Radhamohanpur.
The village Dombandhi is having two cadastral sheets. It covers 300 hectare
area and the total population of the village is 294 persons (2011). The main
worker of the village constitutes 54% of total population and 51% of the total
workers are agricultural labourers and 2 % of the workers are cultivators.
The village Bhalki is having five cadastral sheets. It covers 961.8 hectare area
and the total population of the village is 2272 persons (2011). The main worker
of the village constitutes 38% of total population and 16% of the total workers
are agricultural labourers and 19 % of the workers are cultivators.
The village Radhamohanpur is having four cadastral sheets. It covers 403
hectare area and the total population of the village is 90 persons (2011). The
main worker of the village constitutes 62% of total population and 62% of the
total workers are agricultural labourers and no cultivators are present here.
The three villages are contiguous and altogether they cover 1625 hectare area.
For comprehensive study, the three villages are combined together and all the
study for the evaluation of the geomorphic resources, water resources, land use
land cover, soil resources and planning for alternative, economically profitable
and ecologically sustainable land use land cover will be made.

113
Figure: 7.1
Geological Map

114
7.1 Evaluations of geomorphic resources for the villages Geomorphic conditions and attributes, as has already been said and evaluated
as geomorphic resources, are studied for these three villages also. The
important indicators are, Absolute Relief, Relative Relief, Slope, Ruggedness
Index, Drainage Frequency and Drainage Density.
7.1.1 Relative Relief Relative relief is one of the methods to depict the local relief of any part of the
earth surface. Maximum elevation 70m is found in the central west part of the
study area and minimum elevation 60 is found in the east of the study area.
Relative relief of the villages has been studied using two categories i.e. <3 m and
3 to 6m per one sq.km grid. North and south west part of study area, the
relative relief is less than three meters per sq.km and it covers 53% of total
area. In the east and central part of the study area, relative relief is three to six
meters per sq.km and it covers 47% of total area (Figure: 7.2 & Table: 7.1).

115
Figure: 7.2 Relative Relief

116
Table: 7.1 Relative Relief
Source: Author’s Calculation
This low relative relief indicates that the region is almost flat land and
appearing mature stage of geomorphic evolution. Lower relative relief suggests
that if availability of water is made, the region can be converted to a very good
agricultural region. Although maximum area is covered under <3m/sq.km
relative relief zone but the presence of surface water resources are few. As a
result the low relative relief zone could not be converted into good agricultural
zone.
7.1.2 Slope Slope of land is one of the important physiographic aspects influencing the agricultural
land use of an area. Slope of the study villages is not very high. Slope of the villages has
been classified in five zones i.e. < 10’, 10 – 20’, 20 – 30’, 30 – 10 and >10. Maximum
slope is found in south, west and central part and minimum slope is fond over north, east
and south-east part (Figure : 7.3 & Table : 7.2). Minimum slope zone, < 10’ is distributed
over the east of the study area and it covers one per cent of total area. 10’ – 20’ slope
zone covers 61% of the total area. The low slope land can easily be used for agricultural
activities if other required resources for it are available.
Table: 7.2
Slope
Source: Author’s Calculation
Relative Relief in MeterClass Area in Hector Area in % <3 879.6 52.86 3--6 784.4 47.14 Total 1664 100
Slope in DegreeClass Area in Hector Area in % >10 3.37 0.20 30’-10 24.13 1.45 20’-30’ 602.30 36.20 10’-20’ 1015.00 61.00 <10’ 19.20 1.15 Total 1664.00 100.00

117
Figure: 7.3 Slope

118
7.1.3 Frequency of Surface Water Bodies Lots of water bodies, both natural and manmade are available in the villages.
Number of water bodies per one square kilometer grid has been calculated.
Isolines of the data have been drawn and the region is classified into four zones
as per the drainage frequency. Drainage frequency zones are <2, 2 – 10, 10 – 15
and > 15. Maximum study area falls under the < 2 category of drainage
frequency. The zone is distributed in the south west, west, north west, north
and north east parts of the study area and it covers 67% of total area. Two to
ten water bodies per sq.km zone is distributed in the south, south central and
east central part of the study area and it covers 13% of total area. 10 -15 water
bodies per sq.km zone is distributed in the central east part of the study area
and it covers 13% of total area. More than 15 water bodies zone per sq.km is
distributed in the eastern part of the study area and it covers 7% of total study
area (Figure 7.4 & Table 7.3). It may be true that the study area is having many
water bodies. Unfortunately the poor management of the water bodies makes
the unable to hold the much needed water in most of time of a year. The ground
reality shows that these water bodies add little water to the region in drier
periods.
Table: 7.3 Frequency of Surface water bodies
Source: Author’s Calculation
Frequency of Surface Water Bodies Class Area in Hectare Area in %
>15 116.00 6.97
10-15 210.80 12.67
2-10 214.20 12.87
<2 1123.00 67.49
Total 1664.00 100.00

119
Figure: 7.4
Frequency of Surface Water Bodies

120
7.1.4 Drainage Density Drainage density is defined as the total length of streams of all orders per unit
area. Drainage density of the study area has been measured, and isolines are
drawn to classify the region in two categories, <1 km/km2 and 1-2 km/km2.
Less than one km/km2 drainage density zone is distributed in the south,
central and north east parts of the study area and it covers 54% of total area.
One to two km/km2 drainage density zone is distributed in the north central
and south east parts of the study area and it covers 46% of total study area
(Figure 7.5 & Table 7.4).
From the study of the drainage density it may appear that the area may have
significantly good amount of surface water resources. But the ground reality
shows that the highest drainage density is due to origin of some first order
streams from the highlands and it does not add significantly to the availability
of water in the region.
Table: 7.4 Drainage Density
Drainage Density Km/Km2
Class Area in Hectare Area in % 01- 02 760.50 45.70
<1 903.50 54.30 Total 1664.00 100.00
Source: Author’s Calculation

121
Figure: 7.5 Drainage Density

122
7.2 Soil Soil may be defined as a natural body development as a result of pedogenic
process that takes place during and after the weathering of rocks and in which
plants and other forms of life are able to grow. It forms a loose superficial
mantle covering the earth’s crust (Daji, Kadam and Patil, 2001). In the present
study area (Bhalki, Dombandi and Radhamohanpur) we have collected the soil
samples from 41 different geographical locations. Analysis of the chemical
properties to assess the fertility for all 46 soil samples is done.
Table: 7.5 Soil Samples and their Chemical Properties
Geo-Location Sl.No
Village Name North East
pH EC mmhos/cm
OC %
N kg/ha
P2O5 kg/ha
K2O kg/ha
1 Bhalki 23027.’ 16.1” 87037’ 12.6” 5.74 0.08 0.22 238.33 6.9 26.88 2 Bhalki 23027’ 30” 87037’ 44” 5.68 0.07 0.26 204.19 9.2 43.76 3 Bhalki 23028’ 04” 87037’ 50” 5.20 0.04 0.18 229.28 11.5 107.52 4 Bhalki 23028’ 13” 87037’ 56” 5.27 0.03 0.36 279.28 10.2 40.32 5 Bhalki 23026’ 48.6” 87027’ 31.8” 4.79 0.03 0.38 239.04 8.9 45.32 6 Bhalki 23027’ 53” 87037’ 49” 4.92 0.03 0.16 247.74 18.1 67.20 7 Bhalki 23027’ 31.9” 87037’ 15.6” 4.98 0.06 0.28 257.50 18.4 69.30 8 Bhalki 23028’ 28” 87037’ 42” 4.92 0.05 0.30 260.64 11.2 80.64 9 Bhalki 28028.3’ 31.4” 87037’ 40.7” 4.96 0.04 0.38 271.10 16.1 34.10 10 Bhalki 23028’ 31.4” 87037’ 40.7” 6.52 0.06 0.30 207.32 18.4 67.20 11 Bhalki 23028’ 04” 87037’ 50” 4.90 0.05 0.22 213.60 13.8 120.96 12 Bhalki 23028’47” 87037’ 54” 4.71 0.03 0.30 223.00 7.6 53.20 13 Bhalki 23028’ 31” 87031’ 40.7” 5.05 0.03 0.18 224.05 6.6 36.20 14 Bhalki 23028’ 20.7” 87037’ 08.2” 5.25 0.03 0.20 213.24 12.3 80.64 15 Bhalki 23028’ 25” 87037’ 53” 5.32 0.05 0.30 246.30 14.3 44.13 16 Bhalki 23027’ 16.1” 87037’ 12.6” 5.58 0.06 0.34 251.22 8.2 107.52 17 Bhalki 23027’ 20” 87037’ 48” 6.90 0.08 0.40 228.92 78.2 94.08 18 Bhalki 23028’ 25” 87037’ 53” 5.63 0.04 0.38 266.90 11.5 107.52 19 Bhalki 23028’ 40” 87037’ 46” 5.53 0.05 0.40 256.87 12.3 35.10 20 Bhalki 23027’ 27” 87037’ 51” 5.30 0.04 0.26 228.92 69.9 255.34 21 Bhalki 23027’ 57” 87037’ 52” 4.75 0.02 0.10 181.88 15.6 94.08 22 Bhalki 23026’ 39.9” 87037’ 32.5” 4.80 0.05 0.38 295.48 11.5 39.10 23 Bhalki 23027’ 12” 87037’ 29” 4.78 0.06 0.34 238.68 64.4 28.88 24 Bhalki 23027’ 47” 87038’ 51” 6.26 0.09 0.78 453.00 46 519.84 25 Dombandi 23026’ 34.7” 87036’ 32.08” 4.89 0.02 0.16 232.06 17.6 53.76 26 Dombandi 23026’ 46.04” 87035’ 58.34” 4.31 0.04 0.30 261.40 9.2 65.20 27 Dombandi 23027’ 43.6” 87035’ 47.01” 4.50 0.04 0.32 247.74 18.4 29.88 28 Dombandi 23027’ 43.6” 87035’ 47.01” 4.32 0.02 0.22 250.88 10.5 53.76 29 Dombandi 23027’ 09” 87036’ 20.7” 4.71 0.01 0.36 250.88 15.6 27.88 30 Dombandi 23027’ 43.6” 87035’ 47.01” 4.56 0.02 0.14 168.99 16.9 161.28 31 Radhamohanpur 23028’ 16.14” 87036’ 38” 5.55 0.02 0.14 169.34 10.9 134.40 32 Radhamohanpur 23029’ 12.06” 87037’ 05.37” 5.70 0.07 0.40 244.60 16.8 147.84

123
33 Radhamohanpur 23028’ 59.03” 87036’ 14” 6.70 0.013
0.38 216.38 23.0 362.88
34 Radhamohanpur 23029’ 33” 87036’ 10.03” 4.92 0.07 0.50 244.60 27.6 108.52 35 Radhamohanpur 23029’ 21.05” 87037’ 11.03” 4.80 0.03 0.30 332.60 29.9 40.32 36 Radhamohanpur 23028’ 23.22” 87037’ 13.47” 4.49 0.05 0.36 235.20 11.5 40.33 37 Radhamohanpur 23029’ 31.01” 87037’ 11.03” 4.10 0.04 0.28 258.20 12.3 33.45 38 Radhamohanpur 23028’ 52.03” 87036’ 14” 4.43 0.01 0.28 210.88 14.6 41.41 39 Radhamohanpur 23029’ 11” 87036’ 54” 4.58 0.02 0.40 297.92 16.1 40.32 40 Radhamohanpur 23028’ 23.22” 87037’ 13.47” 4.45 0.01 0.48 300.19 9.2 31.44 41 Radhamohanpur 23029’ 31.01” 87037’ 11.03” 4.68 0.01 0.16 263.42 14.6 40.32
7.2.1 pH (Puissance de Hydrogen) Soil pH is probably the most commonly measured soil chemical property. Since
pH (the negative log of the hydrogen ion activity in solution) is an inverse or
negative function, soil pH decreases as hydrogen ion or acidity increases in soil
solution. A soil pH of 7 is considered neutral. Soil pH values greater than 7
signify alkaline conditions, whereas those with values less than 7 indicate
acidic conditions. Soil pH typically ranges from 4 to 8.5, but can be as low as 2
in materials associated with pyrite oxidation and acid mine drainage.
Soil pH has a profound influence on plant growth. Soil pH affects the quantity,
activity and types of micro organisms in soils which in turn influence
decomposition of crop residues, manures, sludges and other organics. It also
affects other nutrient transformations and the solubility or plant availability of
many plant essential nutrients. Phosphorus, for example, is mostly available in
slightly acid to slightly alkaline soils, while all essential micronutrients, except
molybdenum, become more available with decreasing pH. Aluminum,
manganese and even iron can become sufficiently soluble at pH < 5.5 to become
toxic to plants. Bacteria which are important mediators of numerous nutrient
transformation mechanisms in soils generally tend to be most active in slightly
acid to alkaline conditions.
Soil pH map of the study area (Figure: 7.6) shows that soils of the entire area
belongs to acidic conditions (pH value <7). Maximum soil pH value (6.9) is
found in the central part of the area and minimum soil pH value (4.1) is found
in northeast parts of the study area. The pH of the region has been divided into
four soil pH zones i.e. <5, 5.0 – 5.5, 5.5 -6.0 and > 6 pH values. First zone (<5)
is distributes in almost all the directions of the study area, north, north east,

124
south east, south, south west, west and north west parts of study area and it
covers 64 % of total area. Second zone (5.0 – 5.5) is distributed over the central,
north central, west central, south central and eastern parts of the study area
and it covers 20% of total area. Third zone (5.5 – 6.0) is distributed over the
central, north central, west central, south central and east parts of the study
area and it covers 12% of total area. Last zone (>6.0) is distributed over the
central and east central parts of the study area and it covers 3% of total study
area (Figure: 7.6 & Table: 7.6).
Table: 7.6
pH (puissance de H ydrogen)
Source: Author’s Calculation
For most agronomic crops, a soil pH of 6.0 to 7.0 is ideal for crop growth,
however, the pH tolerance range for various crop species can vary. In the
present study area the zone of pH < 5 pH is suitable for Cashew plant growth,
5.0 to 5.5 pH value zone is suitable for Groundnut cultivation because high
groundnut yields are obtained on soils with moderate acidic reaction (soil pH
5.0 to 6.4), alkaline soils being undesirable. Millet forages grow well in soil pH
levels between 5.5 and 7.0. Soil pH near neutral (pH 6.0 to 7.0) is very much
suitable for papaya cultivation.
pH (puissance de Hydrogen)
Class Area in Hectare Area in %
<5 1066.00 64.21
5.0-5.5 350.90 20.50
5.5-6.0 194.40 11.80
>6.0 52.70 3.49
Total 1664.00 100.00
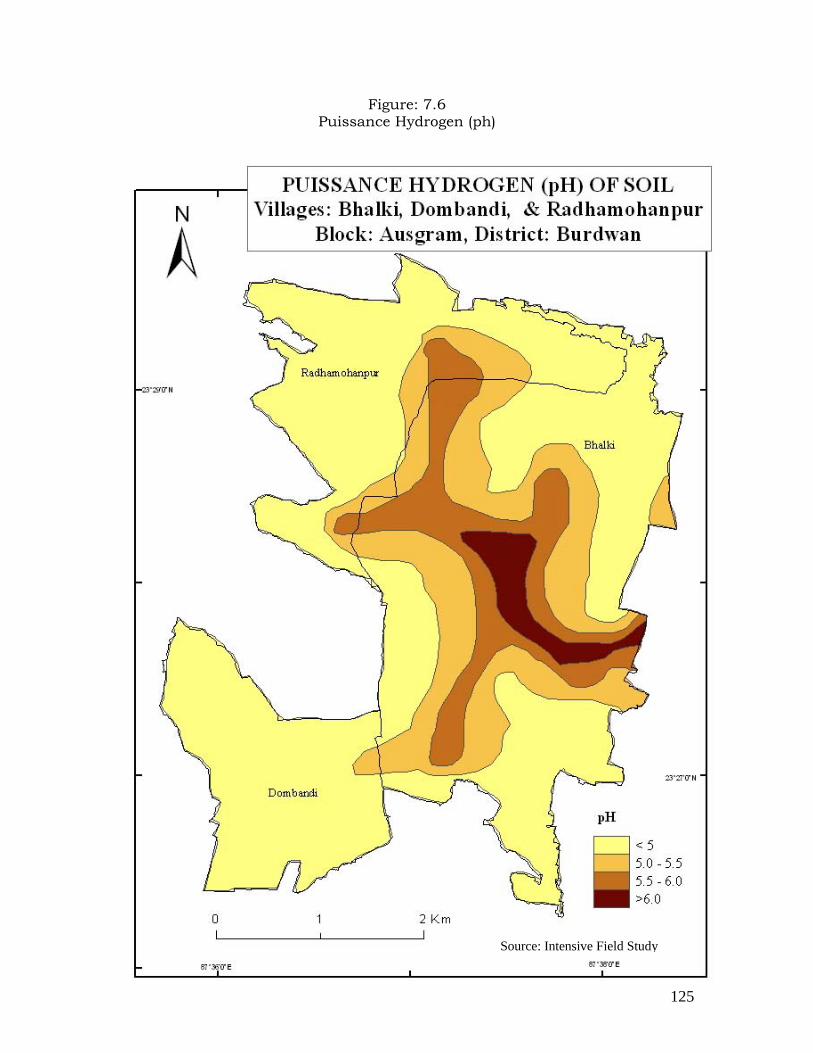
125
Figure: 7.6 Puissance Hydrogen (ph)
Source: Intensive Field Study

126
7.2.2 Electrical Conductivity (EC) Soil Electrical Conductivity (EC) is a measurement that integrates many soil
properties affecting crop productivity. It influences the water content, soil
texture, soil organic matter, depth to clay-pans, salinity, exchangeable calcium
(Ca) and magnesium (Mg). Electrical conductivity is the ability of a material to
transmit (conduct) an electrical current and is commonly expressed in units of
millisiemens per meter (mS/m). Soil EC measurements may also be reported in
units of decisiemens per meter (dS/m), which is equal to the reading in mS/m
divided by 100. Soils with water-filled pore spaces that are connected directly
with neighbouring soil pores tend to conduct electricity more readily. Soils with
high clay content have numerous, small water-filled pores that are quite
continuous and usually conduct electricity better than sandy soils. Curiously,
compaction will normally increase soil EC. Dry soils are much lower in
conductivity than moist soils. Increasing concentration of electrolytes (salts) in
soil water will dramatically increase soil EC.
From the soil Electric Conductivity (EC) map (Figure: 7.7) of the villages,
maximum EC value (0.09mmhos/cm) is found over the eastern part and
minimum EC value is found over the south west, west, north west and northern
parts of the study area. The current soil electric conductivity map has been
divided into three zones i.e. <0.03, 0.03 – 0.05 and >0.05. First zone (<0.03) is
distributed over the south west, west, north west, north and north east parts of
the study area and it covers about 44% of total area. Second zone (0.03 – 0.05)
is distributed over the south west, west, north west, east, south east and
central parts of the study area and it covers 35% of total area. Last zone (>0.05)
is distributed over the central, south, east, central north and north western
parts of the study area and it covers 21% of total study area (Figure: 7.7 &
Table: 7.7).

127
Table: 7.7
Electrical conductivity
Source: Author’s Calculation
Electrical conductivity (EC) in mmhos/cm
Class Area in Hectare Area in % <0.03 726.40 43.65
0.03-0.05 589.70 35.44
>0.05 347.90 20.91
Total 1664.00 100.00
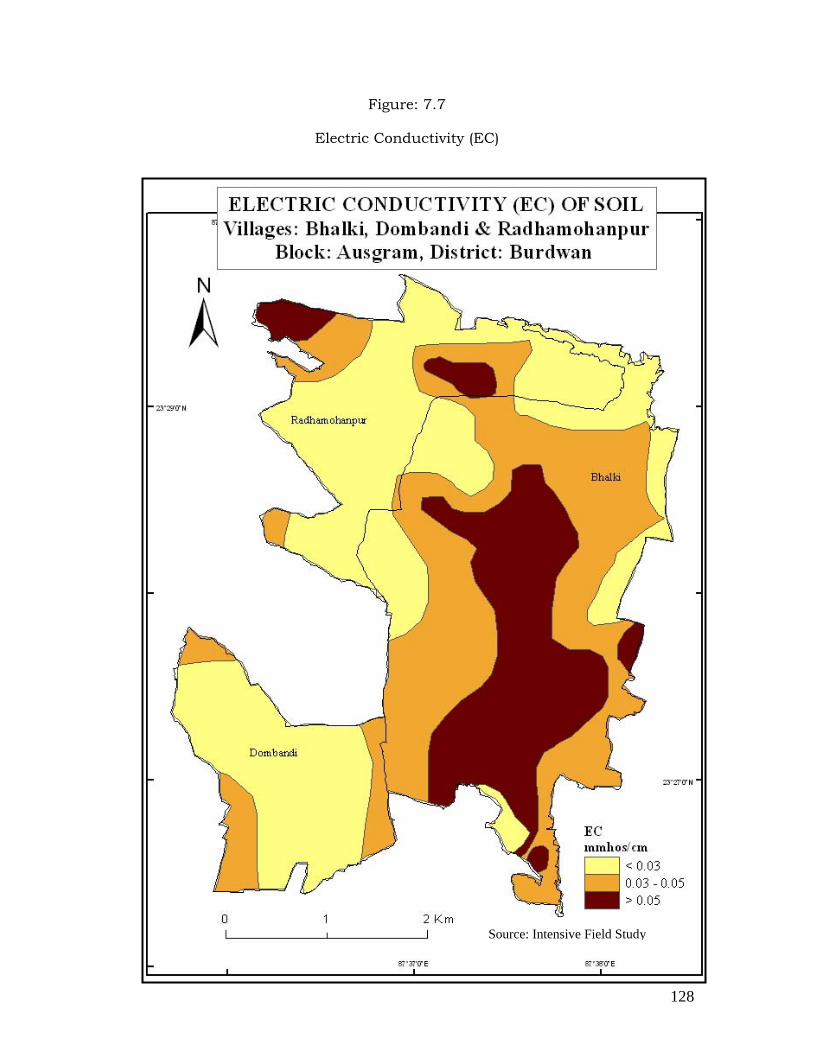
128
Figure: 7.7
Electric Conductivity (EC)
Source: Intensive Field Study

129
7.2.3 Organic Carbon (OC) The presence of decomposing organic matter in soil is indicative of the fact that
the synthetic processes are already active in the soil and the biochemical
activities which supplement the chemical activities have also started. The
plants and animals (both macro and micro) grow on weathered materials and
the organic residues left behind decay with time and become an integral part of
the soil. The main source of soil organic matter in plant tissues and animals are
the subsidiary source of soil organic matter. Earthworms, centipedes, ants etc.
also play an important role in the translocation of plant residues. Gravity and
water infiltration bring carbon molecules down through the soil profile, making
them available for consumption. However, some forms of carbon decompose
more easily than others. "Older" carbon in the soil profile is much more
resistant to decomposition and remains stored in the soil. Soil organic matter
directly benefits the soil microbial community and indirectly influences all other
organisms, particularly plants. Nutrients tied up in organic matter are not
readily available to plants. Rather, microbes must first begin the decomposition
process and obtain energy from organic carbon. As the organic matter is broken
down, nutrients such as nitrogen and phosphorus are released into the soil and
are then available for uptake by plants.
The soil Organic Carbon (OC) map (Figure : 7.8) of the study area shows
maximum Organic Carbon (0.5%) is available in the north west and western
parts and minimum Organic Carbon value (0.1%) is available in eastern part of
the study area. The Organic Carbon concentration of the region is divided into
two zones i.e. <0.5% and >0.5. First zone (<0.5%) is distributed over the north,
north east, east, south east, south, south west and northern parts of the study
area and it covers 83% of total area. Second zone (>0.5%) is distributed over the
north west, west and central east parts of the study area and it covers 17% of
total area (Figure: 7.8 & Table: 7.8).
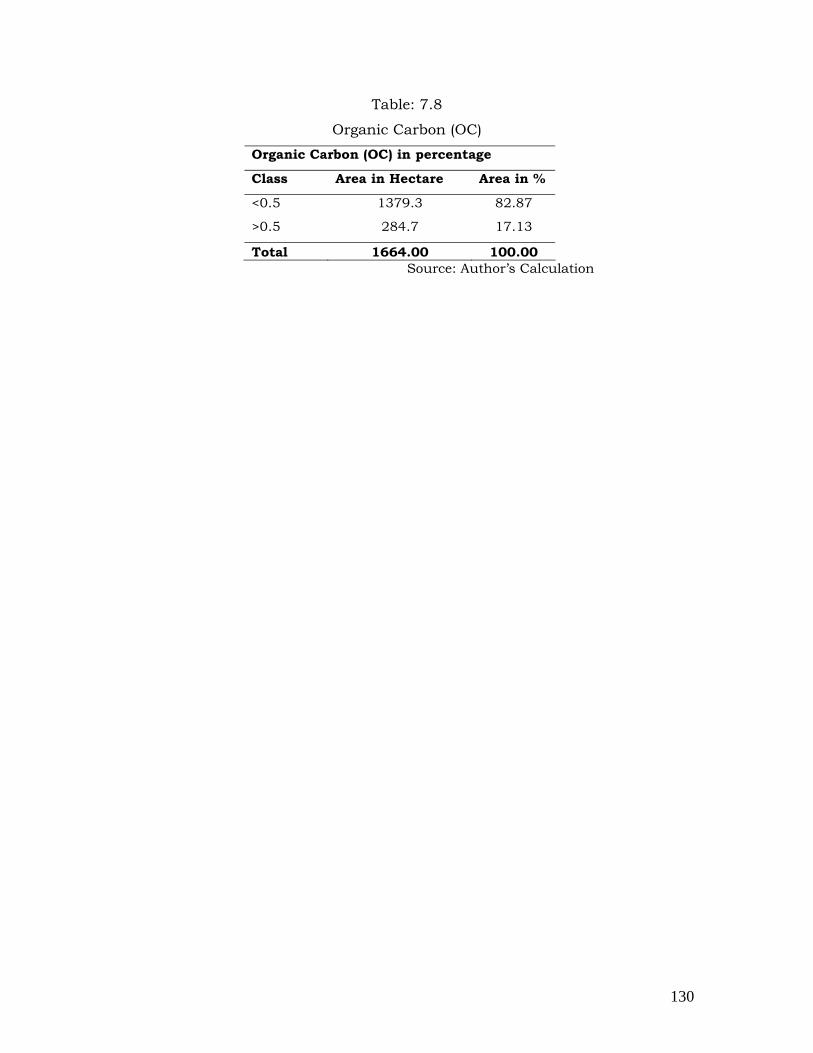
130
Table: 7.8
Organic Carbon (OC)
Organic Carbon (OC) in percentage
Class Area in Hectare Area in %
<0.5 1379.3 82.87
>0.5 284.7 17.13
Total 1664.00 100.00 Source: Author’s Calculation

131
Figure: 7.8
Organic Carbon (OC)
Source: Intensive Field Study

132
7.2.4 Nitrogen (N) Nitrogen is the nutrient required by plants in the greatest quantity. The
nitrogen concentration of plants ranges from about 0.5 to 5% on dry weight
basis. Since most of the plants have rather high nitrogen requirement and most
soils can't supply sufficient nitrogen to meet this demand, nitrogen normally be
supplemented through organic or inorganic fertilizer sources. The ultimate
source of all nitrogen in soils is the atmosphere. Nitrogen as N2 is not directly
available for uptake by most plants. Legumes in symbiosis with particular
species of the bacterial genus, Rhizobium, transforms gaseous N2 to plant
available form, with capacities to fix N2 ranging from about 40 to greater than
300 lbs N/acre/year.
Nitrogen is an essential ingredient for the production of sufficient food for an
expanding world population. Proper nitrogen management can decrease the
potential for negative environmental impacts.
Table: 7.9
Nitrogen Status in Soil
Source: Author’s Calculation
Nitrogen status map (Figure: 7.4) of the study area shows that the maximum
amount of nitrogen (N) is available in the eastern part (453 kg/ha) of the study
area and the minimum is available in the western part (168.99 kg/ha). We
classified the soil nitrogen map into two zones i.e. <250 kg/ha and >250 kg/ha.
The first zone (<250 kg/ha) is distributed over the south, south east, central,
north west and north eastern parts of the study area and it covers 63% of total
area. Second zone (<250) is distributed over the west, south west, east, central,
Nitrogen Status in Soil, kg/ha
Class Area in Hectare Area in %
<250 1050.3 63.12
>250 613.7 36.88
Total 1664.00 100.00

133
north east and north eastern parts of the study area and it covers 37% of total
area (Figure: 7.9 & Table: 7.9).

134
Figure: 7.9
Nitrogen (N)
Source: Intensive Field Study

135
7.2.5 Phosphorus (P) Phosphorus in soil organic matter accounts for about 20 to 65% of the total
phosphorus found in soils. Therefore, phosphorus mineralization from soil
organic matter is an important source of available phosphorus for plant growth.
Phosphorous ranks second to nitrogen as a limiting nutrient for plant growth.
Although plant available forms of this element are anionic, phosphorus is
immobile in soils with appreciable colloid content because it tends to be tightly
bound to these tiny particles. Phosphorus may also form water insoluble
compounds such as insoluble calcium phosphates in alkaline soils and
insoluble iron and aluminum phosphates in acid soils. The concentration of
phosphorus in soil solution is normally much less than one part per million
(ppm), even in fertilized soils, and often is only hundredths of a ppm in
unfertilized soils. Phosphorus fertilizers are normally produced through
acidification of the mineral, apatite, found in high concentrations in some
sedimentary deposits. Organic phosphorus sources, such as manure, may also
be used. Manures, however, usually contain relatively large quantities of
phosphorus relative to nitrogen. Care must be taken with manure additions so
that excess phosphorus doesn't result in deficiencies of other nutrients, such as
zinc or contribute to soluble phosphorus in runoff waters. Soluble phosphorus
can be lost in surface runoff waters, but is usually found adsorbed to soil
particles transported by erosion. Phosphorus in runoff has been implicated in
eutrophication (excessive algal growth) of lakes and streams. Plants need
phosphorous for strong root growth; fruit, stem and seed development; disease
resistance; and general plant vigour. Phosphorous availability depends on warm
soil temperatures, pH range and the levels of other nutrients, such as calcium
and potassium in the soil.
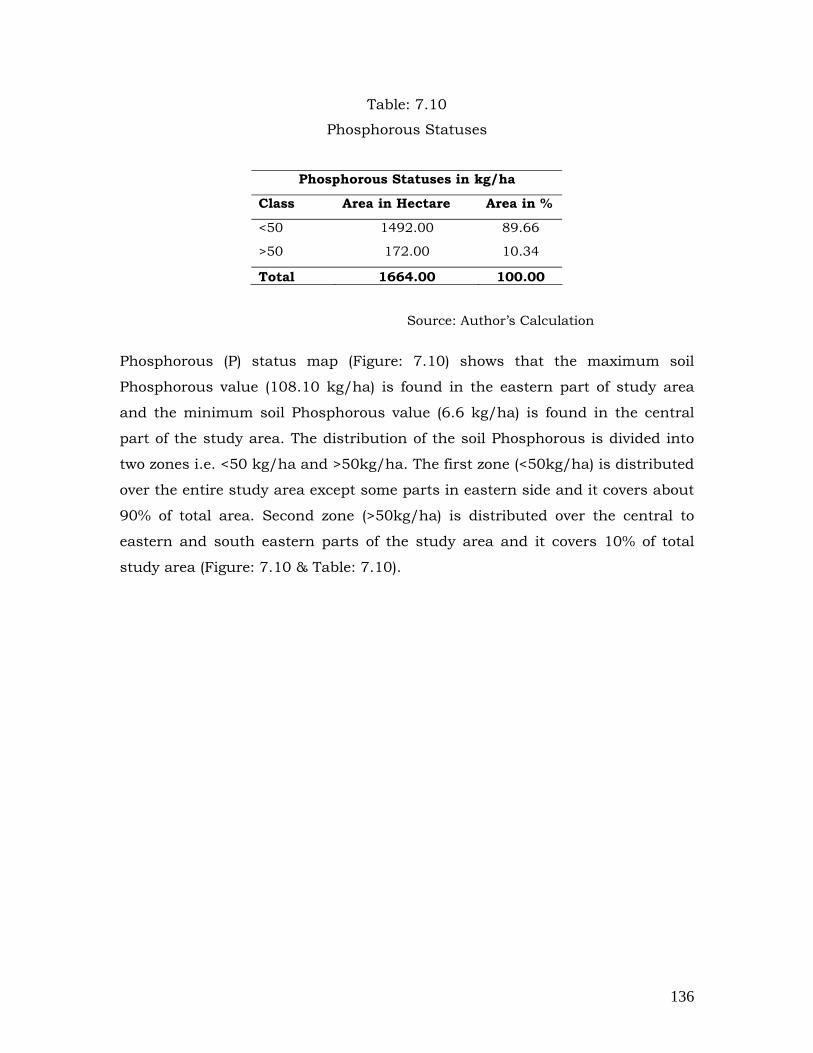
136
Table: 7.10
Phosphorous Statuses
Source: Author’s Calculation
Phosphorous (P) status map (Figure: 7.10) shows that the maximum soil
Phosphorous value (108.10 kg/ha) is found in the eastern part of study area
and the minimum soil Phosphorous value (6.6 kg/ha) is found in the central
part of the study area. The distribution of the soil Phosphorous is divided into
two zones i.e. <50 kg/ha and >50kg/ha. The first zone (<50kg/ha) is distributed
over the entire study area except some parts in eastern side and it covers about
90% of total area. Second zone (>50kg/ha) is distributed over the central to
eastern and south eastern parts of the study area and it covers 10% of total
study area (Figure: 7.10 & Table: 7.10).
Phosphorous Statuses in kg/ha
Class Area in Hectare Area in %
<50 1492.00 89.66
>50 172.00 10.34
Total 1664.00 100.00

137
Figure: 7.10 Phosphorous (P2O5)
Source: Intensive Field Study
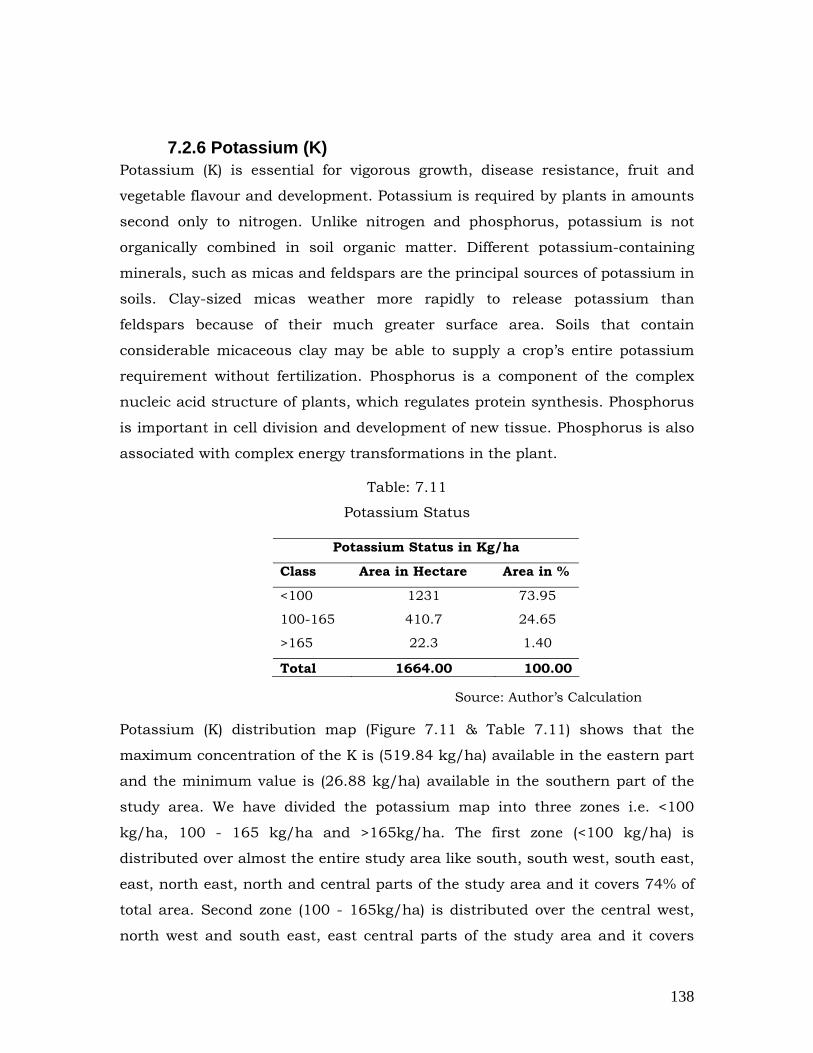
138
7.2.6 Potassium (K) Potassium (K) is essential for vigorous growth, disease resistance, fruit and
vegetable flavour and development. Potassium is required by plants in amounts
second only to nitrogen. Unlike nitrogen and phosphorus, potassium is not
organically combined in soil organic matter. Different potassium-containing
minerals, such as micas and feldspars are the principal sources of potassium in
soils. Clay-sized micas weather more rapidly to release potassium than
feldspars because of their much greater surface area. Soils that contain
considerable micaceous clay may be able to supply a crop’s entire potassium
requirement without fertilization. Phosphorus is a component of the complex
nucleic acid structure of plants, which regulates protein synthesis. Phosphorus
is important in cell division and development of new tissue. Phosphorus is also
associated with complex energy transformations in the plant.
Table: 7.11
Potassium Status
Source: Author’s Calculation
Potassium (K) distribution map (Figure 7.11 & Table 7.11) shows that the
maximum concentration of the K is (519.84 kg/ha) available in the eastern part
and the minimum value is (26.88 kg/ha) available in the southern part of the
study area. We have divided the potassium map into three zones i.e. <100
kg/ha, 100 - 165 kg/ha and >165kg/ha. The first zone (<100 kg/ha) is
distributed over almost the entire study area like south, south west, south east,
east, north east, north and central parts of the study area and it covers 74% of
total area. Second zone (100 - 165kg/ha) is distributed over the central west,
north west and south east, east central parts of the study area and it covers
Potassium Status in Kg/ha
Class Area in Hectare Area in %
<100 1231 73.95
100-165 410.7 24.65
>165 22.3 1.40
Total 1664.00 100.00

139
25% of total area. Third zone (>165kg/ha) is distributed in central east, north
west parts of study area and it covers one per cent of total area.
From the above discussion it has been clear that the entire region and the
selected villages are having inferior quality of soil. The unavailability of the
water resource worsens the situation. The field investigation revealed that most
of the farmers cultivate the land on a sustainable basis only once in a year. Day
by day the situation is becoming grim. An urgent need is there to plan for some
alternative agricultural system for the poor farmers so that they can cultivate
some crops with the available resources and at the same time can earn some
more.

140
Figure: 7.11
Potassium (K2O)
Source: Intensive Field Study

141
7.3 Land Use Land Cover of the Selected Villages Current land use land cover pattern includes forest, water bodies, agricultural
land, plantation, current fallow (Degraded forest), fallow land, settlements and
roads. Evaluation of the present LULC is useful for the making of new seasonal
land use land cover plan and agricultural pattern. Land use land cover analysis
of the region is done using IRS-1D, LISS-IVmx satellite images of different
periods and seasons (Figure: 7.13 & Table: 7.12).
Forest is one of the very ecologically sensitive forms of land use land cover of
the villages. Current land use land cover map is showing that about 54% of the
total land of the villages is covered by forest. The main variety of the forest is
Sal. Some form of forest has been generated by the plantation process. Planted
forest covers about one percentage land of the study area. The main form of the
planted forest is Eucalyptus tree and mostly it is found in Bhalki Village
Agricultural land is the next important land use land cover of the villages. It
covers about 32 % of land to the total land area of the villages. All the
agricultural lands are not cultivated throughout the year but we can divided
them into three categories i.e. single crop land (one time cultivation per year),
double crop land (two times per year) and three cropped land (three times per
year). The Single cropped land is being cultivated only once in a year (July -
October). This category of land covers 13 % of the study area. This cultivation is
rainwater dependent and no water is available for irrigation. The Double
cropped land holds two times crops in a year. Mostly the cultivation occurs in
the months of July to December (July to October and December to February).
Paddy is the main form of cultivation. Double cropped land covers16 % of the
total study area. Three cropped land is used to cultivate crops in all the three
cropping seasons. Although paddy is the main form of cultivation but some
wheat, maize, vegetables are also grown in this category of land. It has been
learnt that this land has the facility of canal irrigation and other form of
irrigation. While the other two categories rely on the rain water and few lands
are having irrigation from tanks and ponds. The three cropped land covers only
3% of the total study area.

142
Current fallow has been considered as those lands which remained fallow as
cultivable waste for the current season and it varies with season to season.
Degraded forest land has been considered as current fallow land. The current
fallow land in general covers about 2% of the study area.
Water bodies are considered as most important resources for this region. They
include rivers, ponds canals etc. Panagarh Branch Canal is very important
source of irrigation water and it is supplying some water for irrigation. About
5% of the total study area is covered by surface water bodies. This is to say here
is that almost all the surface water bodies remain dry in the much needed dry
season and add little water to the region for irrigation and other domestic
purposes.
Roads and settlements are present all over the villages. All the settlement
locations are connected through metal road, un-metal road and foot paths.
About 3 % of the total area is covered by the settlements and road.
Table: 7.12 Exiting Land Use Land Cover
Land Use Land Cover Area in Hectare Area in %
Agriculture Single Crop 216.00 12.98
Agriculture Doble Crop 268.67 16.15
Agriculture Three Crops 51.28 3.03
Current Fallow (degraded forest) 35.76 2.15
Fallow land 32.07 1.93
Forest 901.04 54.00
Plantation 24.25 1.42
Road 36.58 2.20
Settlement 18.92 1.37
Water Body 79.43 4.77
Total area 1664.00 100.00 Source: Author’s Calculation
Evaluation of the present land use land cover makes us understand that the
LULC is not sustainable both economically and ecologically. We can plan for
harvesting the excess rain water in the naturally available depressions. The
land use land cover of the villages are no different from the entire Ausgram
Blocks. Here also we have observed that the water is the only determining factor

143
Figure: 7.12 Existing Land Use Land Cover
Source: Author’s Calculation
for controlling intensification and extension of the agricultural land use. At the
same time we have seen that where the water is available, varieties of crops are
being cultivated throughout the year.
But it is to be remembered that it is not possible to manage the water overnight
or water cannot be made available to the whole villages. Some possibilities
should be explored for cultivating the whole region throughout the year in all
over the villages with the presently available natural resources. This will help
the local people to live a better life in a sustainable manner.
Existing LULCVillages:Bhalki, Dombandi &
Radhamohanpur
13%
17%
3%
2%
1%55%
1%
2%
1%
5%
Agriculture SingleCropAgriculture DobleCropAgriculture ThreeCropsCurrent Fallow(degraded forest)Fallow land
Forest
Plantation
Road
Settlement
Water Body
Total Area: 1664 Hectares

144
Figure: 7.13
Existing Land Use Land Cover and Cropping Pattern

145
7.4 Alternative agriculture Alternative agriculture is meant by the planning of new land use land cover for
the region which is not the traditional type. It is based on the available
geomorphic resources, water resources, soil resources and land use land cover
and importantly the knowledge and need of the society. An attempt has been
made to suggest four new alternative seasonal land use land cover types for the
study villages. The suggested crops are more suitable than the current land use
land cover in accordance with the available geomorphic and other resources.
Cashew, Groundnut, Millets and Papaya are some crops which are not
traditional to this region but if cultivated may be more economically and
environmentally sustainable.
The major and significant land use land cover of the study villages is forest. The
main variety of tree is Sal. It is not desired to disrupt the environmentally
significant land use land cover. So, no alternative suggestions are made to the
forest covered areas.
In many parts of the villages plantation is being taking place. The main variety
of the planted tree is Eucalyptus. It has been learnt from the field that the
forest is being maintained by the Joint Forest Management (JFM) group. We did
not suggest altering the land use land cover of those parts also.
The lands those are having good water availability and paddy is being cultivated
thrice in a year, alternative agriculture is not expected by the cultivators. So we
suggested continuing paddy cultivation on such lands.

146
Figure: 7.14 Alternative Crops Zones

147
Alternative cultivation is suggested to those lands where the paddy cultivation
is once or twice in a year and that is also dependent on the rain fall only. It has
been learnt from the field that the farmers are not even interested to the paddy
cultivation in these areas. As they have no known alternative agricultural
knowledge and suggestions, the farmers are continuing the profit less
subsistence paddy cultivation. The important suggested alternative agricultural
crops are cashew, groundnut, millets and papaya
Table: 7.13 Alternative Crops Zone
Source: Author’s Calculation
Crops Zone Area in Hectare Area in % Cashew 464.70 27.92 Groundnut 693.70 41.69 Millets 245.60 14.76 Papaya 260.00 15.63 Total 1664.00 100.00

148
Table: 7.14
Suggested new agricultural pattern
Drainage Density (<1km/sq.km)
Relative Relief (3-6m/sq.km)
Slope (>30’)
Geomorphology
Surface Water Bodies Frequency
(<2 surface water bodies/sq.km)
Water Resource (Minimum Surface Water Resource
Zone)
Soil pH (<5)
Soil EC (<0.03 mmhos/cm)
Soil OC (<0.5 %)
Soil N (<250 kg/ha)
Soil P (<50 kg/ha)
Soil K (>40 kg/ha)
CASHEW
Current Land Use Land Cover
Drainage Density (1-2 km /
sq.km)
Relative Relief (<3 m /
sq.km)
Slope (10-30’)
Geomorphology
Surface Water Bodies
Frequency (2-10 surface
water bodies/sq.km)
Water Resource ((Minimum and moderate Surface
Water Resource Zone))
Soil pH (5 -5.5)
Soil EC (0.03 – 0.05 mmhos/cm)
Soil OC (>0.5%)
GROUNDNUT
Soil N (<250 kg/ha)

149
Soil P (<50 kg/ha)
Soil K (>40 kg/ha)
Current Land Use Land Cover
Drainage Density (1-2
km/sq.km)
Relative Relief (<3m/sq.km)
Slope (10-30’)
Geomorphology
Surface Water Bodies
Frequency (<2 surface water
bodies/sq.km)
Water Resource (Minimum Surface Water Resource
Zone)
Soil pH (5.5 – 6.0)
Soil EC (>0.05 mmhos/cm)
Soil OC (<0.5%)
Soil N (<250 kg/ha)
Soil P (<50 kg/ha)
Soil K (>50 kg/ha)
MILLET
Current Land Use Land Cover
Drainage Density (>2
km/sq.km)
Relative Relief (3-6m/sq.km)
Slope (10-20’)
Geomorphology
Surface Water Bodies
Frequency (2-15 surface
water bodies/sq.km)
Water Resource (Minimum Surface Water Resource
Zone)
Soil pH (>6)
Soil EC (>0.05 mmhos/cm)
PAPAYA
Soil OC (>0.5%)
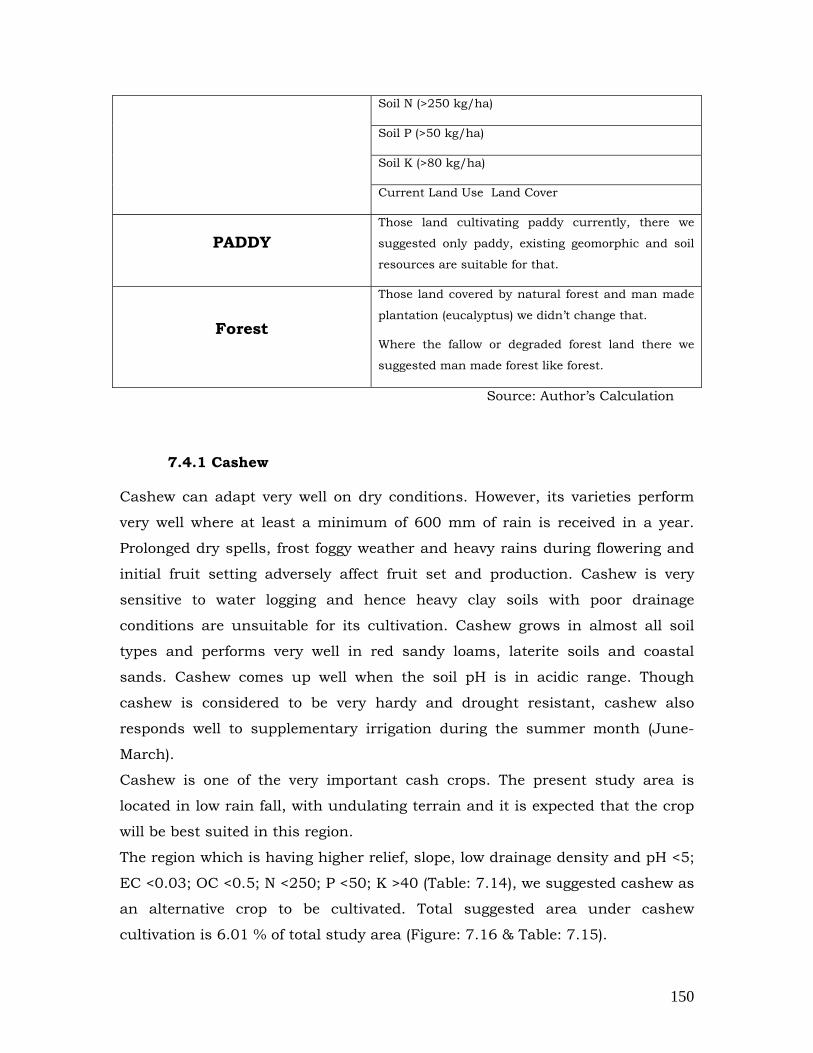
150
Soil N (>250 kg/ha)
Soil P (>50 kg/ha)
Soil K (>80 kg/ha)
Current Land Use Land Cover
PADDY
Those land cultivating paddy currently, there we
suggested only paddy, existing geomorphic and soil
resources are suitable for that.
Forest
Those land covered by natural forest and man made
plantation (eucalyptus) we didn’t change that.
Where the fallow or degraded forest land there we
suggested man made forest like forest.
Source: Author’s Calculation
7.4.1 Cashew
Cashew can adapt very well on dry conditions. However, its varieties perform
very well where at least a minimum of 600 mm of rain is received in a year.
Prolonged dry spells, frost foggy weather and heavy rains during flowering and
initial fruit setting adversely affect fruit set and production. Cashew is very
sensitive to water logging and hence heavy clay soils with poor drainage
conditions are unsuitable for its cultivation. Cashew grows in almost all soil
types and performs very well in red sandy loams, laterite soils and coastal
sands. Cashew comes up well when the soil pH is in acidic range. Though
cashew is considered to be very hardy and drought resistant, cashew also
responds well to supplementary irrigation during the summer month (June-
March).
Cashew is one of the very important cash crops. The present study area is
located in low rain fall, with undulating terrain and it is expected that the crop
will be best suited in this region.
The region which is having higher relief, slope, low drainage density and pH <5;
EC <0.03; OC <0.5; N <250; P <50; K >40 (Table: 7.14), we suggested cashew as
an alternative crop to be cultivated. Total suggested area under cashew
cultivation is 6.01 % of total study area (Figure: 7.16 & Table: 7.15).

151
So we can suggest, with proper care, the cashew cultivation can be alternative
forming system instead of cultivating one time non profitable paddy.
7.4.2 Groundnut
Groundnut being a leguminous crop has some advantages over other crops
including the horticultural crops. The region is having low nitrogen availability
but the groundnut has the ability to fix atmospheric nitrogen biologically into
the soil which enriches the soil and this benefit the succeeding crops. The crop
does not require irrigation and can be cultivated on the residual soil moisture
conditions. It does not need elaborate management practices. It provides a very
nutritive bio-mass in the form of green fodder which can be fed to cattle.
Groundnut crop can be considered not only as an oilseed crop but also as a
food crop because of varieties of availability of high protein.
Groundnut has been suggested mainly to the mono-crop fields and also for
some double cropped marginal lands. If the farmers are trained well to this
cultivation, groundnut can be cultivated when the land remains fallow between
next paddy growing seasons. Other important criteria which are considered for
the groundnut cultivation are pH 5 -5.5; EC 0.03 – 0.05; OC >0.5; N <250; P
<50 and K >40 (Table: 7.14). Total suggested area under groundnut cultivation
is 7.66 per cent of total study area (Figure: 7.16 & Table: 7.15).
7.4.3 Millets
Millets are some of the oldest form of cultivated crops. Millets require warm
temperatures for germination and development. Millets are efficient users of
water and grow well in areas of low moisture. Millets are often grown as catch
crops where other crops have failed or planting is delayed due to unfavourable
weather. Millets grow well on well-drained loamy soils. They do not tolerate
water-logged soils or extreme drought.
The present region is best fit as per the climatic and soil condition for the millet
cultivation. Other than geomorphic and climatic conditions, the soil conditions
are also taken into consideration for the suggestions of the millet. Main
emphasis was given to the present land use land cover of the region. The lands
having mono crop or double cropping land with pH 5.5 – 6.0; EC >0.05; OC
152
<0.5; N <250; P <50 and K >50 are chosen for the millet cultivation (Table:
7.14). It can be cultivated in the time when the lands are remaining fallow or
unutilized. Total suggested area under millet cultivation is 4.78 per cent of total
study area (Figure: 7.16 & Table: 7.15).
7.4.4 Papaya
Papaya grows well on many types of soil, but they must be adequately drained.
Restricted soil drainage promotes root diseases. Production on other soil types
is limited to low rainfall areas where restricted drainage is less likely to cause
problems. Soil pH near neutral (pH 6.0 to 7.0) is preferred.
Papaya is a tropical fruit having commercial importance because of its high
nutritive and medicinal value. Total annual world production is estimated at 6
million tones of fruits. India leads the world in papaya production with an
annual output of about 3 million tones. Papaya being a tropical fruit grows well
in the mild sub-tropical regions of the country up to 1,000 m. above sea level.
Night temperature below 120-140 C for several hours during winter season
affects its growth and production severely. It is very much sensitive to frost,
strong winds and water stagnation. Deep, well drained sandy loam soil is ideal
for cultivation of papaya.
The region is well fit for the cultivation of papaya as it is having higher relief
loamy soil and the much necessary climate also. Along with the above
conditions, the soil parameters are also taken into consideration. The regions
where the pH <6; EC >0.05; OC >0.5; N; >250; P >50 and K >80 and also where
the lands are cultivated once or twice in a year, considered for the papaya
cultivation (Table: 7.14). Total suggested area under papaya cultivation is 4.76
per cent of total study area (Figure: 7.16 & Table: 7.15).

153
Table: 7.15 Suggest New Land Use Planning
S.No Crops Area in Hectare Area in %
1 Cashew 100.00 6.01
2 Groundnut 127.40 7.66
3 Millets 79.52 4.78
4 Papaya 79.27 4.76
5 Paddy 51.32 3.08
6 Water bodies 79.43 4.77
7 Settlements 18.92 1.14
8 Road 36.59 2.20
9 Forest 1067.30 64.14
10 Plantation 24.25 1.46 Total 1664.00 100.00
Source: Author’s Calculation
Figure: 7.15
Suggest New Land Use Planning
Suggest New Land use PlanningVillages: Bhalki, Dombandi & Radhamohanpur
6% 8%
5%
5%
3%
5%
1%
2%
64%
1% CashewGroundnutMilletsPapayaPaddyWater bodiesSettlementsRoadForestPlantation
Source: Author’s Calculation
Total Area: 1664 Hectares

154
Figure: 7.16 Suggested New Seasonal Land Use Land Cover Plan
155
7.5 Conclusion Evaluation of the geomorphic resources, water resources, soil resources
and the existing land use land cover has been done for the selected
villages. It has been seen that the area is having little undulations and
water resources are scarce as well. The soil of the region is not very
fertile also. As a result the agriculture of the villages hampered the most.
Most of the agricultural lands are cultivated once in a year and very few
lands are cultivated twice or thrice. The mono cropping is also dependent
on the timely arrival of monsoon rainfall.
The existing surface depressions like tanks, ponds, lakes etc. can be
used as storing the excess rainwater of the monsoon months and can
use used in the drier months. But the planning and implementations
from the government level may take time. Meanwhile the farmers can use
the suggested alternative cropping with the available climatic,
morphologic, water and soil resources.
We have suggested four major new crops like Cashew, Groundnut,
Millets and Papaya based on the climatic, geomorphic, soil, water and
existing land use land covers. The forest, plantation, water bodies,
settlements and roads to be remain unchanged in the new planning map.
Similarly, three times paddy cultivated lands, although very low in few
amount, we have not suggested any alteration as it was not desired by
the farmers.
In the new seasonal land use land cover plan map, we have proposed
Cashew (6.01%), Groundnut (7.66%), Millets (4.78%), Papaya (4.76%),
Paddy (3.08%), Water Bodies (4.77%), Settlement (1.14%), Road (2.20%),
Forest (64.14%) and Plantation (1.46).
It is not an easy task by the farmers to adopt the suggested alternative
seasonal land use land cover plan. Initiatives from the Government and

156
NGOs are to be taken to make the farmers understand the importance
and benefit of cultivation the new crops.

157
Chapter: - Eight
CONCLUSION
The present research work intends to evaluate the geomorphic resources, water
resources, soil resources from the perspective of the land use land cover with
special emphasis on the agricultural activities and sustainability. It was
mentioned that the geomorphic resources define the availability and potentiality
of the water resources, so do the nature, extent and intensity of agricultural
activities. Water resource plays the controlling role in the intensity and nature
of the agricultural activities. The soil characteristics also have the deterministic
role of the agricultural activity. Existing geomorphic resources, water resources,
soil resources and the existing land use land cover has been reassessed and
alternative agricultural activities are planned to facilitate the economic benefit
of the local farmers and sustainability of the region.
The present study has been carried out in Ausgram I and II Blocks of the
Burdwan District, West Bengal. It is a transition zone between the Chotonagpur
Plateau in the west and the alluvial fertile Bengal-Deltaic zone in the east. The
region suffers from the water stressed problems and it has undulating
topography which is not favorable for intensive agricultural activities.
Cultivators of the region are not able to cultivate for most of the cultivating
seasons. The study intensively used Remote Sensing and Geographical

158
Information System to evaluate the geomorphic resources, water resources, soil
resources and land use land cover of the region. The geomorphic conditions are
affecting the availability of water resources. Similarly the water is also
restricting the intensity of the agricultural activities. The soils are tested and
find that with the available resources, some alternative cultivation is possible
here which will make the region to develop economically and ecologically as
well. The present section would like to summarize the main findings of the
study. It would briefly discuss the policies to be adopted and the steeps to be
taken so that the region’s sustainability and economic development is not
threatened in future. It would then conclude by indicating some of the possible
directions of further extension of the present study.
8.1 Major Findings
In the starting point of the present study we tried to conceptualise the meaning
of geomorphic resource, land use land cover, land use land cover in relation to
geomorphic resource, land use land cover relation with water resource and
importance of land use land cover study with Remote Sensing and GIS
technology. Here we have seen that the land use land cover, especially the
agricultural extension and intensification is highly controlled by the available
water and geomorphic conditions at any level of spatial scale. The temporal
study of available literatures also supports the importance of the geomorphic
resources and water resources for any economic activities.
Methodological aspect of the present study has been dealt in details. Satellite
Remote Sensing (RS) and Geographical Information System (GIS) were widely
applied. RS and GIS based study of land use land cover, geomorphic resources,
water resources, soil resources clearly answer the what, where and why in
geographic study. Quantitative analysis of satellite images of IRS and Landsat,
topographical sheet, field study of in situ data were integrated in the GIS.
Simple overlay techniques in GIS has been applied to study the nature and
extent of land use land cover in relation to the geomorphic, water and soil
resources. Different thematic layers were prepared using GIS and a seasonal
land use land cover planning proposal has been made for some selected
villages.

159
The geomorphic resource characterization means measurement and
quantification of the absolute relief, relative relief, dissection index, slope,
drainage frequency, drainage density and ruggedness index. The region is
evaluated as to be in the late maturity stage of the geomorphic cycle of
evolution. Some undulations are controlling the availability of water resources.
Some of the first order streams along with some big rivers are also found to be
originated in the region indicating sufficient water availability. Thus the
problems of water resource potential and harvesting are observed. A study has
been made to enquire about the need of the water resource management.
Identification of surface water harvesting and surface water potential zones of
present study area has been done.
An in-depth study on three Villages in Ausgram II blocks was taken up for
planning of alternative agricultural land use land cover with the available
geomorphic, water and soil resources. The identified alternative crops are
Cashew, Groundnut, Millets and Papaya. Paddy is the source of staple food and
this should be continued in the wet season.
The present study clearly points out that the existing traditional agricultural
activities are not in accordance with the geomorphic, water and soil resources
of the region. The changing socio-economic situation demands more
sustainable income level for development of the region. Under such conditions
immediate measures are to be taken so that the region may have some
sustainable economic agricultural activities.
8.2 Policy Suggestions
The increasing need for economic development of this particular region is
expected to be met through the extension and intensification of the agricultural
activities. But the constraints of such attempts are the morphometric
attributes, water availability and soil of the region. Continuing with the same
attempt of extending the traditional agricultural system is seems to be more
costly for the local farmers and not sustainable in long term as well. Decreasing
forest cover and already depleted water resources are making the region
ecologically more fragile.

160
Not only the climate, but the geomorphic conditions are also responsible for the
poor condition of the water resource of the region. This in turn is restricting the
growth of agricultural activities. The intensive study of the geomorphic
condition reveals that they can also be used as resources if managed properly.
The geomorphic situations are taken into consideration for identification of the
water potential and water harvesting zones in the region. Efforts from the
government level may help to design and implement some check dams and
water diversions which will help to store excess water of the rainy season in the
existing surface depressions like ponds, lakes etc. This will help to increase and
develop the water resource base of the region and will provide water in the
adjacent agricultural fields in need. The existing irrigation system may be
reviewed and modern technology may be employed for more effective irrigation.
Educating farmers for the need and use of water harvesting, storing and
adapting technological innovations are also important.
The per-capita availability of the rain water and the uncertainty of irrigation
have classified the region as water stressed. Poor water management practices
make the ponds and other surface water bodies dry immediately after the rainy
season. As a consequence the agricultural activities are severely affected and
majority of the agricultural lands are being cultivated once in a year and for
rest of the year it remains dry. This demands the alternative farming or
cropping pattern. Introduction of dry land farming is also another option for the
region.
The mono-cropping lands are mainly due to the scarcity of the water resources.
With the help of the available geomorphic conditions, water resources and soil
resources alternative cropping has been planned for the region. This can be
cultivated throughout the year and will bring the economic benefit to the region.
The alternative farming practices are not very easy to learn & adopt by the local
farmers. Government, NGOs and other institutional helps are needed to make
the farmers aware of the need and scope of the alternative farming. Farmers
should also be motivated to cultivate these new alternative crops. Technical
help to cultivate the alternative suggested crops are also needed from the
appropriate authority from the government sector.

161
These are some of the many integrated policies which are needed to develop the
region in more affirmative economic and ecological sustainability way.
8.3 Further Research
The present study is a part of the much broader issue of sustainable natural
resources use and development practices. While studying and bringing up the
issues like use of the existing geomorphic resources, water resources and soil
resources and evaluation of the existing agricultural practices, several further
research direction may be identified. The study region is located very close to
the city Burdwan and why such a low level of Human Resource development is
there can be an interesting further research idea. Similarly, the study of the
economics of water resources can be done. One may look after the institutional
need in different sectors of further development in more sustainable way.
As concluding remark, it should be mentioned that the present study suggests
that the land use land cover, especially the agricultural activities are not in
accordance with the regional geomorphology and other resources. These are
leading to more and more economic and social consequences. The unscientific
extension and intensification may worsen the sustainability of the region as
well. There is therefore, an urgent need for the appreciation of the possible
danger of unscientific and unsustainable land use land cover of the region. The
implementation of the suggested land use land cover may lead the development
in more sustainable way and we may develop towards the much needed
progress.
162
Bibliography
Abd El-Kawy, O.R., Rød, J.K., Ismail, H.A., Suliman, A.S. (2011). and land
cover change detection in the western Nile delta of Egypt using remote
sensing data. Applied Geography, 31, 483e494.
Abrahams, A.D., Campbell, R.N. (1976). Source and tributary-source link
lengths in natural channel networks. Geol Soc Am Bull, 87. 1016–1020.
Adamo, S.B., Crews-Meyer, K.A. (2006). Aridity and desertification: exploring
environmental hazards in Jachal, Argentina. Applied Geography, 26 (1),
61–85.
Agarwal, C., Green, J. M., Grove, T., Schweik, C. (2000). A review and
assessment of land-use change models: Dynamics of space, time, and
human choice. Paper presented in the Fourth International Conference on
Integrating GIS and Environmental Modeling (GIS/EM4), September 2–8,
Banff, Canada.
Agriculture in India Study report (2001).
http://www.indianchild.com/india_agriculture.htm
Ahern, F. J., Janetos, A. C., Langham, E. (1998). Global Observation of Forest
Cover: a CEOS’ Integrated Observing Strategy. Proceedings of 27th
International Symposium on Remote Sensing of Environment, T romsø,
Norway, June 8–12 1998 (Norway: International Symposium on Remote
Sensing of Environment), 103–105.
Ahmed, E. (1968). Distribution and causes of Gully Erosion in India – Paper
presented in the 21 st International Geographical Congress, New Delhi,
Section IV, Complex Physical Geography.
Aitkenhead, M.J., Aalders, I.H. (2011). Automating land cover mapping of
Scotland using expert system and knowledge integration methods.
Remote Sensing of Environment 115, 1285–1295.
Alcamo, J., ed. (1994). IMAGE 2.0: Integrated Modeling of Global Climate
Change. Kluwer Academic Publishers, Dordrecht, Germany.
Allen, J.R.L. (1978). Computational Methods for Dune Time Lag: Calculations
Using Stein’s Rule for Dune Height. Sedimentary Geology, Vol. 20, No. 1.

163
Alonso, D., Sole, R. V. (2000). The DivGame Simulator: A stochastic cellular
automata model of rainforest dynamics. Ecological Modelling 133 (1/2),
131-141.
Amarsaikhan, D., Ganzorig, M., Ache, P., & Blotevogel, H. (2007). The
integrated use of optical and InSAR data for urban land-cover mapping.
International Journal of Remote Sensing, 28, 1161−1171.
Anderson, James R. (1971). classification schemes used in selected recent
geographic applications of remote sensing: Photogramm.Eng., v. 37, no. 4,
379-387.
Anderson, M.G. and Burt, T.P. (1977). Automatic monitoring of soil moisture
conditions in a hill slope spur and hollow. J.Hydrol. 33, 27–36.
Anderson, M.G. and Burt, T.P. (1978). The role of topography in controlling
through flow generation. Earth Surf. Processes 3, 331–44.
Araus, JL., Slafer, G.A., Reynolds, M.P and Royo, C. (2002). Plant breeding and
drought in C3 cereals: what should we breed for? Ann. Bot. 89 (Spec. No.)
925-940.
Arogyaswamy, R.N.P. (1967). Geomorphological features of the Nilgiri
mountains, Proc, Geom, Stud, Ind., 78 – 88.
Auden, J.B. (1954). Erosional pattern and fracture Zones in Penisular India,
Geol. Magazine, Vol. 35 (3), 264 – 275.
Babar, Md. (1998). Geomorphic analysis of Purna river basin in Parbhani
district (Maharashtra) India. Indian Journal of Geomorphology 3(1), 29 –
39.
Babar, Md .(2002a). Hydrogeomorphological mapping for groundwater resource
development in the northern part of Parbhani District (Maharashtra)
using IRS 1B, LISS II Geocoded data. In proceeding volume of National
Conference on GIS and Their Application in Civil Engineering during
February 14 – 16, 2002 at Deccan College of Engineering and
Technology, Hyderabad, 75 – 83.
Babar, Md. (2002b). Application of Remote Sensing in Hydrogeomorphological
Studies of Purna River Basin in Parbhani District, Maharashtra, India. In
proceeding volume of the international symposium of ISPRS Commission

164
VII on Resource and Enviromental Monitoring held during December 3 – 6,
2002, 34 (7). 519 – 523.
Babar, Md. (2001). Hydrogeomorphological studies by remote sensing
application in Akoli Watershed (Jintur), Parbhani Dist., Maharashtra,
India. In Spatial Information Technology: Remote Sensing and GIS.
ICORG edited by I.V. Murali Krishna, 2. pp. 137 – 143.
Bagchi, K, (1960). Drainage pattern in Ganga delta, Geog. Rev. of India, Vol.
22(4), 51 – 53.
Baker, W. L. (1989). A review of models in landscape change. Landscape
Ecology 2 (2), 111-133.
Bakr, N., Weindorf, D. C., Bahnassy, M. H., Marei, S. M., & El-Badawi, M. M.
(2010). Monitoring land cover changes in a newly reclaimed area of Egypt
using multitemporal Landsat data. Applied Geography, 30(4), 592e605.
Balasundaram, M.S. (1977). Contribution to geomorphology and geohydrology of
the Brahmaputra Valley. Geological Survey of India Misc. publication,
No.12.
Balling, R. J., Taber. J. T, Brown, M and Day, K. (1999). Multiobjective urban
planning using a genetic algorithm. ASCE Journal of Urban Planning and
Development 125 (2), 86-99.
Baltsavias, E. P., Stallmann, D. (1992). From Satellite Images to GIS with
Digital Photogrammetry Using SPOT Data. In Proc. of EGIS 92, 23.-26.
March, Munich, Germany, Vol. 2, 945 - 946.
Balzter, H., Braun, P. W and Kohler, W. (1998). Cellular automata models for
vegetation dynamics. Ecological Modelling 107 (2/3), 113-125.
Bandhopadhyay, M.K. (1972). Geomorphic Characteristics of Southern Part of
Khasi Hills, Geographical Review of India, Vol. 34, Pt, 2, 184 – 189.
Batisani, N., & Yarnal, B. (2009). Urban expansion in Centre County,
Pennsylvania: spatial dynamics and landscape transformations. Applied
Geography, 29(2), 235e249.
Baulig, H. (1959). Morphombtrie. Ann. Glogr., 68(369), 386 - 408.
Best, J.L. (1986). The morphology of river channel confluences. Prog.Phys.Geog.
10, 157–74.
165
Bhattacharya, G. (1996). Remote sensing for geological, geomorphological and
ground water studies, 16 th Indian Geography Congress, 181 – 303.
Bishop, M.P. and Shroder, J.F. (2000). Remote sensing and geomorphometric
assessment of topographic complexity and erosion dynamics in the
Nanga Parbat massif. In: Khan, M.A., Treloar, P.J., Searle, M.P. and Jan,
M.Q. (Eds.), Tectonics of the Nanga Parbat Syntaxis and the Western
Himalaya (Geological Society London, Special Publications, 170), London,
181-199.
Bishop, M.P., Bonk, R., Kamp, U and Shroder, J.F. (2001). Topographic
analysis and modeling for alpine glacier mapping. Polar Geography, 25:
182-201.
Blarzcsynski. (1997). Landforms Characterization with Geographic Information
Systems. PE & RS, 63 (2), 183 – 193.
Bloschl, G and Sivapalan, M. (1995). Scale issues in hydrological modeling: a
review. In Kalma, J.D. and Sivapalan, M., editors, Scale issues in
hydrological modeling, 9 -47. Wiley.
Bork, E. W., & Su, J. G. (2007). Integrating LIDAR data and multispectral
imagery for enhanced classification of rangeland vegetation: A meta
analysis. Remote Sensing of Environment, 111(1), 11−24.
Bose, S.C. (1961). Some Preliminary Observations on the Geomorphology of the
Lower Luni Basin, Geographical Review of India, 23 No.4.
Boyer, J.S. (1982). Plant productivity and environment. Science 218, 443-448.
Briassoulis, H. (1999). Analysis of Change: Theoretical and Modeling
Approaches. Regional Research Institute, West Virginia University.
Bucha, T., & Stibig, H. J. (2008). Analysis of MODIS imagery for detection of
clear cuts in the boreal forest in north-west Russa. Remote Sensing of
Environment, 112, 2416–2429.
Burgess, D. W., Pairman, D. (1997). Bidirectional reflectance effects in NOAA
AVHRR data. International Journal of Remote Sensing, 18, 2815-2825.
Cecchini, A., Viola, F. (1990). Eine Stadtbausimulation. Wissenschaftliche
Zeitschrift der Hocheschule fur Architektur und Bauwesen 36, 159-162.
Chakraborty, S.C. (1970). Some Consideration on the Evolution of physiography
of Bengal, Ed. By Cgatterji, Gupta& Mukhopadhyay, Calcutta.

166
Chatterjee, S.P. (1945). Land utilization in the District of 24 Parganas, Bengal.
Bengal. B.C.Law vol., part 2, Calcutta.
Chatterjee, S.P. (1952). Land utilization survey of Howrah District, Geographical
Review of India, vol. XIV, No.3.
Chatterjee. S., Dey. M., Prakasam, C and Biswas, B. (2011).Changing Spatial
Pattern of Woman Work Participation in Burdwan Municipality. Paper
presented at the National Seminar on Geography: Space, Time & People.
Anthropological Survey of India, Kolkata.
Chatterjee, S., Dey, M., Prakasam, C and Biswas, B. (2010). Socio-Economic
Implications of Arsenic Toxicity in Purbasthali I & II Block of Burdwan
District. Jornal of Environment and Ecology.Vol -28 (4A).
Chatterjee, S., Prakasam, C and Biswas, B. (2011).Assessment of and Land
cover Changes through Satellite remote sensing: A case study of
Purbasthali-I&II blocks, Burdwan District, West Bengal, India. Paper
presented at the UGC Sponsored National Seminar on Sustainable
Development: An Interdisciplinary Approach. Sarsuna College, Kolkata.
Chatterji, S.C. (1945). Some Aspects of geomorphology of the Ranch Plateau,
Cal. Geog. Rev., Vol. VII.
Chatterji, S.C. (1946). Phsiographic Evolution of Chotanagpur, Cal. Geog. Rev.,
Vol. VII, No.3&4.
Chattopadhyay, S., Chattopadhyay, Mahamaya. (1998). Principles and methods
for terrain analysis: A pilot study of Kerala In : Research Methodology,
Social, Spatial and Policy Dimensions, (eds, Misra, H.N. and Singh. V.P),
Rawat Publ, New Delhi.
Chen X., Vierling, L., Deering, D. (2005). A simple and effective radiometric
correction method to improve landscape change detection across sensors
and across time. Remote Sensing of Environment 98, 63–79.
Chibber, H.L. (1953). The landforms life and radial drainage of Mount
Parasnath, Hazaribagh district, Nat, Geo. Soc. Ind. Bull., No. 18.
Chomitz, K. M., and Gray, D. A. (1996). Roads, , and deforestation: A spatial
model applied to Belize. The World Bank Economic Review 10 (3), 487-
512.

167
Chorley, R.J., Dale, P.F. (1972). Cartographic problems in stream channel
delineation, Cartography 7, 150–162.
Chorley, R.J. (1962). Geomorphology and general system theory. U.S. Geol.
Survey. Prof. Paper 500-B.
Chorley, R.J. (1967). Models in Geomorphology, in R.J. Chorley, et.al (eds)
Models in Geography.
Chorley, R.J. (1969). The drainage basin as the fundamental geomorphic unit. In
Water, earth and man, R.J. Chorley (ed.), 77–100. London: Methuen.
Chorley, R.J. (1972). Spatial Analysis in Geomorphology. Methuen a Co. London.
Choubey, V.D. (1966). The Geological Structure and Geomorphology of the
Country Around Katangi, Jabalpur district, unpublished Ph.D. Thesis of
University of Saugar, Saugar.
Choubey, V.D. (1967). A Study of Erosion Surface of Saugar, Damoh, Jabalpur
and Narsinghpur districts of Madhya Pradesh. Geomorphological studies
in Indian. Proceedings of Advanced Research Centre, Department of
Applied Geology, University of Saugar, 164-171.
Chuvieco, E. (1993). Integration of linear programming and GIS for land-use
modeling. International Journal of Geographical Information Systems 7 (1),
71-83.
Cihlar, J. (2000). 'Land cover mapping of large areas from satellites: Status and
research priorities’, International Journal of Remote Sensing, 21: 6, 1093
— 1114
Cihlar, J., Xiao, Q., Beaubien, J., Fung, K., and Latifovic, R., (1998).
Classification by Progressive Generalization: a new automated
methodology for remote sensing multichannel data. International Journal
of Remote Sensing, 19, 2685–2704.
Coppin, P., Jonckheere, I., Nackaerts, K., Muys, B., & Lambin, E. (2004). Digital
change detection methods in ecosystem monitoring: a review.
International Journal of Remote Sensing, 25(9), 1565e1596.
Costanza, R., Sklar, F. H and Day, J. W. Jr. (1986). Modeling spatial and
temporal succession in the Atchafalaya/Terrebonne Marsh/estuarine
complex in South Louisiana. Pages 387-404 in D. A. Wolfe, ed. Estuarine
Variability. Academic Press, Orlando, FL.
168
Couclelis, H. (1985). Cellular worlds: A framework for modeling micro-macro
dynamics. Environment and Planning 17, 585-596.
Crews-Meyer, K. A. (2004). Agricultural landscape change and stability in
northeast Thailand: Historical patch-level analysis. Agriculture,
Ecosystems & Environment, 101, 155–169.
Cromley, R. G., Hanink, D. M. (1999). Coupling land-use allocation models with
raster GIS. Journal of Geographic Systems 1, 137-153.
Daji, J. A., Kadam, J. R and Patil, N. D. (2001). A Textbook of Soil Science.
Media Promoters & Publishers Pvt. Ltd. Bombay.
Das, K.N. and Pandey, I.C. (1964). Some Aspects of the Geomorphology of the
Chamkhutia Area, U.P., The National Geographical Journal of India, Vol,
X, 177-184.
Das, T. (2009). /land cover change detection: an object oriented approach.
Institute of Geoinformatics, University of Münster.
Davis, W. M. (1899). The geology cycle. Geog. Jour, 14, 41 - 58.
Davis, W.M. (1915). Biographical memoir of John Wesley Powell, Nat. Acad. Sci.,
Mem., 11 – 83.
Dayal, P. (1947). The Agricultural Geography of Bhihar, London, Ph.D, Thesis
(unpublished).
De, Boissezon, H., Gonzales, G., Pus, B., and Sharman, M. (1993). Rapid
estimation of crop acreage and production at a European scale using
high resolution imagery operational review. Proceedings of the
International Symposium ‘Operationalization of Remote Sensing’, ITC
Enschede, The Netherlands, 94–105.
De, Ploey, J. (1971). Liquefaction and rainwash erosion. Z. Geomorphol. NF 15,
491–6.
Debi, P. (1965). Orign of Chotanagour Scarps, Geog. Outlook, Vol.4, Ranchi.
Dent, D., Young A. (1981). Soil Survey and Land Evaluation. George Alien and
Unwin Ltd., London, UK.
Desai, S.D. (1968). Terrain Evaluation – Principles and Techniques, The
National Geographical Journal of India, Varanasi, Vol. XIV, pt,4, 258-264.
Deshmukh, V.M. (1975). Lonkhede: A study in rural , The Ocean Geographer,
vol.XIII, Nos.1 and 2.

169
Devi, H. I. (2000). River Basin Morphology, Rajesh Publishions, New Delhi.
Dewan, A. M., & Yamaguchi, Y. (2009). and land cover change in Greater
Dhaka, Bangladesh: using remote sensing to promote sustainable
urbanization. Applied Geography, 29(3), 390e401.
Dey, M., Chatterjee, S., Prakasam, C., Biswas, B. (2011). Spatio-Temporal
Dimensions of Land Cover Change Analysis Through RS & GIS
Technology In Part Of Eastern Burdwan District, West Bengal, India. Paper
presented at the National Association of Geographers, India (NAGI), 33rd
Indian Geography Congress. The University of Burdwan, Burdwan.
Dey, M., Chatterjee, S., Prakasam, C. (2010). Changing Spatial Pattern of
Woman Work Participation in Burdwan Munucipality. Journal of Indian
Geographical Foundation, Vol – 14, No -2.
Dickinson, R.E., Henderson-Sellers, A., Kennedy, P.J., Wilson, M.F. (1986).
Biosphere-Atmosphere Transfer Scheme (BATS) for the NCAR Community
Climate Model. NCAR Technical Note NCAR/TN-2751STR, 69. Boulder,
CO.
Dikau, R., Brabb, E.E., Mark, R.K., Pike, R.J. (1995). Morphometric landform
analysis of New Mexico. Zeitschrift für Geomorphologie, N.F., Suppl.-Bd.,
101, 109-126.
Dirk, Bryant., Daniel, Nielsen., Laura, Tangley., The Last Frontier Forests:
Ecosystems and Economies on the Edge (World Resources Institute,
Washington, D.C., 1997), 1.
Drummond, R.R. (1974). When is a stream a stream? Professional Geographer
26, 34–37.
Dunn, J.A. (1929). The geology of north Singbhum including parts of Ranchi
and Manbhum districts, Mem, Geological Survey of India, Vol. 54, pp.
132.
Dunn, J.A. (1939). Post Mesozic Movements in the Northern part of the
Peninsula, Memoirs of the G.S.I., Vol. 73.
Dutt, G.K. (1970). Geomorphology – Techniques and Applications, Geographical
Review of India. Calcutta, Vol. 32, No.2, 133 – 124.
Eastman, R. (1999). Guide to GIS and Image Processing. Clark University,
Worcester, MA.

170
Ehlers, M., Jadkowski, M. A., Howard, R. R., And Brousten, D. E., (1990).
Application of SPOT data for regional growth analysis and local planning.
Photogrametric Engineering and Remote Sensing, 56, 175-180.
Environment Agency. (2007). Inter-laboratory comparison of in vitro
bioaccessibility measurements for arsenic lead and nickel in soil, Science
Report SC040060/SR2. Bristol: Environment Agency. (PDF, 816KB).
EPA, U.S. (2000). Projecting Land-Use Change: A Summary of Models for
Assessing the Effects of Community Growth and Change on Land-Use
Patterns, EPA/600/R-00/098. U.S. Environmental Protection Agency,
Office of Research and Development, Cincinnati, OH. [This introduces
urban models for the view point of environmental assessment].
Ermentrout, G. B., Edelstein-Keshet, L. (1993). Cellular automata approach to
biological modeling. Journal of Theoretical Biology 160 (1), 97-113.
Farr, T.G., Kobrick, M. (2000). Shuttle radar topography mission produces a
wealth of data. American Geophys. Union, EOS, v.81, 583-585.
Feder, J. (1988). Fractals. New York: Plenum Press, 11.
Feddema, ohannes, J.J., Oleson, Keith W., Bonan, Gordon. B. Mearns, Linda O.
Buja., Lawrence, E., Meehl, Gerald, A., Washington, Warren. M. (2005).
The importance of land-cover change in simulating future climates,
Science 310, 1674-1678.
Fenneman, N.M. (1914). Physiographic boundaries within the United States,
Ann, Ass, Amer. Geog., 4, 84- 134.
Foody, G. M., Green, R.M. Lucas, R.M. Curran, P.J. Honzak, M. Amaral .& I.
Do. (1997). Observations on the relationship between SIR-C radar
backscatter and the biomass of regenerating tropical forest. International
Journal of Remote Sensing 18, 687-694.
Foody, G.M. (1998). Sharpening fuzzy classification output to refine the
representation of sub-pixel land cover distribution. Internat. J. Rem.
Sens. 19(13), 2593–2599.
Foody, P. M. (2002). Status of land covers classification accuracy assessment.
Remote Sensing of Environment, 80, 185– 201.
Fox, C.S. (1930). The Jharia Coalfield, Mem. Geol. Surv. Of India, Vol.56.

171
Fox, C.S. (1931). The Gondwana System and related Formations, Mem. Geol.
Surv. Of India, Vol. 58.
Fox, C.S. (1934). The lower Gondwana Coalfields of India, Mem. Geol. Surv. Of
India, Vol.59.
Friedkin, J.F. (1945). A laboratory study of the meandering of alluvial rivers. US
Waterways Exp. St.
Friedl, M. A., McIver, D. K., Hodges, J. C. F., Zhang, X. Y., Muchoney, D.,
Strahler, A. H., Woodcock, C. E., Gopal, S., Schneider, A., Cooper, A.,
Baccini, A., Gao, F., & Schaaf, C. (2002). Global land cover mapping from
MODIS: Algorithms and early results. Remote Sensing of Environment, 83,
287−302.
Gao, J., Liu, Y. (2010). Mapping of land degradation from space: A comparative
study of Landsat ETM+ and ASTER data. International Journal of Remote
Sensing 29 (14), 4029–4043.
Garde, R.J. (2005). River Morphology, New Age International (P) Limited,
Publishers, New Delhi.
Gardiner, V. (1976). Land evaluation and the numerical delimitation of natural
regions. Geographia Polonica, v34.
GCOS, (1997). GCOS/GTOS plan for terrestrial climate-related observations.
Report GCOS- 32, WMO/TD-No. 796, World Meteorological Organization.
Gee, E.R. (1932). Geology and Coal Resources of Raniganj Coalfield, Mem G.S.I.,
Vol. XI.
Geoghegan, J., Pritchard, Y., Ogneva-Himmelberger, R., Roy, Chowdury.,
Sanderson, S. and Turner, B. L., II. (1998). "Socializing the pixel" and
"pixelizing the social" in /cover change. Pages 51-69 in D. Liverman, E. F.
Moran, R. R. Rindfuss, and P. C. Stern, eds. People and Pixels. National
Research Council, Washington, DC.
Geoghegan, J., Wainger, L., Bockstael, N. (1997). Spatial landscape indices in a
Hedonic framework: An ecological economics analysis using GIS.
Ecological Economics 23, 251-264.
Gilbert, G.K. (1914). The transportation of debris by running water. US Geol.
Surv.Prof. Paper no. 86.

172
Gilbert, N., Troitzsch, K. G. (1999). Simulation for the Social Scientist. Open
University Press, London, UK.
Giles, P.T. (1998). Geomorphological signatures: classification of aggregated
slope unit objects from digital elevation and remote sensing data. Earth
Surface Processes and Landforms, 23, 581-594.
Gilruth, P. T., Marsh, S. E and Itami, R. (1995). A dynamic spatial model of
shifting cultivation in the highlands of Guinea, West Africa. Ecological
Modelling 79, 179-197.
Gong, P., Marceau, D. J., Howarth, P. J. (1992). A comparison of spatial feature
extraction algorithms for land-use classi. cation with SPOT HRV data.
Remote Sensing of Environment, 40, 137–151.
Gordon, J and Shortliffe, E. (1984). The Dempster-Shafer theory of evidence:
Rule based expert systems. Pages 272-292 in B. Buchanan and E.
Shortliffe, eds. The MYCIN Experience of the Stanford Heuristic
Programming Project. Addison Wesley, Reading, MA.
Goudie, A.S. (2004). Encyclopedia of Geomorphology, vols. 1 & 2. Routledge,
London, 1184.
Goudie, Andrew., Lewin, John., Richards, Keith., Anderson, Malcolm., Burt,
Tim., Whalley, Brian and Worsley, Peter. (1990). Geomorphological
Techniques, Unwin Hyman, New York, 14.
Greenwood, G. (1857). Rain and River on Hutton and Playfair against Lyell and
all comers, 1st ed., London.
Gregory, K.J. (1976). Drainage basin adjustments and man, Geographica
polonica V. 34.
Gregory, K.J. and Walling, D.E. (1973). Drainage Basin Form and Processes.
Edward Arnold Scrap Processors Inc., London.
Grigg, David. (1995). An Introduction to agricultural geography. Routledge, New
York.
Grohmann, C.H. (2004). Morphometric analysis in geographic information
systems: applications of free software GRASS and R. Computers and
GeoSciences, v.30, 1055-1067.

173
Grohmann, C.H., Riccomini, C and ALVES, F.M. (2007). SRTM –based
morphotectonic analysis of the Pocos de caldas alkaline massif
Southeastern Brazil. Computers & GeoSciences, v.33, 10-19.
Gronewold, A and Sonnenschein, M. (1998). Event-based modelling of
ecological systems with asynchronous cellular automata. Ecological
Modelling 108 (1), 37-52.
Gugan, D.G., Dowman, I.J. (1988). Accuracy and Completeness of Topographic
Mapping from SPOT Imagery. Photogrammetric Record, 12 (72), 787-796.
Gupta, S.N.P. (2004). Geomorphology of Damodar Basin, Rajesh Publications,
New Delhi.
Hack, J. T. (1957). Studies of longitudinal stream profiles in Virginia and
Maryland. US.Geol. Surv., Prof. Pap., 294B, 45-97.
Hall, C. A. S., Tian, H., Pontius, Y. Qi, G and Cornell, J. (1995). Modelling
spatial and temporal patterns of tropical change. Journal of
Biogeography 22 (4/5), 753-757.
Hansen, M. C., DeFries, R. S., Townshend, J. R. G and Sohlberg, R. (2000).
Global land cover classi. cation at 1 km spatial resolution using a classi.
cation tree approach. International Journal of Remote Sensing, 21, 1331–
1364.
Hansen, M., Dubayah, R., & Defries, R. (1996). Classification trees: An
alternative to traditional land cover classifiers. International Journal of
Remote Sensing, 17, 1075–1081.
Hasan, Ozdemir., Deanne, Bird. (2009). Evaluation of morphometric parameters
of drainage networks derived from topographic maps and DEM in point
of floods. Environ Geol 56, 1405–1415. DOI 10.1007/s00254-008-1235-y.
Hegselmann, R. (1998). Modeling social dynamics by cellular automata. Pages
37-64 in W. B. G. Liebrand, A. Nowak, and R. Hegselmann, eds.
Computer Modeling of Social Processes. SAGE Publications, London.
Hettner, A. (1928). Surface features of the land, translated by Phillip Tilly
(1972), The Macmuillan Press, London, Vol. 29, 14 – 15.
Hironi, K. (1991). Land use Planning and Geomorphology: A Study of Sawal
Mandhopur, Concept Publishing Company, New Delhi.

174
Hogeweg, P. (1988). Cellular automata as a paradigm for ecological modelling.
Applied Mathematics and Computation 27 (1), 81-100.
Homer, C. G., Ramsey, R. D., Edwards, T. C. Jr and Falconer, A. (1997).
Landscape cover type modeling using a multi-scene Thematic Mapper
mosaic. Photogrammetric Engineering and Remote Sensing, 63, 59–67.
Horton, R.E. (1932). Drainage basin Characteristics, TransAm. Geophys, Union,
Vol. 13, 350 – 361.
Horton, R.E. (1945). Erosional development of streams and their drainage
basins: hydrophysical approach to quantitative morphology. Bull Geol Soc
Am 56, 275–370.
Houghton, R.A. (1999). The annual net flux of carbon to the atmosphere from
changes in 1850-1990, Tellus Series B-Chemical And Physical
Meteorology, 51, 298-313.
Houghton, R. A. (1994). The worldwide extent of land-use change. BioScience,
44, 305–313.
Howitt, R. E. (1995). Positive mathematical programming. American Journal of
Agricultural Economics 77 (2), 329-42.
Hunday, A. & Banerjee, S. (1967). Geology and Mineral Resources of West
Bengal, Mem. G.S.I., Vol.97.
Imbernon, J. (1999). Changes in agricultural practice and landscape over a 60-
year period in North Lampung, Sumatra. Agriculture, Ecosystems and
Environment, 76 (1), 61-66.
International Rice Research Institute, (1975).Major research in upland Rice,
Manila, Philippines.
IPCC. (2000). , Land-Use Change, and Forestry. A Special Report of the IPCC
[Watson, R.T., I.R. Noble, B. Bolin, N.H. Ravindranath, D.J. Verardo, and
D.J. Dokken (eds.)]. Cambridge University Press, Cambridge, United
Kingdom and New York, NY, USA, 377.
Jain, M.K., Kothyari, U.C. (2001) Estimation of soil erosion and sediment yield
using GIS. Hydrol Sci J 45 (5), 771–786.
Janetos, A.C and Justice, C.O. (2000). Land cover and global productivity: a
measurement strategy for the NASA programme, International Journal of
Remote Sensing, 21, 1491-1512.

175
Jensen, J.R. (1996). Introductory Digital Image Processing: A Remote Sensing
Perspective, 2nd edn. Prentice Hall: Upper Saddle River, NJ.
Jha, V.C. (1966). Himalayan Geomorphology, Rawat Publications, Jaipur and
New Delhi.
Johnson, W.H. (1982). Interrelationships among geomorphic interpretation of
the stratigraphic record, process geomorphology and geomorphic modele.
In C.E.Thorn (ed.) Space and Time in Geomorphology, George Allen &
Unwin, Lonon.
Jones, D.K.C. (1980). British applied geomorphology: an appraisal, zeitschrift
fur Geomorphologie, Supplement 36. 48-73.
Jongman, R. H., Bunce, R. G & Elena-Rossello, R. (1998). A European
perspective on the definition of landscape character and biodiversity. Key
concepts in landscape ecology. In J. W. Dover, & R. G. H. Bunce (Eds.),
Proceedings of the 1998 European congress of the International
Association Of Landscape Ecology (1–35). UK: IALE.
Kaimowitz, D and Angelsen, A. (1998). Economic Models of Tropical
Deforestation: A Review. Centre for International Forestry Research,
Jakarta, Indonesia.
Kale, V.S., Ely, L.L., Enzel, Y and Baker, V.R. (1994). Geomorphic and
hydrologic aspects of monsoon floods in Central India. Geomorphology,
10, 157 – 168.
Kartikeyan, B., Sarkar, A and Majumder, K. L. (1998). A segmentation approach
to classification of remote sensing imagery. International Journal of
Remote Sensing, 19, 1695–1709.
Kharkwal, S.C. (1970). Morphometric study of a Himalayan Basin – A Sample
Study, National Geographical Journal, India, Vol. 16, Pt. 1, 47- 60.
King, L.C. (1962). The Morphology of the Earth, Oliver&Boyd, Edinburgh,
London.
Krishanan, M.S. (1953). Structural and Tectonic History of India, Mem. G.S.I.,
Vol.81.
Krishanan, M.S. (1956). Geology of India & Burma, Higginbothams (Pvt.), Ltd.,
Madras.

176
Krzystek, P. (1995). New investigations into the practical performance of
automatic DEM generation. Proceedings, ACSM/ASPRS Annual
Convention, Charlotte, North Carolina, American Society for
Photogrammetry and Remote Sensing, 2, 488-500.
Kumar. K.V, Guha. A and Lesslie. A. (2009). Satellite-based geomorphological
mapping for urban planning and development – a case study for Korba
city, Chhattisgarh. Current Science, vol. 97, no. 12, 25 December.
Lambin, E. F. (1994). Modelling Deforestation Processes: A Review. European
Commission, Luxemburg.
Lambin, E. F. (1997). Modeling and Monitoring Land- Cover Change Processes
in Tropical Regions. Progress in Physical Geography 21, 375–93.
Lambin E.F., Geist H., Lepers, E. (2003). Dynamics of and cover change in
tropical regions. Annual Review of Environment and Resources 28, 205–
241.
Laney, R. M. (2004). A process-led approach to modelling land change in
agricultural landscapes: A case study from Madagascar. Agriculture,
Ecosystems & Environment, 101, 135–153.
Langbein, W.B. (1947). Topographic Characteristics drainage basins U.S.
Geological Survey Water Supply Paper, 968c, 125 – 157.
Lark, R. M. (1995). A reappraisal of unsupervised classification, II: optimal
adjustment of the map legend and a neighborhood approach for mapping
legend units. International Journal of Remote Sensing, 16, 1445–1460.
Lark, R. M. (1995a). A reappraisal of unsupervised classi. cation, I:
correspondence between spectral and conceptual classes.
InternationalJournal of Remote Sensing, 16, 1425–1423.
Lark, R. M. (1995b). A reappraisal of unsupervised classi. cation, II: optimal
adjustment of the map legend and a neighborhood approach for mapping
legend units. International Journal of Remote Sensing, 16, 1445–1460.
Lawrence, A.R. (1985). An interpretation of dug well performance using a digital
model. Ground water, 23(4). 449 – 454.
Lawrence, R., Hurst, R., Weaver, T., & Aspinall, R. (2006). Mapping prairie
pothole communities with multitemporal Ikonos satellite imagery.
Photogrammetric Engineering and Remote Sensing, 72, 169−174.

177
Lee, R. G., Flamm, M. G., Turner, C., Bledsoe, P., Chandler, C., DeFerrari, R.,
Gottfried, R. J., Naiman, N., Schumaker and Wear, D. (1992). Integrating
sustainable development and environmental vitality: A landscape ecology
approach. Pages 499-521 in R. J. Naiman, ed. Watershed Management:
Balancing sustainability and environmental change. Springer-Verlag,
New York.
Leggett, C. G., Bockstael, N. E. (2000). Evidence of the effects of water quality
on residential land prices. Journal of Environmental Economics and
Management 39, 121-144.
Leopold, B., Wolman. G and Miller, J. P. (1964). Fluvial Procrsses in
Geomorphology. Freeman, San Francisco, London.
Lewis, W.V. (1944). Stream trough experiments and terrace formation.
Geol.Mag. 81, 240–52.
Li, H and Reynolds, J. F. (1997). Modeling effects of spatial pattern, drought, and
grazing on rates of rangeland degradation: A combined Markov and
cellular automaton approach. Pages 211-230 in D. A. Quattrochi and M.
F. Goodchild, eds. Scale in Remote Sensing and GIS. Lewis Publishers,
New York.
Liu, J., Chen, J.M., Cihlar, J., Park, W.M. (1997). A processed-based boreal
ecosystem productivity simulator using remote sensing inputs. Remote
Sens. Environ. 62, 158-175.
Longley, Paul A., Batty, Michael. (eds.) (2003). “Advanced Spatial Analysis”.
Longley, P., Higgs, G and Martin, D. (1994). The predictive use of GIS to model
property valuations. International Journal of Geographical Information
Systems 8 (2), 217-235.
Long-qian, C., Li, W., & Lin-shan, Y. (2009). Analysis of urban landscape
pattern change in Yanzhou city based on TM/ETMþimages. Procedia:
Earth and Planetary Science, 1(1), 1191e1197.
Lu, D., Mausel, P., Brondizio, E., & Moran, E. (2004). Change detection
techniques. International Journal of Remote Sensing, 25(12), 2365e2407.
Lu, D., Mausel, P., Brondizio, E., Moran, E. (2004). Relationships between
forest stand parameters and Landsat TM spectral responses in the
Brazilian Amazon Basin. Forest Ecol. Manag. 198, 149–167.

178
Ludeke, A. K., Maggio, R. C and Reid, L. M. (1990). An analysis of
anthropogenic deforestation using logistic regression and GIS. Journal of
Environmental Management 31, 247-259.
Lyell, S.C. (1872). Principles of Geology, Appleton and Co. New York.
Mabbutt, J.A. (1968). Review of concepts of land classification of rivers and
lakes, In: Land evaluation Sewert, G.A, ed, Australia, Macmillan.
Mache, R.N and Peshwa, V.V. (1978). Photo – geological interpretation of the
control on drainage in Gondwana and Bijawars of Son valley, Shahdol
district, M.P., Procceedings of Symposium on Morphology and Evoluation
of Landforms, University of Delhi, pp – 250 – 254.
Macka, Z. (2001). Determination of texture of topography from large scale
contour maps. Geografski Vestnik 73(2), 53–62.
Mackin, J.M. (1936). The capture of the Greybull River. Am.J.Sci. 231, 373–85.
Maheshwari, R.C., Bohra, C.P., Singh, H.P., Singh, R. (1996). Planning for
sustainable agricultural development based on natural resources and bio-
energy systems. A case study In: Research in Geography, Land use
Changes and Sustainable Development, (ed. Singh, R.B.) APH Publishing
Corp, New Delhi.177 – 184.
Maidment, D.R. (2002). ArcHydro GIS for water resources. Esri Press, California.
Mandal, R.B. (1980). Models in land utilization. In: Recent Trends and Concepts
in Geography (eds. Mandal, R.B. & Sinha, V.N.P.) vol. 11,279 – 299.
Mandal, R.B. (1982). Land utilization: Theory and practice, Concept Publishing
Company, 341.
Mann, S., Benwell, G. (1996). The integration of ecological, neural, and spatial
modelling for monitoring and prediction for semi-arid landscapes.
Computers and Geosciences 22 (9), 1003-1012.
Mannan, B., Roy, J., RAY, A.K. (1998). Fuzzy ARTMAP supervised classification
of multi-spectral remotely-sensed images. Internat. J. Rem. Sens. 19(4),
767–774.
Mark, D.M. (1983). Relation between field-surveyed channel network and map-
based geomorphometric measures, Inez Kentucky. Ann Assoc Am
Geographers 73(3), 358–372.

179
Mas, J.F. (1999). Monitoring land-cover changes: a comparison of change
detection techniques. International Journal of Remote Sensing. 20 (1),
139-152.
Masek, J. G., Honzak, M., Goward, S. N., Liu, P., & Pak, E. (2001). Landsat-7
ETM+ as an observatory for land cover: Initial radiometric and geometric
comparisons with Landsat-5 Thematic Mapper. Remote Sensing of
Environment, 78, 118−130.
Maxwell, J. C. (1955). The bifurcation ratio in Horton’s law of stream number.
Trans. Am. Geophys. Union., 36 (Abstr.).
Maxwell, J. C. (1960). Quantitative geomorphology of the San Dimas
experimental forest, California. Off.N au. Res. (U.S.), Geogr. Branch,
Project 389-042, T e c h .Rep., 19.
Meijerink, A.M.J. (1988). Data acquisition and data capture through terrain
mapping units, ITC Jour. 1, ILWIS spl, issue.
Melton, M. A. (1958). Geometric properties of natural drainage systems and
their representation in an E, phase space. J. Geol., 66, 35-54.
Melton, M. A. (1960). Intravalley variation in slope angle related to microclimate
and erosional environment. Geol. SOC. Am., Bull., 71, 133-44.
Melton, M.A. (1957). An analysis of the relation among elements of climate,
surface properties and geomorphology. Off. Nav. Res. (US.), Geogr.
Branch, Project 389-042, Tech. Rep., 11.
Melton, R. A. (1958). Correlation structure of morphometric properties of
drainage systems and their controlling agents. J . Geol., 66, 442-60.
Merlin, P. (1965). A propos des methods de morphometry. Acia Geogr., 56, 14-
20.
Mertens, B & Lambin, E. F. (1997). Spatial modelling of deforestation in
southern Cameroon. Applied Geography, 17, 143–162.
Meyer, W. B., Turner, II. B. L. (1994). Global Land-Use/Land-Cover Change.
Cambridge University Press, New York.
Meyer, W.B. (1995). Past and Present Land-use and Land-cover in the U.S.A.
Consequences 1.
180
Meyer, W.B., Turner, B.L. II. (2002). The Earth transformed: Trends, trajectories
and patterns. In: Johnston RJ, Taylor PJ, Watts MJ (eds) Geographies of
global change: Remapping the world, 2nd ed. Blackwell, Oxford, 364–376.
Millaresis, G.C., Argialas, D.P. (2000). Extraction and delineation of alluvial
fans from digital elevation models and Landsat Thematic Mapper images.
Photogrammetric Engineering and Remote Sensing, 66, 1093-1101.
Mitchell, C.W. (1973). Terrain Evaluation. Longman, London, 221.
Mohammad, N. (1978). Agricultural in India, A Cast Study, Inter India
Publications, Delhi.
Mohammd, Hezam., Al-Mashreki., Juhari Bin Mat Akhir., Sahibin Abd Rahim.,
Kadderi Md. Desa., and Zulfahmi Ali Rahman. (2010). Remote Sensing
and GIS Application for Assessment of Land Suitability Potential for
Agriculture in the IBB Governorate, the Republic of Yemen. Pakistan
Journal of Biological Sciences, 13, 1116-1128.
Monkhouse. F.J., Wilkinson, H.R. (1994). Maps and Diagram, B.I. Publications
PVT Ltd, New Delhi.136 – 140.
Moore, I.D., Grayson, R.B., Ladson, A.R. (1991). Digital terrain modeling: a
review of hydrological, geomorphological and biological applications.
Hydrological Processes, 5(3), 3- 30.
Morisawa, M. E. (1957). Accuracy of determination of stream length from
topographic maps. J . Geol., 66.
Morisawa, M. E. (1958). Measurement of drainage-basin outline form. J . Geol.,
66, 587-91.
Morisawam, M. E. (1959). Relation of quantitative geomorphology to stream flow
in representative watersheds of the Appalachian Plateau Province. Off.
Nan. Res. (U. S.) Geogr. Branch, Project 389-042, Tech. Rep., 20.
Morisawa, M. E. (1962). Quantitative geomorphology of some watersheds in the
Appalachian Plateau. Geol. Soc. Am., Bull., 73(9), 1025-49.
Morisawa, M.E. (1967). Relation of discharge and stream length in the eastern
United States. Proc. I n f. Hydrol. Symp., Fort Collins, Co., 173-6.
Morisawa, M. E. (1968). Streams: Their Dynamics and Morphology. McGraw-Hill,
New York.

181
Moss, A.J., Walker, P.H. (1978). Particle transport by continental water flows in
relation to erosion, deposition, soils and human activities. Sedim.Geol.
20, 81–139.
Moss, M.R. (1981). A process approach to biophysical land classification: Some
application to peninsular Malaysia. In Carpenter, R.A. (ed). Assessing
Tropical Forest Lands, Tycooly International, Dublin.
Moss, M.R. (1983). Landscape synthesis, landscape processes and land
classification, some theoretical and methodological Issues, Geojournal, 7.
Mouflis, G.D., Gitas, I.Z., Iliadou, S., Mitri, G. (2008). Assessment of the visual
impact of marble quarry expansion (1984–2000) on the landscape of
Thasos Island, NE Greece. Landscape and Urban Planning 86, 92–102.
Mukerjee, A.B. (1975). Geomorphological study of Choe terraces of Chandigarh,
Siwalik Hills India, Himalayan Geology, Vol.5, 302 – 326.
Mukhopadhyay, S.C. (1969). Some aspects of Geomorphology of part of the
Subarnrekha Basin around Mahali Murup, Bihar, Geographical Review
of India, Vol, XXXI, No.2, 33- 40.
Mukhopadhyay, S.C. (1973). Geomorphology of the Subarnarekha basin with a
special reference to its cycle of erosion, Ph.D. thesis, Calcutta University,
Calcutta.
Mukhopadhyay, S.C. (1979). Some aspects of Geomorphology of part of the
Subarnrekha Basin around Mahali Murup, Bihar, Geographical Review
of India, Vol, XXXI, No.2, 33- 40.
Mukhopadhyay, S.C. (1984). The Thisa Basin – A Study in Fluvial
Geomorphology, K.P. Banchi&Co., Calcutta.
Munroe, D. K., Croissant, C., & York, A. M. (2005). policy and landscape
fragmentation in an urbanizing region: assessing the impact of zoning.
Applied Geography, 25(2), 121e141.
Munroe, D., Southworth, J., Tucker, C. (2001). The Dynamics of Land-Cover
Change in Western Honduras: Spatial Autocorrelation and Temporal
Variation. Paper presented in the American Agricultural Economics
Association Annual Meeting, August 5-8, Chicago, IL.
Munshower, F.F. (1994). Practical Handbook of Disturbed Land Revegetation.
Lewis Publishers, Boca Raton, Florida.

182
Myers, N. (1993). Tropical forests: the main deforestation fronts. Environmental
Conservation, 20, 9–16.
Nagendra, H., Munroe, D., Southworth, J. (2004). Introduction to the special
issue. From pattern to process: landscape fragmentation and the
analysis of /land cover change. Agriculture,Ecosystems and Environment
101 (2–3), 111–115.
Nagendra, H., Pareeth, S., Ghate, R. (2006). People within parks-forest villages,
land-cover change and landscape fragmentation in the Tadoba Andhari
Tiger Reserve, India. Applied Geography, 26(2), 96e112.
Nanavati, M.B. (1957). Readings in Land Utilization, The Indian Society of
Agricultural Economics, Bombay.
Nanshan, A.i. (1987). Entropy of erosive drainage system. Journal of
vmservation of Water a,ul Soil, (2). 9 -18. (in Chinese).
National Portal Content Management Team, Reviewed on: 29-04-2011
http://india.gov.in/sectors/agriculture/index.php
Nguyen, M. Q., Atkinson, P. M., Lewis, H. G. (2006). Super resolution mapping
using a Hopfield neural network with fused images. IEEE Transactions on
Geoscience and Remote Sensing, 44, 736−749.
Noble, C.A., Morgan, R.P.C. (1983). Rainfall interception and splash detachment
with a Brussels sprout plant: a laboratory simulation. Earth Surf.
Processes Landforms 8, 569–77.
NRSA. (1995). Integrated Mission for Sustainable Development Technical
Guidelines, National Remote Sensing Agency, Department of Space,
Government of India, Hyderabad.
Nunes, C., Auge, J. editors. (1999). Land-use and land-cover change (LUCC):
Implementation Strategy. IGBP Report 48 and IHDP Report 10.
Stockholm: IGBP Secretariat, Royal Swedish Academy of Science.
O’Callaghan J., Mark, D.M. (1984). The extraction of drainage networks from
digital elevation data. Comput Vis Graph Image Process 28, 323–344.
Oldham, R.D. (1893). A Manual of the Geology of India Chiefly compiled from
the observations of the Geological Survey 2nd edition revised and largely
rewritten by R. D. Oldham, 543. Calcutta.

183
Openshaw, S. (1995). Developing automated and smart spatial pattern
exploration tools for geographical information systems applications. The
Statistician 44 (1), 3–16.
Openshaw, S. (1994). Computational human geography: Towards a research
agenda. Environment and Planning A 26, 499–508.
O'Sullivan, D. (2001). Graph-cellular automata: a generalised discrete urban
and regional model. Environment and Planning B 28 (5), 687-706.
Padmaja, G. (1975). Some Aspects of Quantitative drainage characteristics of
the Dhund Basin. Geographical Review of India, Calcutta, Vol. 37, 158 –
164.
Pan, D., Domon, G., de Blis, S., Bouchard, A. (1999). Temporal (1958–1993)
and spatial patterns of changes in Haut-Saint-Laurent (Quebec, Canada)
and their relation to landscape physical attributes. Landscape Ecology,
14, 35–52.
Pande, R.K. (1990). Quantitative Geomorphology of A Himalayan Drainage Basin,
Shree Almora Book Depot, Almora.
Pascoe, E.H. (1950). A Manual of Geology of India and Burma, Third Edition,
Vol.1, G.S.I. Calcutta.
Pelorosso, R., Leone, A., Boccia, L. (2009). Land cover and change in the Italian
central Apennines: a comparison of assessment methods. Applied
Geography, 29(1), 35e48.
Penck, W. (1953). Morphological Analysis of Landforms, (First edition 1924),
Macmillan and Co., London.
Pielke, Sr. R.A. (2005). and climate change, Science 310, 1625-1626.
Pimentel D., Harvey, C., Resosudarmo, P., Sinclair, K., Kurz, D., McNair, M.,
Crist, S., Riebsame, W.E., Meyer, W.B., and Turner, B.L. II. (1998).
Modeling Land-use and Cover as Part of Global Environmental Change.
Climate Change. Vol. 28. 45.
Plantinga. (1999). Modeling Decisions with Aggregate Data. American Journal of
Agricultural Economics 81(February), 180-194.
Platagea, G.H., Popa, G. H. (1963). Variation of river network features between
the Ialomita and the Trotus rivers. Probl. Geogr. (Bucharest), 9,129-46 (in
Romanian).

184
Prakasam, C. (2011).Comparative Study of Drainage Morphometric Analysis
through Geospatial Technological Approach for Udaipur Water
Catchment, Udaipur, Rajasthan. Paper presented at the National Seminar
on Geography: Space, Time & People. Anthropological Survey of India,
Kolkata.
Prakasam, C., Biswas, B., Sandakumari, A. (2010). Land cover changes in
Theni District, Tamil Nadu, India, Using Remote Sensing and GIS. Paper
presented at the International Conference on Environment, Resource and
Regional Development. The University of Burdwan, Burdwan.
Prakasam, C. (2010). and Land Cover Change Detection through Remote
Sensing Approach: A Case Study of Kodaikanal Taluk, Tamil Nadu, India.
International Journal of Geomatices and Geosciences. Vol .1, No 2.
Prakasam, C., Biswas, B. (2009). Land cover change study in Ausgram I & II
Blocks, District Burdwan, West Bengal using Remote Sensing and GIS,
Indian Journal of Landscape Systems and Ecological Studies,Vol – 32, No
– 2.
Prakasam, C., Biswas, B. (2010). Evaluation of Geomorphic Resources: Past
and Present Studies - A Review, International Journal of Geomatices and
Geosciences Volume 1, No 4.
Prakasam, C., Thirumorthy, G., Biswas, B. (2010). Solid Waste Management in
Salem City, Tamil Nadu, Using GIS Techniques, Indian Journal of
Landscape Systems and Ecological Studies. Vol – 33, No – 1.
Prakasam, C., Biswas, B. (2010). Identifying the Surface Water Resource in
Ausgram Blocks I & II, Burdwan District, West Bengal, India, Based On
Morphometric Analysis, Using GIS. Journal of Water & Land-Use
Management, Vol- 10, No – 1
Prakasam. C., Kumar, K., Chatterjee, S. (2010). Tribal Area Development
Planning of Chintapalli Block, Visakhapatnam District, Andhra Pradesh,
India: Using GIS and Remote Sensing Approach. International Journal of
Geomatices and Geosciences. Vol .1, No 2, (2010).
Prakasam, C. (2010). Morphometric Analysis of the Perunchani Lake
Catchment Area Kanniyakumari district Tamil Nadu Using GIS. Journal
of Indian Geographical Foundation. 2010, Vol – 14, No -2.

185
Prakasam, C., Biswas, B. (2011). Using GIS Technology Classified the Water
Stressed zones based on Geomorphic Resources: A Case Study of
Ausgram Block, Burdwan District West Bengal. Paper presented at the
UGC Sponsored National Seminar on Emerging Trends in Geography,
Bankura Christian College, Bankura.
Prakasam, C., Biswas, B. (2011). Tribal area development planning Using GIS
techniques: A Case study of Ausgram Block, Burdwan District, West
Bengal. Paper presented at the Annual Workshop for the Junior Scientists
Meet. Netaji Institute for Asian Studies, Kolkata.
Prakasam, C., Biswas, B. (2011). Evaluation of Physical Resource Based, Using
Remote Sensing – GIS to Suggest Alternative Agricultural Practices to
some Backward Villages in Ausgram Block, Burdwan District, West
Bengal, India. Paper presented at the National Association of
Geographers, India (NAGI), 33rd Indian Geography Congress. The
University of Burdwan, Burdwan.
Prakasam, C., Biswas, B. (2011).Identification and Zonation of water stressed
region of Ausgram I and II Blocks of Burdwan District, West Bengal,
India: A Geospatial approach. Paper presented at the 24th Indian
Institute of Geomorphologists (IGI) National Conference and Annual
Convention on Costal Dynamics and Geomorphology. Anna University,
Chennai.
Prakasam, C., Biswas, B. (2011). Seasonal Land cover Planning for Ausgram
Block, Burdwan District, West Bengal, India: A Geospatial Technological
Approach. Paper presented at the UGC Sponsored National Seminar on
Sustainable Development: An Interdisciplinary Approach. Sarsuna College,
Kolkata.
Prasad, A. (1965). The Physical Landscape of Chotanagpur: A Study in Regional
Physiography, Geog. Outlook, Vol. IV, Ranchi.
Prasad, N. (1971). Geomorphology in Chotanagpur, Geography of Chotanagpur
(Bihar), Dept of Geography, Ranchi University.
Prasad, N. (1973). Geomorphic Sub-Regions of the Barakar Basin, Indian
Geographical Studies Res. Bull. No.1, Sept, Patna.

186
Prasad, N. (1973). Surajkund, the Hottest Spring of Bihar, The Bihar
Information, Patna, March.
Prasad, N. (1974). The Significance of Tectonic History and Climatic changes in
Geomorphic Interpretation, Indian Geog. Studies, Res. Bull, No.2, Patna,
March.
Prasad, N. (1977). Stream Order Analyses of the Barakar Basin, Indian Geog,
Studies, Res. Bull. No.9, Patna, September.
Prasad, N. (1979). Hydrographic Network and Drainage Basin Analysis : A Case
Study of the Barakar Basin, Geog. Rev. of India, Vol. 41, Calcutta, (Dec.).
Prasad, N. (1985). Determination of Stage of Land Scape Evolution through
Relief Mesures, Facets of Geomorphology, Ed. By Kumar, A., Thinker
Library 1 & C, Sarojini Naidu Marg, Allahabad.
Prasad, N., Rumki, S. (2011). Terrain Evaluation - A Review. International
Journal of Current Research, Vol. 3, Issue, 7, .296-301.
Prinz, D. (1996). Water Harvesting - History, Techniques and Trends, Z. f.
Bewässerungs wirtschaft 31, 1, 64 - 105.
Prinz, D. (1995). Water Harvesting in the Mediterranean Environment - Its Past
Role and Future Prospects. In: Tsiourtis, N.X. (ed.) Water Resources
Management under Drought or Water Shortage Conditions. Proceedings,
EWRA 1995 Symposium 14-18 March 1995, Nicosia, Cyprus, pp. 135-
144. Balkema, Rotterdam
Radhakrishnan, B.P. (1952). The Mysore plateau, its structural and
physiographical evaluation, Bull. Mysore Geologist Assn, Vol. 3, 57.
Raj, R.K. (1980). Geomorphology of the Sonar Berma Basin, M.P. Concept
Publishing Company, New Delhi.
Raj, R.K. (1971). Geomorphology of the Sonar – Berma Basin, Ph.D. thesis,
University of Sagar, M.P. (Published in 1980).
Rao, V.L.S.P. (1947). Soil survey and analysis, Indian Jour., vol.XXII, No.3.
Rastogi, R.A., Sharma, T.C. (1976). Quantitative analysis of drainage basin
characteristics. Jour. Soil and water Conservation in India, v.26 (1&4), 18-
25.

187
Rinaldo A., Rodrı´guez-Iturbe. I., Rigon, R. (1998). Channel networks. In:
Jeanloz R, Albee AL, Burke KC (eds) Annual review of earth and planetary
sciences, vol 26. Annual Reviews, Palo Alto, 289–327.
Rivera, V. O. (2005). Hyperspectral change detection using temporal Principal
component analysis. Spain: University of Puerto Rico.
Rodell, Matthew., Velicogna, Isabella., Famiglietti, James S. (2009). Satellite-
based estimates of groundwater depletion in India. NATURE| Vol 460|20,
999-1003. doi:10.1038/nature08238.
Rodriguez-Iturbe, I., Valdes, J.B. (1979). The geomorphologic structure of
hydrologic response. Water Resources Research, 15(6). 1409-1420.
Rogan, J., Miller, J., Stow, D., Franklin, J., Levien, L., Fischer, C. (2003). Land-
cover change monitoring with classification trees using Landsat TM and
ancillary data. Photogrammetric Engineering and Remote Sensing, 69,
793–804.
Roohani, M.S., Gupta, R.P. (1988). Quantative Hydromorphic investigation in
the Chenab catchment, Himalayas, Hydrology Journal of IAH vol.XI, No 4.
Roy, B.K. (1968). Mesurement of rural in Azarngarh, Middle Ganga Valley, The
geographer, Spl. No., , vol.XV.
Rudraiah, M., Govindaiah, S., Vittala, S.S. (2008). Morphometry using Remote
Sensing and GIS Techniques in the Sub-Basins of Kagna River Basin,
Gulburga District, Karnataka, India. Journal of Indian Society of Remote
Sensing. 36. 351 – 360.
Satpathi, D.D.P. (1970). A Broad Outline of Geomorphology of Singhbhum,
India, Symposium on Erosion Surface, 21st Inter – Geog. Cong. Ahmad &
Dasgupta (eds).
Satpathi, D.D.P. (1972). Quantitative Analysis of Landforms a case study of the
Deo River Basin, Singhbhum, Geog. Outlook, Vol.9, Ranchi.
Satpathi, D.D.P. (1975). Landscape Cycles of Singhbhum, Geog. Outlook, Vol.
XI, Ranchi.
Savigear, R.A.G. (1965). A technique of morphological mapping, Ann. Ass. Amer.
Geog., 55, 514 – 518.

188
Schulz, J. J., Cayuela, L., Echeverria, C., Salas, J., Rey Benayas, J. M. (2010).
Monitoring land cover change of the dryland forest landscape of Central
Chile (1975e2008). Applied Geography, 30(3), 436e447.
Schumm, S.A. (1956). The evolution of drainage systems and slopes in
Badlands at Preth Amboy, New Jersey. Geol Soc Am Bull 67, 597–646.
Schumm, A.A. (1977). The Fluvial system, John Wiley, New York.
Schumm, S.A., Mosley, N.P., Weaver, W.E. (1987). Experimental Fluvial
Geomorphology. A Wiley Inter- Science Publication. John Wiley and Sons,
New York, U.S.A., 2nd Edition.
Schumm, S.A., Khan, H.R. (1971). Experimental study of channel patterns.
Nature 233, 407–9.
Schumm, S. A. (1979). Geomorphic thresholds: the concept and its application.
Trans. Inst. Br. Geogr. (New Ser.), 4(4).
Sellers, P.J., Berry, J.A., Collatz, G.J., Field, C.B., Hall, F.G. (1994). Canopy
reflectance, photosynthesis, and transpiration. III. A reanalysis using
enzyme kinetics- electron transfer models of leaf physiology. Remote
Sensing of the Environment, 42, 1–20.
Sen, P. K. (1993). Geomorphological Analysis of Drainage Basins (An
Introduction to Morphometry and Hydrological Parameters), The
University of Burdwan, Burdwan.
Sen, A.K. (1965). Mapping of Micro-Geomorphic Units of Siwana Area, Western
Rajasthan, Journal Geological Society of India Vol. 12, No.2. 189-191.
Sengupta, S. (2006). ‘In India, water crisis means foul sludge’, New York Times,
29 September.
Sengupta, S. (1972). Geographical Framework of the Bhagirathi-Hooghly Basin
Proceeding of the Interdesciplinery Symposium, Calcutta University.
Serneels, S., Lambin, E. F. (2001). Proximate causes of land-use change in
Narok District, Kenya: A spatial statistical model. Agriculture, Ecosystems
& Environment, 85, 65–81.
Serra, P., Pons, X., Saurí, D. (2008). Land-cover and land-use change in a
Mediterranean landscape: a spatial analysis of driving forces integrating
biophysical and human factors. Applied Geography, 28, 189–209.

189
Sharma, H.S. (1969). Physiography of the Lower Chambal Valley and its
Agricultural Development, Ph.D. Thesis, published in 1980, Concept, New
Delhi, 1-128.
Sharma, H.S. (1970). Micro-geomorphic Regions of Lower Chambal Valley,
Indian Geographical Journal, Madras, Vol.45, 1-44.
Sharma, H.S. (1981). Perspectives in Geomorphology, 4 Vols. Edited, Concept
Pub, Co. New Delhi.
Sharma, J. N., Jugran, D.K. (1992). Hydrogeomorphological Studies around
Pinjaur-Morni-Kala Amb Area, Ambala District (Hariyana) and Sirmour
District (Himachala Pradesh). Photonirvachaak, Journal of Indian Society
of Remote Sensing, 20(4).187 – 197.
Sharma, J.N., Amin, N. (1996). A morphometric study of the Dikhou river basin,
India. Indian Journal of Geomorphology, 1(2), 207 – 224.
Sherbinin, Alex de. (2002). Land-Use and Land-Cover Change, A CIESIN
Thematic Guide. Center for International Earth Science Information
Network (CIESIN) of Columbia University, Palisades, NY, USA.
Shreve, R.L (1966). Statistical law of stream numbers. J Geol 74, 17–37.
Shrever, R. L. (1969). Stream lengths and basin area in topological random
channel networks. J. Geol., 77(4).
Shrever, R. L. (1966). Statistical law of stream numbers. J. Geol., 74(1), 17-37.
Shrever, R. L. (1967). Infinite topologically random channel networks. J. Geol.,
73(2), 178-186.
Shrivastava, Ashok. K., Srivastava, Arun. K., Solomon, Sushil. (2011).
Sustaining sugarcane productivity under depleting water resources.
Current science, vol. 101, no. 6, 25.
Silvertown, J., Holtier, S., Johnson, J., Dale, P. (1992). Cellular automaton
models of interspecific competition for space: The effect of pattern on
process. Journal of Ecology 80 (3), 527-534.
Singh, Savindra. (1980). Estimation of drainage density. National Geographer,
16 (2), 81 – 89.
Singh, A. (1989). Digital Change Detection Techniques Using Remotely Sensed
Data. International Journal of Remote Sensing. Vol. 10, No. 6, 989-1003.

190
Singh, A. (1989). Digital Change Detection Techniques Using Remotely Sensed
Data. International Journal of Remote Sensing, Vol. 10, No. 6, 989-1003.
Singh, A.K. (2003). Modelling Land Cover Changes Using Cellular Automata In
A Geo-Spatial Environment. International Institute for Geo-Information
Science and Earth Observation Enschede, The Netherlands (M.Sc -
Thesis).
Singh, J. (1971). Optimum carrying capacity of land in Punjab, N.G.J.I.,
vol.XVII, part 1
Singh, N. (1990). Geomorphology of Himalayan Rivers (A case study of Tawi
Basin), Jay Kay Book house, Jamu Tawi.
Singh, R.P. (1956). Geomorphological Evolution of Chotanagour Highlnds – India,
National Geographical Soc. Of India, (Published in 1969), Varanasi.
Singh, R.P. (1957). Stages and Structural Growth Chotanagpur, Journal of
University of Bihar, Vol. III, No. 1.
Singh, R.P. (1970). Topography and Towns in the Chotanagpur Highlands, The
Magadh University Jour. Bodh Gaya, Vol. III, No.1.
Singh, S. (1977). A statistical Analysis of the average slopes of the Belan Basin:
The Deccan Geographer, Vol. XV, No.2, 307 – 316.
Singh, S. (1981). Estimation of drainage density. National Geographer, 16 (2), 81
– 89.
Sklar, F. H., Costanza, R. (1991). The development of dynamic spatial models
for landscape ecology: A review and prognosis. Pages 239-288 in M. G.
Tuner and R. H. Gardner, eds. Quantitative Methods in Landscape
Ecology. Springer-Verlag, New York.
Smart.J. S. (1968a). Statistical properties of stream length. Wafer Resour. Res.,
4(4), 1001-14.
Smart, J. S. (1968b). Mean stream number and branching ratios for
topologically random channel networks. Bull. Assoc. I nt . SOC. Hydrol.,
13(4), 61-4.
Smart. J. S. (1969). Topological properties of channel networks. Geol. SOC.A m.,
Bull., 80(9), 1757- 74.
Smith, B., Sandwell, D. (2003). Accuracy and resolution of shuttle radar
topography mission data. Geophys. Res. Lett., v.30 (9), 20-21.

191
Smith, G.H. (1935). The Relative Relief of Ohio, Geog. Review, Vol. 25.
Srinivasan, P. (1998). Use of Remote Sensing Techniques for Detail Hydro-
geomorphological Investigation in part of Narmadasagar Command area.
M.P.J. Indian Soc. Remote Sensing. 16 (1). 55 – 62.
Stanners, D., Bourdeau, P. (1995). Europe’s Environment: the Dobris
Assessment, Copen- hagen, European Environment Agency.
Statham, I. (1973). Scree slope development under conditions of surface particle
movement. Trans. Inst. Br. Geog. 59, 41–53.
Strahler, A.N. (1952). Geomorphic analysis of erosional topography. Bull. Geol.
Soc. Am., (63), 25-34.
Strahler, A. N. (1952a). Dynamic basis of geomorphology. Geol. SOC.A m., Bull.,
63(9).
Strahler, A .N. (1956). The nature of induced erosion and aggregation. In : W. L.
Thomas (Ed.), Man’s RoZe in Changing the Face o f the Earth. Thomas,
Chicago-Illinois.
Strahler, A.N. (1956). Quantitative geomorphology of drainage basins and
channel networks. In: V.T. Chow (ed), Handbook of Applied Hydrology.
McGraw Hill Book Company, New York, Section 4-11.
Strahlear, A. N. (1956a). Quantitative slope analysis. Geol. Soc. Am., Bull., 67(5).
Strahler, A. N. (1956b). The nature of induced erosion and aggregation. In : W.
L. Thomas (Ed.), Man’s RoZe in Changing the Face o f the Earth. Thomas,
Chicago-Illinois.
Strahler, A. N. (1957). Quantitative analysis of watershed geomorphology.
Trans. Am. Gcophys. Union, 38.
Strahler, A.N. (1958). Dimensional analysis applied to fluvidely eroded
landforms. Geol. Soc. Amer, Bull., 63, 913 – 920.
Strahler, A.N. (1964). Quantities Geomorphology of Drainage basins and
channel networks, In V.T. Chow(ed) Handbook of Applied Hydrology.
Strahlera, N. (1966). Physical Geography. John Wiley, New York, London and
Sydney.
Taber, S. (1930). The mechanics of frost heaving. J.Geol. 38, 303–17.

192
Takeyama, M., Couclelis, H. (1997). Map dynamics: Integrating cellular
automata and GIS through Geo-Algebra. International Journal of
Geographical Information Science 11 (1), 73-91.
Tarboton, D.G. (1997). A new method for the determination of flow directions
and upslope area in grid digital elevation models, Water Resource
Research, 33.309- 319.
Tarboton, D.G., Bras, R.L., Rodiriguez-Iturbe, I. (1991). On the extraction of
channel network from digital elevation data, Hydrological Process, 5. 81 –
100.
Tauer, W., Humborg, G. (1992). Runoff irrigation in the Sahel zone: Remote
Sensing and GIS for determining Potential sites. Technical Center for
Agric. And Rural Co-operation. Netherlands, GIS Publ,.
Telbisz .T. (1999) Számítógépes szimuláció a felszínalaktanban . Földrajzi
Közlemények CXXIII./XLVII. 3-4 sz. 151-162.
Thomas, C.E. (ed) (1982). Space and time in Geomorphology, George Allen &
Unwin, London.
Thorup-Kristensen, K., Grevsen, K. (1999). An organic vegetable crop rotation
self sufficient in nitrogen. Nordisk Jordbrugsforskning 81(3), 206-214.
Thorup-Kristensen, K., Nielsen, N.E. (1998). Modelling and measuring the effect
of nitrogen catch crops on the nitrogen supply for succeeding crops.
Plant and Soil 203, 79-89.
Tiwari, A., Raj, B. (1996). Hydrogeomorphological mapping for groundwater
prospecting using Landsat MSS images – A case study of part of
Dhanbad district, Journal of Indian Society of Remote Sensing , 24 (4).
281 – 285.
Tobler, W. R. (1979). Cellular geography. Pages 379-386 in S. Gale and G.
Olsson, eds. Philosophy in Geography. D. Reidel Publishing Company,
Dordrecht, Netherlands.
Trame, A., Harper, S. J., Aycrigg, J., Westervelt, J. (1997). The Fort Hood Avian
Simulation Model: A Dynamic Model of Ecological Influences on Two
Endangered Species.
Trudgill, S.T., Crabtree, A.M., Pickles, K.R.J., Burt, T.P. (1984). Hydrology and
solute uptake in hillslope soils on Magnesian Limestone: the Whitwell

193
Wood project. In Catchment experiments in fluvial geomorphology, T.P.
Burt and D.E. Walling (eds), 183–215. Norwich: Geo Books.
Tuceryan, M., Jain, A.K. (1993). Texture Analysis. In: Handbook of Pattern
Recognition and Computer Vision, Chen, C.H., L.F. Pau and P.S.P. Wang
(Eds.). World Scientific, Singapore, 235-276.
Tucker, G.E., Catani, F., Rinaldo, A., Bras, R.L. (2001). Statistical analysis of
drainage density from digital terrain data. Geomorphology, 36, 187-202.
Turner, B. L. II., Clark, W. C., Kates, R., Richards, J., Mathews, J. T., Meyer, W.
B. (Eds.) (1990). The Earth as transformed by human action. Cambridge,
Cambridge University Press.
Turner, B. L., Skole, D., Sanderson, S., Fischer, G., Fresco, L., Leemans, R.
(1995). Land-Use and Land-Cover Change Science/Research Plan. Joint
publication of the International Geosphere-Biosphere Programme (Report
No. 35) and the Human Dimensions of Global Environmental Change
Programme (Report No. 7). Stockholm: Royal Swedish Academy of
Sciences.
Turner, B.L II. (2002). Toward integrated land-change science: Advances in 1.5
decades of sustained international research on land-use and land cover
change. Pages 21–26 in Steffen W, Jäger J, Carson DJ, Bradhsaw C, eds.
Challenges of a Changing Earth. Berlin: Springer.
Turner, B.L., Meyer HI, W.B., Skole, D.L. (1994). Global /land cover change:
toward an integrated program of study. Ambio 23, 91-95.
Van Burkalow, A. (1945). Angle of repose and angle of sliding friction: an
experimental study. Bull.Geol.Soc.Am. 56, 669–708.
Van der Meer, F. (1996). Spectral mixture modelling and spectral stratigraphy
in carbonate lithofacies mapping. Journal of Photogrammetry and Remote
Sensing, 51(3), 150-162.
Varma, P. (1957). Ranchi Plateau, its geomorphology and Human Settlements,
Unpublished Ph.D. thesis, University of Allahabad, Allahabad (U.P).
Vats, P.C. (1983). Geomorphic factors in planning – A case study of village
Asan Tiloria. The Geographical Observer, Vol 19, 11 – 16.
Veldkamp, A., Lambin, E. F. (2001). Predicting land-use change. Agriculture,
Ecosystems, and Environment 85 (1-3), 1-6.

194
Veldkamp, A., Fresco, L. O. (1996). CLUE: A conceptual model to study the
conversion of and its effects. Ecological Modelling 85 (2/3), 253-270.
Verstappen, HTh. (1983). Applied geomorphology. ITC, Enschede.
Vink A.P.A. (1975). – Advancing Agriculture, Series in Agricultural Sciences – I,
Springer – Verlag Berlin Heidelberg, New York.
Vitousek, P.M. (1992). Global environmental change: an introduction. Annual
Review of Ecology and Systematic 23, 1-14.
Vogelmann, J. E., Sohl, T., and Howard, S. M., (1998). Regional
characterization of land cover using multiple sources of data.
Photogrammetric Engineering and Remote Sensing, 64, 45–57.
Wadia, D.N. (1937). An outlook of geological history of India, in An outline of the
field science of India, Ind, Sc. Congress Assn., Calcutta, 43 – 69.
Wadia, D.N. (1975). Geology of India, Tata McGraw – Hill Publishing Co., New
Delhi, Fourth Edition.
Warner, T. A., & Campagna, D. J. (2009). Remote sensing with IDRISI Taiga: A
beginner’s guide. Hong Kong, Geocarto International Centre.
Weinberg, M., Kling, C. L and Wilen, J. E. (1993). Water markets and water
quality. American Journal of Agricultural Economics 75 (2), 278-91.
Weng, Q. (2001). A remote sensing – GIS evaluation of urban expansion and its
impact on surface temperature in the Zhujiang Delta, southern China.
International Journal of Urban and Regional Studies, 22, 425-442.
West, W.D. (1962). The line of Narmada-Son Valley. Current Science, Vol. 20.
West, W.D. (1964). The Geomorphology of the Country around Sagar and
katangi, An example of superimposed drainage, Jour. Geol, Sci. of India,
Vol.5.
Westervelt, J. D., Hannon, B. M., Levi, S and Harper, S. J. (1997). A Dynamic
Simulation Model of the Desert Tortoise (Gopherus agassizii) Habitat in the
Central Mojave Desert. Champaign, IL: U.S. Army, Corps of Engineers,
CERL Publication 97/102.
http://blizzard.gis.uiuc.edu/dsm_TORT_frame.htm.
Wiesmann, A., ller, U., Toan, T. L., Santoro, M., Werner, C., & Strozzi, T. (2005).
Use of ENVISAT ASAR wide-swath mode data over Siberia for large area
land cover mapping, parameter retrieval, and change detection.

195
International Geoscience and Remote Sensing Symposium (IGARSS), 5,
3595−3598 Seoul. 2005 IEEE International Geoscience and Remote
Sensing Symposium.
Wigmosta, M. S., Vail, L. W., Lettenmaier, D. P. (1994). A distributed hydrology-
vegetation model for complex terrain. Water Resources Research, 30.
1665-1679.
Wooldridge, S.W. (1932). The Cycle of erosion and the representation of relief,
Scottish Geographical Magazine, 48, pp. 30-36.
Wulder, M. A.,White, J. C., Goward, S. N., Masek, J. G., Irons, J. R., Herold, M.,
Cohen,W. B., Loveland, T. R., &Woodcock, C. E. (2008). Landsat
continuity: Issues and opportunities for land cover monitoring. Remote
Sensing of Environment, 112, 955−969.
Wyman, M. S., & Stein, T. V. (2010). Modeling social and land-use/land-cover
change data to assess drivers of smallholder deforestation in Belize.
Applied Geography, 30(3), 329e342.
Yang, X. and Lo, C. (2002). Using satellite imagery to detect land cover changes
in Atlanta, Georgia metropolitan area. International Journal of Remote
Sensing. 23, 1775-1798.
Yeh, A. (1999). Urban planning and GIS. In: Longley, P., Goodchild, M.,
Maguire, D., Rhind, D. (Eds.), Geographical Information Systems—
Management Issues and Applications. Wiley, New York.
Yuan D., Elvidge C.D., Lunetta R.S. (1998) Survey of multispectral methods for
land cover change analysis. In Remote Sensing Change Detection:
Environmental Monitoring Methods and Applications, edited by R. S.
Lunetta and C. D. Elvidge (Chelsea, MI: Ann Arbor Press), 21–39.
Yuan, F., Sawaya, K.E. Loeffelholz, B.C.; Bauer, M.E. (2005). Land cover
classification and change analysis of the Twin Cities (Minnesota)
metropolitan areas by multitemporal Landsat remote sensing. Remote
Sensing of Environment. 98, 317-328.
Zavoianu.I. (1985). Morphometry of drainage basins, developments in water
science, 20, Elsevier Publications. Amsterdam. 4 – 5.
Zhou, W., Troy, A., & Grove, M. (2008). Object-based land cover classification
and change analysis in the Baltimore metropolitan area using

196
multitemporal high resolution remote sensing data. Sensors, 8(3),
1613e1636.
http://bardhaman.nic.in/home.htm
http://en.wikipedia.org/wiki/Ausgram_I_%28community_development_b
lock%29
http://www.ibef.org/download/west_bengal_190111.pdf
http://www.indianetzone.com/45/rainfall_distribution_india.htm
http://www.westbengalonline.in/Profile/Geography/Agriculture.aspx.

Supervisor interaction with Bhalki Village farmers during Field data collection (23/12/2007)
Author: Field Verification Bhalki village (18/04/2009)