thesis submitted for the degree of doctor of philosophy of
TRANSCRIPT

Thesis submitted
for
the degree of Doctor of Philosophy
of the
'University of London
by
Ali Massoumi, B. BiSc.(Teh.), I.Sc ond. D.I.C.
Chemistry Department, Imperial College of Science
and Technology, London, S.W.7. October1962.,

Title
"STUDISS Ot3 LPF1 ATE PD TABOMSM OF 3ULPUUR
IN SOILS.

Abstract.
A number of methods of determining total sulphur and
aulphate in soils were studied and one of these was
modified to suit the present study.
The interrelationships of total sulphur, sulphate,
organic carbon, total nitrogen, clay content, pH and
oalctul carbonate content (for calcareous soils) were
determined for 63 cultivated soils from South—Eastern
England.
The concurrent mineralization of sulphur, carbon, and
nitrogen during incubation tinder standard conditions was
investigated for a number of soils varying naturally in pH as well as for a single soil adjusted to different pH
levels
The effects of the addition of various organic
materials (cellulose, straw, compost, grass, manure) on the metabolism (mineralization or immobilization) of
sulphur during incubation of a soil adjusted to three pH
levels was studied. The growth of and sulphur uptake by xgrass in 40
soils was studied in pot tests with sulphur as the only
limiting nutrient. The relationships between dry matter

yields and total sulphur uptake on the one hand and
initial soil sulphate and total sulphur contents on the
other were studied by the use of correlation*
coefficients.
Incubation tests and pot tests with ryegrass were
used to study the effects of addition of cystine, methienine,
compost, and potassium sulphate, applied at the same
sulphur rate, on mineralization of sulphur and carbon and
on growth of and sulphur uptake by the grass in a soil
adjusted to three pH levels.

To
Bather o tether, Uncle and teachers

Acknowledgement
The author wishes to express his deep appreciation
and gratitude to Dr. A.H. Cornfield, Ph.D., 1140., D.I.C.,
P.R.I.C. under whose supervision and encourage—
ment this investigation was conducted«
The author is particularly thankful to the College
authorities and to Professor R.1. Barrer, D.Sc., So.D.,
V.R.I.C., P.R.S., Head of the Department of Chemistry
for their generous help in connection with the preparation
of this thesis.
The author also wants to thank Mary and the ether
staff members of the Agricultural Chemistry section for
their timely assistance in various ways,

Contents
,Page Chapter I.
1 Introduction 2
2. Review of Literature
3. Literature Review — Conclusions 20
4. Objectives of the present studies 21
Chapter II. Analytical Lethods.
1. Deterraination of sulphate in soils 24
2 Details Qf the method used in this study for determination of total sulphur in soils, plants and organic materials. 27
3, Details of the method used in this study for doternination of sulphate in soils. 31
4, Determination of maximun water holding capacity of soils and sand.
5 DeterAnation of total nitrogen in soils and plant materials. 32
6. Determination of organic carbon in soils.
7. Determination of pH in soils.
8. Deterlination of carbon mineralization during incubation of sOils treated with organic materials 33
9, Deterlination of ammonia and nitrate in coils. 34
10, Determination of clay content of soils. 34
11. Determi-nation of free carbonate in soils. 35
32
33

Chapter III. The sulphate-sulphur and total
sulphur contents of cultivated soils and their
relationship to other soil constituents.
Page
1. Introduction. 37 2. e tho s • 38 3.,Result. 38
4. Relationship between total sulphur and other variables. 44
5. Relationship betv:een sulphate and other variables. 48
6.Nitrogen/sulphur ration. 49 7. Discussion 50
8. Suanary and Conclusion°. 57.
Chapter IV. Mineralization of sulphur in
comparison with that of nitrogen and carbon
during incubation of soils.
1. Introduction
2. Experimentalt Hxperiment
61
62 3 Results 62
4. Experiment (2), 68
5. Results, 6$
6. Discussion (of experiments 3. and 2) 72
7. Sulnary and Conclusions. 74

Page
Chapter V. Aetabolism of sulphur during
incubation of soil treated with various organic
materials,
1. Introduction. 78 2, Method. 79. 3. Results. 81
4, Discussion. 17 5. auary and. Conclusion. 91
Chapter VI. Uptake of sulptlur by ryegrass as
related to soil sulphate and total sulphur
contents.
1. Introduction,
2. Experimental. 96
3. Results, 98
4. Relationship between soil total sulphur and uptake of sulphur by ryegrassi 105
5. Relationship between soil sulphate and uptake of sulphur by ryegrass. 105
6. elationship between soil total sulphur and total yields and percentage nitrogen in ryegrass. 108
7. Relationship between soil sulphate and total yields and percentage nitrogen in ryegrass. 108
V, Relationship between dry matter yields and percentage sulphur in ryegrass, and total uptake of sulphur in ryegrass. 111

page
9. Relationship between percentage sulphur and percentage of nitrogen in ryegrass. 111
10. Appearance of ryegrass during growth. 111
11. Total sulphur uptake by rycgvass as related to the original sulphate—sulphur contents of the soils. 114
12. Dipcussion. 115
13. Summary and. Conclusion. 118
Chapter VII. Ihe eallet of sulphur compounds on
the metabolism of sulphur and carbon in soils.
and uptake of sulphur by ryegrass at 3 soil
pH lovols.
1. Introduction. 122
2. Bxperimental. 123
3. Incubation Experiment. 124
4, Pot Experkment. 125
5. Results — Incubation experiment. 126
6. Results . Pot experiment. 132
7. Discussion (of both incubation, and pot tests). 139
8. Summary and Conclusion. 143
Chapter VII.
1, General Discussion and Conclusions. 146
2. Sulphur cycle 154
References. 156

ORLPfER
1. Introductien.
2. Review of Literature.
Historleal.
Determination of Sulphur in Soils.
Sulphur deficiency in soils.
Loss of sulphur by drainfte.
Removal of sulphur by crops.
Sulphur deficienoes in plants.
Effects of atmospheric sulphur dioxide.
Sulphur fertilisers as related to plant growth.
Soil sulphur statue as related to other soil constituents.
literalisation of organic sulphur in soils.
Literature review conclusions.
Objectives of the preeent studies.

Antreduotiort.*
It is new an established fact that sulphur is one
of the fifteen elements essential for plant growth (1, 2)
as well as for other forms of life. Most plants
Obtain their supplies of sulphur from the sulphates
present in the soil (44), and it is.their ability to
synthesise this form of sulphur into organic compounds
Which ensures the supply of sulphur-containing amine.acide
needed by higher animals. The need of higher animals is
met by the amino-acids 1.4ystine and Ii-methionene (part
of the compounds which form plant protein) (3, 6)
together with the vitamins thiamine and biotin* (which are
also important hormones in plants as growth promoters) (4)
The tripeptide, glutathion, contalring the amine-acid
cyatine, is also important physiologically in oxidation.
reduction reactions in. the &rival body and is a major
source of sulphate.
Sulphur is also a constituentof v us flavour and
odour producing organic compounds found in such species
as mustard (rich in. S-glucosides, sinigrin and stn bin)
onion and garlic (mereaptane, ally1 sulphide and vinyl
sulphide)* Among the other naturally-occurring sulphur
compounds is sulphite, Which plays an intermediate role

3
in sulphate metabolism, thiols, which have been separated
from plants and the antibiotics aging eubtilin and
penicillin (44).
There are a number of other compounds Which hays been
identified recently as S.methyloyeteins sulphorge (a
constituent of cabbag, and sulphoxide sulpheraphene
CH S0.CACH2 *CH2 .1103 (found in radish seeds) (45).
The amine.acide cyotinc and methionone (higher
animals are entirely dependent upon plants for methienine)
(5) are building elements of many proteins such as
insulin (045.1169.1011.S.31120) which is synthesised in the
pancreas and is rich in cystine (12%) Which is a very
important compound in animal physiology. Sherman (50)
quotes the approximate per cent of sulphur in the human
body as 0.25, and the approximate per centage of it in the
earth's cruet is 0.11. He also points eut that plant
proteins being a common feed contain approximately 16%
14 and 1% S and the contents if the two elements change in
a mere-or-less parallel manner.
The important role of enzymes centa4nAr (S ) groups
(7) in the metabolism of cells and the above mentioned
facts stress the importance of sulphur in animal and
plant nutrition. The determination of the sulphur content
of the plants by the Wolffls dry ashing method which was
shown by later workers to result in the less of match
organic sulphur, misled the early workers into believing
that little sulphur was needed by plants. Thus in these
early days little importance was attached to sulphur as
an essential plant nutrient.
2* #ev4e
Histericeal. Sulphur has been recognised as an essentibl
constituent of plants since the work of De Sauseurb (a)
in 1804.
Per some time before thissulphur compounds had been
applied to soils because of their observed beneficial
effect on plant growth, but these benefits were not
ascribed to their sulphur content
Brown (9) credits the discovery of gypsum which was
later used as a fertiliser, to a clergyman in Germany in
1768. prom there its use spread to France and Great
Britain i t was taken to the United State* by Franklin
and during the period 1770-1650 large quantities of gypsum
were applied to soils both in Europe and the United States.
Various views were put forward to explain the offset
of gypsum implant growth, among the moat interesting being

that of Liebig (8) who showed that plant life foods en
mineral substances and not, as was believed by many up
to that time, upon the organic material of manure and
similar matter in the moil. He maintained that OaSO4
absorbed anaemia from the air. On the other hadd. Davy
(8) maintained that the amount ^ of "lime sulphate" in
plants Was increased by the gypsum treatment of soils.
Both of these theories were contradicted . by the investig.
ation of Beussingsult in 1584 (30) who thawed that theta was ns increase in the 0a504 dentent of the': plant ash as
a result of gypsum fertilisation and no' increase in plant
yields except for a few plants such as tuoorne, sainfoin
and clover. Owing to the work of Boussingault and
probably more to the wide use of superphosphate after the
beginning of its manufacture by Sir John Lewes in
England in 1843 (97), little attention was paid to saphur
until the beginning of this century. The low sulphur
content of plants, according to ash analysis by Wolff's,
method. alse contributed to the loss of interest of this
element
Seger td. Bogdaneff (4, 10) was the first to phaeie
the importance of sulphur in soil fertility. In 1898,
he found that addition of sodium sulphate to some black
soils in Russia resulted in certain crops, such as white

mustard giving considerably higher yield, and led him in
1899 to determia►e the sulphur content of plant materials
by several methods which Showed that the ash in many
oases contained only a small fraction of the total sui.
phur tresent in the plant*
pete;91patien of. Aphur itkieloils*
Among the first studies of the sulphur content if
soils was that by Dymond and associates' (11)* Dymond,
Hughes and Jupes determined the sulphur content of soils
in Bssex (England) and showed the importance of sulphur
for plant growth and its relation to the amount of sulphate
in the soil, which had previously been overlooked* They
also found that sulphur was as important quantitatively
as was phosphorus in the composition ©f some plants
These authors (11) state that the average British soils
contain less sulphur than phosphorus, the average of the
analysis of 21 typical sons showing 042% sulphur and
0.059g, phosphorus. They demonstrated that the usefulness
of sulphur manuring as generally confined to heavy
yielding crops containing a high proportion of "albumineid".
They also reported that there was not sufficient "sulphuric
acid", in soil or supplied by rain for heavy yielding crops
rich in albumineid and for such crepe sulphate should b*
included in artificial manures* Per cereal crops and

7.
permanent pasture the soil and the rain provided the
"sulphuric acid" necessary. During the first thirty
years of this century some determinations of the sulphur
content of American soils were made. Hart and Peterson
(4, 10) using the sodium.peroxide fusion method, proposed
by Osburn, for determination of sulphur in Kentucky soils showed that the amount of sulphur found by this method
was much greater than those found after dry aching.
Their method which was later modified by Shell (10),
proved to be reliable. Swanson and Latahaw (123) later
suggested the use of magnesium nitrate instead of sodium
peroxide. However, the wet—oxidation method was used by
Patterson (23) and Hall (21) for determination of total
sulphur in plant material. They too proved that dry*
wilting resulted in the loss of practically all the
organic sulphur. This view was also in complete accord
ance with the works of Berthelot, Ballow, ?raps, Beetle
and Sherman (21). With satisfactory new methods of
sulphur analysis available, determinations of sulphur in
soils were carried out in many places. Shedd (10) found
that there were considerable variations in the sulphur
content of soils from different areas, and even in the
game area there were differences in the sulphur content
of virgin and cultivated soils as well as of surface and

subsoils. Robinson (18) determined sulphur in some
American soils by ignition of soil with sodium carbonate
and nitrate in an electric furnace and reported an average
of 0.11, of sulphur. Evan and Rost (46) determined the
sulphate—sulphur and total sulphur in some qinesota soils
and reported that the upper layer of podsolic soils had
much less total sulphur (about 100 p.p.m.) than the
upper layer of the Cheronezem and black prairie soils
(400.500 p.p.m.), Little (47) examining Scottish soils
reports that 30A of agricultural coils contain readily
soluble sulphate levels of 4mg/100 g. of soil and 77, had
3mg/lOOg of soil. Jordan an4 Bardeley (48) reported
that the amount of sulphate—sulphur extracted with
Morgan's reagent from red yellow podzolic soils was 3
p.p.m. or less in the surface soils. Sulphate tended to
accumulate at 6 to 30 inches below the surface, Steller
(49) reported that the amount of sulphate increased with
increasing clay content and that where the predominating
clay mineral was kaolinitet gibbsite or illite the amount
of sulphate—sulphur wac; definitely higher than when the
clay was predoninently montmorillonite He also
reported (50) that the soluble sulphate content of the
0 — 12 inches layers of cropped soils was low but increased
markedly with depth. In virgin soils sulphate contents

9
were practically nil in the top 24 inches. Malavalta (51)
reported that in Brazilian soils sulphur occurred as
pyrites and gypsum, Eaton (20), Shaw and Young (37)
concluded that sulphur reserve in soils appeared to depend
mainly on organic compaande.
Sulphur deficiencl.eo, in soitls.
Kamprath et alia (52) reported that the soils of
Durham, H. Carolina were deficient in sulphur for cotton
and tobacco. Woodward and Eaton (19) reported the same
thing about soils from other parts of America. Even
though the use of sulphur-containing fertiliser© ouch as
superphosphate sulphat of potash and ammonium sulphate
have greatly increased (55) there are attll a number of
reports of sulphur deficiencies in various parts of the
world: Conrad (56) reported that sulphur deficiency was
demonstrated in many areas of Carolina. He showed that
either sulphur or gypsum applications, corrected the
deficiency; Legumes showed the most marked responses to
sulphur fertilisation. Keller and his o.-workers (57)
reported that white clover was stunted unless gypsum was
applied. neatly (58) and his associates, using sodium
sulphate in Alberta soils, reported that many soils gave
definite growth responses !any other recent reports
10.
have been made by: Bardeley and Jordan (59). Walker. and
Adams (60), ilalung and associates (Brazilian soils) (61,
76), Emilsson (German and Swedish soils) (62), Stephens
(Ghanian soils) (63). Coic (French soils) (64). Ashly and
Mika (Lilies Americana) (67), Barrow (Australian soils)
(66), Pelipets (Ukranian soils) (82) and Grincheneke and
Pelipets (83), all of which indicate that soils studied were
deficient in sulphurs
Loss of soil sulphur by drainage.
Shedd (10) suggested that more sulphur is probably
lost through drainage than is brought down by rainfall and
to maintain the sulphur content it is necessary to add
somematerial containing sulphur to soil. This point was
later investigated by Lyon and Bizzel (12) who studied the
loss of soil sulphur by drainage and concluded that the
sulphur removed in the drainage water from an unpianted, unlimed soil that had received some form of manure but no
commercial fertiliser amounted to 44 pounds per acre per
annum. The applic lion of lime increased the loss of
sulphur Cropped soils lost lees sulphur in drainage
water than did fallow soils. They also showed that an
annual application of sulphate of potash at a rate of
200 pounds per acre markedly increased the quantity of

11.
sulphur in drainage water. Shaw and Young (37) found
that sulphur in a silty clay loam was not materially
increased by applying sulphates probably through loss by
drainage. Leaching of sulphur was not decreased by
limestone or dolomite supplements. Kilmer and his
co-workers (38) reported that in Wisconsin, annual losses
from a Fryette silt loam with 10 elope were approximately
1 lb, sulphur per acre when crops were grown and 3 lb. per
acre from unoropped soil. Battiesee (39) studied, lasing
coil left bare, under grass, or planted with various crops
and the balance of sulphate recorded at intervals under
conditions of mulching with paper, irrigation and addition
of different types of organic matter or without treatment.
He noted that a considerable amount of sulphur was removed
by drainage water and more was assimilated by lucerne than
by rotations of cereals, carrots and buckwheat, Watenra
(40) too, reported losses of sulphur as sulphate in
drainage water from lysimetere. Over 3 years the losses
of sulphate increased with the extent of rainfall. Been
during a year of moderate rainfall (48 in.) the loss of
sulphate per acre was equivalent to that contained in
140 lbs of superphosphate.

Removal of soil sulphur by crops.
One of the first workers to study this was Shedd (10),
who found that constant cropping.withaut manuring in some
oases resulted in, very large losses of soil sulphur.
Hart and Peterson (4, 10) reported that the amount of
sulphur roioved from soils by certain crops was consider—
able. In the case of average crops of cereal grains
and straws, this amounted to about two thirds of phosphorus
removed. The grasses of mixed meadow hay removed as much
sulphur as Phosphorus whilst alfalfa removed 2 3 times
as much sulphur as phosphorus. They Showed that
unmanured soils cropped for 50 60 years lost on average 40;Ti of the sulphur originally present in the soils. It has been proved (30) that most plants absorb sulphur
readily with increasing amounts applied With fertilisers.
The sulphur requirement of vegetable crops, as has been
mentioned before, depends on the kind of crop. Some
crops such as cabbage, turnip and onion absorb particularly
large amounts of Sulphur. Legumes fall into an inter.-
mediate group and corn, grasses and grains have lower
requirements, particularly when grown at moderate nitrogen
levels (48). Shkond (53) and Williams and Steinberge
(54) reported that soil sulphate content correlated with
plant sulphur uptake and yield. Sulphur contained in the

13.
rxar?Aetad portion of a crop is lost to the soil, but, in some cases, the sulphur mr.v- be partially or completely
returned to the soil in crop residues and animal by-
products.
OUlvhur deficiencies in Plants.
!Away solution culture studies have been made with a
view to obtaining visual deficiency symptoms in plants.
For example Ginsburg (22) reported that the leaves of
soyabean grown in cultures without sulphur gradually
turned yellow and became covered with black spots; this
was followed by browning of roots, Nightingale (23)
reported that the fruits of tomatoes grown in sulphur.
deficient cultures were yellowish-green and were smaller
than where sulphur was applied. Baton (24) studied
sunflower and soyabean and reported the visible effects
of sulphur deficiency as yellowish-green colour of
leaves and thinner stems compared with normal plan
He also reported that the soluble organic fraction and
nitrate increased in the sulphur-deficient stems.
handles (26) studied chleresis in chlerella and reported
that the addition of sulphate to a deficient plant
resulted in rapid recovery from chlorosis. There has
been similar reports by Harris et-alia (28), Anderson and

14.
Webster (42) (studying cotton), and Humphreys (32)
(studying lucerne and clover). The best known sulphur
deficiency disease ie tea yellows which occurs in parts
of Nyasaland (30). Plants deficient in sulphur are
high in carbohydrate and nitrate. The rate of nitrate
reduction is decreased, but starch digestion and trans-
location of sugars is not restricted (8, 29).
3ffect. of atmospheric sulphur dioxide.
Thomas et alia (25), Fried (using radio-active
sulphur) (33) and Olsen (14) found that plants were able
to absorb a certain amount of 02 directly from the
atmosphere. However, the amounts of sulphur-dioxide
present in the atmosphere were in themselves inadequate
for plant growth. Zimmer and Croker (2) reported that
plants growing in the divinity of smelters which give rise to much SO2 have been injured.
A concentration of about 1 p.p.m. in the atmos-phere caused some damage to plants whilst higher comm.,
trations caused defoliation. Alway et alia (34),
Wilson (35) and Jordan et alia (36) concluded that SO2
brought down by rain, snow and wind into the soil in some
oases made a significant contribution to the sulphur content of soils. Beas (31), for example, found that
Visual sulphur deficiency symptomo in tobacco disappeared

15.
following rain. The amount of sulphur brought down by
rain varies a great deal with location, mainly due to
differences in atmospheric pollution. Jordan and
Bardsley (48) reported that the supply from rain varied
from 5.4 lbs/acre in the south to 13-20 1134/acre in the
mere industrial north of the United States of America.
A figure as high as 196.7 lbs sulphur per acre has been
reported (8) for an industrial area of Minnesota.
Sulphur fertitlisore as related to plant gyowth.,
Hart and Persher (14) found in greenhouse trials with
a soil containing 0.4% of sulphur trioxide that "high
protein and sulphur" plants such as rape, radish, turnip
and clover responded to a marked degree to the application
of sulphur fertilisers In the case of clover the
addition of gypsum to a so-called complete fertiliser,
(Supplying nitrogen, potash and phosphoric acid) produced
a 35% increase in the dry matter yield of the °rep.
Peterson (14) found that where no sulphate had been
supplied, clover plants contained no sulphate in the sap,
but rhere gypsum had been supplied, the plants contained
an abundance of sulphate in the sap. He concluded that
the determination of the amount of sulphate in the
growing plants may be of value in showing whether or not

16.
a crop on a given soil is being limited by the lack of
sulphate. Miller (15) showed that addition of sulphate
and elementary sulphur enhanced the growth of plants
grown in the pots in the greenhouse. He pointed out that
the great increase in the nitrogen content of clover
where sulphate had been added was probably the effect of
the sulphate stimulating the action of legume bacteria.
Sulphate also increased root development and the number
f root nodules (8, 15). Kosevich (16) recommended
addition of sulphates to Russian soils to improve Yields.
Lipman and Gericke (17) studying the effect of sulphur as
a fertiliser on a sandy soil reported that sulphate of
ammonia was superior to other readily available nitrogenous
fertilisers for barley. The superiority they concluded
to be due to sulphur contained in the sulphate of ammonia.
The presence of sulphate in fertilisers has been and will
continue to be an important source of sulphur for crop
produotion. Mehring and Bennett (55) summarised the data
showing the sulphur cont:nt of fertilisers, manures and
soil amendments. normal superphosphate contains an
average of about 12i; sulphur. According to these workers
the average sulphur content of mixed fertilisers consumed
in 1948 was 7.74 per cent. However, the present trend
is towards the use of higher analysis fertilisers whioh
will be likely to contain less sulphur.

17.
Soil sulphur status as related to other soil constituents.
The relationship between the sulphur content and
other constituents in soils has been reported by a number
of workers. Walker (68) found that the average of
CIN: (all in organic forms) of well—drained New Zealand
grassland soil was 100:8:1. Williams and Steinbergs (69)
found in Australian soils that organic sulphur was closely
correlated with organic carbonand nitrogen contents.
Sulphate comprised only a small proportion of the total
sulphur present. The mean ratio of COO P (all in
organic form) was 150;10:1.26:0,66.
Harper (70) reported an average 7.6 for org,N/Org.S
ratio of 170 soils. Evan and Rost (46) found that pod.-
zols had an org.Niorg ranging from 18 to 40,
eralisation of organic sulphur in oils. The process of oxidation of organic sulphur com—
pounds in the soil to sulphate is one of the important
changes sulphur compounds undergo in the soil. Among
the first workers who studied this process was Shedd (13)
who found that the organic sulphur of horse manure was
slowly oxidised to sulphate in soil. Kahuzhsky (73)
reported on the formation of sulphate in fallow and grass—
land soils at different times of the year. He pointed
out the similarity of sulphur and nitrogen mineralisation
18.
in soils. This was further stressed by Demolon and
Batisse (74) who reported that there was a close parallel-
ism between nitrification and sulphur oxidation in soils.
They studied sulphur mineralisation in both fallow and
'cropped soils, and showed that there were net losses of sulphur, indicating that over 1;', of the original total
sulphur had been mineralised annually. Hesse (76)
studying lihanges in forest soils of East Africa concluded
that biological oxidation of organic sulphur was extremely
slow compared with that of carbon and nitrogen. Starkey
(77) reported that changes of sulphur in soils are brought
about by various micro-organisms in three different
stages:
1. Transformation of organic sulphur compounds, for
which the fungus Aspergillus oryzae, the bacterium of the
genus Pseudomonas, Achromohacter cystinavorua, Aspergillus
niger, the fungus scopularispsis (for oxidation of
methionine) and some others are mainly responsible.
2. Reduction of inorganic compounds. This is done by
heterotrophic micro-organisms such as the fungus
Schisophyllum-commune, the bacteria protOs vulgaris and
Thiobacillus thioparus.
3. Transformation of inorganic sulphur compounds
brought about by autotrophic organisms, using carbon

19. dioxide as the source of carbon. These organisms
oxidise sulphides, elemental sulphur, thiosuiphate and
hydrogen sulphide. The nest important ones filam,zntaus
bacteria such as Deggitoa, Thiothrix, Chlorobiumt
Thiobacillue this—oxidans, Thiobacillue thioparus and
bacterium_ Thiocyanoxidans,, all of which are aerobic.
Fereney (78) studying aerobic transforration of cysteine
to sulphate by micro—organisms reported the following
stages: cystoine cystine cystine disulphate .-p—
cystine sulphinic acid sulphate. Later he reported
(79), that cysteic acid, sulphite and —hydroxypyruvio
acid were detected. Freney (SO) also concluded that the
relative intensity of immobilisation and mineralisation
of added sulphate and native organic sulphur.00mpounds
was affected by the presence of growing plants, due
presumably to the rizosphere effect.

3. Literature Review-Conclusion.
From the review of literature the following con-
elusions are mades
1. Sulphur is an essential element in plant and animal
nutrition, being a constituent of cystine, methionine and
plant growth regulators, thiamimand biotin.
2. Different plant species have widely different sulphur
requirements.
3. Sulphur is limiting to plant growth in soils of many
parts of the world,
4.. The main source of sulphur for plants appears to be the
organic sulphur compounds present in the spil organic
matter. Under normal conditions these organic compounds
are gradually mineralized to sulphate, which appears to be
the form in which plants absorb sulphur from soils. The
other main source of sulphur for plants is the sulphate
added when the common sulphur-containing fertilizers such
as superphosphate, sulphate of ammonia and sulphate of
potash are applied to soil. In this respect it must be
borne in mind that the modern trend for using concentrated
forms of fertilizer (e.g. etooncentrated" superphosphate,
anhydrous ammonia and concentrated complete fertilizers)
containing no sulphur may tend to cause sulphur deficiencies
in time. 5. Although plants may absorb sulphur dioxide directly

21.
from the atmosphere and may also obtain sulphur from
sulphur diixide which has been brought down by rainfall
into the soil, the amounts absorb-d in these ways are
probably negligible except near industrial areas or
densely populated towns.
6. From the limited amount .of work done to date there
appears to be a close correlation between the extent of
mineralization of organic sulphur and that of organic
nitrogen in soils.
4. ObAectives .of the r tudies.
The first part of this studyci ted to exaTining
a number of published methodstr determining sulphate and
total sulphur in soils with a view to selecting suitable
methods, and if necessary, modifying these to ertit the
requirements of this study.
In view of the fact that no systematic study appears
to have been made of the sulphur status of cultivated soils
of this country a part of this study was devoted to this
aspect. Soils selected ( from various areas of southern
England) on the basis of a wide range of texture and pH
were therefore analysed for total sulphur and sulphate and
the results obtained were compared with other soil values

22.
viz. pH, total nitrogen, organic carbon, and olay content.
Pollowing on the above selected soils were studied
to deterlines-
1. Concurrent mineralization during incubation of sulphur,
carbon And nitrogen of (a) natural soils, and (b) soils
adjusted to different pH levels prior to incubation.
2. The effect of f:10dition of different organic materials
to soils on metabolism (mineralization or immobilization)
of sulphur during incubation.
3. The effects of addition of sulphate, composted straw,
methionine and cystino, all applied at the same sulphur
level to soils adjusted to different pH values ons—
(a) the metabolism of sulphur during incubation, and
(b) uptake of sulphur by rye grass in pot tests.
4. The uptake of sulphur by rye grass in pot tests using
a variety of soils supplied with all nutrients except
sulphur and the relationship between sulphur uptake and
initial levels of sulphate and total sulphur in soils.

23.
CHAPTER. ii
ANALYTIICAL 1113THODS
Determination of sulphate in soils.
Details of the method used in this study for determination
of total sulphur in soils, plants and organic materials.
Details of the method used in this study for determination
of sulphate in soils.
Determination of mavimum water holding capacity of soils
and sand.
Determination of total nitrogen in soils and plant material
Determination of pH of soils.
Deterlination of organic carbon in soils.
Deter,nination of carbon mineralization during incubation
of soils treated with organic material.
Determination of ammohia and nitrate in soils.
Determination of clay content of soils.
Deter7ination of free carbonate in soils..

24.
Deterrination of sulphate in soils., (Tests of a number
f published methods).
In view of the large namber of samples which would
have to be analysed in this study, it was obvious that
a fairly rapid method of determining sulphate in soil
extracts would be required. A review of literature
indicated that a. turbidimetric method would be the most
suitable in this respect. lany such methods have been
published (86, 87, 88, 89, 90, 91). They involve
extraction of the soil with water or a salt solution
followed by development of the barium sulphate turbidity
by addition AP barium chloride under carefully controlled
conditions, usually in the presence of a dispersing agent
such as gum acacia or gelatine. The extent of turbidity
is then measured in an absorpAometer.
The method described by Jarrett (87) was tried first.
Re extracted the soil with Morgan reagent (0.5N acetic acid
buffered with 0.75N sodium acetate) and developed the
turbidity by addition of a saturated solution of barium
chloride plus hydrochloric acid in the prereuce of gum
acacia. Although satisfactory for relatively large amounts
of sulphate, the method proved insufficiently sensitive
when less than 15 pg sulphate—sulphur was present in the
aliquot taken for testing. The method suggested by

25.
Bardsley and Lancaster (83) was next tried. This
involves eztraction with a buffered acetic acid solution
in the prcerce of activated charcoal to reduce inter-
ferente of extracted organic matter.' The turbiditt is '
then developed by addition of 20-60 mesh barium chloride
crystals. This method was found to be quite unsuitable,
since it was found impossible to even prepare a reproduc-
ible standard curve.
The - method finally adapted for determining sulphate
in soil extracts was a modification of that described by
Chonery and Butters (89). This method was developed
originally for determining total sulphur in soils and
plant material after convOrsion of organic sulphur to
sulphite by evaporation with fuming nitric acid followed
by ignition with magnesium nitrate. After bringing the
residlle into solution the sulphate, turbidity is developed
by adding solid barium chloride followed by gum acacia. •
For sulphate deterAnations in soils in this study Ohenery
and Butters method wan used from the point Where the
sulphate is brought into solution,
The modifications introduced were as follows:
(1) Barium chloride crystals lees than 1 m.m. mesh added
at the rate of 1 g to 25 ml of final test solution
were found to give better reproducibility.
(2) The aqueous gum aoaoia proposed by Chenery and Butters
tended to become turbid after a few days. This was

26.
overcome by incorperating. the gum acacia in the
acetic acid solution used as a reagent in this.
method. Acetic acid solution was also mixed with
the phosphoric acid in order to save time in the
delivery of the reagents.
3) The Chenery-Butters method. was found to be rather
insensitive when' the aliquot taken for to .t con-
tained less than 10 pg sulphate-sulphur. This was
overcome by the addition of a "seed" solution pre-
pared from barium chloride and potassiun sulphate sa
as to supply.10 pg barium sulphate-sulphur in each
test tube, including controls and those used for the
preparation of t!ie standard curve.
xtraction of_sulnh ,from,soils
Although many workers (86, 87, 88) have reported
that sulphate can be extracted quantitatively from soils
by the !organ reagent and various salt solutions and
determined-satisfactorily in such extracts, it was found,
in fact, in this study, that with certain soils poor
recovery of known added amounts of sulphate was obtained
when such solvents were used. When water was used as an
extracting agent complete recovery of added salphatelon
obtained with every one of 30 different soils tested.
It was found that 1 part by weight of soil to 2

27.
parts by volule of water with a 30 minute shaking period,
using activated charcoal, (0.04 g,pcx 16 & of soil) was
satisfactory in this respect.
Betas of the method, usedIn,this study for determirilg
total sulphur in soils., Plants and organics materials.
Reagents:-
(1) Magnesium nitrate solution: 25 g. of "Specure" mag-
nesium (5 rode) was dissolved in 450 ml. Analar nitric
acid and the solution diluted to 500 ml.
(2) Nitric acid, fuming Analar.
(3) Nitric acid 31.2 v/v prepared from concentrated
Analar nitric acid.
(4) Nitric acid v/v prepared from concentrated Analar
nitric acid.
(5) Acetic-phosphoric acid: 900 ml acetic acid was mixed
with 300 ml. 8 Analar orthophosphbric acid.
(6) Gum acacia-acetic acid solution: 5g. gum acacia was
dissolved with heating in 500 ml. water. After cooling
and filtering, the filtrate was diluted to 1 litre with
glacial acetic acid.
(7) Standard salphate-sulphur solution: 5.442 g. dried

28.
Analar potassium sulphate was dissolved in water and
diluted to 100 ml. This concentrated stock solution
contained 10 mg. sulphate-sulphur per ml. The working
standard solution (containing 10 pg. sulphate-sulphur per
ml.) was prepared daily from the concentrated standard by
diluting it 1000 times with water.
(8) Barium chloride crystals: Analar BaC122ff20 was ground
to pass a 1 m.m. sieve.
(9) Barium sulphate "seed" suspension: 9g. barium chloride
crystals were dissolved in 22 ml. water and 0.5 ml.
potassia72 sulphate solution (containing 1000 p. p.m. sul-
phate-sulphur) was added. This was brought slowly to the
boil and then cooled quickly, so that stable crystals were
formed (90, 91). 2 ml. of the gum acacia-acetic acid
solution (reagent 6) wan then added. This "seed" sus-
pension was always prepared one day prior to use.
Procedure for evils.
lg. 0.5 m.m. sieved air-dried soil was teighed into
a 20 ml. silica crucible, treated with 2 ml. magnesium
nitrate solution, and the contents evaporated to dryness
on a water-bath. The crucible was then placed in an
electrically-heated muffle furnace at 30000 for at least
16 hours (usually overnight), After cooling, 5 ml.
31.2 nitric acid was added and t e contents digested for

29.
about 2.5 hours on a water-bath. The contents were then
transferred euantitatively to a 50 ml. graduated flask
and diluted. to volume. After thorough shaking, the
contents of the flask were filtered through a dry Whatman
No. 42 filter paper. 5-10 ml. of the filtrate were
placed in a test tube (6 in. in.) calibrated at 25 ml.
2 mil. of acetic-phosphoric acid reagent rap added, the
solution dilated to about 22 ml. and after shaking, 0.5 ml.
of the barium sulphate "seed" suspension and lg. barium
chloride crystels were added successively. All tubes were
stoPeered with rubber bungs and inverted 3 times. They
wore left for 10 minutes and then inverted 10 times.
After another 5 minutes, the tubes were inverted 5 times
and after another 5 minutes 1 ml. of the gum acacia-acetie
acid solution added. After dilution to the 25 ml. mark
the tubes were inverted 3 times and left to stand for 1.5
hours. The tubes were then inverted 10 tines just before
pouring the contents into the 4 cm. cell for turbidity
meaoureeent in the Hilger Biochem. abeorptiometer using
the dark blue filter Standard curves were prepared
freshly each time a batch of eoletions were analysed by
placing. 0, 1, 3, 5, 8, 10 and 12 ml. of standard solution
(containing 10 rig, ealyihete-sulphur per 11.) in a series
of 25 ml. calibrated tea;: tubes. To each of the tubes

30.
2.5 ml, of 25;°. nitric acid and 2 ml. acetic-phosphoric
acid were added and turbidity diveloped exactly as des-
oribed above for the unknown solutions. A standard
graph was drawn and the amount of sulphur in the unknown
solutions determined. With practiee, it was found, that
the staadard curves were almost identical from day to day.
Proeedure_fav plaflt and organic materigis.
0.2 g. of the dried finely-ground material was
weighed into a silica crucible, treated with 2 ml. fuming
nitric acid, and toe covered crucible allowed to stand
overnight. The contents were then evaporated to dryness
en a steam-bath. The residue was treated with 2 ml. of
magnesium nitrate solution., the contents evaporated to
dryness on a steam-bath and the crucible left for about
16 hours in an electrically-heated muffle furnace at
45000 (it was necessary to place the crucible in the cold
furnace and bring this up to temperature, otherwise same
of the contents were lost through excessive "frothing").
After cooling. 5 ml. 25/, nitric acid was.added to the
crucible and the contents warmed on a steam-bath for about
30 minutes. 'hey were then transferred quantitatively
to a 50 mi. graduated flask and made up to .volume.
After filtering til6ugh Whatman No, 42 filter paper the
sulphate deterAnation was carried out as described under

31.
the "Procedure for Soils" with the only difference that
only 1.5 ml. of nitric acid (257') was added to each tube.
Details of the method used in this study for deteraininA
sulphate in soils.
10g. air—dried 2 m.m. sieved soil was placed in a
boiling tube and 20 ml. water was added. After stoppering
with a rubber bung, the tube was shaken - for 15 minutes in
a mechanical reciprowyting shaker. 0.04 g. animal
charcoal. (Norit NK purified by boiling with concentrated
hydrochloric acid, washing and drying) was then added And
shaking continued for another 15 minutes. A blank was
always carried out to allow for the traces of sulphate
present in the charcoal. After filtering thvath a No. 42 Whatman filter paper the sulphate content of the filtrate
was determined as described under the "Procedure for Soils",
the only extra addition being of 2.5 ml. 25;' nitric acid
to each tube. The use of charcoal usually reaoved all
colour from the extracts, but where with a few soils this
was not achieved a blank was carried out using all reagents
except barium chloride and the seed suspension. The
extinction value thus obtained was subtracted from that obtained with the full reagent treatment so as to correct

32.
for the extinction due to the colour of the extract.
Determ nation of maximum water _heldinacvaciti ot soils • and sand.
10 g. of the air—dried 2 an. sieved sample were
weighed into a tared 25 ml* porcelain crucible with a
sintered porcelain base. '.:2he crucible was placed in a
flat dish containing water up to the level of the sintered
disc. After allowing adsorption of water by capillary
action for at least 4 hours, the crucible was removed,
its outside wiped and weighed. The water uptake
represents water adsorption at a pP of virtually zero.
Dot rmina total nitron in soils and lant mat
The Kjeldahl digestion method was used, using 2 g.
air—dried 2 mm. sieved soil or 0.10g. finely—ground plant
material, 6-7 ml. of concentrated sulphuric aeid, 2g. of potassium sulphate and 2 drops of selenium oxychioride as
a catalyst. Ammonia was determined by cteam—distillation
in the usual way.

33
DeterminrItion of organic carbon in soil.
Walkley and Black's (86) rapid titration method was
used.
Determination of pH in soils.
The ph of the soil was determined by the Cambridge
pH meter using the caletel—glass electrode system, and a
soil:rater ration Of 1:2.
'Determination of carbon mineralia tion during incubat
pf soils treated with organic material.
The method described by Cornfield (92) was used.
This consisted of mixing the dry sieved soil with
quantity of the ground organic material (1-2) and placing
the mixture in a 6" x 1" tent tube. The mixture WAS
wetted to 5O of its maximum water holding capacity.
A small vial 'containing 0.02g. barium TY,rolide and 1 ml
water was placed on the soil in the test tube which was
then closed with a rubber bung. The test tube was then
incubated and, after varying tile intervals the vial was
withdrawn, replaced with a freshly charged vial each time,

34*
and its carbonfite content deterAned in a modified Collins
ealcimeter. An appropriate blank was put thr-mgh in the
same y.
Soile were analysed for ammonia and nitrate after
extraction with N-sodium acetate, using the modified
Conway method described by Bremner and Shaw (93), Annonia
was determined by addition of magnesium oxide suspension,
and nitrate-amonia by addition of magnesium oxide sus-
pension plus titanous sulphate
_ination of the 21aY content of soils.
The clay content of the soils was deterTined by 4
modification of the Bouyouces hydrometer method (94).
The air-dried sieved soil (25 . 50g.) was dispersed by
mechanical shaking for 30 minutes with 1;: Calgon (sodium,
hexametaphosph-te) in 0,1N-sodium hydroxide (100 200 ml )
The contents were then transferred to a suitable size of
graduated cylinder, made up to the mark, shaken vigorously,
allowed to stand for 5 hours at 20°C, and the density then

measured with the h drometer.. A blank rnm done tvt the
same time. Previty.ls,work (94) had shown that this
method geve very similar results for clay content as
compared with the more tedious pipette method. •
. itnntion of the free carbonate in sells.
This ras deternined in a modified Collins ciloimeter.

36.
CHAPTER III
THE SUIMATB-OULPHUR AN]) TOTAL SUL2HUR 0)31T3 O'
ClaTIVAT2D SC)ILS AND TIBIR RELATION6RIP TO OMR SOIL
CONqTITMINTS.
Introduction.
Kothods.
Results.
Relationship between total sulphur and other variables.
Relationship between sulphate and other variables.
Nitrogen/sulphur ratios,
Discussion.
Summary and Conclusions.

37*
Introduntien.
The literature review has indieted that most of
the sulphur occurring in send does so in the organic
for: and that sulphate occurs in relatively enall,
though variable, amounts. In addition, very email
amounts of'nO21..aulphate inorganic sulphur, such as
sulphides, thiesulphatee, and elementary sulphur, have
been reported (46, 77, 95, 105, 106). Work in America,
Australia, New Zealand and Scotland (69, 70, 71, 75, 98,
99, 100) has shown a relationship between organic carbon,
nitrogen, and sulphur contents. The sulphate.eontent
of soils has also shown to be positively correlated With
clay content (49)
Since no systematic study appears to have been made
on English soils the purpose of this chapter is to doll-
cribe the inter-relationships of the above factors in a
variety of cultivated soils. The soils used were
sampled in various parts of southern England, where it
was possible to obtain soils varying widely in erg:1711c
matter, clay content, and pH, and including calcareous
soils* The range of soils obtained are probably
representative of those occurring in most parts of the
country. The samples selected for analysis do not
represent a true etatistical sampling of s of the

38.
area, but rare selected to give a we range of the
characteristics studied.
Methods.
From about 100 samples collected, 63 were selected
on the basis of values obtained for pH, org-aic carbon,
and clay contents pH ranged from 3.86 to 8.50, organic
carbon (Walkley-Black values) from 0.71/, to 12.30;, and
clay from 3.5; to 35.O. 17 calcareous soils containing
0.46 to 61.1 free carbonates (.,xprossed as calcium
carbonate) were included.
2rior to analysis all samples had 'Wean air-dried and
ground to pass 2 mm. sicve
The 63 selected saaplerwere analysed forsulrhate-
sulphur and total sulhuri Details of all analytical
prooedur.s used have been described in Chapter II.
RL11j3.
Results of all analyses are given in Tables 1, 2 and
3 The results were divided into three tables on the
basis of pH valuest

39.
Table 1 — Soils of pH less than 5.5 Table 2 — Soils with 1,115.5 to 7.0
Table 3 . Calcareolrks soils. All soilik with pH greater than 7 contained free
carbonnten, but 4 soils containing free chalk had pH
values slightly less than 7. it was decided to treat these as calcareous soils, because it was felt that the
presence of free chalk was more inortant in deter-.
rAning soil properties than was soil pH.
In each of the three tables results are arranged in
increasing order of total sulphur content.

la o al Blaok nitrogen (/1 uis
40. Wae
Total sulphur, sulphate-sulphur, Walkley.Black carbon; total, pH <5;5 arranged in increasing order of total-sulphur. Soil No.
To al sulphur
phate sulphur (15.n.m.)
u1. cuiphur an of T.S.
ph
51 120 11.2 9.33 4.30 60 200 15.0 6.25 4.90 61 225 12.0 5.33 4.56 50 230 17.0 7.40 4.10 12 305 21.2 6.95 5.10 17 330 19.2 5.81 5.30 41 332 33.0 9.94 4.10 59 350 45.0 13.70 5.24 11 365 17.5 4.79 4.60 38 380 37.0 9.73 3.86 49 387 24.0 6.20 5.40 14 450 21.0 4.66 4.50 20 520 80.0 15.38 4.10 18 635 32.0 5.04 4.44 48 760 35.5 4.67 4.94 54 870 125.0 14.34 4.86 45 980 37.6 3.84 4.20 8 110u 14.0 1.27 5.18 47 1415 125.5 0.36 5.00 34 2150 22.3 1.04 5.30
utean 605.2 37.25 7.23 4.69
(a) . this ratio with exceptionally high value for organic value
nitrogen and clay contents in soils with
Carbon ) 0.84 0.100 5.6 10/1.0 0.91 0.101 8.5 10/1.8 1.03 0.133 3.5 10/1.6 1.70 0.115 22.3 10/1.8 0.84 0.129 19.G 10/2.2 2.91 0.133 5,3 10/2.3 1.74 0.133 10.2 10/2.2 1.18 0.123 14.5 10/2.4 2.94 0.217 10.5 10/1.6 2.82 0,205 9.7 10/1.7 1.90 0.175 16.0 1C/2.0 2.46 0.210 9.2 10/2.0 4.20 0.252 10.6 10/1.7 2.25 0.231 12.3 10/2.6 3.66 0.271 35.0 10/2.7 7.50 0.502 7.5 10/1.5 3.77 0 296 8.2 10/3.1
10.20 0.442 20.0 10/2.4 7.05 0.527 6.10 10/2.4 12.30 0.213 8.20 10/9.2(a)
3.61 0.2256 12,11 10/2.2
carbon was excluded fron calculation a on

TabIle aii Total-sulphur, sulphate sulphur, Walkley.Black carbon, total arranged in increasing order of total sulphur.
ooll No.
xoial- sulphur (P.P.m.
Su1p_l e- sulphur
.m.
.,s p 22r as Li., of T.S. plt
46 112 6.0 5.36 5,50
52 340 22.4 6.58 6.40
Oil. 553 10.3 2.92 5.92
58 360 19.0 5.28 6.50
29 370 14.8 4.00 6.80
380 56.0 14.74 5.92
2 405 27.0 6.67 6.58
1 425 22.3 5.28 6.00
3 435 11.4 2.62 5.70
16 472 24.0 5.08 5.50
51 472 11.2 2.37 7.00
35 495 32.2 6.50 6.20
57 500 125.0 25.00 6.00
4 520 21.6 4.15 6.60
44 545 94.0 17.25 6.90
39 575 21.0 3.65 6.90
32 600 12.0 2.00 6,50
55 610 112.0 18.52 5.90
42 640 96.0 15.00 5.84
23 784 23.2 2.94 6.10
24 787 36.0 4.56 6.00
25 787 55.2 6.75 6.60
26 790 36.0 4.56 6.00
27 787 36.8 4.67 6.00
40 790 155.0 19.62 5.80
9 1085 10.0 0.92 6.00
(a) in on., ation of (N/3) ratio those 3 numbers with
41.
nitrogen and clay contents in soils with R (7.0-5.5)
Y- Black
a nitrogen NA
0.71 0,070 6.1 10/1.4 1.43 0.150 15.0 10/2.0 2.88 0.138 5.1 10/2.5 3.30 0.151 5.1 10/2.2 1.72 0.175 7.6 10/2.0 1.18 0,123_ 15.6 10/2.6 2.22 0.30/ 8.4 10/1.2 2.85 0.126 4.8 10/3.1 2.15 0.010 9,0 10/42,0(a) 1.77 0.07(.; 12.3 10/6.3 (a) 1.80 0.210 7,8 10/2.1 1.87 0.224 27.0 10/2.0 1.48 0.188 34.0 10/1.9 2.49 0.316 8.5 10/1.5 2.10 0.216 8.5 10/2.1 2.25 0.238 8.8 10/2.3 4.50 0.245 12.0 10/2.3 1.71 0.233 11.3 10/2.0 1.95 0.224 10.4 10/2.4 2.40 0.315 11.4 10/2.3 2.50 0.250 U.S 1°/5.0 2.35 0.263 11.5 10/2.7 2.55 0.280 11.7 10/2.3 2.46 0.280 11.4 10/2.3 1.95 0.221 9.9 10/2.8 6.35 0,175 15.5 10/5.7 (a)
2.34 0.199 11.54 10/2.3
exceptionally low values for T.N. were excluded.

otal Su phate. Sul.= p ur No. sulphur sulphur as !-/, of T.S, pH
.7) M
42. Tal4o
Total-sulphur, sulphate-sulphur, pH, organic carbon Nalkloy. soils arranged in increasing order of total sulphur.
(53) 420 48.0 11.43 7.20 (5) 455 18,0 3.96 8.18 28 525 13.8 2.63 7.68
21 570 15.0 2.63 6.70
19 575 33,0 5.74 7.16
22 670 90.0 13,43 6.96. 36 675 86.0 12.74 7.30
15 712 32.8 4.61 7.24 -730 112.0 15,34 7.10
840 32.0 3.81"8.50 30 840 78.0 9.28 7.50 10 1050 14.5 1.37 7.74
33 1050 190.0 18.05 6.6
56 . 1150 74.0 6.43 71
13 1216 22.4 1,85 7.2
43 1333 120.0 9.00 6.9 37 1775 27.0 1.52 7.1
raean • 858. 99.2 7.28 7.3
These 2 sa,aplee contain exceptionally high Caeo3 content. (a) Tee with exceptionally low nitrogen content, were
Black), total nitrogen, clay, and CaCo3 content of calcareous
)afitiey- Black cry C.(`)
ffoial nitrogen
(`[- f,)
0fay W
We), N/S
1.34 0.154 10.2 0.84 10/2.3 1.48 0.189 24.0 0,30 10/2.2
3.28 0.263 11.0 0.48 10/1.8
3.40 0.386 9.1 1.11 10/1.4
1.70 0.231 10.7 2,00 10/2.3
2.30 0.315 11.3 0.56 10/1.8
1.50 0.010 20.3 51.10* 10/58.0(a)
2.22 0.070 9.4 2.04 10/9.0 (a)
2.01 0.063 18,1 1.30 10/8.7 (a)
2.32 0.119 20.2 3.75 1U/6.4
3.19 0.370 19.0 38.60' 10/2.0 2.76 0,329 14.1 2.70 10/3.0
3.40 0.385 13.7 3.80 10/2,2 2.79 0.372 12.6 5.30 10/2.7
2,65 0.332 15.0 6.25 10/3.3 2.79 0.292 9.8 7.27 10/4.0 3.60 0.321 16.5 3.56 10/5.2
2.51 0,247 14.41 8.30 10/2.5
excluded Fran mean ealculaticin.

43.
Total sulphur
The range and mean values of total sulphur for the
three pH groups are shown below:
pH roup total S range Mean total S P.p.m. 5 1).1)4,16. S
< 5.5 120-2150 ,505
5.5-7.0 112-1085 554
calcareous 420-1775 B58
652 (overall)
It is seen that all grave showed a wide range in
total sulphur content. The mean value for the calcareous
group wal so-newht higher than those of the two other
groups.
Siilpate
The range and mean values for salpimte for the three
pH groups are shown below:
SO ranpe ?lean SO P.P4m. S
< 5.5 11.2-125.5 37.3 5.5-7.0 6.0.155,0 41.9
calcareous 13.8-190.0 59.2
45.0 (overall)
Again all groups showed a wide range in sulphite
contents, with the calcareous soils averaging more than
the other two groups. Sulphate-sulphur as a percentage

44. of total sulphur averaged 7.23, 7,58, and 7.28 for the
pH 5.5.7.0, and calcareous groups respectively.
Relationships between total sulphur and other variables,
Table 4 gives the linear correlation coefficients
between soil total sulphur and sulphate—sulphur and pH,
organic carbon, total nitrogen and clay for each pH
group and for the soils as a whole. Also given is the
correlation coefficient for free carbonates and total
sulphur for the calcareous group.
When the soils were considered as a whole there was
a highly significant correlation between total sulphur
and-sulnhate. When the individual pH groups were con—
sidered no significant correlations occurred, but it can
be seen that the value of the correlation coefficient
tended to increase with decreaing pH of the groups.
There were no significant correlation coefficients •
between total sUlnhur and pH for the soils as a whole
or within any pH group. However, the, value for the
oils.ris a whole was very near significance.
. , There were highly significant correlation coefficients
between total sulhur and organic carbon for the soils as

45.
a'rficle and group. The value for - the
group Wan'particularly high (r 1=- 0.910,,
etal:sUlPhur and'total nitrogen were significantly or highly, tgnificantly correlated for the soils an a
ele an,,Teil: #aa for eadh pH group. This .confirms reslAlts.ibbtined by oth,er. workers (69, 704 75, 99, 100).
Ctal_OphurjAnd clay content were poorly
correlated fOr thenoils:as a whole and for each pH -group. !
When the two soils containing, excentionally high
Carbente2 (3W - and 6TA - CaCO3) were excluded frort the - calculatien between total sulliftur-and:carbonateS for the
:calcare6:1s4reup, the remaining soils (o48 to ,7,274 CaCO3) showed a h y significant correlation coeffieien between the. two

all soils 4 5.5
5.5-'7.0
0.235 0.910**
6:557,** 5 07 calcar-u eos all soils 0.689** 4 5.5 0.52 * 5.5700 0.538** calcareous 0.579*'
all soils 0.550** < 5.5 0.024
5.5-7.0 0.170 calcareoy;.s 0.059 all boils 0.093 calcareous 0.765**
ti n
highly siGnificant
. m to It n • n ni.
significant highly ignificant
ft n n
not significant n n n n
• to CI
highly sigaiiicant'(a)
46. Table (4) Correlation coeff‘icient (r) between _soil total-sulphur content ana othcr cmli values. wen*. MIIMMI.V.•
ReTark
not significant n n
highly significant not significant
Al " IT calcareous -0.240. 0 n n
arganic-carbon ' m m
m n
" n
total-nitrogen n - . n n n . ft et
clay-content It n
.11 " 0 n .,
' free carbOnate
0.178
• significant at P = 0.05 ** significant at P = 0.01 (a) in this calculation the two soils (30,36) which contained-exceptionally high values of OaCO3 were excludcd. fro:71 calculation of (r) value.
total S correlated with
soil nil range_
sulphate-sulphur 4 5.5 0.350 m n 5.5-7.0 0.250 ,o, n •
n II
calcareous all soils 0.395**
PE < 5.5 0.340 n 5.57.0 -0.008

47.
Table 0) Correlation coefficient between soil sulphate-sulphur content and other soil vaules,
sulphate-i soil correlated with pH range
r Remark
tt
Vt
tt
< 5.5 5.5-7.0. calcareoun all soils
4 5.5 5.5-700 calcareous all soils
5.5 56-7.0 calcareous
0.009 not significant .0.177 . tt -0.515* . significant
0.079 not significant
0.350
ft
ft
-00294
tt
Vt
0.094
0,059
ff
Vt
0.624" highly significant
0.198 not significant
0.072 I
highly significant
not significant ft
It Vt
Vt
It
(a)
pi ft
Vt
vt
organic carbon ft ft
ft
ft
total nitrogen 0
it
all soils 0.32 **
clay content < 5.5 -0.175 Vi
ft
5.5-7.0 0.352 It
11 calcareous 0.005 If all soil 0,124
calcium carbowyto cal- 0.30 c.Ircous
* significant at P = 0.05 ** significant at P. = 0.01 (a) in this calculation the two sOils (30, 36) which contained exceptionally high values of CaCO3 were excluded from calculation of (r) value.

48.
Relationshi_s between ,sulphate tnd othorvarlable
Correlation coefficients are shown in Table 5.
,i1 vAlphate and ph showea poor correlation for
'the soils as a whole and for the pH< 5.5 and_ pff5. -7.0
Groups, bat .111eeet ignificant ncGutive ourreltion
for to calcareous group.
2ulphate an organAc carbon showea poor correlation
for the.seils as a whole as well as 3!1' the different
ph group
uipte and soil total nitrogen shorila highly
slignificant correlations for the soilb As a whole and
for the pH < 5.5 group, but poor correlations for the
two other pi groups.
sulphate correlated poorly with roil carbonate content for the calcareous group OVOA wimri the'hig4-
carbonate cilc wore excluded from the cale,,Ilotion..
All the above relationships are shown diagramatically
in Figures 1-10. Each diagrafl. presents the soils as
a whole with the individual pa groups indicated.
Exceptionally high valuos were in soae oases left out,
but these, with the exception of theligh carbonate
values, were included in the correlation calculations.

X
• 0
•
• 30 •
0 • 0 X
• 0
0 IIP
X X • X
• • ex 0
• • x xx
•
0 X
40 80 04 ti
70 04 g 60
5
A 40
20
1( 0 •
X
0
0 •
0 0
1500 1760 1000
Fig.'. Relationship between total Sulphur and Sulphate-
Sulphur in Soils.
130
120
110
100
• pH < 5.5
pH = 5.5 - 7.0 O Cale. Soils, 0 Du 7.0
Q
• •
To Sulphur tPoP.M.)

Fig. 219Alationship between pH values and total Sulphur
in Soils.
1 • pH (5.5 13004. I x pH =-- 5.5 - 7.0
12001. 0 CalC . Soils
0 PH > 7.0
1100, •
.
•
a
0
• X
O
O
O 0
•
O
100. •
X X 0
• • a
6 •
• •
• 7 7.5 5 6
pH Values

Fig. 3. Relation between organic carbon (Walkley and Black's
Method) and total Sulphur in Soils.
1300/ • pH <5.5 x pa= 5.5 - 7.0
, o Cale. 1200,
0 > 7- 0
11001
1000 •
9001,
C14 • 04 800
ciS El 700
600
500-
O
0 xxlc
0 0
x x *ye • 0
0
• 0
o • x
• yC X
400* •
• X • • X •
•
300; •
200 • • •
• 1001 •
0 1 2
3
C %.
0
0
O O

Fig. 4. Relationship between total nitrogen and total Sulphur in Soils.
• la <8.5
x pH tr. 5•5 7o0 0
o
) 7.0
Cale Soils 0
0
• x
• 800
31 A 1" X A
0 700
• 0 600
"g 0 se 0
0 g
%at •
400
300
200
100
• • •
•
•
•
• .
•
0.1 0.2 0.3 004 0.6
0

Fig. 5. Relationship between pH-values and Sulpha Sulphur
in Soils.
130 7
o o 1201-
110 f• 0
100
0 0 90
0
80. 0 0
0
70
i 60. O
50 0 O
0 0 0 0
30 , 0
0
40
O 0 6 o
0 0
20
0
0 0
0
0 o 0 0
0 0
6 0 0 0 0 0 0 0 0
oo
0
0
0 0
10,
0 4 5 6 7 7.5
-PH. Value

Fig. 6. Relationship between organic carbon VNalkley and Black's Method) and Sulphate-Sulphur in Soils.
140
130
120
• pH 45.5 - x pH= 5.5-7.0
Cale. o kra >7.0
0
0
110
100
0 90
• 80
o
80 0
40 • • • A 0,( 0
•0
30 • X 0
Xit 0 20 • • •
•
10 X
0 0 1.
2 C % 3
4

30
20
101 0
a • 6 X
• • • X 0 •
•
•
$ 0
x
0 •
0.4 0.6 0L.
0 0.1 0.2 0.3 %
X
Fig. 7. Relationship between total nitrogen and Sulphate-Sulphur
in Soils
• pH <5.5 • pH -at 5.5 - 7.()
0 Cale. Soils.
o gHl 7.0
X
100
90
0
•
80 QI
70
foi 60
0
•
0 0
130
120
110
0 .
40 • •
X 0 • 0

• • • • •
X
X •
Fig.(8) Relationship between clay content and
total sulphur in soils.
0 1.300
1200
1100
1000
900
S ch 800
ci 700
H.
600
500 I
400
300
200
• 100
0
• •
O 0
•
• 0 0
0 0
•
• pH < 5.5 • pH a 5.5 - 7.0 O pH 780 • Cabo. soils.
0
• • •
le.
0 6 10 15 Clay %
20 25

rt
Fig. (9) - Relationship between clay eontitnt and
Sulphate-Sulphur in soils.
130
120
• •
•
• pH < 5.5 pH = 5.5-7.0
o FH )7.0 • Ciao. Soils
a 0 110 .
100 .
90 O
• 80 • •
70
60
50 • 0 •
40 • •4
o e • •
30 - It 0
If •
X AON
• a 0 •
20 • a • • a •• o it • •
• •
10 • PIP X X •
SC
0 5 10 15 20 26 Qv 5.

3 9 5 6 7 8 9 10 % CaC01
Fig, (10) ,Relationship betimen chalk & total sulphur
in Calcarsoue Soils.
1300
1200
1100 4.
1000 4.
• 900
800
Total-sulphur (r. p.m.)
v00
x
600 +
500.
400
300
200
100

49
itrogen/sulnhur ratios.
The ratios of soil total nitrogon to total sulphur
less water-extractable sulphur for all eoila are shown
in the last column ot Tables 1 to 3. This ratio' la
essentially that of organic nitrogen to' organic sulphur,
:and will be referred to hereafter as the N/5 ratio.
The convention of . taking nitrogen as 10 was adopted so
that the results could be compared with those given by other workers, most of IvhoTri have adopted this convention.
For the pH< 5.5 group 19 of the 20 soils had N/S ratios ranging. from 30/1.9 to 10/3.1 (mean 10/202).
.The odd - soil . whidh:had :an exceptionally narrow ratio of
.10/902 differed from the ether soils only in that it was exceptionally high in Organ., c carbon. , -
For the pH 5.5-7.0 group '23 'of the 26 soils had
11".ratios ranging from 10/1.2 to 10/3.1 (mean 10/2.3)
Of the other three soils two' had ratios of 10/5.7 and
10/6.3, whilst the other .had a. most unusual ratio of
10/42. These odd soils were all unusually low in total
nitroge
For the calcareous, group he -bu the soils,
nately, 14 out of..17, had N/S ratios ranging from 10/1.4
to 10/6.4 (mean 10/3.0. - The odd soils had ratios .
ranging from.10/8.7 to 10/58. The three odd soas 'were

50.
very low in nitrogen compared with the others.
The above results are summarised in the table
below (the soil have not been included):
vl growls ws rangp
mean WS < 5.5 .10/1.0 - 10/3.1 10/2.2
5.5-7.0 10/1.2 - 10/3.1 10/2.3
calcareous 10/1.4 - 10/6.4 10/3.0
all soils 10/1.0 10/6.4 10/2,5
Diqcussion.
The water-soluble sulphate-sulphur content of the
soile studied showed very wide variations. The mean
values for each pH group showed a trend for sulphate to
increase with soil pH, with not much difference between
the two lower pH groups, but with calcareous group
averaging about 50;L more sulphate than the other two.
This may be due to adsorption of sulphate on calcium
carbonate or precipitation of calcium sulphate within the
particles of calcium carbonate or "co-crystallization"
of inorganic sulphates with calcium carbonate as
suggested by Williams and Steinborgs (69), Williams et
alia (99). Such sulphate may be retained in the soil

51*
against the action of loachins* but in (=xtractable by
the half-hour shaking with rater need for deter,lining
water-nollAblo sulphate in this study.
Although sulphate-sulphur expreo,cd as a percentage
of total 13 varied t, a fair extent in all pi gioupi the
lean values for the three ph groups were very similar,
ranging from 7.235 to 7 5.8* With the exception of a
few soils it appears therefore that sulphate-sulphur
constitutes only a sm-111 fraction of the, total sulphur
content' and in general this fraction appears to be
independent of soil p1. This is confirnod by the highly
significant correlation between the two factors when the
soils are considered as a whole.
Inorganic sulphur cupounde in soils may be present
an water-soluble sulphates, water-insoluble sulphates
such as bariura and strontium sulphates as mentioned by
Villiams et alia (99) and non-sulphate inorganic forms
such as sulphides, sulphites, eleNentary sulphur,
polythionatee, ate. all of which have been detected in
soils (77, 105, 106). !hc latter forms where sulphur
is in lower oxidation states than in sulphate are likely
to be present in negligible amomitm in norial well-
aerated cultivateJ soils* Sulphate may even be present
in soils attached to organic matter in neovalently.bound"

52.
form as suggested by Williwas and Steinbergs (54).
Such sulphte may be split, from the soil by heating (54), hydrolysis (99), grinding (106), or drying (104). Clay '
soils may also co,:ltain basic sulphates soluble in.
dilute acids but not in rater (99). Until the role of
thee compounds has. been worked out, it is probably
sae to asellme for the present that it is the water
soluble sulphatefraotion of soils which is the main torn
inWhich plants obtain their sulphur* The other forme
may be important in helping to replenish the coil Solution
with sulphate as this is removed by plant uptake or
leaching.
Organic carbon was poorly correlated with sulphate
in the soils as a whole and in the three PR groups with
the exception of the. plif 5.5 group, where the correlation
approached significance. Total nitrogen, which io
essentially organic nitrogon, was significantly correlated
with sulphate in the soils as a whole, but the two factors
showed a particularly high correlation coefficient for,
the pli.(5.5 group. The two other groups showed poor
correlation between the two factors. This indicates
that in acid soils the humus content, as measured by
organic carbon content, or better still by orgn.nic
nitrogen content, probably deter-lines the level Of

sulphate present.
The poor correlations between sulphete and clay
contents with the exception of the p74 5*5-7.0 group,
where the correlation only approached significance
indeLcates that clay content in Itceif is likely to be of
little value in indicating soil sulphate level. It is
Hlikely that the type of clay present as well as the
amount present may be important in this respeet (36, 52)4
The poor correlations between soil pH values and
total sulphur indicates that IF in itself is of little
value in determining the total sulphur content o: the
seilc,
Total sulphur isjlighly signi,ficantly correlated
with both organic carbon and total nitrogen for the soils
as a whole as well as for all pH groups. Little is yet
known of the nature of the bulk of the organic latter
present in soils though a number of organic suWiur
compounds have been detected in soils. Anent these may
be mentioned eystinet.methionine (106, 108, 109, 110),
trithiobenzaldehyde (106), mercaptans0 sulphonie acids
(106) and oholine sulphate (1120 113). In addition,
thiamine,' biotin° ethereal sulphates, and thiourea may
well be present since these compounds are essential for
_badterial activity or are products of this activity.

54s
Since th,7,., bulk of organic matter in cultivated soils is
derived from plant and animal residues it will contain :
protein from these sources as well as protein of microbial
origin arising from microbes attacking these residues.
Since protein and' its degradation products are composed
of compounds containing carbon, nitrogen, and sulphur it
is not surprising that a high correlation exists between
total soil sulphur (which is essentially organic sulphur)
and both organic carbon and total soil nitrogen (which
IS essentially organic ,nitrogen).
The poor correlations which exist between soil clay
contents and total sulphur for the soils as a whole as,.
well as for the.three.pH groups indicates that clay
content in-itself..is , of'little value in deternlning • he.
total sulphur Centent'of soils.
The highly significant correlation between. total •
sulphur and porcentage, of calcium carbonate in the
calcareous group is intereSting, particularly in view Of
the fact that water-soluble sulphate is poorly correlated
with carbonate content . This may be due to the fact
that water-insoluble forms of sulphate such as barium
and strontium sulphates may be present. Williams•et -
alia (99) have in fact shown that the barium and strontium
contents of calcareous soils are -positively eorrelsted

55.
with carbonate Contents. Alternatively basic sulphate
(99) which are soluble in dilute acids but not in water
may account for this. Finally there is a possibility - ,
that the covalently-bound sulphate (54, 106) is held
even mere XirAlt in the presence of free calcium
carbonate. All these for4s of sulphate are water-
insoluble but would be included in the total sulphur
figures and this could account for the high correlation
between total sulphur and carbonate content and the
relatively low correlation between water-soluble sulphate
and carbonate content.
Results obtained for / ratios, if we exclude the
few nodd" soils, indicate that there is a three- to five-
fold variation in the range within the three pi groups.
Between tie three pa groups although there was a trend
for the mean VS ratio to increase with pH, the relatively
wide range of ratios within the groups indicates that this
trend is probably significant.
The seven "odd" soils, namely, those containing n
unusually high proportion of sulphur to nitrogen in
comparison with the other 56 soils studied, differed from
tbom in having either an unusually high organic carbon Or an unusally low nitrogen content contents The possibility arises that these odd soils
• contain an unusually high proportion of organic sulrhur

56.
compounds which lack nitrogen. In this connection Barrow (114) has sugge d thrtt sulphur may be present in soils L sulph. tea sugar derivatives (such as are present in sole =sins Altern-tively„ these soils may have been treated with organic manures such as peat, which may have an unusually high proportion of sulrhur to nitrogen. Finally, the possibility of the presence in these soils of inorganlo non sulphete water-insoluble forms of sulphur cannot be....okoluded.
It is of interest to :compare the raean ratio this study with those reported • by other
Milian° et alia (98# 99) found a dean 17/S Value of 10/1.4 for calcareous* soils when su3.phate was *eluded and the same ratio for non-calcareous soils When,
sulpb.ate was , included. In a further -paper (69) they reported values of .,10/1 2 for acid and' 10/1.5 for alke.line soils. Evans and' Rost (46) found a mean rat f 10/1.5 ft'-.)r black prairie and podzel ,soils Thus
the, mean 'overall 10 ratio (10/2.5) foUnd in this study *6-'moteriall wer than those reported by the. other workers. The reasons for thi difference are not readily apparen OnO „reason may,' be due to the fact that the coils used i this study:were all , cUltivated soils which .had proouriably received sulphur-containing

57.
fertili.zere (superphos.phate, ammonium and potassium, sulphates) which- may h!:Are resulted in an accu-:.u:!ation
sulphur compounds derived fr3,1. plant roniclues unusually rich in sulphur. .ehis is eliPported by the
• Viet tilat the other workers have included non—cultivated nex~-ferti.3 iced ec i1 - in their mean values. In additinnv
here.. is. a pee ibility that- -the Methods, used by these work.ars for deterdtining total sulphur .in soils did not result in complete' recovery of sulphur. This could account at , least partly, :for the wider mean Ws ratios obtained by them as' compared with those obtained in this
y— hree Cultivated soils.varyin widel texture and PH were analysed for total sulphur, water—%tractable sulphur, total nitrogen, organic carbon alkle Black method) and in the calcareous soils,
free oarbonate 13 • The.different values' were correlated tor the soils .ass whole as well as for three pH groups,
viz. pH < 5 5 pA 5.5,-7.0', and calcareous soils. Water—soluble sulphur, which was essentially

58.
sulphate, tlocounted for ,0•92-25.0;) (mean 7,36) of the
total'sulphur for the soils as a whole. Rach pit croup
also showed wide variations in this value, but the
Means for each group were very similar. Zulphate was
significantly correlated with total sulphur .for the
soils as a whole, but not within the pit groups.
2. The calcareokw group containd on an avor:ce more
total sulphur and sulplvAo tban did the two other groups.
This is probably duo to the presence of insoluble.
r.11.1pht-Ae and/or basic sulphates do—erystnilised with the
inorganic carbonates. Total sulphate was cin1±icantly
correlated with erbonate content.
3. , Total slaphur was significantly dorrelted with
both total nitrogen and 'organic carbon in the soils as a
whole as well as within each pH group. Sulphate was
Significantly correlated 'with total nitrogen in the soils
ris a whole and in the Iola< 5.5 group but not In the two
other groups. Sulphate was.poorly correlatod with
organic carbon.
4. • Neither total sulphur nor oullate were correlated
with clay content either in 'the three pH croups or in
tile soils RS a wIlole,
5. The ratio organic nitrogen/orgnic oulphur (N/S)
for all but 7 of the 63 soils fell within the -range

59.
10/1.0 —10/6.0 (can 10/2,5). The 7 "odd" soils, containing higher prop ions of'sulphur, were also
unusuaL. in having very to nitrogen values or very high
organic carbon values, There was little difference.in
the mean N/3 ratio between the three pH groups* The
overall mean N/3 ratio of 10/2,5 was sere that narrower
than tha-1; reported by worlzers in other :parts of the world
(10/1,4:— 10/1.5). This discrepancy may be due to the
fact that theYsoil' used in this study, being cultivated
soils, had been fertilized and thus tended to accumulate
more sulphur in organic form. Alternatively the method
of deteraining organic sulphur used by other workers may
have Under-stimated the soil sulphur content.

NanATION OF SOILS. oacl "ARBON' DURING
60.
•
gINERALIgATION of "ULPTIUR IN1:107APY dON_WITH THAT 0
Trrtroclue
Experiyac,mtal: Experilent (1) Resulta
Experil,mt (2)

61.
introduction,
. - The technieue of studying the. mineralisation of
*Al organic natter by incubation mothods under con-
trolled conditions has 'been widely used in the past,
Mont of the work re7)erted has been concerned with the
mineralization of nitrogen and carbon (102, 118, 119,
120), but a few reports hJ!Are appered relating to the
mineralisation 'of sulphur.
Hesse (76) found that a soil mineralized appreciable
anounts of carbon and nitrogen during incubation, but no
sulphur, 'Johnson (66) found that storage of moist soil
had no effect on its content of soluble sulphate, whilst..
Preney and Spencer (80) found that incubation of one of
the soils they used. resulted in a decrease in extractable
sulphate. However, mineralization of sulphur in the
order of a few parts Per million has been reported (66,
80).
The purpose of this chapter is to report on studies
of the mineralization of sulphur in a number of soils and
compare this with mineralization of carbon and nitrogen.
The first part of the study (Experiment 1) was done with
nine soils selected on the .basis of a wide range of pH
and the second part (Experiment 2) on a single soil type
adjusted to - different pH valued prior to incubation.

62
experimental
Experiment 1.
Each soils type was air—dried, and ground to pass a
2 mm, cieve. pear each soil eight 10 g. portions were
weighed into 10 ca. .x 2.5. cm. (diam.) glass vials.
Water was then added to 5Q of the water...holding on.pacity.
Into each vial was then placed a smaller vial containing
barium peroxide and water (as already described in
Chapter II) to measure carbon dioxide release and to
supply oxygen. The vials were closed with rubber bangs
and placed in an incubator at 289C. After 32 days half
the vials of each soil type were removed and analysed
for sulphate.sulphur, ammonia and nitrate nitrogen, and
carbon dioxide. After another 34 days, i.e., 66 days
from the start, the rest of the vials were analysed in
the same way. Appropriate controls were ems.) ysed before
incubation to obtain initial values for sulphate-sulphur,
and, ammonia and nitrate nitrogen
Results.
Table 6 gives the values for the initial sulphate,
ammonia and ammonia + nitrate (total mineral nitrogen) .

63.
and also the values for these as well, as carbon dioxide released after 32 days and 66 days of incubation. Also
given are the values of orgnic sulphur, total nitrogen
and Welkicy-Black carbon for each soil prior to
incubation. Bach_ value in the mean of duplicate
de terminations.
Table 7 shows for the 32-day incubation period the
net values (final minus initial) for sulphate-sulphur,
ammonia and ammonia + nitrate, and also for carbon dioxide.
Results are given as p.p.m. sulphur, nitrogen and carbon
respectively and also as mineralized elements expressed
as a percentage of the total origi n Al elements. Table 8 shows the results for the 66-dav incubation
period.
Figures 11 and 12 illustrate the net mineralization
of the three elements for seven of the soils and also
the average values for all the nine soils, expressed as
a percentage of the total elements in the soils. For the 32-day incubation the values for net
mineralized elements were for sulphur 1.3 - 19.6 p.p.m.,
for total mineral nitrogen 6.4 - 48.4 p.p,m., and for
carbon 409 - 763 p.p.m. For the 66-day incubation the
values were for sulphur 6.0 29,5 p.p.m., for total
Elinoral nitrogen 18.1 64.4 p. p.m. and for carbon
676 1219 p.p,me The negative value for nitrogen,

start of experiment original values
24.1
22.7
19.5
22.7
17.5
28.0
22.8
23.7
15.0
66 Days
p.m./ sdo.p.m./ JAILx N E05 CO, org. 8.
(,.p.m.) T.N. ore. %
..10~.0.1mara*Morro.
24.5 13.6 65.2 36.8 511 .263 3.28
77,5 40.5 93.8 30.5 372 .154 1.34
20.0 0 68.5 30.5 461 .210 1.60
26.2 , 6.7 15.4 42.2 588 .240 4.5
21.5 3.0 73.75 27.0 342 .140 2.88
127.0 81.6 113.6 44.7 497 .238 1.71
56.5 76.4 114.4 31.1 305 .133 1.03
21.0 72.6 76.0 27.6 185 .101 .91
20.4 50.5 55.1 24.8 109 .10 .84
Tab (6) Tiinerali7atiori of sul-phur,_ nitreeen and carbon during ineub-tion_of soils of var oil.
64.
Soil No.
v 1"-'
Initial aulphur and nitrogen (p. p.m.)
Days from the
32 Days
'Jul. 3 N113- 111 -103 1\1 3 (p.D.m.) .p..",14, (P3 ep14.1a.
28 7.7 13;8 8.1 17.2 20.2 17.7 36.5
53 7.2 48,0 9.6 66.20 67.6 16.8 72.6
31 7.0 11.2 6.5 24.0 14.5 6.2 72.5
32 6.5 12.0 9.60 33.5 18.7 17,5 45.0
Si1. 5.9 10,3 9.00 15.9 17.5 6.0 53.5
55 5.9 113.0 20.8 113.6 124.0 54.5 121.0
59 5.2 45.0 15.3 84.4 51.5 62.7 93.8
60 4.9 15.0 19.30 20.50 21.6 54.2 62.4
51 4.3 11.2 21.4 27.8 12.5 44.4 65.5

sulphur mineralized nitrogen mineralized
an , as org. S.
(/)":P.Tar.)
no AH74.N07 (14.m0
- Soil • pii SO No... (4p.m.)
28 {..7..40 1.25 9.6 - 19.3
53 7.2 3.9.6 5.87 7.2 6.4 31 7.0 3.3 0.72 -0.3 48.4' 32 6.5' 6.7 1.14 7.9 11.5 . Sil. 5.9 7.2 2.10 -3.0 37.5
55 5.9 11.0 ' 2.21 33.7 7.4
59 5.2 6.5 2.13 47.3 7.4 60 4.9 6.8 3.67 34.9 41.9
51 4.3 1.3 1.19 22.7 37.7
7.42 2.23 21.4 24.1
carb©n aineralized
as T.W
00,-. (p:p1.)
as org. o
0.74 " '657 2.00 0.42 620 4.62 2,30 - 532 2.95 0.47 620 1.37
2.70 477' 1.66 0.31 763 4.46 0.56 624 6.05 4.14 646 . : 7.09 3.77 409 4.86
1.71 594 3.!9a
65.
Nat-iount.LL)f
soils for min.erali ea. during the _.inoubation of various

66.
Table (8) Amounts of sulphur, nitrogen and carbon mineralized durinA the incubation •
of variu i1 ;,r 66 days.
sulphur mineralized nitrogen mineralized carbon mineralized
Soil as as as as P.14m* as No. org. 0. NU -N T.N. 002 -0 5 erg.. C
(p4.m.) (P:P.m?)
28 7.7 10.7 2.10 5.5 47.9 1.82 1004 3.06
53 7.2 29.5 7.93 30.8 17.7 1.14 - 830 6.19
31 7.0 8.3 1.90 -6.5 64.4 3,06 832 3.96
32 6.5 14.2 2.41 -2.8 -18.1 () , 1151 4.69
oil. 5.9 11.2 3.27 -6.0 57.8 4,31 736 2.55
55 5.9 14.0 2.81 61.8 0.0 0 1219 7,12
59 5.2 13.5 4.42 61.1 27.9 1.17 848
:8.23
60 4.9 ,.6.0 3.24 53.6 55.5 5.49 753 8027
51 4.3 9.2 8.44 28.8 27.3 2.73 676 8.04
mean 13.0 4.05 ' 25.1 32.0 2.81 894 5.79

451
3
8.
30 60
5
4
erl
$4
C7c,
/ 0
/ 0
4
3; 3 2, 0 0
$4 P4
7'
6 0
0 30 (40(51)
60
Pig. (11) The amounts of sulphur, nitrogen and carbon
mineralized as percentage of organic sulphur,
total nitrogen and organic carbon in 32 and
66 days.
0
C. ono cp-•" N
o -0•••• Ix
No(30
Days of incubation Days of incubation

8_
7 s
6 -
5 •
4
3,
2
Perc
enta
ge min
eraliz
e d
1
Pig. (12) The amounts of mineralised sulphur, nitrogen and carbon as poroontage of organio sulphur, total nitrogen and organic carbon respeotivoly after 32 and 66 days incubation.
O .
0
0
0
0
C
oI
• 4°14T •
o W •
Perce nta
ge m
inera liz
ed
fr
1110641.
60 0
o ....•••••"•-••••'• Oa (rs)
6
C. 5 , o 4_
3 •
2, .
1.
30 Days of incubation
• NO (k)
isid:r.; •••••""' $o WO 0 _.„.••• ,...• • 7 .6....•••" ...../▪ e
co t ...,...• ‘
o ""."--- .......#
o ----- ........*_,,..
0,r°
30 60
Days of incubation

daya p.p.m.
66 days 1414m,
13.0 32.0
894
ulphur 7.42
nitrogen 24.1
Carbon 594
67.
obtained with only one soil, indicAes that less mineral
nitrogen was present after incubation than initially.
This was presumably due to immobilization of nitrogen.
When the mineralized elements were expressed as a
percentage of the total on elements the values were
for sulphur 0.72 —.5.87/4, for nitrogen 0.31 — 4.14;= and
for carbon 1.37 — 7.09;fJ for the 32 day incubation. For the 66 day incubation the values were, for sulphur 1.90
for nitrogen, nil — 5.49;r, and for carbon 2.55 — 8.2V.
The mean values for 9 soils for the net amount of the three elements miner, zed are shown belowi
and for the corresponding values expressed as a percentage
of he total original elements*
2
Sul/Shur 2.23 4.05
Nitrogen 1,71 2.81
Carbon 3.90 5.79
66 da

68.
Experiment 2.
500 z. trrnplon of a sndy lone seil (Gillwood) were
treated with varying amounts of aluminium chloride or
calcium carbonate and then allowed to stand, with
.regular leaching, in order to obtain soils of different
pH (121). From these soils, after air—drying, three.
were selected with pH valos of 4.7, 6.0 and 7.1 res—
pectively. The procedure for determining sulphur,
nitrogen, and carbon mineralization in these soils during . .
incubation was as described in Experiment 1, except that,
periods of 30 days and 69 days of incubation were used,
iesults,
Table 9 shows the initial and final valueS'fr the
three eleaents after 30 and 69 days of incubation.
Table 10 shows the net values after 30 days inc:mbation
for the three elements, expressed as p.p.ri. and also as
a percentage of the respective total eleMents. Table.
11 chews the results after G9 daye'inclzbation.
Pig. 13 shows the rate of mineralization of the
three elements, exprel,;oe0 as a percentage of the total
elecnts present, in the individual soils as well as the
average for the three soils. Fig. 14' shows the

Days from Initial amounts Original values theystart of incubation
69 days 30 days
Table (9):AnoralizaIion of sulphur, nitrogen and carbon during thcAneubtion of Sinwooa oi1!:01notea to 3 7p: 1.vslz.
No, pli Sul. 6, Nitz.N ITU3 N (p.p.n.)
la
((i):14.)
-a
(1) 7.1 25.5 6.4 7.2 38.9 0 42.6
(2) 6.0 22.5 6.0 7.5 35.2 3.0 34.0
(3) 4.7 5.7 12.0 12034 4.63 16.0 22.0
CD -.0 . Na,-11 NI13 N CO2-0 (P.P.m.) (P.P.a.) (gP.m.)-401 (P.P.m.) (p.p.ii. )
Org. 3, T.H. C
69.
495 47.6 11.9 62.0 924 300 0.137 2.8
382 38.0 18.9 65.8 654 295 0.135 2.7
354 11.5 49.7 55.7 600 290 0.135 2.7

70.
Table (10) Net amounts of SUllohur, nitrogen. and carbon
incubtAion of Zilwooa soil -d'uo'6ed to ' PH levels.
mineralized dur 3() ds.vs
•
No. -11.
•" sulphur mineralized •
nitrogen mineralized carbon mineralized
g.p.m. SO4 -S
• as • - % org.$
as NH -N
, 3'N, NO - p•
as T.N.
CO3-0 P
as A org.C.
(1)
(2)
(3)
7.1
6.0
4.7
14.4
12.7
-1.10
4.3
4.2
-0.4
-6.60
-3.02
5.96
35.4
26.5
9.7
2,60
1.96
0.72
455
332
354
2.0 .,
1.4
' 1.2
Table of sulphur t: nitrogen 'antic carbon mineralized during6 ,anounts dais 0;
.incubstion of_Silweed soil adjusted to 2 pHaevels.
sulT)hur mineralized nitrogen mineralized carbon !line rail zed
No, pd p.p.a. . SO4-2
as erg.3
ae as Nil HO-
p.p.m.
as T.N.
CO -0 as org.
(I) . 7.1 22.1 7.3 5,3 73.8 5.3 824 . 3.0
(2) 6.0 15.5 5.2 12.9 58.3 4.3 654 2.4
(3) 4.7 5.3 2.0 37.6 43.3 3.2 600 2.2

71.
. relationship between the rate of .mineralization of .sul—
phut. and nitrogen and that between sulphur and carbon
expressed as total amounts mineralized and also as a
. percentage of the original total elements present,
The amount of sulphur nineralized after both 30 and
69 days was relatively high in the soils of pH 6.0 and
7.1 compared with that mineralized in the soil of pH
4.7.. The low pH soil showed a alight net negative value for sulphate after 30 days, indicating immobilization of
Some of the original sulphate. However, after 69 days
this, soil showed a net gain in sulphate. The mineralis—
ation of both nitrogon.and carbon also increased with
coil pH. Carbon mineralization was affected to a
lesser extent than was sulphur and nitrogen mineralization
by pH. rTlen'results are expressed on the basis of a
percentage of the eapective 'total elements the differences
due to pH followed a similar trend.
Fig. 13 shows that in the soils of pH 6.0 and 7.1
organic sulphur mineralized more readily than did organic
nitrogen and carbon, but the reverse was true in the
soil of pIt 4.7.
Fig. 14 shows that the rate of nineralization of
sulphur was better correlated with that of nitrogen than
with that of carbon.

3
51 •
Percentage mineralize
d
7
6
5
4
3
2
1
/1-
>C://0 pH -7.1
•
A 11*
/ • 0
Fig. (13) The amounts of mineralized sulphur, nitrogen
and carbon as percentage of organic sulphur,
total nitrogen and organic carbon respectively after 30 and 69 days.'
• A/
C cla"--;;
_...0...-^"; 0
----7./
..
0 . ,..."*"
• A 5̀ 1. (3)
, A
„7 Il ---- o-----
• • —0 0,
...e' i • o ,
olb ''''.. M r,
pH.-z6o sit 0,) 60 70 30
70 0 30
Days.of incubation

en
) C. Ita-- "70 441cif
.4 (C)
0 70' ri
okcd
60,
50
40' 4)
V 30 r. 4 20
10 (a)
0 •
0 10 20 30 0 10 20 30 (p.p.m.) sulphur mineralised (p.p.m.) sulphur mineralized
69 it/
3 N. 4, - •
6 R164% aa r.14 .
10G
200
3
7
0
Pig. (14) Relationship between mineralised sulphur and nitrogen (a), and sulphur and carbon (b), and also between mineralised sulphur as percentage of orsaaio sulphur and mineral nitrogen as percentage of Z.P. (o) and of mineralised carbon as percentage of organic carbon in soil adjusted to 3 pH levels.

72.
Discussion (off' Tlroeriments 1 and 2).
.changos in the :1vols'of soil nutrients.with-t me are du' lainly tO :/icroi 1 activity resulting in inereasod'n6tooncentrations of nutrients in inorganic
:. .form (mineralization) or,docreased not concentrations (IMMObiliwaVien) -Leaching and plant uptake will also affect thecoAcentrations of nutrients.inthe.soil, but in view ofthe difficulty of interpreting the results
-obtained Under-V.16Se conditions, incubation tests, where ' leaching andpiliit uptal7e aro - notinvolved, are useful -tn indicating the importance of soil metabolic prpoeeselo,
In the soils used in this study there were always'. ains.An-lhe -emounts of sulphate, mineral nitrogen
and mineralized carbon, except for one:-soil which ehovied a net,reduCtien-inmineral mitiogen and another which showd a' slight net reduction .in sulphate. The amounts'ef.Sulphur:mineraliSed by the nine'soils of different origin' varied over a fair range and were not related to- the - originalpH of,the soils, However, with the Soils-of the same origin, adjusted to different pH
.walues.before incubation, there was'a distinct trend for, mineralization'to decrease with decreasing pH' This
A.ndicatei, that -pH in itself is of little value in
7ting 4he . ability of a soil to supply mineral sulphate

734
when noili of different origin are compared, but may be
useful for -a particular soil type varying in pH.
If it is assumed that the amount of sulphur
71inotalized dUring.32:days incubation'is about equal
to that 'mineralized in the 'field inanormalcropping
season, then those soilrvshowing, a high.rate of mineral
izatien could probably supply suffidient'sulphur to meet
crops, - eyen allowing for losses.by leaching. • Thus 10
p.p.m. mineralized sulphur.is wouivalentto about 20
sulphur per acre in the.fort of sulphate, qoils.
giving:this,or;larger amounts of sulphur could supply all
of the elementnecessary for cereal and hayAropSt •bUt
probably , netTfor swedes and,potatpes:(122) lost of
the soils, however ,"would probably mat mineralize
sufficient sulphur even for thepOtorer7.feeding ere") And.
'Wouldhaveto rely: onfreeervesmf boil Sulphate and:.
Sulphate applied in the common fertilizers.
.Oman vverage'the soils mineralized about 3 times
rot en than sulphur and about 75 times more carbon
These ratios were very similar with both
incubation periods. The ratios varied considerably among
individual soils and showed no relationship to pH. Thus
wt. ld ApOar that the extent of the ultimate lop
ganic forms of these elcrientrl over many years of
cropping cannot accurately be forecast from short-term

74,
incubation tests. Such factors as differences in the
amount and nature and crop residues and application of
organic manures may well have the most important effect
in this respect.
The relatively close correlation existing between
mineralized sulphur and nitrogen compared with that
between mineralized sulphur and carbon (Pig. 14) indicates
that sulphur and nitrogen are derived from a common
source, probably modified humild protein, whilst
mineralized carbon is derived from these sources as well
as from cellulosic material, such as plant residues.
If material of wide carbon/sulphur ratio is present
then much carbon dioxide may be released during its
decomposition without corresponding mineralization of
sulphur. In facts as will be shown in the next chapter,
immobilization of sulphate may occur.
ammaryand Concluslons.
The concurrent mineralization of sulphur carbon and
nitrogen during incubation of (1) Nine different
cultivated soils"with pH ranging from 4.3:to 7.7 Over
32 and 66 days and (2) A sandy loan (Silwood soil) vith

75.
pH which had been adjusted to three different values
(4,7, 6.0 and 7.1) prior to incubation for 30 and 69
days. Sulphate, wamonia, and nitrate were deterriined
before and after incubation, the differences representing •
the net sulphur mineralization and in the case of
ammonia + nitrate, the net nitrogen mineralization.
Carbon mineralization was assessed by measuring the
carbon dioxide produced during incubation.
Al]. the soils showed a net mineralization of sul-
phur except the Silwood soil of pH 4.7 which showed a
net negative value, indicating immobilization of some
of the original sulphate present.
The aounts of sulphur mineralized varied con-
adorably with soil type during the incubation of the
9 soils and were not related to soil pH,' In the case of
Silwood soil the a-aount of sulphur mineralized increased
'with pH
in the case of the 9 soils the amount ,of sulphur mineralized was not correlated with the amount of either
carbon or nitrogen mineralized or. with the organic sulphur
content of the soils. With the Silwood soil the amount
ofpulphurmineralizodAas correlated with the amounts. of
nitrogen an car‘i AnAdolized.: -
When the eleent mineralized was expressed as a

76.
percentage of the total element originally present in the soil the proportion of the element which mineralized
decreased in the order, carbon, sulphur nitrogen.
For the 9 soils the average amount of the three
lements mineralized were 7,4, 24.1 and 594 p.p.m. for
sulphur, nitrogen and carbon respectively during 32 days
incubation and 13, 32 and 894 p.p.m. during 66 days
incubation.
The results obtained, indicate that when comparing
soils of different types it ie not possible to forecast
from a knowledge of either carbon or nitrogen mineral-
ization to what extent sulphur mill be mineralized at the
same time. Soil pH is also of little value in indicating
to what extent sulphur will mineralize. Because of the
correlation between the amount of sulphur mineralized
for a soil of a given type and pFI, nitrogen mineralization
and carbon mineralization any of the latter factors may
be useful in indicating the possible extent to which
sulphur will mineralize,

METABOLIag OP SULkUR WRING INCUBATION OP SOIL T. ,AT81)
WITH VLRIOUS OTZGANIC MATERIALZ
Introduction.
Method.
Results.
Discussion.
Ummary and Conclus ne.
CHAI'T rR V

metabolism of sulphur during inoubation of treated • was followed
with materials va sulph was therefo
out. in order to extlude the nfusing effects
different soil types it was a cidod to use a single
soil a,dusted to different pH levels.
78.
Introduction.
Although mush work h s:been reported (66, 68, 89,
120, etc.) on the effects of addition of organic
materials to soils on tho metabolism of nitrogen, little
work appears - to have been done with regard to nulhur
metabolis under these Conditions. Aarrew (117) found
that the metabolism of sulphur from decomposing organic
material in soils depended on the sulphur content 'of
the:materials in much the same way as metabolise of
itrogen depended on their nitrogen content.
ce sulphate appears to be the forl in which plants
obtain their sulphur from soils chang in soil sulphate
content due' 'to organ c matter additiols would be a means
indicating.whother sulphur is mineralized or
immobilized. The rollowing investigation', in which the

79.
toetikod.
The 'ilwood soil (sandy loam) was adjusted to
various pi-LvalAes as described in Chapter IV. From •
tilesepthree sells, with - p11 values of 4.72, 6.10 and
7.40, wers'used'for the study.
'Thc organic materials added together with thbir
total sulphur and sulphate contents (air-Jried basic) are
listed below:
Sulphate-S Total S D+Poras Np.m.
Cellulose
traw
980
Compost 1
660
-Compost 2
690
Grass 2120
0 0
1550
3000
3450
4500
5250 Parmyard.manure (F.Y.M.) 680 rotted)
The cellulose used was the B.D.l « cellulose powder
used for column chronatography. . The straw was wheat
straw. Oompost-1 was wheat straw which had been com
posted for 6 months after addition of sufficient
nitrochalk to give an initial carbon/nitrogen ratio of
40. ' Compost 2 was wheat straw rnized with sufficient
ueen,grass,to give an initial earben/nitrogsn ratio of'
40 and also allowed to rot for 6 months. The grass .was

80.
rye grass cut young. The farvard manure was obtained
from a cattle Shed and was allowed to rot for 9 nthe
Where necessary the organic materials were air-dried
and finely-ground in a mill. 10g. air-dried 2 ram. sieved
coil were aixed with 0.200g. of organic material and the
mixture placed in a 6 in. x in. diameter test tube.
Water was then added in sufficient amount to bring the
moisture c-)ntent of the mixture to 50c, of the maximum
water-holaing capacity. This water contained sufficient
nitrogen, as potassium nitrate, to supply 2 mg. nitrogen
per tent tube. This nitrogen was added to ensure that
nitrogen rao not limiting to the micro-organisms -
decomnosing the organic materials. Sufficient test
tubes were prepared for each treatment and for the con-
trol to provide for 4 samplings after varying periods of
incubation (33, 70, 100 and 132 days from the °tart).
The tubes were plugged with cotton wool, weighed, and
moisture loese made up when necessary by addition of
water. Incubation -was done at 28°C.
Sulphate was determined in water extracts ad des-
cribed in Chapter IT after the sampling dates mentioned,

81,
RosuJ.te.
Table 12 Shows the sulphate-sulphur contents
initiAlY and at the four Saapling daes for the control
and treated snils at the three pH levels.
• Table 13 shows the net sulphate-sulphur valttes.
These were. obtained by subtraction of initial sulhate-
sulphur content and also of the values obtained in the
control. oil. Negative values indicate iamobilization
of sulphate.
The results are also shown graphically in (a)
Vigo, 15.-17, where the different materials are conrared
at each pH level and (b) Pigs. l&-20, Iere each neterial'
is compared at the three pH levels.
FYI was the only material which showed net positive
sulphate values at all stages of incubation and at all
pH levels. There were no consistent differences due to
pH. although there was a tendelley for the sulphate to
become immobilized towards the ead of the incubation
Period at the highest p11 level.
Composts 1 and 2 at the lowest pH level also showed
net gains of sulphate towards the end of incubation,
though they showed slight net losses initially. ,A.t the
medium and high pIt levies compost 1 showed net losses in
the early stages of incubation, but these loses wore

p. p,' 5u1Ohur found in days from the start
70
36.00 40.80 31.1.7 30.80
74.00 79.55 71,64 78.47
53.75 63.31 54 64 50.30
14.19 15.43 23.36 33.97
47.30 58.27 54.46 46.67
49,45 60.91 53.75 50.70
40.00 42.14 42.28 42.13
47.30 3.01 60,00 49.50
93.40 .91.37 91,37 87.80
70.95 75.45 78.47 75,25 27.90 28.21 45,50 62.32
43.00 62.30 63.13 62»35
70.95 60.90 66,82 67,00
38.70 51.06 55.18 61.63
Initial 111 treainont soil Soo
control 5.7
soil + grass
Y.1. 48.x:
19.3
4,72 llulose 5.7
owap (1) 18.9
colp. ( ) 19.5 + straw 25,3
contra 22.5 soil + grass 64.9
tt + P.1703. 36.10
6.1 + collulso 22,50
+ col!). (1) 35.10
co 1l4 (2) 36.30 + straw 42,10
4 (SO in org: o colooun4)
82.
sulp rtctabilism in 31r7 oil at 3. Pli
nd with: varkotts .mrree _of ttp...".r arek
'

Table (12 . continued
oil Initial ; treatment soil SO% .. 4.450 in.
organic ,_ 040m,Pouria).
Sulphur found in days from the start
33 70 100 . ,132-
control •• 44.73-.56.43' 50»79 49.94 soil. + gratis• 67.90 • 99 30: 96' 75 97.28 84.92
+ 39.10 60»26 79.55:70 76 62.97 .7'.4. n+ cellulose 25.5 29.02 31,.44 35.69 4©.85.
+ camp.. (1) 55.00 54.46 65.93 56.07 + comp. (2) 39.30' .'66.6564.50.,69.39::' 69.51 . 4: straw. 5.10, 27.00 45.68, 62 - 38: .48.52

Soil" pH
tr,atment:' "'P.p.12l.SulphUr found'in'days from. the' start, '
• tT .
, 8'4.' ' "'"J •
,',. :.
:'t
+ grass
+'F.Y.M.
" '; 70 ,,', 100 ' ,1'2
-4.40 -'~65 -0.95,. :5.. 27
4.15' ,'8.91 9~81 5.9 "
'. • • ~ .. ~. < - .'
, 4~72 + cellulose' ;;"21.81 -25.,..,. -8.0 "'.17.' , ~ . +oemp. (l)
+' oGmp.(2) ,
'+e'traw'
, -1.904.27
-0.45 '6~'1
-15.60,-18.26
,10.10, 2.67'
8.78 , 6.10, '
-a.50 -8.27
, + gras.
+ F.Y_ra., ,'.70 '.4.03 -11.~' -4.io
10.05: , 8.85:, ',4.87,:12.15.: "
+. cellu.lose ,-19.4,24.19' 14.512'.82
+ comp.(l) '-16.00" -'.'-9.41 ,0.25; .', ,::
• + comp. (2) , 9.85 ,',5.9' -6.98' 3.7
+' atraw-aB.2 .21.54~24.42 -7.77i . ,"
I i
+ grass
+ oellu.lose
+ oomp.(l)
:+ oamp. (2)
+ straY("
4.17 ,~2.0a' ,4~09 ~7.42
'1.9', '9.52 6.'1 J).57
-15.71 ~24.99 ~15.10'-9.09(" ,.'. '
, -2.9' -15.17 . " i.'94 ";'7.07"... .
8.12 ...5.7J" . 4~eo ;,5~77" .. :
~I -.
. ,;' , .

Sulp
hate
-s (
p.p.
m.)
Pig. (15) lletabidisa of sulphur during incubation .f eilwood soil (01 4.72) treated with six different organic materials.
20
10 oft
tre15191•4 "r
• tAV10114* 100 / Tyro
O 0
-10: \\. $4-4 z
-20
Soil pH is 4.72 Cellulose Compost (1) • Compost (2)
Straw
\
grass P.Y.M.

r.
Pig. (16) Metabolism of sulphur during incubation of silwood soil (pH 6.1) treated with six different organic materials.
T--; 10 EZAt
,///
+3 • 03 P4
// 4 / .s1 •
0 /e ,t oax
/1 2 days
p4
—10
0 \ • )
—20 / 0
6171/
—30
- grass.
cellulose
Moil pH m 6.1
cr)
Compost (1). compost (2) ----x
straw 0

Pig. (17) Metabolism of sulphur during incubation of eilwood soil (111 Is 7.4) treated with six different organic materials.
Gi
4 4 -10
0 +-3, —20
cn
\ ---\\
•
0 \ / / o \
\ ...
Co..„..
\ \ \ / o .
o ,-;c) ,e 0
\
"••. ee N "IV
N te N . //0/
.//o ,
0 t,:,.0.:0 grasp o
F.Y.M.
cellulose
compost (1) Soil pH = 7.4 compost (2)------x
straw 0

Pig. (le) Setubal= et sulphur dwriug incubation if eilweed Dell at 3 pit levels treated with (a) grass (b) cellulose.

F.Y.M. (a)
10 PH = 6 .
Lt .:2;1,2/
144 a.m.
E 41 Pti
• LI 70 days
33 100
(straw) 1.4 '7 1
—10
e-,
P.
N
.1
(b)
-40
Pig. (19) Metabolism of sulphur during incubation of silwood soil at 3 pH levels treated with (a) P.Y.M. (b) Straw.

I' — r
—
‘-i
2 days
+10
Su lp hate- s (p. p.m.)
(b)
—10
,Compost (2)
—20.
Fig. (20) Metabelism of sulphur during incubation of silwood soil at 3 pH levels treated with (a) Compost (1) and (b) Compost (2).
10, (a)
• 1 L
/N days d g. 33 70 /100 N 32
‘•1
N N\
Compost (1) LA _1 -? \-1 .1-
N /
N .4/ N/
—10,

65. reduced towards the end. Compost 2 showed alternate
gains and losses as incubation proceeded.
Grass also showed alterns,te losses and gains of
sulphate o:t the medium and high pH levels. At the low
pH grass showed lessee initially, with gains towards the
end of incubation.
Cellulose showed considerable net losses of sulphate
initially, but these losses reduced with further
incubation. There were little differences dlle to pH
except at the end of incubation, where a net loss was
still apparent at thehigh level, but net gains occurred
at the other pH levels.
Straw behaved similarly to cellulose excelyt that
the extent of the net losses of sulphate during the .
early stages of incubation increased with pH level. With
further Incubation losses decreased, but there was still
a net loos at -the end of incubation at all pH levels, the
A.Teatestloss occurring at the high pH level.
The greatest immobilization of sulphur occurred
with the straw treatment at the high pH level, where
sulphate—sulphur was immobilized to the extent of 37 P•Piom*
33 days from the start of incubation. By the end of
incubation, however, 437 of this immobilized sulphur had
been mineralized. Cellulose showed maximum imrlobiliZation
86.
of 6p.n.n. sulphur 7© days after incubation at all pH levels. By the end of incubation 52 of the immobilized sulphur had mineralized at the high-pH, whilst at the medium and low PH levels all the 'immobilized sulphur had mineralized.
The general tendency at all pH levels was for 'initial ineralizatiOnv where-thla occurred first, to be followed
by immobilizatiOn and 'where immobilization occurred initially, for this. to be followed by mineralization.
The critical level of total sulphur content of the organic' materials for determining whether ultimate, ineralization or immobilization will occur is som
the or. der 3,000 p.pfrm or 0 (dry basis) but dependent to:a:certain extent on the nature of the
material and soil pH Thus FY3 containing0.5 56.total
sulphur. showed. net'minoralizatien of su1phur at all
stages, but showed ultimate mintralization'only, a' the two lower pH levels. 'The lme composts) -eontaining:000p
and 0.345, total sulphur, showed miporal zation . Or immobilization to a limited extent during incubation, but taltimatel ► showed ,only, slight-net- gaina:or losses. Grass containing 0.45 total sephur did not dhew—any groat -difforencee in mineralization or.immobilizatien of eta
p incubation. This may have been due to the
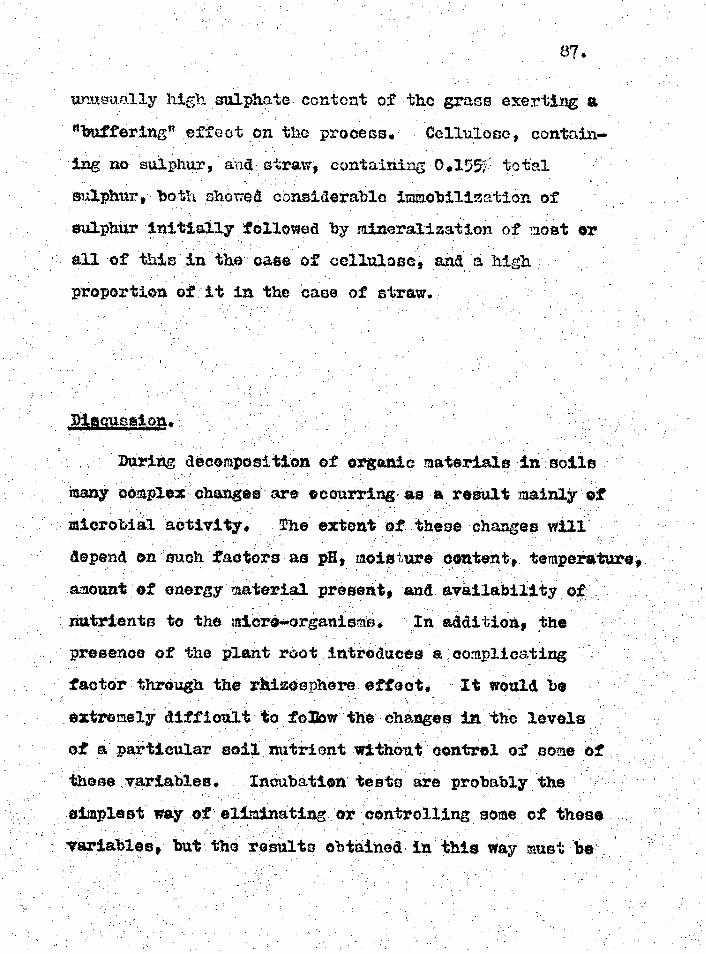
87.
unueurilly high sulphate- content of the grass exerting a
"bUffering"Heffecton the prodess 'Oelluipsc, contain-
ing no sulphur, and. straw, contaiting, 0,155 total
sUlphur both shoved considerable immobilinatian of
!xulphUr'initially followed by mineralization of Most or
all of this'Ari the caseof cellulose, and a high:
proportion of:it in the ease of straw:
in fif
are occurring s a r salt ma
microbial activity. The extent of these changes wi
depend on such factors as pH, moisture content, temperature
amount of energy material present, and availability o
nutrients to the micro-organisms. In addition, the
presence of the plant root introduces a.complicating
factor through the Olzosphere effect. It would be
e y difficult to fo101ow the changes in the levels
particular soil nutrient without control of some of
variables. Incubation' tests are probably the
pleat way of eliminating or:controlling some of these
blest but the results obtained in this Way must be
During decom
any complex change

88.
considered in the light of the restrictions imposed.
During decomposition of an organic material in soil
alization and immobilization of sulphur may be
new concurrently, but, without the use of tracer
techniques, all we Call measure is the net effect of these
two processes. From the point of view of the plant,
however it is the net value which is significant, whether
this be positive or negattve. Thus the net values
obtained in this experiment should be useful in indicating
whether or not a particular organic substance would tend
to increase or decrease the sulphate level in soils It
would appear that materials containing more than about
0 1 sulphur (dry basis) will not cause even any
p mmobilization of sulphate. Materials con..
taining:0,3 ...;.C450 total-sulphur may cause a slight.
teMporary,immobilizationo thus causing a reduced •
availability:of,s4lphateto-the plant. However, since the usual field practice is to incorporate organi
s ,in the soil some time before the crop i so mporary phase ay:have been passed by the'time
Op- is actively growing and-takingsignificant amounts' .sulphate from thesoil.,
- Where the organic . materialcontains less than about
otal sulphur a fair amount of net immobilization may

89
take ,place. This is (1.1.o to the sulphur require-aents of the micro-organisms which attack the easily-decomposable cellulosictaterial present in substances of low sulphur content, such as straw. After the initial stage of immobilizatien/of sulphur during which most of the easily-' decomposable earbonaceousmaterial has been used up/ the mineralizatiou rate of sulphur from the dead organisms !
then oxceeds.an ,immobilizing effects which may be occurring. HThue sulphur immobilized initially is mineralized, 'The extent to which this occurs depends on the type of Oaterial as well as on its sulphur content ,
It is interesting to note that cellulose, containing no sulphur, caused less not immobilization of sulphur than did straw, which contained 0.155/, sulphur. Also, all
, or nearly all, depehding on pH, of the sulphur immobilized by the cellulose was eventually mineralized, rhereas a portion of the sulphur immobilized by the.Straw was still "fixed" even at the end of incubation. This is probably due to the presence of lignin in the straw, which, through modification by bacterial activity, forms stable bumic substances containing: sulphur in organic combination which is net easily mineralized.
The resalts obtained in this study for sulphur are
similar in many ways to those obtained by Cornfield (124)
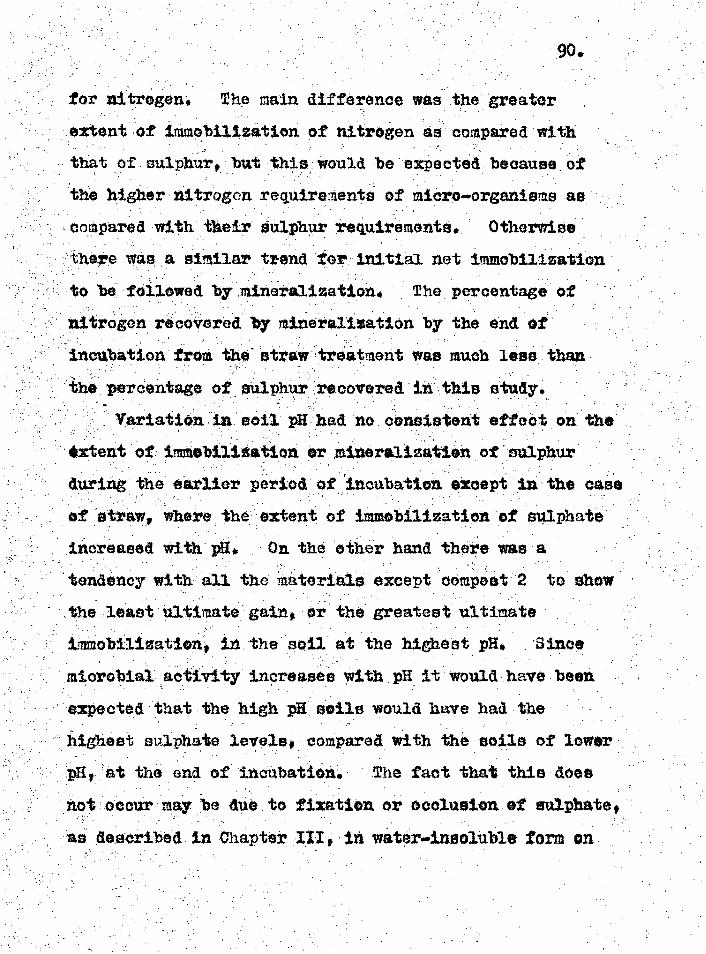
for nitrogen. he main difference was the greater extent of immebilization of nitrogen as compared with that of sulphur, but this:would be expected because of the higher , nitregon requirementss of micro—organisms as compared with their sulphur requirements, Otherwise there was..a similar trend for:initial net immobilization
to be followed by mineralization, ; The percentage of
rogen recovered by mineraiizatien by the end of
incubation from the- Straw treatment was much less than , • . ,
the percentage of sUlphur recovered in this study
Variatien 'in soil pH had no coneistent effect on the
t of immobilization or mineralization of sulphur
r period of incubation except in the
of etraw, where the extent of immobilization of sulphate
,increased with pa
On the 'other hand there was .a
endency with all the mate except compost 2 to show least ultimate gain, or greatest ultimate
mmobilizationr in the mail" at the highest pH. Since
crobial activity increases with. pH it would have been
xpected that the high pa soils would have had the
et sulpb.ate leveler compared with the soils of lower
t the end of incubation. The fact that this does
not occur may be due to fixation or occlusion of sulphate
as described in Chapter Illy in water-insoluble form on

he,:.calcium carbonate which was added to the
soil to raise its pH.
The general effect of the addition of organie
materials to soils on the level of sulphate appears to
be temporary, as seen from the shape of the curves in . Figs. 15-17, where, ,after initial increases or decreased
in phate level, depending on the sulphur content of
the added materials, all levels tended to approach the
x.axis, which represents no immobilization or
eralisation f sulphur.
Under. field conditions the rapidity and extent of , sulphur metabolism duo to addition of organic materials
likely to be much less than those occurring in this
study. This is beoauSe of suboptimal temperature and
moisture conditions, and the fact that the organic
materials will not be so intimately mixed with the
clueions.
of sulphur during incubation of
oil at hr e A levels (4,72 6 10, 7 40) which had
ved organic materials of varying total sulphur content
.525%) was studied over. .'1.32 days. Oulphate levels

92.
obtained at various stages of incubation less those
present initially and in the control soils showed the
extent to which net mobilization or minera iwItion of
sulphur had occurred.
Farmyard manure (04525`a total sulphur) was the only
material which brought about net gains in sulphate at all
stages of incubation. Grass and two composts (0.300
0,450V; sulphur) showed small net gains or losses of
sulphate, Straw (04.155 sulphur) and cellulose (no
sulphur) caused fair net immobilization of sulphate during
the early stages of incubation; most of the sulphur
immobilized by the straw was mineralized by the end of
incubation, whilst all the sulphur immobilized by the
cellulose, except in the soil of high pH, was completely
mineralized.
Variation in soil pH had no consistent effect on the
extent of immobilization or mineralization of sulphur
during the early period of incubation except in the case
of straw addition, where the extent of immobilization of
sulphur increased with pH. However, there was a
tendency for all materials to show, the least ultimate
gain in sulphate/ or the greatest ultimate immobilization,
in the soil of high pH.
The general effect of the addition of organic

93,
materials to soil on the level of sulphate appears to be
temporary in that after an initial increase or decrease
in sulphate level, depending on the sulphur content of
the material, sulphate levels tended to return to
normal.
The critical level of total sulphur content of
organic materials for determining whether mineralization
or immobilization of sulphur will occur is in the order
of 0.3A' total luiphur (dry basis). This level will
vary to some extent depending on the nature of the
material and to a lesser extent on soil PH.

UPTAKE -OP SULbHUR.EY RiEGRASS IN POT TESTS AS RELATED •
TO 'OIL SULPHATE AND TOTAL SULPHUR OONTCNT04, .„ .
Introduction.
4Terimental.
Aeaults.
Relationship between soil total sulphur an
ulphur, by ryegrass.
Relationship between soil sulphate and .'u
ryegrass.
Relationship' betwe soil otal s
uptake f
1,,:e of oulphur
and total yields
and percentage nitrogen ryegrass.
Relationship between soil sulphate and
percentage nitrogen,in ryegrass,
lationship between dry matter yields
sulphur in ryegrass, and total uptake
ryegrass.
Relationship between p
nitrogen in ryegrass
otal "",yiolde an
an percentage
cad sulphur
Oa tags sulphur and per entag
Appearance of ryegrass during growth.
Total sulphur uptake by ryegrasa as related to the
Qr.ginal sulphate sulphur contents of the soils.
acussion.
Summary and nolu iona•
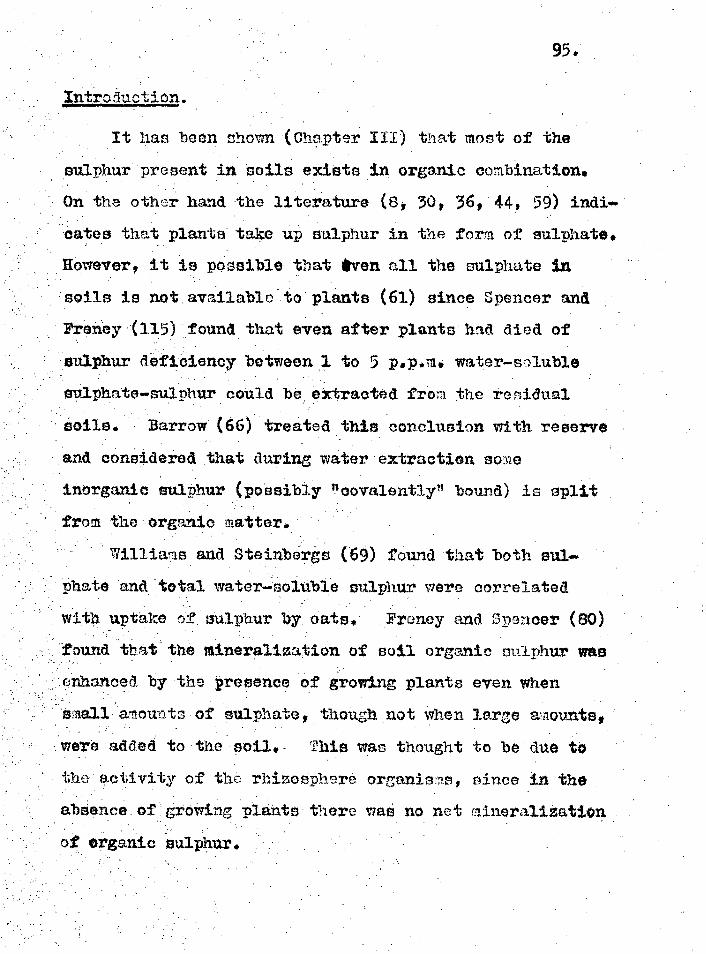
95.
Int oluction.
It has been nhown .(Chapter III) that most of the
sulphur present in soils exists in organic combination.
On the other hand the literature (8, 30, 56,'44, 59) indi-
cates that plants take up sulphur in the form of sulphate.
towever, it is poasible that Oven all the sulphate in
soils is notAvailable. lo plants (61) since Spencer and
liteney (115) . found that even after plants had died of
,sulphur deficiency between 1 to 5 p.p.m, water-soluble
sulphate-sulphur could be Octracted from the residual
'theils., Barrow (66) treated this conclusion with reserve
and considered that during water - extraotien some
inorganic sulphur (possibly _oevalentl bound) is split
the organic natter.
Williamsand Steinbergs (69) found that both sul-
eand:total water-tolUble sulphur were correlated
with uptake 0_, Sulphur by data. Freney and Spencer (80)
foundthatthe mineralization of soil organic sulphur was
enhanced by the presence of growing plants even when
Small :Amounts of sulphate, though _not when large amounts,
.rereladded to the.poil This was thought to be'due to
the' activity of the rhiposphore organisms, since in the
abeence ofgtering plants there was no net mineralitation:
of organic sulphUr.

96.
Since it appears that no critical work has been
done to show whether soil sulphate content or total
sulphur content is the more important in determining
the availability of soil sulphur to plants, the study
described below was carried out.
Experimental.
Forty of the soils described in Chapter III were
selected of. the basis of a wide range of sulphate and
total sulphur contents and pH and included 12 calcareous
soils.
Por eaoh soil 100g. of air-dried 2 mm,-sieved soil
was mixed with 200g. of acid-washed sand and the mixture
placed in a plastic-type flower pot (3 in. high by 3 in,
diameter at the top). Two "control" pots, i.e., con.
taining only 300g. sand were also prepared. Each pot
was sown with 0,25g. of ryegrass seed and the soil
mixture was then moistened with distilled water.
Watering (before germination and during growth of the
grass) was carried out alternately by addition to the top
and to the saucers in which the pots stood. In order to
ensure that sulphur was the only limiting nutrient major

and trace elements were added in solution after
germination and after each cutting. The major elements
were added as potassium nitrate (equivalent to 100 lb.
per -acre), magnesium nitrate (50 lb. per acre), calcium
chloride (25 lb. per acre), and potassium dihydrogen
phosphate (50 lb. per acre). The trace elements were
applied in 10 ml. of solution containing 5.6 p.p.rn. iron,
e.55 p.p.m. manganese, 0.64 p.p.m. copper, 0.065 P.P.m.
zinc 0.73 Psp.m. boron, and 0.019 pip.m. molybdenum
(Hewitt, 125).
The experiment started on 12th April 1961, in a greenhouse and cuttings were made 30, 90, 130 and 185
days from the time of germination In, view of the low
yields of the first cuttings these were combined with the
second cuttings for analysis, .The third and fourth
cuttings were also., combined, Hereinafter the "first
cutting1.w3ll.refer to the combined actual first and
second au tinge and the "second cutting" to the combined
bird and fourth cuttings. After the final cutting the roots were washed free of soil and sand. All harvested
material was dried to constant weight in an even at 70 0,
weighed, and ground to a fine powder in a laboratory
mill prior to analysis for total sulphur and total
nitrogen (as described in Chapter II).

98.
Results,
Redults.for total sulnhur and l7hate oontonts of
the soils, sulp]lur uptake .in each cutting and the roots, :.
. net sulphur uptake (obtained by subtraction of sulphur
uptake by the control sand cultures), net total dry
.matter yields (obtained by subtraction of yields frog the
controls) and nitrogen percentage and sulphur percentage
in the combined cuttings and roots are shown in Table 14
for soils of pH 5.5, in Table 15- for soils of pH 5.5 —.
7.0 and - in Table 16 for calcareous soils. In each table
• the resrlts are_ arranged in increasing order of soil
total sulphur. The results for dry matter yields and,
• sulphur percentage in each cutting and roots are shown
in Table 17.•
In or der to see whether I.Lere - rtre any general trends
in the mean. valres for each 0 group the tc,ble below was
prepared:,
Oil total sulphur. (p.p.m.) Soil sulphate—sulphur (p.p.m.) Net total sulphur uptake
by ryegrass (1g•) Net total yield of ryograss(g.) c/o sulphur in ryegrass 0 nitrogen in ryegrass
It is seen that there was a general trend for all
values to increase with increase in soil pH group,
Soil pH group. Caleareoua <5.5 .5.-7.0
342 532 766 22.9 46.7 51.0
6.49 8.37 10.7 1.31 1.36 1.64 0.46 0,52 0.56 1.37 1.50 1.59

Net S. uptake m Net total 1st. let 2- Total ie1d ,
N
Table (14) Total sulphur, sulphate sulphur in'soilo. of
,/c, nitrogen of ryegrassp.'
Soil No. pri T.S.
.P.P.m . Sul.S. p•p•ra.
sulphur uptake
,nd. Uoots Total
46 5.50 , 112 6.0 2.00 2.96 1.90 6.86
51 4.30 120 11.2 2.71 4.50 2.17 9.38 60 4.90 200 15.0 1480 5.88 2.18 9.86
50 4.10 230 17.0 1.86 5.68 2.43 9.96
41 4.10 332 33.0 5.95 6.33 2.16 14.44
59 5.24 350 45.0 3.45 6.28 3.28 13.21
11 4.60 365 17.5 3.07 5.50 2.82 11,39
49 5.40 387 24.0 5.39 5.76 2.71 13.86.
45. 4.20 980 37.6 5.82 6.69 2.66 15.17
Mean, 341.77 22.9
p1(5.5 ane sulphur uptake, total yield, sulphur and
11••••••••■••••••••••
1.24 1.76. 2.04 0.50 1 3.4 1.95 4.01 4.55 0.85 1.28 0.46 4.1• 1.04 4.48 5.04 1.30 1.30 0.40 3.4 1.10 att34 5.14 0.72 1,36 0452 3.0
5.19 9008 9.62 1.95 1.36 • 0.46 2.69 6053 8.39 1.77 1.40 0.45- 1.9 2.31 5.37 6.57 0.98 1.53. 0.52' 3.8 4,63 7.95 .9.03 1.91 1.25 0,45 3.7
5.06 9.31 10.35 1.80 1.24 0.51 2.8
2.79 5.87. 6.49 1.31. -,1.37 0.46 3.2
P.S. uptake 2original soil. au_ hat €-S

Table f15) Total sulphux5 sulphate.sulphur of soils wit)) at range of 5.5. .0 and total sulphur u take total
yield. nitrogen percentage and sulphur percentage of Inresratr.
Soil No.
pu p.p.ra•
Sul .S. p•Pon.
sulphur uptake (mg.) Net S. uptake (nig.) Net total old
ftM)
N S T.S. uptake original soil sulph,,te-1
1st. *Ild. Roots Total et. 1st 2nd
Total
52 6.40 340 - 22.4 .• 3.55 4.75 3.03 11.33 2.79 5.10 6.51 1.72 1.50' 0.40 - 2.9
511. 5.92 353 10.3. . 2,29 4.48 - 2.66 9,43 1.53 .3.57 4.61 1.00 1.57 0.43 4.5
.58 • 6.50 360. 19.0 2.29 .3.91 3.58 9.78 -. 1.53 3,00 4.96 0.94 1.46 0.46 2.6
29 - 6.80. 370 14.8 2.54 4.12 4.60 - 11.26 1.78 3.46 6.44 1.53 1.50 0.42 4.3
Har. 5.92 380 56.0 2.60 5.16 1.74 9.50 1.84 - 4.56 4.68 0.75 1.36 0.52 0.83
2 • 6.58. 405 27.0. 5.65 .6.94 2.87 15.46 4.89 9.39 '10.64 2.10 1.35 0.47 4.0 .
1 6.00 .425 22.3 3.24 4.38. 2.17 9.79 2.48 4.42 4.97 0.91 1.41 0,47 2.2
3 5.70 .. 435 11.4 -3.18 4.34 1.90 .9.42. 2.42 4.32 4.60 1.20 1.50 0.40 4.0
31 7.00 472. 11.2 2.98 4.76 3.78 .11.52 2.22. 4.54 6.70 1.05 1.74 0.52 • 6.0
35 6.20 495. 32.2 4.04 5.67 3.17 12.88: 3.28 7.51 8.06 1.10 1.60 0.57 2.5
57 6.00 500 125.0 5.60 10.17 2.23 18.00 4.84 12.61 13.16 1.43 1.35 0.69 1.1
4 6.60 520 21.6 5.39 -6.00 2.19 13.58H, 4.63 8.19 8.76 1.57 1.56 0.49 4.1
6.90 545 94,0 44
4.13 7.35 3.35 14.83 3.37 8.23 10.01 1.13 1.64 0.64 1.1
6.50 . 600 12.0 2.24 4.27 3..61 10.12 1.48 3.31 5.30 1.10 1.74 0.45 4.4
55 5.90 610 113.0 4.50. 10.46 4.36 19.32. 3.74 11.76 14.50 1.63 1.27 0.68 1.3
42 '5.84 640 96.0 4.77 7.59 3.38 15.74.• 4.01 . 9.16 10.92 1.47 1,40 0.59 1.1
24 6.00 787 36.0 5.09. 8.18 4.24 17.51' . 4.33 10.07 .12.69 1.94 1.63 0.56 3.6
40 • 5.80 790 155.0. 4.90 - 7.80 4.96 17.66. 4.14 9.50 12.84 1.83 1.53 0.53 10.84
-9 6,00 1085 - 10.0 3,73 7,00 2.75. ,13.48 9.97 7.53 8.66 1.47 1.51 0.51 8.66
mean 532.2 46.7 3.07 6.86 8.37 1.36 1.50 0.52 3.17
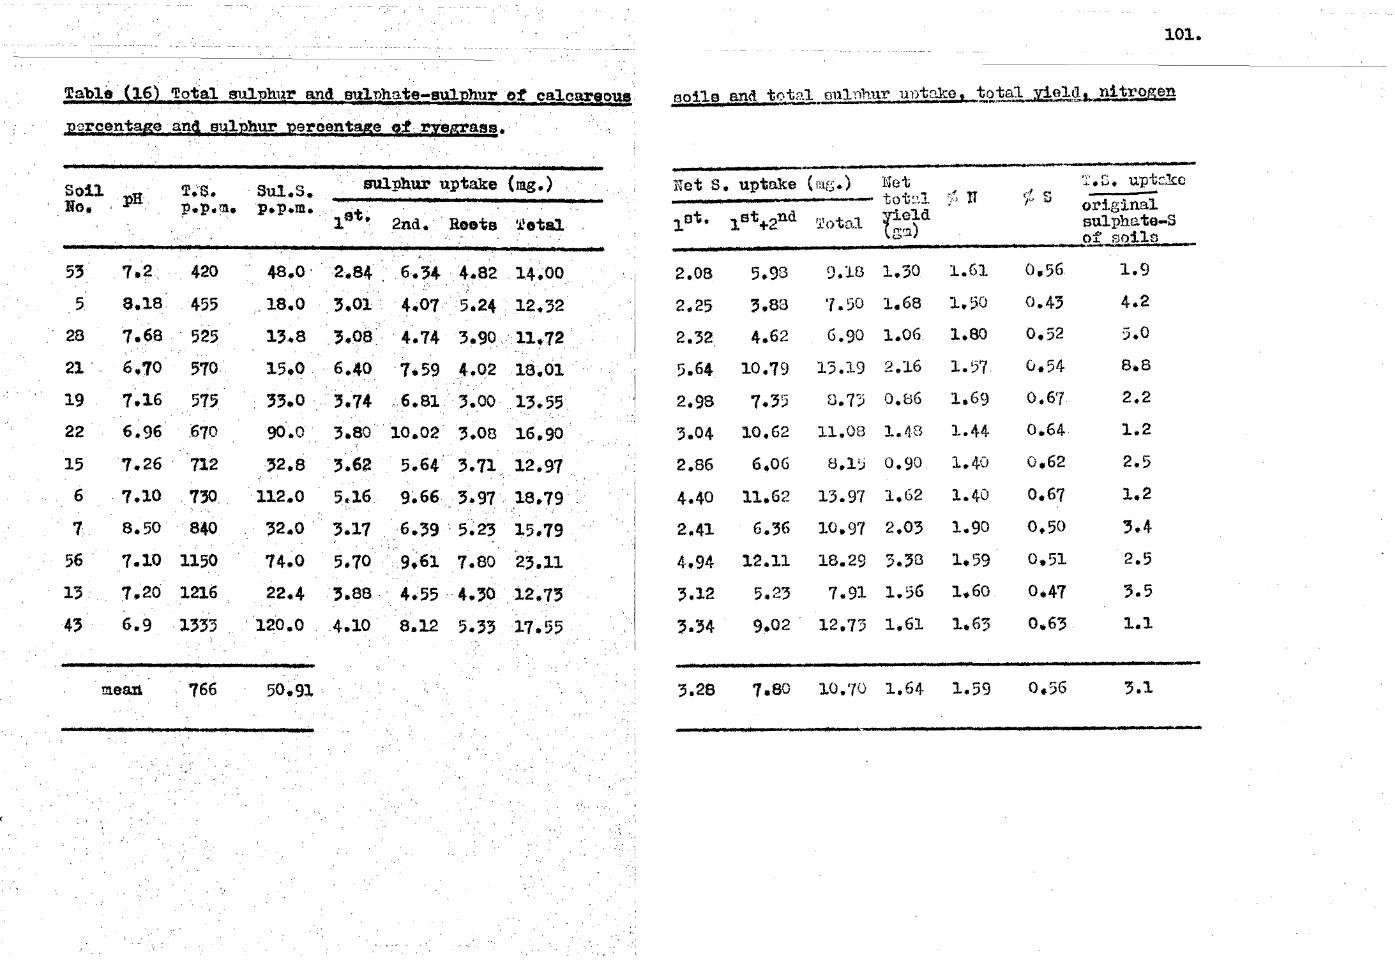
101.
Table (16) Total sulphur and sulphate-sulphur of calcareous noils an total jii1hur ul)take, tTpql_210.641,Alrogen
Porcenitve and aulphur percentage c± ryegrass,
Soi1 No. ,
T0S. p0p.m•
Sul.S, p.p.m.
:sulphur uptake (rag.)
2nd. Rests Tote ,
53 7.2 420 48.0 2.84 6.34 4.82 14000
5 8.3.8 455 18.0 3.01 4.07 5.24 12.32 28 7.68 525 13.48 3008 4.74 3o90:11,72
21 6.70 570 15.0 6.40 71,59 4.02 13.01 19 7.16 575 33.0 3.74 6.81 3.00 13.55 22 6.96 670 90.0 3.80 10.02 3.03 16.90
15 7.26 712 32.8 3.62 5.64 3.71 12.97
6 7.10 730 112.0 546 9.66 3.97 13+79
7 8.50 840 3240 3017 6.39 5.23 15079
56 7.3.0 1150 74.0 5.70 9.63. 7.80 23.11
13 7.20 1216 22.4 3.88 4.55 4.30,12.73
43 6.9 3.333 120.0 4.10 8.12 5.33,17055 • • • • • ••
mean 766 50.93.
Net S. uptake(rag.) Net totl eld Sm)
uptcat original sulphate'-S of soils
1 at. +2nd Total -
2.08 5.93 9.16 1.30 1.61 0,56 1.9
2.25 3,83 7.50 1.68 1.50 0+43 4.2
2.32 4.62 6.90 1.06. 1.80 0.52 5.0
5.64 10.79 13.19 2.16 1.57. G.54 8.8
2.98 7035 8.7') 0.86 1,69 0.67 2.2
3.04 10.62 11.08 1.48 1.44 0.64 1.2
2.86 6.06 8.15 0.90 1.40 0.62 2.5
4.40 11.62 13.97 1.62 1.40 0.67 1.2
2.41 6.36 10.97 2.03 1.90 0,50 3.4
4+94 12.11 18.29 3.30 1,59 0,51 2.5
3.12 5,23 7.91 1.56 1,60 0047 3.5
3.34 9.02 12.73 1.61 1.63 0.63 . 1.1
3.28 7.80 10,70 1.64 1.59 0.56 3.1

Table (17) Dry latter yield and sulphur percentage in
individual cuttings and roots of rzegrase grown in 40,
different soils.
cic., of sulphur in each Soil let 2nd Roots total cutting No. cutting cutting yield
(gm). (gm) let 2nd root cutting cutting
46 0.4912 0.5298 0.64201.6640
51 0.5714 0.5614 0 $862.2.0190
60 0.6218 1.0092'0 8376 2.4686
50 0.2714 9.6886-0 9306 1.8906
' 41 .0 9262 0 7560- 14418'30.W
59 0.7260. 0.9286 1.28962.9442
11 0.838 0.6290 0.9404.2,1532
49 ''0.9986 0.7114 1.299.0793
45 1.0590 0.7762 1.1214:2.9566
52 0.8886 0.9202 1. 0814 2.8902
fSil 0.5339 ©.7036 0,320 2.1695.
'-0.6182 0;6862 0.8072 2 1116'
29 -0 6962 0.7270, 1.2780 2.7012 0 3650
Hat 0.5561 ..0.7558: 0.6016 1.9135 0.4685. 0.6831.:0.2900
2 1,0468 1,1112. 1.1058 3.2638. 0.5400 0.6250 0.2600 0.6903 0.6012 0,7882 2.0797 0,4700 0,7291 0.2750
'6,7070 (L706 ,p 8742 2,34680‘4500 0.5666 0.2160 -.0.7044 0.7670 0.7572 2 2286:0,4225 0.6208 015000
Cont.
0.4080 0.5583 0.2950.
0.4750 0.8000, 0.2450.
0.2900 0.5825 0.2600
6750 0.8250 0.2600
0 6430 0.8375 0.1500
0,4750 0.6760 0.2700
0.5260 0.8750 0.3000
0,5400 0.7280 0,2090
0 5500 0,8620 0.2375
0,4000 0.5166 .,0.2800
439O ;06374'
0.3700 5706.
0.5666

.,10'.
Table (17) continued......
• n • ,
total. %of. sulphur in each
SoU 1st 2nd Roots·. cuttingNth outtil'8 cutt~ yie14
(gil), (gil)l~') L~ ..)
1st. 2nd' root;cuttig puttiM .'
... ,
'5 0.7704 0.6676 0.8034 2.2414 0.5250 .0.8500, . ,0.'950~..,: ' ' .. . "" , .
57 0.8140 . 0.7676 ~.0234 2.6050 O~6875· ,i.3250. . 0.2189·, .
4 1.1600 0.9280 0.6618 2.7498 0.46;0 0.6,458 ,.' 0.'312", "
44 0.8793 0.6538 0.7708 2.30'9 0.4700 1..1250 . .0.4060'
'2 0.7454 0.6178 0.88S4 2.2516 0.3000 ,0.6913 0.4060.: '.
55 0.8192 0.8578 1.1250 2.8020 0.5500, 1.2200 0.3800 .,"
~,' ".:' .
42 0.8679 0.7590 1.0250 2.. 6469 0.5500 1.0000 " 0.3'00'
24- 1.1506 1.0232 0.9426 '.11640.4100 0.8000 0.4'500 .
40 0.7668 0.7804 1.4594 ,.0066 0.6250 1 .. 0000 0.'400,
9 0.9332 0.8340 0.87962.6468 0.4000 0.8400 ' 0 .. '125 '
53 0.6104 0.7050 1.15782.4732 0.46;0 O.gooo '0.4166 :.,
5 0.8490 0.7398 1.2610 2.84980.'550 0.5500 0,4160
28 0.7508· 0.6688 0.81'0 2.2326 0.4100 0.7086 0.4800
'21 1.3774 0.9846 0.9678 ".3298 0.4650 0.,7708 0.4155·
19 0.8512 0,.7176 0.4616 2.0'04 0.4400 0.9500 0 ..6500
22 0.8518 1.1548 0.6442 2.6508 0.4465 0.8676 0.4780
15 0.8226 0.6602 0.593S 2.0766 0.4400 0.8541 0.6250 '
6 1.0164 0.7358 1.0448 2.7970 0.5075 1.'125 0.5800
7 0.9458 0.6246 1.3956 '.1660 O.3i50 0,7750 0,"750
Coni:.

104.
Table (17) continued.
of sulphur in each Soil 1st 2nd Roots total cutting No cutting cutting yield
(ga) L%, ) g o ( I 1st 2nd Root 1 cutting cutting
56 1.2542 1.4890 1.8060 4.5492 0.4550 0.6458 0.4330 13 0.9712 0.7278 1.0326 2.7316 0.4000 0.6250 0.4166
43 1.1244 0.7830 0.8808 2.7882 0.3650 1.0375 0.6060

1051
•,17.catlonchipc between soil total sulphur and uptokoof
sulphur by ryeprass.
,Te,ble18 shows the correlation coefficiente between
soil total sulpbure.nd oulphur uptake in the firet and
first + second cuttings and in the firnt + second cuttings
roote (total uptake). The reeellts are given for each
grour' qAd for the soils as a thole.
Then ell cone were considered. there was a highly
significant- correlation between soil total sulphur and
sulrhuruptake in the first and first + second cuttin3s
and in the two auttinge-4- roots. When the coil ,11
groups are oonsideredtherc was no significant correlation
between thetwo.fsetors in any pU group in the first
uttJngS. In thc_first + second cutting and in the two uttings' + recta the only significantcorrelatione
'occurred in the OK
t onshi e between neil ulnhate and u take
by ryewass.
Table 19 chows.thee relationships arranged in groups
in the'saae way as the above section.
4ben the soile were considered as a whole the
correlation coefficients between soil sulphate content
and ixptako o.L sulphur by ryegrass were highly significant
14 the first and first + second cuttings andin the two

106
Table (18) nOIE t:1,0nshi; bctween soil total-suIphur and
plant:uptake,
Total-3 soil pH r Remark
correlated with . range
1st uptske 5.5
0.50 not significant tt
it
0,340 tt calcareous 0.290
N it
tt
II all soils 0.420** highly significant together
(lst+2nd) upt
total uptake
H It
< 5.5 5.5 7 0 calearess
0.540 not significant
0.63** highly significant
0.48 not significant
< 5.5
0.540 not significant
5.5-7.0 0.56* significmt
calcareous 0.310 not significan
all soils 0 54** highly signifi ant
tt all soils 0.68 * highly significant
* o•os-' *4% Fr Ow di

Remark SO noil pH correlacorrelated with range
1st uptake < 5.5 0.67** hi& .y 5,5-7.0 0.70** calcareous 0.26 not
ttnifieant ft
et
< 5.5 5. 5-7 0
al ttp ak 0.86**
0.75**
all soils 0,43**
+2nd uptake <5.5_ 0. 5.5-7.0 0 calcareous 0,66* can all soils 0.76** highly sign c
107.
Table clf2) Relationship between soil sulphate-sulphur and Dlatit uptake.
calcareous .0 48 not H
all soils 0 68 highly
* - 0.01

108.
cuttings + roots. When the pH groups were considered
the correlations were also significant except with the
first cutting and the total uptake in the calcareous
group.►
Relationships between ,soil sulphur and total yields and
% nitrogen in ry‘grass.
Table 20 show the relationdhips between soil total
ulphur and (a) total dry matter yields (the two cuttings
roots) and (b) % nitrogen in the combined dry matter
from the cuttings + roots for the Boils as a whole and for
each pH group.
The only correlation showing significance was that
between total soil sulphur and total dry matter yields
when the soils were considered as a whole
4qaticonships between 41 pulphate and totalyields and
nitrogen in ryegrass.
Table 21 shows the relationship between soil sulphate
content and (a) total dry matter yields and (b) % nitrogen
in the combined dry matter of the ryegrass.
The only significant correlation -that; occurred was
that between total soil sulphate and total dry matter
yields in the pH < 5,5 group.

109.
Table (20) Relationship between soil total sulphur and
total yield and, N % of x,;ye,grass.
T.S. soil pH
Rel'ark correlated with
Total dry matter yield ,
Total dry matter yield
Total dry matter yield
Total dry m'atter yield
0
< 5.5 0.56
not significant
0.36
0
it
calcareous 0.43
ft
It
all soils 0.50** highly significant
< 5.5 -0.41 not significant
5.5-7.0 0.02
it
calcareous 0.07
11
all soils 0.25
If, Nitrogen
0
ft

110.
Table (21) Relationship between soil sulnhate—sulphur and
total dry matter yield and percentage nitrogen in ryegrass.
Sulphate.S Soil pH correlated with
r Remark
total dry matter yield <5.5 0.63** highly signific nt
total dry -latter yield 5.5-7.0 0.27 not H
total dry matter yield calcc;reoii 0.20 u
total dry. matter. yield all soils
e N ogee < 5.5
0,28
—0.43
0
it
5.5-7.0 .0.30
calcareous —0.48 .0 • 41
all soils —0.13
rl
*40 ?= o• c, I

Relatlonships between total dry matter yields and c/o sulphur
ryegraso and total uptake of sulphur by ryegrass.
Table 22 shows the relationships between total dry
matter yields and (a) sulphur in the combined yields and
(b) total uptake of sulphur by the combined yields for
the soils as a whole and also for the three pH groups.
There were no significant correlations between total
dry matter yields and 0 sulphur in the plant material. On. the other handthere were highly significant correlations
between total dry matter yields and total uptake of sulphur
for the soils as a whole and also for the different PH groups.
Relat onships between sulphur aid f nitrogen r,Vegrass.
These are shown in Table 23 for the soils as a whole
and for each pH group, None of the correlations were
significant.
►host of the above relationships are shown diagrama
tally in Wigs. 21 25.
Appearance of the ryegrass during growth.
'Observations on apparent vigour of growth and
chlorotic symptoms were made throughout the growing period.
The growth rate varied from pot to pot up to the first

112.
Table (22) Relationship between total dry matter yicld
and 1:1) 5', of sulphur in rvegrass and Sb) total sulphur,
uptake by ryegrass.
yield correlated with
soil pH Remark
sulphur < 5.5 -.0.005 not significant r, n 5.5-7.© 0.24 n n
it n calcareous 0.39 n to
n n all soils 0.04 " n
total S. upt <5., 0.87** highly significant
5.5-7 *0 0072"
oalcaroous 0,83** 0
all soils 0.78**
it '
1 o • 01

• nitrogen
II
u3. Table 23) Relationship between sulphur and % nitroken in rograss.
S soil pH correlated with
Remark
< 5.5 -4.36 mot significant 5.5-7.0 -0.28 calcareous -0.34 all soils 0.005

AlueLMILag Pig. (21) Relationship between (a) soil total sulphur and
sulphur uptake, and (b) soil sulphato—s. and sulphur uptake.
6 (a) •
A O 0-
x O •0 0
O 0 •
• • • 0
A • • 0 0
00 0 00 0
•
•
•
t pH 5.5 o pH = 5.5-7.0 • calcareous
0 •
5
qn 4
3
2
1
0 100 500 1000 1500
(T.S.) P.p.m. (b)
6 •
• 0
o
0
•
• 0
0
0 0
0
5
4
3
+) 2 0
1
0
0 • oo
•
0$ •
.0 • 0 00 0 • 0
• •
•
• 0
x pH 5.5
O pH = 5.5-7.0 • caicareeus
01 0
10 20 30 40 50 60 70 80 90 100 110 120 130 140 150 sulphate—s (P.P.a.)

3-
1.5-
0
upta
ke
(mg.
)
4.5
10.5
9
7.5
6.
12.
10.5
9.
7.5
6-
4.5.
3
1.5
upta
ke
(mg.)
500 (10.p.m.) T.S.
1500
(b)
1000 0 100
• 0 • 0
0 0 •
0 0 O • A
0 0 • •
•
0 •
• • 0 0
7' oo a *** 0 0 • 0 ° o
A pH 5.5
O PH 5.5-7.0
• calcareous
Pit + Second Cuttings
Pig. (22) Relationship between (a) soil total sulphur and s-uptake by ryegrass (b) soil sulphate-sulphur and sulphur uptake.
12- O •
(a) • 0 • •
O
•
0,0 0 •
• 00 • •
06 • 4. 14 0
0 0 • 0
o 11. pH 5.5
It 0 pH 5.5-7.0 • calcareous
0 •
0 * 0 10 20 30 40 50 60 70 80 90 100 110 120 130 140 150
(p.p.m.) soil-s

15
0
Two cuttings + roots
pig. (23) Relationship between (a) soil total sulphur and sulphur uptake (b) soil sulphate-sulphur and sulphur uptake by ryegrass.
20.
(a)
0
ic *x
A i A
V 0 0 00 o
0
0 0
• 0
0
0
0
0
•
•
•
0
• 0
0 • •
• 0
•
•
•
x pH 5.5 O pH 5.5-7.0 • calcareous
200 400 600 800 1000 1200 1400 1500 Total-s (p.p.m.)
x pH 5.5 O PH 5.5-7.0
20 • calcareous
( b)
•
0 0
0 0. 0 • 0 A A A * • • •
• ois 0 o A 0
,g o o 0
+, 15-
4-3 10. 0 4-3
5, 0
• o0
0 0 • 0
0 0 10 20 30 40 50 60 70 80 90 100 110 120 130 140 150
Sulphate-8 (p.p.m.)

3
2
T. y
ield
(gm )
1
•
•
0 • • X
0 • v.
• 0 • • 0 •• • 0 • 0 • • • 0 0
s
0 • • 0 • • 0
Pig. (24) Relationships between total dry matter yield and (a) soil total s and (b) soil sulphate-s.
0
(a)
• • $
0 • •
3
2
r▪ l
0
4 • 0 0 • o • • 0
0 • • • * •
• • • o • • I •
Ao • 0 0 A • X pH 5.5
o pH = 5.5-7.0 X • calcareous
100 200 300 400 500 600 700 860 900 11)0611.00 1203130014001E0 • 4. (b) •
x pH 5.5- 0
o pH = 5.5-7.0 • calcareous
lb 20 30 40 50 60 70 80 90 100 110 120 130.140 lk sulphate-s

Fig. (25) Relationship. between total mill:tor uptake
and total dry matter yields.
5!
18
17
16
15
14
13
12
11
10
9
o0
•
•
•
0 •
0 •
0
•
•
••
0
1
•
0
8 0 0
x • • • 0 6
5. Adp
•
A • • • K PH 5.5 4,
• PH 5.5-7.0 3
0 calcareous 2
0 0 2 5
net total yield (gm)
3.5
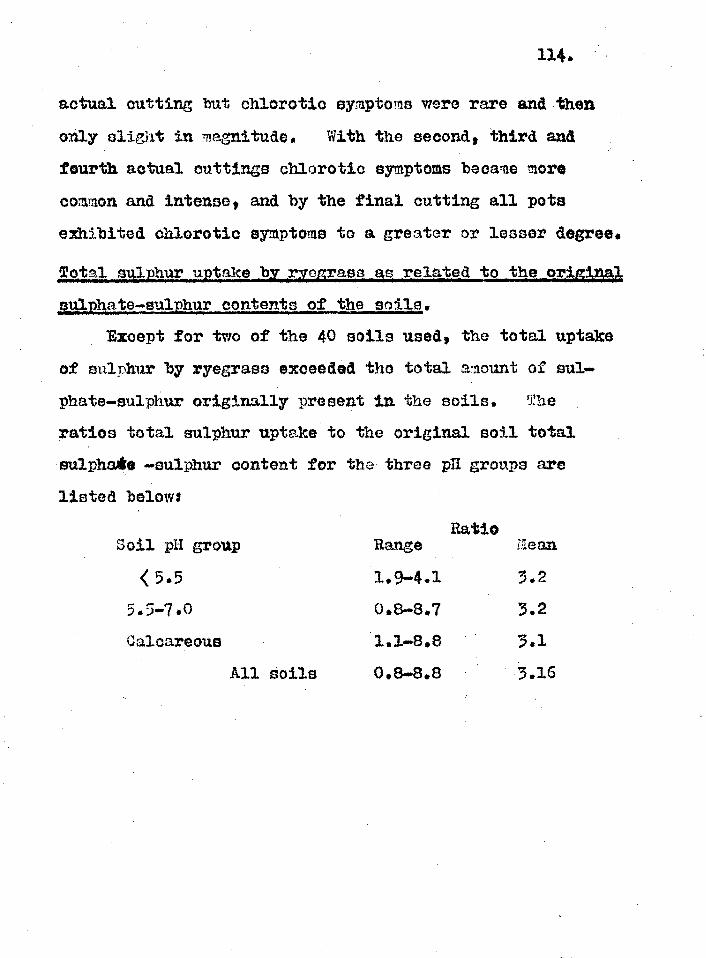
114.
actual cutting but chlorotic symptoms were rare and then
only alight in magnitude. With the second, third and
fourth actual cuttings chlorotic symptoms became more
common and intense, and by the final cutting all pots
exhibited chiorotic symptoms to a greater or lesser degree.
Total sulphur uptake by ryograss_as related to the original
sulphate-sulphur contents of the soils.
Except for two of the 40 soils used, the total uptake
of sulphur by ryegraso exceeded the total alount of sul-•
phate-sulphur originally present in the soils. The
ratios total sulphur uptake to the original soil total
sulpha*. -sulphur content for the three pH groups are
listed belows
Ratio Soil pH group Range
<5.5 1.9-4.1 3.2
5.5-7.0 0.8-8.7 3.2
Calcareous 1.1-8.8 3.1
All soils 0.8-8.8 3.16

115.
Discussion.,
When the soil pH groups are considered separately
it was fund that uptake of sulphur by ryegrass was
usually better correlated with initial soil sulphate con.
tent than with initial total sulphur content. When the
-sells are considered as a whole, however, the values of
the correlation coefficients between sulphur uptake on the
one hand and both initial sulphate content and initial total
sulphur content were very similar. Thus even though it
appears that the initial sulphate content is a better
indicitor than is initial total sulphur content of the
ability of ryegrass to take uP sulphur from the eons, the
importance of the latter cannot be excluded. This is
• 'confirmed by the fact that the average total uptake of
sulphur by the grass was about three times the amount of
sull*ate-sulphur originally present in the soils. Thus
the original organically bound sulphur has in, general made
the greatest contribution to the sulphur nutrition of the
.grass. This has probably occurred as a moult of mineral-
ization of organic soil sulphur during cropping. The
'increasing values of the correlation coefficients between
plant sulphur uptake and seal total sulphur with increasing
length of cropping indicates that the organic sulphur
fraction becomes increasingly important with time.

116•
The calcareous group of soils usually showed poor
correlation between sulphur uptake and both initial
sulphate and total sulphur contents. This is probably
due to the generally higher levels of both sulphate and
total sulphur in this group as compared with the lower
pH groups. This, together with the fact that grass
growing on the calcareous group took up more sulphur than.
did grass growing on the soils of lower pH, indicates that'
sulphur was not limiting the growth of the plants in the
oalcareous group. This is confirmed by the poor
correlation between total dry matter yields and both soil
sulphate and total sulphur contents in this group. On
the other hand the highly significant correlation between
total dry matter yields and initial soil sulphate for the
pH (-5.5 group indicates that sulphate was limiting in at
least Some of the soils of this group. This is oenfirmed
by the very high correlation between total sulphur uptake
and initial soil sulphate. ,
The poor correlations between dry matter yields and
sulphur in the plant material indicates that the latter
figure is a poor indicator of yield. This is probably
because the % sulphur in the plant did not vary widely
between different soils. This is reflected in the high
correlations between dry matter yields and total sulphUr
uptake.

117
The poor correlations botween 5) nitrogen in the plant
and both soil sulphate and total sulphur as well as
between nitrogen and 5 sulphur in the plant indicates that soil and plant sulphur status do not affect nitrogen
uptake, except insofar as they affect yields. This con
clusion differs from that obtained by Harward et alia (126)
Who found that ;'• nitrogen and cg, sulphur in lucerne were
positively correlated. However, in view of the ability
of lucerne to fix:nitrogen, it is possible that sulphur
plays au important part in this process and this could
account for the correlation between the two factors,
this study where no fixation occurred and where in any
case nitrogen was not limiting the growth of the grass,
it is perhaps not surprising that the two factors are not
correlated.
The organic sulphur fraction in soils is obviously
an important reserve of sulphur for plant nutrition,
resumably during cropping mineralization of organic
sulphur takes place continuously and the sulphate formed
is absorbed by the plant roots. In this study on an
average about 75°4 of the total sulphur taken up by the
ryegrass was present iritially in the soil in organic form.
Although there were considerable variations within each
pH group in the extent to which organic sulphur mineralized

118.
during croppinz, it is interesting to note that the
average extent of mineralization was very similar for
each pH group.
In conclusion it appears that in general the
calcareous group of soils was a better supplier of
sulphur to ryegrass, as indicated by the higher yieldn
and total sulphur uptake, than were the lower pli groups.
The pH 5.5-7.0 group was somewhat better than the pH < 5.5 group in these respects. The general tendency for 7
sulphur in the grass to increase with pH indicates that
at low pH sulphur compounds in the grass, including
sulphur amino acids, are more likely to be limiting for
animal growth at low than at high pH
Summary and Conclusions.
Ryegrass was grown in pots in the greenhouse for
185 days using 40 different soils (mixed with sand)
varying widely in pH, total sulphur, add sulphate con-
tents. rlajor and trace elements were applied to ensure
that sulphur was the only nutrient limiting the growth
of the grass. A number of cuttings were made and these
and the roots at the end of the experiment were weighed

119.
for yields and analysed for their sulphur and nitrogen
contents.
The total sulphur uptake by the plants both early
andII ate during cropping was highly correlated with
initial soil sulphate content for the soils as a whole
as well as for the V1(5.5. and pH 5,5-7.0 groups. The calcareous soils usually showed poor correlation between
the two factors.
Soil total sulphur was significantly correlated with total sulphur uptake when the soils were considered as a
whole. The pH (5.5. and the calcareous groups showed
no significant correlations between the two factors,
whilst the pH 5,5-7.0 group showed significant correlations
only towards the end of the cropping period.
Initial soil sulphate was significantly correlated
with total dry matter yields only with the pH 4 5.5 group. Total soil sulphur was significantly correlated with dry
matter yields only when the soils were considered as a
whole.
nitrogen in the grass was poorly correlated with
both initial soil sulphate and total sulphur.
Total dry matter yields were poorly correlated with
sulphur in the plant material, but were highly correlated
with total sulphur uptake by the plants.
1,4 sulphur and % nitrogen in the plant material were

.120.
poorly correlated with each other.
Bicopt for two of the 40 soils used, the total
uptake of sulphur by ryegrass exceeded the total amount
of sulphate—su10hur originally presnnt in the soils.
Up to 90:- of the total sulphur taken up by the grass was
derived from sulphur present in the soil in organic form
at the start of cropping. On an average, about 75Z o'
the total sulphur uptake was derived, from originally
organic sulphur.
The calcareous group of soils was a better supplier
of sulphur to ryegrass than were soil of lower pH,
whilst the p11 5,5-7,0 group was somewhat better than the
pH< 5.5 group.

121,
CHAPTER VII
THE EFFECT OF SULPHUR COMPOUNDS ON THE METABOLISM OF
SULPHUR AND CARBON IN SOILS AND UPTAKE OP SULPHUR BY
RYEGRASS AT 3 pH LEVELS.
Introduction
Experimental
Incubation Experiment
Pot Experiment
Results
incubation Experiment
Pot Etperiment
Discussion (of both incubation and pot testa)
Summary and Conclusions

122,
eduction.
Variouc organic sulphur compounds roach the soil in
the forl of residues of plants and animals and are also formed as products of microbial activity. The principal
end-product of decomposition of these compound? is sul-
phate under aerobic conditions and sulphides and elementary
sulphur under anaerobic conditions. Many reactions are
involved, however, before these end-products are forded
(101). Two of the important compounds in animal and
plant metabolism, namely methionine and cystine have been
detected in soils (128, 1290 130), indicating that these
compounds may play an important role in sulphur changes
in soils. Hesse (131) reported oxidation of methionine
to sulphate after 14-20 days in forest soils. Greenwood
and Lees (118), studying the dcomposition of methionine in soil, reported the production of thiols and sulphate.
Later (101) sulphate, dimethyl disulphide
and traces of hydrogen calphide were reported. Wood and
Baleen (127) showed that cystine added to sand cultures
resulted in an increase in sulphate in plant tissues.
They found that methionine also sti4ulated the growth of
sulphur-deficient plants. The production of sulphate
from cystine is more rapid than that from methionine (101). Preney (78) reported the following changes for cystine
oxidation in soils

123,
cystine-w cystine disulphtilliALcystine sulphinic acid—sulphate.
The pork reported in this chapter was carried out to
study:
(a) The mineralization under aerobic incubation conditions
of sulphur and carbon of methionine and cystine added to
soil in comparison with that of compost.
(b) The availability of the sulphur in, methioning, cystine,
compost, and potassium sulphate to ryegrass in pot tests
when the materials were applied at the same sulphur level.
In view of the possible importance of soil pH on the
metabolism of sulphur in soil and the fact that no work
appears to have been done on the pH effect, the above
experiments were carried out with a soil adjusted to three
pH levels.
Experimental
Samples of Silwood soil (sandy loam) were adjusted to
different pH levels by the use of aluminium chloride and
calcium carbonate as described in Chapter IV. Three of
these soils, having pH values of 4.9, 61, and 7.1 were
used for both the incubation and pot studies. These soils
and samples of methionInc, cystine, and compost were
analysed for total sulphur and sulphate-sulphur, Methionine

124.
and cystine'rere obtained from the British Drug HOUSOS.
.•The compost had been prepared by allowing wheat straw to
rot.for 6 months with the addition of sufficient green
grass to give an initial cabbon/nitrogen ratio of 40.
Incubation Experiment.
. .This wr,s 'one in test tubes as described in Chapter
IV usiir 10g. portions of air-dried 2 mm. sieved soil.'
Thodriedv ground compost eras added at the rate of
(equivalent to 10 tens per acre). The methionine and
eystine :ere "diluted" ?fith silver sand and an appropriate
aiount•ofthis weighed out so as to supply the same .amotnt
of sulphur as present in the added compost. The materials
were mixed thoroughly with the dry soil and the mixture
placed inthe.te t tubes. Water was then added to bring
thc moistnre content of the soil to 5O of the water-holding
capacity. For the potassium sulphate treatment, Analar
potassium sulphate was added in the sae amount of water '
so as to sl4ply. the sae amount .of sulphur as that present
ix the composT,. Vials containing bariva poro:cide and
water wore then placed on the soils in the tent tubes.
Per each treatment at each pIT. level, inclutling control
soils, four tubes wore prey:red. The tubes vire 'awn
incubated At 200 and duplicate tubes were re:aoved after
34 and 65 days fro l the start of the enperilaeriL.

125.
vials were analysed for carbonate and the soils for sul-
phate as described in Chapter II.
Pot Exterent.
70g. portions of soils of the three pH levels were
mixed with 230g. acid-washed sand, The compost was
mixed in at thea,ateof 1.e, and methioninc, eystine, and
potassium sulphate were mixed in to supply the same amount
Of Sulphur as present in the ,compost. The mixtures were
placed in email plastic pots sown With ryegrass (0.25g.
per pot) and the procedure from then was as described in
Chapter VI. Other major and trace elements were supplied
to ensure that sulphur was the only limiting nutrients
A control series for each pU level was run concurrently.
The experiment was started on 11th July 1961. Cuttings
were 'made on 29th August and 2nd October. These two
cuttings were mixed, dried and weighed and will be
referred to hereinafter as the first cutting. On 10th
November the tops and roots were collected together by
washing the soil from the roots. All materials, after
drying at 70°C were ground and analysed for total sulphur
as described in Chapter II.

126.
Results.
Incubation Experiment.
Table 24 shows the actual levels of sulphate-sulphur
found in the control and treated b ile initially and after
34 and 65 days of incubation. Table 25 shows the net
mineralization (or immobilization where negative values
occur) of sulphate-sulphur; these values were obtained
by subtracting the appropriate initial (pre-incubation)
values and also the values of the appropriate control soils.
Table 26 shows the values for carbon dioxide release
from the soils during incubation for 34 and 65 days.
Table 27 shows the net release of carbon dioxide, obtained
by subtracting the values obtained for the control soils.
The above results are also shown diagramatically in
Figs. 26-28, which show the not sulphate-sulphur levels
for the pH 4.9 soil (Pig. 26), the pH 6.1 soil (Fig. 27),
and the pH 7.1 soil (Pig. 28). Net carbon dioxide release
values are shown for the pH 4.9 soil in Fig. 29, for the
pH 6.1 soil in Fig. 30, and for the PR 7.1 soil in Pig. 31.
Table 28 shows the percentage recovery of added
sulphur as sulphate during incubation at the three pH
levels. Table 29 shows the perceatage loss of added car-
bon (as carbon dioxide).
Considering firstly sulphur mineralization it will be

Ts:no (21) nu a-lount of sulphate found during the
treated with various sources of sulphur.
sulDhate.
Soil pH 4.9 treatment initial 34
days 65 days
initial
Control . 5.57 7,04 10.21 10.0
Soil + Coilpoot 12.47 20.33 20.30 16.9
+ Liothionine 5.57 14.3 25.59 10.0
+ Cystine 5.57 47.29 43.40 10.0
+ 2304 40.07 42.98 47.70 .44.5
127.
incubation of Silvrood soil (3 pH levOle)
sulphur
6.10 7.10
34 days
65 days
initial 34 days
65 days
15.29 11.82 11.20 15.30 14.19
20.47 20.0 18.1 24.1 18.0
40.47 36.49 11.20 48.0 52.0
47.5 43.5 11.20 53.74 55.15
54.72 54,80 45.72 51,60 54.10*

128.
Table .(25) Net a-anunt of mineralized or immobilized
ulphate-3 daring the incubation of silwood woil (3 PA
levels treated with various sources of sul bur.
Sulphate-sulphur (p.p.m.)
Soil pH 4.90 6.10
7.10
reatment 34 65 34 65 34 65 days days days days days days
Soil + Compost 2.60 6.10 2.10 -1.0 2.9 -3.10
+ Llethionine 7.26 15.33 25.18 30.67 32.70 37.91 t + Oystine 40,25 33.19 32.21 31.68 38.44 40.96 I + K 30 1.44 2.99 2 4 4.93 8.48 1.80 5.41
Table (26) Iletabolism of carbon during the incubation of
S lwood soil levels treated with various sour e
n1 Co d roa he s art o experirnent
Soil PH 4.90 .10 7.10 treatmen 65 total 34 65 total 541- 65 totial days days daYs days days days Control 11.2 Soil compost 19.2 Soil + methionine14.5 Soil + cystine 13.2
Soil + K2SO4 9.9
3.2
6.2
5.0
5.3
3.5
14.3
25.4
19.5
18.5
13.4
11.7
22.2
16.2
13.9
14,3
4.8
7,0
5.2
5.5
4.4
16.5
29.2
21.40
19.4
18.7
16.3
26.7
19.9
19.4
15.9
6.4
12.
6.8
6.0
6.4
22.7
39.2
26.7
25.4
22

129*
Table 2,7) Net amounts of carbon mineralized or immobilized
during the incub2tion of Silwood soil (3 pH levels)
treatod with different material.
Net 00 released from the start of experiment (mg.)
Soil pH
4.9
treatment 34 65 days days
Soil + compost 8.0 3.10
Soil + methionine 3.3.1.9
Soil + cystine 2.0 2.2
Soil + IL 2504 0.4
6.10 7.10
total 34 65 days days
total 34 65 days days
total
114 10.50 2.20 12.70 10.40 6.10 16.50
5.2 4.50 0.40 4.9 3.6 0.4 4.0
4.2 2.2 0+70 2.9 3.1 .4 2.7
.0 «9 2.50 -0.4 2.2 -0.4 -0.4

130.
Table (28) PeroentaFe recovery of added sulphur assu1pate
durina incubation of soil at, pH levels treated with 'ipus materials
material added
/0 recovery of added sulphur as sulphate-. sulphur.
34 65 34 65 34 65 days days days days days days
Cethionine 21 45 73 89 95 110
0ystine 117 96 93 92 111 118
Compost 9 21 8 .4 10 —11
Sulphate 104 109 114 125 105 116
Table .2.9) Percentage loss ,of added carbon 00 ) shnrinr
incubation of. Silwepft soil at UR ilevelp treated V.th
materials.
N loss of added carbon soil pH carbon/
sulphur 4.9 6.10 7.10 ratio
953 90% 75; 1.80
190 160 140 1.11
9.0 9.5 11.0 116
materials added
methionine
cystine
compost

131
seen (Pigs. 26-26) that in the 1DH 4.9 soil the sulphur
of cystine mineralized at a much greater rate than that
of methionine. In the pH 6.1 and. 7.1 soils the mineral-
ization rate of methionina was only slightly lower than
that of cystine. In the pH 4.9 soil part of the sulphur
of cystine mineralized during 34 days was Immobilized
during further incubation, but this occurred to only a
small extent or not at all in the two soils of higher pH.
The mineralized sulphur from methionine showed no such
effect at any pi. from Table 28 it is Seen that
apparently more than 100;, of the added oystine-sulphur
was recovered as sulphate in some cases. This .indicates'
that the presence of cystine has stimulated the mineral-
izationof native soil organic sulphur compounds. In this
respect it has been most effective in the soil of pH 7,1
The compost-sulphur mineralized at a slow rate compared
with that of eystine-sulphur, In the soils of pH 6,1
and 7.1 prolonged incubation, (65 days) resulted in
apparent re-immobilization of some of the sulphur
mineralized in the early stages to such an extent that
negative values were obtained for net sulphate values.
The actual valuco are however, low and probably of doubt-
ful significance. The maximum recovery of compost-
sulphur as sulphate amounted to 21tA„ this occurring after
25 days incubation at pH 4.9. At the two higher pH

Fig. (26) Net sulphate-sulphur values during incubation of pH 4.9 soil treated with various materials.

0 t•
I
10-
0 4
0
01-01;447"4" *
kz so4.
30
•
4' -5_
OH = 6.10
Fig. (27) Net sulphate—sulphur values during incubation of pH = 6.1 soil treated with various materials.
40..

30
4
0
Ott
Fig. (28) Net values of sulphate—sulphur during the incubation of pH = 7.10 soil treated with various materials.
40
10
34 Days
—5 PH = 7.1

pH = 4.9
11
10
9
8
7
a) 6 ca as 5
ti cm 4
0 0
2
1 Days of incubation
0
—1
—2
0
. Fig. (29) Net values of CO2 released during incubation of pH = 4.9 soil treated with various materials.

12
11
10
9
To 8
7 0 0
6 42)
a) k 5
4. 4-)
3
2
1
0
Pig. (30) Net values of CO2 released during incubation of pH = 6.1 soil treated with various materials.
1.
°
0 •
4
•
• •
1 aeJtA-0- 4"44- 0
•
0
-
k. ic- 2- So ti
34 65 Days of incubation
0
•
pH = 6.10

ti
Pig. (31) Net values of 002 released during incubation of pH = 7.1 soil treated with various materials.
17
zA
M e, 0
o .---.--•••••• 0
Cp 4. 0
4
net CO2 re
leas
ed (
mg )
16
15
14
13
12
11
10
9
4
3
Days of incubation 24 • 65
1. s'611 PH = 7.1

132.
levels no compost ca/phur was recovered after 65 dus.
The positive net values at all pH levels due to the
j,otaesiu,'. sulphate treatlient and the fact that recovery
of added sulphate-calphur exceeded 10(V, (Table 2)
indicates that this material has also stimulated the
mineraliztion of sulphur in the native soil organic sul-
phur compounds* This effort was greatest at pH 6.1.
The percent-se loss of added methionine-carhon during
incbation ranged from 75 to 95 and tended to decrease
with increasing pH. The percentage loss of added cystine-
. carbon ranged from 140 to 190 and also tended to decrease
with increasing pH. The greater than 100 values
obtained indicate that cystino had stimulated the mineral
ization soil native organic carbon. • The added compost'
lost little of its carbon, ranging from 9;", to lri% The
percentage loss of carbon fro n the added materials ras
roughly correlated•Iith the carbon/sulphur ratio of the
materials. Addition of poraSsium sulphate dcpr,soed.the .
mireralization of native organic carbon.
P t Enperi-nE,nt.
Tables 30-32 show (a) dry matter yields of the 'first
cutting of ryegrass, roots + tops and total dry matter
yields, (b) sulphur in the materials and (o) total sul
phur uptake for the soil of IA 4.9 (table W), pH 6.1
(table 31) and pH 7.1. (table 32).

133.
Table (30) Dry matter yield, percentage of aulphur and
on Silwood soil of pH = 4.9 treated with various materia1s1
total out hur unta171) r,emrass rown
4easOmmoul*
uptake of sulp • ur told (g.)
Treatment lot cutting
to
tope
total mean left cutting
tops
roots
T. uptake by
top + root
!dean
Control
Control
Compost
+ Compost
+72ethienine
+ Methionine
+ Cystine
+ Cystine
+ K2 04 K2804
.4774
.4736
.6564
.4688
.4130
.4280
.6028
.5506
.4792
.4548
.6482
.7420
.6968
.6388
46336
.7504
.6376
.7740
.6744
.6426
1.1256
1.2156
1.3534
1.1076
1.0466
1.1784.
1.2404
1.3246
1.1536
1.0974
1.1706
1.2305
1.1120
1.2825
1.1255
.580
.750
.612
.600
.833
.780
730
.633
.691
.620
.355
.335
.350
.358
.467
.500
.500
.500
.505
.510
5.07
6.03
6.46
5.10
6.04
7.09
7.58
7.36
6.55
6.09
5.55
5.78
6.56
7.47
6.32
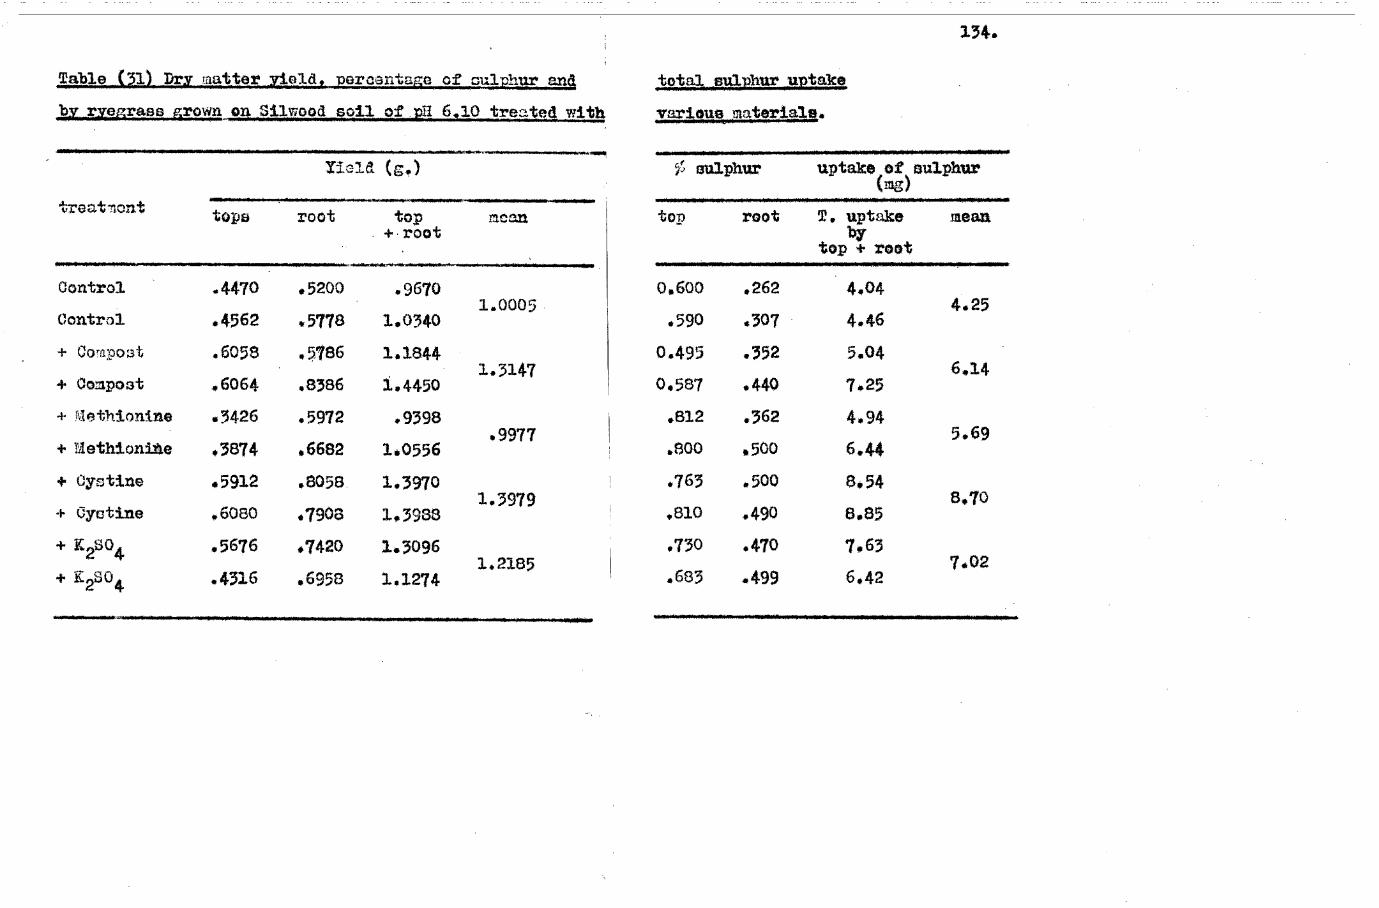
uptake of)su
T. uptake mean by
top + root
4.04 4.25
4.46
5.04 6.14
7.25
4.94 5.69
6.44
8,54 8.70
8.85
7.63
6.42 7.02
134.
Table (31) Dry matter yield, percentage of sulphur and
total sulphur uptake
by rypgrass pirown on Silwood soil of.pH 6.10 treated with varioutt materials.
treatmont
riold (g.)
root top .1-, root
ton root
Control .4470 .5200 .9670 0.600 .262 1.0005
Control .4562 .5778 1.0340 .590 .307
CoTpwat .6058 .5786 1.1844 0.495 .352 1.3147
+ Conpost .6064 .8386 1.4450 0.587 .440
+ Msthionine .3426 .5972 .9398 .812 .362 .9977
+ Methionifte .3874 6682 1.0556 .800 .500
+ Cystine .5912 .8058. 1.3970 .763 .500
+ Cyctine .6080 .7908 1.3988 1.3979
.810 .490
+ 2SO4 .5676 .7420 1.3096 .730 .470 185
+ K2SO4 .4316 .6958 1.1274 .683 .499

135.
Table (32) Dry matter yi,21,2j taeoLtza....rand, total sulbAru.taLtzy2aEa22
IlzaziaziailmalLiajiLdpa Llalatta:UsUtkluadalla Materials.
treataent Yield (c.) sulphur T. uptake of sulphur
(ne) moortrao•
tops roots top + root
mean tops roots T. uptake by
top + root mean
Control .4014 .4574 .3508 .550 .520 4.59 .9840 4.85
Control .5130 .5962 1.1092 .562 .375 5.11 + Colpost .6024 .6036 1.2060 .612 .400 6.10
1.2298 6.11 + Compost .4314 .7722 1.2536 .634 .400 6,13 + ;aothiAlino .4874 .3200 1.3074 .687 .460 7.12
1.2312 6.86 + Uethionine .3910 .7640 1.1550 .675 .520 6.61 + Cystine .6982 .6391 1.3773 .672 .530 8.28
1.3337 7.94 + Cystine .6534 .6368 1.2902 .812 .520 7.61
K2504 .4622 .8272 1.2894 .612 .445 6.51 1.2685 7.32
+ E2$04 .5517 .6958 1.2476 .690 .625 8.14

Pig. (32) Net sulphur uptake by ryegraes.

Pig. (33) Net sulphur uptake by ryegrass.
69
120 Days
net 3- upta ke (mg )

Pig. (34) Net sulphur uptake by ryegrass.
69 120 Days

136.
Table 33 shows the analysis of variance for the
total dry matter yields for all treatments at all pH
levels, and Table 34 shows the same thing for total
sulphur uptake.
Total dry matter yields ranged from 0.984g to
1.393g. per pot. In general the cystine treatments gave
the highest yields, followed in decreasing order by compost,
potassium sulphate, uethionino and controls. For each
treatment yields wore usually igher at pH 6.1 or 1.1 than
at pfl 4.9, The mean values for total.sulphur uptake (m& per
pot) for the different treatments at the three pa levels
are suilmarized below;
;Teat op.t, La 6 1 la M
Control 5.55 4.25 4.85 4.88
Compost 5.78 6.14 6.11 6.01
Liethionine 6.56 5.69 6.86 6.37
Oystine 7.97 8.70' 6.45 8.34
.eotassium sulphate 6.32 7.02 7.32 6.89
?lean 6.44 6.36 6.71
Total sulphur uptake ranted from 4.25 :fig71. to 8.70 mgm.
per pot. Differences in total sulphur uptake due to pH were relatively small compared with differences due to

137.
Tablo (33) Totaliield of ryegraos p.own on Silwood
(3 PR levels) treated with :various materials.
Treatment R. I R 11 Tr. total Tr. mean In4' value
Cl (a) 1.126 1.216 2.342 1.171
02 0.967 1.034 2.001 1.000
03 0.859 1.109 1.968. 0.984
Co 1.353 1.108 2.461 .1.230
002 1.184 1.445 2.629 1.314
0o3 1.206 1.254 2.460 1.230 2.954
Met 1.047 1.178 2.225 1.112 significant
'.4et2 0.940 1.056 1.996 0.996 at
Met3 1,307 1.155 2.462 1.231
Cyl 1.240 1.325 2.565 1.282
Cy2 1.397 1.399 2.796 1.398
0y3 1.377 1.390 2.667 1.333
Kl 1.154 1.097 2.251 1.125
'2 1.309 1.127 2.436 1.218
K3 1.289 1.248 2.537 1.268
3.B.= ± 0,039 C.D. at 5; = .084 esAk. Cy2, Co2, Cy , 1(3, ilet3, CO3, Co K2'# K1, aetl'
02, 1Wc;20 03.
(a) = 1 = pH 4.9, 2 = ph 6.1, 3 = pi/ 74
Control, Co = Compost, Llet = Ilethionine, Cy = Cystl.ne,
K = Potancium sulphate.

138.
2111112 011Tatalmanor uttake by ryegrass(total yields), grown on Silwood_soil.of 3 pH levels.
Treatment R I R II Tr. total Tr. i4ean '111# value
01 (a)
C2 03 Col
Co2 Co-
Met 1
Met2
I
Cy/
Cy2
0y3
5.07 6.03 11.10 5.55
4.04 4.46 8.50 4.25
4.59 5.11 9;70 4,85 6.46 5.10 11.56 5.78
5.04 7.25 12.29 6.14 **
6,10 6.13 12.23 6.11 P = 4.928
6.04 7.09 13.13 6,56 significant
4.94 6.44 11.38 5.69 at 5
7.12 6.61 13.73 6.86
7.58 736 14.94 7.47 8.54 8.85 17.39 8.70
8.28 7.61 15.89 7.94
6.35 6.09 12.64 6.32
7.63 6.42 14.05 7.02
6.51 8.14 14.65 7.32
• 8.2. = + 0.28 Results.
V 0y3, Cy.
0.D. at 5;:,= 0.60,
Met
Met
4K0ijp qt. .03
(a) 1 = pH 4.9, 2 = pH 6.1, 3 pH 7.1
C = Control, Co *=Compost, aet Mothionine, 0y Cystine,
K = Potassium sulphate.

139.
treatment. In general cystine gave the highest sulphur
,uptake. followed 'in decreasing order by potassium sulphide,
.methionino, compost and controls. For each treatment
total sulphur uptake was usually higher at pH 6.1 or 7.1
than at p11 4.9. At pH 6.1 and 7.1 aU treatments were
usually significantly diTforent with respect to total
sulphur uptake, whilst at pH 4.9 the differences rere not consistently significant
Discussion (of both incubation and pot tests).
The main factor eerging from these two experiments
is ease with which the sulphur in cystine is mineralized
at all pH levels. The high uptake of cystine-sulphur by
ryograss can be exl)lained if it is assumed that sulphur'
is taken up by the plant only after cystine sulphur has
mineralized. Thus it appears that cystine is decomposed
quickly by soil bacteria and in addition the activity of
the bacteria are stimulated to such an extent by the
presence of cystine that some of the native organic sulphur
compounds arc ales mineralized. This would explain the
greater than 100 recovery of added cystine-sulphur as
sulphate in the incubation tests. 'lethionine-sulphur

140.
mineralized less readily than did eystine-sulphurt
particularly in soil of pH 4.9* At this low pH
methionine-sulphur mineralized more readily during the
later than during the early period of incubation. Other
workers'(101, 118, 131) have also found that mothionine
decomposed more slowly in soils than did other amino-
acids.• These wor7aers did not study the effect of Al and
this' study has shown that the sulphur of methionine was
mineralized less, readily than that of cystinc,only,at low
soil pH. In addition the relatively poor uptake of
methionine-salthur by ryegrass conpared with the ealphur
of the oi;hcr materials tooted shows that even in the
presence of plant rooto methienine-sulPhur is only slowly
Aineralized. In the pot testa there is a possibility *hat some of the methionine-sulPhur was lost as volatile organic
alphur coalpoands and thin could = ve accounted for the
poorer uptake of methioninc-sulphur. Other worl:era (101,
118) have reported the forniation of such compounds dOring
dec =position of mothioninc. In the incubation test in
this otudy the mathioninc-tre ted coil elicit strongly of
garlic-like sabatances, particularly in the early stage
at high and the later etago at low pH. These vapours
gave positive testa with mercuric chloride and mercuric)
cyanide solutions, indicating the presence of dimethyl

141«
disulphide and methylthiol. In the incubation tests,
which were carried out in closed containers, most of these
volatile compounds would be retained by the soil and the
sulphur in then eventually mineralized, Whilst in the
pot tots they would be lost by volatilization before the
sulphur in them could be mineralized. Beoauee of the
porosity of the sand-soil mixtures used in this study loss
by volatilization would probably be high.
It is interesting to note, as shown in the imitation
test, that the addition of sulphate as did addition of
cystine to the soil tended to stimulate the mineralization
of soil native organic sulphur compounds« Thie effect
was more consistent for sulphate additions than for
eystine additions. On the other hand, uptake of sulphur
by ryegrass was usually greater where eystine than Where
sulphate containing the same amount of sulphur was added. This shows the superiority of an organic over an inorganic
form of sulphur for plants.
Although compost showed poor mineralization of its
sulphur in comparison with the other materials in the
incubation test, its ability to supply sulphur to rye-
gr ss was usually somewhat greater than that of methionine
in the early stagesot growth, but not in the later stages.
With compost there was a poor relationship between sulphur
mineralized during incubation and the ability of the

142.
material to supply sulphur to ryegrase.
The higher than 100 loss of added cystine-carbon
in the incubation test indicates that the carbon in this
material was completely mineralized and in addition the
material stimulated the mineralization of native organic Carbon. liethionine.carbon, on the other hand, was only
partially lost, The results are generally comparable
with recovery of added organic sulphur as sulphate,
exoept that cystine addition stimulated mineralization of
native organic carbon to a greater extent than it
stimulated mineralization of native organic sulphur; also
pit had lees effect on loss of methionine-carbon than on
recovery of methionine.sulphur as sulphate. Since
addition of potassium sulphate depressed the mineralization
of native organic carbon but stimulated the mineralization
of native organic sulphur, this indicates that the
addition of sulphate-containing fertilizers might help to
conserve humus from loss by oxidation Whilst helping to
improve the soil sulphur status. Easily decomposable
organic sulphur compounds, on the other hand, would tend
to stimulat4aoterial activity, resulting in increased
mineralization of sulphur but at the same time would tend
to reduce the soil humus reserves. But the reduction in
reserves of humus would be accompanied by increasing
availability of sulphur to plants.

143.
Su-ma/7 and Conclusions,
The effects of methionine, cystine, compost and
Potassium sulphate applied at the same sulphur gate -on
metabolism of eulphur and carbon in incubation tests and
on yields of and sulphur uptake by ryegraes in pot tests
were studied using a sandy loam soil which had been
,adjusted to pH levels of 4.9, 6,1 and 7,1.
Cystine mineralized rapidly at all pH levels and also
stimulated the mineralization of soil native organs o
sulphur and carbon. The cystine treatment showed the
highest dry matter yields and uptake of sulphur by rye..
grass.
Mineralization of methionine was slow compared with
that of cystine in the early stages of incubation, par-
tioularly in the soil of pH 4.9. By the end of the
incubation mineralization of methionine-sulphur was
virtually complete except at the low pH. Mineralization
of methionine-carbon decreased with increasing soil pH
and methiopine apparently did not stimulate mineralization
of soil native organic carbon, Illethionine was a
relatively poor source of sulphur for ryegrass as compared
with cystine.
Although compost resulted in a not immobilization
sulphur in the incubation tests, it stimulated uptake of


145.
CEA TER "PRIX
General Discussion and Conclusions.
ulphur. Cycle.

146.
General Disaassion and Conclusions.
The 63 soils obtained from various parts of Southern
England and used in this study contained an average of
7,036 of their: sulphur in the form of sulphate, the
: remainder being in the form of organically bound sulphur •
compounds. • This level is of the same order as those
reported by workers from other countries. Thus it would
. appearthat organic sulphur is an important, reserve of
sulphur for plants providing that conditions are satiS..
factory for its conversion to sulphate in the'soil. .•
Under aerobic conditions and'in'the_absence of easily . -
decomposable organic .material organic sulphur is converted
to sulphate by the action of bacteria. The extent of ,
conversion was not related to soil pH when 'different
soils were considered but .With a. single soil type of
varying pH the extent of sulphur mineralization increased
with pH. Thus sulphur mineralization appears to follow
a trend similar to that of nitrogen and carbon mineraliz—
In the pre,6onoe of easily. decomposable organic material
of low sulphur content immobilization of sulphate occurred
even under aerobic conditions, presumably due to the
sulphur requirements of thoseorganisms responsible for the
decomposition of the organic matorials. Thus straw

147.
addition resul ed in the greatest level of immobilization
of sulphur, but grass and compost additions also resulted
in some immobilization. All these materials contained
lose than O*V total sulphur (dry basis) and this appears
to be the approximate critical level of sulphur content
and any material having less than thin amount of sulphur
will cause immobilization of sulphur when added to mils*
This immobilisation is only temporary and with further
time most or all of the immobilized sulphur is again
recovered as sulphate. When materials of high sulphur
content were added to soil there was a fairly rapid
mineralization of sulphur, with no apparent initial
tendency for immobilization to °mar, lethionine and
oystine, which are probably the two most important oulPhur
intermediates formed, during the minoralization of protein
material, differed in their rate of mineralization with
methionine showing relatively low mineralization, par-
ticularly at low pR
The significant car ion ecieting between total
sulphur on the one hand and total nitrogen and organic
carbon on tho other hand indicates an intimate association
of those three elements in soil organic matter. The fact
that calcareous soils on an average contained more sul-
phur than did non-ealcareous soils is probably due to the
148*
protective effect of calcium carbonate in retaining
sulphate in flop-leadhable form. Calcareous soils also
shored themselves as better suppliers of sulphur when
cropped with ryegrass than did nop-calcareous soils,
Indicating that the sulphate retained by them is in
easily available form. This ability of calcareous soils
to retain sulphate which is easily available to plants its
in contrast to the generally low status of calcareous
soils with respect to nitrogen. This is presumably
because not only is nitrogen readily mineralized in such
soils, but also because nitrate, the final, product of
nitrogen mineralization, is not retained by soils against
the effects of leaching. The generally high level of
sulphate as well as of total sulphur in oaloareous soils,,
as compared with those, in non-calcareous soils, indicate
that.the former group probably contain an adequate level
of available sulphur for plants*
The study on the concurrent mineralization of eul
phur, nitrogen and carbon in the soils indicated that in
general the proportion of sulphur mineralized was greatft
than that of nitrogen but less than that of carbon. It
is possible that non-protein sulphur compounds e.g.
sulphated polysaccharides or bisulphite coipounds of
ligninsp.that contain little or no nitrogen, are present

149.
in soils, The relatively close correlation existing
between mineralized sulphur and nitrogen compared with
that between mineralized sulphur and carbon indicates that
mineralized sulphur and, nitrogen are derived from a
common source, probably modified humus protein, whilst
mineralized carbon in derived from this source as well as
from highly cellulosic material, such as plant residues.
If even a 'small amovmt of plant residue is present, then
this, because of its side carbon/nitrogen ratio, will
release carbon dioxide during its decomposition without
corresponding mineralization of sulphur.
The incubation tests indicate that the rate at which
sulphur mineralizes in sails is probably sufficient to
suprly all of the element necessary for cereal and hay
crone, but not for gross feeding crops such as swedes or
potatoes. The latter would have to rely on reserves of
soil sulphate and sulphate applied as fertili ere. In
this, connection it is again worth mentioning that the
modern trend for using concentrated mixed fertilizers free of sulphate is likely to eventually cause sulphur
deficiencies even in soils which in the past have been able
to supply adequate, sulphur to plants. Crops such as the
brassicas, mustard., and lucerne, which have, an unusually
high sulphur requirement, are likely to be the firnt to
150*
suffer.
The fact that added sulphate stimulated the
mineralization of native soil sulphur and depressed that
of native organic carbon together with the fact that added
cystine stinulated the mineralization of both native
organic carbon and sulphur indicates that a mixture of
both organic and inorganic sulphur compounds should be
applied in Order to maintain adequate sulphur nutrition
of the crops without excessive destruction of soil organic
matter* with its consequent bad effects. The fact that
cystine was more effective than sulphate (when both were
applied at the sane sulphur .. rate) in increasing both yields
and sulphur uptake icy ryograss indicates the superiority
of an organic over an inorganic form of fertilizer such
as has often been demonstrated in the past with nitrogen.
A consideration of some of the correlation coeffloients
which have been, calculated in this study is of interest
in indicating the value of one variable for predicting
that of another. Thus ,both total nitrogen and organic
carbon may be useful as rough indications of the amount of
total sulphur present. Organic carbon in acid soils would
be of particular value. Similarly the total nitrogen
content of acid soils, but not neutral or calcareous soils,
could be of value in indicating soil sulphate level

151
Apart from this sulphate was poorly correlated with the
other values measured.. Total sulphur wan also poorly
correlated with soil pH and clay content. Thus neither
of these latter two values are of use in indicoting the
possible sulphate or total sulphur level in soils.
The average nitrogen/sulphur ratio of the soils used
in this study was 10/2.5, Which is somewhat narrower than
those reported by workers in other countries, values in
the order of 10/1.5 being obtained. The reasons for this
difference are not readily apparent. One reason may be
due to the fact that the soils used in this study were
all cultivated soils which had presumably received
sulphur-containing fertilizers (superphosphate and ammonium
and potassium sulphates) which may have resulted in an
accumulation of organic sulphur compounds derived from
plant material unusually rich in sulphur. This is
supported by the fact that other workers have included
non oultivated non-fertilized soils in their average values.
In addition, there is a possibility-that the methods used
by these workers for deteraining total sulphur in soils
dlA
nit result In complete recovery of sulphur. This'
could .account, at least partly, for the wider average
nitrogen/sulphur ratios obtained by them as compared with
that obtained in this stUdy..

l52
The pot tests with ryegraas indicated that the
ealcareous group of soils were higher in available
sulphur than were the non-calcareous soils. This was
shown by both higher average dry matter yields and total
uptake of sulphur from the calearebus group. There
were also indications that the medium pEt group of soils
was soeewhat better in these respects than were the acid
soils.
Within the calcareous group there was poor
correlation between yields or total sulphur uptake on the
one hand and initial soil sulphate or initial total soil
sulphur on the other. This indicates that sulphur was
not limiting the growth of ryograss in the caleareous
group. Within the acid group of coils both yields and
sulphur uptake were correlated with initial soil sulphate
but not with initial soil total sulphur. Thie indicates
that at least some of the soils in this group were
deficient in sulphur with respect to the growth of the
grass, and that this deficiency was in sulphate rather
than in total sulphur. In such soils mineralization of
organic) sulphur was low during cropping, so that the grass soil
had to rely on initial/sulphate for most of its sulphur
uptake. Within the medium pa group of soils yields were
poorly correlated with both initial soil total sulphur and

153.
sulphate, but total sulphur uptake was well correlated
with both factors, The high correlation at all stages
of cropping between sulphur uptake and initial soil
sulphate together with the fact that the correlation
between sulphur uptake and soil total sulphur increased
with extent of cropping indicates that although initial
sulphate is important, total sulphur becomes increasingly
important with time. This would be expected since
sulphate is immediately available to the plant, whilst
total sulphur (which is essentially organic sulphur)
becomes available only after mineralisation.
If the results obtained in the pot tests could be
applied to the growth of grass in the field they would
indicate that initial soil total sulphur content would be
a suitable indicator of sulphur availability to the plant
only in soils of medium pH, whilst initial soil sulphate
content would be a suitable indicator for all except
calcareous, soils.

154. The .Sulphur Cycle.
The sulphur cycle in nature is shown in Pig. 35.
This study has been concerned with those obmages shown in the lower half of the diagram, 10ee, mineralization and immobilization occurring under aerobic conditions. The diagram shows only the main changes which occur.. In
actual fact many intermediates, both organic and inorganic,
have been shown to be formed. Some of these may be of
importance for plant growth, e.g. the sulphur amino—acids
may be absorbed directly by plants at least to some extent
and may be more effective as a source of sulphur than is
sulphate; in addition the sulphur—contalytirig vitamins
biotin and thiamine may also have a growth—promoting effect
for plants.
The upper part of the diagram is concerned with
changes occurring under both aerobic and anaerobic con—
ditions. In poorly drained soils these changes maybe
of signifioanoe with, respect to their effects on plant
growth. These changes are of even greater importance in
soils growing rice which are waterlogged on purpose. The main "gains" to sulphur to the cycle are from
sulphate fertilizers derived from deposits of sulphur and
sulphides. The main "losses" of sulvhur from the cycle are into the sea as sewage effluent and soil leaching«

Anaerobic • mineralization
Organic matter (Humus)
ac
and 11°8 2-
anaerobic aerobic
oxidation
. Reduc.
Aerobic Bacte oxides
Gain from
fertilizer
ial ion
Waste an dead animal matter
Aerobic immobilization
Dead plant matter
so2 4
Plant food
Animal protein (org. S.)
animal food
Plant protein (org. S.)
Fig. (35)
The sulphur cycle in nature.
Bacterial oxidation
Sulphur
Loss through -37;a11737151 sewage

55. The small gain of sulphur from the sea obtained by the
use of fish manures is probably negligible compared with
the amounts lost into the sea, Thus our sulphur
reserves are gradually disappearing into the sea and a
time will no doubt come when we will be forced to
recover sulphur from the sea. However, the proper use
of sulphur.-containing fertilizers combined with the more
widespread use of sewage sludges and even of sewage
effluents, such as has been reported from the United
States, Will do much to help to conserve our supplies of
sulphur.
Following from this it appears that much useful work ooulk be done along the lines of studying the availability to plants of sulphur from organic sources such as sewage,
sludge, manure, and compost. In addition the direct
nutrition t1 effect of organic sources of sulphur such as
cystine should be more fully investigated. There is
also much work to be done on the nature of the organic
forms of sulphur present in soils and factors affecting
their formation and decomposition.

156.
References.
1. Jackson, M.L., 1953, Soil Chemical Analysis (2) London, Constable & Co. Ltd.
2. !iurray, 1950, Co. Ltd.,
Biology (471) London, Macmilan
3. Thver, B.S. (478) 2nd
4. Crocker, T,„,
and Anderson D.B. 1952, 21ant Physiology edition New York, London, D. van Nostrand Co,
1945, Soil Science, 59, (149).
5. Shorn, 11.0., 195 • (66).
6. Thomas, 1947, Plant Physiology 3rd edition, (166) London, J. g: A. Churchill Ltd.
7. Boll-Davidson-Scarborough, 1961, Testbook of Physiology and Biochemistry 5th edition, London, Livingston Ltd.
8, liar, 1959, Soil fertility, (209-222), 2nd edition, John Vilcy & Son Inc,
9. Woodurd, J., 1922, Bot.Gaz., 73: (81-109).
10. Shedd, 0.., 1913, Ky.Agr.Exp.Bul., 174, (269-306).
11. Dymond, Hu;hco F., Sci., Vol. 2, 217).
Jupe, C.V.C.„ 19051 J.Agr.
12. Lyon, and Bizzell, J. Vol. 8, (88),
1916, J.Amer.Soc.Agro.
13. Shedd, 0. 1914, Ky.Agr,Z7.p.Sta.Bul., 188, (595-630)0
14. Peterson, W.H., 1914, Wis.AgriExp ta.Bul, 240, (18-19),
15. !Mier, TLC., 1919, J.&gr.Res., Vol. 17, (87-100).
16. elean H.0., 1916, Soil Sci. 5, (258).
17. Lipman, C.B., GoriCtr:, V.P., 1913, Neil 6ci., 7, (81)
18. Robinson, W.O., 1914, U.3. Dept. Agr.Bui., 122, (27).
Chemistry of food and nutrition,

157.
19. Walks7an, .11., 1927, Principles of soil microbiolegy, Tindall & Cox.
20, Eaton, 8.V., 1922, Bot.Gaz., qA-, (32-56).
21. Hall, H."1.0 1922, Bot.Gaz., 73, (401-410).
22. Ginsburg, 3.71., 1925, Soil Sol., 20, (6),
23. Patterson, W.H., 1914, J„Amer.Chem.Soo., Vol. 36, (1290).
24. Baton, 5.V., 1941, Bot.Gaz., 102, (536.556).
25. Thomas, 7.141 Uondrloks, R•114,, Collier T.R. and Hill, R., 1943, Plant Phys., 18, (345-370).
26. Mandels, C.ft., 1943, Plant PhYs./ 18, (449-474).
27. Young, 0.., 1945, Soil Sci.Soc.kne.Proc., 6, (215-218).
28. Harris R.O., 1945, J.Ame Sco.Agron., 73, (323-328).
29. ri31o, D.R. and Zaton, P.M., 1951, Plant Phys. 26, 629).
30. Russell, E.J., 1961, Soil condition and plant growth, 9th edition, Longman.
31. Neas, L., 1953, J.Agron., 45, (472-477).
32. Humphreys, L.R. 1954, Soil and fertilizers 17, (535).
33. Pried, 1948, Soil Sci.Soc.Amearoc., 13, (135-138).
34. Alway, Marsh, k.W. and lethley, v/.41„ 1937, Soil Sci.Soc.kicr,Procs, 2, (237).
35. Wilson, D.P., 1926, J.Amer.Soc.Agron., 18, (1108)
36. Jordan, H.V. and Ensminger, L.E., Advances in Agron4, 1958, X, (407-432),
37. Shaw, W.j, and Young, J.B., 1938, Soil Sol., 46, (229-247).
38. Kilmer, V.J. Hayes, O.E. and Muckenbirn, 1944, Agron.' 36' (249-263).

158.
39. Battisse, 1954, Soils and fertilizers, 17, (153).
40. Waters, B.F., 1957, New Jeland J.Agron., 95, (16).
41 Olscn, A.A., 1957, Soil Sci., 84, (107-111).
42. Anderson, 0.B. and Webster, 1.1.11., 1959, J.kgron., 51. (675-677).
43. Lott, W.L., deClung, A.O. and viedcalf, J.C., 1961, Soils and fertilizers, 24-1, (72).
44. Young, L. and Maw, G.A., The metabolis:1 of sulphur compounds., 1958, let edition, London, Methuen& Co. Ltd.,
45. ,Torris, C.J. and Thompson, J.P., 1956, J.Aner.Chom. Soc., 78, (160).
46. Evans, C.A., and Rost, C.O., 1945, Soil Sol., 59, (125).
47. Little, A.C., 1958, J.Sci.Food Agri., 9, (273-281).
48. Jopdan, Bardsloy, C.E., 1958, Soil Sci.Soo. Arler.Proc., 22, (254-256).
49. Neller, J.R., 1959, Soil Sci.Soc.Amer.Proc., 23, (346-348).
50. Neller, J.R., 1961, Soils and Fertilizers, 24-2, (142).
51. Malavalta, E., 1954, Ohem.Abstr., 48-1, (1485).
52. Xemprath, E.J., Nelson, W.L. and Pitts, 3.7., 1957, Agron.J., 49, (289-293).
53. Shkonde, E.I., 1957, Soils and Fertilizers, 20, (785).
54. Williams, C.H., Stoinbergs, A., 1959, Austr. J.Agrio Res., 10, (340-352).
55. Mehring, A.L. and Bennett, C.A., 1950, Soil Sci., 70, (75-81).
56. Conrad, 3.2., 1950, Soil Sol., 70, (4344).
57. Neller and co-workers, 1951, Chom.Abstr., 45-31 (10458).

159.
58. Bently, 0.P., Hoff, D. and Mtt, D.P., 19561 rJb,ra.Alintr., 50—.L. (337).
on.J 59. Bardsley, 0.., Joldrn, q.V., 1957, 49, (510-312).
60. 7alk-r, and Adams, P.R., 1958, Plants an6 soil, 9, (353-363).
61. icOlunr!,, A.C., lartino, bat. do PrItes, 1959, Soil 5oi.Soe.Anor.Pron., 23, (221-224).
62. Ranson, B., 1961, Soils nnd Fertilisers, 23, (442).
63. Utephens, D., 19C)00 anc rcrtilizer, 3 (341).
64, Colo, Y., 1960, 11 end, Frtili5 , 23-5,(354).
65. Ashly, 11kv., !:.3„ 1960, Soils and Fertilisers, 23-4, (304).
66. Barrow, J.N., 1961, A s.J.kgri.Res., 12, (306-319).
67. JoOlung, 4.., 'Artines In. dc Froites, 1959, Chem. Abstr., 53-5, (19250).
68. Walkr, T.t., 1957, J.Driti Grasel.:30c., 12, (10-18).
69. u.a., and ,t:inbcr3s, 1958, Auo.J.Agris Res., 9, (483-491).
70. Harper J.U., 1960, Jells an4 FortiliLlers 23-3
71. J.G., 1959, Chol.Abntr., 95-4, (14393).
72. Vinal.urove, :.h., 1937, l'odolLV 4. 4p3-504, (Coon—wealth Bureaus of. soils, 1960, (9)).
73. Kabup.thsy, A., 1939, Ann.Aeron., 9, (06-92). 74. Delolon, A.. and Pastiose, L.14.1 1942, Am.
?ranee..(ol. 73uroau of soils, 1960, Sept. (9)).
75. adanov, Ii., Pedology, ?17-525 it.e. (0omn., Bureau.of Soils, 1960, Sept. 9).

160.
76, Hesse ,•t., 1957, Plante and Soil, 9, (86-96).
77. lAarkey, 1950, Soil Sol., 70# (55-64).
78. Freney, J.R., 1958, Nature, London, 182, (1318-1319).
79. Froney, J.R., 1960, Aus.J.Biol.Sci., 13, (387.392). (o119 and .1ortilizers, 1961, 24-1, (17)).
80. Preney, N.R. and Sponcer, K., 1960, Aust.J.Agr.Res., 2, (339-345).
81. Barrow, N.J., 1960, Auo.J.Agr.Res., 2, (531.338).
82. Polipets, V.A.., 1961, Coilz and Fertiliers, 24-2, (138).
.83 Grinekenks, A.4. and Pell Vertiliers, 24-2, (138
84. Bro-ltiold, 1954, 'Jails and Fertilizers
85. Walkley, A . and Black, 1.4., 1934, soil Oei., 37, (29).
36. Chemin, L. Yien C. 1950, oil ci.Soo.Amer.Proe.# 15, (149-151).
87. Jarrett, 11.0" 1959, Sei.J.Iloy.0011,Sei., 27, (41-45)*
88. ardsley, C.s. au a Lancaster„,J.D.4 1960, ot1 ci.800. Arleree., 24, (265-268).
89. Batters, B. and Chencry, 1959, Analyst, 84, (239...245)0,
90. 3teinbergs0 A., 1953, Analyst, 78, (47).
91. Steinborgs, A., 1955, Analyst, 80, (457-461),
92. Cornfield A.H., 1961, Plant ana Soil, 14, (90-93).
93. Bremner, J.M. and Shaw, K., 1955, J.A r 45, (320-328). 94. Laboratory lonnual for kgricultural
Imperial College, London. ntry. (87),
1961 Soils and

107.
108.
161.
1955, Soils and Fertilizers, 18,
Thnpat B.X. and Adals, A.P.R., 1959, 87, (135-140).
95. Walker, T.V.1 (185.187).
96. Walirer T Soil 001.1
97. Sauchelli, V.t 1950, Soil Sol., 70, (1-3).
98. Williwas# 00140 and Donald, ext., 1957, Aus.J.Agri• Res., Vol. 8, (179-189).
99. Williams, 0.1., Williams T.G. and -Scott, H.DI.,'1960, J.Soil Soi.t Vol. 11, (334-346).
100. Walltc,,rt T.W. and Adams, A.P.R., 1958, Boil Sci*# 05, (305-317).
101..Frederick L Soil Sct.Sc
102* Cornfield, A.
103.
104.
105.
106.
„Amer.Proc., 21, (285-291). Starkey, R.L. and Segall 1957,
., 1952, J.Sci.Food Agri., 3, (341-349)•
Jensen, ILL., 1931, J.Agr Sot., 21, (81).
86,'(241-4) Preney, J. ,. 1958, Soil',
lmittonhorg, J. et ilia, 1951, Plant and Soil 3: ( 5
Preney, 1961, AusamAgri Res..' Vol. 12, (424. 32).
Putnm R.D. and Sohnidtt 1954, Soil Sci. 87, (22),
Stevenson, F.J.t 1956, Proo.SoilSei.Soc.A7aer. (201).
ci., 80, (181) Sowden, Pa., 1955, Soil
ci., 82, (491). Soviden, P,J.t 1956, Soil
Bremner, 1950, Bloche,n. J. 47, (538).
Woolley, D. 1. and Peterson' T7.71., 1937, ti*Diol•Ohen•• 122, (213)*
113. Stevens, 0.i. end Vohra, P., 1955, J.Alor.Chwn.300.1 77, (4935).
) •

Grenrrood, D.J. 7, (255-60.
Annds2:-?1-0. • and Allard, 7, (G1824),
Lose, R., (1956), ,P1ant ant'. Soil,
ket.10, 1955, J.3si. Pood
162.-
114. Darrow, N.J., 1960, AuS.J.Agri.Res., Vol. 20 (317-330).
115. Spencer, K,, and PrenT,, LF., 1960, Aus.J.Agri.' Les., (940-59),
110, Drobnick,' J., 1960,
117, Barrow, N.J., 1960, A177o.J.Agri.Res., Vol. 11, (900. 969)
Plant and Zoil, Vol. 12, (199-219).
and 3oellner, 1954, ThoToon, b.l.„ Black, G.h. Sol" 77, (135-96
cornap1d, &.1., 1953, J.Jci.V,4c., Vol.
122. iIc11, Di, 1947, èrtilirs and aanuren, lurray.
4, (296-301).
(17), JfAxa
123. Swanson, 0.0. and Latdhaw, 1922, Soil c;ei., 14,
124. Cornfield, , 1959, J.Agri,Sei.„ Vol. 53, (327-329).
125. Hewitt, n.J., 1955, 2nd 'Ildition, Yir,?dley Roadin,
and 3en Ltd,
126. Harward, c'hao Toil' Tien, and Fang ,. 1962, J.Agron., Vol. 54, (101-106).
127, Steward, 1960, Plont Physiology, Vol. 1B, (289), kcadeuio Press, New York and 'London.
128. Young, J.L. and artenden, J.L., 0.958), Commonwealth Bureau of Soils 1960,7*,ent. (4). (Ohio, Azri. xper.;.;a. Res. Cir., 61,'(18)).'
129. Biswao, 'E.D. and Das, 1;0130 p 1957, J. Indian Soc. Soil Sol." 5, (31-37).

163.
130. 2.J., 1956, toil 04., 82, (491-496).
131. 'lasso, P.R., 1956, Co7monwOrtlth Bureau of Sono, wept. (6), ' Afri.kg4. for muss. Org. Rap., 22-2(3).'
13.'Barrov N.J.,.1958,Nature, 181, (1806.7).