thesis draft
DESCRIPTION
thesisTRANSCRIPT

EFFECT OF SEAWATER ON GEOENVIRONMENTAL
PROPERTIES OF SOILS
A thesis (Phase I) submitted in partial fulfillment of the requirements for
the award of the degree of
M.Tech
in
Environmental Engineering
By
BANTUPALLI SAI VENKATESH
DEPARTMENT OF CIVIL ENGINEERING
NATIONAL INSTITUTE OF TECHNOLOGY
TIRUCHIRAPPALLI – 620 015
DECEMBER 2015

BONAFIDE CERTIFICATE
This is to certify that the project (Phase I) titled EFFECT OF SEAWATER ON
GEOENVIRONMENTAL PROPERTIES OF SOILS is a bonafide record of the work
done by
BANTUPALLI SAI VENKATESH (203414005)
in partial fulfillment of the requirements for the award of the degree of Master of
Technology in Environmental Engineering of the NATIONAL INSTITUTE OF
TECHNOLOGY, TIRUCHIRAPPALLI during the year 2015-2016.
DR. K. MUTHUKKUMARAN Prof. R. JAYASANKAR
Guide Head of the Department
Project Viva-voce held on _____________________________
Internal Examiner External Examiner

i
ABSTRACT
Seawater collected from Bay of Bengal has been used to mix three soil types and its
consistency limits, compaction characteristics and undrained Shear Strength are compared
with the properties of the three soil types mixed with tap water. Results of laboratory
investigation are presented to show that plasticity index decreased from 13 using tap water
to 5 using seawater for the Low compressible clay, from 10 using tap water to 4 using
seawater for the Clayey sand and from 6 using tap to 1 using seawater for the High
compressible clay. The maximum dry unit weight were in the order of 1.96, 1.94, 1.68 g/cc
for the Low compressible clay, Clayey sand and High compressible clay respectively when
mixed with tap water. Using Seawater, the maximum dry unit weight for the clay decreased
from 1.96 g/cc to 1.94 g/cc, but that of clayey sand and High compressible clay increased
from 1.94 g/cc to 2.16 g/cc and from 1.68 g/cc to 1.7 g/cc respectively. In the case of CH
soil, the undrained shear strength increased from 94.45 to 116.94 KPa with the addition of
Seawater. The undrained shear strength of CL, SC soils decreased from 25.13 to 15.7 KPa,
28.75 to 13.92 KPa respectively with the addition of Seawater.
Keywords: Consistency; Compaction; Plasticity Index; Undrained; Shear.

iii
ACKNOWLEDGEMENT
At the very outset, I would like to express my sincere gratitude to my guide
Dr. K. Muthukkumaran, Assistant professor, Department of Civil Engineering for
giving me this opportunity to work under her esteemed guidance. I am greatly indebted to
her for her invaluable advice and support.
I am grateful to Dr. S. T. Ramesh, Associate professor, Department of Civil Engineering
for his valuable support and guidance in making this project a successful one.
I feel it is a great privilege in expressing my thanks to Dr. R. Gandhimathi, Assistant
professor, Department of Civil Engineering for her full-fledged guidance and motivation.
I am extremely grateful to Dr. S. Sundarrajan, Director, National Institute of
Technology, Tiruchirapalli, for having provided me with sufficient facilities to carry out
this work.
I sincerely express my gratitude to my Head of the Department, Dr. R. Jayasankar,
Department of Civil Engineering for providing me the necessary opportunities for the
completion of my project and all others for their guidance and help. I appreciate the
efforts put in by my friends during various stages of my project work. I would also like to
thank the staff members of my department for their invaluable help and guidance.
I would be eternally thankful to my parents for their everlasting care, support and
encouragement.
BANTUPALLI SAI VENKATESH

iii
TABLE OF CONTENTS
Title Page No.
ABSTRACT ................................................................................................................... i
ACKNOWLEDGEMENTS ......................................................................................... ii
TABLE OF CONTENTS ............................................................................................. iii
LIST OF FIGURES ...................................................................................................... iv
LIST OF TABLES v
ABBREVIATIONS ....................................................................................................... v
CHAPTER 1 INTRODUCTION
1.1 General .................................................................................................................. 1
1.2 Causes of seawater intrusion ................................................................................. 1
1.3 Effect of seawater on clay minerals ...................................................................... 2
1.4 Measures to control saltwater intrusion ................................................................ 5
1.5 Motivation of study 6
1.6 Objectives of the Study ......................................................................................... 6
1.7 Organization of the Thesis .................................................................................... 6
1.8 Summary ............................................................................................................... 8
CHAPTER 2 LITERATURE REVIEW
2.1 General .................................................................................................................. 8
2.2 Characterization of four clay minerals .................................................................. 8
2.3 Effect of seawater on atterberg limits ................................................................... 9
2.4 Effect of seawater on swelling characteristics ...................................................... 11
2.5 Effect of seawater compaction characteristics ...................................................... 11
2.7 Summary ............................................................................................................... 20
CHAPTER 3 MATERIALS AND METHODOLOGY
3.1 General .................................................................................................................. 13
3.2 Methodology ......................................................................................................... 13
3.3 Classification of soils ........................................................................................... 14
iv
3.4 Determination of consistency limits ..................................................................... 14
3.4.1 Liquid limit test ..................................................................................................... 14
3.4.2 Plastic limit test ..................................................................................................... 15
3.5 Proctor test ............................................................................................................ 16
3.6 Unconfined compression test ................................................................................ 17
3.7 Summary ............................................................................................................... 18
CHAPTER 4 RESULTS AND DISCUSSIONS
4.1 General .................................................................................................................. 19
4.2 Quality parameters of tap water and seawater ...................................................... 19
4.3 Effect of seawater on the consistency limits ......................................................... 20
4.4 Effect of seawater on the compaction characteristics ........................................... 21
4.5 Effect of seawater on the unconfined shear strength ........................................... 23
4.6 Summary ............................................................................................................... 25
CHAPTER 5 SUMMARY AND CONCLUSIONS
5.1 Summary ............................................................................................................... 26
5.2 Conclusions ........................................................................................................... 26
5.3 Scope of future work ............................................................................................. 27
REFERENCES 28
LIST OF FIGURES
Figure
No. Title Page No.
1.1 Organization of the thesis ................................................................................ 7
3.1 Methodology for Present Study ....................................................................... 13
4.1 Compaction curves for Low Compressible clay using Tap water and
Seawater ........................................................................................................... 21
4.2 Compaction curves for Clayey Sand using Tap water and Seawater .............. 21

v
4.3 Compaction curves for High Compressible clay using Tap water and
Seawater ........................................................................................................... 22
4.4 Stress Strain relation for High Compressible clay using Tap water
and Seawater .................................................................................................... 23
4.5 Stress Strain relation for Low Compressible clay using Tap water
and Seawater .................................................................................................... 23
4.6 Stress Strain relation for Clayey sand using Tap water and Seawater ............. 24
4.7 Variation of Undrained shear strength for different soils with
addition of tap water and seawater ................................................................... 24
LIST OF TABLES
Table No.
. Title Page No.
2.1 Characterization of four Clay Minerals ........................................................... 8
2.2 Atterberg Limit of Clay Minerals .................................................................... 10
3.1 Classification of soils ...................................................................................... 14
4.1 Quality parameters of Tap water and Seawater 19
4.2 Variation of Liquid limit, Plastic Limit on different soils with the
addition of Tap water and Seawater 20
LIST OF ABBREVIATIONS
CL : Low compressible clay
CH : High compressible clay
SC : Clayey sand
Kpa : Kilo pascal
g/cc : gram per cubic centimetre

1
CHAPTER 1
INTRODUCTION
1.1 GENERAL
Seawater intrusion occurs when seawater is drawn into freshwater aquifers. This natural
process is intensified by sea level rise and over pumping of aquifers. Because of the
growing threat of seawater intrusion, there needs to be a closer study to address its
effects on the environment and the stability of soils. The increased occurrence of
seawater intrusion changes the soil chemistry in the environment and may affect the
interaction among soil particles, which could effect important engineering properties
such as soil strength. Because pumping from aquifers creates a cone of depression of
the water table, a cone of ascension of the freshwater-seawater interface is created as
described by the Ghyben-Herzberg ratio, which implies that for every meter drop of the
fresh water table compared to sea level, there is 40 meters of seawater that is drawn into
that column of water, so it could become a significant problem if the percolating water
affects strength. Past studies have shown that percolating water with ionic strength
increases hydraulic conductivity of clayey soils in the laboratory, which could be
explained by the electrical double-layer thickness theory.
1.2 CAUSES OF SEAWATER INTRUSION
When an aquifer is in hydraulic connection with saline / marine water, portions of the
aquifer may contain saltwater while other portions contain fresh water. Freshwater is
slightly less dense (lighter) than saltwater, and as a result tends to float on top of the
seawater when both fluids are present in an aquifer. There is a relationship based on the
density difference between saltwater and freshwater that can be used to estimate the
depth to saltwater based on the thickness of the freshwater zone above sea level. The
relationship is known as the Ghyben-Herzberg relation. The boundary between the
freshwater and the saltwater zones is not sharp but instead is a gradual change over a
finite distance, and is known as the zone of diffusion or the zone of mixing. In
peninsular region of county, all of our groundwater originates as recharge from
precipitation.
This recharge creates a pressure distribution within our aquifers that tends to be highest
in the centre of the islands, lowering as you approach the shorelines. The pressure

2
distribution leads to a flow in the aquifers that is vertically downward near the centre
of the islands, then flowing radially outward toward the shore .Two mixing processes
(diffusion and dispersion) continuously move saltwater into the freshwater zone. Flow
in the freshwater zone sweeps this mixed brackish water toward the shoreline where it
discharges at submarine seeps. The processes of recharge, flow, mixing, and discharge
all work together to hold the interface position in a roughly stationary position. A
change to one or more of these processes can result in a change in the position of the
interface, an inland movement of the interface boundary known as lateral intrusion.
When a well is pumped, water levels in the vicinity of the well are lowered, creating a
drawdown cone.
If a saltwater zone exists in the aquifer beneath the well, the saltwater will rise up
toward the well screen. This rising up of saltwater is known as upconing and is the
second type of seawater intrusion. In reality the groundwater system in peninsular
county is made up of multiple layers of unconsolidated sand and gravel capable of
supplying water to wells (Aquifers). These aquifers are interbedded with lower
permeability layers of silt and clay (Aquitards) that pass water more slowly. Aquifers
and Aquitards in peninsular country vary spatially in both thickness and elevation. In
any given area of the county, there may be several aquifers present, and each aquifer
will have different hydraulic characteristics (recharge, pressure, capacity etc.) and
susceptibility to seawater intrusion. Even within a single aquifer, the hydraulic
characteristics can vary significantly from one location to another.
1.3 EFFECT OF SEAWATER ON CLAY MINERALS
Studies of the distribution of clay minerals in near-shore marine environments (Grim,
Dietz and Bradley, I949 ; Grim and Johns, I954 ; Powers, 1954, 1957) suggest that
diagnosis of such minerals may occur when they are transferred from fresh-water to
sea-water by river action. The mechanism of any changes that take place is not known,
but a first stage must involve reactions of the cations and anions in sea-water with the
minerals through exchange. Theoretical consideration of cation exchange indicates that
a rearrangement of the cations in the exchange positions will take place. Kelley and
Liebig (1934) showed experimentally that a bentonite preferentially adsorbed more
magnesium than sodium from sea-water, Hendricks and Ross (1941) suggested that
adsorption of magnesium ions was important in the genesis of glauconite in marine
sediments. The relations between the cations in seawater and those in the exchange

3
positions probably can be explained by the law of mass action. The process is complex
because of the different bonding energies of Ca2+, Mg2+, K + and Na+ ions ; the effect
of the cations originally in the exchange positions on the clay minerals ; the variation
in charge of the exchange positions ; the ionic activity of the sea-water ; and the buffer
mechanism of seawater.
In view of the importance of the marine environment and of the changes that may take
place in clay minerals after deposition in the sea, a number of observations was made
of the reactions of montmorillonite (Osage, Wyo., A.P.I. standard no. 25b), mixed-layer
mineral (Highbridge, Ky., A.P.I. standard no. 42), " illite " (Fithian, Ill., A.P.I. standard
no. 35), kaolinite (Bath, S.C., A.P.I. standard no. 5), and halloysite (Tintie, Utah, A.P.I.
standard no. 13) when 2% suspensions were allowed to remain in contact with seawater
for varying periods of time.
The relations of clay minerals and various electrolytes together with a knowledge of
the crystal structures and chemical composition of these minerals indicate that the
reactions to be expected between them and seawater will be complex and will be
different for the structurally different clay minerals. Isomorphous replacement of
cations within the clay mineral structures and broken bonds at the edges of the crystals
cause the development of negative charges in excess of the positive charges on the
particles. The different clay minerals vary in the amount of negative charge developed
and hence in their ability to adsorb and exchange cations with those present in a contact
solution. In general, the amount of reaction follows the order of total exchange capacity
of the minerals, which is : kaolinite < halloysite < illite < mixed-layer mineral <
montmorillonite.
The quantity of cations in the exchange positions, and their kind, whether mono or
divalent, influences the reactions with solutions. Soil chemists refer to the condition in
which all the exchange positions are filled with metal cations as " base saturation", a
useful concept when considering exchange reactions. " Base unsaturation " means that
H+ ions take the place of the common metal cations in the exchange positions, and the
" percentage base saturation " indicates the proportion of the exchange positions filled
with metal cations other than H+. The presence of H+ ions in the exchange positions is
complicated by the release of aluminum from the octahedral layer as described by Paver
and Marshall (1934). Recent work by Low (1955), Aldrich and Buchanan (1958), and
Higdon and Marshall (1958) has shown that the aluminum released retards formation
4
of H-clays. The laws governing replacement of cations on a charged clay mineral
Marshall (1954) after extensive experiments to determine the bonding energy of the
common metal cations. In general, this bonding energy is in the order: Ca > Mg > K >
H > Na. However, in certain clay minerals, kaolinite and some Wyoming bentonite, for
example, the bonding energy is Mg > Ca. Divalent ions with strong bonding energy in
contact solutions are able to occupy the exchange positions preferentially to monovalent
ions.
Titration of water suspensions of clay minerals in the H-form with alkaline solutions
gives neutralization curves that indicate that there are several definite exchange sites on
montmorillonite with different capacities for attracting cations. Inflection points occur
on these curves where adsorption of cations takes place. The relation between the
cations in the contact solution and the adsorption of cations by neutralization of
exchange sites on the clay minerals can be explained by the law of mass action
(Schofield and Taylor, 1955; Garrels and Christ, 1956). It has long been known
(Jarusov, 1937) that in systems containing more than one cation, the cation having the
highest mean free bonding energy takes the positions on the clay mineral surface having
the highest bonding energy.
The positions with less bonding energy are therefore left to be filled with cations of
lower bonding energy. Thus Ca2+ and Mg2+ in a mixed electrolyte are bonded rapidly
to the sites of strongest negative charge, leaving monovalent cations, such as: Na+, to
fill sites of weaker negative charges. Another point to be considered about the reaction
of clay minerals with sea-water is that small amounts of SiO2, A12O3, and Fe2O3 are
dissolved from them by sea-water, but it is not known if this solubility is due to a surface
effect as indicated by Nash and Marshall (1956), to the solubility of SiO2 and Al2O3
(the latter is slightly soluble at pH 8.0) at the pH of sea-water (Correns, 1949 ;
Krauskopf, 1956), or to the release of A12O3 from H-clays by a saline solution
(Mukherjee, Chatterjee and Ray, 1948).
Probably the C1- ions in seawater form a complex with the A13+ ions released from the
clay minerals. Seawater is an aqueous solution containing a variety of dissolved solids
and gases. It is a strong electrolyte with pH ranging from 7.5 to 8.4 depending on the
amount of CO2 present. Seawater is a buffer solution because of the presence of
carbonate and borate species. The cation principally affected by buffering action is

5
calcium because of the relation CaCO3 ⇌ CaHCO3 ⇌ H2CO3. This series of reactions
affects the availability of Ca2+ ions to enter into the exchange positions of clay minerals.
Sea-water contains cations in excess of the equivalent anions derived from strong acids
(Harvey, 1957, p. 153). This excess base or titration alkalinity is equivalent, to that of
the bicarbonate, carbonate and borate ions in the water.
1.4 MEASURES TO CONTROL SALTWATER INTRUSION
A number of different measures have been used to control seawater intrusion and to
protect the groundwater resources. The main principle of protection is to increase the
volume of fresh groundwater and reduce the volume of saltwater. Todd (1974)
discussed various means of preventing saltwater from contaminating groundwater
sources including:
1. Reduction of the abstraction rates
2. Relocation of abstraction wells
3. Subsurface barriers
4. Natural recharge
5. Artificial recharge
6. Abstraction of saline water
7. Combination of injection and abstraction systems
Extensive research has been carried out to investigate saltwater intrusion in coastal
aquifers. However, only few models have been developed to study the control of
saltwater intrusion. These models use one or more of the previous measures to study
the control of saltwater intrusion. The reduction of abstraction rates aims to reduce the
pumping rates and use other water resources (Scholze et al. 2002). The relocation of
abstraction well aims to move the wells further inland (Sherif and Al-Rashed 2001).
Subsurface barriers aim to prevent the inflow of seawater into the basin (Harne et al.
2006). Natural recharge aims to recharge aquifers with additional surface water (Ru et
al. 2001). Artificial recharge aims to increase the groundwater levels, using surface
spread for unconfined aquifers and recharge wells for confined aquifers. The sources
of water for injection may be surface water, groundwater, treated wastewater or
desalinated water (Papadopoulou et al. 2005). The abstraction of saline water aims to
reduce the volume of saltwater by extracting brackish water from the aquifer (Sherif
and Hamza 2001). The combination of injection of freshwater and extraction of saline

6
water can reduce the volume of saltwater and increase the volume of freshwater
(Rastogi et al. 2004).
1.5 MOTIVATION FOR THE STUDY
Problems like extensive ground settlement occurs due to upon salinity intrusion from
pumping of groundwater. Similarly, the groundwater level is drops continuously in
various parts of the coastal, due to excessive withdrawal for industrial and agricultural
purposes, causing intrusion of seawater toward land. Moreover, ground settlement
related problems and other problems should also be expected from sea level rise
because of global warming. Due to seawater intrusion there is a change in in-situ soil
properties and in laboratory for evaluating geoenvironmental properties ground water
or distilled water. But in-situ will be in interaction with different qualities of water.
1.6 OBJECTIVES OF THE STUDY
The objective of the present investigation is as follows:
1. To determine the characteristics of Seawater and Tap water.
2. To evaluate the geoenvironmental properties of soils with addition of Tap
water.
3. To study the impact of seawater intrusion on the geoenvironmental properties
of soils.
4. To compare the test results obtained with addition of Tap water and Seawater
to the soils.
1.7 ORGANIZATION OF THESIS
The thesis is organized in five chapters. Chapter 1 includes the introduction in which
the motivation and objectives for the present study is also discussed. Chapter 2 deals
with the review of literature. Chapter 3 gives with an overview of the methodology
adopted and the materials required for the study. The results and discussions are
compiled in chapter 4. Chapter 5 deals with the summary and conclusion of the study.
The organization of the thesis is shown in Fig 1.1

7
Fig 1.1 Organization of thesis
1. 8 SUMMARY
This chapter enumerates the effect of seawater on clay minerals, Causes of Seawater
intrusion and measures to control seawater intrusion .The motivation of the study and
objectives of the present study were also discussed.
Chapter 5
Summary and Conclusions, Scope of future work
Chapter 4
Results and discussion
Chapter 3
Materials and Methods
Chapter 2
Review of literature
Chapter 1
Introduction, Motivation, Objectives of the study

8
CHAPTER 2
LIERATURE REVIEW
2.1 GENERAL
(Mitchell,1976) characterized the different minerals present in the clay soil and the
bonding in the minerals and ability their participate in the cation exchange
reactions.(Lambe and Whitman, 1979) gave the variation of Atterberg limits based on
the minerals present in the soil and the ions exchanged during the interaction. Effect of
different salts and salt solutions on the geoenvironmental properties of soils given by
different authors has been discussed here.
2.2 CHARACTERIZATION OF FOUR CLAY MINERALS
Clay
Mineral
Chemical
designation
Bonds
between
layers
Ion exchange
Capacity of
Cation
Exchange
(meq /100g)
Illite
(K,H2O)2Si
(Al,Mg,Fe)4,6-
O20(OH)4
K-ions, strong
Some Si always
exchanged with
Al, K provides
balance between
the layers
0-40
Kaolinite
Al4Si4O10(OH)8
(SiAl)8(MgFe)6
O20(OH)4
O-OH, strong Al against silica
in 2:1 layer 3-15
Chlorite O20(OH)4 (2:1
layer)
(MgAl)6
(OH)12
Al against Mg in
Intermediate
layer
10-40
Montomor
illonite
Si8(Al3.34Mg0.66)
O20(OH)4
O-O, very
weak,
swellable
Mg exchanged
with Al 80-150
Table 2.1 Characterization of four Clay Minerals (after Mitchell, 1976)

9
2.3 EFFECT OF SEAWATER ON ATTERBERG LIMITS
The liquid limit and plastic limits of a type of soil can be correlated with various
engineering properties, such as permeability, shrinking and swelling behaviour, shear
strength, and compressibility of the soil. In addition the evolution of consistency limits
provides some very basic mechanical data about the soil and also gives a first insight
into the chemical reactivity of clays (Arasan and Yetimoglu, 2008; Shariatmadari et al
, 2011). Alamdar, 1991; Mahasneh, 2004; Mansour et al , 2008; Yukselen-Aksoy et al.,
2008; Arasan and Yetimoglu, 2008; have studied the effect of salt solutions on the
consistency limits of soil. The results have shown the liquid limit and plastic limit of
soil decrease as the salinity of pore fluid increases. Sivapullaiah and Manju, 2005, have
investigated the effect of NaOH solution on some geotechnical properties of the soil
with low plasticity (LL=38%). Their results have shown that the liquid limit of the soil
increases as NaOH solution concentration increases. The reason behind that is the
formation of a new swelling compound created by reaction of alkali solution with clay.
The effect of four salt solutions including NH4Cl, KCl, CuSO4 and FeSO4 on
consistency limits of CL clay and CH clay have been investigated by (Arasan and
Yetimoglu, 2008). Their experimental results indicate the liquid limit of CL clay
increases as the slat concentration increases whereas the liquid limit of CH clay
decreases as the slat concentration increases
(Kaya, 2008), Has studied the Seawater effect on consistency limits and compressibility
characteristics of clays. The results from his study indicate that the effect of seawater
is negligible on the tested consistency limits and compressibility characteristics of soils
when they have liquid limits up to 110%. The seawater effect is most noticed on the
consistency limits and compressibility of Na-bentonites. They also compared the results
with previous research. All reported data were normalized by dividing the index values
obtained using seawater by those obtained using distilled water. The comparison of data
indicate that the compiled data and present study data are in good agreement, i.e. when
the normalized values are plotted as function of liquid limit, all index properties plot
along the unity line until the liquid limit of soils is about 110%; then, the normalized
index values decrease almost linearly with liquid limit.
(Chittaranjan, 2011), Has studied effect of sea water on some geotechnical properties
of clayey soil. In this study soil which falls under CH group as per I.S classification is
used and geotechnical properties were discussed. The variation of liquid limit, plastic

10
limit and plasticity index with tap water and seawater, it is observed that the liquid limit,
plastic limit and plasticity index values of the contaminated soil increases when the
result of tap water is compared with the result of sea water. Liquid limit increased by
9.32% Plastic limit increased by 8% Plasticity index increased by 10.91.
(Ivasuc, 2012) Has studied the seawater influence on the behaviour of the expansive
clays. In his study four clayey soil samples were gathered with different mineralogy
and plasticity characteristics and tested to determine liquid limit in the presence of
distilled water, tap water and seawater. The results showed that The liquid limit
decrease in presence of seawater; values of all liquid limits in seawater are lower than
those in tap water. This difference can be seen more clearly for the bentonite sample.
Mineral Exchangable
Ion
Liquid
Limit
(%)
Plastic
Limit
(%)
Plasticity
Index
(%)
Shrinkage
Limit (%)
Montomoriilonite Na
K
Ca
Mg
Fe
Fea
710
660
510
410
290
140
54
98
81
60
75
73
656
562
429
350
215
67
9.9
9.3
10.5
14.7
10.3
-
Illite Na
K
Ca
Mg
Fe
Fea
120
120
100
95
110
79
53
60
45
46
49
46
67
60
55
49
61
33
15.4
17.5
16.8
14.7
15.3
-
Kaolinite Na
K
Ca
Mg
Fe
Fea
53
49
38
54
59
56
32
29
27
31
37
35
21
20
11
23
22
21
26.8
-
24.5
28.7
29.2
-

11
Table 2.2 Atterberg Limit of Clay Minerals (Lambe and Whitman, 1979)
( a Represents after five cycles of wetting and drying )
2.4 EFFECT OF SEAWATER ON SWELLING CHARACTERISTICS
(Chittaranjan, 2011), Has studied effect of sea water on some geotechnical properties
of clayey soil. In his study soil which falls under CH group as per I.S classification is
used and geotechnical properties were discussed the free swell index with tap water and
sea water It is observed that the free swell index increased 6.67% in seawater.
(Ivasuc, 2012), Has studied the seawater influence on the behavior of the expansive
clays. In his study the rate of change in swelling behavior of clayey soils when exposed
to seawater with respect to distilled water. The four clayey soil samples were gathered
with different mineralogy and plasticity characteristics and tested to swelling
characteristics in the presence of distilled water, tap water and seawater. The results
The differential free swell percent is lower than that in tap water and distilled water for
swelling soils (LL > 150...200 %), indicating reduction in swelling potential in
seawater, The difference in free swell percent between distilled water and seawater is
remarkable, between 0% to 200%; zero is for non-swelling soils and 200% is for
bentonite Clay .
2.5 EFFECT OF SEAWATER COMPACTION CHARACTERISTICS
Compaction tests were performed on dam construction materials. Soil compaction
improves strength characteristics of soil and consequently increases bearing capacity of
foundations constructed on it. Emami, 2008; Mansour et al., 2008 and Alainachi and
Alobaidy, 2010, have evaluated the effect of salinity on the compaction test results.
Their results showed that optimum moisture content decreases and maximum dry unit
weight of soil increases as the salinity of water increases.
(Chittaranjan, 2011), Has studied effect of sea water on some geotechnical properties
of clayey soil. In his study, soil falls under CH group as per I.S classification is used
Mineral Exchangable
Ion
Liquid
Limit
(%)
Plastic
Limit
(%)
Plasticity
Index
(%)
Shrinkage
Limit (%)
Attapulgite H 270 150 120 7.6

12
and geotechnical properties were discussed compaction characteristic like OMC, Dry
density and UCC, OMC increased by 30 % Dry density increased by 7.58%, UCC by
20% with seawater compared with tap water.
The effects of salt solution on shear strength of soil have been investigated by
Chattopadhyay, 1972; Di Maio and Fenelli, 1994; Alamdar, 1999; Tiwari et al., 2005;
Ayininuola et al., 2009; Naeini and Jahanfar, 2011 and Siddiqua et al., 2011. In their
studies, shear strength of soil has increased as concentration of water increased.
2.6 SUMMARY
The presence of different minerals present in the soils have significant effect on the
geoenvironmental properties and the bonding between the soil layers and the ions
responsible exchange reactions .Salts will show variation in the Atterberg limits,
maximum dry density and shear strength of soils

13
CHAPTER 3
MATERIALS AND METHODOLOGY
3.1 GENERAL
In the previous chapter, based on the previous reports the effect of seawater on different
soils and the changes in the geoenvironmental properties have been discussed. In this
study Low Compressible Clay, Clayey sand, High Compressible Clay soils have been
used for evaluating the impact of Seawater intrusion on geoenvironmental properties.
3.2 METHODOLOGY
The flowchart for methodology adopted in the current study is summarised in Fig 3.1
Fig.3.1. Flowchart for Methodology
Effect on Undrained shear strength of soils with the addition of Tap water and Seawater
Effect on Compaction chracteristics of soils with the addition of Tap water and Seawater
Effect on consistency limits of soils with the addition of Tap water and Seawater
Seawater and Tapwater characteristics
Soil Characterization by sieve analysis and Consistency limits
Collection of different soil samples

14
3.4 CLASSIFICATION OF SOILS
Type of soil Classification criteria
Low Compressible Clay Liquid Limit less than 35%
Above A line and Hatched zone on the
plasticity chart
Clayey sand More than 12% finer than 75µ size
Atterberg limits above A line with Ip
greater than 7
High Compressible Clay Liquid Limit greater than 50%
Above A line anon the plasticity chart
Table 3.1 Classification of soils
3.4 DETERMINATION OF CONSISTENCY LIMITS
3.4.1 LIQUID LIMIT TEST
Liquid limit is significant to know the stress history and general properties of the soil
met with construction. From the results of liquid limit the compression index may be
estimated. The compression index value will help us in settlement analysis. If the
natural moisture content of soil is closer to liquid limit, the soil can be considered as
soft if the moisture content is lesser than liquids limit, the soil can be considered as soft
if the moisture content is lesser than liquid limit. The soil is brittle and stiffer.
The liquid limit is the moisture content at which the groove, formed by a standard tool
into the sample of soil taken in the standard cup, closes for 10 mm on being given 25
blows in a standard manner. At this limit the soil possess low shear strength.
APPARATUS REQUIRED
Balance
Liquid limit device (Casagrande)
Grooving tool
Mixing dishes
Spatula

15
Electrical Oven
About 120 gm of air-dried soil from thoroughly mixed portion of material passing 425
micron I.S sieve is to be obtained. Distilled water is mixed to the soil thus obtained in
a mixing disc to form uniform paste. The paste shall have a consistency that would
require 30 to 35 drops of cup to cause closer of standard groove for sufficient length.
A portion of the paste is placed in the cup of liquid limit device and spread into portion
with few strokes of spatula. Trim it to a depth of 1cm at the point of maximum thickness
and return excess of soil to the dish. The soil in the cup shall be divided by the firm
strokes of the grooving tool along the diameter through the centre line of the follower
so that clean sharp groove of proper dimension is formed. Lift and drop the cup by
turning crank at the rate of two revolutions per second until the two halves of soil cake
come in contact with each other for a length of about 1 cm by flow only. The number
of blows required to cause the groove close for about 1 cm shall be recorded. A
representative portion of soil is taken from the cup for water content determination.
Repeat the test with different moisture contents at least three more times for blows
between 10 and 40.
Draw a graph showing the relationship between water content (on y-axis) and number
of blows (on x-axis) on semi-log graph. The curve obtained is called flow curve. The
moisture content corresponding to 25 drops (blows) as read from the represents liquid
limit. It is usually expressed to the nearest whole number.
3.4.2 PLASTIC LIMIT TEST
Helps in selection of soils used for making bricks, tiles, soil cement blocks in addition
to its use as foundation for structures.
APPARATUS REQUIRED
Porcelain dish.
Glass plate for rolling the specimen.
Air tight containers to determine the moisture content.
Balance of capacity 200gm and sensitive to 0.01gm
Oven thermostatically controlled with interior of non-corroding material to
maintain the temperature around 1050 and 1100C.
16
Take about 20gm of thoroughly mixed portion of the material passing through 425
micron I.S. sieve obtained in accordance with I.S. 2720 (part 1). Mix it thoroughly
with distilled water in the evaporating dish till the soil mass becomes plastic enough
to be easily moulded with fingers. Allow it to season for sufficient time (for 24 hrs)
to allow water to permeate throughout the soil mass Take about 10gms of this plastic
soil mass and roll it between fingers and glass plate with just sufficient pressure to roll
the mass into a threaded of uniform diameter throughout its length. The rate of rolling
shall be between 60 and 90 strokes per minute. Continue rolling till you get a threaded
of 3 mm diameter. Kneed the soil together to a uniform mass and re-roll. Continue
the process until the thread crumbles when the diameter is 3 mm. Collect the pieces of
the crumbled thread in air tight container for moisture content determination. Repeat
the test to atleast 3 times and take the average of the results calculated to the nearest
whole number.
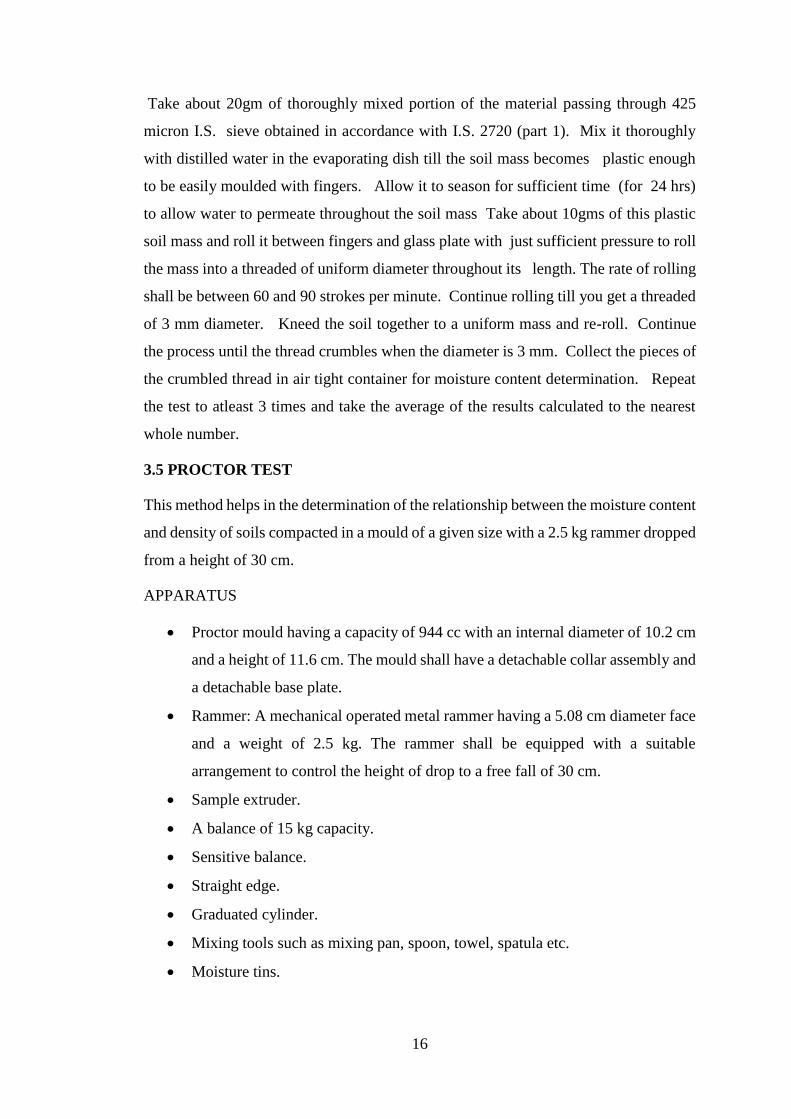
3.5 PROCTOR TEST
This method helps in the determination of the relationship between the moisture content
and density of soils compacted in a mould of a given size with a 2.5 kg rammer dropped
from a height of 30 cm.
APPARATUS
Proctor mould having a capacity of 944 cc with an internal diameter of 10.2 cm
and a height of 11.6 cm. The mould shall have a detachable collar assembly and
a detachable base plate.
Rammer: A mechanical operated metal rammer having a 5.08 cm diameter face
and a weight of 2.5 kg. The rammer shall be equipped with a suitable
arrangement to control the height of drop to a free fall of 30 cm.
Sample extruder.
A balance of 15 kg capacity.
Sensitive balance.
Straight edge.
Graduated cylinder.
Mixing tools such as mixing pan, spoon, towel, spatula etc.
Moisture tins.

17
Take a representative oven-dried sample, approximately 2.5 kg in the given pan.
Thoroughly mix the sample with sufficient water to dampen it to approximately 4%
moisture content. Weigh the proctor mould without base plate and collar. Fix the collar
and base plate. Place the soil in the Proctor mould and compact it in 3 layers giving 25
blows per layer with the 2.5 kg rammer falling through. Remove the collar, trim the
compacted soil even with the top of the mould by means of the straight edge and weigh.
Divide the weight of the compacted specimen by 944 cc and record the result as the wet
weight γwet in grams per cubic centimetre of the compacted soil. Remove the sample
from the mould and slice vertically through and obtain a small sample for moisture
determination. Thoroughly break up the remainder of the material until it will pass a
no.4 sieve as judged by the eye. Add water in sufficient amounts to increase the
moisture content of the soil sample by one or two percentage points and repeat the
above procedure for each increment of water added. Continue this series of
determination until there is either a decrease or no change in the wet unit weight of the
compacted soil. The moisture content from soil sample kept in oven for 24hrs gives the
true moisture content. This moisture content helps in the dry unit weight γd of the soil.
Plot a graph between the moisture content and dry unit weight gives the Optimum
moisture content and Maximum dry density of soil.
3.6 UNCONFINED COMPRESSION TEST
Used to determine shear parameters of cohesive soil. It is not always possible to conduct
the bearing capacity test in the field. Sometimes it is cheaper to take the undisturbed
soil sample and test its strength in the laboratory. Also to choose the best material for
the embankment, one has to conduct strength tests on the samples selected. Under these
conditions it is easy to perform the unconfined compression test on undisturbed and
remoulded soil sample. Now we will investigate experimentally the strength of a given
soil sample.
Before starting of experiment diameter and length of the specimen were found out.
EQUIPMENT
Loading frame of capacity of 2 t, with constant rate of movement. What is the
least count of the dial gauge attached to the proving ring!
Proving ring of 0.01 kg sensitivity for soft soils; 0.05 kg for stiff soils.
Soil trimmer.

18
Frictionless end plates of 76 mm diameter (Perspex plate with silicon grease
coating).
Evaporating dish (Aluminium container).
Soil sample of 76 mm length.
Dial gauge (0.01 mm accuracy).
Balance of capacity 200 g and sensitivity to weigh 0.01 g.
Oven, thermostatically controlled with interior of non-corroding material to
maintain the temperature at the desired level. What is the range of the
temperature used for drying the soil
Sample extractor and split sampler.
Dial gauge (sensitivity 0.01mm).
Vernier callipers.
In this test, a cylinder of soil without lateral support is tested to failure in simple
compression, at a constant rate of strain. The compressive load per unit area required
to fail the specimen as called Unconfined compressive strength of the soil.
PREPARATION OF SOIL SAMPLE
Soil sample with optimum moisture content from proctor test with 3.8 cm diameter and
7.6 cm long was prepared. The sample was placed in position in the load frame. Dial
readings were converted to the appropriate load and length units, and entered these
values on the data sheet in the deformation and total load columns. Sample cross-
sectional area A0= (Π/4)*d2 was computed. Then strain, ε =ΔL/L0 was computed.
Corrected area, A'= A0 / (1-ε) was computed. Using A', specimen stress, Sc = P/ A' was
computed. Stress versus strain was plotted. Show qu as the peak stress (or at 15% strain)
of the test. Mohr’s circle was drawn using qu from the last step and show the undrained
shear strength, Su = C (or cohesion) = qu/ 2.
3.7 SUMMARY
In this chapter, characterization of soil samples and the test procedures for evaluating
the geoenvironmental properties such as consistency limits, standard proctor test,
unconfined compression test were discussed in this chapter.
19
CHAPTER 4
RESULTS AND DISCUSSION
4.1 GENERAL
The previous chapter discusses in detail the various materials and experimental
procedures that were referred in this study. Different soil samples were collected from
Asoor, Purathakudi, Pullambadi locations for the study. In this chapter the effect of
Seawater on the consistency limits, Optimum moisture content, Max dry density,
Undrained Shear strength on Low Compressible Clay, Clayey sand, High Compressible
Clay soils has been studied.
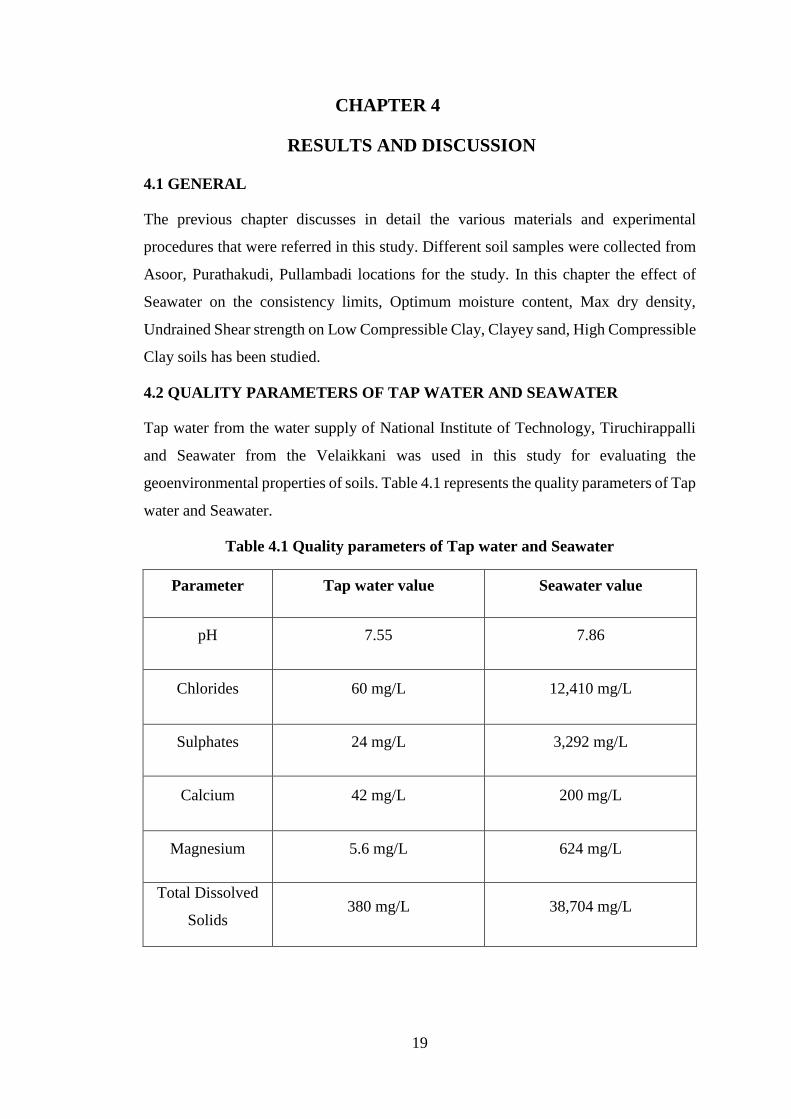
4.2 QUALITY PARAMETERS OF TAP WATER AND SEAWATER
Tap water from the water supply of National Institute of Technology, Tiruchirappalli
and Seawater from the Velaikkani was used in this study for evaluating the
geoenvironmental properties of soils. Table 4.1 represents the quality parameters of Tap
water and Seawater.
Table 4.1 Quality parameters of Tap water and Seawater
Parameter Tap water value Seawater value
pH 7.55 7.86
Chlorides 60 mg/L 12,410 mg/L
Sulphates 24 mg/L 3,292 mg/L
Calcium 42 mg/L 200 mg/L
Magnesium 5.6 mg/L 624 mg/L
Total Dissolved
Solids 380 mg/L 38,704 mg/L

20
4.3 EFFECT OF SEAWATER ON THE CONSISTENCY LIMITS
Location Soil Specific
Gravity
Water
Used LL (%) PL (%)
Plasticity
Index(PI)
Asoor
SC
2.63
Tap water
25
15
10
Seawater 20 16 4
Purathakudi
CL
2.5
Tap water
23
17
6
Seawater 18 17 1
Pullambadi
CH
2.82
Tap water
60
28
32
Seawater 48 25 23
Table 4.2 Variation of Liquid limit, Plastic Limit on different soils with the
addition of Tap water and Seawater
Above table shows the variation of Liquid limit, Plastic limit with the addition of tap
water and seawater. Plasticity index of the clayey sand, Low compressible clay and
High compressible clay reduced from 10% to 4%, 6% to 1% and 32% to 23% when
mixed with tap water and seawater respectively.
Mansour et al., 2008 have indicated that the presence of high valence exchangeable
cations in seawater decrease the distance between particles by decreasing the repulsive
forces in the soil microstructure. This causes the Vander Waals attractive force to be
dominant, hence increasing of capillary stress that formed between particles boundaries
and finally forming the aggregation.

21
4.4 EFFECT OF SEAWATER ON THE COMPACTION CHARACTERISTICS
Fig 4.1 Compaction curves for CL using Tap water and Seawater
The above graph represents the Variation of OMC and Maximum dry density for CL
soil with addition of Tap water and Seawater. With the addition of seawater to the Low
Compressible clay the optimum moisture content increased from 13.5% to 15%. This
resulted in the decrease in the maximum dry density from 1.96 g/cc to 1.94 g/cc. This
may be due to repulsive force between the salt molecules and the clay intermolecular
structure, causing an increase in the intermolecular distances and an increase in the void
ratios
Fig 4.2 Compaction curves for SC using Tap water and Seawater
1.5
1.55
1.6
1.65
1.7
1.75
1.8
1.85
1.9
1.95
2
4.00 6.00 8.00 10.00 12.00 14.00 16.00 18.00 20.00
Dry
un
it w
eigh
t(g/c
c)
Moisture content (%)
Tap water Seawater
1.5
1.6
1.7
1.8
1.9
2
2.1
2.2
0 1 2 3 4 5 6 7 8 9 10 11 12 13 14 15 16
Dry
un
it w
eigh
t(g/c
c)
Moisture content (%)
Tap water

22
The above graph represents the Variation of OMC and Maximum dry density for SC
soil with addition of Tap water and Seawater. With the addition of seawater to the Low
Compressible clay the optimum moisture content decreased from 9.5% to 9.%. This
resulted in the increase in the maximum dry density from 1.94 g/cc to 2.16 g/cc.
This may be due to chemical reaction between the salt molecules and soil particles,
which partially contains lime. Sodium, potassium and magnesium chlorides from salt
reacts with calcium oxides and hydroxides from soil to form calcium chloride, which
hardens the soil and increases the dry unit weight.
Fig 4.3 Compaction curves for CH using Tap water and Seawater
The above graph represents the Variation of OMC and Maximum dry density for CL
soil with addition of Tap water and Seawater. With the addition of seawater to the Low
Compressible clay the optimum moisture content increased from 16% to 19%. This
resulted in the increase in the maximum dry density from 1.68 g/cc to 1.7 g/cc.
This may be due to chemical reaction between the salt molecules and soil particles,
which partially contains lime. Sodium, potassium and magnesium chlorides from salt
reacts with calcium oxides and hydroxides from soil to form calcium chloride, which
hardens the soil and increases the dry unit weight.
1.45
1.5
1.55
1.6
1.65
1.7
1.75
7 8 9 1 0 1 1 1 2 1 3 1 4 1 5 1 6 1 7 1 8 1 9 2 0 2 1 2 2 2 3 2 4 2 5
Dry
un
it w
eigh
t(g/c
c)
Moisture content (%)
Tap water

23
4.5 EFFECT OF SEAWATER ON THE UNCONFINED COMPRESSIVE
STRENGTH
The Unconfined compression test is conducted on the soil sample which has been
prepared with the help of optimum moisture content obtained from the proctor test
In the case of CH clay, the Unconfined compressive strength increased from 188.91 to
233.89 KPa with the addition of Seawater. High Compressible clay has multi layers of
gibbsite and silica sheets with hydrogen bonding linking these sheets. Upon axial
compression when treated with seawater, these sheets become closer to each other and
the tendency of these sheets to resist compression is high, which leads to higher
strength.
Fig 4.4 Stress Strain relation for CH using Tap water and Seawater
Fig 4.5 Stress Strain relation for CL using Tap water and Seawater
0
20
40
60
80
100
120
140
160
180
200
220
240
260
0 1 2 3 4 5 6 7 8 9 10 11 12 13 14 15 16 17 18
Axia
l st
ress
(kp
a)
Axial strain (%)
SeawaterTapwater
0
5
10
15
20
25
30
35
40
45
50
55
0 1 2 3 4 5 6 7 8 9 10 11 12 13
Axia
l st
ress
(kp
a)
Axial strain (%)
Tapwater seawater

24
The Unconfined compressive strength of Low Compressible clay decreased from 50.26
to 31.4 KPa with the addition of Seawater. the formation of dispersed structure (e-e or
f-f) on interaction with seawater which is unstable which leads to decrease in strength.
Fig 4.6 Stress Strain relation for Clayey sand using Tap water and Seawater
The Unconfined compressive strength of Clayey sand decreased from 57.51 to
27.84KPa with the addition of Seawater. In case of Clayey sand, cohesion is due to
presence of small quantity of clay. On interaction of soil with denser seawater particles
there is collapse in the honeycombed structure. Due to this there is a decrease in
strength.
Fig 4.7 Variation of Undrained shear strength for different soils with addition of
tap water and seawater
0
5
10
15
20
25
30
35
40
45
50
55
0 1 2 3 4 5 6 7 8
Axia
l st
ress
(kp
a)
Axial strain (%)
Seawater
Tapwater
25.13 28.75
94.45
15.7 13.92
116.94
10
50
100
150
CL soil SC soil CH soil
Un
dra
ined
sh
ear
stre
ngt
h
(kp
a) Tapwater Seawater

25
In the case of CH clay, the Undrained shear strength increased from 94.45 to 116.94
KPa in Low Compressible clay decreased from 25.13 to 15.7 KPa, in Clayey sand
decreased from 28.75 to 13.92 KPa with the addition of Seawater.
4.6 SUMMARY
Effect of Seawater on the consistency limits, Optimum moisture content, Max dry
density, Undrained Shear strength on Low Compressible Clay, Clayey sand, High
Compressible Clay soils has been studied and the test results are shown.

26
CHAPTER 5
SUMMARY AND CONCLUSIONS
5.1 SUMMARY
The objective of the study to was to find out the effect of Seawater on various
geoenvironmental properties on Low Compressible Clay, Clayey sand, High
Compressible clay soils. The effect of various properties such as liquid limit, plastic
limit, optimum moisture content, maximum dry density, Undrained shear strength were
studied and the results of the same were discussed in chapter 4.
5.2 CONCLUSIONS
1. The high compressible clay gave the highest specific gravity of 2.82, while the
Low compressible Clay gave the lowest specific gravity of 2.50.
2. When mixed with tap water High compressible clay gave the highest liquid and
plastic limits, while Low compressible clay gave the lowest values.
3. Plasticity index of the clayey sand, Low compressible clay and High
compressible clay reduced from 10% to 4%, 6% to 1% and 32% to 23% when
mixed with Tap water and Seawater respectively.
4. Plasticity index of the Clayey sand, Low compressible clay and High
compressible clay reduced from 10% to 4%, 6% to 1% and 32% to 23% when
mixed with tap water and Seawater respectively. Using Sea water, maximum
dry unit weight for the Low compressible clay was decreased from 1.96 g/cc to
1.94 g/cc, but increased that of clayey sand, and High compressible clay from
1.94 g/cc to 2,16 g/cc, 1.68 g/cc to 23.2 g/cc respectively.
5. This may be due to repulsive force between the salt molecules and the clay
intermolecular structure, causing an increase in the intermolecular distances and
an increase in the void ratios.
6. Whereas, the increase in the dry unit weight of the Clayey sand, Low and High
compressible clay could be as a result of a chemical reaction between the salt
molecules and soil particles, which partially contains lime.
7. Sodium, potassium and magnesium chlorides from salt reacts with calcium
oxides and hydroxides from soil to form calcium chloride, which hardens the
soil and increases the dry unit weight.

27
8. In the case of CH clay, the Undrained shear strength increased from 94.45 to
116.94 KPa with the addition of Seawater.
9. The Undrained shear strength of CL, SC soils decreased from 25.13 to 15.7
KPa, 28.75 to 13.92 KPa respectively with the addition of Seawater.
10. CH soil has multi layers of gibbsite and silica sheets with hydrogen bonding
linking these sheets. Upon axial compression when treated with seawater, these
sheets become closer to each other and the tendency of these sheets to resist
compression is high, which leads to higher strength.
11. In case of Sc, cohesion is due to presence of small quantity of clay. On
interaction of soil with denser seawater particles there is collapse in the
honeycombed structure. Due to this there is a decrease in strength.
12. In case of CL soil, the formation of dispersed structure (edge to edge or face to
face) on interaction with seawater which is unstable which leads to decrease in
strength.
5.3 SCOPE OF FUTURE WORK
To study the effect of Seawater on various geoenvironmental properties such as
swelling chracteristics, Compressibility characteristics, infiltration, Shear strength of
soils at different conditions. A study on the consistency limits, Unconfined compression
strength, Compaction has been carried out in this study

28
REFERENCES
Dorothy Caroll , Harry C Starkey, Effect of sea-water on clay minerals,
U.S. Geological Survey, Washington D.C.
Chen, J., Anadarajah, 1998. Influence of pore fluid composition on volume
of sediments in kaolinite suspensions. Clays and Clay Minerals, 46 (2), 145–
152.
Binod Tiwari, Gyanu Ratna Tuladhar; and Hideaki Marui (2005),
Variation in Residual Shear Strength of the Soil with the Salinity of Pore
Fluid, 10.1061/(ASCE)1090-0241131:12(1445).
Anil Kumar Mishra, Masami Ohtsubo, Loretta LI and Takahiro Higashi
(2005), Effect of Salt Concentrations on the Permeability and Compressibility
of Soil-Bentonite Mixtures, J. Fac. Agr., Kyushu Univ., 50 (2), 837-849.
Yeliz Yuk selen-Ak soy , Abidin Kaya , Ali Hakan Ören (2008), Seawater
effect on consistency limits and compressibility characteristics of clays,
Engineering Geology 102 (2008) 54–61
Seracettin Arasan, Temel Yetimoglu (2008) , Effect of inorganic salt
solution on consistency limits of clay ,Turkish J. Eng. Env. Sci. 32, 107 –
115.
Behzad Fatahi , Hadi Khabbaz and Sudip Basack (2011) , Effects of
salinity and sand content on liquid limit and hydraulic conductivity,
Australian Geomechanics Vol 46 .
P. D. Arumairaj. A. Sivajothi [2011] , Effect of Sea Water on Expansive
Soils, EJGE Vol. 15
Tatiana Ivasuc, (2012), Seawater influence on the behavior of the expansive
clays, Environmental Engineering. Vol. I, 2012.
S .A. Naeini, M. A. Jahanfar, (2011), Effect of Salt Solution and Plasticity
Index on undrained Shear Strength of Clays, World Academy of Science,
Engineering and Technology ,Vol:5
Rassoul Ajalloeian, Hadiseh Mansouri, Amir Hossein Sadeghpour [2013],
Effect of Saline Water on Geotechnical Properties of Fine-grained Soil, EJGE
Vol. 18
G. R. Otoko (2014), The Effect of Salt Water on the Physical Properties,
Compaction Characteristics and Unconfined Compressive Strength of a Clay,

29
Clayey Sand and Base Course, European International Journal of Science
and Technology, Vol. 3 No. 2, March, 2014.
M.E. Elmashad, A.A . Ata (2015), Effect of seawater on consistency ,
infiltration rate and swelling characteristics of montmorillonite clay, HBRC
Journal
Peng Chang-sheng, Low G kathleen, Zhang Qian( 2009), Effects of water
salinity and content on particle size distribution and soil strength, Journal of
Environmental Science and Engineering, Jan. 2009, Volume 3, No.1 (Serial
No.14)
Ayininuola Gbenga Matthew and Agbede Oluwole Akinyele ( 2014),
Sodium and Calcium Salts Impact on Soil Permeability, Journal of Earth
Sciences and Geotechnical Engineering, vol. 4, no. 3, 2014.
M. Chittaranjan, T. Srikanth, B. Yamini Lakshmi & D. Pavani, Effect of
sea water on some geo technical properties of clayey soil, International
Journal of Earth Sciences and Engineering, Vol 04, 2011.
Tamadher T. Abood, Anuar Bin kasa, Zamri Bin Chik, Effect of adding
three chloride compounds (NaCl, MgCl2, CaCl2) on the properties of silty clay
soil Journal of Engineering Science and Technology ,Vol. 2, No. 1 (2007)
102-110.
Abbasi, N., “The Role of Anions in the Dispersion Potential of Clayey
Soil,” Journal of Agricultureal Engineering Research, 12. (In pertioan),
2011.
Alainachi, I. H., and G.A. Alobaidy., The Effects of Basra Gulf Salt Water
on The Proctor Compaction and CBR Test Results of SoilSamples at Baniyas
City, Abu Dhabi, UAE, Electronic Journal of Geotechnical Engineering,
15., 2010.
Arasan, S., and T. Yetimoglu., Effect of Inorganic Salt Solutions on the
Consistency Limits of Two Clays, Turkish J. Eng. Env. Sci, 32, 107-115.,
2008.
Ayenu-Prah, Jr. A. Y., Effect of the Chemical Composition of Compaction
Water on the Performance of Soil Subgrades and Embankments, M.Sc.
Thesis,Texas Tech University, 62 P, 2004.

30
Ayininuola, G. M., O. A., Agbede and S. O. Franklin., Influence of
Calcium Sulphate on Subsoil Cohesion and Angle of Friction,” Journal of
Applied Sciences Research, 5, 297-304, 2009.
Chaudhari, S., Saturated Hydraulic Conductivity, Dispersion, Swelling, and
Exchangeable Sodium Percentage of Different Textured Soils as Influenced by
Water Quality, Communications in Soil Science and Plant Analysis, 32,
2439-2455, 2001.
Bale Nikhil Kumar, Jeevana Smitha , Dr. K V Uday, Effect of Salinity on
Geotechnical Properties of Expansive Soils, International Journal of
Innovative Research in Science,Engineering and Technology, Vol. 4, Issue
7, July 2015
Moyayed, R.Z., Haratian, M. and Izadi, E. (2011). “Improvement of
Volume Change Characteristics of Saline Clayey Soils”, Jnl. of Applied
Sciences. 11(1), 76-85
Zhou, J., Zheng, X., Flury, M. and Lin, G. (2009). “Permeability Changes
during Remediation of an Aquifer Affected by Sea-water”, J. Hydrology. 376,
557-566.
ASTM D4318 (2010), Standard Test Methods for Liquid Limit, Plastic Limit,
and Plasticity Index of Soils, ASTM International
B.L. Kirov1, N.N. Truc1” A study on the relationship between geotechnical
properties and clay mineral composition of Hanoi soft soils in saline media”
International Journal of Civil Engineering, December 2011.
P. G. Studds, D. I. Stewart and T. W. Cousens, The effects of salt solutions
on the properties of bentonite-sand mixtures, Clay Minerals,1998.
A.K. Mishra, Effect of bentonite quality on the hydraulic and compressibility
behaviour of soil-bentonite mixtures in the presence of salt solution, 2011