the tornado that struck embry-riddle aeronautical
TRANSCRIPT

Journal of Aviation/Aerospace Journal of Aviation/Aerospace
Education & Research Education & Research
Volume 25 Number 2 JAAER Spring 2016 Article 3
Spring 2016
The Tornado that Struck Embry-Riddle Aeronautical University on The Tornado that Struck Embry-Riddle Aeronautical University on
Christmas Day, 2006: Lessons Learned from a Near-Miss Christmas Day, 2006: Lessons Learned from a Near-Miss
John M. Lanicci Embry-Riddle Aeronautical University - Daytona Beach, [email protected]
Follow this and additional works at: https://commons.erau.edu/jaaer
Part of the Aviation Commons, Emergency and Disaster Management Commons, Meteorology
Commons, and the Organizational Communication Commons
Scholarly Commons Citation Scholarly Commons Citation Lanicci, J. M. (2016). The Tornado that Struck Embry-Riddle Aeronautical University on Christmas Day, 2006: Lessons Learned from a Near-Miss. Journal of Aviation/Aerospace Education & Research, 25(2). https://doi.org/10.15394/jaaer.2016.1690
This Article is brought to you for free and open access by the Journals at Scholarly Commons. It has been accepted for inclusion in Journal of Aviation/Aerospace Education & Research by an authorized administrator of Scholarly Commons. For more information, please contact [email protected].
Introduction
A tornado with estimated F2 intensity struck Daytona Beach, Florida on the afternoon of
Christmas Day 2006. The majority of the estimated $50 million in damage was confined to the
Embry-Riddle Aeronautical University campus (National Climatic Data Center, 2006), where the
tornado destroyed or severely damaged 50 of the university’s 74 training aircraft, destroyed an
aircraft hangar, set a maintenance hangar on fire, severely damaged the advanced flight
simulation center, and destroyed the administration building (National Climatic Data Center,
2006; Brown, 2007). The tornado also damaged homes and businesses in the city, most notably
cutting a large damage swath through the Sutton Place apartment complex, which is less than one
mile from campus.
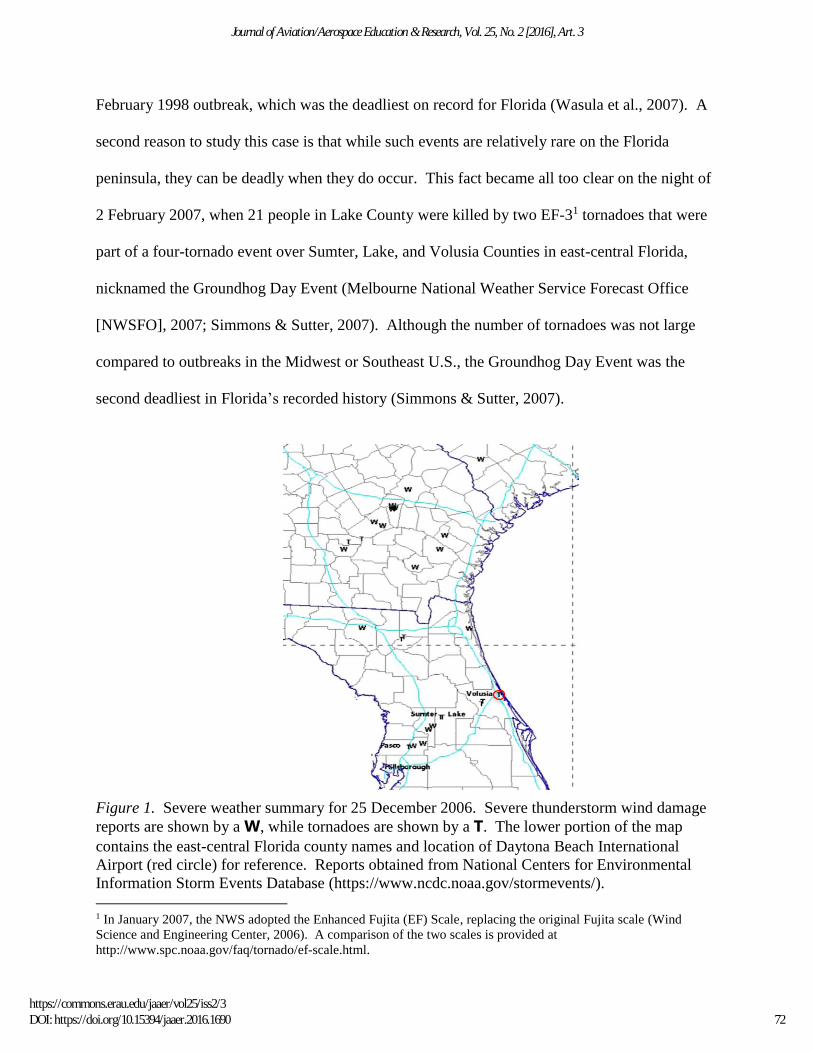
The tornado was one of six reported across Florida and Georgia, along with 19 reports of
severe-thunderstorm wind damage across Florida, Georgia, and South Carolina over a period of
12 hours, from 2:00 a.m. Eastern Standard Time (all times EST unless otherwise noted) to just
before 2:00 p.m. Of the six tornadoes, five were observed in Florida, and four of these were
rated as F2 on the Fujita Tornado Intensity Scale (Fujita, 1971). Figure 1 shows a map of the
severe weather reports from 25 December.
The Daytona Beach tornado caused no fatalities but there were six injuries, and only 15
total injuries reported across the three states that experienced severe weather. Despite what
would appear to be a relatively ‘routine’ tornado event that might not be worth examining, there
are several important reasons for studying this case. First, the meteorological literature does not
contain a lot of case studies of non-tropical severe storms in this part of the state, save for
climatological studies such as those of Hagemeyer and Schmocker (1991), Paxton and Shepherd
(1993), Hagemeyer (1997), and Williams et al. (1999), and a case-study analysis of the 23
71
Lanicci: The Tornado that Struck Embry-Riddle
Published by Scholarly Commons, 2016
February 1998 outbreak, which was the deadliest on record for Florida (Wasula et al., 2007). A
second reason to study this case is that while such events are relatively rare on the Florida
peninsula, they can be deadly when they do occur. This fact became all too clear on the night of
2 February 2007, when 21 people in Lake County were killed by two EF-31 tornadoes that were
part of a four-tornado event over Sumter, Lake, and Volusia Counties in east-central Florida,
nicknamed the Groundhog Day Event (Melbourne National Weather Service Forecast Office
[NWSFO], 2007; Simmons & Sutter, 2007). Although the number of tornadoes was not large
compared to outbreaks in the Midwest or Southeast U.S., the Groundhog Day Event was the
second deadliest in Florida’s recorded history (Simmons & Sutter, 2007).
Figure 1. Severe weather summary for 25 December 2006. Severe thunderstorm wind damage
reports are shown by a W, while tornadoes are shown by a T. The lower portion of the map
contains the east-central Florida county names and location of Daytona Beach International
Airport (red circle) for reference. Reports obtained from National Centers for Environmental
Information Storm Events Database (https://www.ncdc.noaa.gov/stormevents/).
1 In January 2007, the NWS adopted the Enhanced Fujita (EF) Scale, replacing the original Fujita scale (Wind
Science and Engineering Center, 2006). A comparison of the two scales is provided at
http://www.spc.noaa.gov/faq/tornado/ef-scale.html.
72
Journal of Aviation/Aerospace Education & Research, Vol. 25, No. 2 [2016], Art. 3
https://commons.erau.edu/jaaer/vol25/iss2/3DOI: https://doi.org/10.15394/jaaer.2016.1690

In addition to the aforementioned reasons, there is a third, and perhaps more important
reason for studying this case: the lack of awareness within the local population about winter-
season severe weather in this part of Florida. Post-event discussions with university officials
revealed a general lack of awareness of the seasonal likelihood of dry-season, tornadic
thunderstorms over east-central Florida. The author observed this a number of times when
presenting the details of this case to faculty, staff, and students in the months following the
event. When one examines the student demographics of Embry-Riddle, this lack of seasonal
awareness is not surprising; nearly 75% of first-semester undergraduate students are from out-of-
state (Embry-Riddle Institutional Research, n.d.). Additionally, more than 400 international
students from over 80 different countries were enrolled in fall semester 2006 classes (Embry-
Riddle Institutional Research, n.d.).
This paper begins with a summary of the tornado’s touchdown at Daytona Beach
International Airport (DAB) and subsequent path through the Embry-Riddle campus, presented
using meteorological and non-meteorological sources. Additionally, the event is examined from
two unique perspectives: (a) a hypothetical estimate of personnel exposure had the tornado hit
during regular classes, and (b) a description of the events surrounding Comair Flight 580. The
paper concludes with a set of recommendations for increasing awareness and preparedness for
such extreme weather events that can be adopted by collegiate aviation programs and airport
management. The recommendations propose a program patterned after the four phases of
emergency management: (a) mitigation, (b) preparedness, (c) response, and (d) recovery.
Summary of the Atmospheric Conditions Prior to the Tornado’s Touchdown at DAB
The setting for severe storms in Florida during the winter season typically has a strong jet
stream located far enough south to allow surface cyclogenesis to take place close to the
73
Lanicci: The Tornado that Struck Embry-Riddle
Published by Scholarly Commons, 2016

peninsula, resulting in the formation of conditional instability and strong vertical wind shear in
the atmosphere. Figure 2a shows a composite analysis of the key surface, 850-hPa (about 5,000
feet above mean sea level [MSL]), and 300-hPa (about 30,000 feet MSL) parameters at 7:00 a.m.
on 25 December; Figure 2b shows an idealized configuration of these same features for a typical
Florida peninsula dry-season tornado event. Note that in both Figures 2a and 2b, the 300-hPa jet
stream is located over the Gulf of Mexico, and a surface low is located close to Florida. Surface
lows that develop and migrate over the Gulf of Mexico or the Gulf Coast states, in combination
with strong low- and upper-level winds, can produce the type of instability and vertical wind-
shear conducive for severe thunderstorms over the Gulf Coast and the Florida peninsula. In
these types of synoptic-scale weather patterns, warm, humid air is drawn northward from the
tropics, as evidenced by the high morning surface dew points (mid to upper 60s and low 70s F),
which were as high as the average high air temperatures for this time of the year. At the upper
levels, winds in the jet-stream core were between 80 and 125 kt on the morning of the event.
(a) (b)
Figure 2. Panel (a): 7:00 a.m. 25 December 2006 composite analysis. Surface fronts are in
black using conventional notation, areas of surface dew point > 68°F (10°C) are in green
shading, strongest 850-hPa winds are shown by red arrows, and strongest 300-hPa winds are
shown by purple arrows with jet core depicted by shaded oval. Thin purple arrow shows 300-
hPa winds over Florida and adjacent waters. Panel (b): Idealized positions of surface fronts,
strongest 850-hPa and 300-hPa winds for strong tornado events during Florida peninsula dry
season. Note. Panel (b) is after Hagemeyer (1998).
74
Journal of Aviation/Aerospace Education & Research, Vol. 25, No. 2 [2016], Art. 3
https://commons.erau.edu/jaaer/vol25/iss2/3DOI: https://doi.org/10.15394/jaaer.2016.1690
As the morning progressed, a series of severe-thunderstorm and tornado warnings were
issued by NWSFOs in Tampa and Melbourne, stretching from Pasco and Hillsborough Counties
(just north of Tampa), through the central counties of Sumter and Lake, and into Volusia County in
the east (Melbourne NWSFO, 2006). These warnings were the result of a long-lived portion of a
squall line that moved onshore near Tampa around 10:00 a.m. and produced nearly all of the
severe weather reports on this day in Florida (county locations shown in Figure 1).
This particular section of the squall line produced a severe-storm radar signature known as
a bow echo (Fujita, 1978; Przybylinski, 1995; Markowski & Richardson, 2010). The bow echo is
aptly named for the characteristic radar reflectivity pattern showing one segment of the line
accelerating ahead of its adjacent segments, producing a feature that looks like an arc or bow (see
the conceptual diagram in Figure 3a). Within the bow echo, straight-line winds are the most
dangerous hazard, although tornadoes can form along and just to the north of the bow-echo apex
by creation of small-scale rotation in the low levels of the storm complex (Weisman & Trapp,
2003; Trapp & Weisman, 2003; Trapp, Tessendorf, Godfrey, & Brooks, 2005). The author notes
that Fujita’s seminal research on the bow echo was a result of forensic investigations he conducted
into the causes of multiple high-profile airliner accidents in the 1970s and 1980s in which
downbursts and microbursts were involved (Fujita, 1978, 1985).
Figures 3b through 3d illustrate the evolution of the parent thunderstorm system that
eventually spawned the tornado at DAB, using base reflectivity imagery from the Next Generation
Doppler Radar (NEXRAD). When one compares the evolution of the bow echo in the NEXRAD
images from 10:39 a.m., 12:24 p.m., and 2:09 p.m. with the idealized model in Figure 3a, the bow
echo is seen to have evolved from the nascent stage ‘B’ through the mature and comma-echo
stages ‘C’ and ‘D’ in the conceptual diagram. The evolution depicted in Figures 3b-d also shows
75
Lanicci: The Tornado that Struck Embry-Riddle
Published by Scholarly Commons, 2016

that when the original bow-echo ‘comma head’ structure dissipated after 1:00 p.m., the bow echo
regenerated as it headed towards DAB. By 2:09 p.m., this regenerated bow echo had again
reached a comma-echo stage as it headed off the coast.
The NEXRAD imagery also contains a well-documented feature known as a rear-inflow
notch, which is an area of noticeably lighter precipitation behind the bow echo’s apex. Studies by
Przybylinski (1995) and others have documented this signature as being associated with a
phenomenon called a rear-inflow jet, which is important in the production of straight-line wind
damage associated with the bow echo. In the comma-echo stage, rotation is possible in the region
between the apex and the comma head, and this was the stage that the system began to pass
through as it approached the Daytona airport (DAB in Figure 3).
Figure 3. Panel (a): Conceptual diagram of bow-echo evolution from echo through comma
stages. Favored downburst location is marked by ‘DB’ along dotted white line, and favored
tornado locations are shown by grey dots in stages B-D. Figure adapted from Fujita (1978) by
Cooperative Program for Operational Meteorology, Education and Training. Panels (b)-(d):
NEXRAD base reflectivity for 12:39, 1:24, and 2:09 p.m. Red and yellow polygons are tornado
and severe-thunderstorm warning areas, respectively. Pertinent features described in the text are
labeled in white. Graphics in panels (b)-(d) courtesy of Iowa Environmental Mesonet (n.d.).
Comma head Rear-inflow notch
DAB 2:09 p.m. - Bow echo in comma
stage; leading edge
gradient strengthens
further
Rear-inflow notch DAB
Comma head dissipated
1:24 p.m. - Bow echo regenerates;
leading edge gradient
strengthens
Comma head
Rear-inflow notch
DAB
12:39 p.m. - Bow echo in ‘comma’ stage
(a)
(c) (d)
(b)
76
Journal of Aviation/Aerospace Education & Research, Vol. 25, No. 2 [2016], Art. 3
https://commons.erau.edu/jaaer/vol25/iss2/3DOI: https://doi.org/10.15394/jaaer.2016.1690

Tornado Touchdown at DAB and Path Through the Embry-Riddle Campus
In Daytona, the bow echo passed directly over DAB and the tornado formed at the east end
of the runway 7L/25R complex. The evolution of the system at DAB was examined via
NEXRAD, the Low Level Wind Shear Alert System (LLWAS) (Federal Aviation Administration
[FAA] Technical Order 6560.21A, 1989; National Center for Atmospheric Research, 2012), and
the DAB Automated Surface Observing System (ASOS). The nine LLWAS towers vary in height
from 90 to 148 feet (for reference, the ASOS wind measuring height is 33 feet), and cover a
horizontal area approximately three by four miles. Wind direction and speed data from the
LLWAS towers were collected and provided to the author via a Microsoft Excel® spreadsheet at
10-second intervals from 1:30 to 2:00 p.m. The data was examined to determine if a discernible
wind shift appeared at each tower, since the ASOS data were only available every minute, and
NEXRAD data every 4 minutes.
A 1-hour time series from the ASOS data revealed that the altimeter setting dropped 0.03
in. Hg in just 5 minutes, to a minimum of 29.765 in. Hg at 1:35 and 1:36 p.m., before suddenly
rising 0.06 in. Hg over the next 4 minutes. To put this pressure change into perspective, Sanders
and Gyakum (1980) coined the term “bomb” to describe an extratropical cyclone whose central
pressure drops by at least 24 hPa in 24 hours (averaging at least 1 hPa per hour). The altimeter
setting drop at DAB was equivalent to a 1.02 hPa drop in 5 minutes, 12 times faster than the rate
described by Sanders and Gyakum.
At 1:37:28 p.m., during the period of rapid pressure rise at the DAB ASOS, the NEXRAD
base reflectivity data (Figure 4) showed the leading edge of the bow echo was passing over the
airport complex. The coincident LLWAS data in Figure 4 showed that the winds at the
westernmost towers (4 and 5) had already shifted with the passage of the bow echo west of the
77
Lanicci: The Tornado that Struck Embry-Riddle
Published by Scholarly Commons, 2016

touchdown end of runway 7L, consistent with the ASOS pressure rise and wind shift there. The
winds between Towers 5 and 9 appear to have cyclonic rotation, which could be an indicator of the
rotation that can be observed north of the bow-echo apex in the Fujita conceptual model (mature
stage ‘C’ in Figure 3a). An animation of the LLWAS winds for the 1:30–2:00 p.m. time period is
available at http://wx.erau.edu/faculty/lanic00f/dabtornado/llwas_anim.mov. A best estimate of
tornado touchdown derived from the ASOS, NEXRAD, and LLWAS data was 1:38–1:39 p.m.
According to the NWS storm damage survey, the tornado was on the ground for approximately 5
minutes, and traveled a distance of nearly 3 miles (National Climatic Data Center, 2006).
Figure 4. Local analysis over Daytona Airport and vicinity about 30–60 seconds before tornado
touchdown just east of intersection of runways 25R/7L and 34/16. Path of tornado outlined in
dashed red line with locations of ERAU campus and Sutton Place Apartments as shown.
LLWAS winds plotted for closest time to NEXRAD scan. Tower numbers are indicated in
black. Maximum base reflectivities from NEXRAD (~50 dBZ and greater) are shown by shaded
area. The X denotes the location of a NEXRAD-identified circulation about 2 km above ground.
78
Journal of Aviation/Aerospace Education & Research, Vol. 25, No. 2 [2016], Art. 3
https://commons.erau.edu/jaaer/vol25/iss2/3DOI: https://doi.org/10.15394/jaaer.2016.1690
In addition to the meteorological data collected and analyzed for this case, there was non-
meteorological information that also helped the author determine a timeline for the tornado
touchdown and subsequent damage path. This timeline, along with damage photographs from
the campus, is presented in Figure 5.
The author obtained a copy of an after-action report from the Embry-Riddle Campus
Safety Department (Widham, Freshwaters, Clark, & Thing, 2006). In it, a Campus Safety officer
described the sequence of events that occurred at the College of Aviation building at the time of
the tornado touchdown (note that the College of Aviation building is located along the left edge
of the lower red dashed line in Figure 5a). A condensed version of his summary is shown in
Table 1.
The Campus Safety officer’s description of the pressure changes is consistent with the
time frame of the ASOS pressure drop/jump. Other information in Table 1 corroborates a
touchdown time consistent with that derived from the meteorological data, such as the timeline
of the hangar fire caused by one of the training aircraft being thrown into the building by the
tornado. The Campus Safety officer reported that the Port Orange Fire Department was on the
scene “around 1345 EST”, which translates to a response time of about 5–7 minutes when one
considers that they are approximately 5 miles from the campus. Given that the tornado warning
was issued at 1:25 p.m., this is a 13–14 minute lead-time, which is right at or slightly better than
the national average of 13 minutes for a tornado warning (Erickson & Brooks, 2006).
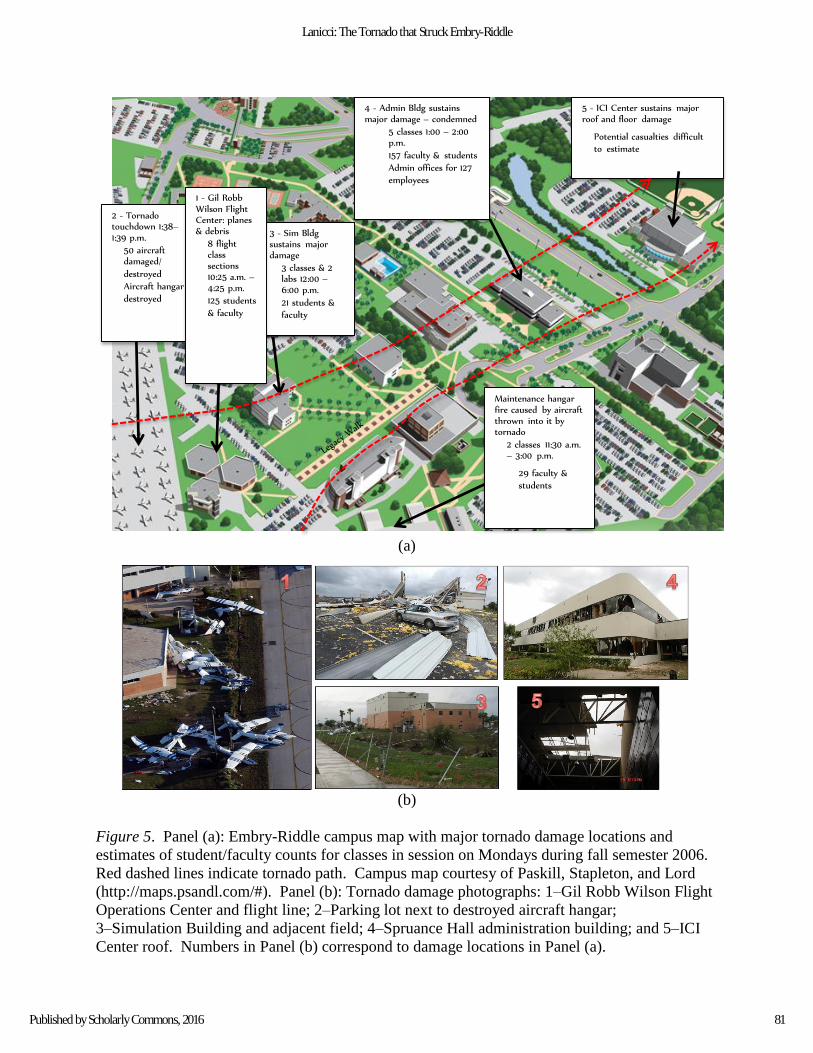
Figure 5b documents some of the tornado damage on the Embry-Riddle campus. All of
the photographs were taken within the area bounded by the red dashed lines in Figure 5a. As the
tornado touched down, many of the aircraft were ripped from their tie-downs and thrown into
each other or into the sides of adjacent buildings. After the tornado, several tie-downs were
79
Lanicci: The Tornado that Struck Embry-Riddle
Published by Scholarly Commons, 2016

recovered and the chains had been stretched to the point where the links became ‘fused’ to each
other. Several buildings sustained major damage, and the Spruance Hall administration building
was declared unsafe and was condemned. Across the street from campus, the ICI Center
received major roof damage, and the basketball court was destroyed from the resultant water
damage. The Sutton Place Apartments also sustained major damage as the tornado cut a swath
directly through the complex.
Table 1
Documentation of Tornado Timeline from Non-Meteorological Sources
Source Description
Eye-witness report from
Embry-Riddle Campus Safety
Officer
From inside College of Aviation Building, saw “a severe rain
storm approaching and felt the change in atmospheric pressure
resulting in a ‘popping’ sensation… Simultaneously, there was
a pressure on his chest making catching his breath difficult.”
Officer “ran down the hallway and sought refuge in the men’s
bathroom… there was a ‘screaming’ sound as wind hit the
building. …could feel the building ‘shudder’. The lights went
out, and there was a very loud rumble, then it was very quiet.
The entire sequence lasted approximately one minute.”
Eye-witness report from
Embry-Riddle Campus Safety
Officer
After tornado hit, one of the aircraft maintenance buildings had
caught on fire. Officer reports Port Orange Fire Dept. arrived on
scene "approximately 1345 hours.”
Amateur Radio Operator
storm damage report
Reported to Melbourne NWSFO at 1:45 p.m. that large trees
down near Daytona Beach Police Station near Nova Road and
Range Road. Based on knowledge of former location of
Daytona Beach PD, this was likely 990 Orange Ave., across the
street from Sutton Place Apartments.
Law Enforcement report Reported to Melbourne NWSFO at 1:41 p.m. that small aircraft
were overturned at Embry-Riddle.
Volusia County Sheriff’s
Office
Received a phone call from the Bellevue Avenue area at 1:41
p.m. that “something” had passed through and taken down the
traffic lights.
Stopped clock in Embry-
Riddle Simulation Building
Clock on the south wall of Room 214 in Advanced Flight
Simulation Building (across from College of Aviation) was
knocked off the wall by blowing debris from tornado. Clock
showed 1:39 p.m. when it stopped.
80
Journal of Aviation/Aerospace Education & Research, Vol. 25, No. 2 [2016], Art. 3
https://commons.erau.edu/jaaer/vol25/iss2/3DOI: https://doi.org/10.15394/jaaer.2016.1690
(a)
(b)
Figure 5. Panel (a): Embry-Riddle campus map with major tornado damage locations and
estimates of student/faculty counts for classes in session on Mondays during fall semester 2006.
Red dashed lines indicate tornado path. Campus map courtesy of Paskill, Stapleton, and Lord
(http://maps.psandl.com/#). Panel (b): Tornado damage photographs: 1–Gil Robb Wilson Flight
Operations Center and flight line; 2–Parking lot next to destroyed aircraft hangar;
3–Simulation Building and adjacent field; 4–Spruance Hall administration building; and 5–ICI
Center roof. Numbers in Panel (b) correspond to damage locations in Panel (a).
2 - Tornado touchdown 1:38–1:39 p.m.
• 50 aircraft damaged/
• destroyed
• Aircraft hangar destroyed
3 - Sim Bldg sustains major damage
• 3 classes & 2 labs 12:00 – 6:00 p.m.
• 21 students & faculty
Maintenance hangar fire caused by aircraft thrown into it by tornado
• 2 classes 11:30 a.m. – 3:00 p.m.
• 29 faculty & students
5 - ICI Center sustains major roof and floor damage
• Potential casualties difficult to estimate
4 - Admin Bldg sustains major damage – condemned
• 5 classes 1:00 – 2:00 p.m.
• 157 faculty & students
• Admin offices for 127 employees
1 - Gil Robb Wilson Flight Center: planes & debris
• 8 flight class sections 10:25 a.m. – 4:25 p.m.
• 125 students
& faculty
81
Lanicci: The Tornado that Struck Embry-Riddle
Published by Scholarly Commons, 2016

Why Was This a Near-Miss for Embry-Riddle and Daytona Airport?
Embry-Riddle’s Near-Miss
Despite the extensive damage to the aircraft and facilities at Embry-Riddle, there were no
fatalities or injuries from the tornado. Obviously, the fact that the tornado hit campus on
Christmas Day played a large role. After the event, faculty, staff, and students wondered what
might have occurred had the tornado hit campus on a Monday afternoon when classes were in
session. The author produced an estimate of the number of faculty, staff, and students who could
have been in the path of the tornado had it occurred on a Monday afternoon during the Fall 2006
semester.
The estimates were constructed by examining damage reports and photography,
retrieving course enrollments from the fall semester, and filtering the results by those classes
meeting on Monday afternoon during the time of the tornado’s passage through campus. This
estimate is shown in the inset boxes of Figure 5a. Although the aircraft hangar adjacent to the
aircraft-parking ramp was totally destroyed, there were no scheduled classes held there, so it was
difficult to determine how many individuals would have been in that facility if the tornado had
hit during a typical Monday afternoon. Of great concern was the fact that five classes, totaling
157 students, would have been meeting in Spruance Hall (administration building) during the
1:00–2:00 p.m. class period. Spruance Hall took the most damage of all the buildings on campus
with the exception of the aircraft hangar. Additionally, 127 administrative personnel, including
the university president and the majority of his senior staff, were housed in Spruance Hall. With
a large number of windows and a glass-roofed atrium (see photo 4 in Figure 5b), close to 300
people could have been inside when the tornado hit. The maintenance hangar that caught on fire
82
Journal of Aviation/Aerospace Education & Research, Vol. 25, No. 2 [2016], Art. 3
https://commons.erau.edu/jaaer/vol25/iss2/3DOI: https://doi.org/10.15394/jaaer.2016.1690

also held offices and classrooms. There were two classes totaling 29 students and faculty that
would have been meeting on Monday afternoon at the time the tornado hit.
While it is difficult to make a casualty estimate with any degree of precision, the
calculations in Figure 5a suggest that approximately 400-500 people could have been exposed to
the tornado and its debris had it hit during a typical Monday afternoon in the fall semester. This
estimate does not include potential casualties from anyone who would have been outside,
especially along Legacy Walk (labeled in lower portion of Figure 5a), a primary pedestrian
thoroughfare, which was the main pathway of the tornado.
Daytona Airport’s Near-Miss
The story behind Comair Flight 580 and the Daytona Control Tower is somewhat
complicated. In September 2006, the FAA banned radios and cell phones from air traffic control
facilities, and National Oceanic and Atmospheric Administration (NOAA) Weather Radios
(NWRs) were considered part of that list (National Air Traffic Control Association [NATCA],
2006). When the Melbourne NWSFO issued its tornado warning at 1:25 p.m., controllers in the
control tower cab and radar room at the airport were unaware of the warning, and that the airport
was in the projected path (NATCA, 2006; Griggs, 2007). There were two important safety
considerations in this instance: (a) safety of aircraft in flight or on the ground; and (b) safety of
personnel on the ground, to include the air traffic controllers themselves. Following is an
excerpt from the NATCA (2006) press release, issued three days after the tornado; note that
besides the Campus Safety officer, this was the only other eyewitness account of the tornado:
Without any way to hear about the tornado warning that was issued for the area, two
controllers remained at their posts in the tower cab. They reported poor visibility due to
the heavy rain and said they noticed the large, thick windows surrounding them start to
83
Lanicci: The Tornado that Struck Embry-Riddle
Published by Scholarly Commons, 2016

move eerily in and out. They said the building shuddered a bit and they heard a low,
moaning sound. (Italics added by the author.)
At the time the tornado hit, the Daytona terminal radar approach control (TRACON)
would have been vectoring Comair Flight 580, a Canadair Regional Jet inbound from LaGuardia
Airport to DAB, but commercial power had failed before the aircraft’s arrival, and the
uninterruptible power source in the TRACON had also failed just moments before the tornado
struck the airport, silencing their radios and rendering the room totally dark (Griggs, 2007).
Once the pilots realized they had lost contact with the radar controllers, they continued
southbound along the coast until they were able to call the tower, which still had power. The
tower then took over the approach functions for their arrival; however, the tower controllers had
no knowledge of the tornado warning that had been issued for the area. Media reports after the
tornado stated that many individuals in the Daytona airport passenger terminal were also
unaware of the tornado warning (Griggs, 2007). Considering that the tornado touched down less
than ½ mile from the terminal building, these people could also be considered part of the
airport’s ‘near-miss’ from this event.
In order to assess the vulnerability of the flight in the air and the people on the ground at
the airport, 5-minute ASOS observations from DAB were analyzed to determine the degree of
current weather situation awareness of the tower cab and radar controllers in the absence of the
NWR. Flight track information for Comair Flight 580 obtained from the FAA through a
Freedom of Information Act request was examined for the last 60 minutes of the flight. The
flight track data provided 5-10 second updates of aircraft location and altitude. As was done
with the Embry-Riddle campus damage assessment, non-meteorological data sources such as
media accounts were also examined for relevance. In order to determine how close Comair
84
Journal of Aviation/Aerospace Education & Research, Vol. 25, No. 2 [2016], Art. 3
https://commons.erau.edu/jaaer/vol25/iss2/3DOI: https://doi.org/10.15394/jaaer.2016.1690
Flight 580’s flight path actually got to the parent thunderstorm, 1-minute duration plots of the
flight path (colored arrows) were overlaid with closest-in-time NEXRAD base reflectivity, and
closest-in-time DAB ASOS observations were consulted for reference. These plots are shown in
Figure 6.
Between 1:33 and 1:37 p.m., the flight was preparing to make its final approach to DAB
by turning to fly parallel to the coast. At 1:33 p.m., Comair Flight 580 was located about 24
nautical miles (nm) north-northeast of the airport and was descending from an altitude of 14,200
feet to 13,100 feet. This was the time when the bow echo began to approach and pass through
the airport. The 1:35 p.m. ASOS remarks showed that a thunderstorm was first observed at 1:32
p.m. and that the pressure was falling rapidly, along with frequent cloud-to-ground lightning
southwest through north of the field.
By 1:40 p.m., DAB reported ½-mile visibility in a thunderstorm with heavy rain, winds
from 230º at 20 kt with gusts to 34 kt, and a varying wind direction between 200º and 260º. The
remarks section showed that the peak instantaneous wind of 270º at 34 kt had occurred 3 minutes
earlier (1:37 p.m.). Clearly, the air traffic controllers at DAB would have been well aware of the
thunderstorm on the airfield. The best estimate that could be made using the media reports (e.g.,
Griggs, 2007) and the aircraft flight-path data is that the loss of communication between Flight
580 and DAB TRACON occurred right around this same time (1:39–1:40 p.m.). This was the
timeframe when the flight should have made a right turn to begin its final approach to land on
runway 25R, but instead continued southbound along the coast (see Figure 6). This was also the
time that the tornado was moving through the Embry-Riddle campus. Media reports estimate
that the power outage lasted about 3 minutes (Griggs, 2007).
85
Lanicci: The Tornado that Struck Embry-Riddle
Published by Scholarly Commons, 2016

Once contact was re-established by the crew, instructions were given to turn around and
head north along the coast, as controllers saw a break beginning to form in the precipitation
pattern north of DAB (see Figure 6). The flight began its turnaround at approximately 1:45 p.m.,
and started heading to the north-northwest, paralleling the coast just as it had done before. By
this time, the bow echo had passed through DAB and the tornado had dissipated, but the bow
echo was now heading off the coast, and Comair Flight 580 was on a collision course with it
unless it could reach the entry point south of Palm Coast before the bow echo. Figure 6 shows
that the flight made its closest approach (about 6 nm) to the leading edge of the line of
thunderstorms at 1:50 p.m., at an altitude of 3,000 feet. From this point, the flight was able to
reach the turning point near Palm Coast and begin its final approach into DAB, landing on
runway 16 at 2:06:37 p.m., approximately 27 minutes after the tornado hit.
Figure 6. Time series of NEXRAD maximum base reflectivity (color-coded by scan time) and
Comair Flight 580 flight path (black dots with arrowheads). Colored arrows with labels denote
one-minute segments of Flight 580’s path and altitude in hundreds of feet and match the
NEXRAD color codes. NEXRAD valid times are 1:33:14 p.m. (orange); 1:41:43 p.m. (red);
1:50:12 p.m. (purple); and 1:58:41 p.m. (blue). Range marker on right of figure is shown by
vertical black line; each tick mark is 5 nm.
86
Journal of Aviation/Aerospace Education & Research, Vol. 25, No. 2 [2016], Art. 3
https://commons.erau.edu/jaaer/vol25/iss2/3DOI: https://doi.org/10.15394/jaaer.2016.1690
There are two questions that arise from the preceding analysis:
1) Would Comair Flight 580 have made the final turn to land at DAB on its original plan
at around 1:40 p.m. if the power had not gone out at the TRACON?
2) Would the tower have been evacuated if the controllers knew about the tornado
warning?
These two questions are virtually impossible to answer with certainty. There are,
however, some important points that can be made about each of these questions. First, an
excerpt from the transcript of the controller-pilot communications showed that the pilots of
Comair Flight 580 had on-board weather radar and a visual fix on the approaching thunderstorm
(Griggs, 2007). They were actually considering flying another 10-15 miles to the south and
turning toward the coast to come into DAB from the south (based on the NEXRAD imagery in
Figure 6 and the author’s experience as a meteorologist, this would have been a bad idea!). If
they had made the turn into DAB as originally planned, it would have put them in the direct path
of the severe thunderstorm, and it is likely that they either would have turned to avoid the
thunderstorm or would have been given instructions to divert away from the airport (the ASOS
report showed that 1:40 p.m. was the height of the worst conditions at the field).
Another consideration is that the LLWAS did not alert for a microburst or wind shear in
this case; the wind pattern was apparently not divergent enough to set off the alarm. The peak
LLWAS winds were around 45 kt from the southwest as the bow echo passed through, and so
even though the alarm did not sound, landing an aircraft in such strong, gusty, and directionally
varying winds so close to the ground would have been challenging and very likely not attempted.
The second question is problematic, because the NWR broadcast would have mentioned
that the storm already had a history of wind damage and tornadoes, so the tower controllers
87
Lanicci: The Tornado that Struck Embry-Riddle
Published by Scholarly Commons, 2016
would likely have taken it very seriously. Given the 14-minute lead time, as the storm
approached from the southwest, continuous monitoring of the ASOS and LLWAS would have
given the tower personnel enough time to prepare for a possible evacuation and implement the
appropriate emergency backup procedures. However, with the power outage in the cab and the
tower evacuated, there would have been some anxious moments for Flight 580 as they attempted
to make contact with air traffic control during and just after the tornado touched down on the east
end of the DAB complex.
Lessons Learned from This Event and Issues that Remain Unresolved
In the field of safety, the National Safety Council (2013) defines a near-miss as:
…an unplanned event that did not result in injury, illness, or damage – but had the
potential to do so. Only a fortunate break in the chain of events prevented an
injury, fatality or damage; in other words, a miss that was nonetheless very near.
In the case of the Embry-Riddle campus, the “fortunate break” was a temporal one (semester
break). At the airport, it was a power outage in the DAB TRACON that caused Comair Flight
580 to lose contact just long enough that the flight continued southward instead of turning
towards final approach into DAB’s terminal airspace, and that the tornado did not touch down in
the passenger terminal area.
In the aftermath of the tornado, the Embry-Riddle leadership deployed a number of
measures to help ensure that campus personnel are kept safe during a severe-weather event. The
most visible of these measures is an automated calling/electronic alerting system that was
implemented in 2009. The current version, known as RAVE, is used for emergency notification
(http://www.ravemobilesafety.com/rave-alert/).
88
Journal of Aviation/Aerospace Education & Research, Vol. 25, No. 2 [2016], Art. 3
https://commons.erau.edu/jaaer/vol25/iss2/3DOI: https://doi.org/10.15394/jaaer.2016.1690

The RAVE system alerts users through voice, text, email, and messaging directly to the
desktop computer in case of an emergency. Students, faculty, and staff are required to provide
emergency contact information to the university and are strongly encouraged to sign up for the
RAVE notification system. Many universities use similar systems to disseminate critical
information during emergencies. Sherman-Morris (2009) documented the results of a campus-
wide survey in the aftermath of a tornado near-miss at Mississippi State University in January
2008. Her study showed that 85% of the respondents knew of the possibility of severe weather
through the emergency alert messaging system, along with more traditional methods such as
interpersonal communication and television. Her study illustrated the importance of the last two
methods in maintaining a high level of preparedness regarding approaching severe weather.
A second initiative, which was completed in August 2015, was the designation of the
Embry-Riddle campus as Storm Ready by the Melbourne NWSFO. The Storm Ready program
(http://www.stormready.noaa.gov) is a part of the NWS Weather-Ready Nation initiative
(National Weather Service [NWS], 2013), which endeavors to build “…community resilience in
the face of increasing vulnerability to extreme weather and water events”. In part, Storm Ready
certification is achieved through accomplishment of the following tasks:
Establish a 24-hour warning point and emergency operations center.
Have more than one way to receive severe weather warnings and forecasts and to alert
the public.
Create a system that monitors weather conditions locally.
Promote the importance of public readiness through community seminars.
Develop a formal hazardous weather plan, which includes training severe weather
spotters and holding emergency exercises. (http://www.nws.noaa.gov/stormready/)
89
Lanicci: The Tornado that Struck Embry-Riddle
Published by Scholarly Commons, 2016

Embry-Riddle now joins 14 other colleges/universities and 157 organizations/agencies across the
state of Florida in reaching this certification.
There was a great deal of media attention focused on the absence of the NWRs in the
DAB tower after the tornado. The prohibition on NWRs was lifted at the end of May 2007
(Turner, 2007). However, subsequent severe-weather events over the last 9 years at airports
around the U.S. have revealed gaps in communication, warning dissemination, and awareness at
multiple levels in the operations of several major airports (e.g., Freedman, 2011; Ellis, 2015).
The most notable of these occurred when a tornado hit Lambert St. Louis International Airport
(STL) on 22 April 2011 and produced extensive damage in the terminal area (NWS, 2011). This
tornado, rated as EF4, blew out windows in the terminal building and tore off large pieces of the
roof.
In the aftermath of this case, the NWS Service Assessment (NWS, 2011) noted that
although there was a 34-minute lead-time on this tornado warning, there were also major
deficiencies in dissemination and preparedness:
Finding D-4a: Preparedness activities and action plan procedures for the Lambert St.
Louis International Airport were minimal and ineffective for this event.
Finding D-4b: People in the concourses of the Lambert St. Louis International Airport did
not take cover until they observed winds increasing significantly outside the concourse
windows. While airport procedures were to announce warnings in the airport terminal
per airport policy, each airline had its own emergency plan for the concourses; however,
many airport patrons commented they received no information on the storm whether they
were in the main terminal or in a concourse.
90
Journal of Aviation/Aerospace Education & Research, Vol. 25, No. 2 [2016], Art. 3
https://commons.erau.edu/jaaer/vol25/iss2/3DOI: https://doi.org/10.15394/jaaer.2016.1690

Finding D-4c: FAA personnel did not evacuate the Lambert Field tower until 8:08 p.m.,
when their manager called to convey the warning she saw on television. This was 32
minutes after the warning issuance and 2 minutes before the tornado struck the airport.
Recommendation D-4: WFOs (weather forecast offices) should work closely with airport
personnel in their CWA (county warning area) to encourage timely and comprehensive
severe weather operating procedures, including a solid means for receiving,
disseminating, and responding to warnings. Periodic drills and simulations should be
conducted to ensure procedures are adequate. (pp. D-7–D-8)
The STL tornado event revealed the inadequacies of procedures for preparedness and
dissemination of critical information. Fortunately, as in the Daytona Beach tornado case, there
were no fatalities or serious injuries from the STL tornado. It is only a matter of time before a
similar event occurs in which there is significant loss of life—unless awareness and preparedness
procedures are improved.
One of the ongoing challenges in an environment such as a college campus or an airport
is the constant turnover of people, whether students or transient passengers. As a result, severe
weather awareness, which is not the same as preparedness, can be lacking. The
recommendations presented below can go a long way to increase both awareness as well as
preparedness.
“Aware, Prepare, Protect, and Recover”
A Process Patterned After the Four Stages of Emergency Management
The dictionary definition of awareness is “knowledge or understanding of a subject,
issue, or situation” (“Awareness,” n.d.). By contrast, preparedness is “the state of being ready
91
Lanicci: The Tornado that Struck Embry-Riddle
Published by Scholarly Commons, 2016

for something” (“Preparedness,” n.d.). In order to be prepared for a situation such as severe
weather, one needs to be aware of the possibility that the event can occur.
How does one increase an individual’s awareness of certain types of weather
phenomena? In some respects, the issue of awareness may be related to certain aspects of
weather salience, studied by Stewart, Lazo, Morss, and Demuth (2012) and described by Stewart
(2009) as “the degree to which individuals attribute psychological value or importance to the
weather and the extent to which they are attuned to their atmospheric environments” (p. 1833).
Weather salience is important to those interests looking to improve the efficacy of weather and
climate products (Stewart et al., 2012). It is seen as one way to increase our understanding of
how individuals’ and groups’ perceptions of the weather influence the ways in which they pay
attention to, and take action on weather and climate information in their day-to-day lives.
It is proposed here that in order to increase both awareness and preparedness for severe
and tornadic thunderstorms in this part of Florida, an approach is needed that combines the four
phases of disaster preparation/emergency management (mitigation, preparedness, response, and
recovery) with the concepts inherent in the weather ‘forecast funnel’ process (Snellman, 1982).
A summary of the phases of emergency management, along with a discussion of the terminology
and lineage can be found in Baird (2010). The reason for employing the forecast funnel is that
the decreasing time and space scales inherent in the funnel can be joined to the awareness and
preparedness actions as the event draws closer. The balance of the paper is devoted to a
description of this approach, which is shown graphically in Figure 7.
92
Journal of Aviation/Aerospace Education & Research, Vol. 25, No. 2 [2016], Art. 3
https://commons.erau.edu/jaaer/vol25/iss2/3DOI: https://doi.org/10.15394/jaaer.2016.1690

Figure 7. Conceptual model of Severe-Storm Awareness/Preparedness program patterned after
four stages of emergency management and the weather forecast funnel process. Proactive phase
refers to all actions taken before a severe-weather event (up to several months in advance), until
the event is imminent (hours before). Reactive phase refers to all actions taken after the event
has occurred, from immediate recovery (hours to days after the event) to long-term recovery and
determination of lessons learned as conditions are returned to normal.
“Aware” - Mitigation and Climatology
The program begins in the mitigation phase of emergency management. Here, a long-
term strategy is undertaken to lower the risk exposure to a hazard (see specifics at
http://www.fema.gov/what-mitigation). Given that mitigation is a long-term process, it makes
sense to link it to the large end of the forecast funnel, when one examines relevant climatological
information before beginning the task of making the forecast itself.
An example in the present case would be seasonal awareness of tornado climatology in
Florida. To develop that awareness, there are two product sources that can be used. The first is
SPC’s Severe Weather Climatology page, which provides occurrence frequencies for seven
categories of severe weather for each week of the year, using historical data from 1982 to 2011
(http://www.spc.noaa.gov/new/SVRclimo/climo.php?parm=anySvr). Figure 8 shows an
93
Lanicci: The Tornado that Struck Embry-Riddle
Published by Scholarly Commons, 2016

example of the SPC Severe Weather Climatology; this is a probability of tornado occurrence for
the continental U.S. for the week of 23 December.
This chart illustrates that while tornadoes in late December are relatively rare or non-
existent over most of the continental U.S., there are parts of the country (including Florida)
where they have occurred historically. Portions of Florida are in the lightest shading of tornado
probability (0.1%).
Figure 8. Climatological tornado probability for the week ending 23 December, based on 30
years of data. Probability shown by various shadings is for a tornado to occur within 25 miles of
any given point in the continental U.S. It is important to consider these climatological
probabilities when evaluating SPC forecast probabilities, because at first glance, forecast
probabilities of 5, 10, or 15% would not seem that large until compared to those in charts such as
this one. Note. Chart courtesy of SPC and National Severe Storms Laboratory
(http://www.spc.noaa.gov/new/SVRclimo/climo.php?parm=allTorn).
94
Journal of Aviation/Aerospace Education & Research, Vol. 25, No. 2 [2016], Art. 3
https://commons.erau.edu/jaaer/vol25/iss2/3DOI: https://doi.org/10.15394/jaaer.2016.1690
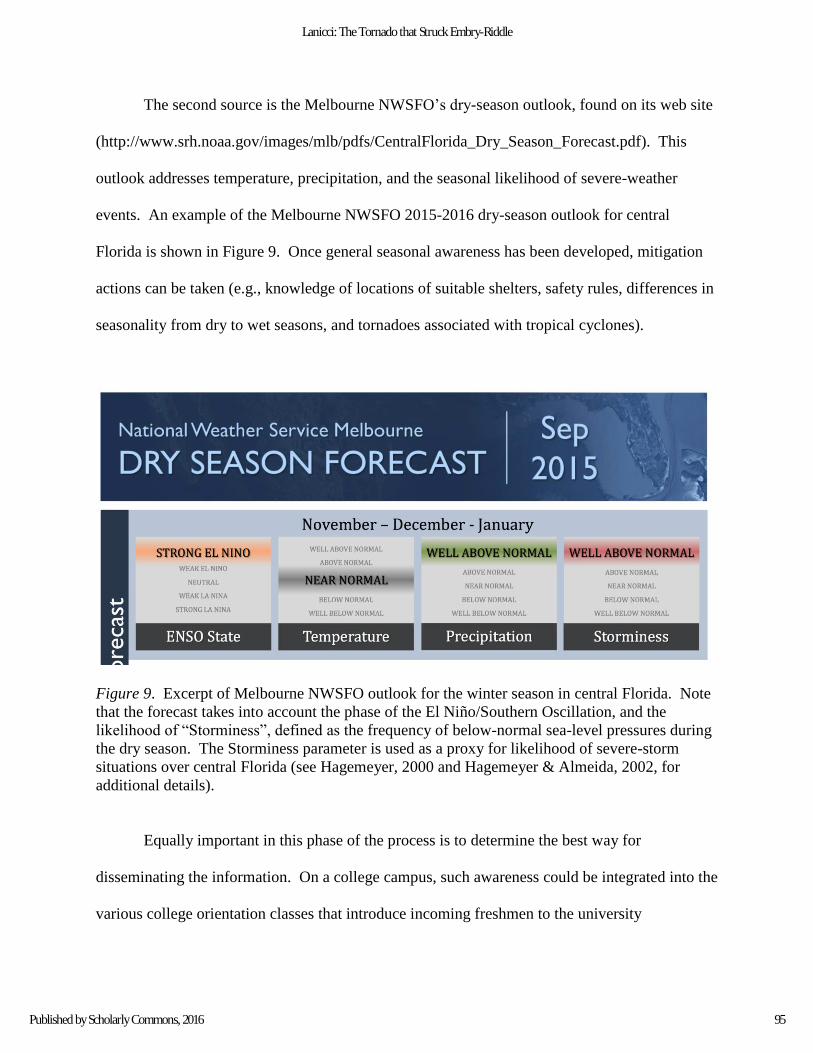
The second source is the Melbourne NWSFO’s dry-season outlook, found on its web site
(http://www.srh.noaa.gov/images/mlb/pdfs/CentralFlorida_Dry_Season_Forecast.pdf). This
outlook addresses temperature, precipitation, and the seasonal likelihood of severe-weather
events. An example of the Melbourne NWSFO 2015-2016 dry-season outlook for central
Florida is shown in Figure 9. Once general seasonal awareness has been developed, mitigation
actions can be taken (e.g., knowledge of locations of suitable shelters, safety rules, differences in
seasonality from dry to wet seasons, and tornadoes associated with tropical cyclones).
Figure 9. Excerpt of Melbourne NWSFO outlook for the winter season in central Florida. Note
that the forecast takes into account the phase of the El Niño/Southern Oscillation, and the
likelihood of “Storminess”, defined as the frequency of below-normal sea-level pressures during
the dry season. The Storminess parameter is used as a proxy for likelihood of severe-storm
situations over central Florida (see Hagemeyer, 2000 and Hagemeyer & Almeida, 2002, for
additional details).
Equally important in this phase of the process is to determine the best way for
disseminating the information. On a college campus, such awareness could be integrated into the
various college orientation classes that introduce incoming freshmen to the university
95
Lanicci: The Tornado that Struck Embry-Riddle
Published by Scholarly Commons, 2016

environment. For a collegiate aviation program, it is recommended that seasonal weather
awareness presentations and/or briefings be given to flight instructors, students, and staff. This
is a common practice in the military community, where the majority of base/post personnel are
transient (2–3 years per assignment). This level of awareness is critical for force protection.
“Prepare” - Preparedness and Medium-Range Forecasts
The next step of the process is preparedness on multiple time and spatial scales. Many
individuals may be unaware of the medium-range (days 4-8) severe-storm forecasts that have
been available from SPC for several years now. In the present case, the SPC first identified the
possibility of severe weather over the Florida peninsula a little over 72 hours in advance of 25
December (Figure 10). If one already has the seasonal awareness concerning severe weather
from the previous phase, the routine of looking at the SPC 1, 2, 3, and 4-8 Day Severe Storm
Outlooks is not a huge time investment, and the product can be checked daily to determine if the
forecast is staying consistent from one day to the next.
Figure 10. SPC Medium-range Severe-storm Outlook for Days 4-8. Note. Obtained from SPC
Severe Weather Events Archive (http://www.spc.noaa.gov/exper/archive/events/).
96
Journal of Aviation/Aerospace Education & Research, Vol. 25, No. 2 [2016], Art. 3
https://commons.erau.edu/jaaer/vol25/iss2/3DOI: https://doi.org/10.15394/jaaer.2016.1690

Given the uncertainties associated with tornado prediction, there are still actions that can
be taken in the days leading up to an event. It would not have been practical to evacuate the
university’s training aircraft to another location, as would have been done for an approaching
hurricane. There were, however, other appropriate precautions that could have been taken to
ensure that the campus environment was prepared for the possibility of severe weather (e.g.,
updating emergency contact information, stocking up on supplies in case of power outages,
possible use of high-stress tie-down chains for aircraft on the parking ramp).
“Prepare” – Preparedness, Short-Range Forecasts, Watches, and Warnings
The Day 1 Convective Outlook, issued during the evening of 24 December (see Figures
11a and 11b), gives the probabilities of specific types of severe weather such as tornadoes, wind,
and hail. The percentages, though small, are significant when compared to climatological
probabilities for the given time of the year. A comparison of the forecast tornado probabilities in
Figure 11a (> 5%) with the climatological probabilities in Figure 8 (> 0.1%) shows that the
probability of tornadoes over Florida on the 25th was 50 times greater than climatology for that
time of year.
(a) (b)
Figure 11. As in Figure 10, except for Day 1, which is issued at approximately 1:00 a.m., and is
valid for 24 hours beginning at 7:00 a.m. Panel (a) shows probability of tornado occurrence
within 25 miles of any given point in the outlined area. Panel (b) is similar to (a), except for
severe-thunderstorm wind. Note. Obtained from SPC Severe Weather Events Archive
(http://www.spc.noaa.gov/exper/archive/events/).
97
Lanicci: The Tornado that Struck Embry-Riddle
Published by Scholarly Commons, 2016

On the morning of the tornado event, severe thunderstorm winds and tornadoes had already
been reported in parts of Georgia, so the SPC severe-thunderstorm and tornado watches in effect
for that day (see Figure 12) were based on both NEXRAD indicators and observed storm reports
from the field (SPC Severe Weather Events Archive, n.d.). As the squall line moved onshore north
of the Tampa Bay area around 11:00 a.m., the local NWSFOs began issuing tornado and severe-
thunderstorm warnings for storm-sized areas within the tornado watch. Figure 13 shows a
summary of the individual tornado and severe-thunderstorm warnings issued by both the Tampa
and Melbourne NWSFOs, and illustrates some interesting aspects of this event.
(a) (b)
Figure 12. Red polygons denote Tornado Watches #882 (Panel a) and #884 (Panel b) issued by
SPC on the day of the event, with NEXRAD mosaic overlay. The first watch did not include
east-central Florida, but the second one, valid from 10:05 a.m. to 5:00 p.m., did. The start time
for Watch #884 provided some 3½ hours lead-time for the Daytona Beach tornado. Note.
Obtained from Iowa Environmental Mesonet (n.d.).
Although forecasters were aware of the favorable conditions for severe weather on the
peninsula three days in advance, issuing warnings for individual storms proved to be extremely
challenging, as evidenced by the number of warnings that had no observed severe-storm reports in
them (false alarms). In the case of these storm-based warnings, NEXRAD severe-storm detection
98
Journal of Aviation/Aerospace Education & Research, Vol. 25, No. 2 [2016], Art. 3
https://commons.erau.edu/jaaer/vol25/iss2/3DOI: https://doi.org/10.15394/jaaer.2016.1690

algorithms and characteristic signatures in the reflectivity and storm-relative velocity fields gave
strong indications of either cell rotation, strong low-level winds in the thunderstorm’s gust front, or
both.
Figure 13. Tornado and severe-thunderstorm warnings and reports for 11:00 a.m.–3:00 p.m. on
25 December. Tornado warning areas are shaded red, severe-thunderstorm warning areas are
shaded yellow, and start times are shown in white along bottom boundary of polygon. Severe-
thunderstorm wind reports are shown by yellow balloons with TSTM WND DMG label; times
are in yellow italics. Tornado reports are shown by red balloons with TORNADO label; start
times are in red italics. Note. Graphic was created using data from the Iowa Environmental
Mesonet (n.d.) and placing it into Google Earth™.
Once the timeframe is under 24 hours, additional precautions can be taken, such as
putting emergency personnel on standby and moving equipment indoors, as the need arises. As
11:20 a.m. 11:20 a.m.
11:47 a.m.
12:20 p.m.
1:22 p.m.
1:40 p.m.
99
Lanicci: The Tornado that Struck Embry-Riddle
Published by Scholarly Commons, 2016

stated earlier, the SPC issued the tornado watch covering Daytona Beach some 3½ hours prior to
the tornado touchdown. At this point, monitoring NWR, television, NWS and other weather
information sources, and taking other precautionary actions could be accomplished. Given that
the parent thunderstorm that produced the Daytona tornado already had a history of severe
weather, the issuance of the tornado warning at 1:25 p.m. would be sufficient cause for preparing
to go to shelter and taking other protective actions as the storm approached. It is at this point and
the response phase that follows, that the forecast funnel is at its narrowest point in the sense that
real-time observations and nowcasts are used to protect personnel, equipment, and property.
“Protect and Recover” – Response, Recovery, and the Need for Additional Weather
Information
Embry-Riddle employed its post-tropical cyclone response and recovery methods in the
hours and days following the event. First among the actions taken in the response phase was
activating the university’s Crisis Management Team and securing the campus in order to prevent
people coming onto campus, trying to help, and getting injured. The Crisis Management Team
met regularly during the response phase and the start of the recovery phase; it consisted of
representatives from the Flight Department, Building and Grounds, University Construction and
Planning, Campus Safety and Security, University Safety, Information Technology, Academics,
and Communications (Connolly, 2007).
In addition to damage assessment, developing a sound communications protocol was one
of the most important parts of the response phase. Because the tornado hit on a holiday, the main
issues were the building damage and destruction of the university’s fleet of training aircraft.
Furthermore, the university received an inundation of information requests from media outlets,
students on break, and companies wanting to offer assistance. According to then-Chancellor Dr.
100
Journal of Aviation/Aerospace Education & Research, Vol. 25, No. 2 [2016], Art. 3
https://commons.erau.edu/jaaer/vol25/iss2/3DOI: https://doi.org/10.15394/jaaer.2016.1690
Tom Connolly, “…everybody wants to know what’s going on and everybody means the
community, students, faculty, parents, everybody” (Connolly, 2007).
An additional challenge came from the world of social media. The chancellor asked the
associate dean of students to go online via Facebook®
…and start putting the word out to our students who were all home for Christmas holiday
and would be wondering what was going on. That turned out to be one of the most
important of all our communication links. I think that within the first couple of days we
had over two thousand hits. (Connolly, 2007)
Over the next several weeks, the damaged and destroyed aircraft were replaced with short-term
leased aircraft provided by Cessna, the Experimental Aircraft Association, and several Embry-
Riddle alumni (Connolly, 2007). The start of spring semester classes was delayed by only one
week.
In the response phase, both short- and medium-range weather forecasts are critical to
ensure the safety of those tasked with damage repair, debris cleanup, and equipment salvage.
In the recovery phase, the meteorological view begins to widen, since recovery actions
may involve new building construction, major repairs and renovations to existing structures, and
similar activities. At this stage, knowledge of climatology once again becomes crucial in order
to keep projects on schedule and protect workers from weather hazards such as high winds,
lightning, flooding rains, severe weather, and tropical systems.
Recovery also involves institution of new and revised procedures for personnel entrusted
with maintaining campus safety and security. Among the new and revised procedures instituted
on campus in this phase were periodic severe-weather drills, links to severe-weather information
on the university’s computer portal, and a listing of severe-weather procedures in the university’s
Disaster and Emergency Management/Recovery Plan (Embry-Riddle Aeronautical University,
101
Lanicci: The Tornado that Struck Embry-Riddle
Published by Scholarly Commons, 2016

2015). Additionally, a number of students and faculty were certified as SKYWARN storm
spotters by personnel from the Melbourne NWSFO, taking advantage of the basic and advanced
classes offered in Volusia County every year
(http://www.srh.noaa.gov/images/mlb/pdfs/skywarnclasses.pdf).
Conclusions
This research provides a case-study analysis to the literature on east-central Florida severe
thunderstorms and tornadoes. It complements the climatological studies by showing that the pre-
outbreak conditions were consistent with stability and wind-shear conditions favorable for dry-
season tornado events in Florida. There is a need for further case studies of these types of events,
since they have the potential to be deadly, as evidenced by the February 1998, and 2007
Groundhog Day events. Lanicci (2016) discusses the lethality of Florida peninsula dry-season
tornado events in detail. His study outlines three factors that contribute to their lethality: (a) a large
winter-season transient population unfamiliar with Florida tornado climatology; (b) an inventory of
mobile homes that is above the national average; and (c) a disproportionate fraction of dry-season
tornadoes occurring during the evening and overnight hours.
In addition to the meteorological elements of this case, a number of important lessons were
learned from two near-misses that occurred on the Embry-Riddle campus and at the airport. At the
airport, power outages combined with a lack of awareness of the NWS tornado warning to
potentially put an arriving commercial flight and terminal passengers in unnecessary danger.
Despite the fact that the crew of Comair Flight 580 were able to reach the DAB tower and conduct
a safe arrival, they came within 6 nm of the leading edge of the squall line after being redirected
northward by air traffic controllers, which is a tight margin for safety. Subsequent severe-weather
102
Journal of Aviation/Aerospace Education & Research, Vol. 25, No. 2 [2016], Art. 3
https://commons.erau.edu/jaaer/vol25/iss2/3DOI: https://doi.org/10.15394/jaaer.2016.1690

events, such as the STL tornado in 2011, have pointed to a need to establish clearer and more
efficient means to disseminate important severe-weather information to people in the terminal area.
At Embry-Riddle, there were several important lessons learned from an event that could
have easily exposed a total of nearly 500 faculty, staff, and students to an F2 tornado that went
through the center of campus. First, seasonal awareness of weather hazards must be instilled
among campus personnel. This is particularly important in an environment with the high turnover
rate of a college campus. Second, an effective way for disseminating the necessary information
must be developed and implemented. Such methods can include warning systems such as reverse-
calling and seasonal awareness briefings to the flight department and to students in their orientation
classes.
An appropriate source for relevant forecast products must be found and utilized. In the
present case, the SPC produces forecast products that span from 8 days to 12 hours, and also issues
watches that can provide appropriate campus agencies such as the safety department with enough
lead time to take protective actions. On the storm scale, the NWSFOs issue warnings that can be
disseminated through a number of means, such as the reverse calling program mentioned above.
Having the appropriate means to organize and respond to the event in real time is also very
important; the university was able to adapt its tropical cyclone emergency actions to this situation.
However, having specific protocols that are tailored for responding to different types of natural and
other types of disasters is optimum.
Acknowledgments
There are a number of individuals who were very helpful during this study. Dr. Frederick
Mosher and Dr. Christopher Herbster of the Embry-Riddle Meteorology program provided many
fruitful discussions of this case, and Dr. Mosher in particular obtained the valuable DAB
103
Lanicci: The Tornado that Struck Embry-Riddle
Published by Scholarly Commons, 2016

LLWAS data from Mr. Chris Turner of the FAA. Ms. Nance Koslik analyzed photos and
aircraft-parking diagrams to produce preliminary damage trajectory maps that documented the
initial tornado touchdown on the Embry-Riddle campus, and also contacted the Volusia County
Sheriff’s Office to obtain pertinent information about 911 calls and responses related to the
tornado. Ms. Tina Clark from the Embry-Riddle Campus Safety Department provided the Event
Report described in this study. Finally, Ms. Yvonne Terry from the Embry-Riddle Registrar’s
Office provided class enrollment and location information for the fall semester 2006, which
allowed the author to produce the personnel exposure estimates contained in this study.
104
Journal of Aviation/Aerospace Education & Research, Vol. 25, No. 2 [2016], Art. 3
https://commons.erau.edu/jaaer/vol25/iss2/3DOI: https://doi.org/10.15394/jaaer.2016.1690
References
Awareness. (n.d.). In Macmillan Online Dictionary. Retrieved from
http://www.macmillandictionary.com/us/dictionary/american/awareness
Baird, M. E. (2010, January). The “phases” of emergency management. Background Paper
Prepared for the Intermodal Freight Transportation Institute (IFTI), University of
Memphis.
Brown, A. (2007, Spring). A whirlwind recovery. Lift, the alumni magazine of Embry-Riddle
Aeronautical University, 8-12. Retrieved from http://lift.erau.edu/wp-content/uploads/lift-
2007-spring.pdf
Connolly, T. (2007, February 28). Interview by R. Rockett [video]. Retrieved from
http://dbheritage.erau.edu:8080/webcat/request/DoMenuRequest?SystemName=Universit
y+Archives&UserName=WebArchives+public&Password=&TemplateProcessID=6000_
1051_6086&bCachable=1&MenuName=Public%20Search%202
Ellis, R. (2015, May 7). Delta passengers left stranded during tornado warning. The Oklahoman.
Retrieved from http://newsok.com/article/5417147
Embry-Riddle Aeronautical University. (2015, June). Disaster and Emergency
Management/Recovery Plan. Embry-Riddle Aeronautical University, Daytona Beach, FL.
Retrieved from https://ernie.erau.edu/Departments/University-Safety-Office/emergency-
management/Documents/disaster-emergency-management-recovery-
plan.pdf#search=Disaster%20and%20Emergency%20Management%2FRecovery%20Plan
Embry-Riddle Institutional Research. (n.d.). Factbook – Enrollment, Daytona Beach campus.
Retrieved from http://ir.erau.edu/Factbook/Enrollment/
105
Lanicci: The Tornado that Struck Embry-Riddle
Published by Scholarly Commons, 2016

Erickson, S. A., & Brooks, H. E. (2006). Lead time and time under tornado warnings: 1986 –
2004. Paper presented at the 23rd Conference on Severe Local Storms, St. Louis, MO.
American Meteorological Society.
Federal Aviation Administration (FAA). (1989). Siting guidelines for low level windshear alert
system (LLWAS) remote facilities. Technical Order 6560.21A. Retrieved from
http://www.faa.gov/documentLibrary/media/Order/6560.21A.pdf
Freedman, A. (2011, May 16). Despite warning, St. Louis tornado caught airport, passengers off
guard. The Washington Post. Retrieved from
https://www.washingtonpost.com/blogs/capital-weather-gang/post/despite-warning-st-
louis-tornado-caught-airport-passengers-off-guard/2011/05/13/AFYkhX2G_blog.html
Fujita, T. T. (1971). Proposed characterization of tornadoes and hurricanes by area and
intensity. (Satellite and Mesometeorology Research Project [SMRP] Research Paper No.
91). University of Chicago, Dept. of Geophysical Sciences.
Fujita, T. T. (1978). Manual of downburst identification for project NIMROD. (SMRP Research
Paper No. 156). University of Chicago, Dept. of Geophysical Sciences.
Fujita, T. T. (1985). The downburst - Microburst and macroburst. (SMRP Research Paper No.
210). University of Chicago, Dept. of Geophysical Sciences.
Griggs, M. (2007, April 12). Daytona-bound flight almost flew into tornado. Daytona Beach
News Journal, pp. A1, A8.
Hagemeyer, B. C. (1997). Peninsular Florida tornado outbreaks. Weather and Forecasting, 12,
pp. 399–427. http://dx.doi.org/10.1175/1520-0434(1997)012<0399:PFTO>2.0.CO;2
106
Journal of Aviation/Aerospace Education & Research, Vol. 25, No. 2 [2016], Art. 3
https://commons.erau.edu/jaaer/vol25/iss2/3DOI: https://doi.org/10.15394/jaaer.2016.1690
Hagemeyer, B. C. (1998). Significant extratropical tornado occurrences in Florida during
strong El Niño and strong La Niña events. Paper presented at 19th Conference on Severe
Storms, Minneapolis, MN. American Meteorological Society, pp. 412–415.
http://dx.doi.org/10.1175/1520-0434(1997)012<0399:PFTO>2.0.CO;2
Hagemeyer, B. C. (2000). Development of a low pressure index as a proxy for dry season severe
weather in Florida and its relationship with ENSO. Paper presented at the 15th
Conference on Probability and Statistics, Asheville, NC. American Meteorological
Society, pp. J22–25.
Hagemeyer, B. C., & Almeida, R. A. (2002). Experimental forecasting of dry season storminess
over Florida and the southeast United States from the ENSO signal using multiple linear
regression techniques. Paper presented at the 16th Conference on Probability and
Statistics in the Atmospheric Sciences, Orlando, FL. American Meteorological Society,
p. J3.10.
Hagemeyer, B. C., & Schmocker, G. K. (1991). Characteristics of east central Florida tornado
environments. Weather and Forecasting, 6, pp. 499–514. http://dx.doi.org/10.1175/1520-
0434(1991)006<0499:COECFT>2.0.CO;2
Iowa Environmental Mesonet. (n.d.). Valid Time Event Code (VTEC) Browser. Retrieved from
https://mesonet.agron.iastate.edu/archive/
Lanicci, J. M. (2016). A multi-scale analysis of the atmospheric conditions associated with the
Daytona Beach tornado of Christmas Day, 2006. Electronic Journal of Severe Storms
Meteorology. In revision.
Markowski, P., & Richardson, Y. (2010). Mesoscale meteorology in midlatitudes. Chichester:
Wiley-Blackwell. http://dx.doi.org/10.1002/9780470682104
107
Lanicci: The Tornado that Struck Embry-Riddle
Published by Scholarly Commons, 2016

Melbourne National Weather Service Forecast Office (Melbourne NWSFO). (2006). Christmas
Day tornadoes. Retrieved from http://www.srh.noaa.gov/mlb/?n=122506
Melbourne National Weather Service Forecast Office (Melbourne NWSFO). (2007). The
Groundhog Day tornado outbreak - February 2, 2007. Post storm damage surveys &
summaries. Retrieved from http://www.srh.noaa.gov/mlb/?n=surveys
National Air Traffic Control Association (NATCA). (2006, December 28). FAA ban on weather
communications equipment and radios compromises safety of its employees and the
flying public. Press Release. Retrieved from
http://natca.ulwweb.com/press_releases.aspx?aID=1763
National Center for Atmospheric Research. (2012). Wind shear hazards to aviation operations –
Wind shear program background, overview, and alert interpretation. Research
Applications Lab, National Center for Atmospheric Research, Boulder, CO. Retrieved
from
https://www.ral.ucar.edu/sites/default/files/public/images/aap/windshear_systems_backgr
ound_presentation.pdf
National Climatic Data Center. (2006, December). Storm Data, 48(12). Retrieved from
http://www.ncdc.noaa.gov/IPS/sd/sd.html
National Safety Council. (2013). Near miss reporting systems. Retrieved from
http://www.nsc.org/WorkplaceTrainingDocuments/Near-Miss-Reporting-Systems.pdf
National Weather Service (NWS). (2011, December). Service Assessment - The Historic
Tornadoes of April 2011. Retrieved from
http://www.nws.noaa.gov/om/assessments/pdfs/historic_tornadoes.pdf
108
Journal of Aviation/Aerospace Education & Research, Vol. 25, No. 2 [2016], Art. 3
https://commons.erau.edu/jaaer/vol25/iss2/3DOI: https://doi.org/10.15394/jaaer.2016.1690
National Weather Service (NWS). (2013, April 17). Weather-ready nation roadmap, version 2.0.
Retrieved from
http://www.nws.noaa.gov/com/weatherreadynation/files/nws_wrn_roadmap_final_april1
7.pdf
Paxton, C. H., & Shepherd, J. M. (1993). Radar diagnostic parameters as indicators of severe
weather in central Florida. (NOAA Technical Memorandum NWS SR-149).
Preparedness. (n.d.). In Macmillan Online Dictionary. Retrieved from
http://www.macmillandictionary.com/us/dictionary/american/preparedness
Przybylinski, R. W. (1995). The bow echo: Observations, numerical simulations, and severe
weather detection methods. Weather and Forecasting, 10, pp. 203–218.
http://dx.doi.org/10.1175/1520-0434(1995)010<0203:TBEONS>2.0.CO;2
Sanders, F., & Gyakum, J. R. (1980). Synoptic-dynamic climatology of the “Bomb”. Monthly
Weather Review, 108, pp. 1589–1606. http://dx.doi.org/10.1175/1520-
0493(1980)108<1589:SDCOT>2.0.CO;2
Sherman-Morris, K. (2009). Tornado warning dissemination and response at a university
campus. Natural Hazards, 52(3), pp. 623–638. http://dx.doi.org/10.1007/s11069-009-
9405-0
Simmons, K. M., & Sutter, D. (2007). The Groundhog Day Florida tornadoes: A case study of
high-vulnerability tornadoes. (Quick Response Research Report 193). University of
Colorado Natural Hazards Center. Boulder, CO.
Snellman, L. W. (1982). Impact of AFOS on operational forecasting. Paper presented at the
Ninth Conference on Weather Forecasting and Analysis, Seattle, WA. American
Meteorological Society, pp. 13–16.
109
Lanicci: The Tornado that Struck Embry-Riddle
Published by Scholarly Commons, 2016

SPC Severe Weather Events Archive. (n.d.). Retrieved from
http://www.spc.noaa.gov/exper/archive/events/
Stewart, A. E. (2009). Minding the weather: The measurement of weather salience. Bulletin of
the American Meteorological Society, 90, pp. 1833–1841.
http://dx.doi.org/10.1175/2009BAMS2794.1
Stewart, A. E., Lazo, J. K., Morss, R. E., & Demuth, J. L. (2012). The relationship of weather
salience with the perceptions and uses of weather information in a nationwide sample of
the United States. Weather, Climate, and Society, 4, pp. 172–189.
http://dx.doi.org/10.1175/WCAS-D-11-00033.1
Trapp, R. J., Tessendorf, S. A., Godfrey, E. S., & Brooks, H. E. (2005). Tornadoes from squall
lines and bow echoes. Part I: Climatological distribution. Weather and Forecasting, 20,
pp. 23–34. http://dx.doi.org/10.1175/WAF-835.1
Trapp, R. J., & Weisman, M. L. (2003). Low-level mesovortices within squall lines and bow
echoes. Part II: Their genesis and implications. Monthly Weather Review, 131, pp. 2804–
2823. http://dx.doi.org/10.1175/1520-0493(2003)131<2804:LMWSLA>2.0.CO;2
Turner, K. (2007, July 4). FAA to allow weather radios in control towers [Web blog post].
Retrieved from
http://blog.cleveland.com/metro/2007/07/faa_to_allow_weather_radios_in.html
Wasula, A. C., Bosart, L. F., Schneider, R., Weiss, S. J., Johns, R. H., Manikin, G. S., & Welsh,
P. (2007). Mesoscale aspects of the rapid intensification of a tornadic convective line
across central Florida: 22–23 February 1998. Weather and Forecasting, 22, pp. 223–243.
http://dx.doi.org/10.1175/WAF977.1
110
Journal of Aviation/Aerospace Education & Research, Vol. 25, No. 2 [2016], Art. 3
https://commons.erau.edu/jaaer/vol25/iss2/3DOI: https://doi.org/10.15394/jaaer.2016.1690

Weisman, M. L., & Trapp, R. J. (2003). Low-level mesovortices within squall lines and bow
echoes. Part I: Overview and dependence on environmental shear. Monthly Weather
Review, 131, pp. 2779–2803. http://dx.doi.org/10.1175/1520-
0493(2003)131<2779:LMWSLA>2.0.CO;2
Widham, M., Freshwaters, R., Clark, T., & Thing, P. (2006). Safety Report. Case No. 060814.
Embry-Riddle Aeronautical University Safety Department.
Williams, E., Boldi, B., Matlin, A., Weber, M., Hodanish, S., Sharp, D., …Buechler, D. (1999).
The behavior of total lightning activity in severe Florida thunderstorms. Atmospheric
Research, 51, 3-4, pp. 245–265. http://dx.doi.org/10.1016/S0169-8095(99)00011-3
Wind Science and Engineering Center. (2006). Enhanced Fujita scale. Texas Tech University,
Lubbock, TX.
111
Lanicci: The Tornado that Struck Embry-Riddle
Published by Scholarly Commons, 2016