the superintendent’s recommended operating budget and
TRANSCRIPT

Montgomery County Public Schools, Rockville, Maryland
Recommended to the Board of Education December 2016
Fiscal and School Year Ending June 30, 2018
Jack R. Smith, Ph.D. Superintendent of Schools
www.montgomeryschoolsmd.org/budget
FY 2018Operating Budget
The Superintendent’s Recommended
Operating Budget and Personnel Complement

montgomeryschoolsmd.orgCheck out the MCPS website for more detailed information about the FY 2018 Operating Budget.
VISIONWe inspire learning by providing the greatest public education to each and every student.
MISSIONEvery student will have the academic, creative problem solving, and social emotional skills to be successful in college and career.
CORE PURPOSEPrepare all students to thrive in their future.
CORE VALUESLearning Relationships Respect Excellence Equity
Board of Education
Ms. Jeanette E. Dixon
Dr. Judith R. Docca
Mr. Michael A. Durso
Mrs. Shebra L. Evans
Mrs. Patricia B. O’Neill
Ms. Jill Ortman-Fouse
Mrs. Rebecca Smondrowski
Mr. Eric GuerciStudent Member
School Administration
Jack R. Smith, Ph.D.Superintendent of Schools
Maria V. Navarro, Ed.D.Chief Academic Officer
Kimberly A. Statham, Ph.D.Deputy Superintendent of School Support and Improvement
Andrew M. Zuckerman, Ed.D.Chief Operating Officer
850 Hungerford Drive Rockville, Maryland 20850 www.montgomeryschoolsmd.org
FISCAL YEAR 2018 OPERATING BUDGET TIMELINE
Superintendent Presents Recommended FY 2018 Operating Budget to Board of Education December 13, 2016
Sign-up for Board of Education Public Hearings December 14, 2016 through January 10, 2017
Board of Education Public Hearings-Auditorium January 5 & 11, 2017
Board of Education Budget Work Sessions January 17 & 19, 2017
Board of Education Action February 14, 2017
Board of Education Budget Transmittal to County Executive/Council (Required by March 1, 2017) March 1, 2017
County Executive Submits Proposed FY 2018 Operating Budget to Council March 15, 2017
County Council Budget Public Hearings April 2017
County Council Work Sessions April – May, 2017
County Council Budget Action June 1, 2017
Final Board of Education Action to Approve FY 2018 Operating Budget June 13, 2017
OPERATING BUDGET DOCUMENTSThe documents listed below enable citizens to understand the MCPS budget and how resources are used.
Budget in Brief—Provides detailed summary information on the budget and changes proposed in the Superintendent’s Recommended Operating Budget.
Superintendent’s Recommended Operating Budget (often called the management budget)—Shows budget resources by office, department, and other units. It includes references to the units that carry out each program, describes in detail the work of each unit, shows all budget changes, and includes performance measures for each operating unit, a glossary of budget terms, an index of all items, and a section describing how to understand the budget.
The Operating Budget Adopted by the Board of Education—Shows summary budget information, including changes to the Superintendent’s Recommended Operating Budget made by the Board of Education.
The Operating Budget Summary—Includes information based on the final budget appropriated by the County Council and approved by the Board of Education.
The Program Budget—Includes summaries of more than 70 programs across MCPS departments and offices. The programs are categorized to show how the budget is aligned with the Montgomery County Public Schools Strategic Planning Framework, Building Our Future Together.
Personnel Complement—Provides a detailed listing of all positions requested in the budget. The Program Budget, the Superintendent’s Recommended Operating Budget, and the Operating Budget Summary include personnel complements organized by program and unit, respectively.
Budgeted Staffing Guidelines—The Superintendent’s Recommended Operating Budget includes budgeted staffing guidelines for regular education and special education. These guidelines govern the allocation of personnel resources by school and special education disability.
Schools at a Glance—Provides a variety of information for each school, including programs from the Program Budget that are implemented at each school and personnel expenditures budgeted for each school. A separate document, Special Education at a Glance, is published to show special education resources at each school.
All of these publications are available on the MCPS website at www.montgomeryschoolsmd.org/departments/budget/

M A R Y L A N Dwww.montgomeryschoolsmd.org
850 Hungerford Drive ♦ Rockville, Maryland 20850
December 13, 2016
Dear Members of the Board of Education:
I am pleased to submit for your consideration my Fiscal Year (FY) 2018 Operating Budget recommendation for Montgomery County Public Schools (MCPS). I am recommending an FY 2018 Operating Budget of $2,519,848,012, which will help to build the foundation and structure that is needed to ensure that all MCPS students are ready to graduate from high school and are prepared to be successful in college and careers.
My recommendation includes an increase of $62,374,251 and 95.478 Full-time Equivalent (FTE) positions to fund the same level of services for a growing number of students, rising costs in operations, and strategic accelerators. Part of this increase is offset by savings of $24,678,901generated by program efficiencies and reductions. This additional, $62,374,251 represents a 2.5 percent increase in the operating budget compared to FY 2017.
In addition, this budget assumes that the Montgomery County Council will continue to fund $27,200,000 from the county’s Consolidated Other Post-employment Benefits Trust Fund to cover a portion of our retiree health benefits costs.
As we begin our discussions on the FY 2018 Operating Budget, it should be noted that our community continues to receive a strong return on the investment it makes in our students.For instance, consider the recent performance of the MCPS students:
• In the 2015–2016 school year, a total of 17,569 MCPS students took at least one Advanced Placement exam with 75.8 percent earning a college-ready score of 3.0 or higher;
• The Class of 2016 earned a 1631 average combined SAT score, surpassing both the national and state averages; and
• Our students in the Class of 2016 earned $343 million in college scholarships.
While MCPS has had a long history of high achievement for many students, not all students have been successful. There are groups of students who have not had the learning opportunities or reached learning levels that have prepared them to be successful in college, career, and community. These learning disparities fall most heavily on Black/African American students, Hispanic/Latino students, and students impacted by poverty. As the student population continues to grow, MCPS’ capacity to ensure the success of these children will define its success. We must act now to create a school system where academic success is not predictable by race, ethnicity, socioeconomic status, language or disability. Our commitment to equity in no way lessensour commitment to excellence. Our commitment is to raise to excellence those students who have not yet achieved at their highest potential.
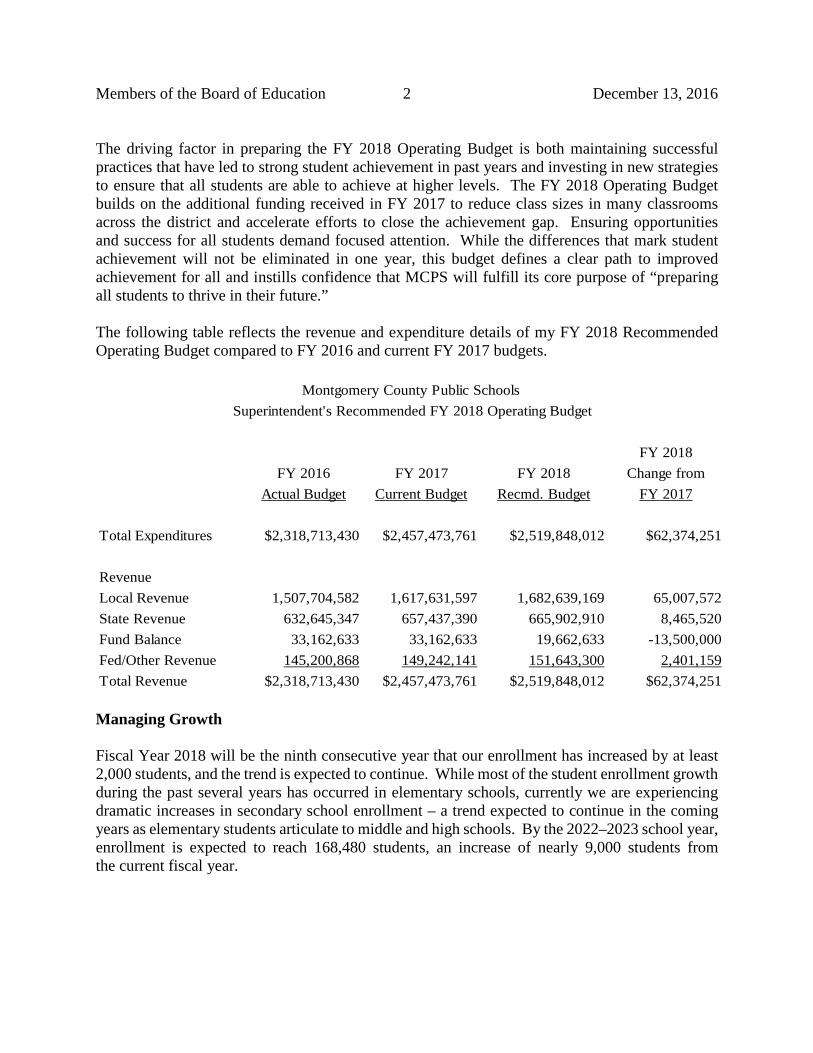
Members of the Board of Education 2 December 13, 2016 The driving factor in preparing the FY 2018 Operating Budget is both maintaining successful practices that have led to strong student achievement in past years and investing in new strategies to ensure that all students are able to achieve at higher levels. The FY 2018 Operating Budget builds on the additional funding received in FY 2017 to reduce class sizes in many classrooms across the district and accelerate efforts to close the achievement gap. Ensuring opportunities and success for all students demand focused attention. While the differences that mark student achievement will not be eliminated in one year, this budget defines a clear path to improved achievement for all and instills confidence that MCPS will fulfill its core purpose of “preparing all students to thrive in their future.” The following table reflects the revenue and expenditure details of my FY 2018 Recommended Operating Budget compared to FY 2016 and current FY 2017 budgets.
FY 2018FY 2016 FY 2017 FY 2018 Change from
Actual Budget Current Budget Recmd. Budget FY 2017
Total Expenditures $2,318,713,430 $2,457,473,761 $2,519,848,012 $62,374,251
RevenueLocal Revenue 1,507,704,582 1,617,631,597 1,682,639,169 65,007,572State Revenue 632,645,347 657,437,390 665,902,910 8,465,520Fund Balance 33,162,633 33,162,633 19,662,633 -13,500,000Fed/Other Revenue 145,200,868 149,242,141 151,643,300 2,401,159Total Revenue $2,318,713,430 $2,457,473,761 $2,519,848,012 $62,374,251
Montgomery County Public Schools Superintendent's Recommended FY 2018 Operating Budget
Managing Growth Fiscal Year 2018 will be the ninth consecutive year that our enrollment has increased by at least 2,000 students, and the trend is expected to continue. While most of the student enrollment growth during the past several years has occurred in elementary schools, currently we are experiencing dramatic increases in secondary school enrollment – a trend expected to continue in the coming years as elementary students articulate to middle and high schools. By the 2022–2023 school year, enrollment is expected to reach 168,480 students, an increase of nearly 9,000 students from the current fiscal year.
Members of the Board of Education 3 December 13, 2016
In order to manage our expected student enrollment growth, my budget recommendation adds more than 226 FTE positions, including 120.0 general elementary/secondary FTE positions, 64.8 FTE positions for special education services, and 29.9 FTE positions to serve our growing population of students who receive English for Speakers of Other Languages services.We also need 12.4 FTE positions to open the new Bethesda/Chevy Chase #2 Middle School as well as 9.7 FTE positions to add Grade 8 to Hallie Wells Middle School for the 2017–2018 school year. Finally, we need 35.5 FTE positions in school support operations for transportation, school plant operations, and food services for the additional students and facilities expected next fiscal year.
Strategic Accelerators
This budget recommendation includes $10,207,815 in strategic accelerators, including 22.0 FTE positions. These resources help intensify efforts to close the persistent opportunity gaps and improve academic excellence for all. The strategic accelerators are grouped by the five strategic priorities that were outlined in fall 2016.
To support the core or principal strategy of improving teaching and learning, an additional $3,561,854 and 13.5 FTE positions are included. Within this total, $1,193,652 will be used to increase opportunities and improve achievement for students including implementation of a diploma program for students who need an alternative path for graduation, increasing access to Career Technology Education programs and implementation of apprenticeship programs. In addition, $457,311 will be used to enhance achievement focused co-curricular programs to all middle schools to increase outcomes and opportunities for students. In addition to new dollars, realigned dollars will support these efforts including the realignment of a supervisor position to provide coordination of efforts. A total of $1,037,103 and 12.5 FTE positions will expand the home school model to the remaining elementary schools. To ensure effective mathematics instruction, an increase of $500,000 is needed to provide professional development, instructional materials, focused support, and approaches to scheduling students in elementary and middle schools. Funding of $150,000 will be used to add six additional equal opportunity schools, as part of a nationwide initiative, to increase students’ access to advanced academic courses, and $192,689 to implement two-way immersion programs at elementary schools and plan for middle school options.
For the focus on learning, accountability, and results, a total of $2,475,772 and 2.0 FTE positions are included. Within this total, $1,271,022 and 2.0 FTE positions are to implement a systemwide data system for all schools to better measure student performance as we work to prepare all students for success in college, career, and life. Funding of $654,750 will allow MCPS to implement an online Individualized Education Program (IEP)/Section 504 system that will allow us to better analyze IEP data and access tools to support students with disabilities in early childhood as well as secondary transitions. A total of $450,000 is included to ensure that any Grade 11 student interested in taking the SAT or ACT exam will be able to do so. In addition, $85,000 is needed to implement an online high school planner for college and career readiness for all Grades 8‒9 students and expanded to additional grades in the 2018–2019 school year.
Members of the Board of Education 4 December 13, 2016
An additional, $1,266,032 and 1.5 FTE positions will support our focus on human capital. This includes $100,000 to provide training for teachers on effective strategies, content knowledge, and cultural competency. To build out our human resources system for schools, we are including $575,000 in this year’s budget. Also, $422,135 is included to develop pathways for supporting services staff who desire to become teachers as we continue to build our workforce with highly effective committed educators. Finally, $168,897 and 1.5 FTE positions will be used to intensify our equity recruitment, hiring, and retention efforts.
For our focus on community engagement and partnerships, an additional $1,246,703 and 2.0 FTE positions are included. Within this total, $734,959 and 1.0 position will be used to improve support to families through improved communication and increased materials for parents to help children succeed in schools. In addition, $149,744 and 1.0 position will be used to create an East County arts elementary program that imbeds additional music into the learning experience for students. To expand the Achieving Collegiate Excellence and Success to five additional schools, an increase of $147,000 is included. Funding of $120,000 will be used to create community and business partnership to establish summer work programs for Montgomery County high school teenagers and to enhance existing partnerships focused on tutoring and instruction;$95,000 to expand Science, Technology, Engineering, and Mathematics (STEM) courses and extracurricular programs to increase the number of underrepresented students in STEM fields;and an additional $45,000 will be added to the budget to support our Interages partnerships.
An increase of $1,657,454 and 3.0 FTE positions are included for our focus on operational excellence. To improve business systems that are either obsolete or cumbersome in order to create effective and efficient business operations, an increase of $1,007,416 and 1.0 position is included. A total of $503,000 is included to streamline the school registration process through an online system that will create efficiencies and reduce errors. Finally, $147,038 and 2.0 FTE positions are added to improve our security operations.
Program Efficiencies, Reductions, and Realignments
While this operating budget realigns and accelerates funding in important areas to improve teaching and learning for all students, program efficiencies and reductions totaling $24,678,901 and 196.29 FTE positions also are included. This includes reductions of $4,780,088 and 37.750 FTE positions from central services. Major program reductions include $6,216,923 and the elimination of 91.550 FTE instructional data analyst positions. Other program reductions include $2,475,915 and 35.5 FTE for reading initiative teacher positions and $460,311 and 6.6 FTE for literacy coach positions. Some special program teacher positions also are being eliminated totaling $362,669 and 5.2 FTE positions. Also, there is a reduction of $694,446 and 9.0 FTE positions in Alternative Programs. Reductions in Special Education programs total $767,494 and 10.475 FTE positions mostly for teacher and paraeducator positions.
There are funding reductions of $2,153,000 in professional development stipends, $2,000,000 in instructional materials, $575,902 in the career lattice program, and $800,000 in tuition reimbursement. With the elimination of the regional summer school at the elementary school
Members of the Board of Education 5 December 13, 2016
level, a total of $336,194 will be saved. It is important to note this does not impact our summerprogram at individual schools or our Building Educated Leaders for Life partnership program. Other major reductions include reductions in substitutes, stipends, furniture, and travel.
In order to reduce the overall budget, the increase typically included for inflation related to rising costs for textbooks and instructional materials totaling $483,590 for FY 2018 will be absorbed. Based on actual expenses in recent years, expenditures for the purchase of bus tires and parts can be reduced by $625,000. Finally, the utility budget can be reduced by $1,100,000 due to price and consumption reductions and efficiencies. While these and other smaller reductions are both difficult and painful, given the other funding requirements in this budget, coupled with our commitment to excellence for all our students, they must be included in this recommended budget.
There are a number of budget-neutral realignments in the Recommended FY 2018 Operating Budget. Major realignments include the Department of Instructional Leadership being realigned from the Office of School Support and Improvement to the Office of the Chief Academic Officer for the purpose of consolidating professional leadership efforts in the district. Another realignment involves the establishment of the Office of the Chief Financial Officer where budget and finance-related functions are consolidated for the school district.
Contract Negotiations
The three-year agreements that the Board of Education ratified on March 11, 2014, will expire at the end of FY 2017. Negotiations began in October 2016 and are continuing at this time with our three employee associations on new contracts to be effective July 1, 2017. While the final terms of these contracts have not yet been agreed upon, in order to plan for the requirements of the FY 2018 Operating Budget, a total of $55,000,000 has been included to support the negotiated agreements once they are finalized. By the time that the Board approves its budget on February 14, 2017, more details on these contracts should be available.
A Budget Developed in Collaboration with our Partners
My recommended FY 2018 Operating Budget was developed in partnership with our employees and parents/guardians. I want to thank the leadership of the Montgomery County Association of Administrators and Principals, the Montgomery County Education Association, and the Service Employees International Union Local 500 for their collaboration and commitment during the development of this budget. I also am grateful to the leaders of the Montgomery County Council of Parent Teacher Associations, Inc., and representatives of the African American Student Achievement Action Group and the Latino Student Achievement Action Group, who also were involved in the development of this budget recommendation. Finally, I am appreciativefor the dedication and cooperation of our executive leadership team and other MCPS staff in the development of this operating budget recommendation.
Members of the Board of Education 6 December 13, 2016
This budget has been developed with the important goal of improving outcomes and opportunities for each and every student that attends MCPS. I look forward to working with the Board of Education on my recommended FY 2018 Operating Budget. This budget reflects our core values of learning, relationships, respect, excellence, and equity. It reflects our commitment to continue the investment in all our children so that they may complete their MCPS education ready to be successful in college, career, and community.
Sincerely,
Jack R. Smith, Ph.D.Superintendent of Schools

C O N T E N T S
The Superintendent’s Recommended Operating Budget and Personnel Complement FY 2018 PAGE
How to Read the Budget ................................................................................ i-1
Summary Data:Table 1: Summary of Resources by Object of Expenditure ............................... ii-1Table 1a: Summary of Budget Changes ........................................................... ii-2Where the Money Goes .................................................................................. ii-3Where the Money Comes From ...................................................................... ii-4Table 2: Budget Revenues by Source ............................................................... iii-1Table 3: Revenue Summary for Grant Programs by Source of Funds ............... iv-1Table 4: Summary of Student Enrollment ....................................................... v-1Table 5: Allocation of Staffing ......................................................................... vi-1Table 6: Cost per Student by Grade Span ........................................................ vii-1Summary of Negotiations .............................................................................. viii-1Montgomery County Public Schools FY 2018 Organization Chart ................... ix-1
Budget Chapters:Schools ......................................................................................................... 1-1School Support and Improvement .................................................................. 2-1Chief Academic Officer .................................................................................. 3-1Curriculum and Instructional Programs ......................................................... 4-1Special Education .......................................................................................... 5-1Student Services and Engagement .................................................................. 6-1Operations ..................................................................................................... 7-1Technology Support and Infrastructure .......................................................... 8-1Human Capital Management ......................................................................... 9-1Administration and Oversight ........................................................................ 10-1
Appendices:Administrative & Supervisory Salary Schedule ............................................... A-1Business and Operations Administrators Salary Schedule ............................... A-2Teacher and Other Professional Salary Schedule............................................. A-3Supporting Services Hourly Rate Schedule ..................................................... A-4State Budget Category Summaries (Categories 1–81) ...................................... B-1K–12 Budget Staffing Guidelines .................................................................... C-1Special Education Staffing Plan and Budget Guidelines .................................. D-1Non-Operating Budget Positions .................................................................... E-1Reconciliation of Comprehensive Annual Financial Report (CAFR) and Operating Budget for FY 2016 Actual Expenditures ..................................... F-1Glossary ........................................................................................................ G-1

HOW TO READ THE BUDGET
All Montgomery County Public Schools’ (MCPS) operating budget documents are available on the MCPS website: www.montgomeryschoolsmd.org/departments/budget
The Superintendent’s Recommended Operating Budget and Personnel Complement is a comprehensive document that provides program and budget information by organizational unit. This version of the budget is published in December, accompanying the superintendent’s presentation of the recommended budget to the Board of Education. The Board of Education holds public hearings and work sessions prior to taking action to adopt the budget. The Board’s actions are documented in the Board of Education’s Budget Request that is transmitted to the county executive and County Council by March 1.
The major components of the Superintendent’s Recommended Operating Budget (commonly referred to as the “Management Budget”) are summarized below in order of appearance in the document.
Table 1: Summary of Resources by Object of Expenditure Table 1 summarizes the MCPS operating budget expenditures in dollars and full-time equivalent (FTE) positions. It show one year of actual data, the original budget for the current fiscal year, the current approved budget, the recommended/requested budget, and the change from the current approved budget to the recommended/requested budget. The data is categorized in five major objects of expenditure: salaries and wages, contractual services, supplies and materials, other, and equipment.
Table 2: Budget Revenues by Source Table 2 summarizes how the operating budget is funded by type of revenue. It includes the amount of revenue MCPS is projecting to receive to fund its activities for the upcoming fiscal year, prior year actual revenues, the revenue corresponding to the original budget for the current fiscal year, and the revenue that corresponds to the current approved budget. The sources of revenue used to fund the budget are county funds, state funds, federal funds, and funds from other sources. Enterprise/Special Funds are funded by user fees and other non-tax supported sources.
Table 3: Revenue Summary for Grant Programs by Source of Funds This table details the sources of funding for all budgeted grant programs. The display includes funding that corresponds to the original budget for the current year, the current year’s approved revenue, and estimated revenue for the upcoming fiscal year. In addition, the table provides a listing of non-budgeted grants received by MCPS at the time of publication.
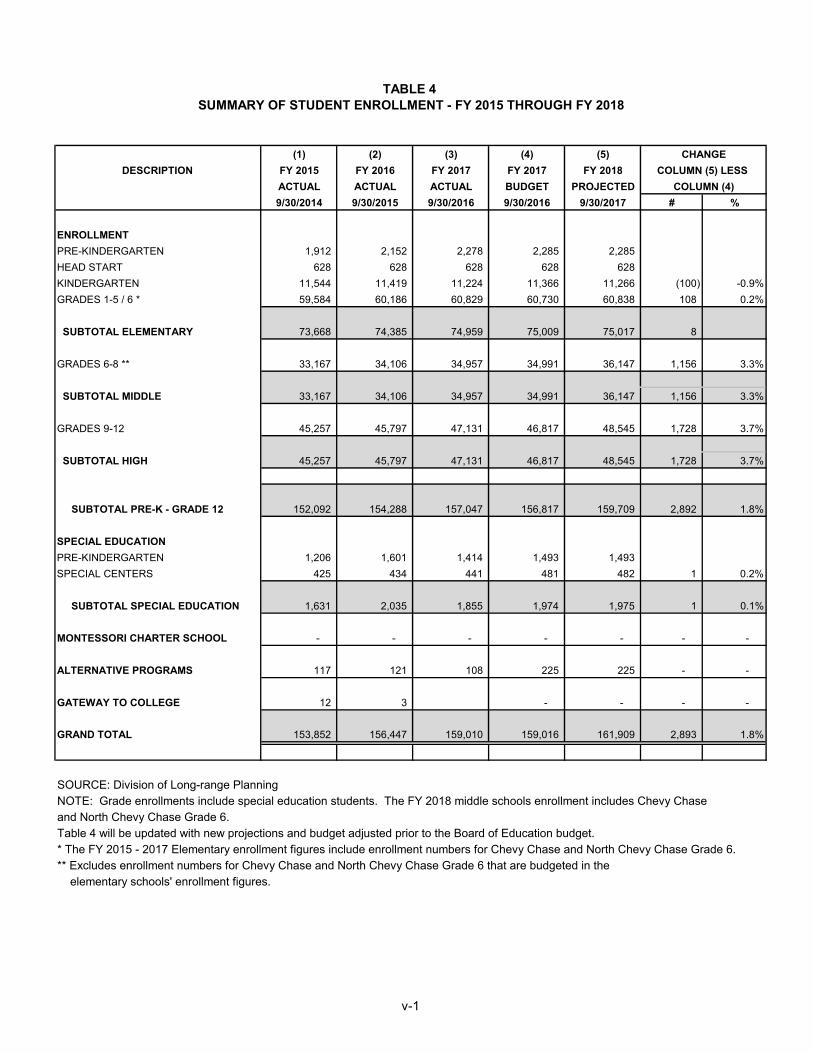
Table 4: Summary of Student Enrollment A significant portion of the MCPS budget is driven by changes in student enrollment. Table 4 shows actual and projected student enrollment for regular instruction by school level. Table 4 also shows the number of elementary, middle, and high school students who receive special education instruction in special classes, special schools, or centers. The number of students enrolled in alternative programs also is shown.
Table 5: Allocation of Staffing Table 5 shows all MCPS budgeted positions classified by major position type.
i – 1

HOW TO READ THE BUDGET
Cost Per Student by Grade Span This chart shows average cost per student figures that are calculated using student enrollment data and budget data for regular school operations. Figures are provided for the fiscal year in which the latest actual expenditures and actual enrollment data are available, the current budget year using actual enrollment data, and the recommended/requested budget year using projected student enrollment data. Cost per student figures are provided for kindergarten/elementary and secondary levels.
Summary of Negotiations This narrative explains the status of the negotiated contracts between the Board of Education and the employee bargaining groups—the Montgomery County Association of Administrators and Principals/Montgomery County Business and Operations Administrators (MCAAP/MCBOA), the Montgomery County Education Association (MCEA), and the Service Employees International Union, Local 500 (SEIU).
Montgomery County Public Schools Organization Chart This chart shows the overall MCPS organization, including the major offices and reporting departments.
Chapters There is a chapter in the budget document for each of the major offices/areas: Schools; School Support and Improvement; Chief Academic Officer; Curriculum and Instructional Programs; Special Education; Student Services and Engagement; Operations; Technology Support and Infrastructure; Human Capital Management; and Administration and Oversight.
Each chapter includes:
• An overall organization chart for the office and organization charts for each major department,division, or unit.
• A program mission summary for the major offices and reporting departments. Included in thenarrative are the mission statement, overview of major functions, measures, and a budgetexplanation. The budget explanation provides a detailed description of the changes in the unit’sbudget from the prior year.
• A budget resource page for the major organizational units. The page shows actual expenditure datafor the last fiscal year, the original approved budget, the current approved budget, proposed budget,and the change between the proposed budget and current approved budget. Budgetary data isaggregated by major object of expenditure and further displayed by major subobjects of expenditure.The total number of FTE positions is also shown on the resource page.
• A personnel complement provides a detailed display of the FTE positions. Positions are groupedby title, grade, and state budget category. The total number of positions on the personnel complementequals the total number of positions shown on the budget resource page.
Some chapters include supplemental charts and tables. For example, charts display data about utilities and the lease/purchase of buses. Appendices Additional budgetary information is provided in eight appendices. Appendix A includes the salary schedules for administrative and supervisory employees, business and operations administrative employees, teachers and other professional employees, and supporting services employees, effective on
i – 2

HOW TO READ THE BUDGET
July 1 for the upcoming fiscal year. MCPS is required by law to budget by state budget category. Appendix B provides an explanation of the State Budget Categories and provides data representing the amount of the total budget that is attributable to each budget category. Appendices C and D provide detailed budgeted staffing guidelines and information for regular K-12 instruction and special education, respectively. Appendix E provides a listing of positions charged to the Capital Budget and Trust Funds. Appendix F is the Reconciliation of the Comprehensive Annual Financial Report (CAFR) and the Operating Budget for FY 2016 Actual Expenditures. Appendix G is the Glossary of MCPS Operating Budget Terms that are commonly used in the budget document. The Index provides the reader with alternate access to various parts of the budget document.
i – 3

OBJECT OF EXPENDITURE FY 2016 FY 2017
ACTUAL
FY 2017 FY 2018 FY 2018
BUDGET CURRENT BUDGET CHANGE
POSITIONS
Administrative
TOTAL POSITIONS
OTHER SALARIES
AdministrativeProfessionalSupporting Services
TOTAL OTHER SALARIES
TOTAL SALARIES AND WAGES
02 CONTRACTUAL SERVICES
03 SUPPLIES & MATERIALS
04 OTHER
05 EQUIPMENT
GRAND TOTAL AMOUNTS
707.200 718.100 718.100 718.750 .650
1,652,631,451
$2,457,473,761
22,180.50122,185.501
1,550,159,910 35,896,488
28,200,923
22,275.979 95.478
1,652,848,488
385,528 385,528 335,528328,03762,646,960 115,198,946
(50,000)56,020,655 52,229,787
24,372,869 24,894,824 484,904
84,549,615 87,405,357 87,764,607 140,429,298 52,664,691
1,688,527,939
27,650,990 27,127,136 27,344,361 35,055,858 7,711,497
60,884,734 66,609,484 66,594,072 66,018,294 (575,778)
18,511,706 18,498,306 18,739,370 241,064
62,969,15924,409,920
$2,457,473,763 $2,519,848,012 $62,374,251
17,379,186
$2,282,587,631
21,447.249
01 SALARIES & WAGES
Administrative
Professional 12,468.776 13,043.036 13,036.0368,182.623 8,337.715 8,339.715
13,141.091
8,327.638
105.055
Supporting Services (12.077)
88.650 86.650 86.650 88.500 1.850
$97,654,946$98,038,346$93,337,568 $97,801,809 $146,863
8,289,325 8,898,1538,760,474 8,760,474 137,679
368,809,362 (8,147,969)
(8,904,776)1,072,589,317Professional 1,013,999,096 1,081,924,938 1,081,494,093
Supporting Services 349,984,306 376,719,373 376,957,331
1,548,098,641 (16,768,203)1,564,866,844TOTAL POSITION DOLLARS 1,465,610,295 1,565,443,131
TABLE 1
SUMMARY OF RESOURCES
BY OBJECT OF EXPENDITURE
Business/Operations Admin.
Business/Operations Admin.
2,024,972 2,378,836 2,379,158 2,254,835 (124,323)Local/Other Travel
Insur & Employee Benefits 530,246,933 589,689,148 589,689,148 605,343,323 15,654,175Utilities 38,878,609 41,564,244 41,564,244 40,701,717 (862,527Miscellaneous 55,362,297 58,744,721 58,773,021 63,206,676 4,433,655TOTAL OTHER 626,512,811 692,376,949 692,405,571 711,506,551 19,100,980
ii – 1

TABLE 1A SUMMARY OF BUDGET CHANGES FY 2017 - FY 2018
($ in millions)
ITEM FTE AMOUNTFY 2017 CURRENT OPERATING BUDGET 22,180.501 $2,457.5
FY 2018 CHANGES: FY 2018 CHANGES CONTINUED:
ENROLLMENT CHANGES EFFICIENCIES & REDUCTIONSElementary/Secondary 119.975 9.1 Efficiciencies & Reductions (196.290) (24.7) Special Education 64.791 5.8 Subtotal (196.290) ($24.7)ESOL 29.915 1.9 Transportation 7.500 0.5 Food Services 4.000 0.3 ITEM FTE AMOUNTSubtotal 226.181 $17.6 STRATEGIC PRIORITY ACCELERATORS
Improve Teaching and Learning 13.500 $3.6NEW SCHOOLS/ADDITIONAL SPACE 46.000 $3.8 Focus on Learning, Accountability and Results 2.000 2.5
Focus on Human Capital 1.500 0.7EMPLOYEE SALARIES - CONTINUING AND NEGOTIATED Focus on Community Partnerships ad Engagement 2.000 1.2 SALARIES FOR CURRENT EMPLOYEES (including benefits) $32.2 Focus on Operational Excellence 3.000 2.2
Subtotal 22.000 $10.2EMPLOYEE BENEFITS AND INSURANCEEmployee Benefits Plan (active) 5.5 Employee Benefits Plan (retired) 2.5 FY 2018 OPERATING BUDGET 22,275.979 $2,519.9Retirement 7.5 FY 2017 - FY 2018 CHANGE 95.478 $62.4FICA/Self-Insurance/Workers' Compensation, Fire Insurance (0.4) Self-insurance, Worker's Compensation 1.5 Less Grants (81.7) Administrative Costs/Fees 0.1 Less Enterprise Funds (64.7) Subtotal $16.7 Less Special Revenue Funds (1.7)
SPENDING AFFORDABILITY BUDGET 22,275.979 $2,371.8INFLATION AND OTHERTextbooks, Instructional Materials, Building/Maintenance Supplies 0.5 Utilities (0.8) Special Education 0.9 REVENUE INCREASE BY SOURCEMaintenance 15.000 2.3 Local 65.0Transportation (10.500) (0.7) State 8.5Relocatables 0.6 FederalTuition Reimbursement 1.0 OtherGrants and Enterprise Funds (6.618) 2.2 Fund Balance (13.5) Other (0.295) 0.6 Enterprise/Special Revenue Funds 2.4Subtotal (2.413) $6.6 TOTAL REVENUE INCREASE $62.4
Numbers may not add due to rounding.
ii–2
ii – 2
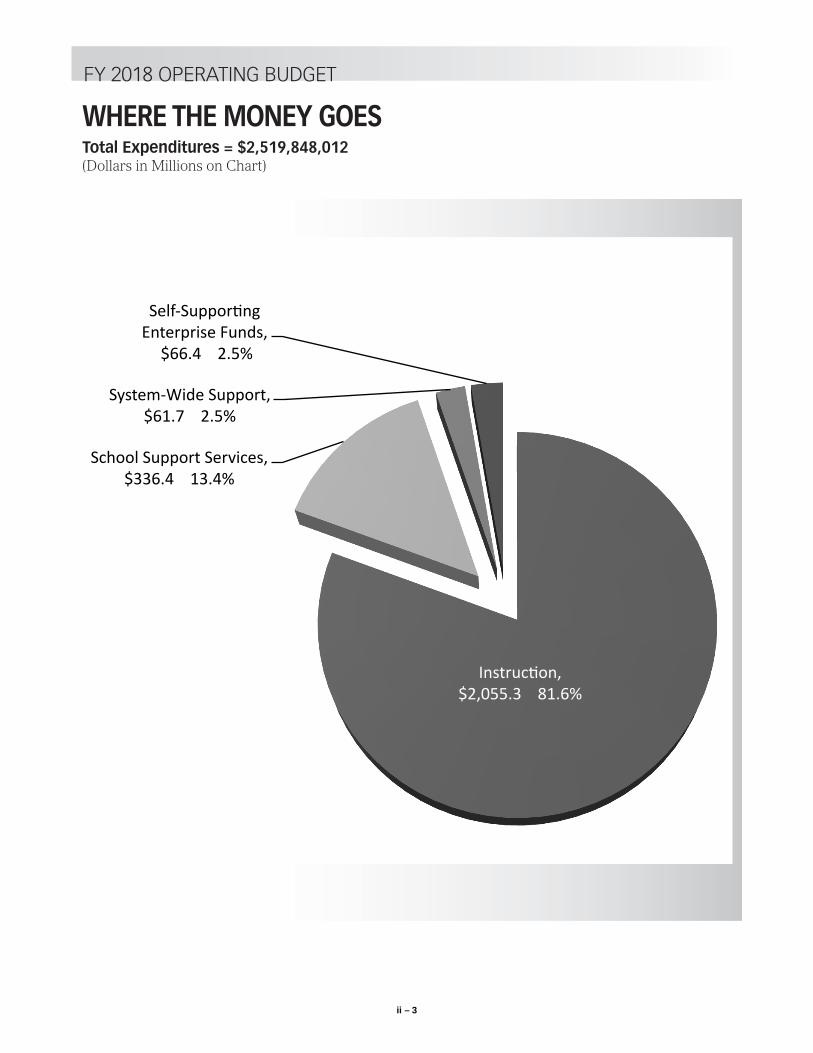
WHERE THE MONEY GOESTotal Expenditures = $2,519,848,012(Dollars in Millions on Chart)
Local,$1,682.6 66.8%
State, $665.9 26.4%
Federal, $74.3 3.0%
Other, $10.9 0.4%
Fund Balance, $19.7 0.8%
Enterprise Funds, $66.4 2.6%
Instruc(on, $2,055.3 81.6%
School Support Services, $336.4 13.4%
System-‐Wide Support, $61.7 2.5%
Self-‐Suppor(ng Enterprise Funds, $66.4 2.5%
FY 2018 OPERATING BUDGET
ii – 3

WHERE THE MONEY COMES FROMTotal Revenue = $2,519,848,012(Dollars in Millions on Chart)
Local, $1,682.6 66.8%
State, $665.9 26.4%
Federal, $74.3 3.0%
Other, $10.9 0.4%
Fund Balance, $19.7 0.8%
Enterprise Funds, $66.4 2.6%
FY 2018 OPERATING BUDGET
ii – 4

BUDGET REVENUE BY SOURCE SOURCE FY 2016 FY 2017 FY 2017 FY 2018
ACTUAL BUDGET CURRENT ESTIMATED
CURRENT FUNDFrom the County: $1,463,274,812 $1,617,631,597 $1,617,631,597 $1,682,639,169
Local Contribution for State Retirement 44,356,785 Programs Financed Through Local Grants 72,985 Total from the County 1,507,704,582 1,617,631,597 1,617,631,597 1,682,639,169
From the State: Bridge to Excellence Foundation Grant 322,176,176 325,526,802 325,526,802 329,600,004 Geographic Cost of Education Index 17,744,167 35,976,870 35,976,870 36,427,036 Limited English Proficient 60,287,318 61,681,997 61,681,997 62,453,802 Compensatory Education 136,727,928 137,614,315 137,614,315 139,336,234 Students with Disabilities - Formula 36,565,418 37,620,077 37,620,077 38,090,804 Students with Disabilities - Reimbursement 16,552,782 17,270,242 17,270,242 17,579,627 Transportation 39,786,572 40,933,087 40,933,087 41,445,268 Miscellaneous 138,692 170,000 170,000 140,000 Programs financed through State Grants 2,666,294 644,000 644,000 830,135 Total from the State 632,645,347 657,437,390 657,437,390 665,902,910
From the Federal Government: Impact Aid 98,467 150,000 150,000 150,000 Programs financed through Federal Grants 73,300,031 74,752,923 74,752,923 74,167,537 Total from the Federal Government 73,398,498 74,902,923 74,902,923 74,317,537
From Other Sources: Tuition and Fees D.C. Welfare 166,194 120,000 120,000 140,000 Nonresident Pupils 528,084 530,000 530,000 530,000 Summer School 1,699,726 1,519,000 1,519,000 1,867,021 Outdoor Education 686,504 680,000 680,000 680,000 Student Activities Fee 756,345 691,600 691,600 700,000 Miscellaneous 309,541 300,000 300,000 300,000 Programs financed through Private Grants 596,073 6,731,204 6,731,204 6,731,204 Total from Other Sources 4,742,467 10,571,804 10,571,804 10,948,225
Fund Balance 33,162,633 33,162,633 33,162,633 19,662,633.
Total Current Fund 2,251,653,527 2,393,706,347 2,393,706,347 2,453,470,474
ENTERPRISE & SPECIAL FUNDS
School Food Service Fund: State 2,041,615 2,305,057 2,305,057 2,211,852 National School Lunch, Special Milk and Free Lunch Programs 39,284,516 34,400,008 34,400,008 35,147,693 Sale of Meals and other 16,131,511 17,262,204 17,262,204 16,943,135 Total School Food Service Fund 57,457,642 53,967,269 53,967,269 54,302,680
Real Estate Management Fund: Rental fees 3,536,447 3,686,191 3,686,191 3,986,191 Total Real Estate Management Fund 3,536,447 3,686,191 3,686,191 3,986,191
TABLE 2
iii – 1

BUDGET REVENUE BY SOURCE SOURCE FY 2016 FY 2017 FY 2017 FY 2018
ACTUAL BUDGET CURRENT ESTIMATED
TABLE 2
Field Trip Fund: Fees 2,184,988 2,006,361 2,006,361 2,306,361 Total Field Trip Fund 2,184,988 2,006,361 2,006,361 2,306,361
Entrepreneurial Activities Fund: Fees 2,226,617 2,364,802 2,364,802 4,084,802 Total Entrepreneurial Activities Fund 2,226,617 2,364,802 2,364,802 4,084,802
Total Enterprise Funds 65,405,694 62,024,623 62,024,623 64,680,034
Instructional Television Special Revenue Fund: Cable Television Plan 1,654,209 1,742,791 1,742,791 1,697,504 Total Instructional Special Revenue Fund 1,654,209 1,742,791 1,742,791 1,697,504
GRAND TOTAL $2,318,713,430 $2,457,473,761 $2,457,473,761 $2,519,848,012
Tax - Supported Budget FY 2016 FY 2017 FY 2017 FY 2018ACTUAL BUDGET CURRENT ESTIMATED
Grand Total $2,318,713,430 $2,457,473,761 $2,457,473,761 $2,519,848,012 Less: Grants (76,635,383) (82,128,127) (82,128,127) (81,728,876) Enterprise Funds (65,405,694) (62,024,623) (62,024,623) (64,680,034) Special Revenue Fund (1,654,209) (1,742,791) (1,742,791) (1,697,504)Grand Total - Tax-Supported Budget $2,175,018,144 $2,311,578,220 $2,311,578,220 $2,371,741,598
The Adult Education Fund was created July 1, 1991, but was discontinued effective July 1, 2006, because the program wastransferred to Montgomery College and the Montgomery County Department of Recreation. The Real Estate ManagementFund was created July 1, 1992. The Field Trip Fund was created effective July 1, 1993. The Entrepreneurial ActivitiesFund was created effective July 1, 1998. The Instructional Television Special Revenue Fund was created July 1, 2000.
iii – 2

TABLE 3REVENUE SUMMARY FOR GRANT PROGRAMS BY SOURCE OF FUNDS
Program Name and Source of Funding FY 2016 FY 2017 FY 2017 FY 2018ACTUAL BUDGET CURRENT ESTIMATED
Budgeted
FEDERAL AID: NO CHILD LEFT BEHIND (NCLB)
Title I - A (941/942) 21,677,905$ 25,274,192$ 25,274,192$ 25,124,592$ Subtotal 21,677,905 25,274,192 25,274,192 25,124,592
Title I - DNeglected and Delinquent Youth (937) 152,835 140,137 140,137 168,164
Total Title I 21,830,740 25,414,329 25,414,329 25,292,756
Title II - ASkillful Teaching and Leading Program (915) 358,570 351,203 351,203 874,542 Teacher Mentoring (917) 481,545 253,720 253,720 253,720 Consulting Teachers (961) 2,853,601 2,902,171 2,902,171 2,211,828
Total Title II 3,693,716 3,507,094 3,507,094 3,340,090
Title IIIEnglish Language Acquisition (927) 3,375,986 3,352,368 3,352,368 3,365,645
Title VIIAmerican Indian Education (903) 26,024 26,024 26,024 25,669
SUBTOTAL 28,926,466 32,299,815 32,299,815 32,024,160
OTHER FEDERAL, STATE, AND LOCAL AID
Head Start Child Development (931/932)Federal 3,603,676 3,771,965 3,771,965 3,667,684
Individuals with Disabilities Education (907/913)Federal 32,089,056 31,237,686 31,237,686 31,110,389
Infants and Toddlers - Passthrough from Montgomery County Department of Health and Human Services (930)
Federal 791,315 791,315 791,315 837,602 State 232,421 232,423 232,423 186,135
Judith P. Hoyer Child Care CentersState (904/905) 644,000 644,000 644,000 644,000
Medical Assistance Program (939)Federal 4,956,871 5,010,522 5,010,522 5,117,501
National Institutes of Health (NIH) (908)Federal 266,187 275,207 275,207 281,388
Provision for Future Supported Projects (999)Other 3,307,875 6,731,204 6,731,204 6,731,204
Carl D. Perkins Career & Technical Ed. Improvement (950/951)Federal 1,169,596 1,133,990 1,133,990 1,128,813
McKinney - Vento Homeless Children and Youth (910)Federal - - - - SUBTOTAL 47,060,997 49,828,312 49,828,312 49,704,716
TOTAL 75,987,463$ 82,128,127$ 82,128,127$ 81,728,876$
iv – 1

TABLE 3REVENUE SUMMARY FOR GRANT PROGRAMS BY SOURCE OF FUNDS
Program Name and Source of Funding FY 2016 FY 2017 FY 2017 FY 2018ACTUAL BUDGET CURRENT ESTIMATED
Summary of Funding SourcesFederal 71,803,167$ 74,520,500$ 74,520,500$ 74,167,537$ State 876,421 876,423 876,423 830,135 CountyOther 3,307,875 6,731,204 6,731,204 6,731,204 GRAND TOTAL 75,987,463$ 82,128,127$ 82,128,127$ 81,728,876$
Additional grant appropriation through the Provision for Future Supported Projects as of November 15, 2016NIST - Summer Institute for Middle School Science Teachers 12,000 NIST - Research Experience for Teachers 8,000 Title I, Part A—School Improvement 1003(a), Focus Schools 604,771 21st Century Community Learning Centers: Knight Time at Wheaton High School 240,665 Federal Prekindergarten Expansion Program 734,400 IDEA, Passthrough Part B 53,842 Preventive Services/Foundation School Grant 149,059
SUBTOTAL FEDERAL FUNDING 1,802,737 Ready 4 Kindergarten 152,240
SUBTOTAL STATE FUNDING 152,240 Middle Years Programme Study 10,000 Howard Hughes Medical Institute Science Education Project 545,000
SUBTOTAL OTHER FUNDING 555,000
TOTAL 2,509,977
iv – 2
v-1
TABLE 4 SUMMARY OF STUDENT ENROLLMENT - FY 2015 THROUGH FY 2018
(1) (2) (3) (4) (5) CHANGEDESCRIPTION FY 2015 FY 2016 FY 2017 FY 2017 FY 2018 COLUMN (5) LESS
ACTUAL ACTUAL ACTUAL BUDGET PROJECTED COLUMN (4)9/30/2014 9/30/2015 9/30/2016 9/30/2016 9/30/2017 # %
ENROLLMENTPRE-KINDERGARTEN 1,912 2,152 2,278 2,285 2,285HEAD START 628 628 628 628 628KINDERGARTEN 11,544 11,419 11,224 11,366 11,266 (100) -0.9%GRADES 1-5 / 6 * 59,584 60,186 60,829 60,730 60,838 108 0.2%
SUBTOTAL ELEMENTARY 73,668 74,385 74,959 75,009 75,017 8
GRADES 6-8 ** 33,167 34,106 34,957 34,991 36,147 1,156 3.3%
SUBTOTAL MIDDLE 33,167 34,106 34,957 34,991 36,147 1,156 3.3%
GRADES 9-12 45,257 45,797 47,131 46,817 48,545 1,728 3.7%
SUBTOTAL HIGH 45,257 45,797 47,131 46,817 48,545 1,728 3.7%
SUBTOTAL PRE-K - GRADE 12 152,092 154,288 157,047 156,817 159,709 2,892 1.8%
SPECIAL EDUCATIONPRE-KINDERGARTEN 1,206 1,601 1,414 1,493 1,493SPECIAL CENTERS 425 434 441 481 482 1 0.2%
SUBTOTAL SPECIAL EDUCATION 1,631 2,035 1,855 1,974 1,975 1 0.1%
MONTESSORI CHARTER SCHOOL - - - - - - -
ALTERNATIVE PROGRAMS 117 121 108 225 225 - -
GATEWAY TO COLLEGE 12 3 - - - -
GRAND TOTAL 153,852 156,447 159,010 159,016 161,909 2,893 1.8%
SOURCE: Division of Long-range PlanningNOTE: Grade enrollments include special education students. The FY 2018 middle schools enrollment includes Chevy Chase and North Chevy Chase Grade 6.Table 4 will be updated with new projections and budget adjusted prior to the Board of Education budget.* The FY 2015 - 2017 Elementary enrollment figures include enrollment numbers for Chevy Chase and North Chevy Chase Grade 6.
elementary schools' enrollment figures.** Excludes enrollment numbers for Chevy Chase and North Chevy Chase Grade 6 that are budgeted in the

BUDGET BUDGET BUDGET BUDGET CURRENT BUDGET FY 17 - FY 18POSITIONS FY 2013 FY 2014 FY 2015 FY 2016 FY 2017 FY 2018 CHANGE
1 Executive 19.000 21.000 19.000 16.000 17.000 16.000 (1.000)
Administrative - (directors, supervisors, program2 coordinators, executive assistants) 195.000 196.700 204.700 199.700 197.600 195.750 (1.850)
Business/Operations Administrator - (leadership3 positions supervised by directors and supervisors) 92.000 91.650 90.650 88.650 86.650 88.500 1.850
Other Professional - (12-month instructional/4 evaluation specialists) 182.300 183.500 189.500 187.400 185.400 168.500 (16.900)
5 Principal/Assistant Principal 486.000 491.500 494.000 491.500 503.500 507.000 3.500
6 Teacher 10,475.070 10,759.420 10,984.160 10,940.304 11,481.264 11,584.329 103.065
Special Education Specialist (speech pathologists, physical/occupational
7 therapists) 495.200 506.750 508.958 506.708 503.008 506.898 3.890
8 Media Specialist 190.200 192.200 195.500 195.500 196.500 197.000 0.500
9 Counselor 453.300 456.300 467.500 467.000 486.000 497.500 11.500
10 Psychologist 94.905 100.000 106.034 106.034 115.034 115.034 -
11 Social Worker 14.405 14.800 14.830 14.830 15.830 18.830 3.000
12 Pupil Personnel Worker 45.000 45.000 51.000 51.000 53.000 53.000 -
Instructional Aide and Assistant (paraeducators, media assistants, lunch-hour aides, parent
13 assistants, instructional data assistants) 2,560.253 2,596.605 2,660.994 2,652.222 2,764.814 2,698.087 (66.727)
Secretarial/Clerical/Data Support (secretarial, clerical, personnel/transportation/fiscal/other lower
14 grade program/data assistants) 988.100 986.625 983.250 963.225 967.850 977.500 9.650
15 IT Systems Specialist 131.000 131.000 133.000 109.000 108.000 108.000 -
Security - (includes all positions except those in16 lines 2,3,14 above) 227.000 227.000 229.000 232.000 232.000 239.000 7.000
Cafeteria - (Includes all positions except those in17 lines 2,3,14,15 above) 557.948 558.948 561.448 561.448 564.323 569.323 5.000
Building Services - (includes all positions except18 those in lines 2,3,14 above) 1,342.700 1,365.075 1,376.700 1,363.200 1,379.700 1,403.700 24.000
Facilities Management/Maintenance - (includes19 all positions except those in lines 2,3,14,15 above) 345.000 354.000 354.000 352.000 352.000 366.000 14.000
Supply/Property Management - (includes all 20 positions except those in lines 2, 3,14,15 above) 47.000 50.000 51.500 51.500 51.500 50.500 (1.000)
Transportation - (includes all positions except 21 those in lines 2,3 14,15 above) 1,685.650 1,685.590 1,685.590 1,673.153 1,693.153 1,690.153 (3.000)
Other Support Personnel - (business, technology human resources,communications, printing, and
22 other support staff) 234.575 230.075 226.675 224.875 226.375 225.375 (1.000)
TOTAL 20,861.606 21,243.738 21,587.989 21,447.249 22,180.501 22,275.979 95.478
TABLE 5 ALLOCATION OF STAFFING
vi – 1

vii-1
KINDERGARTEN/ TOTAL AMOUNT TOTALELEMENTARY SECONDARY K-12* EXCLUDED* BUDGET**
FY 2016 BUDGETEXPENDITURES 1,027,204,678 1,109,773,603 2,316,978,281 181,410,655 2,318,388,936STUDENTS 9/30/15 71,790 80,388 152,178COST PER STUDENT 14,308 13,805 14,043
FY 2017 BUDGETEXPENDITURES 1,081,844,067 1,188,672,804 2,270,516,871 181,410,655 2,318,388,936STUDENTS 9/30/16 72,096 82,514 154,610COST PER STUDENT 15,006 14,406 14,685
FY 2018 BUDGETEXPENDITURES 1,095,063,058 1,233,112,836 2,328,175,894 191,672,118 2,519,848,012STUDENTS 9/30/17 72,104 85,399 157,503COST PER STUDENT 15,201 14,428 14,782
Notes:
Operating budget funds used in the calculation excludes amounts for Summer School, Community Services, Tuition for Students with Disabilitiesin Private Placement, Prekindergarten, Infants and Toddlers, and Enterprise Funds.FY 2017 Figures Reflect Current Approved Budget.*Once negotiated agreements are finalized, the funds budgeted to support the contracts will be moved to the appropriate accounts and the costs will be recalculated.
TABLE 6COST PER STUDENT BY GRADE SPAN
Enrollment figures used to calculate cost per student excludes students in PreK/Head Start.
12,000
12,500
13,000
13,500
14,000
14,500
15,000
15,500
KINDERGARTEN/ELEMENTARY SECONDARY TOTAL K-12
COST PER STUDENT BY GRADEFY 2016 THROUGH FY 2018
FY 2016
FY 2016FY 2016
FY 2017
FY 2016
FY 2017
FY 2018
FY 2018
FY 2018
FY 2016 FY 2017
vii – 1

Montgomery County Public Schools FY 2018 Operating Budget
Summary of Negotiations
The three-year agreements that the Board of Education ratified on March 11, 2014, will expire at the end of FY 2017. Negotiations began in October 2016 with our three employee associations on new contracts to be effective July 1, 2017, and are continuing at this time. While the final terms of these contracts have not yet been agreed on, in order to plan for the requirements of the FY 2018 operating budget, a total of $55,000,000 has been included to support the negotiated agreements once they are finalized. By the time that the Board approves its budget on February 14, 2017, more details on these contracts should be available.
viii – 1

MONTGOMERY COUNTY PUBLIC SCHOOLS ORGANIZATION—FY 2018
MONTGOMERY COUNTY BOARD OF EDUCATION
Superintendent of Schools
Department of Communications
Office of Shared Accountability
Chief of Staff
Internal Audit
PolicySpecial Education Legal Services
Partnerships
General Counsel
Chief Operating Officer
Associate Superintendent
for Human Resources and Development
Employee Assistance Unit
Department of Performance
Evaluation and Compliance
Department of Certification and Staffing
Department of Professional
Growth Systems
Chief Technology
Officer
Department of Technology Integration &
Support
Department of Infrastructure
and Operations
Department of Business Information
Systems
Department of Learning
Management Systems
Athletics Unit
Transfers and Appeals Unit
Department of Employee & Retiree
Services
Department of Association Relations
Department of Facilities Management
Department of Materials
Management
Office of the Chief Financial Officer
Department of School Safety and Security
Department ofTransportation
Deputy Superintendent of School Support and
Improvement
Associate Superintendent for Elementary School Support & Improvement
Associate Superintendent for Secondary School Support & Improvement
Associate Superintendent
of School Administration and Leadership Development
SchoolsElementary 133
Alternative Programs
Schools Middle 40 High 26 Special Schools/ Centers 5
Chief Academic OfficerDepartment of
Professional Learning and Equity Initiatives
Department of Elementary
Curriculum and Districtwide Programs
Department of Secondary
Curriculum and Districtwide Programs
Department of Career
Readiness & Innovative Programs
Associate Superintendent for Curriculum & Instructional
Programs
Associate Superintendent
for Special Education
Department of Special Education Services
Division of Business, Fiscal & Information
Systems
Resolution and Compliance
Unit
Central Placement Unit
Associate Superintendent
for Student and Family Support and Engagement
Pupil Personnel Services & Attendance
Services
International Admissions &
Enrollment
Psychological Services
Student, Family, and School Facilities
School Counseling
Services
ix – 1

Schools PAGE
Elementary Schools ....................................................... 1-13
Grades K–5
Prekindergarten/Head Start
Grant: Head Start School-based Programs
Grant: Title I, Part A School-based Programs
Middle Schools .............................................................. 1-22
Grade 6–8
High Schools ................................................................... 1-27
Grades 9–12
Thomas Edison High School of Technology
Grant: Carl D. Perkins Career & Technology Education Improvement Program
English Speakers of Other Languages .......................... 1-34
Grades K–12
Special Education Programs and Services ................... 1-39
Special Education School-Based Programs and Services
Special Education Prekindergarten, Special Programs and Related Services
Preschool Education Programs and InterACT
Special Schools/Centers
Grant: Individuals with Disabilities Education Act
Chapter 1
Schools

515.000
By Object of Expenditure
Summary of Resources
Schools
5.500
OBJECT OF EXPENDITURE FY 2016 FY 2017 FY 2017 FY 2018 FY 2018ACTUAL BUDGET CURRENT BUDGET CHANGE
509.500509.500
13,986.596 16,362.227 85.85813,353.049
328,037
50,880,718
385,528
3,403,080 3,835,216 5,845,059
23,650,887 22,661,376
3,835,216
3,917,476
17,759,143
385,528
54,835,512
4,426,973
335,528 (50,000)
46,125,708 50,532,508 50,532,508 103,165,747 52,633,239
3,917,372 3,791,221 (126,151)
54,835,408 107,292,496 52,457,088
1,111,011,199
23,681,105
1,118,021,253 1,281,659,549 1,322,863,233 41,203,684
718,537
2,009,843
726,701
(989,511)
(117,238)843,939 843,939
8,180,970 7,548,714 7,548,714 7,579,720 31,006
3,244,866 3,793,473 3,806,873 4,025,723 218,850
12,144,373 12,186,126 12,199,526 12,332,144 132,618
1,272,827 1,259,427 966,975 (292,452)
$1,158,996,527 $1,364,668,787
POSITIONS
Administrative
TOTAL POSITIONS
01 SALARIES & WAGES
Administrative
OTHER SALARIES
Administrative
Professional
Supporting Services
TOTAL OTHER SALARIES
TOTAL SALARIES AND WAGES
02 CONTRACTUAL SERVICES
03 SUPPLIES & MATERIALS
04 OTHER
Local/Other Travel
Insur & Employee Benefits
Utilities
Miscellaneous
TOTAL OTHER
05 EQUIPMENT
GRAND TOTAL AMOUNTS
$64,376,706 $68,067,361 $67,814,072
16,448.085
TOTAL POSITION DOLLARS 1,060,130,481 1,063,185,741 1,226,824,141 1,215,570,737 (11,253,404)
$68,545,353 $731,281
$1,322,604,605 $42,064,182
955,914
$1,145,273,709
25.000 25.000 25.000
12,433.415 132.165
3,474.670 (51.807)2,740.156 3,526.47712,301.25010,711.940Professional
Supporting Services
497.50025.000
10,189.8802,640.669
1,005,893,490 998,887,920
145,864,254
(7,005,570)
150,843,369 (4,979,115)875,361,616
118,221,238872,635,952
120,209,218
Professional
Supporting Services
2,170,921 2,273,210 2,273,210 2,273,210Business/Operations Admin.
Business/Operations Admin.
CHAPTER 1 – 1 SCHOOLS

Schools
THE MONTGOMERY COUNTY PUBLIC SCHOOLS
(MCPS) operating budget is created each year to
allocate the resources necessary to provide an excep-
tional education to all of the children of this commu-
nity to ensure they are college and career ready upon
graduation. In the 2016–2017 school year, MCPS
is entrusted with educating 159,022 students—the
largest and most diverse enrollment in the district’s
history. To achieve our goal of Academic Excellence
for All, MCPS directed significant resources begin-
ning in FY 2017 that will continue in FY 2018 to reduce
class size, provide targeted teacher and support staff
to work with students, improve professional devel-
opment, and enhance career preparation and college
readiness programs.
While MCPS has had a long history of high achievement for many students, not all students have been successful. There are groups of students who have not had the learn-ing opportunities or reached learning levels prepared to be successful in college, career, and community. These learning disparities most heavily fall on Black/African American students, Hispanic/Latino students, students impacted by poverty, students receiving special educa-tion services, English for Speakers of Other Languages, etc. As the student population continues to grow, the school system’s capacity to ensure the success all of our children will define its success. We must act now to create a school system where academic success is not predict-able by race, ethnicity, socioeconomic status, language, or disability. Our commitment to equity in no way less-ens our commitment to excellence. Our commitment is to raise to excellence all students, including those students who have not yet achieved at their highest potential.
The driving factors in preparing the Fiscal Year 2018 Operating Budget are both maintaining successful prac-tices that have led to strong student achievement in past years and investing in new strategies to ensure that all students will achieve at higher levels. Ensuring oppor-tunities and success for all students demands focused attention. While the differences that mark student achievement will not be eliminated in one year, this bud-get defines a clear path to improved achievement for all and instills confidence that MCPS will fulfill its core pur-pose of preparing all students to thrive in their future.
The FY 2018 Operating Budget has been created in align-ment with the five strategic priorities outlined in fall 2016, which intensify efforts to close persistent opportunity
gaps and improve academic excellence for all. The core or principle Strategic Priority of the five is to improve teach-ing and learning to provide a strong academic program for all students across the school district. The remaining four Strategic Priorities are the means to improve teach-ing and learning and include the following:
• Focus on Learning, Accountability, and Results• Focus on Human Capital Management• Focus on Community Partnerships and Engagement• Focus on Operational Excellence
Focus Area I—Learning, Accountability, and ResultsWe are strengthening our accountability framework to provide more clarity about the multiple indicators neces-sary to measure student performance as we work to pre-pare our students for success in college, career, and life. Specific data across multiple measures will be used to hold each of us accountable for student, school, and sys-temwide performance in meeting our goal of Academic Excellence for All. We are committed to using these data measures to create and execute plans for schools, stu-dent groups, and individual students that do not meet system targets. Simultaneously, we will have plans to ensure every student is challenged, demonstrates prog-ress, and achieves at his or her highest potential. Our commitment will include plans and metrics for those strategies that will be employed when students, schools, and the system do not meet milestone measures.
Focus Area II—Human Capital ManagementWe must invest in and shape a workforce that reflects and embraces the diversity of our community. Such a workforce must be highly qualified and hold the collec-tive belief that all students can learn at high levels. All employees, regardless of role, must possess the ability to help MCPS achieve our goal of Academic Excellence for All. It is essential that all employees see themselves as part of the outcomes for students. We each play a role. Our approach must be comprehensive and must span across the human capital continuum of attract-ing, recruiting, mentoring, developing, recognizing, and retaining highly effective employees. MCPS will develop a comprehensive systemwide plan for profes-sional development that identifies priorities and profes-sional learning expectations for all staff. The district also will ensure all staff are culturally proficient and possess the skills, knowledge, and beliefs about social emotional learning and mental health of students to create a learn-ing environment that is student-centered and meets the individual and diverse needs of students. Additionally, MCPS will implement all components of the diversity hiring initiative to ensure the workforce is of the highest quality and reflective of the community it serves.
CHAPTER 1 – 2 SCHOOLS

Schools
Focus Area III—Community Partnerships and Engagement
MCPS is committed to working with its public and pri-vate partners to support and engage families in order to improve the academic achievement of all students. We know that for students to be successful, we need to have families and communities as essential partners. They are the co-creators to help us build stronger learning envi-ronments for our students and ensure all students rec-ognize and fulfill their potential for successful futures.
The district will both sustain and expand existing part-nerships that meet the in-school and out-of-school needs of students and families and cultivate new partnerships to provide greater access to opportunities that will result in students being college and career ready. MCPS also will implement additional academic support to students, and foster relationships that keep students engaged in school and on track for graduation. MCPS will continue to facilitate two-way communication with parents, stu-dents, employees, and community members using a wide array of tools to engage and communicate information.
Focus Area IV—Operational Excellence We know that great teaching is supported and enabled by excellent operational systems. Our efforts to provide all students with an education that prepares them for their future must be built on a strong foundation of world-class operations. Every office and department will strive to understand and anticipate student and school needs. We will work to ensure excellent service so that schools have the resources and supports needed to deliver on the promise of excellence and equity for all students.
MCPS will use strategic planning and continuous improvement processes to continue to build and maintain excellent services to schools; ensuring efficient and timely operations, and nurturing 21st century learning environ-ments. MCPS also will ensure resource allocations and support to schools and offices are aligned to strategic pri-orities and are distributed efficiently and effectively based on enrollment, student needs and community values.
How MCPS Invests Its Resources Approximately 80 percent of the budget funds the instructional programs in the classroom while the remaining 20 percent is allocated to support functions such as transportation, building services, maintenance and food services, among others. The MCPS Program Budget, which can be found on the Budget 101 web page, provides a helpful summary of how these tax dol-lars are used across the district in six broad categories:
Core Instructional Programs The core instructional programs include resources that provide all students with access to a rigorous curriculum and culturally proficient instruction that prepares them for college, career, and life. It also includes the support needed to operate the school. The budget is developed using projected student enrollment for each school by grade level (refer to Appendix C for staffing allocation guidelines). Specific resources provided to schools to support core instructional programs include:
• Administrative staff• Teachers and substitute teachers• Paraeducators, clerical staff, and other support
positions• Textbooks and instructional materials• Outdoor Education• School-based library media resources• Gifted and talented programs• Extracurricular programs, including athletics• Career and Technology Education
Programs that Provide Additional Support to Improve Student Achievement
MCPS is focused on ensuring that all of our struggling learners receive the same level of excellence in teaching and learning provided to our successful students. While MCPS has a long history of high performance for many students, there are students who have not excelled. We must maintain the high levels of performance, and increase performance for those students not achiev-ing at their potential. Programs in this category include those that provide direct services to students to nar-row the achievement gap. The resources and services provided by these programs are over and above core general education programs and services and are both federally and locally funded (refer to Appendix C for resource allocation guidelines). Specific supplemental programs, staffing and support to schools include:
• Preschool Education Programs for students with disabilities
• PreK and Head Start programs• Learning and Academic Disability services
(elementary)• Class size reduction teachers (elementary)• Focus teachers/paraeducators and academic inter-
vention teachers (elementary, middle, high)• Extended day/year academic support including high
school interventions and Online Pathways to Graduation• Coordinated Student Service Learning• Interim Instructional Services• Maryland Meals for Achievement• Alternative programs
CHAPTER 1 – 3 SCHOOLS

Schools
• Career support and career readiness• Minority Achievement-Focused programs • English for Speakers of Other Languages (ESOL)
resources including Multidisciplinary Educational Training and Support (METS) program (elementary, middle and high)
• Special Education programs
Collaborative Partnership Programs to Improve Student Achievement
MCPS is committed to working with its public and pri-vate partners to support and engage families in order to improve the academic achievement of all students. Programs included in this category are those that MCPS administers in partnership with other governmental, business, and community entities to support the instruc-tional and social emotional needs of students and nar-row the achievement gap. Our partnerships include the Montgomery County Department of Health and Human Services, Montgomery College, the Montgom-ery County Department of Recreation, and the Office of Refugee and Resettlement. Some of the programs and services offered under these partnerships include:
• Linkages to Learning (elementary and middle school students and family members in high poverty areas)
• Judith P. Hoyer Early Child Care Centers (birth—5 students and family members in high poverty areas)
• Counseling, Residency and International Admissions (elementary, middle, and high school students and family members)
• Postsecondary partnership programs (high school students)
• Language assistance services (elementary, middle, and high school)
Programs to Support School Improvement and Ensure High Quality Instruction
MCPS is engaged in a continual process of improving practices of teachers, leaders, and support profession-als dedicated to the highest level of student success and reflective of the community we serve. This category of programs includes those that focus on building the capacity of schools and staff to deliver the highest qual-ity instruction. Program services include specific sup-port staff and materials, observation protocols, effective use of data and technology to provide individualized instruction, and special education services. The majority of the budget for this category is for the following:
• Staff Development Teachers program• Curriculum and content professional learning• Leadership development• Instructional technology support
• Leadership and support to schools• Enriched and Innovative Instruction• Professional Growth Systems • Certification and Continuing Education programs• Program Evaluation and Research
School Operational Support ProgramsMCPS has a history of providing excellent services to schools by having efficient and timely operations, secure and modern facilities, and nurturing 21st cen-tury learning environments. School operational support programs are those that provide transportation, build-ing services and maintenance, safety and security, and other support services to students and schools. Specific programs include:
• Student transportation• Building services and maintenance• School safety and security• Facilities management and utilities• Food and nutrition services• Materials management
Systemwide Support ProgramsPrograms in this category include resources that sup-port and provide leadership for systemwide policies and academic priorities, provide operational leadership, and administer business services that support MCPS students, schools, and employees. The primary focus of these programs is to ensure resource allocations and support to schools and offices are aligned to our stra-tegic priorities and are distributed efficiently and effec-tively based on enrollment, student needs and the values of our community. However, it should be noted that one-third of the budget in this category is for retirees. Sys-temwide support includes:
• Planning and financial services• Systemwide technology support• Human Resources• Policy development and leadership• Communications• Accountability, Records, and Reporting
FY 2018 will maintain a similar distribution; however, a number of programs, which are described later in the document, will be targeted in ways to ensure that aca-demic success is not predictable by race, ethnicity, social economic status, language or disability.
CHAPTER 1 – 4 SCHOOLS

Schools
How Schools are Staffed As the majority of the MCPS budget pays for personnel and funds the instructional program in each school, a common question often asked concerns school staffing. Specifically, how does MCPS decide how many teach-ers, administrators, and support professionals work in each school? How does MCPS determine which schools will be allocated additional staff to have reduced class sizes compared to other schools? These and many other questions can be answered by reviewing the detailed staffing guidelines and formulas that are included in the budget (reference Appendix C) and are explained on the Budget 101 web page. Four principles guide school staffing in MCPS:
• Consistency—Schools with similar needs are allo-cated similar resources.
• Differentiation—Schools that serve students with greater needs receive greater resources.
• Flexibility—Building leaders have flexibility to use allocated resources to serve their students.
• Transparency—Decisions about allocations are shared so that everyone know why and when resources are allocated.
In following these principles, MCPS’ staffing formulas are based on three main factors—enrollment, need, and program. Core instructional program resources are allo-cated to all schools. These include administrators, teach-ers, and support staff as well as materials, media, and textbook funds. The guidelines used for allocations are provided in Appendix C and are based on the student enrollment in each grade level. Essentially, this means that two schools with the same enrollment in a given grade will be allocated the same number of teacher and other resources for those students. For example, in Grade 1, the guideline is 27. Grade 1 projected enroll-ment for each school is reviewed and the each school is allocated staffing to minimize when there is a class exceeding guideline. If a school has 100 students in Grade 1, the school will be allocated 4 teachers. If that number were 120, the school would be allocated 5 teach-ers. For elementary schools, this process is repeated for each grade in every school. For secondary schools, the allocation is made based on students in the school tak-ing seven classes and each teacher teaching five sec-tions. Similarly, allocations are made for other positions based on the formulas in Appendix C.
Next, MCPS differentiates staffing allocations based on the needs of the students the school serves. Schools that have more students who are economically disadvantaged receive additional staff to reduce class sizes and pro-vide additional support and interventions. For instance, in our higher-poverty elementary schools—Focus
schools—MCPS works to keep the average class size for Kindergarten and Grades 1 and 2 at 18 students or fewer. Therefore, based on enrollment, these schools receive additional allocations. In the previous example, the school with 100 Grade 1 students would receive six teachers compared to the core staffing of four teachers allocated to a non-impacted school. Other differentiated staffing include services for ESOL, alternative program, academic intervention, and focus staffing. These alloca-tions are based on the number of students in these pro-grams and the educational needs of those students.
Finally, MCPS also allocates staff and resources based on programs. If a school has a magnet, a special educa-tion center, or another type of program, additional staff is provided. These allocations are based on the number of students in the programs and the educational and learning needs of those students.
The K−12 Budget Staffing Guidelines and the Special Education Staffing Plan in Appendix C provide a com-prehensive list of how all positions are allocated. Each school’s staffing allocations can be found on the MCPS website in the Schools at a Glance document.
MCPS Performance Data and Data ManagementThe MCPS performance data reveal that while many stu-dents are performing well, a performance gap persists among some student groups.
To address this gap, in FY 2017, a new accountabil-ity structure was introduced to better monitor student achievement using multiple measures at critical points in a student’s educational journey. The new data mile-stones (see the Pre–K–12 Milestones chart that follows) will provide teachers, school leaders, district officials, and ultimately, the community, a clear indication of how students are performing. There is a particular focus on the data at the transitional levels as students move from primary to intermediate (Grade 2), intermediate to middle (Grade 5), middle to high (Grade 8), and in high school for preparedness for career, college, and commu-nity. These milestones monitor literacy and mathematics using multiple measures including classroom data and assessment performance at key thresholds of a student’s schooling.
As a result, MCPS will have a more complete under-standing of a student’s readiness for the next grade level as well as college and career readiness upon graduation. District level performance data will be available publicly to inform the community of system progress in prepar-ing students for college, career and community.
CHAPTER 1 – 5 SCHOOLS

Schools
What is the MCPS Budget Spent On?The MCPS FY 2017 Operating Budget %
Core Instructional Programs $ 1,162,931,490 47%
Elementary Instructional Programs $ 505,398,969
Middle School Instructional Programs 266,578,135
High School Instructional Programs 322,267,443
Student Services Learning 13,736
Outdoor Environmental Education Program 1,595,493
Career and Technology Education Program 5,541,644
School Library Media Program 37,676,266
Extracurricular and Athletic Programs 15,236,792
Special Programs 8,623,012
Programs That Provide Additional Support to Improve Student Achievement $ 660,247,758 27%
Prekindergarten and Headstart Programs $ 18,311,105
Elementary School Instructional Support Program 119,386,561
Middle School Instructional Support Program 25,483,936
High School Instructional Support Program 38,933,266
Coordinated Student Services Program 32,697,897
Interim Instructional Services 2,527,046
Summer School Programs 2,082,323
George B. Thomas Learning Academy 200,752
Maryland Meals for Achievement and Summer Meals Programs 7,007,663
Special Education Programs 413,617,209
Collaborative Partnership Programs to Improve Student Achievement $ 14,237,632 1%
Program to Support School Improvement and Ensure High Quality Instruction $ 128,535,879 5%
School Operational Support Programs $ 401,581,569 16%
Student Transportation Program $ 136,592,955
Field Trip Program 2,006,361
Building Services and Maintenance Programs 137,457,995
School Safety and Security Program 16,033,682
Facilities Management and Utilities Program 49,077,014
School Energy and Recycling Programs 1,457,721
Food and Nutritional Services Program 46,959,606
Materials Management Program 8,274,221
Team Works and Copy-Plus Programs 3,722,014
Systemwide Support Programs $ 89,939,433 4%
Total $ 2,457,473,761 100%
CHAPTER 1 – 6 SCHOOLS

Schools
Pre–K–12 Milestones Moving Through the Learning Journey
Primary Foundation
Intermediate
Middle
High AT EACH MILESTONE
Exit Question: Are our students ready
for the next level?
Entry Question: Did our students
make a successful transition?
The following charts depict the gaps that exist at each transitional grade level in reading and mathematics using trend arrows comparing the 2016 data to 2014 data. The data reveal we have gaps in performance among our student groups that need to be reduced with focused efforts and resources. Across most data points, a 30-point gap exists between Asian and White student groups and Black/African American and Hispanic/Latino student groups. Substantial gaps also exist for students who are English language learners, receive Free and Reduced-price Meals System (FARMS) services, and spe-cial education services.
MCPS Assessment Program–Primary Reading (Grade 2)
Data reveals that for the past three years, a 20- to 30-point gap was observed for Black/African American and His-panic/Latino students compared to their racial/ethnic peers with the percent of students meeting the end-of-year benchmark for Grade 2 on Assessment Program in Primary Reading (AP-PR). Additionally, a 20-point gap was observed each year for Limited English Proficient (LEP) students and students receiving FARMS services compared to all students.
Trend Arrow Key:
→ indicates > 2 percentage point increase
↔ indicates 0.1 to 1.9 percentage point change in either direction
→
indicates > 2 percentage point decrease
2013–2014
2014–2015
Preliminary 2015–2016
MCPS (Assessment Program-Primary Reading: Grade 2)
Actual Actual Actual Trend
All Students 71.3 71.8 70.1 ↔
Asian 82.6 82.7 83.6 ↔
Black/African American 66.0 68.2 63.5 ↔
Hispanic/Latino 56.9 56.2 55.1 ↔
Two or More Races 80.3 85.0 78.4
→
White 82.2 83.4 83.0 ↔
Special Education 31.0 29.1 29.5 ↔
LEP 58.0 56.6 54.5
→
FARMS 57.0 56.9 54.6
→
Measures of Academic Progress–Primary Grades (Grade 2)
Data below detail the percent of students meeting the 50th percentile or higher on the Measures of Academic Progress–Primary Grades (MAP-P). A 25- to 30-point gap exists for Black/African American and Hispanic/Latino students compared to their Asian, White, and students identified as two or more races counterpoints.
2013–2014
2014–2015
Preliminary 2015–2016
Measures of Academic Progress-Primary Grades: Grade 2
Actual Actual Actual Trend
All Students 69.1 69.9 69.7 ↔
Asian 86.7 87.8 88.0 ↔
Black/African American 56.5 58.3 57.0 ↔
Hispanic/Latino 49.3 50.2 51.2 ↔
Two or More Races 80.4 84.3 81.4 ↔
White 86.8 87.5 87.6 ↔
Special Education 36.2 36.0 37.8 ↔
LEP 52.5 52.2 52.8 ↔
FARMS 47.2 48.1 48.7 ↔
CHAPTER 1 – 7 SCHOOLS

Schools
Measures of Academic Progress–Reading (Grade 5)Data below detail the percent of students meeting the 50th percentile or higher on the Measures of Academic Progress–Reading (MAP-R).
2013–2014
2014–2015
2015–2016
Measures of Academic Progress-Reading Grade 5
Actual Actual Actual Trend
All Students 62.2 62.8 65.9 →
Asian 78.1 79.2 82.8 →
Black/African American 45.8 48.8 53.6 →
Hispanic/Latino 38.0 38.4 44.3 →Two or More Races 76.4 71.6 77.5 ↔
White 81.6 82.6 84.1 →
Special Education 22.7 19.5 27.8 →
LEP 28.5 30.6 29.8 ↔
FARMS 35.1 37.4 41.7 →
Measures of Academic Progress–Mathematics (Grade 5)
Data below detail the percent of students meeting the 50th percentile or higher on the Measures of Academic Progress–Mathematics (MAP-M). About a 35- to 40-point gap was observed across the three years between Asian and Black/African American and Hispanic/Latino stu-dents. A close to 50-point gap exists between Asian and Black/African American and Hispanic/Latino students.
2013–2014
2014–2015
2015–2016
Measures of Academic Progress-Reading Grade 5
Actual Actual Actual Trend
All Students 56.4 58.9 53.9
→
Asian 78.9 81.5 80.5 ↔
Black/African American 37.5 40.9 33.8
→
Hispanic/Latino 33.5 34.8 31.6 ↔
Two or More Races 71.0 68.3 66.2
→
White 76.2 78.1 73.0
→
Special Education 17.1 19.1 20.3 →
LEP 28.7 31.2 23.7
→
FARMS 30.0 33.1 28.5 ↔
Measures of Academic Progress–Reading (Grade 8)Data below detail the percent of students meeting the 50th percentile or higher on the Measures of Academic Progress-Reading (MAP-R).
2013–2014
2014–2015
2015–2016
Measures of Academic Progress—Reading Grade 8
Actual Actual Actual Trend
All Students 65.6 64.8 72.6 →
Asian 80.1 83.0 86.7 →
Black/African American 50.3 47.9 59.8 →
Hispanic/Latino 44.1 41.1 51.5 →
Two or More Races 75.3 76.0 83.6 →
White 83.9 83.6 89.7 →
Special Education 25.4 23.7 32.9 →
LEP 20.4 18.5 22.1 →
FARMS 38.6 37.0 48.3 →
Algebra I by Grade 8 with C or higherData detail the percent of students who earned a C or higher in Algebra I by Grade 8.
2013–2014
2014–2015
2015–2016
Algebra I by Grade 8 with C or higher Actual Actual Actual Trend
All Students 55.8 51.5 53.5
→
Asian 78.9 76.0 76.7 ↔
Black/African American 37.4 32.3 35.2
→
Hispanic/Latino 33.5 28.4 30.2
→
Two or More Races 65.1 63.9 65.0 ↔
White 73.8 69.6 70.4 ↔
Special Education 15.0 11.2 19.1 →
LEP 26.7 14.0 16.6
→
FARMS 29.5 24.5 26.9
→
CHAPTER 1 – 8 SCHOOLS

Schools
Algebra 2 by Grade 11 with C or higherData detail the percent of students who earned a C or Higher in Algebra 2 by the end of Grade 11.
2013–2014
2014–2015
2015–2016
Measures of Academic Progress—Reading Grade 8
Actual Actual Actual Trend
All Students 63.9 65.7 71.8 →
Asian 81.1 83.6 84.7 →
Black/African American 48.0 49.5 58.2 →
Hispanic/Latino 45.0 44.8 46.2 ↔
Two or More Races 64.4 72.7 75.0 →White 77.2 79.2 83.4 →
Special Education 27.3 27.8 29.1 ↔
LEP 38.7 39.6 42.6 →
FARMS 41.6 43.9 46.9 →
To enhance monitoring of the new accountability sys-tem, MCPS is piloting a new comprehensive assessment and data analytics platform to better assist school and district leaders in using performance data to improve student outcomes. The system provides real time access to student data and allows school and central office leaders to analyze the data to inform instruction and determine support necessary for student success. MCPS plans to continue to expand implementation of this valu-able data management tool in the coming school year.
Targeted Strategies to Eliminate DisparitiesWhile MCPS has a long history of high performance for many students, there are students who have not excelled. We must maintain the high levels of performance, and increase performance for those students not achieving at their potential. MCPS is dedicated to creating a school system where academic success is not predictable by race, ethnicity, socioeconomic status, language, or dis-ability. This can be achieved through our core Strategic Priority of improving teaching and learning to provide a strong academic program throughout MCPS and achiev-ing Academic Excellence for All. This core Strategic Pri-ority of improving teaching and learning is supported by our plans to focus on the following four strategic priority areas (1) learning, accountability, and results; (2) com-munity partnerships and engagement; (3) human capital management; and (4) operational excellence.
To achieve our goal of Academic Excellence for All, MCPS directed significant resources in FY 2017 and con-tinuing in FY 2018 to reduce class size, provide targeted
teacher and support staff to work with students, improve professional development, and enhance career prepara-tion and college readiness programs.
Improve Teaching and LearningOne of the approaches MCPS is implementing is class size reduction. The FY 2017 Operating Budget included $21.2 million in new investments to support 280 addi-tional classroom teacher positions. This has enabled MCPS to change the elementary class size guidelines that are used to allocate staff to schools. In our highest poverty schools—Focus schools—some class size guide-lines are further reduced for some grade levels; however, the guidelines are being changed for non-Focus schools as well. The FY 2018 Operating Budget reflects MCPS’ commitment to continuing to ensure students are learn-ing at high levels and to invest additional resources where they are needed. It should be noted that chang-ing the guidelines does not mean that every elementary class has smaller classes in each grade level. For classes that already are at or less than the new guidelines the number of students in the classroom will not change; however, schools that have several classrooms that exceed the new guidelines will receive additional teach-ers to create smaller classes.
For our secondary schools, the FY 2017 Operating Bud-get allowed for reduced class size guidelines for math-ematics, science, social studies, reading, and foreign language classes. It is important to remember that class size guidelines are not the same as average class sizes. Principals use their teacher positions to offer a wide range of course offerings to students while keeping the size of core content classes manageable. The addi-tional classroom teachers for secondary schools allow us to minimize the number of classes exceeding the class size guidelines, reduce the average class sizes in all our schools, and reduce class sizes to address our priority of closing the achievement gap. The Budget 101 web page includes more information about how teaching posi-tions are allocated. For FY 2018 MCPS will continue to provide resources to maintain these class sizes.
There are several other areas of emphasis that improve teaching and learning in MCPS. For example, improving the teaching and learning of literacy and mathematics will help ensure that all students not only have a solid foundation across all content areas but also possess the critical and creative thinking skills necessary to be col-lege and career ready. The FY 2017 Operating Budget included $6.4 million to fund 115 new teacher and para-educator positions to assist in math and literacy. MCPS is implementing a pilot curriculum project, Ready Com-mon Core, in 11 elementary schools in the 2016-2017 school year. The project includes greater support for
CHAPTER 1 – 9 SCHOOLS

Schools
students, professional learning for teachers, and detailed monitoring to assess student progress. The district will monitor the project carefully throughout the year.
At the same time, MCPS is rethinking its mathematics program, carefully examining course content, sequence, programs, and access to improve achievement. MCPS also is working to identify external partners who can assist in improving outcomes for students.
In addition, MCPS will spend approximately $3.5 million in the 2016-2017 school year on new summer training in literacy, elementary mathematics, Algebra 1, Algebra 2, and Math 8. A new Sister School effort at the elemen-tary level will encourage collaboration among teach-ers across schools to promote best practices by using classroom observations, data analysis, and collaborative planning to lead to better outcomes for students. At the secondary level, MCPS will employ a year-long cohort learning model for 25 secondary school teams (8 high schools, 17 middle schools) to improve teaching and learning of mathematics. Teams will include paraedu-cators in professional learning to support their work in small groups with students. In addition, ESOL and METS teachers will be included in the training to improve their content knowledge. The central office will continue to support innovative approaches and professional learn-ing through the Instructional Core Team model.
MCPS also will provide additional summer training to improve literacy instruction at the elementary level and in English, science, and social studies courses at the sec-ondary level with a particular emphasis on improving student writing.
One of the most pronounced and persistent gaps in achievement continues to be among students with dis-abilities. MCPS is investing $1 million in the 2016-2017 school year to expand the Elementary Home School Model to increase the number of special education stu-dents who are served in their home feeder pattern. This will increase the students' access to rigorous instruction and content in literacy and mathematics and increase the amount of time they are receiving services in the least restrictive environment. For FY 2018 this initiative will expand to additional schools.
To address the underperformance of students with lim-ited English proficiency, MCPS has a three-pronged approach:
• Increase capacity of general education teachers to work with ESOL students through professional development.
• Use research-based best practices such as the Shel-tered Instruction Observation Tool to design and
deliver lessons helps to ensure that both ESOL and general education teachers have the tools to meet the unique educational needs of these students.
• Continue to deploy English Language Development Teachers/Coaches in identified schools to build the capacity of general education staff to support the lan-guage and academic content needs of ESOL students.
To improve teaching and learning, MCPS also strives to provide a variety of learning opportunities based on the identified needs and myriad interests of students. The work of FY 2017 will be continued into FY 2018 with additional funding focused on increasing opportuni-ties for students to participate in rigorous coursework, programs, and co-curricular activities including career technology expansion, dropout prevention, robotics, coding and other Science, Technology, Engineering, and Mathematics programs and immersion programs. This will include the expansion of achievement-focused extracurricular programs to all of our middle schools to increase outcomes and opportunities for students.
Career preparation is growing in importance and it is imperative that all students develop the skills necessary to be successful in whatever career path they ultimately choose. MCPS offers 34 Career and Technology Educa-tion pathways and is working to increase exposure to these pathways for middle and high school students. Increasing exposure and access as well as concentrated effort to identify students who could benefit from these programs will lead to an increase in the number of stu-dents who complete the pathways with certifications, licensures, and preparation for meaningful careers. MCPS also is expanding access to career preparation programs for those students who come to the school district but may not be able to earn enough credits to graduate. The Career Readiness Education Academy has been designed to assist these students—the major-ity of whom are English language learners—receive English language instruction and career education to prepare them for the workforce. This program began in 2016 and will continue to add seats in the coming years as demand increases.
Another effort to increase the number of students from underrepresented groups who will be college and career ready is the Equal Opportunity Schools initiative. This work in four high schools during the 2016-2017 school year focuses on identifying those students who may be successful in Advanced Placement or International Bac-calaureate programs but are not enrolled in these rigor-ous classes. This program helps identify these students and works with the schools to support them so that they can be successful in these advanced courses. For FY 2018, the initiative will extend to an additional six schools.
CHAPTER 1 – 10 SCHOOLS

Schools
MCPS also is working with Montgomery College to break down barriers that might be preventing MCPS gradu-ates from accessing credit-bearing courses at the Col-lege. Removing barriers and providing more supports to students will increase the likelihood of students complet-ing their Associate’s degree and entering the workforce or continuing on to complete a Bachelor’s degree.
These are among the efforts across the district to invest in promising practices to boost student achievement. The district is committed to using every dollar entrusted to it to further student success and build a stronger com-munity for everyone.
In addition, there are initiatives addressed in other chap-ters of this budget targeted to improve teaching and learning.
Focus on Learning, Accountability, and ResultsIn the FY 2018 budget, we will implement systemwide data tools for all MCPS schools that will provide infor-mation to support learning. In addition, we will imple-ment the Maryland Online Individualized Education Program (IEP)/504 Plan developed by MSDE that facili-tates the entire process including IEP development, meetings, tracking, and reporting. MCPS will implement a secondary school planner for all students. Improving opportunities for students is an important aspect of our plan. Another strategy we will use will include provid-ing resources so that the fee will be paid by MCPS for any student in Grade 11 who is interested in taking an SAT or ACT exam.
Focus on Human CapitalRegardless of their role, all MCPS employees must pos-sess the ability to assist the school district to achieve our goal of Academic Excellence for All. To do so, plans for FY 2018 include resources for professional development that will include training for teachers to address effective instructional strategies, enhanced content knowledge, as well as cultural competence and implicit bias. Other increases in support of our human capital are found in later chapters of this budget. They include developing a pathway for paraeducators and other support services staff to become teachers and accelerated work by the Equity Initiatives Unit. The addition of four equity spe-cialists in FY 2017, resulted in each specialist support-ing fewer schools so they can spend more time working with each school leadership team and staff. The Equity Initiatives Unit will continue to expand its work with schools to ensure that equity is an integral part of the School Improvement Plan. Building and enhancing the cultural proficiency of staff members will enable them to better understand, relate to, and serve their students.
Focus on Community and PartnershipsAnother strategic objective for MCPS is building public and private partnerships with families and communities that result in meeting the needs of students and fami-lies in and out of schools. The resources for this initiative can be found Chapter 6 and Chapter 10. In the FY 2017 budget, MCPS allocated additional elementary counsel-ors, parent community coordinators, psychologists, and pupil personnel workers to assist our students and their families with the support and opportunities they need to help them be successful.
Many students need support beyond the classroom in order to be successful, and the goal is to ensure that the necessary services and community supports are in place to help every student thrive. In the 2016-2017 school year, Child First, in partnership with Action in Mont-gomery, is piloting a program at Burnt Mills and South Lake elementary schools explicitly focused at support-ing parents and helping them become more engaged in their children’s schooling. The pilot offers robust after-school activities and parent training sessions.
Eleven middle and high schools are part of a pilot imple-menting Restorative Justice as the primary method to reduce suspensions, expulsions, and disciplinary refer-rals. The goal of this alternative to traditional disciplin-ary action is to place value on relationships, focus on repairing relations between the victim and wrongdoer, and resolve harm caused. Professional learning and support are provided to schools to assist with the imple-mentation of restorative practices in alignment with MCPS discipline policies and regulations.
For FY 2018, additional resources are included to expand robotics courses and co-curricular programs in our schools. MCPS will work with partner agencies to establish these programs. It is critical that our students have 21st century skills in science, technology, engi-neering, and mathematics to be successful in college or their future career. The FY 2018 budget also includes resources to create an East County elementary arts program. Art education at the elementary school level has been shown to support student growth and devel-opment. Finally, funding is included in this chapter to expand the Achieving Collegiate Excellence and Success (ACES) program to five additional schools in FY 2018. To assist students who may be the first in their families to go to college, MCPS is continuing to partner with Mont-gomery College and The Universities at Shady Grove through the ACES program. This program begins iden-tifying students as they enter high school and pairs them with a coach to support them in preparing for a success-ful entry into college. Now at 11 schools, the program has aided more than 1,700 students in preparing for postsecondary work.
CHAPTER 1 – 11 SCHOOLS

Schools
Focus on Operational ExcellenceOperational excellence results in schools having the resources and supports required to deliver on the promise of excellence and equity for all students. This includes creating efficiencies and ensuring effective operations through updating and enhancing busi-ness systems including the Financial Management and Human Resources systems. In addition, funding is being increased to enhance air quality and maintenance support and prevention programs. These changes are reflected in Chapters 7 through 9 of the budget.
CHAPTER 1 – 12 SCHOOLS
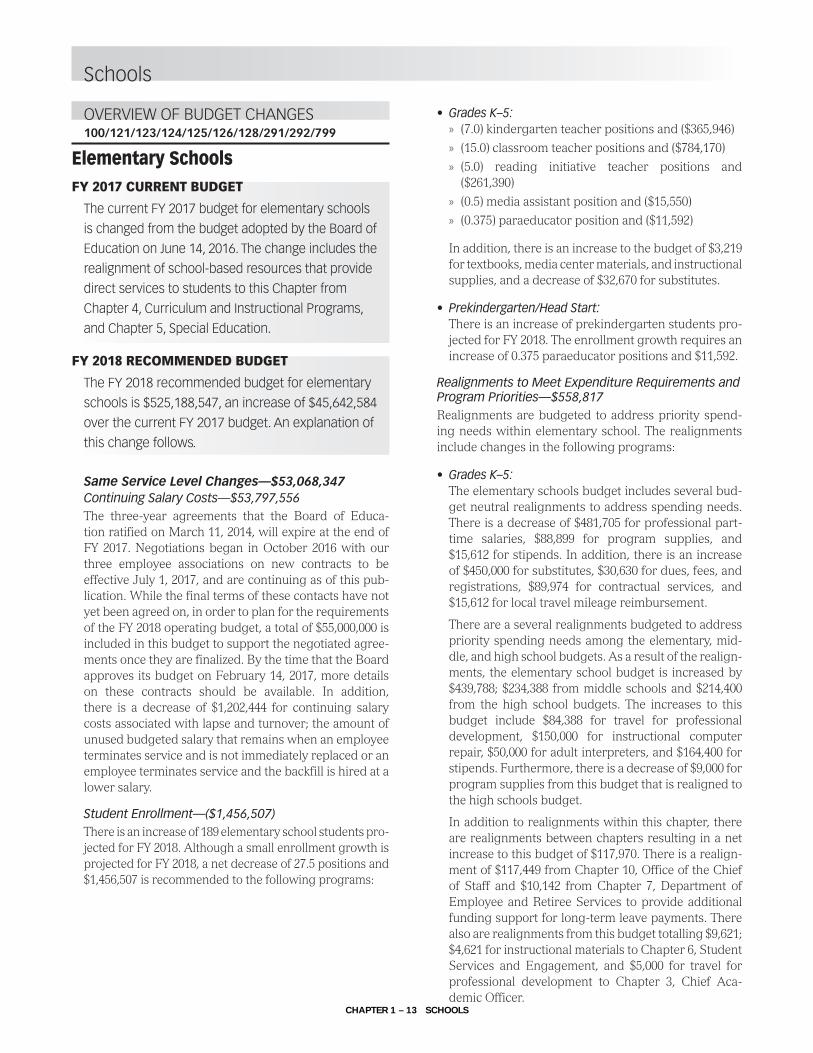
Schools
OVERVIEW OF BUDGET CHANGES 100/121/123/124/125/126/128/291/292/799
Elementary SchoolsFY 2017 CURRENT BUDGET
The current FY 2017 budget for elementary schools
is changed from the budget adopted by the Board of
Education on June 14, 2016. The change includes the
realignment of school-based resources that provide
direct services to students to this Chapter from
Chapter 4, Curriculum and Instructional Programs,
and Chapter 5, Special Education.
FY 2018 RECOMMENDED BUDGET
The FY 2018 recommended budget for elementary
schools is $525,188,547, an increase of $45,642,584
over the current FY 2017 budget. An explanation of
this change follows.
Same Service Level Changes—$53,068,347Continuing Salary Costs—$53,797,556The three-year agreements that the Board of Educa-tion ratified on March 11, 2014, will expire at the end of FY 2017. Negotiations began in October 2016 with our three employee associations on new contracts to be effective July 1, 2017, and are continuing as of this pub-lication. While the final terms of these contacts have not yet been agreed on, in order to plan for the requirements of the FY 2018 operating budget, a total of $55,000,000 is included in this budget to support the negotiated agree-ments once they are finalized. By the time that the Board approves its budget on February 14, 2017, more details on these contracts should be available. In addition, there is a decrease of $1,202,444 for continuing salary costs associated with lapse and turnover; the amount of unused budgeted salary that remains when an employee terminates service and is not immediately replaced or an employee terminates service and the backfill is hired at a lower salary.
Student Enrollment—($1,456,507)There is an increase of 189 elementary school students pro-jected for FY 2018. Although a small enrollment growth is projected for FY 2018, a net decrease of 27.5 positions and $1,456,507 is recommended to the following programs:
• Grades K–5: » (7.0) kindergarten teacher positions and ($365,946) » (15.0) classroom teacher positions and ($784,170) » (5.0) reading initiative teacher positions and
($261,390) » (0.5) media assistant position and ($15,550) » (0.375) paraeducator position and ($11,592)
In addition, there is an increase to the budget of $3,219 for textbooks, media center materials, and instructional supplies, and a decrease of $32,670 for substitutes.
• Prekindergarten/Head Start:There is an increase of prekindergarten students pro-jected for FY 2018. The enrollment growth requires an increase of 0.375 paraeducator positions and $11,592.
Realignments to Meet Expenditure Requirements and Program Priorities—$558,817Realignments are budgeted to address priority spend-ing needs within elementary school. The realignments include changes in the following programs:
• Grades K–5:The elementary schools budget includes several bud-get neutral realignments to address spending needs. There is a decrease of $481,705 for professional part-time salaries, $88,899 for program supplies, and $15,612 for stipends. In addition, there is an increase of $450,000 for substitutes, $30,630 for dues, fees, and registrations, $89,974 for contractual services, and $15,612 for local travel mileage reimbursement.
There are a several realignments budgeted to address priority spending needs among the elementary, mid-dle, and high school budgets. As a result of the realign-ments, the elementary school budget is increased by $439,788; $234,388 from middle schools and $214,400 from the high school budgets. The increases to this budget include $84,388 for travel for professional development, $150,000 for instructional computer repair, $50,000 for adult interpreters, and $164,400 for stipends. Furthermore, there is a decrease of $9,000 for program supplies from this budget that is realigned to the high schools budget.
In addition to realignments within this chapter, there are realignments between chapters resulting in a net increase to this budget of $117,970. There is a realign-ment of $117,449 from Chapter 10, Office of the Chief of Staff and $10,142 from Chapter 7, Department of Employee and Retiree Services to provide additional funding support for long-term leave payments. There also are realignments from this budget totalling $9,621; $4,621 for instructional materials to Chapter 6, Student Services and Engagement, and $5,000 for travel for professional development to Chapter 3, Chief Aca-demic Officer.
CHAPTER 1 – 13 SCHOOLS

Schools
• Prekindergarten/Head Start:There is a realignment of $1,145 from Division of Early Childhood and Title I Programs and Services’ budget to fund a 0.025 FTE paraeducator position and $1,059 in this department’s school-based budget. In Addition, $86 is realigned to the Department of Employee and Retiree Services budget for employee related benefits.
Other—$168,481• Grades K–5:
Applying an inflation factor of 2 percent increases the budget for textbooks, media center materials, and instructional supplies by $168,481.
Program Efficiencies and Reductions—($9,058,875)The FY 2018 recommended budget for elementary schools includes a comprehensive effort to identify potential program efficiencies and reductions. Stake-holders, including community partners and employee union representatives, participated in the program effi-ciencies and reduction process.
There is a reduction in the elementary school budget of 109.75 positions and $5,548,325. The positions are as follows:
• (35.5) reading initiative teacher positions and ($1,855,869)
• (70.75) instructional data analyst positions and ($3,509,483)
• (3.5) classroom teacher positions and ($182,973)
The inflation amount of $168,481 budgeted for textbooks, media center materials, and instructional supplies is elimi-nated. Efficiencies will be necessary to ensure that schools have required textbooks, and instructional supplies.
In addition, there is a reduction of $116,600 for travel for professional development, $44,750 for summer employment salaries, $936,896 for instructional materi-als, $146,867 for substitutes, $2,035,416 for staff devel-opment stipends, $13,996 for furniture and equipment replacement, and $47,544 for stipends.
Strategic Accelerator—$1,633,112
• Improve Teaching and Learning—$217,834There are two strategic accelerators that focus on improving teaching and learning. They are as follows:
» Implementation of a two-way immersion/dual lan-guage programs at elementary schools, and plan for middle school options for FY 2019. To fund this strategic accelerator, the budget is increased by $188,234; $58,234 for teacher training, $50,000 for contractual services, $50,000 for instructional materials, and $30,000 for student transportation. In addition, $4,455 for employee benefits is added
to Chapter 7, Department of Employee and Retiree Services budget.
» Implementation of Highly Gifted Center programs at home schools to create additional spaces avail-able for students and to expand outreach efforts for the program. The proposed budget includes $19,600 for teacher stipends, and $10,000 in contractual ser-vices. Additionally, $1,499 for employee benefits is added to Chapter 7, Department of Employee and Retiree Services budget.
• Focus on Learning, Accountability and Results—$1,113,000
» This budget includes a strategic accelerator totaling $1,113,000 to support the implementation of a sys-temwide data tool for all schools.
• Focus on Human Capital—$170,000 There are two strategic accelerators that focus on human capital. They are as follows:
» Providing professional development for teachers that will include effective strategies, content knowl-edge, as well as cultural competence. The amount budgeted for this strategic accelerator is $100,000 for contractual services.
» Developing and implementing pathways for sup-porting services staff who want to become teach-ers to build our workforce with highly effective and committed educators. This budget includes $70,000 for teacher stipends. In addition, $5,355 for employee benefits is added to Chapter 7, Depart-ment of Employee and Retiree Services.
• Focus on Community Partnerships and Engagement—$132,278
» This budget includes a strategic accelerator that sup-ports the creation of an East County arts elementary program that will embed music in the weekly learning experience for students. For this purpose, the bud-get for this department will be increased by $52,278 and 1.0 elementary music teacher position, $45,000 in contractual services, and $35,000 for instructional materials and music instruments. In addition, $17,466 for employee benefits is added to Chapter 7, Depart-ment of Employee and Retiree Services.
CHAPTER 1 – 14 SCHOOLS
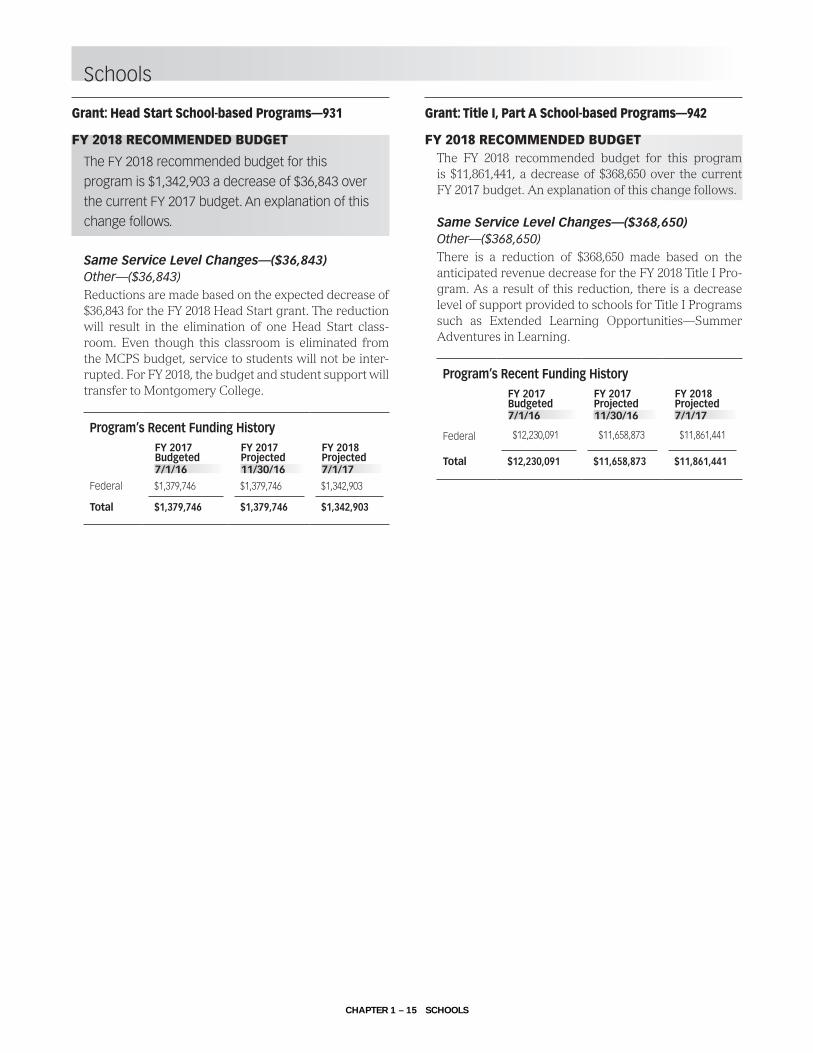
Schools
Grant: Head Start School-based Programs—931
FY 2018 RECOMMENDED BUDGET
The FY 2018 recommended budget for this
program is $1,342,903 a decrease of $36,843 over
the current FY 2017 budget. An explanation of this
change follows.
Same Service Level Changes—($36,843)Other—($36,843)Reductions are made based on the expected decrease of $36,843 for the FY 2018 Head Start grant. The reduction will result in the elimination of one Head Start class-room. Even though this classroom is eliminated from the MCPS budget, service to students will not be inter-rupted. For FY 2018, the budget and student support will transfer to Montgomery College.
Program’s Recent Funding HistoryFY 2017Budgeted7/1/16
FY 2017Projected11/30/16
FY 2018Projected7/1/17
Federal $1,379,746 $1,379,746 $1,342,903
Total $1,379,746 $1,379,746 $1,342,903
Grant: Title I, Part A School-based Programs—942
FY 2018 RECOMMENDED BUDGETThe FY 2018 recommended budget for this program is $11,861,441, a decrease of $368,650 over the current FY 2017 budget. An explanation of this change follows.
Same Service Level Changes—($368,650)Other—($368,650)There is a reduction of $368,650 made based on the anticipated revenue decrease for the FY 2018 Title I Pro-gram. As a result of this reduction, there is a decrease level of support provided to schools for Title I Programs such as Extended Learning Opportunities—Summer Adventures in Learning.
Program’s Recent Funding HistoryFY 2017Budgeted7/1/16
FY 2017Projected11/30/16
FY 2018Projected7/1/17
Federal $12,230,091 $11,658,873 $11,861,441
Total $12,230,091 $11,658,873 $11,861,441
CHAPTER 1 – 15 SCHOOLS
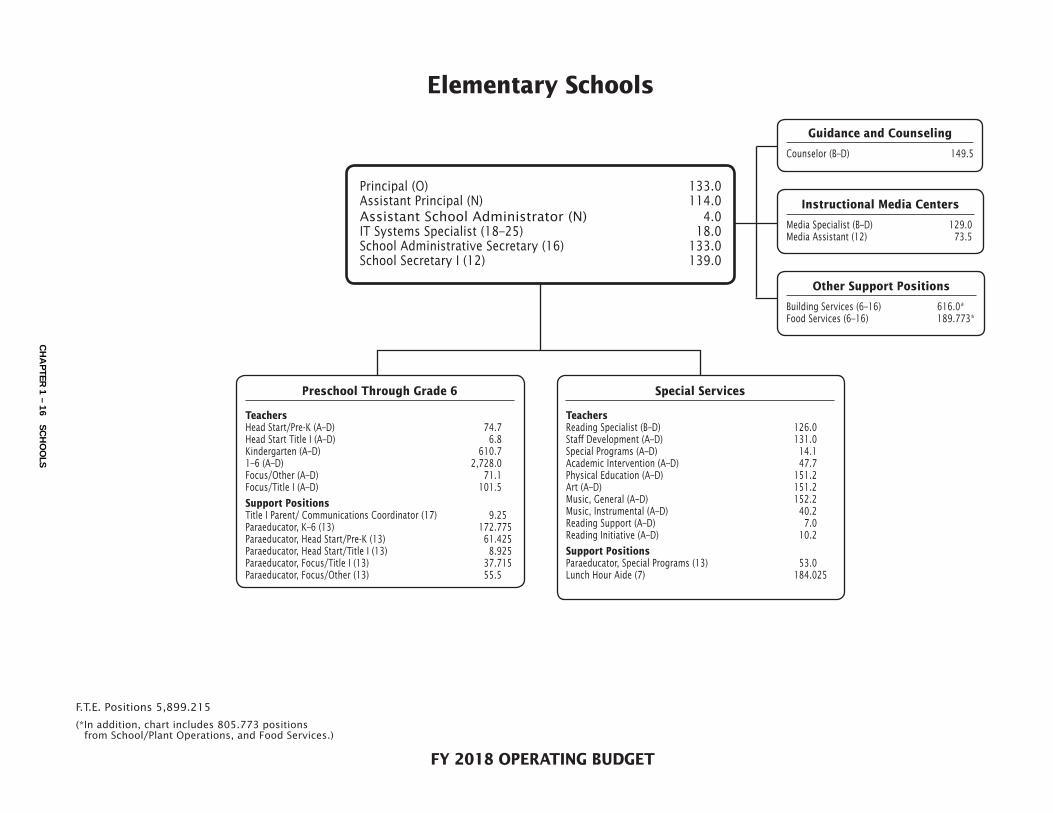
FY 2018 OPERATING BUDGET
F.T.E. Positions 5,899.215
(* In addition, chart includes 805.773 positions from School/Plant Operations, and Food Services.)
Elementary Schools
Guidance and Counseling
Counselor (B–D) 149.5
Instructional Media Centers
Media Specialist (B–D) 129.0Media Assistant (12) 73.5
Other Support Positions
Building Services (6–16) 616.0*Food Services (6–16) 189.773*
Special Services
TeachersReading Specialist (B–D) 126.0Staff Development (A–D) 131.0Special Programs (A–D) 14.1Academic Intervention (A–D) 47.7Physical Education (A–D) 151.2Art (A–D) 151.2Music, General (A–D) 152.2Music, Instrumental (A–D) 40.2Reading Support (A–D) 7.0Reading Initiative (A–D) 10.2
Support PositionsParaeducator, Special Programs (13) 53.0Lunch Hour Aide (7) 184.025
Preschool Through Grade 6
TeachersHead Start/Pre-K (A–D) 74.7Head Start Title I (A–D) 6.8Kindergarten (A–D) 610.71–6 (A–D) 2,728.0Focus/Other (A–D) 71.1Focus/Title I (A–D) 101.5
Support PositionsTitle I Parent/ Communications Coordinator (17) 9.25Paraeducator, K–6 (13) 172.775Paraeducator, Head Start/Pre-K (13) 61.425Paraeducator, Head Start/Title I (13) 8.925Paraeducator, Focus/Title I (13) 37.715Paraeducator, Focus/Other (13) 55.5
Principal (O) 133.0Assistant Principal (N) 114.0Assistant School Administrator (N) 4.0IT Systems Specialist (18–25) 18.0School Administrative Secretary (16) 133.0School Secretary I (12) 139.0
CH
AP
TER 1 – 16 S
CH
OO
LS

Elementary Schools - 121/100/123/124/125/126/128/291/292/799/931
Actual FY 2017Budget
FY 2017Current
FY 2018Request
FY 2018
Summer EmploymentProfessional Substitutes
93,910 93,910 49,160 (44,750)(29,537)
Total Positions (FTE)Position Salaries
5,498.950$415,315,968
5,735.525$434,601,929
5,871.250$443,527,050
5,735.025$435,490,885
Other Salaries
01 Salaries & Wages
9,220,809 9,220,809 9,191,272
Stipends 5,307,083 5,307,083 3,440,745 (1,866,338)Professional Part Time
ConsultantsOther Contractual
OfficeOther Supplies & Materials
MediaInstructional Supplies & Materials
Textbooks
Subtotal Other Salaries
Leased Equipment
Grand Total
Other Equipment
Total Salaries & Wages
02 Contractual Services
Total Contractual Services
03 Supplies & Materials
Total Supplies & Materials
04 Other
Total Other
05 Equipment
Total Equipment
Supporting Services Part TimeOther
604,5751,656,104
604,5751,656,104
97,8701,756,104
66,156,873 55,305,000
(506,705)100,000
477,908
145,510587,001
732,511
145,510587,001
732,511
145,5102,047,400
2,192,910 1,460,399
1,460,399
6,703,574
1,942,803927,203
5,254,445
299,613
8,424,064
1,942,803927,203
5,254,445
299,613
8,424,064
4,399,987
351,714
1,943,586927,580
7,622,867
52,101
783377
(854,458)
(801,197)
439,721,797 462,336,283 471,261,404 516,182,909 44,921,505
10,851,873 10,851,873
24,405,829 27,734,354 27,734,354 80,692,024 52,957,670
$447,144,059
101,371
149,100
$472,000,588
88,228
237,328
149,10088,228
237,328
$480,925,709
223,332
223,332
$526,531,450
(13,996)
74,232(88,228)
$45,605,741
ChangeDescription FY 2016
(136.225)($8,036,165)
Insur & Employee BenefitsUtilitiesMiscellaneous
139,409
186,652
270,402
186,652
270,402
216,652
309,432
30,000
39,030
Local/Other Travel 83,750 83,750 92,780 9,030
CHAPTER 1 – 17 SCHOOLS
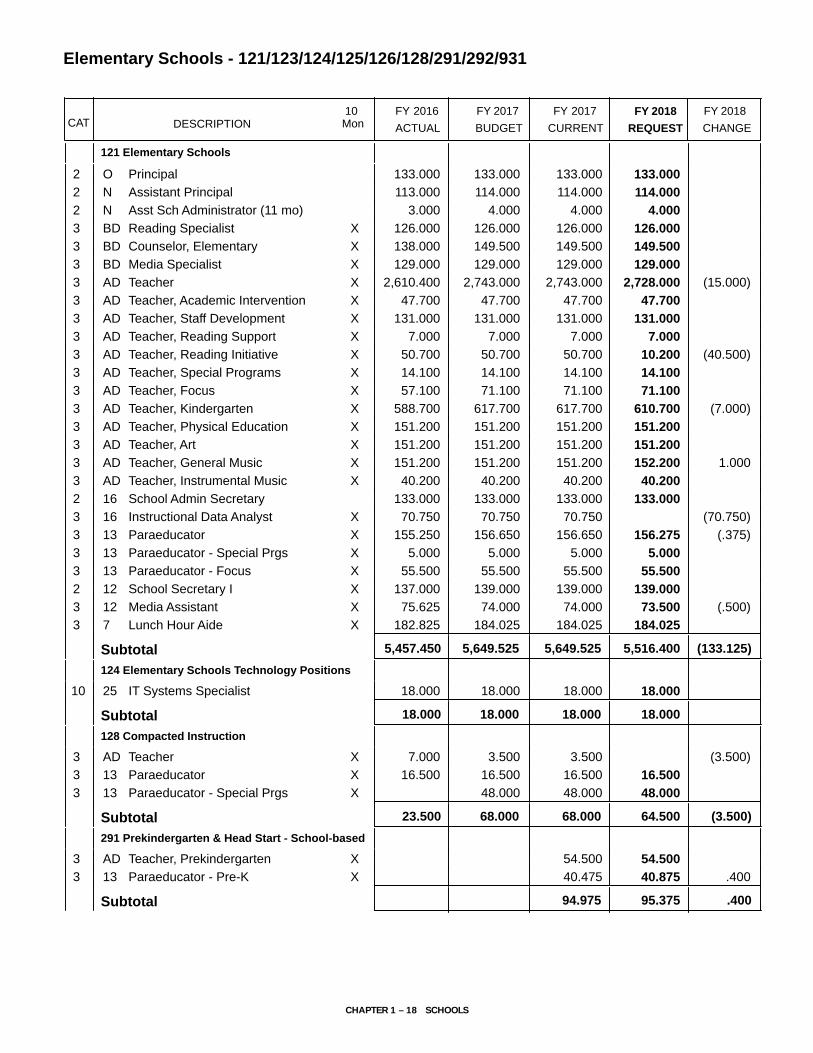
DESCRIPTION CURRENTFYBUDGET
FYACTUAL
20172016 10Mon
FY 2017CAT CHANGE
2018FY
Elementary Schools - 121/123/124/125/126/128/291/292/931
REQUEST
2018FY
121 Elementary Schools
2 133.000 133.000 133.000PrincipalO 133.000
2 113.000 114.000 114.000Assistant PrincipalN 114.000
2 3.000 4.000 4.000Asst Sch Administrator (11 mo)N 4.000
3 126.000 126.000 126.000XReading SpecialistBD 126.000
3 138.000 149.500 149.500XCounselor, ElementaryBD 149.500
3 129.000 129.000 129.000XMedia SpecialistBD 129.000
3 2,610.400 2,743.000 2,743.000XTeacherAD (15.000)2,728.000
3 47.700 47.700 47.700XTeacher, Academic InterventionAD 47.700
3 131.000 131.000 131.000XTeacher, Staff DevelopmentAD 131.000
3 7.000 7.000 7.000XTeacher, Reading SupportAD 7.000
3 50.700 50.700 50.700XTeacher, Reading InitiativeAD (40.500)10.200
3 14.100 14.100 14.100XTeacher, Special ProgramsAD 14.100
3 57.100 71.100 71.100XTeacher, FocusAD 71.100
3 588.700 617.700 617.700XTeacher, KindergartenAD (7.000)610.700
3 151.200 151.200 151.200XTeacher, Physical EducationAD 151.200
3 151.200 151.200 151.200XTeacher, ArtAD 151.200
3 151.200 151.200 151.200XTeacher, General MusicAD 1.000152.200
3 40.200 40.200 40.200XTeacher, Instrumental MusicAD 40.200
2 133.000 133.000 133.000School Admin Secretary16 133.000
3 70.750 70.750 70.750XInstructional Data Analyst16 (70.750)3 155.250 156.650 156.650XParaeducator13 (.375)156.275
3 5.000 5.000 5.000XParaeducator - Special Prgs13 5.000
3 55.500 55.500 55.500XParaeducator - Focus13 55.500
2 137.000 139.000 139.000XSchool Secretary I12 139.000
3 75.625 74.000 74.000XMedia Assistant12 (.500)73.500
3 182.825 184.025 184.025XLunch Hour Aide7 184.025
5,457.450 5,649.525 5,649.525Subtotal (133.125)5,516.400
124 Elementary Schools Technology Positions
10 18.000 18.000 18.000IT Systems Specialist25 18.000
18.000 18.000 18.000Subtotal 18.000
128 Compacted Instruction
3 7.000 3.500 3.500XTeacherAD (3.500)3 16.500 16.500 16.500XParaeducator13 16.500
3 48.000 48.000XParaeducator - Special Prgs13 48.000
23.500 68.000 68.000Subtotal (3.500)64.500
291 Prekindergarten & Head Start - School-based
3 54.500XTeacher, PrekindergartenAD 54.500
3 40.475XParaeducator - Pre-K13 .40040.875
94.975Subtotal .40095.375
CHAPTER 1 – 18 SCHOOLS

DESCRIPTION CURRENTFYBUDGET
FYACTUAL
20172016 10Mon
FY 2017CAT CHANGE
2018FY
Elementary Schools - 121/123/124/125/126/128/291/292/931
REQUEST
2018FY
292 Head Start - Local Match school based
3 8.900XTeacher, Head StartAD 8.900
3 9.700XParaeducator Head Start13 9.700
18.600Subtotal 18.600
931 Head Start Grant - school based
3 11.300XTeacher, Head StartAD 11.300
3 10.850XParaeducator Head Start13 10.850
22.150Subtotal 22.150
5,735.5255,498.950 5,871.250Total Positions (136.225)5,735.025
CHAPTER 1 – 19 SCHOOLS
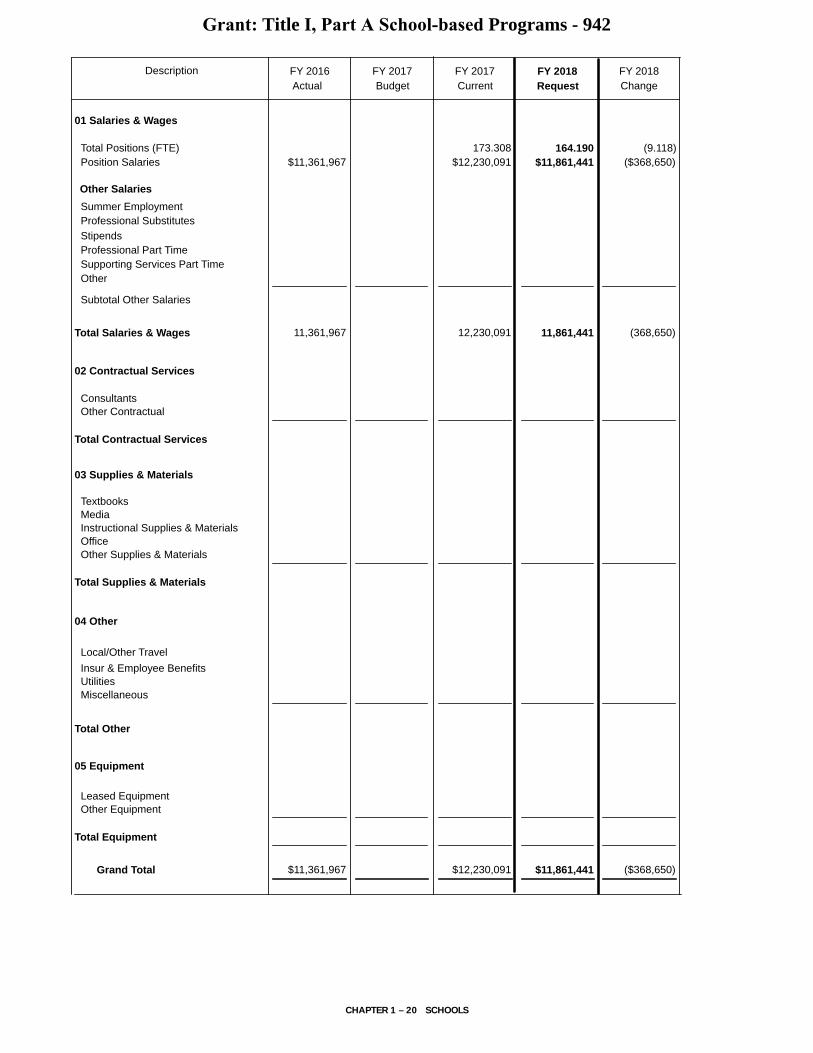
Grant: Title I, Part A School-based Programs - 942
Actual FY 2017Budget
FY 2017Current
FY 2018Request
FY 2018
Summer EmploymentProfessional Substitutes
Total Positions (FTE)Position Salaries $11,361,967
173.308$12,230,091
164.190$11,861,441
Other Salaries
01 Salaries & Wages
StipendsProfessional Part Time
ConsultantsOther Contractual
OfficeOther Supplies & Materials
MediaInstructional Supplies & Materials
Textbooks
Subtotal Other Salaries
Leased Equipment
Grand Total
Other Equipment
Total Salaries & Wages
02 Contractual Services
Total Contractual Services
03 Supplies & Materials
Total Supplies & Materials
04 Other
Total Other
05 Equipment
Total Equipment
Supporting Services Part TimeOther
11,361,967 12,230,091 11,861,441 (368,650)
$11,361,967 $12,230,091 $11,861,441 ($368,650)
ChangeDescription FY 2016
(9.118)($368,650)
Insur & Employee BenefitsUtilitiesMiscellaneous
Local/Other Travel
CHAPTER 1 – 20 SCHOOLS

DESCRIPTION CURRENTFYBUDGET
FYACTUAL
20172016 10Mon
FY 2017CAT
Grant: Title I, Part A School-based Program - 942
FY 2018CHANGE
FY 2018
REQUEST
3 101.600XTeacher, FocusAD (.100)101.500
3 7.200XTeacher, Head StartAD (.400)6.800
3 8.063XParent Comm Coordinator17 1.1879.250
3 46.995XParaeducator - Focus13 (9.280)37.715
3 9.450XParaeducator Head Start13 (.525)8.925
173.308Total Positions 164.190 (9.118)
CHAPTER 1 – 21 SCHOOLS

Schools
OVERVIEW OF BUDGET CHANGES 131/132/133/136
Middle Schools FY 2018 RECOMMENDED BUDGET
The FY 2018 recommended budget for middle
schools is $231,772,689, a decrease of $3,787,135
over the current FY 2017 budget. An explanation of
this change follows.
Same Service Level Changes—($1,529,766)Continuing Salary Costs—($5,154,102)The three-year agreements that the Board of Educa-tion ratified on March 11, 2014, will expire at the end of FY 2017. Negotiations began in October 2016 with our three employee associations on new contracts to be effective July 1, 2017, and are continuing as of this pub-lication. As a result, the proposed FY 2018 Superinten-dent’s Operating Budget does not include employee negotiated salary costs. The decrease of $5,154,102 for continuing salary is the cost associated with lapse and turnover; the amount of unused budgeted salary that remains when an employee terminates service and is not immediately replaced or an employee terminates service and the backfill is hired at a lower salary.
Student Enrollment—$2,888,513The enrollment growth requires an increase of 49.725 additional positions and $2,888,513. The changes are as follows:
• (2.0) assistant school administrator positions and ($195,726)
• 2.0 assistant principal positions and $211,208• 44.6 classroom teacher positions and $2,331,599• 2.0 resource counselor positions and $155,260• 0.25 media assistant position and $7,775• 1.0 security assistant position and $32,224• 0.375 paraeducator position and $11,592• 1.5 school secretary positions and $46,649
In addition, an increase to the budget of $226,156 is required for textbooks, media center materials, and instructional supplies for the additional students. There also is an increase of $61,776 for substitutes.
New Schools/Space—$1,115,773The new Bethesda-Chevy Chase #2 middle school is scheduled to open in FY 2018. Two position were added in the FY 2017 budget, a 0.5 principal and a 0.5 adminis-trative secretary to allow for planning and preparation, and to ensure that the school will be ready for students in September 2017. Additionally, Hallie Wells Middle School which opened in August 2017 for students in
Grades 6 and 7, will include Grade 8 beginning FY 2018. For FY 2018, 20.0 positions and $1,115,773 are added to the budget to open Bethesda-Chevy Chase #2 middle school and add Grade 8 to Hallie Wells Middle School. The positions are as follows:
• 0.5 principal position and $59,328• 2.0 assistant principal positions and $211,208• (8.0) classroom teacher positions and ($418,224)• 0.8 staff development teacher position and $45,039• 0.6 alternative programs teacher position and $31,367• 0.6 special programs teacher and $31,367• 4.0 team leader teacher positions and $359,131• 6.0 content specialist positions and $607,693• 1.0 media specialist position and $54,958• 3.5 school counselor positions and $264,975• 1.0 school financial specialist position and $46,144• 2.5 school secretary positions and $91,609• 0.5 school administrative secretary position and $23,073• 3.0 security assistant positions and $96,672• 0.75 media assistant position and $23,324• 0.875 paraeducator position and $27,048• 0.375 lunch hour aide position and $8,575
There also is a decrease to the budget of $447,514 for textbooks, media center materials, and instructional supplies associated with the non-recurring costs bud-geted in FY 2017 related to opening a new school.
Realignments to Meet Expenditure Requirements and Program Priorities—($519,261)There are several realignments budgeted to address pri-ority spending needs within this chapter among the ele-mentary, middle, high schools budgets. As a result of the realignments, there is a net decrease to this budget of $170,588; $234,388 is realigned to the elementary school budget and $63,800 is realigned from the high school budget. The decreases to this budget include $150,000 for instructional computer repairs and $84,388 for travel for professional development. The increases to this bud-get include $63,800 for contractual services.
In addition, 4.4 adaptive physical education teacher posi-tions and $348,673 are realigned from this department to school-based special education services.
Other—$139,311Applying an inflation factor of 2 percent increases the budget for textbooks, media center materials, and instructional supplies by $139,311.
CHAPTER 1 – 22 SCHOOLS

Schools
Program Efficiencies and Reductions—($2,257,369)The FY 2018 recommended budget for middle schools includes a comprehensive effort to identify potential program efficiencies and reductions. Stakeholders, including community partners and employee union representatives, participated in the program efficiencies and reduction process.
There is a reduction in middle schools of 28.6 positions and $1,195,005. The positions are as follows:
• 20.8 instructional data analyst positions and $787,236• 6.6 literacy coach positions and $345,035• 1.2 special program teacher positions and $62,734
The inflation amount of $139,311 budgeted for textbooks, media center materials, and instructional supplies is eliminated. Efficiencies will be necessary to ensure that schools have required textbooks and materials.
In addition, there are reductions of $53,753 for stipends, $84,079 for summer employment salaries, $454,712 for instructional materials, $21,510 for contractual services, $25,000 for travel for professional development, $17,975 for dues, fees, and registrations, $264,947 for profes-sional part-time salaries, and $1,077 for supporting ser-vices part-time salaries.
CHAPTER 1 – 23 SCHOOLS

FY 2018 OPERATING BUDGET
Middle Schools
F.T.E. Positions 2,763.168
(* In addition, this chart includes 444.3 positions from School/Plant Operations, and Food Services.)
Guidance and Counseling
Counselor, Resource (B–D) 33.0Counselor (B–D) 113.0
Instructional Media Centers
Media Specialist (B–D) 40.0Media Assistant (12) 25.8
Other Support Positions
Building Services (6–16) 300.0*Food Services (6–16) 144.3*
Principal (P) 40.0Assistant Principal (N) 74.0Assistant School Administrator (N) 14.0Coordinator (N) 6.0IT Systems Specialist (18–25) 25.0School Administrative Secretary (16) 40.0School Financial Specialist (16) 40.0Security Assistant (14) 76.0School Secretary I and II (12–13) 114.75
Grade 6 through Grade 8
Teachers6–8 (A–D) 1,505.6
Support PositionsParaeduator (13) 22.625
Special Services
TeachersStaff Development (A–D) 32.0Resource (A–D) 126.0Alternative Programs (A–D) 28.8Academic Intervention (A–D) 25.6Special Programs (A–D) 8.8School Team Leader (A–D) 144.2Content Specialist (A–D) 148.8Focus (A–D) 40.8
Support PositionsParaeducator, Special Programs (13) 24.5Lunch Hour Aide (7) 13.893
CH
AP
TER 1 – 24 S
CH
OO
LS

Middle Schools - 131/132/133/136
Actual FY 2017Budget
FY 2017Current
FY 2018Request
FY 2018
Summer EmploymentProfessional Substitutes
173,267 173,267 89,188 (84,079)51,267
Total Positions (FTE)Position Salaries
2,554.443$204,580,550
2,726.463$219,754,635
2,726.463$219,754,635
2,763.168$217,220,723
Other Salaries
01 Salaries & Wages
2,902,601 2,902,601 2,953,868
Stipends 1,512,512 1,512,512 1,449,268 (63,244)Professional Part Time
ConsultantsOther Contractual
OfficeOther Supplies & Materials
MediaInstructional Supplies & Materials
Textbooks
Subtotal Other Salaries
Leased Equipment
Grand Total
Other Equipment
Total Salaries & Wages
02 Contractual Services
Total Contractual Services
03 Supplies & Materials
Total Supplies & Materials
04 Other
Total Other
05 Equipment
Total Equipment
Supporting Services Part TimeOther
1,518,154302,773
1,518,154302,773
1,203,207301,696
1,105,186 70,000
(314,947)(1,077)
466,796
28,209632,184
660,393
28,209632,184
660,393
28,209521,474
549,683 (110,710)
(110,710)
3,975,318
1,903,3231,228,0773,780,383
53,694
6,965,477
1,903,3231,228,0773,780,383
53,694
6,965,477
3,362,585
53,694
1,761,9471,111,181
6,289,407
(141,376)(116,896)(417,798)
(676,070)
211,957,493 227,199,128 227,199,128 224,323,136 (2,875,992)
1,035,186 1,035,186
7,376,943 7,444,493 7,444,493 7,102,413 (342,080)
$216,938,949
99,070
137,294
$235,559,824
137,294
137,294
137,294
$235,559,824
137,294
137,294
$231,772,689 ($3,787,135)
ChangeDescription FY 2016
36.705($2,533,912)
Insur & Employee BenefitsUtilitiesMiscellaneous
440,272
445,776
597,532
445,776
597,532
445,776
473,169 (124,363)
Local/Other Travel 151,756 151,756 27,393 (124,363)
CHAPTER 1 – 25 SCHOOLS

DESCRIPTION CURRENTFYBUDGET
FYACTUAL
20172016 10Mon
FY 2017CAT
Middle Schools - 131/132/133/136
FY 2018CHANGEREQUEST
FY 2018
2 38.500 39.500 39.500PrincipalP .50040.000
2 6.000 6.000 6.000CoordinatorN 6.000
2 65.000 70.000 70.000Assistant PrincipalN 4.00074.000
2 17.000 16.000 16.000Asst Sch Administrator (11 mo)N (2.000)14.000
3 105.500 109.500 109.500XCounselor, SecondaryBD 3.500113.000
3 38.000 39.000 39.000XMedia SpecialistBD 1.00040.000
3 30.000 31.000 31.000XCounselor, ResourceBD 2.00033.000
3 1,367.700 1,482.020 1,482.020XTeacherAD 23.5801,505.600
3 25.600 25.600 25.600XTeacher, Academic InterventionAD 25.600
3 30.400 31.200 31.200XTeacher, Staff DevelopmentAD .80032.000
3 28.000 28.200 28.200XTeacher, Alternative ProgramsAD .60028.800
3 6.600 6.600 6.600XLiteracy CoachAD (6.600)3 9.400 9.400 9.400XTeacher, Special ProgramsAD (.600)8.800
3 135.000 135.000 135.000XMiddle School Team LdrAD 9.200144.200
3 138.000 138.000 138.000XContent SpecialistAD 10.800148.800
3 30.000 40.800 40.800XTeacher, FocusAD 40.800
3 126.000 127.400 127.400XTeacher, ResourceAD (1.400)126.000
10 25.000 25.000 25.000IT Systems Specialist25 25.000
2 38.000 39.000 39.000School Financial Specialist16 1.00040.000
2 38.500 39.500 39.500School Admin Secretary16 .50040.000
3 20.300 20.800 20.800XInstructional Data Analyst16 (20.800)2 71.000 72.000 72.000XSecurity Assistant14 4.00076.000
2 21.500 21.500 21.500XSchool Secretary II13 .50022.000
2 41.000 42.000 42.000School Secretary II13 1.00043.000
3 20.875 21.375 21.375XParaeducator13 1.25022.625
3 24.500 24.500XParaeducator - Special Prgs13 24.500
2 44.250 47.250 47.250XSchool Secretary I12 2.50049.750
3 24.300 24.800 24.800XMedia Assistant12 1.00025.800
3 13.018 13.518 13.518XLunch Hour Aide7 .37513.893
2,726.4632,554.443 2,726.463Total Positions 2,763.168 36.705
CHAPTER 1 – 26 SCHOOLS

Schools
OVERVIEW OF BUDGET CHANGES 140/141/142/143/146/147/148/151/152/163/564
High Schools FY 2017 CURRENT BUDGET
The current FY 2017 budget for high schools is
changed from the budget adopted by the Board of
Education on June 14, 2016. The change includes the
realignment of school-based resources that provide
direct services to students to this Chapter from
Chapter 4, Curriculum and Instructional Programs
and Chapter 5, Special Education.
FY 2018 RECOMMENDED BUDGET
The FY 2018 recommended budget for high
schools is $305,525,187 a decrease of $909,304
over the current FY 2017 budget. An explanation of
this change follows.
Same Service Level Changes—$1,866,994Continuing Salary Costs—($6,277,722)The three-year agreements that the Board of Educa-tion ratified on March 11, 2014, will expire at the end of FY 2017. Negotiations began in October 2016 with our three employee associations on new contracts to be effective July 1, 2017, and are continuing as of this pub-lication. As a result, the proposed FY 2018 Superinten-dent’s Operating Budget does not include employee negotiated salary costs. The decrease of $6,277,722 for continuing salary is the cost associated with lapse and turnover; the amount of unused budgeted salary that remains when an employee terminates service and is not immediately replaced or an employee terminates service and the backfill is hired at a lower salary.
Student Enrollment—$5,501,216The enrollment growth requires an increase of 98.125 additional positions and $5,501,216. The changes are as follows:
• 2.0 school assistant administrator positions and $195,726• 5.5 school secretary positions and $171,045• 2.0 security assistant positions and $64,448• 78.5 classroom teacher positions and $4,103,823• 6.0 school counselor positions and $454,242• 1.0 media assistant position and $31,099• 2.0 paraeducator positions and $61,824• 1.125 English composition assistant positions and $39,780
In addition, there is an increase to the budget of $262,656 for textbooks, media center materials and instructional sup-plies. There also is an increase of $116,573 for substitutes.
Realignments to Meet Expenditure Requirements and Program Priorities—($1,240,410) The high school budget includes several budget neu-tral realignments to address spending needs. There is a decrease of $185,325 from adult interpreters and a corre-sponding increase of $175,325 for exam fees and $10,000 for local travel mileage reimbursement. In addition, there is a decrease of $12,398 for professional part-time salaries and $2,800 for consultants, to support increases of $10,199 for student transportation, and $5,000 for sup-porting services part-time salaries.
There are several realignments budgeted to address priority spending needs within this chapter among the elementary, middle, and high school budgets. As a result of the realignments, the high school budget includes a net decrease of $269,200; $205,400 to the elementary school budget and $63,800 to the middle school bud-get. Decreases to this budget include $164,400 for staff development substitutes, $50,000 for adult interpreters, $13,800 for instructional materials, and $50,000 for con-sultants. Furthermore, there is an increase of $9,000 for school projects from the elementary school budget.
In addition, 12.2 adaptive physical education teacher positions and $966,777 are realigned from this budget to school-based special education services.
There are also realignments between chapters resulting in a net decrease to this budget of $4,434. This includes a realignment of $5,000 to Chapter 3, Chief Academic Officer for instructional materials, and a realignment of $566 for student transportation from Chapter 7, Depart-ment of Employee and Retiree Services.
Other—$149,922Applying an inflation factor of 2 percent increases the budget for textbooks and instructional materials by $149,922.
Program Efficiencies and Reductions—($1,706,268)The FY 2018 recommended budget for high schools includes a comprehensive effort to identify potential program efficiencies and reductions. Stakeholders, including community partners and employee union representatives, participated in the program efficiencies and reduction process.
The inflation factor of $149,922 budgeted for textbooks, media center materials, and instructional supplies is eliminated. Efficiencies will be necessary to ensure that schools have required textbooks and materials.
CHAPTER 1 – 27 SCHOOLS

Schools
In addition, there is a reduction of 4.0 special program teacher positions and $209,112. There is a decrease of $318,295 for stipends, $97,622 for summer employment salaries, $758,392 for instructional materials, $150,000 for equipment and furniture replacement, $21,000 for school projects, and $1,925 for supporting services part-time salaries.
Strategic Accelerator—$2,663,958
• Improve Teaching and Learning—$1,903,958There are four strategic accelerators in the high school budget that focus on improving teaching and learn-ing. They are as follows:
» Increase opportunities for students to rigorous course work, programs, and co-curricular activities. This will include the implementation of a high school diploma program for students who need an alterna-tive path to graduation. In addition, programs will be expanded to increase access and completion of Career Technical Education. Finally, we will imple-ment an apprenticeship program that will result in more students graduating with an industry certifi-cation and ready to enter the workforce. The fund-ing for these programs include $30,000 in stipends for program development, $300,000 for professional part-time salaries, $630,000 for contractual services, and $30,000 for instructional materials. In addition, $25,245 for employee benefits is added to Chapter 7, Department of Employee and Retiree Services.
» Expanding the achievement-focused extracurricular programs that increase opportunities and outcomes for students to all middle schools by providing sti-pends that are differentiated based on school needs and student populations. These programs are open to all students who seek to participate, with a particu-lar emphasis on targeted outreach to students who may not otherwise have opportunities to participate in extracurricular activities, to ensure all such stu-dents are able to achieve at their highest potential. This budget includes $263,958 for teacher stipends. In addition, $173,160 for activity buses is added to the budget in the Department of Transportation and $20,193 for employee benefits is added to Chapter 7, Department of Employee and Retiree Services.
» Increasing access for students to advance academic courses by adding six Equal Opportunity Schools with funding of $150,000 for contractual services.
» Ensuring effective mathematics instruction through professional development, robust materials, focused support, and approaches to scheduling students. To support this effort, $500,000 for instructional mate-rials is added to the budget.
• Focus on Learning, Accountability and Results—$15,000
» This budget includes a strategic accelerator to sup-port focus on leaning, accountability and results. The funds will provide support for students’ knowl-edge and attainment of a Seal of bi-literacy in their high school diploma that recognizes graduates from public high schools in the state of Maryland who have attained proficiency in speaking, reading, and writing in one or more languages in addition to English. To receive the Seal of Bi-literacy, student must take a language assessment. To support pay-ment of the language assessment for students that qualify for Free and Reduced Meals, $15,000 for contractual services have been added to the budget.
• Focus on Community Partnerships and Engagement—$242,000There are two strategic accelerators in the high school budget that focus on community partnerships and engagement. They are as follows:
» Expansion of STEM courses/programs and extracur-ricular programs to increase participation of tradi-tionally under-represented students in these fields. The total amount budgeted for this strategic accelera-tor is $95,000. Of this amount, $45,000 is for contrac-tual services and $50,000 is for instructional materials.
» Expansion of Achieving Collegiate Excellence and Success (ACES) program to an additional five high schools. For this purpose, $147,000 for contractual services is added to the high school budget.
• Focus on Operational Excellence—$503,000
» This budget includes a strategic accelerator to sup-port the focus on operational excellence. This addi-tional funding will support the implementation of a robust online registration system for applications, school choice and lotteries, registration forms, ath-letic sign-ups, and more. The system will ensure that data submitted is accurate upon first submission, and reduce errors. For this purpose, $503,000 for contrac-tual services is added to the high school budget.
CHAPTER 1 – 28 SCHOOLS

Schools
Grant: Carl D. Perkins Career & Technology Education Improvement Program—950
FY 2018 RECOMMENDED BUDGET
The FY 2018 recommended budget for this
program is $226,556, a decrease of $5,177 over
the current FY 2017 budget. An explanation of this
change follows.
Same Service Level Changes—($5,177)Other—($5,177)It is projected that MCPS will receive decreased revenue of $5,177 for the Carl D. Perkins Career & Technology Education Improvement Program grant. This will result in a reduction of a 0.6 teacher position.
Program’s Recent Funding HistoryFY 2017Budgeted7/1/16
FY 2017Projected11/30/16
FY 2018Projected7/1/17
Federal $231,733 $231,733 $226,556
Total $231,733 $231,733 $226,556
CHAPTER 1 – 29 SCHOOLS
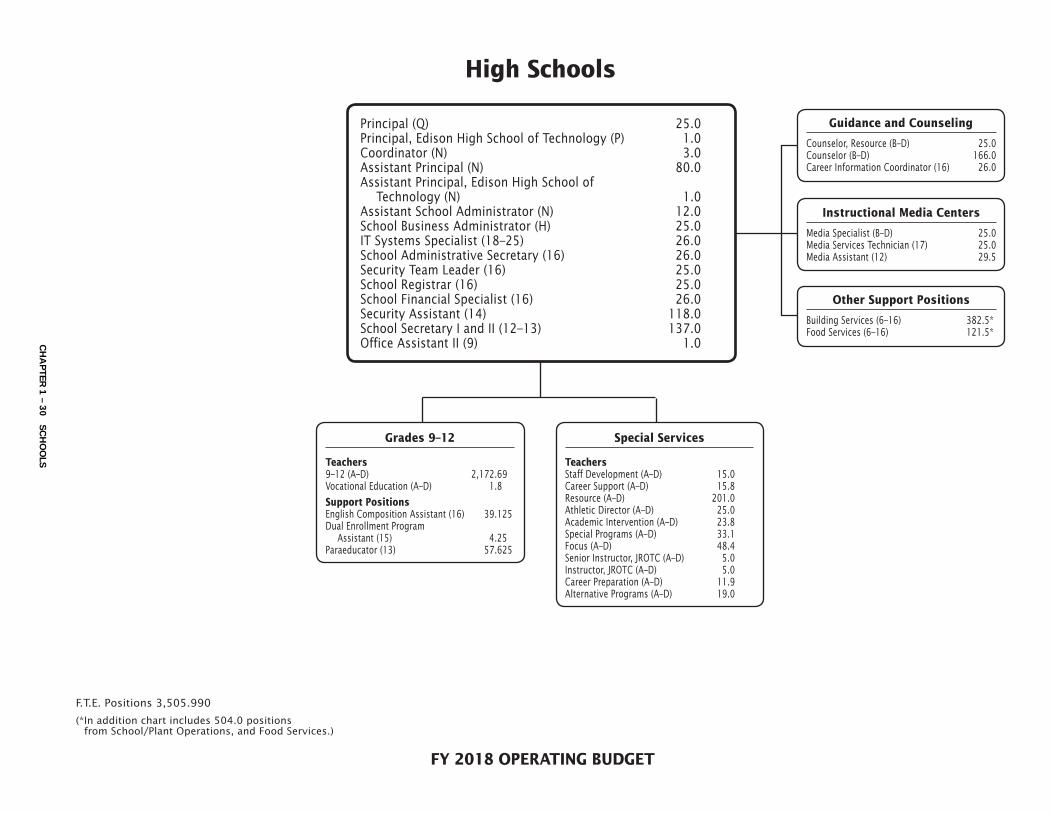
FY 2018 OPERATING BUDGET
High Schools
F.T.E. Positions 3,505.990
(* In addition chart includes 504.0 positions from School/Plant Operations, and Food Services.)
Principal (Q) 25.0Principal, Edison High School of Technology (P) 1.0Coordinator (N) 3.0Assistant Principal (N) 80.0Assistant Principal, Edison High School of
Technology (N) 1.0Assistant School Administrator (N) 12.0School Business Administrator (H) 25.0IT Systems Specialist (18–25) 26.0School Administrative Secretary (16) 26.0Security Team Leader (16) 25.0School Registrar (16) 25.0School Financial Specialist (16) 26.0Security Assistant (14) 118.0School Secretary I and II (12–13) 137.0Office Assistant II (9) 1.0
Grades 9–12
Teachers9–12 (A–D) 2,172.69Vocational Education (A–D) 1.8
Support PositionsEnglish Composition Assistant (16) 39.125Dual Enrollment Program
Assistant (15) 4.25Paraeducator (13) 57.625
Special Services
TeachersStaff Development (A–D) 15.0Career Support (A–D) 15.8Resource (A–D) 201.0Athletic Director (A–D) 25.0Academic Intervention (A–D) 23.8Special Programs (A–D) 33.1Focus (A–D) 48.4Senior Instructor, JROTC (A–D) 5.0Instructor, JROTC (A–D) 5.0Career Preparation (A–D) 11.9Alternative Programs (A–D) 19.0
Instructional Media Centers
Media Specialist (B–D) 25.0Media Services Technician (17) 25.0Media Assistant (12) 29.5
Guidance and Counseling
Counselor, Resource (B–D) 25.0Counselor (B–D) 166.0Career Information Coordinator (16) 26.0
Other Support Positions
Building Services (6–16) 382.5*Food Services (6–16) 121.5*
CH
AP
TER 1 – 30 S
CH
OO
LS

High Schools - 141/140/142/143/146/147/148/151/152/163/564/950
Actual FY 2017Budget
FY 2017Current
FY 2018Request
FY 2018
Summer EmploymentProfessional Substitutes
1,432,553 1,432,553 1,284,931 (147,622)(46,826)
Total Positions (FTE)Position Salaries
3,238.775$257,924,092
3,422.265$276,668,845
3,424.665$276,900,578
3,505.990$274,563,777
Other Salaries
01 Salaries & Wages
3,603,079 3,603,079 3,556,253
Stipends 7,072,324 7,072,324 7,001,237 (71,087)Professional Part Time
ConsultantsOther Contractual
OfficeOther Supplies & Materials
MediaInstructional Supplies & Materials
Textbooks
Subtotal Other Salaries
Leased Equipment
Grand Total
Other Equipment
Total Salaries & Wages
02 Contractual Services
Total Contractual Services
03 Supplies & Materials
Total Supplies & Materials
04 Other
Total Other
05 Equipment
Total Equipment
Supporting Services Part TimeOther
1,317,866650,440
1,317,866650,440
1,624,467638,515
2,708,673 45,000
306,601(11,925)
1,155,335
101,8321,202,826
1,304,658
101,8321,202,826
1,304,658
49,0321,949,501
1,998,533 693,875
746,675(52,800)
6,195,443
1,833,632770,683
4,579,5101,557
342,832
7,528,214
1,833,632770,683
4,579,5101,557
342,832
7,528,214
4,558,9341,557
845,832
1,901,024798,331
8,105,678
503,000
67,39227,648
(20,576)
577,464
273,794,977 293,408,780 293,640,513 291,377,853 (2,262,660)
2,663,673 2,663,673
15,870,885 16,739,935 16,739,935 16,814,076 74,141
$284,652,359
267,801
503,306
$306,434,491
503,306
489,906
489,906
$306,666,224
339,906
339,906
$305,751,743
(150,000)
(150,000)
($914,481)
ChangeDescription FY 2016
81.325($2,336,801)
Insur & Employee BenefitsUtilitiesMiscellaneous
3,238,803
3,133,055
3,689,533
3,146,455
3,702,933
3,363,295
3,929,773
216,840
226,840
Local/Other Travel 556,478 556,478 566,478 10,000
CHAPTER 1 – 31 SCHOOLS

DESCRIPTION CURRENTFYBUDGET
FYACTUAL
20172016 10Mon
FY 2017CAT
High Schools - 140/141/142/143/146/147/148/151/152/163/564/950
CHANGE2018FYFY 2018
REQUEST
141 High Schools
2 25.000 25.000 25.000PrincipalQ 25.000
2 3.000 3.000 3.000CoordinatorN 3.000
2 68.000 80.000 80.000Principal Asst HighN 80.000
2 17.000 10.000 10.000Asst Sch Administrator (11 mo)N 2.00012.000
2 25.000 25.000 25.000School Business AdminH 25.000
3 154.000 159.000 159.000XCounselor, SecondaryBD 6.000165.000
3 25.000 25.000 25.000XMedia SpecialistBD 25.000
3 25.000 25.000 25.000XCounselor, ResourceBD 25.000
3 1,927.300 2,087.390 2,087.390XTeacherAD 66.3002,153.690
3 23.800 23.800 23.800XTeacher, Academic InterventionAD 23.800
3 15.000 15.000 15.000XTeacher, Staff DevelopmentAD 15.000
3 25.000 25.000 25.000XTeacher, Athletic DirectorAD 25.000
3 19.000 19.000 19.000XTeacher, Alternative ProgramsAD 19.000
3 15.800 15.800 15.800XTeacher, Career SupportAD 15.800
3 11.900 11.900 11.900XTeacher, Career PreparationAD 11.900
3 37.100 37.100 37.100XTeacher, Special ProgramsAD (4.000)33.100
3 40.000 48.400 48.400XTeacher, FocusAD 48.400
3 195.000 197.000 197.000XTeacher, ResourceAD 197.000
3 6.000 5.000 5.000XSenior Instructor, JROTCAD 5.000
3 5.000 5.000 5.000XInstuctor, JROTCAD 5.000
10 25.000 25.000 25.000IT Systems Specialist25 25.000
3 25.000 25.000 25.000XMedia Services Technician17 25.000
2 25.000 25.000 25.000School Financial Specialist16 25.000
2 25.000 25.000 25.000School Registrar16 25.000
2 25.000 25.000 25.000School Admin Secretary16 25.000
2 25.000 25.000 25.000XSecurity Team Leader16 25.000
3 37.000 38.000 38.000XEnglish Composition Asst16 1.12539.125
3 25.000 25.000 25.000Career Information Coordinator16 25.000
3 4.250 4.250 4.250XDual Enrollment Program Assist15 4.250
2 115.000 116.000 116.000XSecurity Assistant14 2.000118.000
2 34.000 34.000 34.000XSchool Secretary II13 34.000
2 28.000 28.000 28.000School Secretary II13 28.000
3 52.875 54.375 54.375XParaeducator13 2.00056.375
2 66.500 68.500 68.500XSchool Secretary I12 5.50074.000
3 28.000 28.500 28.500XMedia Assistant12 1.00029.500
3,203.525 3,389.015 3,389.015Subtotal 3,470.940 81.925
142 Edison High School of Technology
2 1.000 1.000 1.000PrincipalP 1.000
2 1.000 1.000 1.000Assistant PrincipalN 1.000
3 1.000 1.000 1.000XCounselor, SecondaryBD 1.000
3 19.500 17.500 17.500XTeacherAD 17.500
CHAPTER 1 – 32 SCHOOLS
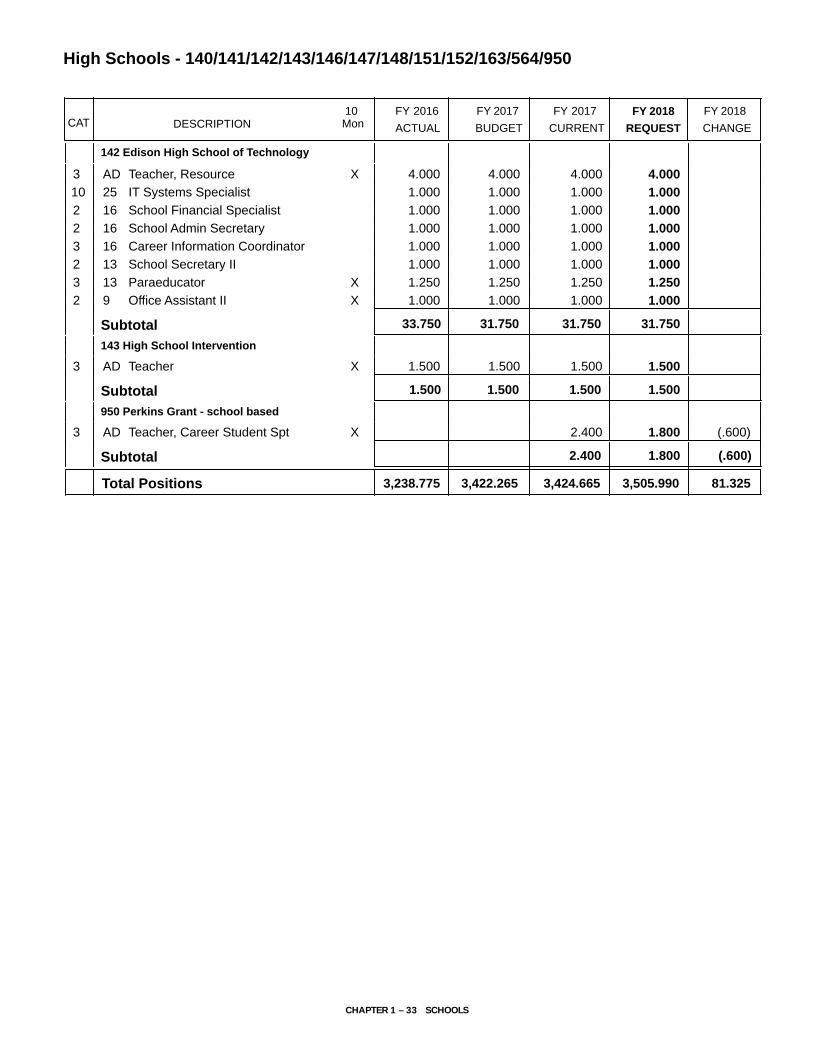
DESCRIPTION CURRENTFYBUDGET
FYACTUAL
20172016 10Mon
FY 2017CAT
High Schools - 140/141/142/143/146/147/148/151/152/163/564/950
CHANGE2018FYFY 2018
REQUEST
142 Edison High School of Technology
3 4.000 4.000 4.000XTeacher, ResourceAD 4.000
10 1.000 1.000 1.000IT Systems Specialist25 1.000
2 1.000 1.000 1.000School Financial Specialist16 1.000
2 1.000 1.000 1.000School Admin Secretary16 1.000
3 1.000 1.000 1.000Career Information Coordinator16 1.000
2 1.000 1.000 1.000School Secretary II13 1.000
3 1.250 1.250 1.250XParaeducator13 1.250
2 1.000 1.000 1.000XOffice Assistant II9 1.000
33.750 31.750 31.750Subtotal 31.750
143 High School Intervention
3 1.500 1.500 1.500XTeacherAD 1.500
1.500 1.500 1.500Subtotal 1.500
950 Perkins Grant - school based
3 2.400XTeacher, Career Student SptAD (.600)1.800
2.400Subtotal 1.800 (.600)
3,422.2653,238.775 3,424.665Total Positions 3,505.990 81.325
CHAPTER 1 – 33 SCHOOLS

Schools
OVERVIEW OF BUDGET CHANGES 217
English Speakers of Other Languages (ESOL)FY 2017 CURRENT BUDGET
The current FY 2017 budget for this unit is changed
from the budget adopted by the Board of Education
on June 14, 2016. The change includes the
realignment of school-based resources from other
chapters that provide direct services to students to
Chapter 1, Schools.
FY 2018 RECOMMENDED BUDGET
The FY 2018 recommended budget for this unit
is $51,506,875, an increase of $789,488 over the
current FY 2017 budget. An explanation of this
change follows.
Same Service Level Changes—$789,488Continuing Salary Costs—($599,289)The three-year agreements that the Board of Educa-tion ratified on March 11, 2014, will expire at the end of FY 2017. Negotiations began in October 2016 with our three employee associations on new contracts to be effective July 1, 2017, and are continuing as of this pub-lication. As a result, the proposed FY 2018 Superinten-dent’s Operating Budget does not include employee negotiated salary costs. However, there is a decrease of $599,289 for continuing salary is the cost associated with lapse and turnover; the amount of unused budgeted sal-ary that remains when an employee terminates service and is not immediately replaced or an employee termi-nates service and the backfill is hired at a lower salary.
Student Enrollment—$1,405,307There is an increase of 500 English for Speakers of Other Languages (ESOL) students projected for FY 2018. The enrollment growth requires an increase of 29.54 addi-tional positions and $1,405,307. This includes an addi-tional 23.035 classroom teacher positions and $1,204,224 and 6.505 paraeducator positions and $201,083.
Realignments to Meet Expenditure Requirements and Program Priorities—($16,530) The FY 2018 recommended budget includes a realign-ment that results in an overall budget neutral set of realignments between departments and offices. The realignment includes $16,530 in teacher salaries from this unit to the Department of Employee and Retiree Services for employee benefits.
CHAPTER 1 – 34 SCHOOLS
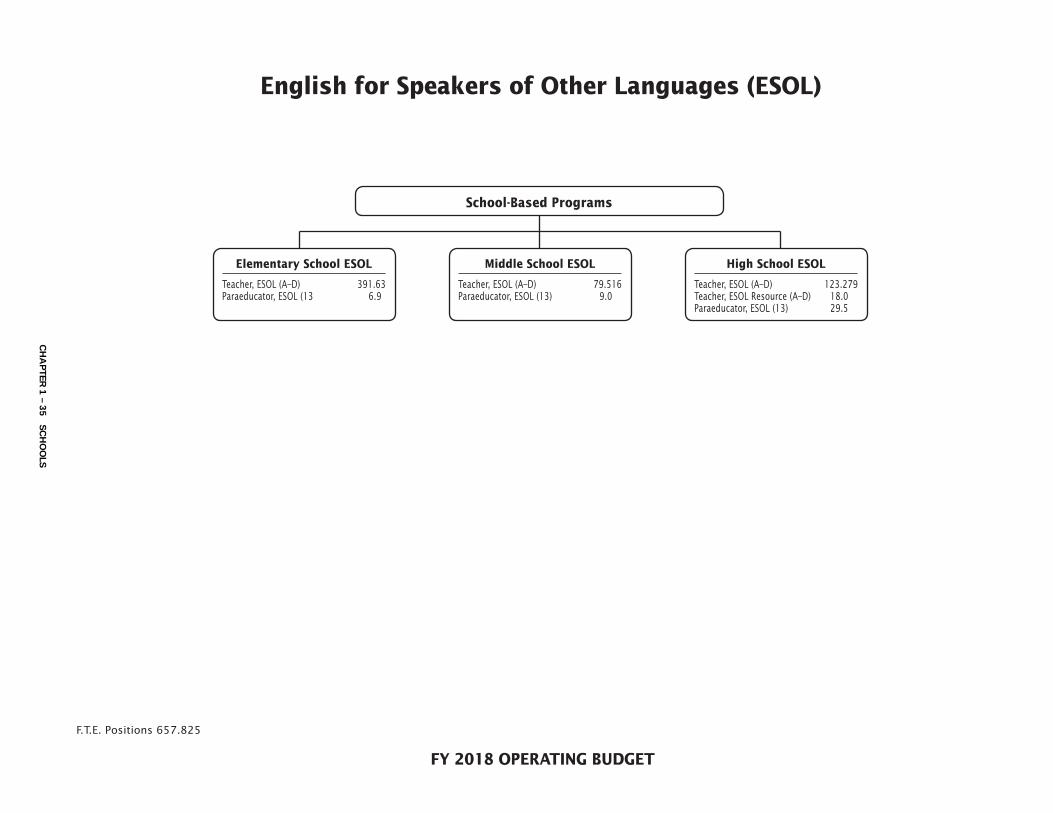
FY 2018 OPERATING BUDGET
School-Based Programs
English for Speakers of Other Languages (ESOL)
F.T.E. Positions 657.825
Elementary School ESOL
Teacher, ESOL (A–D) 391.63Paraeducator, ESOL (13 6.9
Middle School ESOL
Teacher, ESOL (A–D) 79.516Paraeducator, ESOL (13) 9.0
High School ESOL
Teacher, ESOL (A–D) 123.279Teacher, ESOL Resource (A–D) 18.0Paraeducator, ESOL (13) 29.5
CH
AP
TER 1 – 35 S
CH
OO
LS

ESOL School-based - 217
Actual FY 2017Budget
FY 2017Current
FY 2018Request
FY 2018
Summer EmploymentProfessional Substitutes
Total Positions (FTE)Position Salaries $45,861,109
628.285$50,717,387
657.825$51,506,875
Other Salaries
01 Salaries & Wages
StipendsProfessional Part Time
ConsultantsOther Contractual
OfficeOther Supplies & Materials
MediaInstructional Supplies & Materials
Textbooks
Subtotal Other Salaries
Leased Equipment
Grand Total
Other Equipment
Total Salaries & Wages
02 Contractual Services
Total Contractual Services
03 Supplies & Materials
Total Supplies & Materials
04 Other
Total Other
05 Equipment
Total Equipment
Supporting Services Part TimeOther
45,861,109 50,717,387 51,506,875 789,488
$45,861,109 $50,717,387 $51,506,875 $789,488
ChangeDescription FY 2016
29.540$789,488
Insur & Employee BenefitsUtilitiesMiscellaneous
Local/Other Travel
CHAPTER 1 – 36 SCHOOLS

DESCRIPTION CURRENTFYBUDGET
FYACTUAL
20172016 10Mon
FY 2017CAT
ESOL School-based - 217
FY 2018CHANGE
FY 2018
REQUEST
3 571.390XTeacher, ESOLAD 23.035594.425
3 18.000XTeacher, ESOL ResourceAD 18.000
3 38.895XParaeducator - ESOL13 6.50545.400
628.285Total Positions 657.825 29.540
CHAPTER 1 – 37 SCHOOLS

ESOL/BILINGUAL PROGRAMS ENROLLMENT AND STAFFING
FY 2017 FY 2018BUDGET BUDGET CHANGE
Elementary SchoolEnrollment:METS * Students 50 70 20Non-METS Students (Levels 1-5) 16,650 16,730 80 Total Enrollment 16,700 16,800 100
Positions:METS Teachers 3.000 4.700 1.700Non-METS Teachers 383.600 385.430 1.830Paraeducators 4.895 6.900 2.005 Total Positions 391.495 397.030 5.535
Middle SchoolEnrollment:METS Students 160 190 30Non-METS Students (Levels 1-5) 2,240 2,310 70 Total Enrollment 2,400 2,500 100
Positions:METS Teachers 10.000 12.600 2.600Non-METS Teachers 64.900 66.916 2.016Coaches ** 10.000 10.000 0.000Paraeducators 7.500 9.000 1.500 Total Positions 92.400 98.516 6.116
High SchoolEnrollment:METS Students 400 480 80Non-METS Students (Levels 1-5) 3,100 3,320 220 Total Enrollment 3,500 3,800 300
Positions:METS Teachers 16.000 19.200 3.200Non-METS Teachers 91.390 103.079 11.689Resource Teachers 18.000 18.000 0.000SEPA Teachers 1.000 1.000 0.000Paraeducators 26.500 29.500 3.000 Total Positions 152.890 170.779 17.889
Special Education CentersEnrollment:Students 50 50 - Total Enrollment 50 50 -
Positions:Non-METS Teachers 1.5 1.5 - Total Positions 1.5 1.5 - Total Enrollment 22,650 23,150 500Total - Teachers 571.390 594.425 23.035Total - Paraeducators 38.895 45.400 6.505
Teacher staffing for ESOL (Non-METS) is based on projected enrollment and the intensity, or level of service required as follows:
Elementary Proficiency-Based Staffing: Secondary Proficiency-Based Staffing:Level 1 - Number of Students/6 x .2 Level 1 - Number of Students/12 x .7Level 2 - Number of Students/6.3 x .18 Level 2 - Number of Students/12 x .5Level 3 - Number of Students/6.5 x .16 Level 3 - Number of Students/15 x .4Level 4 - Number of Students/7.5 x .14 Level 4 - Number of Students/15 x .3Level 5 - Number of Students/7.5 x .1 Level 5 - Number of Students/15 x .3
ES/MS METS Center Staffing Guidelines as of 9-9-16
Enroll Tch Para
>40 2 1.7525-40 2 1.5016-24 1 1.25<15 1 0.75
* METS - Multi-disciplinary Education, Training, and Support. Students have little or no formal educationin their native countries. 50% of high school METS students are included in the High Schoolnon-METS Level 1 enrollment numbers for staffing purposes.
** Middle school Teacher Coaches are included in the budget for Secondary ESOL (ODD 238)
CHAPTER 1 – 38 SCHOOLS

FY 2018 OPERATING BUDGET
Special Education Programs and Services —Overview
F.T.E. Positions 3,621.887
Learning and Academic Disabilities Program
Secondary Intensive Reading Program
Gifted and Talented Learning Disabled Programs
Learning for Independence Program
Least Restrictive Environment Support
Hours Based Staffing
Home School Model
Transition Services
Autism Programs
Programs for Students with Emotional Disabilities (ED)
Programs—Deaf and Hard of Hearing, Visually Impaired
InterACT
Programs for Physically Disabled/High Incidence
Accessible Technology (HIAT)
Speech and Language Programs
Preschool Education Programs
School/Community-Based Programs
Extensions
Elementary Learning Centers
School-Based Programs and Services
Prekindergarten, Special Programs, and Related Services
CH
AP
TER 1 – 39 S
CH
OO
LS

Schools
OVERVIEW OF BUDGET CHANGES 242/243/246/248/260/266/267/268/269/270/272/273 274/275/279/280/281/282/283/284/285/286/287/288 289/290/295
Special Education School-Based Programs and Services FY 2017 CURRENT BUDGET
The current FY 2017 budget for this program is
changed from the budget adopted by the Board of
Education on June 14, 2016. The change includes
the realignment of special education school-based
resources that provide direct services to students
from Chapter 5 to Chapter 1, Schools.
FY 2018 RECOMMENDED BUDGET
The FY 2018 recommended budget for this
program is $237,244,589, an increase of $739,219
over the current FY 2017 budget. An explanation of
this change follows.
Same Service Level Changes—$372,387Continuing Salary Costs—($3,435,133)The three-year agreements that the Board of Educa-tion ratified on March 11, 2014, will expire at the end of FY 2017. Negotiations began in October 2016 with our three employee associations on new contracts to be effec-tive July 1, 2017, and are continuing as of this publica-tion. As a result, the proposed FY 2018 Superintendent’s Operating Budget does not include employee negotiated salary costs in the specific programs and chapters. The decrease for continuing salary is the cost associated with lapse and turnover; the amount of unused budgeted sal-ary that remains when an employee terminates service and is not immediately replaced or an employee termi-nates service and the backfill is hired at a lower salary.
Student Enrollment—$3,297,243The enrollment growth requires a net increase of 70.221 additional positions and $3,297,243. This includes an additional 32.95 special education teacher positions and $1,848,299, an additional 29.971 paraeducator positions and $926,479, an additional 1.5 social worker positions and $91,371, an additional 3.2 speech-language patholo-gist positions and $253,802, and an additional 2.6 occu-pational/physical therapist positions and $177,292 in the following programs:
• Special Education School-Based Programs and Services—$1,403,923 and 26.203 FTE
» Special Education School-Based Services—decreases of 8.1 special education teacher and 16.238 paraeducator positions and $954,901
» School/Community-Based Programs—increases of 1.0 special education teacher and 3.0 paraeducator positions and $148,656
» Elementary Learning Centers—increases of 5.5 spe-cial education teacher, a 0.5 elementary program specialist, and 4.187 paraeducator positions and $464,964
» Extensions Program—increases of a 0.5 elementary program specialist, a 0.5 social worker, and 5.25 par-aeducator positions and $220,705
» Gifted and Talented/Learning Disabled Programs—decreases of a 0.8 special education teacher and 0.56 paraeducator positions and $62,047
» Learning for Independence Programs—increases of 1.0 special education teacher and 0.875 paraeduca-tor positions and $82,968
» Resource Only Program—decreases of 26.0 special education teacher and 11.0 paraeducator positions and $1,793,952. Services realigned will be provided through Home School Model shown below.
» Least Restrictive Environment Support—decreases of a 0.5 special education teacher and 9.25 paraedu-cators and $313,896
» Hours Based Staffing—increases of 3.4 special edu-cation teacher and 5.751 paraeducator positions and $367,903
» Home School Model—increases of 16.85 special education teacher, 29.8 special education resource room teacher, and 20.538 paraeducator posi-tions and $3,243,523. Services realigned from the Resource Only Program will be provided here.
• Special Education Prekindergarten, Special Programs, and Related Services—$1,151,181 and 30.468 FTE
» Bridge Program—increases of 3.0 special educa-tion teacher and 3.75 paraeducator positions and $283,680
» Programs for Students who are Deaf and Hard of Hearing—decreases of a 0.9 auditory teacher and a 0.787 paraeducator position and $74,640
» Speech and Language Programs—increase of 2.0 speech-language pathologist positions and $158,626
» Transition Services—increase of a 1.0 transition teacher position and $55,920
CHAPTER 1 – 40 SCHOOLS

Schools
» Programs for Students with Emotional Disabili-ties—increase of 5.375 paraeducator positions and $166,152
» Autism Programs—increases of 1.4 special educa-tion teacher and 15.63 paraeducator positions and $561,443
• Special Education Preschool Education Programs (PEP) and InterACT— $778,820 and 15.65 FTE
» PEP Classic—increases of 2.0 preschool teacher and 1.75 paraeducator positions and $165,936
» PEP Five-Hour—increases of 3.6 preschool special education teacher, 4.5 paraeducator, a 0.6 speech-language pathologist, 1.4 physical therapist, and 0.8 occupational therapist positions and $538,020
» PEP Intensive Needs—increases of a 0.6 speech-language pathologist and 1.2 occupational therapist positions and $129,415
» PEP ARC—decrease of a 0.8 occupational therapist position and $54,551
• Special Schools/Centers—($154,256) and (4.1) FTE
» Rock Terrace School—decreases of 0.3 special edu-cation teacher and 1.3 paraeducator positions and increases of 1.0 social worker position for a net increase of $3,952
» Stephen Knolls School—increases of a 0.25 para-educator position and $7,728
» Carl Sandburg Learning Center—decreases of 1.0 special education teacher, 1.0 elementary program specialist, and 1.75 paraeducator positions and $165,937
In addition, the new Bethesda Chevy Chase Middle School #2 is scheduled to open in FY 2018. As a result, 2.0 special education teacher positions and $117,575 are added to the budget to open the new school.
Realignments to Meet Expenditure Requirements and Program Priorities—$877,803There are technical realignments budgeted to address both the student enrollment growth needs listed above and spending priority needs within this program, result-ing in a net increase of 15.1 positions and $877,803. The realignments include changes in the following programs:
• Special Education School-Based Programs and Services—$993,484 and 17.888 FTE
» Special Education School-Based Services—decrease of a 0.2 special education teacher position and $11,184
» Elementary Learning Centers—decrease of a 1.0 spe-cial education teacher position and increase of a 0.188 paraeducator position for a net decrease of $50,124
» Extensions Program—decreases of 1.0 social worker, 12-month and 1.0 instructional special-ist positions and increases of 1.0 coordinator, 2.5 special education teacher, and 1.0 social worker, 10-month positions for a net increase of $139,800
» Gifted and Talented/Learning Disabled Programs—decrease of a 0.2 special education teacher position and $11,184
» Resource Only Program—decreases of 32.5 special education resource room teacher and 12.0 paraedu-cator positions and $3,720,544. Services realigned will be provided through Home School Model shown below.
» Home School Model—increases of 32.5 special edu-cation resource room teacher and 12.0 paraeducator positions and $3,720,544. Services realigned from the Resource Only Program will be provided here. In addition, $389,274 from stipends is being realigned from this program to support spending priority needs in the Office of Special Education and Divi-sion of Business, Fiscal, and Information Systems shown in Chapter 5, Special Education Support.
» Special Education Services—increase of 16.6 adap-tive physical education teacher positions and $1,315,450. This realignment includes 4.4 adaptive physical education teacher positions from the Mid-dle School budget and 12.2 adaptive physical educa-tion teacher positions from the High School budget.
• Special Education Prekindergarten, Special Programs, and Related Services—$400,992 and 6.5 FTE
» Transition Services—decrease of 1.5 paraeducator positions and $46,368
» Programs for Students with Emotional Disabili-ties—increase of 3.0 special education teacher posi-tions and $167,760
» Autism Programs—increases of 5.0 special educa-tion teacher positions and $279,600
• Special Education Preschool Education Programs (PEP) and InterACT— ($525,852) and (9.488) FTE
» PEP Five-Hour—increase of 1.2 special education teacher positions and $67,104
» PEP Intensive Needs—decreases of a 10.5 preschool special education teacher and 0.188 paraeducator positions and $592,956
• Special Schools/Centers—$9,179 and 0.2 FTE
» Rock Terrace School—increase of 0.2 special educa-tion teacher and $11,184
CHAPTER 1 – 41 SCHOOLS

Schools
» Carl Sandburg Learning Center—budget neutral decrease of a 0.5 psychologist position and increase of a social worker position
» Net decrease of ($2,005) from local travel mileage reimbursement accounts across the special schools/centers
Program Efficiencies and Reductions—($659,925)The FY 2018 recommended budget for this program includes a comprehensive effort to identify potential program efficiencies and reductions. Stakeholders, including community partners and employee union representatives, participated in the program efficiencies and reduction process. As a result, reductions for the following programs are listed below.
• Special Education School-Based Programs and Services— ($391,313) and (7.69) FTE
» Extensions Program—decrease of $8,552 to convert 1.5 social worker positions from a 12-month sched-ule to 10-month and 20 summer days
» Gifted and Talented/Learning Disabled Programs—decrease of a 0.2 special education teacher and 0.015 paraeducator positions and $11,648
» Secondary Intensive Reading Program—decrease of a 0.8 special education teacher position and $44,736
» Least Restrictive Environment Support—decreases of 4.8 special education teacher positions and 1.875 paraeducator positions and $326,377
• Special Education Prekindergarten, Special Programs, and Related Services—($220,032) and (5.5) FTE
» Autism Programs—decrease of 2.0 special educa-tion teacher positions and 3.5 paraeducator posi-tions and $220,032
• Special Schools/Centers—($48,580) and (1.0) FTE
» Rock Terrace School—decrease of a 0.25 instruc-tional data analyst position and $12,145
» Stephen Knolls School—decrease of a 0.25 instruc-tional data analyst position and $12,145
» Carl Sandburg Learning Center—decrease of a 0.25 instructional data analyst position and $12,145
» Regional Institute for Children and Adolescents—decrease of a 0.25 instructional data analyst position and $12,145
Strategic Accelerator—$786,528Focus on Learning, Accountability and Results For FY 2018, an additional 16.0 special education teacher positions and a reduction of 3.5 paraeducator positions, resulting in a net increase of $786,528 is added to this
program to support the expansion of Home School Model, which allows education access for students with disabilities at their assigned elementary school, to the remaining 27 schools. In addition, there is $250,575 bud-geted in Chapter 7, in the Department of Employee and Retiree Services for employee benefits.
Grant: Individuals with Disabilities Education Act (IDEA)—907/913
FY 2018 RECOMMENDED BUDGET
The FY 2018 recommended budget for this grant
is $31,110,389, a decrease of $127,297 from the
current FY 2017 budget. An explanation of this
change follows.
Same Service Level Changes—($127,297)Realignments to Meet Expenditure Requirements and Program Priorities—($127,297) It is projected that MCPS will receive decreased revenue for FY 2018, and as a result there is a program decrease of $2,447 for contractual services and $124,850 for assis-tive technology equipment. In addition, there are several technical realignments budgeted to address spending priority needs within this grant.
Program’s Recent Funding HistoryFY 2017Budgeted7/1/16
FY 2017Projected11/30/16
FY 2018Projected7/1/17
Federal $31,237,686 $31,110,389 $31,110,389
Total $31,237,686 $31,110,389 $31,110,389
CHAPTER 1 – 42 SCHOOLS

FY 2018 OPERATING BUDGET
Elementary Learning Centers
Elementary Program Specialist (A–D) 6.5Teacher, Special Education (A–D) 75.5Paraeducator (13) 64.75
School/Community-Based Programs
Teacher, Special Education (A–D) 65.0Paraeducator (13) 99.0
Extensions Program
Coordinator (N) 1.0Social Worker (B–D) 10-month 1.5Elementary Program Specialist (A–D) 1.0Teacher, Special Education (A–D) 16.5Secondary Program Specialist (A–D) 2.0Paraeducator (13) 34.125
Special Education School-Based Programs and Services
Learning and Academic Disabilities Programs
Teacher, Resource Room (A–D)**** 78.0Teacher, Resource (A–D)*** 6.0Teacher, Resource (A–D)**** Teacher, Special Education (A–D) 39.6Teacher, Special Education (A–D)**Paraeducator (13) 175.525
Secondary Intensive Reading Program
Teacher, Special Education (A–D) 10.8
Gifted and Talented/ Learning Disabled Programs
Teacher, Special Education (A–D) 11.6Paraeducator (13) 9.775
Learning for Independence
Teacher, Special Education (A–D) 72.0Paraeducator (13) 63.0
Least Restrictive Environment Support
Teacher, Special Education (A–D) 6.7Paraeducator (13) 7.813
Hours Based Staffing
Teacher, Special Education (A–D) 167.6Teacher, Resource Room (A–D) 50.0Teacher, Resource (A–D) 41.0Paraeducator (13) 175.438
Home School Model
Teacher, Special Education (A–D) 184.0Teacher, Resource Room (A–D) 139.0Paraeducator (13) 155.313
Medical Assistance Program*
School-Based Programs and Services
F.T.E. Positions 1,875.739
* Resources for Medical Assistance are shown in the Division of Business, Fiscal, and Information Systems under Special Education Support (Chapter 5)
** 143.0 positions funded by IDEA *** 20.0 positions funded by IDEA **** 1.5 positions support Model Learning Center***** 51.4 positions for Itinerant Paraeducator Services are
shown in the Grant—Medical Assistance Program in the Division of Business, Fiscal, and Information Systems under Special Education Support (Chapter 5)
School Support Team
Teacher, Special Education (A–D) 0.5
Itinerant Paraeducator Services
Paraeducator, Itinerant (13)***** 98.6
Adaptive Physical Education
Teacher, Physical Education (A–D) 16.6
CH
AP
TER 1 – 43 S
CH
OO
LS

Special Ed School-Based Prgms & Svcs - 248/242/246/260/275/279/280/281/282/283/284/285
Actual FY 2017Budget
FY 2017Current
FY 2018Request
FY 2018
Summer EmploymentProfessional Substitutes
Total Positions (FTE)Position Salaries
1,682.926$99,227,062
1,725.738$104,928,095
1,824.838$108,087,016
1,875.739$109,135,468
Other Salaries
01 Salaries & Wages
Stipends 389,274 389,274 (389,274)Professional Part Time
ConsultantsOther Contractual
OfficeOther Supplies & Materials
MediaInstructional Supplies & Materials
Textbooks
Subtotal Other Salaries
Leased Equipment
Grand Total
Other Equipment
Total Salaries & Wages
02 Contractual Services
Total Contractual Services
03 Supplies & Materials
Total Supplies & Materials
04 Other
Total Other
05 Equipment
Total Equipment
Supporting Services Part TimeOther
99,227,062 105,317,369 108,476,290 109,135,468 659,178
(389,274)
$99,227,062 $105,317,369 $108,476,290 $109,135,468 $659,178
ChangeDescription FY 2016
50.901$1,048,452
Insur & Employee BenefitsUtilitiesMiscellaneous
Local/Other Travel
CHAPTER 1 – 44 SCHOOLS
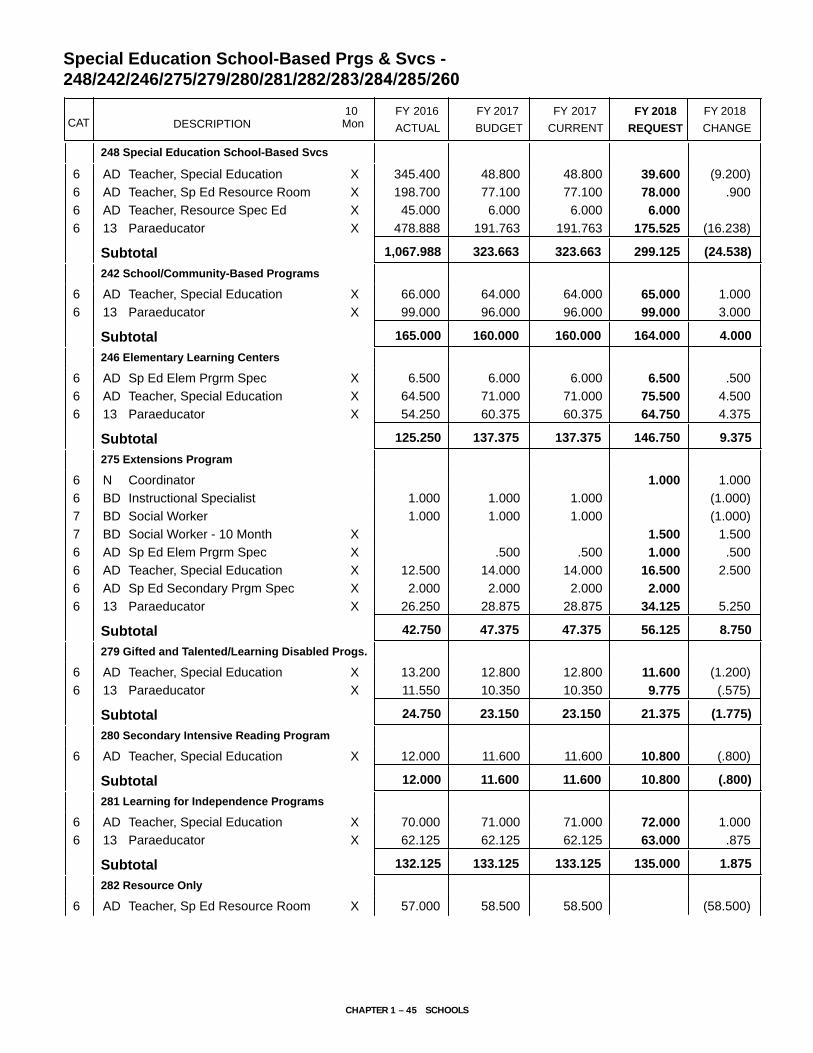
DESCRIPTION CURRENTFYBUDGET
FYACTUAL
20172016 10Mon
FY 2017CAT CHANGE
2018FY
Special Education School-Based Prgs & Svcs - 248/242/246/275/279/280/281/282/283/284/285/260
REQUEST
2018FY
248 Special Education School-Based Svcs
6 345.400 48.800 48.800XTeacher, Special EducationAD (9.200)39.600
6 198.700 77.100 77.100XTeacher, Sp Ed Resource RoomAD .90078.000
6 45.000 6.000 6.000XTeacher, Resource Spec EdAD 6.000
6 478.888 191.763 191.763XParaeducator13 (16.238)175.525
1,067.988 323.663 323.663Subtotal (24.538)299.125
242 School/Community-Based Programs
6 66.000 64.000 64.000XTeacher, Special EducationAD 1.00065.000
6 99.000 96.000 96.000XParaeducator13 3.00099.000
165.000 160.000 160.000Subtotal 4.000164.000
246 Elementary Learning Centers
6 6.500 6.000 6.000XSp Ed Elem Prgrm SpecAD .5006.500
6 64.500 71.000 71.000XTeacher, Special EducationAD 4.50075.500
6 54.250 60.375 60.375XParaeducator13 4.37564.750
125.250 137.375 137.375Subtotal 9.375146.750
275 Extensions Program
6 CoordinatorN 1.0001.000
6 1.000 1.000 1.000Instructional SpecialistBD (1.000)7 1.000 1.000 1.000Social WorkerBD (1.000)7 XSocial Worker - 10 MonthBD 1.5001.500
6 .500 .500XSp Ed Elem Prgrm SpecAD .5001.000
6 12.500 14.000 14.000XTeacher, Special EducationAD 2.50016.500
6 2.000 2.000 2.000XSp Ed Secondary Prgm SpecAD 2.000
6 26.250 28.875 28.875XParaeducator13 5.25034.125
42.750 47.375 47.375Subtotal 8.75056.125
279 Gifted and Talented/Learning Disabled Progs.
6 13.200 12.800 12.800XTeacher, Special EducationAD (1.200)11.600
6 11.550 10.350 10.350XParaeducator13 (.575)9.775
24.750 23.150 23.150Subtotal (1.775)21.375
280 Secondary Intensive Reading Program
6 12.000 11.600 11.600XTeacher, Special EducationAD (.800)10.800
12.000 11.600 11.600Subtotal (.800)10.800
281 Learning for Independence Programs
6 70.000 71.000 71.000XTeacher, Special EducationAD 1.00072.000
6 62.125 62.125 62.125XParaeducator13 .87563.000
132.125 133.125 133.125Subtotal 1.875135.000
282 Resource Only
6 57.000 58.500 58.500XTeacher, Sp Ed Resource RoomAD (58.500)
CHAPTER 1 – 45 SCHOOLS

DESCRIPTION CURRENTFYBUDGET
FYACTUAL
20172016 10Mon
FY 2017CAT CHANGE
2018FYREQUEST
2018FY
282 Resource Only
6 21.500 23.000 23.000XParaeducator13 (23.000)
78.500 81.500 81.500Subtotal (81.500)
283 Least Restrictive Enrvironment Support
6 13.000 12.000 12.000XTeacher, Special EducationAD (5.300)6.700
6 21.563 18.938 18.938XParaeducator13 (11.125)7.813
34.563 30.938 30.938Subtotal (16.425)14.513
284 Hours Based Staffing
6 164.200 164.200XTeacher, Special EducationAD 3.400167.600
6 49.000 49.000XTeacher, Sp Ed Resource RoomAD 1.00050.000
6 40.000 40.000XTeacher, Resource Spec EdAD 1.00041.000
6 169.687 169.687XParaeducator13 5.751175.438
422.887 422.887Subtotal 11.151434.038
285 Home School Model
6 151.150 151.150XTeacher, Special EducationAD 32.850184.000
6 76.700 76.700XTeacher, Sp Ed Resource RoomAD 62.300139.000
6 126.275 126.275XParaeducator13 29.038155.313
354.125 354.125Subtotal 124.188478.313
260 Special Education Services
6 .500XTeacher, Special EducationAD .500
6 XTeacher, Physical EducationAD 16.60016.600
6 98.600XSpec Ed Itinerant Paraeducator13 98.600
99.100Subtotal 16.600115.700
1,725.7381,682.926 1,824.838Total Positions 50.9011,875.739
Special Education School-Based Prgs & Svcs - 248/242/246/275/279/280/281/282/283/284/285/260
CHAPTER 1 – 46 SCHOOLS

FY 2018 OPERATING BUDGET
Prekindergarten, Special Programs, and Related Services
Autism Programs
Teacher, Special Education (A–D) 114.9Paraeducator 13) 227.475
Programs for Students with Emotional Disabilities (ED)
Teacher, Special Education (A–D) 59.0Teacher, Physical Education (A–D) 0.5Secondary Program Specialist (A–D) 10.0Paraeducator (13) 82.625
Bridge Program
Teacher, Resource (A–D) 6.0Teacher, Physical Education (A–D) 2.9Teacher, Special Education (A–D) 32.0School Secretary II (13) 3.0Paraeducator (13) 40.0
Programs—Deaf and Hard of Hearing and Visually Impaired
Auditory Development Specialist (A–D) 7.2Teacher,Vision (A–D) 14.5Teacher, Auditory (A–D) 35.1Teacher, Special Education (A–D) 1.0Interpreter II (18) 2.625Interpreter I (15) 10.573Paraeducator (13) 23.338
Programs for Physically Disabled/ High Incidence Accessible Technology (HIAT)
Occupational Therapist (A–D) 66.6Physical Therapist (A–D) 25.6Teacher, Orthopedic (A–D) 6.5Teacher, Physical Education (A–D) 0.4Paraeducator (13) 9.125
Special Programs and Related Services
Transition Services
Teacher, Transition (A–D) 43.3Paraeducator (13) 18.75
Speech and Language Programs
Speech Pathologist (B–D) 209.1Teacher, Special Education (A–D) 1.7Paraeducator (13) 4.812
Individuals with Disabilities
Education Act (IDEA)
F.T.E. Positions 1,058.623
CH
AP
TER 1 – 47 S
CH
OO
LS

Prekindergarten, Special Prgs., & Related Svcs - 266/267/268/286/287/288/289/290
Actual FY 2017Budget
FY 2017Current
FY 2018Request
FY 2018
Summer EmploymentProfessional Substitutes
Total Positions (FTE)Position Salaries
1,027.155$67,837,511
1,058.623$67,985,539
Other Salaries
01 Salaries & Wages
StipendsProfessional Part Time
ConsultantsOther Contractual
OfficeOther Supplies & Materials
MediaInstructional Supplies & Materials
Textbooks
Subtotal Other Salaries
Leased Equipment
Grand Total
Other Equipment
Total Salaries & Wages
02 Contractual Services
Total Contractual Services
03 Supplies & Materials
Total Supplies & Materials
04 Other
Total Other
05 Equipment
Total Equipment
Supporting Services Part TimeOther
67,837,511 67,985,539 148,028
$67,837,511 $67,985,539 $148,028
ChangeDescription FY 2016
31.468$148,028
Insur & Employee BenefitsUtilitiesMiscellaneous
Local/Other Travel
CHAPTER 1 – 48 SCHOOLS

DESCRIPTION CURRENTFYBUDGET
FYACTUAL
20172016 10Mon
FY 2017CAT CHANGE
2018FY
PreKindergarten, Special Prgs., & Related Svcs - 286/287/288/289/290/266/267/268
REQUEST2018FY
286 Bridge Program
6 29.000XTeacher, Special EducationAD 3.00032.0006 2.900XTeacher, Physical EducationAD 2.9006 6.000XTeacher, Resource Spec EdAD 6.0006 3.000School Secretary II13 3.0006 36.250XParaeducator13 3.75040.000
77.150Subtotal 6.75083.900287 Programs - Deaf & Hard of Hearing
6 .800XTeacher, Special EducationAD .8006 36.000XTeacher, AuditoryAD (.900)35.1006 7.200XAuditory Development SpecAD 7.2006 2.625XInterpreter Hearing Impair II18 2.6256 10.573XInterpreter Hearing Impair I15 10.5736 20.125XParaeducator13 (.787)19.338
77.323Subtotal (1.687)75.636288 Programs - Speech & Language
6 207.100XSpeech PathologistBD 2.000209.1006 1.700XTeacher, Special EducationAD 1.7006 4.812XParaeducator13 4.812
213.612Subtotal 2.000215.612289 Programs - Visually Impaired
6 14.500XTeacher, VisionAD 14.5006 .200XTeacher, Special EducationAD .2006 4.000XParaeducator13 4.000
18.700Subtotal 18.700290 Programs - Physically Disabled
6 6.500XTeacher, OrthopedicAD 6.5006 .400XTeacher, Physical EducationAD .4006 25.600XPhysical TherapistAD 25.6006 66.600XOccupational TherapistAD 66.6006 9.125XParaeducator13 9.125
108.225Subtotal 108.225266 Transition Services
6 42.300XTeacher, Sp Ed TransitionAD 1.00043.3006 20.250XParaeducator13 (1.500)18.750
62.550Subtotal (.500)62.050267 Programs - Students w/Emotional Dis
6 56.000XTeacher, Special EducationAD 3.00059.0006 .500XTeacher, Physical EducationAD .500
CHAPTER 1 – 49 SCHOOLS

DESCRIPTION CURRENTFYBUDGET
FYACTUAL
20172016 10Mon
FY 2017CAT CHANGE
2018FYREQUEST
2018FY
267 Programs - Students w/Emotional Dis
6 10.000XSp Ed Secondary Prgm SpecAD 10.0006 77.250XParaeducator13 5.37582.625
143.750Subtotal 8.375152.125268 Autism Programs
6 110.500XTeacher, Special EducationAD 4.400114.9006 215.345XParaeducator13 12.130227.475
325.845Subtotal 16.530342.375
1,027.155Total Positions 31.4681,058.623
PreKindergarten, Special Prgs., & Related Svcs - 286/287/288/289/290/266/267/268
CHAPTER 1 – 50 SCHOOLS
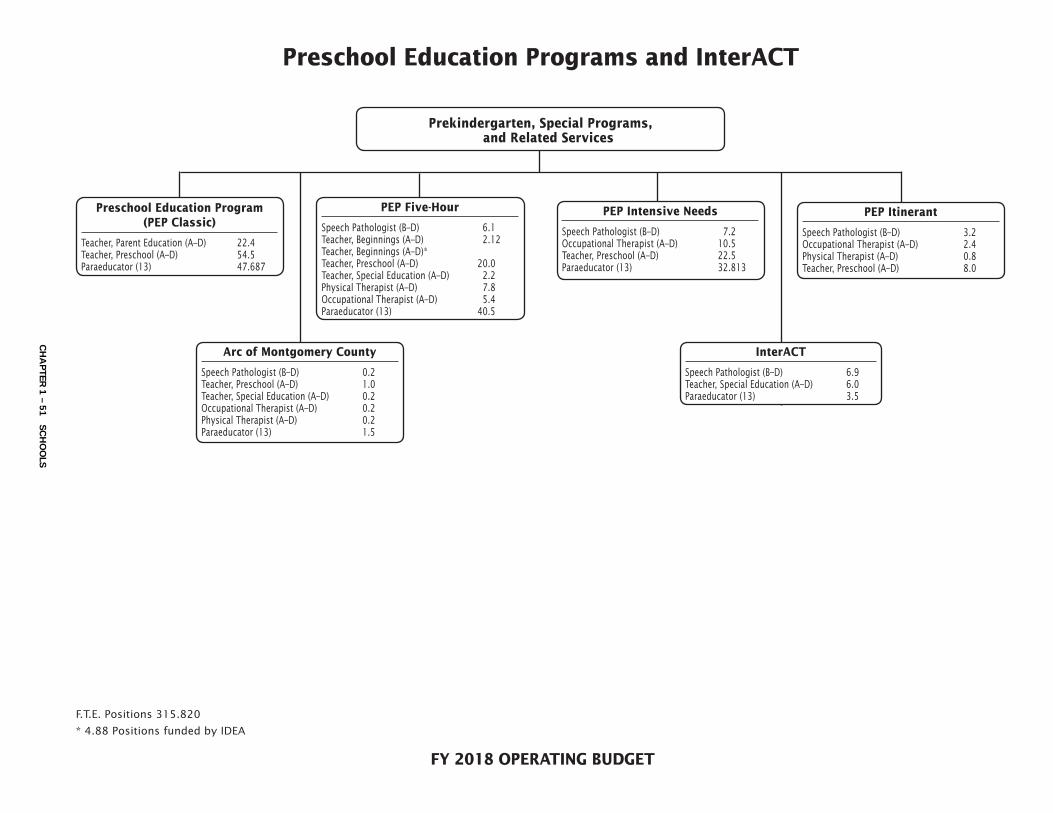
Preschool Education Programs and InterACT
F.T.E. Positions 315.820
* 4.88 Positions funded by IDEA
Prekindergarten, Special Programs, and Related Services
Preschool Education Program (PEP Classic)
Teacher, Parent Education (A–D) 22.4Teacher, Preschool (A–D) 54.5Paraeducator (13) 47.687
Arc of Montgomery County
Speech Pathologist (B–D) 0.2Teacher, Preschool (A–D) 1.0Teacher, Special Education (A–D) 0.2Occupational Therapist (A–D) 0.2Physical Therapist (A–D) 0.2Paraeducator (13) 1.5
InterACT
Speech Pathologist (B–D) 6.9Teacher, Special Education (A–D) 6.0Paraeducator (13) 3.5
PEP Intensive Needs
Speech Pathologist (B–D) 7.2Occupational Therapist (A–D) 10.5Teacher, Preschool (A–D) 22.5Paraeducator (13) 32.813
PEP Itinerant
Speech Pathologist (B–D) 3.2Occupational Therapist (A–D) 2.4Physical Therapist (A–D) 0.8Teacher, Preschool (A–D) 8.0
PEP Five-Hour
Speech Pathologist (B–D) 6.1Teacher, Beginnings (A–D) 2.12Teacher, Beginnings (A–D)*Teacher, Preschool (A–D) 20.0Teacher, Special Education (A–D) 2.2Physical Therapist (A–D) 7.8Occupational Therapist (A–D) 5.4Paraeducator (13) 40.5
FY 2018 OPERATING BUDGET
CH
AP
TER 1 – 51 S
CH
OO
LS

Preschool Education Programs & InterACT - 269/270
Actual FY 2017Budget
FY 2017Current
FY 2018Request
FY 2018
Summer EmploymentProfessional Substitutes
Total Positions (FTE)Position Salaries
309.658$20,537,636
315.820$20,790,604
Other Salaries
01 Salaries & Wages
StipendsProfessional Part Time
ConsultantsOther Contractual
OfficeOther Supplies & Materials
MediaInstructional Supplies & Materials
Textbooks
Subtotal Other Salaries
Leased Equipment
Grand Total
Other Equipment
Total Salaries & Wages
02 Contractual Services
Total Contractual Services
03 Supplies & Materials
Total Supplies & Materials
04 Other
Total Other
05 Equipment
Total Equipment
Supporting Services Part TimeOther
20,537,636 20,790,604 252,968
$20,537,636 $20,790,604 $252,968
ChangeDescription FY 2016
6.162$252,968
Insur & Employee BenefitsUtilitiesMiscellaneous
Local/Other Travel
CHAPTER 1 – 52 SCHOOLS
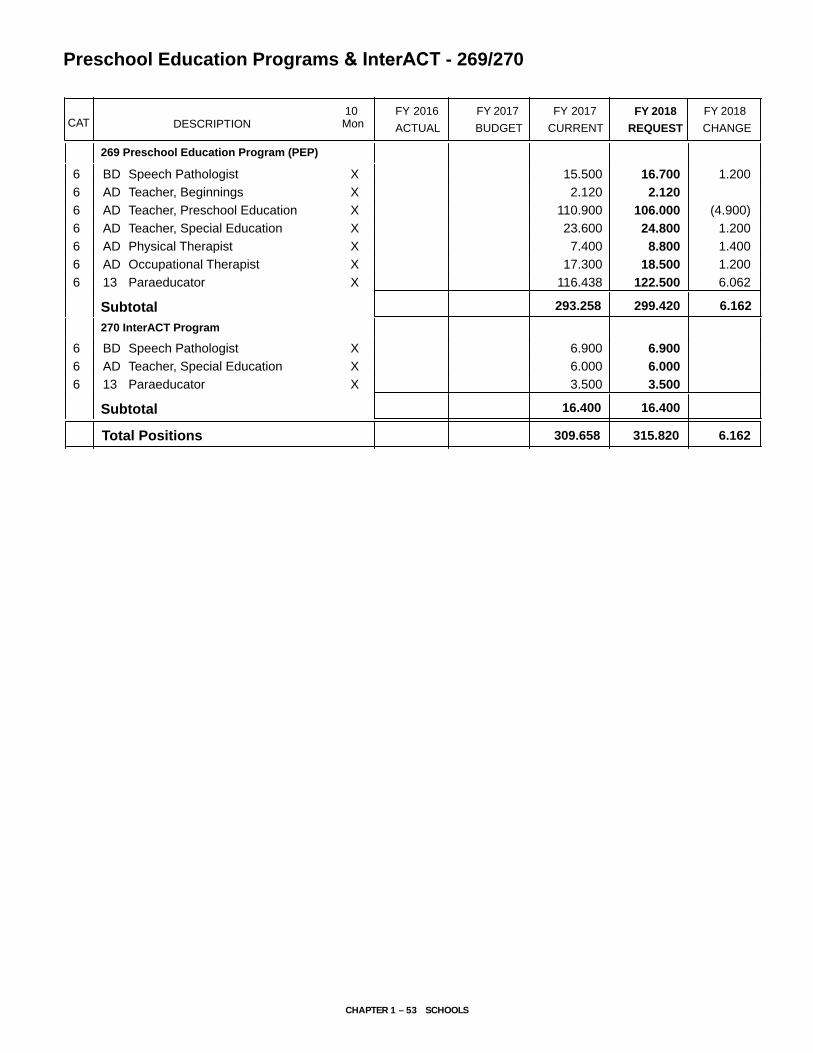
DESCRIPTION CURRENTFYBUDGET
FYACTUAL
20172016 10Mon
FY 2017CAT CHANGE
2018FY
Preschool Education Programs & InterACT - 269/270
REQUEST
2018FY
269 Preschool Education Program (PEP)
6 15.500XSpeech PathologistBD 1.20016.700
6 2.120XTeacher, BeginningsAD 2.120
6 110.900XTeacher, Preschool EducationAD (4.900)106.000
6 23.600XTeacher, Special EducationAD 1.20024.800
6 7.400XPhysical TherapistAD 1.4008.800
6 17.300XOccupational TherapistAD 1.20018.500
6 116.438XParaeducator13 6.062122.500
293.258Subtotal 6.162299.420
270 InterACT Program
6 6.900XSpeech PathologistBD 6.900
6 6.000XTeacher, Special EducationAD 6.000
6 3.500XParaeducator13 3.500
16.400Subtotal 16.400
309.658Total Positions 6.162315.820
CHAPTER 1 – 53 SCHOOLS

FY 2018 OPERATING BUDGET
Carl Sandburg Learning Center
Principal (O) 1.0Psychologist (B–D) 10-month 0.5Media Specialist (B–D) 0.5Social Worker (B–D) 10-month 0.5Teacher, Staff Development (A–D) 0.5Elementary Program Specialist (A–D) 1.0Teacher, Special Education (A–D) 15.0Teacher, Art (A–D) 0.7Teacher, Music (A–D) 0.5Teacher, Physical Education (A–D) 1.0School Administrative Secretary (16) 1.0Paraeducator (13) 26.25Media Assistant (12) 0.5School Secretary I (12) 0.5Lunch Aide (7) 0.875
Rock Terrace School
Principal (P) 1.0Assistant Principal (N) 1.0Psychologist (B–D) 10–month 1.0Counselor (B–D) 0.5Media Specialist (B–D) 0.5Social Worker (B–D) 10-month 1.0Teacher, Staff Development (A–D) 0.4Teacher, Special Education (A–D)***Teacher, Physical Education (A–D) 1.0Teacher, Art (A–D) 0.6Teacher, Music (A–D) 0.6School Administrative Secretary (16) 1.0Security Assistant (14) 1.0School Secretary II (13) 1.0Paraeducator (13) 14.8Media Assistant (12) 0.5
Stephen Knolls School
Coordinator (N) 1.0Media Specialist (B–D) 0.5Teacher, Special Education (A–D)***** Teacher, Staff Development (A–D) 0.3Teacher, Physical Education (A–D) 0.9Teacher, Art (A–D) 0.7Teacher, Music (A–D) 0.6School Administrative Secretary (16) 1.0Paraeducator (13) 14.0Media Assistant (12) 0.5School Secretary I (12) 0.5Lunch Aide (7) 0.875
Longview School
Coordinator (N) 1.0Teacher, Special Education (A–D)** Teacher, Staff Development (A–D) 0.3Teacher, Physical Ed. (A–D) 0.5Teacher, Art (A–D) 0.5Teacher, Music (A–D) 0.4School Administrative Secretary (16) 1.0Paraeducator (13) 15.75Media Assistant (12) 0.5School Secretary I (12) 0.5Lunch Aide (7) 0.875
John L. Gildner Regional Institute for Children and
Adolescents (JLG-RICA)
Principal (P) 1.0Assistant Principal (N) 1.0Media Specialist (B–D) 1.0Secondary Program Specialist (A–D) 2.0Teacher (A–D) 0.5Teacher, Special Education (A–D) 1.0Teacher, Special Education (A–D)**** Teacher, Transition (A–D) 1.0Teacher, Physical Education (A–D) 1.0Teacher, Music (A–D) 0.6Teacher, Art (A–D) 1.0School Administrative Secretary (16) 1.0Security Assistant (14) 1.0Paraeducator (13) 17.0School Secretary II (13) 1.0Media Assistant (12) 0.5
F.T.E. Positions 149.025 * Special schools/centers are supervised by the Office of the
Deputy Superintendent for School Support and Improvement ** Additional 9.0 positions funded by IDEA *** Additional 15.8 positions funded by IDEA **** Additional 18.0 positions funded by IDEA ***** Additional 8.0 positions funded by IDEA
Special Schools/Centers*
CH
AP
TER 1 – 54 S
CH
OO
LS
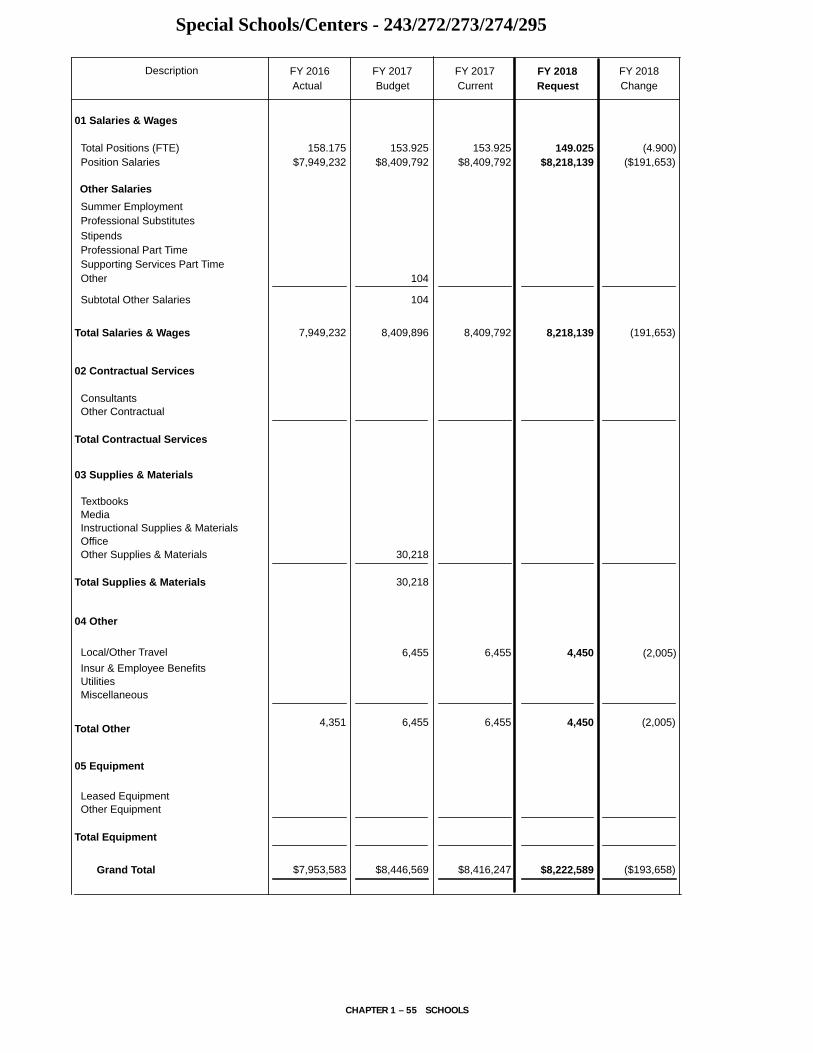
Special Schools/Centers - 243/272/273/274/295
Actual FY 2017Budget
FY 2017Current
FY 2018Request
FY 2018
Summer EmploymentProfessional Substitutes
Total Positions (FTE)Position Salaries
158.175$7,949,232
153.925$8,409,792
153.925$8,409,792
149.025$8,218,139
Other Salaries
01 Salaries & Wages
StipendsProfessional Part Time
ConsultantsOther Contractual
OfficeOther Supplies & Materials
MediaInstructional Supplies & Materials
Textbooks
Subtotal Other Salaries
Leased Equipment
Grand Total
Other Equipment
Total Salaries & Wages
02 Contractual Services
Total Contractual Services
03 Supplies & Materials
Total Supplies & Materials
04 Other
Total Other
05 Equipment
Total Equipment
Supporting Services Part TimeOther
30,218
30,218
7,949,232 8,409,896 8,409,792 8,218,139 (191,653)
104
104
$7,953,583 $8,446,569 $8,416,247 $8,222,589 ($193,658)
ChangeDescription FY 2016
(4.900)($191,653)
Insur & Employee BenefitsUtilitiesMiscellaneous
4,351 6,455 6,455 4,450 (2,005)
Local/Other Travel 6,455 6,455 4,450 (2,005)
CHAPTER 1 – 55 SCHOOLS

DESCRIPTION CURRENTFYBUDGET
FYACTUAL
20172016 10Mon
FY 2017CAT CHANGE
2018FY
Special Schools/Centers - 243/272/273/274/295
REQUEST
2018FY
243 Rock Terrace School
6 1.000 1.000 1.000PrincipalP 1.000
6 1.000 1.000 1.000Assisant PrincipalN 1.000
3 .500PsychologistBD 3 1.000 1.000XPsychologist - 10 MonthBD 1.000
6 1.000 .500 .500XCounselorBD .500
6 .500 .500 .500XMedia SpecialistBD .500
3 XSocial Worker - 10 MonthBD 1.0001.000
6 .400 .400 .400XTeacher, Staff DevelopmentAD .400
6 .100 .100 .100XTeacher, Special EducationAD (.100)6 1.000 1.000 1.000XTeacher, Physical EducationAD 1.000
6 .600 .600 .600XTeacher, ArtAD .600
6 .600 .600 .600XTeacher, General MusicAD .600
6 1.000 1.000 1.000School Admin Secretary16 1.000
6 .250 .250 .250XInstructional Data Analyst16 (.250)6 1.000 1.000 1.000XSecurity Assistant14 1.000
6 1.000 1.000 1.000XSchool Secretary II13 1.000
6 16.100 16.100 16.100XParaeducator13 (1.300)14.800
6 1.000 .500 .500XMedia Assistant12 .500
27.050 26.550 26.550Subtotal (.650)25.900
272 Stephen Knolls School
6 1.000 1.000 1.000Coordinator Special CenterN 1.000
6 .500 .500 .500XMedia SpecialistBD .500
6 .300 .300 .300XTeacher, Staff DevelopmentAD .300
6 .900 .900 .900XTeacher, Physical EducationAD .900
6 .700 .700 .700XTeacher, ArtAD .700
6 .600 .600 .600XTeacher, General MusicAD .600
6 1.000 1.000 1.000School Admin Secretary16 1.000
6 .250 .250 .250XInstructional Data Analyst16 (.250)6 13.750 13.750 13.750XParaeducator13 .25014.000
6 .500 .500 .500School Secretary I12 .500
6 .500 .500 .500XMedia Assistant12 .500
6 .875 .875 .875XLunch Hour Aide7 .875
20.875 20.875 20.875Subtotal 20.875
273 Carl Sandburg Learning Center
6 1.000 1.000 1.000PrincipalO 1.000
3 1.000 1.000 1.000XPsychologist - 10 MonthBD (.500).500
6 .500 .500 .500XMedia SpecialistBD .500
3 XSocial Worker - 10 MonthBD .500.500
6 .500 .500 .500XTeacher, Staff DevelopmentAD .500
6 2.000 2.000 2.000XSp Ed Elem Prgrm SpecAD (1.000)1.000
6 16.000 16.000 16.000XTeacher, Special EducationAD (1.000)15.000
CHAPTER 1 – 56 SCHOOLS

DESCRIPTION CURRENTFYBUDGET
FYACTUAL
20172016 10Mon
FY 2017CAT CHANGE
2018FY
Special Schools/Centers - 243/272/273/274/295
REQUEST
2018FY
273 Carl Sandburg Learning Center
6 1.000 1.000 1.000XTeacher, Physical EducationAD 1.000
6 .700 .700 .700XTeacher, ArtAD .700
6 .500 .500 .500XTeacher, General MusicAD .500
6 1.000 1.000 1.000School Admin Secretary16 1.000
6 .250 .250 .250XInstructional Data Analyst16 (.250)6 28.000 28.000 28.000XParaeducator13 (1.750)26.250
6 .500 .500 .500School Secretary I12 .500
6 .500 .500 .500XMedia Assistant12 .500
6 .875 .875 .875XLunch Hour Aide7 .875
54.325 54.325 54.325Subtotal (4.000)50.325
274 Longview School
6 1.000 1.000 1.000Coordinator Special CenterN 1.000
6 .300 .300 .300XTeacher, Staff DevelopmentAD .300
6 .500 .500 .500XTeacher, Physical EducationAD .500
6 .500 .500 .500XTeacher, ArtAD .500
6 .400 .400 .400XTeacher, General MusicAD .400
6 1.000 1.000 1.000School Admin Secretary16 1.000
6 15.750 15.750 15.750XParaeducator13 15.750
6 .500 .500 .500School Secretary I12 .500
6 .500 .500 .500XMedia Assistant12 .500
6 .875 .875 .875XLunch Hour Aide7 .875
21.325 21.325 21.325Subtotal 21.325
295 Regional Institute for Children & Adolescents
6 1.000 1.000 1.000PrincipalP 1.000
6 1.000 1.000 1.000Assistant PrincipalN 1.000
6 1.000 1.000 1.000XMedia SpecialistBD 1.000
6 .500 .500 .500XTeacherAD .500
6 2.000 1.000 1.000XTeacher, Special EducationAD 1.000
6 1.000 1.000 1.000XTeacher, Physical EducationAD 1.000
6 1.000 1.000 1.000XTeacher, ArtAD 1.000
6 .600 .600 .600XTeacher, General MusicAD .600
6 1.000 1.000 1.000XTeacher, Sp Ed TransitionAD 1.000
6 2.000 2.000 2.000XSp Ed Secondary Prgm SpecAD 2.000
6 1.000 1.000 1.000School Admin Secretary16 1.000
6 .250 .250 .250XInstructional Data Analyst16 (.250)6 1.000 1.000 1.000XSecurity Assistant14 1.000
6 1.000 1.000School Secretary II13 1.000
6 19.750 17.000 17.000XParaeducator13 17.000
6 1.000School Secretary I12
CHAPTER 1 – 57 SCHOOLS
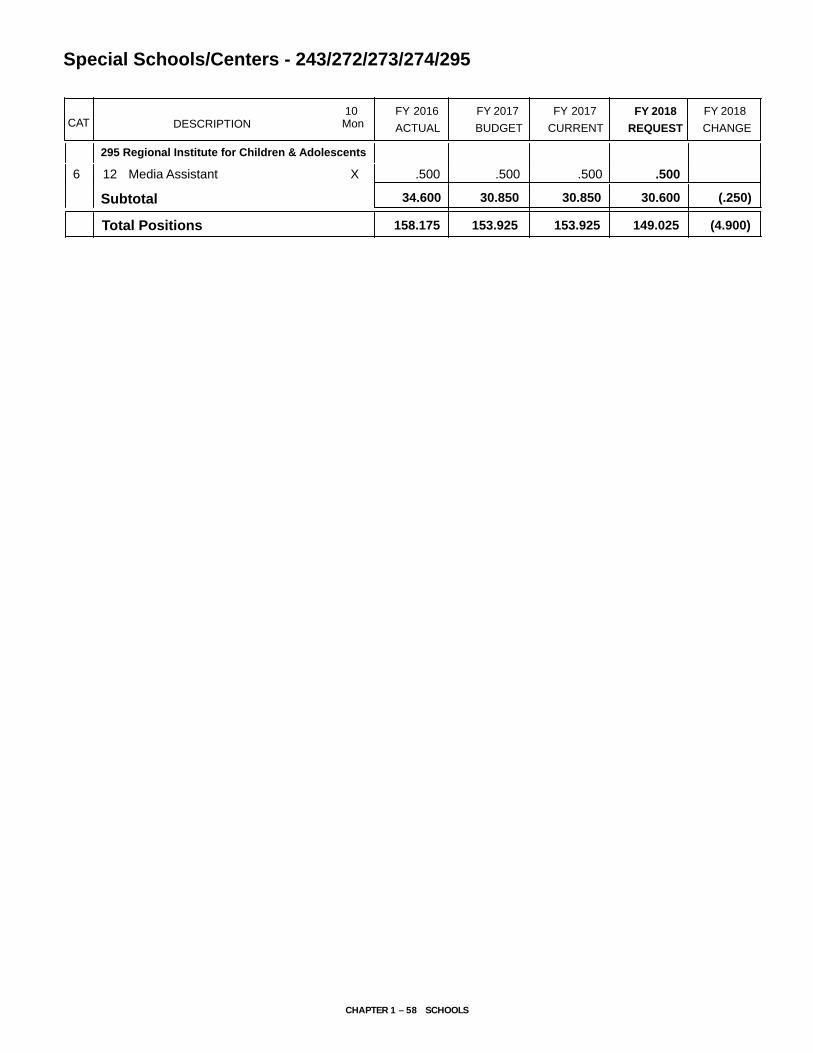
DESCRIPTION CURRENTFYBUDGET
FYACTUAL
20172016 10Mon
FY 2017CAT CHANGE
2018FY
Special Schools/Centers - 243/272/273/274/295
REQUEST
2018FY
295 Regional Institute for Children & Adolescents
6 .500 .500 .500XMedia Assistant12 .500
34.600 30.850 30.850Subtotal (.250)30.600
153.925158.175 153.925Total Positions (4.900)149.025
CHAPTER 1 – 58 SCHOOLS

Stephen Knolls School
Teacher, Special Education (A–D) 8.0
PEP Five Hour
Teacher, Beginnings (A–D) 4.88
JIG-RICA
Teacher, Special Education (A–D) 18.0
Parentally-Placed Private School Students
Speech Pathologist (B–D) 2.0Teacher, Resource Room (A–D) 2.0
Longview School
Teacher, Special Education (A–D) 9.0
Rock Terrace School
Teacher, Special Education (A–D) 15.8
Special Education School-Based Programs: Learning and Academic Disabilities
Teacher, Resource (A–D) 20.0Teacher, Special Education (A–D) 143.0
FY 2018 OPERATING BUDGET
Grant: Individuals with Disabilities Education Act (IDEA) Special Education School-Based Programs and Services
F.T.E. Positions 222.680
* All positions also are shown on other charts in this chapter to reflect program assignments
CH
AP
TER 1 – 59 S
CH
OO
LS

Grant: Individuals with Disabilities Education Act - 913/907
Actual FY 2017Budget
FY 2017Current
FY 2018Request
FY 2018
Summer EmploymentProfessional Substitutes
1,347,046 1,347,046 1,587,443 240,397(265,225)
Total Positions (FTE)Position Salaries
219.780$17,910,501
222.680$18,822,445
222.680$18,822,445
222.680$18,797,286
Other Salaries
01 Salaries & Wages
286,696 286,696 21,471
Stipends 25,256 25,256 271,787 246,531Professional Part Time
ConsultantsOther Contractual
OfficeOther Supplies & Materials
MediaInstructional Supplies & Materials
Textbooks
Subtotal Other Salaries
Leased Equipment
Grand Total
Other Equipment
Total Salaries & Wages
02 Contractual Services
Total Contractual Services
03 Supplies & Materials
Total Supplies & Materials
04 Other
Total Other
05 Equipment
Total Equipment
Supporting Services Part TimeOther
2,063866,291
2,063866,291
80,140723,142
78,077(143,149)
1,303,041
42,8411,094,813
1,137,654
42,8411,094,813
1,137,654
1,103,933
1,103,933 (33,721)
9,120(42,841)
884,808
22,800
418,3385,500
286,494
733,132
22,800
418,3385,500
286,494
733,132
337,2585,500
277,866
22,800
643,424
(8,628)
(81,080)
(89,708)
21,091,997 21,349,797 21,349,797 21,481,269 131,472
3,181,496 2,527,352 2,527,352 2,683,983 156,631
$32,089,056
487,672
394,899
$31,237,686
394,899
394,899
394,899
$31,237,686
266,443
266,443
$31,110,389
(128,456)
(128,456)
($127,297)
ChangeDescription FY 2016
($25,159)
Insur & Employee BenefitsUtilitiesMiscellaneous
8,321,538
7,548,714
27,990
7,622,204
7,548,714
27,990
7,622,204
7,579,720
7,615,320
31,006
(27,990)
(6,884)
Local/Other Travel 45,500 45,500 35,600 (9,900)
CHAPTER 1 – 60 SCHOOLS

DESCRIPTION CURRENTFYBUDGET
FYACTUAL
20172016 10Mon
FY 2017CAT CHANGE
2018FY
Grant: Individuals with Disabilities Education Act - 913/907
REQUEST
2018FY
913 Grant - IDEA
6 3.000 3.000 3.000XSpeech PathologistBD (1.000)2.000
6 190.900 193.800 193.800XTeacher, Special EducationAD 193.800
6 1.000 1.000 1.000XTeacher, Sp Ed Resource RoomAD 1.0002.000
6 20.000 20.000 20.000XTeacher, Resource Spec EdAD 20.000
214.900 217.800 217.800Subtotal 217.800
907 Grant - IDEA Preschool Education
6 4.880 4.880 4.880XTeacher, BeginningsAD 4.880
4.880 4.880 4.880Subtotal 4.880
222.680219.780 222.680Total Positions 222.680
CHAPTER 1 – 61 SCHOOLS

Chapter 2
School Support and Improvement
School Support and Improvement PAGE
Office of the Deputy Superintendent of School Support and Improvement .................................. 2-3
Alternative Programs .................................................... 2-5
Grant: Title I, Part D Prevention and Intervention Programs for Children and Youth Who Are Neglected, Delinquent, or At-Risk........................................ 2-9

25.000
By Object of Expenditure
Summary of Resources
School Support and Improvement
(2.000)
OBJECT OF EXPENDITURE FY 2016 FY 2017 FY 2017 FY 2018 FY 2018ACTUAL BUDGET CURRENT BUDGET CHANGE
27.00027.000
105.750 105.750 (11.000)105.750
86,171
189,818 242,685 269,630
130,820 109,820
242,685
18,971
129,293
209,449
66,823
19,348 190,478 190,478 145,478 (45,000)
18,971 14,971 (4,000)
209,449 160,449 (49,000)
9,536,101
130,820
9,912,383 9,912,383 9,141,333 (771,050)
19,454
26,945
38,027
(21,000)
9,00029,027 29,027
512 569 569 569
8,040 6,500 6,500 6,500
28,006 36,096 36,096 45,096 9,000
$10,321,984 $9,565,879
POSITIONS
Administrative
TOTAL POSITIONS
01 SALARIES & WAGES
Administrative
OTHER SALARIES
Administrative
Professional
Supporting Services
TOTAL OTHER SALARIES
TOTAL SALARIES AND WAGES
02 CONTRACTUAL SERVICES
03 SUPPLIES & MATERIALS
04 OTHER
Local/Other Travel
Insur & Employee Benefits
Utilities
Miscellaneous
TOTAL OTHER
05 EQUIPMENT
GRAND TOTAL AMOUNTS
$4,204,564 $4,272,816 $4,272,816
94.750
TOTAL POSITION DOLLARS 9,449,930 9,702,934 9,702,934 8,980,884 (722,050)
$4,021,268 ($251,548)
$10,321,984 ($756,105)$9,883,218
32.900 (9.000)
36.85036.850 36.85041.90041.900Professional
Supporting Services
27.000
41.90036.850
3,505,437 3,034,935
1,924,681
(470,502)
1,924,681
3,479,578
1,765,7883,505,437
1,924,681
Professional
Supporting Services
Business/Operations Admin.
Business/Operations Admin.
CHAPTER 2 – 1 SCHOOL SUPPORT AND IMPROVEMENT

FY 2018 OPERATING BUDGET
School Support and Improvement—Overview
Office of the Deputy Superintendent of School Support and Improvement
F.T.E. Positions 94.75
Alternative Programs
Office of School Administration and Leadership Development
Office of Secondary School Support and Improvement
Office of Elementary School Support and Improvement
Schools
Elementary 133
Schools
Middle 40High 26Special Schools/Centers 5
CH
AP
TER 2 – 2 S
CH
OO
L SU
PP
OR
T AN
D IM
PR
OV
EMEN
T
Office of School Support and Improvement617/613/561/937
M I S S I O N The mission of the Office of
School Support and Improvement (OSSI) is
to create the conditions for every student
to experience academic excellence through
the development and implementation of
professional learning, comprehensive and
coordinated programs and services, and a
focus on learning, accountability, and results.
MAJOR FUNCTIONSSupporting School Improvement
The function of OSSI is to ensure that every school has excellent leadership that enables schools to focus on improving student achievement through effective instruction. To maintain this focus, the office provides flexible, targeted support and professional development to individual principals, schools, and the school system. At the school level, OSSI monitors the implementation of the school improvement planning process, by assist-ing principals with identifying strategies for improv-ing student learning and achievement, creating school improvement plans to focus and monitor the strategies, analyzing school data for concrete actions, and provid-ing differentiated assistance based on school needs.
To improve the teaching and learning of literacy and mathematics to ensure all students possess the critical and creative thinking skills necessary to be college and career ready, a select group of elementary and secondary schools are piloting the use of an integrated online plat-form that provides real time student performance data to inform and improve instruction as well as improve professional practice. Data from the pilot enhances the strategic work of OSSI to support schools and school leadership in accelerating learning for all students.
OSSI also collaborates with several central offices to strengthen the coordination of services to schools. Spe-cifically, OSSI works with the Office of Curriculum and Instruction to support implementation of curriculum in all schools by observing collaborative planning with principals, engaging in reflective conversations about planning, and observing the implementation of the planning in the classroom. OSSI collaborates with staff in the offices of the Chief Academic Officer, Chief Tech-nology Officer, and Shared Accountability to develop, implement, and monitor strategic, intentional actions
that support the system's strategic priorities and target staffing allocations and training in schools with the larg-est gaps in performance.
Supervision and Evaluation of School-Based Administrators
OSSI oversees the interview selection and evalua-tion processes of all school-based administrators. This includes managing the principal-selection process to ensure community and staff involvement, overseeing transfers of administrators, and monitoring principals’ adherence to the teacher and supporting services pro-fessional growth system requirements. Another aspect of the supervision and evaluation of school-based administrators is the ongoing coaching and monitoring of the principal student learning objective to ensure it is aligned to the goals identified in the School Improve-ment Plan (SIP) and builds on the leadership capacity and professional growth of the principal that will accel-erate student learning and improve adult practice. In FY 2017, OSSI staff began working to align its super-vision practices to the standards of the newly revised Model Principal Supervisor Professional Standards.
Assessment and Monitoring of School Improvement
The School Support and Improvement Framework (SSIF) was developed by OSSI to understand the strengths and needs of each of our 204 schools by using multiple sources of data to pinpoint the support needed. The SSIF is based on four categories of data (i.e. student outcome data and milestones; perceptual data from stakeholder input, observations, community engagement, and pro-fessional learning experiences; implementation data from pilots, audits, and monitoring protocols; and lead-ership data from supervision and evaluation of staff). Once each school’s needs are identified, OSSI works in collaboration with other offices to ensure that schools receive the training, technical support, and human and material resources necessary to meet their needs. Tech-nical assistance and direct school supports are provided to schools through a tiered approach, to those schools with the greatest needs (perhaps across multiple catego-ries of SSIF data), receiving more intense support (more frequent visits, addition staff, specific professional learn-ing sessions, etc.).
Developing Effective Educational Environments OSSI supervises and supports Alternative Programs that work to provide a positive and effective educational program for adolescents who have not been successful in comprehensive schools. Each comprehensive middle and high school operates a Level 1 program for students
CHAPTER 2 – 3 SCHOOL SUPPORT AND IMPROVEMENT
Office of School Support and Improvement617/613/561/937
who need additional support in academic, social/emo-tional and behavior management areas. Alternative Programs also operates four Level 2 programs located outside of the comprehensive school setting. These sec-ondary programs provide direct instruction in the areas of academics and social emotional development. The Level 3 school programs serve students in lieu of expul-sion. A 45-day alternative program serves special educa-tion students who are involved with drugs, weapons, or serious bodily injury offenses.
In FY 2018, OSSI will continue to strengthen the middle school improvement strategy, designed to strategically align existing resources (i.e. middle school focus teach-ers, staff development teachers, and staff development substitutes) to the middle school framework and opti-mize opportunities for adults and students to meet the three competency areas of academic excellence, creative problem solving, and social emotional learning identi-fied in the strategic planning framework. The fund-ing for positions, professional learning, and resource development supports creating the conditions for col-laboration that will improve student achievement and contribute to equity for all students. There are three key focus areas: staff, students, and curriculum. School staff engage in learning centered on the 21st Century ado-lescent learners and develop an implementation plan to elevate opportunities to authentically apply these char-acteristics. Schools have the autonomy to create their plan for full implementation after they have provided time for their staff to learn about the characteristics and assess their current structures and processes.
OVERVIEW OF BUDGET CHANGES
FY 2018 RECOMMENDED BUDGET
The FY 2018 recommended budget for this office
is $9,565,879, a decrease of $756,105 from the
current FY 2017 budget. An explanation of this
change follows.
Same Service Level Changes—$918Realignments to Meet Expenditure Requirements and Program Priorities—$918 There are a number of realignments budgeted to address priority spending needs within this office. There is a decrease of $9,000 for program supplies, and a corre-sponding increase of $7,000 for local travel mileage reim-bursement and $2,000 for dues, registrations, and fees. In addition, $918 to fund contractual services is realigned
to this office’s budget from the budget for the Depart-ment of Employee and Retiree Services. Furthermore, the Department of Instructional Leadership is realigned to the Office of the Chief Academic Officer. In addi-tion, reductions are taken in this department, which are reflected in the Chief Academic Officer overview of bud-get changes.
Program Efficiencies and Reductions—($785,050)The FY 2018 recommended budget for this office includes a comprehensive effort to identify potential program efficiencies and reductions. Stakeholders, including community partners and employee union representatives, participated in the program efficiencies and reduction process.
There is a reduction of 2.0 director II positions and $251,548. Responsibilities will be absorbed by the remaining director positions in the office. Further-more, there is a reduction of 9.0 alternative programs teacher positions, and $470,502, in addition to $30,000 from professional part-time salaries, $10,000 from sum-mer employment salaries, $7,000 from instructional materials, $5,000 from stipends, $4,000 from support-ing services part-time salaries, $3,000 from media cen-ter supplies, $2,000 from contractual maintenance, and $2,000 from textbooks.
Grant: Title I, Part D Prevention and Intervention Programs for Children and Youth Who Are Neglected, Delinquent or At-Risk—937
FY 2018 RECOMMENDED BUDGET
The FY 2018 recommended budget for this
program is $168,164, an increase of $28,027 over
the FY 2017 budget. An explanation of this change
follows.
Contractual Services—$28,027It is projected that MCPS will receive a revenue increase in FY 2018 for this grant, and as a result there is a pro-gram increase of $28,027 for contractual services.
Program’s Recent Funding HistoryFY 2017Budgeted7/1/16
FY 2017Projected11/30/16
FY 2018Projected7/1/17
Federal $140,137 $200,246 $168,164
Total $140,137 $200,246 $168,164
CHAPTER 2 – 4 SCHOOL SUPPORT AND IMPROVEMENT

FY 2018 OPERATING BUDGET
Office of the Deputy Superintendent of School Support and Improvement
Deputy Superintendent of School Support and Improvement 1.0Executive Director (P) 2.0Administrative Services Manager III (19) 1.0Administrative Services Manager I (17) 1.0Copy Editor/Administrative Secretary (17) 1.0
F.T.E. Positions 94.75
Office of School Administration and Leadership Development
Associate Superintendent 1.0Director I (P) 2.0Supervisor (O) 1.0Administrative Services Manager I (17) 1.0Administrative Secretary III (16) 1.0 Administrative Secretary I (14) 1.0
Office of Elementary School Support and Improvement
Associate Superintendent 1.0Director II (Q) 8.0Administrative Services Manager I (17) 1.0Administrative Secretary III (16) 4.0
Office of Secondary School Support and Improvement
Associate Superintendent 1.0Director II (Q) 6.0Administrative Services Manager I (17) 1.0Administrative Secretary III (16) 4.0
Alternative Programs
Principal (P) 1.0Assistant Principal (N) 1.0Pupil Personnel Worker (B–D) 1.0Social Worker (B–D) 1.0Counselor (B–D) 2.0Instructional Specialist (B–D) 1.0Media Specialist (B–D) 1.0Psychologist (B–D) 1.0Central Office Teacher (A–D) 0.5Teacher, Alternative Programs (A–D) 17.4Teacher, Special Education (A–D) 1.0Teacher, Staff Development (A–D) 1.0Teacher, Resource (A–D) 5.0Teacher, Special Education, Resource (A–D) 1.0IT Systems Specialist (25) 0.5School Registrar (16) 1.0School Administrative Secretary (16) 1.0Security Team Leader (16) 1.0Administrative Secretary I (14) 1.0Security Assistant (14) 3.0Paraeducator (13) 13.35
CH
AP
TER 2 – 5 S
CH
OO
L SU
PP
OR
T AN
D IM
PR
OV
EMEN
T

Actual FY 2017Budget
FY 2017Current
FY 2018Request
FY 2018
Summer EmploymentProfessional Substitutes
51,222 51,222 41,222 (10,000)
Total Positions (FTE)Position Salaries
105.750$9,449,930
105.750$9,702,934
105.750$9,702,934
94.750$8,980,884
Other Salaries
01 Salaries & Wages
59,878 59,878 59,878
Stipends 21,384 21,384 16,384 (5,000)Professional Part Time
ConsultantsOther Contractual
OfficeOther Supplies & Materials
MediaInstructional Supplies & Materials
Textbooks
Subtotal Other Salaries
Leased Equipment
Grand Total
Other Equipment
Total Salaries & Wages
02 Contractual Services
Total Contractual Services
03 Supplies & Materials
Total Supplies & Materials
04 Other
Total Other
05 Equipment
Total Equipment
Supporting Services Part TimeOther
50,88918,971
50,88918,971
20,88914,971
(30,000)(4,000)
54,327
10,274105,524
115,798
10,274105,524
115,798
10,274104,442
114,716 (1,082)
(1,082)
119,147
6,6975,000
46,91522,00048,132
128,744
6,6975,000
46,91522,00048,132
128,744
39,91522,00039,132
4,6972,000
107,744
(9,000)
(2,000)(3,000)(7,000)
(21,000)
9,529,809 9,905,278 9,905,278 9,134,228 (771,050)
79,879 202,344 202,344 153,344 (49,000)
$9,730,383 $10,181,847 $10,181,847 $9,397,715 ($784,132)
ChangeDescription FY 2016
(11.000)($722,050)
Insur & Employee BenefitsUtilitiesMiscellaneous
27,100
3,000
32,027
3,000
32,027
3,000
41,027 9,000
Local/Other Travel 29,027 29,027 38,027 9,000
Office of the Deputy Superintendent of School Support and Improvement - 617/561/613
CHAPTER 2 – 6 SCHOOL SUPPORT AND IMPROVEMENT

DESCRIPTION CURRENTFYBUDGET
FYACTUAL
20172016 10Mon
FY 2017CAT CHANGE
2018FY
Office of the Deputy Superintendent of School Support & Improvement - 617/561/613
REQUEST
2018FY
617 Office of Dpty. Supt. of School Supp. & Improv
1 1.000 1.000 1.000Dep Supt for Schl Supp & Imprv 1.000
2 3.000 3.000 3.000Associate Superintendent 3.000
2 16.000 15.000 15.000Director IIQ (1.000)14.000
2 2.000Director IP 1 2.000 2.000 2.000Executive DirectorP 2.000
2 1.000 1.000 1.000SupervisorO 1.000
1 1.000 1.000 1.000Admin Services Mgr III19 1.000
2 1.000 1.000Copy Editor/Admin Sec17 1.000
2 5.000 4.000 4.000Admin Services Manager I17 4.000
2 9.000 8.000 8.000Administrative Secretary III16 8.000
2 1.000 1.000 1.000Administrative Secretary I14 1.000
41.000 37.000 37.000Subtotal (1.000)36.000
561 Alternative Programs
2 1.000 1.000 1.000Principal Alternative ProgramsP 1.000
2 1.000 1.000 1.000Asst Principal, Alt ProgramsN 1.000
3 1.000 1.000 1.000Instructional SpecialistBD 1.000
7 1.000 1.000 1.000Pupil Personnel WorkerBD 1.000
7 1.000 1.000 1.000Social WorkerBD 1.000
3 1.000 1.000 1.000PsychologistBD 1.000
3 2.000 2.000 2.000XCounselorBD 2.000
3 1.000 1.000 1.000XMedia SpecialistBD 1.000
2 .500 .500 .500XCentral Off TeacherAD .500
3 1.000 1.000 1.000XTeacher, Staff DevelopmentAD 1.000
3 26.400 26.400 26.400XTeacher, Alternative ProgramsAD (9.000)17.400
6 1.000 1.000 1.000XTeacher, Special EducationAD 1.000
6 1.000 1.000 1.000XTeacher, Resource Spec EdAD 1.000
3 5.000 5.000 5.000XRes Teacher-Alternative PrgsAD 5.000
2 .500 .500 .500IT Systems Specialist25 .500
2 1.000 1.000 1.000School Registrar16 1.000
2 1.000 1.000 1.000School Admin Secretary16 1.000
2 1.000 1.000 1.000XSecurity Team Leader16 1.000
2 1.000 1.000 1.000Administrative Secretary I14 1.000
2 3.000 3.000 3.000XSecurity Assistant14 3.000
3 13.350 13.350 13.350XParaeducator13 13.350
64.750 64.750 64.750Subtotal (9.000)55.750
613 Leadership Development Unit
2 1.000 1.000Director IIQ (1.000)2 2.000 2.000Director IP 2.000
CHAPTER 2 – 7 SCHOOL SUPPORT AND IMPROVEMENT

DESCRIPTION CURRENTFYBUDGET
FYACTUAL
20172016 10Mon
FY 2017CAT CHANGE
2018FY
Office of the Deputy Superintendent of School Support & Improvement - 617/561/613
REQUEST
2018FY
613 Leadership Development Unit
2 1.000 1.000Administrative Secretary III16 1.000
4.000 4.000Subtotal (1.000)3.000
105.750105.750 105.750Total Positions (11.000)94.750
CHAPTER 2 – 8 SCHOOL SUPPORT AND IMPROVEMENT

Actual FY 2017Budget
FY 2017Current
FY 2018Request
FY 2018
Summer EmploymentProfessional Substitutes
Total Positions (FTE)Position Salaries
Other Salaries
01 Salaries & Wages
StipendsProfessional Part Time
ConsultantsOther Contractual
OfficeOther Supplies & Materials
MediaInstructional Supplies & Materials
Textbooks
Subtotal Other Salaries
Leased Equipment
Grand Total
Other Equipment
Total Salaries & Wages
02 Contractual Services
Total Contractual Services
03 Supplies & Materials
Total Supplies & Materials
04 Other
Total Other
05 Equipment
Total Equipment
Supporting Services Part TimeOther
7,105 7,105 7,105
135,491
126,887
126,887
126,887
126,887
154,914
154,914 28,027
28,027
10,146
1,326
750
2,076
1,326
750
2,076
1,326
750
2,076
6,292 7,105 7,105 7,105
6,292 7,105 7,105 7,105
$152,835 $140,137 $140,137 $168,164 $28,027
ChangeDescription FY 2016
Insur & Employee BenefitsUtilitiesMiscellaneous
906
569
3,500
4,069
569
3,500
4,069
569
3,500
4,069
Local/Other Travel
Grant: Title I, Part D-Prevention and Intervention Programs for Children and Youth Who Are Neglected, Delinquent or At-Risk - 937
CHAPTER 2 – 9 SCHOOL SUPPORT AND IMPROVEMENT

Chapter 3
Chief Academic Officer
Chief Academic Officer PAGE
Office of the Chief Academic Officer .............................. 3-2
Department of Professional Learning and Equity Initiatives ..................................................... 3-8

6.000
By Object of Expenditure
Summary of Resources
Chief Academic Officer
OBJECT OF EXPENDITURE FY 2016 FY 2017 FY 2017 FY 2018 FY 2018ACTUAL BUDGET CURRENT BUDGET CHANGE
6.0006.000
31.200 31.200 (2.000)23.200
158,897
130,203 300,560 298,157
60,980 49,213
265,560
3,075
46,485
340,269
158,897 337,194 357,587 315,001 (42,586)
3,075 3,075
360,662 318,076 (42,586)
2,777,287
57,980
3,577,749 3,598,142 3,512,295 (85,847)
12,818
(2,403)
43,336
(11,767)
3,50039,836 39,836
12,818 39,836 39,836 43,336 3,500
$3,941,125 $3,903,001
POSITIONS
Administrative
TOTAL POSITIONS
01 SALARIES & WAGES
Administrative
OTHER SALARIES
Administrative
Professional
Supporting Services
TOTAL OTHER SALARIES
TOTAL SALARIES AND WAGES
02 CONTRACTUAL SERVICES
03 SUPPLIES & MATERIALS
04 OTHER
Local/Other Travel
Insur & Employee Benefits
Utilities
Miscellaneous
TOTAL OTHER
05 EQUIPMENT
GRAND TOTAL AMOUNTS
$827,731 $968,334 $968,334
29.200
TOTAL POSITION DOLLARS 2,618,390 3,237,480 3,237,480 3,194,219 (43,261)
$970,327 $1,993
$3,999,518 ($96,517)$2,966,793
15.200 (1.000)
8.000 (1.000)9.000 9.00016.20016.200Professional
Supporting Services
5.000
12.2006.000
1,579,530 1,596,534
627,358
17,004
689,616 (62,258)1,320,804
469,8551,579,530
689,616
Professional
Supporting Services
Business/Operations Admin.
Business/Operations Admin.
CHAPTER 3 – 1 CHIEF ACADEMIC OFFICER

Office of the Chief Academic Officer615/216/618/652
M I S S I O N The mission of the Office
of the Chief Academic Officer (OCAO) is to
create opportunities for every student to
achieve at the highest levels and eliminate
barriers to learning through the development
and implementation of curriculum, programs,
professional learning, and services. OCAO
prepares and challenges all students to excel
academically, develop social emotional skills,
and enhance their creativity by providing
exemplary and innovative curriculum,
programs and services.
MAJOR FUNCTIONSProgrammatic Oversight
OCAO leads and directs the instructional priorities of Montgomery County Public Schools (MCPS), focused on impacting and improving student learning through the development and adoption of curriculum, instructional materials and assessments; the development of staff and the implementation of programs and services to remove barriers to student success during their K–12 career and in preparation for beyond. OCAO is comprised of three offices: Curriculum and Instructional Programs; Special Education; and Student and Family Support and Engagement. Based on a 2016 analysis of the needs of schools, the OCAO is focused on organizing staff so as to more effectively provide support to students and fam-ilies through an integrated student and families services model and the consolidation of family facing personnel to increase effectiveness and efficiencies.
Strategic Planning and Continuous ImprovementOCAO works closely with senior leadership to develop a comprehensive collection of processes and routines that focus the work of the organization on strategic priori-ties. During the strategic planning process we align the work across central offices to strengthen collaboration and coordination of service to schools to ensure they have the support and resources necessary to meet the needs of students. In FY 2017, OCAO will analyze data to develop strategic/implementation plans that com-municate the district, office and office goals; the actions needed to achieve those goals; and how we will track progress and adjust our efforts as necessary.
Teaching and LearningOCAO oversees and directs the development and purchase of curriculum and instructional materials designed to provide every student with the opportu-nity to engage meaningfully with content. Addition-ally, OCAO continues to develop a systemic approach to interventions that is predicated upon understanding the needs of students with disabilities, English language learners (ELL), and students traditionally underserved. To support the learning of students, OCAO collaborates with other offices to plan and engage adults in learn-ing experiences that impact student learning utilizing various modalities learning cohort models that focus on staff engaging in year-long cycles of learning.
ProgramsOCAO oversees and directs the identification and dis-semination of innovative and effective programs and strategies to systemically improve teaching and learning, including identifying strategic interventions designed to increase student achievement and wellbeing. Using the Choice Study as a catalyst for an in-depth review of critical programs and services, OCAO has engaged in extensive community outreach, research, and design to develop a comprehensive approach to equitable access to unique programming. In an effort to ensure that all students are provided with equitable opportunities to learn, OCAO has developed programs such as Extended Learning Opportunities Summer Title I Enrichment Program (ELO-STEP), the Young Scholars Program to nurture the intellectual growth of students traditionally underrepresented in programs for the highly able, and the Career Readiness Education Academy (CREA) for newly arrived older students with limited or interrupted education.
ServicesOCAO has leadership and oversight responsibility for the academic and enrichment activities that sup-port schools and ensures the success of every student. The Title III - English for Speakers of Other Languages (ESOL) Program grant, special education programs, Title I, and a myriad of services support student learn-ing, particularly for students with special needs, ELL and students impacted by poverty. In addition to ser-vices provided to students, OCAO plays a significant institutional role in ensuring that families are supported and engaged as partners in their students’ education. To this end, OCAO deploys and embeds parent community coordinators, pupil personnel workers, ESOL counsel-ors, and other staff in school communities to provide ongoing individualized support to families as they navi-gate the school system.
CHAPTER 3 – 2 CHIEF ACADEMIC OFFICER

Office of the Chief Academic Officer615/216/618/652
State, Federal, and Local ComplianceOCAO is responsible for setting the standard for a cul-ture of respect for students by ensuring that MCPS is in compliance with all federal, state, and local laws regard-ing issues of illegal discrimination, sexual harassment, hate/violence, and the Americans with Disabilities Act, as well as the dispute resolution process for students with disabilities. Through a comprehensive approach to safeguarding the rights of students, OCAO monitors the coordination of efforts between various offices, maintain-ing a systemic approach that allows for trend analysis, strategic planning and decision making. This ongoing analysis led to the convening of the Evolving Gender Norms Work Group. Through this work, guidelines were developed to support schools in their efforts to ensure that transgender and gender nonconforming students were welcome in all schools. OCAO provides ongoing support to schools as they accommodate a diverse array of students in communities with divergent expectations.
Equity InitiativesThe mission of the Equity Initiative continues to focus on building leadership capacity to eliminate racial dispari-ties in student performance, so student achievement is no longer predictable by race. The unit facilitates ongoing leadership training, support and coaching for schools, and central office leadership teams consistent with research and best practices. MCPS has included equity criterion for each professional growth system, which has increased the need for support by the equity team. In addition, the unit uses the MCPS Equity Framework as a reflection tool to support schools and offices in identify-ing how equity connects to their day-to-day work.
In FY 2017, an additional $364,000 was added to the budget for cultural proficiency. This funding allowed for the allocation of an additional 4.0 equity specialists, including salary and benefits, to bring the total number of equity specialists to 10.2. This increased allocation allows for a reduction in the caseload of each special-ist in order to increase the frequency and consistency of support to schools and offices.
The mission of the Study Circles Program is to iden-tify, examine, and eliminate institutional barriers to the African American and the Latino student achievement in MCPS. The program provides a structure for diverse stakeholders to (1) engage in honest and productive dia-logue around race and equity, (2) hear a broad range of experiences and perspectives, (3) identify and examine institutional barriers (beliefs, practices, and policies), and (4) collaboratively work to eliminate the barriers.
MEASURES M E A S U R E : 100% of offices have work aligned to strate-gic priorities and defined goals for at least two strategies
FY 2016Actual
FY 2017Estimate
FY 2018Recommended
* 30% 60%
E X P L A N A T I O N : This measures the effectiveness of the tools and resources provided to offices to develop strategic plans and routines to monitor results. This is a new process for the district that is being gradually rolled out to central offices.
M E A S U R E : Number of schools and offices participat-ing in systemwide professional learning sessions and modules offered by EIU, including Study Circles.
FY 2016Actual
FY 2017Estimate
FY 2018Recommended
(1) Schools 109 120 125(2) Offices 18 25 30
E X P L A N A T I O N : This measure provides information on how many schools and offices are participating in systemwide equity and cultural proficiency training.
M E A S U R E : Number of schools/office leadership teams who participated in Study Circles that changed prac-tices and policies.
FY 2016Actual
FY 2017Estimate
FY 2018Recommended
* 18 22
E X P L A N A T I O N : This is a new measure starting in FY 2016. This measure captures the beginnings of systemic organizational change based on trust and capacity-building during study circles.
CHAPTER 3 – 3 CHIEF ACADEMIC OFFICER

Office of the Chief Academic Officer615/216/618/652
OVERVIEW OF BUDGET CHANGES
FY 2017 CURRENT BUDGET
The current FY 2017 budget for this office is
changed from the budget adopted by the Board
of Education on June 14, 2016. The change is a
result of a realignment to this budget of $20,393
to substitute salaries, $3,000 to program supplies,
and $35,000 to contractual services from the Office
of Student and Family Support and Engagement to
support Study Circles.
FY 2018 RECOMMENDED BUDGET
The FY 2018 recommended budget for this office is
$3,903,001, a decrease of $96,517 from the current
FY 2017 budget. An explanation of this change
follows.
Same Service Level Changes—$152,830Realignments to Meet Expenditure Requirements and Program Priorities—$152,830Realignments are budgeted to address priority spend-ing needs in this office. There is a realignment of $11,767 from office supplies to contractual services. In addition, there is a realignment of $12,000 from substitutes to fund contractual services in the Department of Profes-sional Learning and Equity Initiatives.
The FY 2018 recommended budget also includes a bud-get neutral set of realignments between departments and offices. The realignment includes a 1.0 executive director position and $147,830 to this office from a 1.0 supervisor position and $147,830 from the Office of the Chief Financial Officer. In addition, $3,000 for travel for professional development, $500 for local travel mileage reimbursement, and $1,500 for contractual services is realigned to this office’s budget.
In addition, the Department of Instructional Leadership is realigned to this office from Chapter 2, School Sup-port and Improvement. Also, reductions are taken in this department which are reflected in the budget explana-tion below.
Program Efficiencies and Reductions—($368,084)The FY 2018 recommended budget for this office includes a comprehensive effort to identify potential program efficiencies and reductions. Stakeholders, including community partners and employee union representatives, participated in the program efficiencies and reduction process.
In the Office of the Chief Academic Officer, there is a reduction of $27,670 for contractual services based on prior year spending. There is a reduction of a 1.0 direc-tor I position and $118,656, 2.0 instructional specialist positions and $147,178, and a 1.0 administrative secre-tary II position and $43,994 in the Department of Profes-sional Learning and Equity Initiative. In addition, there is a reduction of $30,586 from substitutes. These reduc-tions can be made based on efficiencies and realignment of work to other department staff.
Strategic Accelerator—$118,737 Focus on Teaching and Learning—$118,737 A 1.0 instructional specialist position and $118,737 is added to the budget in order to support strategic pri-orities to ensure all students have opportunities to learn and be successful. This includes implementation of a new program to provide an alternative path to gradu-ation, creation of apprenticeship programs, expansion of achievement-focused extracurricular programs for all middle schools, and expansion of Career Technical Edu-cation programs.
In addition, there is $1,010,000 budgeted for this stra-tegic accelerator in Chapter 1, Schools and $64,915 in Chapter 7, Department of Employee and Retiree Ser-vices for employee benefits.
CHAPTER 3 – 4 CHIEF ACADEMIC OFFICER

FY 2018 OPERATING BUDGET
Office of the Chief Academic Officer
Chief Academic Officer 1.0Executive Director (P) 2.0Instructional Specialist (B–D) 1.0 Administrative Services Manager III (19) 1.0Copy Editor/Administrative Secretary (17) 2.0
F.T.E. Positions 7.0
(The positions in the Office of Student and Family Support and Engagement are shown in Chapter 6, Curriculum and Instructional Programs in Chapter 4, and Special Education in Chapter 5.)
Office of Special Education Office of Curriculum and Instructional Programs
Office of Student and Family Support and Engagement
Department of Professional Learning and Equity Initiatives
CH
AP
TER 3 – 5 C
HIEF A
CA
DEM
IC O
FFICER

Office of the Chief Academic Officer - 615
Actual FY 2017Budget
FY 2017Current
FY 2018Request
FY 2018
Summer EmploymentProfessional Substitutes
Total Positions (FTE)Position Salaries
4.000$555,527
5.000$607,274
5.000$607,274
7.000$873,841
Other Salaries
01 Salaries & Wages
StipendsProfessional Part Time
ConsultantsOther Contractual
OfficeOther Supplies & Materials
MediaInstructional Supplies & Materials
Textbooks
Subtotal Other Salaries
Leased Equipment
Grand Total
Other Equipment
Total Salaries & Wages
02 Contractual Services
Total Contractual Services
03 Supplies & Materials
Total Supplies & Materials
04 Other
Total Other
05 Equipment
Total Equipment
Supporting Services Part TimeOther
125,412
255,892
255,892
255,892
255,892
241,489
241,489 (14,403)
(14,403)
10,039
20,329
20,329
20,329
20,329
8,562
8,562
(11,767)
(11,767)
555,527 607,274 607,274 873,841 266,567
$690,978 $883,495 $883,495 $1,127,392 $243,897
ChangeDescription FY 2016
2.000$266,567
Insur & Employee BenefitsUtilitiesMiscellaneous
3,500 3,500
Local/Other Travel 3,500 3,5003 000 3 000
-
CHAPTER 3 – 6 CHIEF ACADEMIC OFFICER

DESCRIPTION CURRENTFYBUDGET
FYACTUAL
20172016 10Mon
FY 2017CAT
Office of the Chief Academic Officer - 615
FY 2018CHANGEREQUEST
FY 2018
1 1.000 1.000 1.000Chief Academic Officer 1.000
1 1.000 1.000 1.000Executive DirectorP 1.0002.000
1 Instructional SpecialistBD 1.0001.000
1 1.000 1.000 1.000Admin Services Mgr III19 1.000
1 1.000 2.000 2.000Copy Editor/Admin Sec17 2.000
5.0004.000 5.000Total Positions 7.000 2.000
CHAPTER 3 – 7 CHIEF ACADEMIC OFFICER

FY 2018 OPERATING BUDGET
F.T.E. Positions 22.2
Department of Professional Learning and Equity Initiatives
Director II (Q) 1.0Instructional Specialist (B–D) 5.0Administrative Secretary III (16) 1.0
Equity Initiatives Unit
Director I (P) 1.0Coordinator (N) 1.0Instructional Specialist (B–D) 9.2Equity Training Specialist (23) 1.0Parent Community Coordinator (20) 2.0Administrative Secretary II (15) 1.0
CH
AP
TER 3 – 8 C
HIEF A
CA
DEM
IC O
FFICER

Department of Professional Learning and Equity Initiatives - 216/618/652
Actual FY 2017Budget
FY 2017Current
FY 2018Request
FY 2018
Summer EmploymentProfessional Substitutes (42,586)
Total Positions (FTE)Position Salaries
19.200$2,062,863
26.200$2,630,206
26.200$2,630,206
22.200$2,320,378
Other Salaries
01 Salaries & Wages
283,728 304,121 261,535
Stipends 53,466 53,466 53,466Professional Part Time
ConsultantsOther Contractual
OfficeOther Supplies & Materials
MediaInstructional Supplies & Materials
Textbooks
Subtotal Other Salaries
Leased Equipment
Grand Total
Other Equipment
Total Salaries & Wages
02 Contractual Services
Total Contractual Services
03 Supplies & Materials
Total Supplies & Materials
04 Other
Total Other
05 Equipment
Total Equipment
Supporting Services Part TimeOther
3,075 3,075 3,075
4,791
4,6685,000
9,668
4,66840,000
44,668
4,66852,000
56,668 12,000
12,000
36,446
37,651
37,651
40,651
40,651
40,651
40,651
2,221,760 2,970,475 2,990,868 2,638,454 (352,414)
158,897 340,269 360,662 318,076 (42,586)
$2,275,815 $3,057,630 $3,116,023 $2,775,609 ($340,414)
ChangeDescription FY 2016
(4.000)($309,828)
Insur & Employee BenefitsUtilitiesMiscellaneous
12,818 39,836 39,836 39,836
Local/Other Travel 39,836 39,836 39,836
CHAPTER 3 – 9 CHIEF ACADEMIC OFFICER

DESCRIPTION CURRENTFYBUDGET
FYACTUAL
20172016 10Mon
FY 2017CAT
Department of Professional Learning and Equity Initiatives - 216/618/652
CHANGE2018FYFY 2018
REQUEST
216 Dept. of Prof. Learning & Equity Initiatives
2 1.000 1.000 1.000Director IIQ 1.000
3 Instructional SpecialistBD 5.0005.000
2 1.000 1.000 1.000Administrative Secretary III16 1.000
2.000 2.000 2.000Subtotal 7.000 5.000
618 Equity Initiatives Unit
2 1.000 1.000 1.000Director IP 1.000
2 1.000 1.000CoordinatorN 1.000
3 5.200 9.200 9.200Instructional SpecialistBD 9.200
3 1.000 1.000 1.000Equity Training Specialist23 1.000
3 2.000 2.000Parent Community Coord20 2.000
2 1.000 1.000 1.000Administrative Secretary II15 1.000
8.200 15.200 15.200Subtotal 15.200
652 Teacher Leadership Unit
2 1.000 1.000 1.000Director IP (1.000)3 7.000 7.000 7.000Instructional SpecialistBD (7.000)2 1.000 1.000 1.000Administrative Secretary II15 (1.000)
9.000 9.000 9.000Subtotal (9.000)
26.20019.200 26.200Total Positions 22.200 (4.000)
CHAPTER 3 – 10 CHIEF ACADEMIC OFFICER

Chapter 4
Curriculum and Instructional Programs
Curriculum and Instructional Programs PAGE
Office of the Associate Superintendent ........................ 4-3
Department of Elementary Curriculum and Districtwide Programs ................................................... 4-8
Grant: Title VII, American Indian Education................................. 4-12
Division of Accelerated and Enriched Instruction ........................ 4-19
Division of Title I and Early Childhood Programs and Services ....... 4-22
Grant: Title I, Part A Programs ............................................. 4-26
Department of Secondary Curriculum and Districtwide Programs ................................................... 4-28
Department of Career Readiness and Innovative Programs ...................................................... 4-35
Interim Instructional Services ................................................. 4-42
Grant: National Institutes of Health Program ......................... 4-44
Grant: Carl D. Perkins Career & Technology Education Improvement Program .......................................................... 4-45
Division of Consortia Choice and Application Program Services ................................................. 4-47
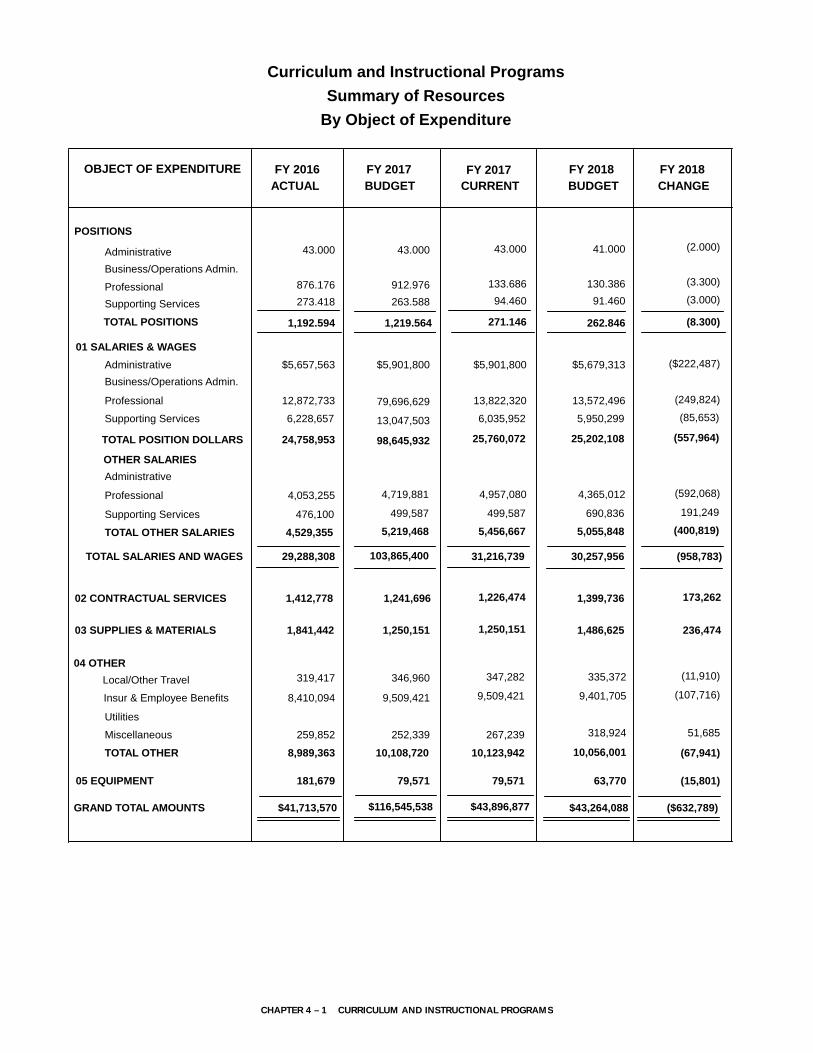
41.000
By Object of Expenditure
Summary of Resources
Curriculum and Instructional Programs
(2.000)
OBJECT OF EXPENDITURE FY 2016 FY 2017 FY 2017 FY 2018 FY 2018ACTUAL BUDGET CURRENT BUDGET CHANGE
43.00043.000
1,219.564 271.146 (8.300)1,192.594
4,529,355
1,412,778 1,226,474 1,399,736
1,250,151 1,486,625
1,241,696
499,587
1,841,442
5,219,468
476,100
4,053,255 4,719,881 4,957,080 4,365,012 (592,068)
499,587 690,836 191,249
5,456,667 5,055,848 (400,819)
29,288,308
1,250,151
103,865,400 31,216,739 30,257,956 (958,783)
319,417
173,262
335,372
236,474
(11,910)346,960 347,282
8,410,094 9,509,421 9,509,421 9,401,705 (107,716)
259,852 252,339 267,239 318,924 51,685
8,989,363 10,108,720 10,123,942 10,056,001 (67,941)
79,571 79,571 63,770 (15,801)
$116,545,538 $43,264,088
POSITIONS
Administrative
TOTAL POSITIONS
01 SALARIES & WAGES
Administrative
OTHER SALARIES
Administrative
Professional
Supporting Services
TOTAL OTHER SALARIES
TOTAL SALARIES AND WAGES
02 CONTRACTUAL SERVICES
03 SUPPLIES & MATERIALS
04 OTHER
Local/Other Travel
Insur & Employee Benefits
Utilities
Miscellaneous
TOTAL OTHER
05 EQUIPMENT
GRAND TOTAL AMOUNTS
$5,657,563 $5,901,800 $5,901,800
262.846
TOTAL POSITION DOLLARS 24,758,953 98,645,932 25,760,072 25,202,108 (557,964)
$5,679,313 ($222,487)
$43,896,877 ($632,789)
181,679
$41,713,570
130.386 (3.300)
91.460 (3.000)263.588 94.460133.686912.976Professional
Supporting Services
43.000
876.176273.418
13,822,320 13,572,496
5,950,299
(249,824)
6,035,952 (85,653)12,872,733
6,228,65779,696,629
13,047,503
Professional
Supporting Services
Business/Operations Admin.
Business/Operations Admin.
CHAPTER 4 – 1 CURRICULUM AND INSTRUCTIONAL PROGRAMS

FY 2018 OPERATING BUDGET
Curriculum and Instructional Programs—Overview
F.T.E. Position 269.846
Office of the Associate Superintendent for Curriculum and Instructional Programs
Department of Elementary Curriculum and
Districtwide Programs
Department of Secondary Curriculum and
Districtwide Programs
Department of Career Readiness and Innovative Programs
CH
AP
TER 4 – 2 C
UR
RIC
ULU
M A
ND
INS
TRU
CTIO
NA
L PR
OG
RA
MS

Office of Curriculum and Instructional Programs211
M I S S I O N The mission of the Office
of Curriculum and Instructional Programs
(OCIP) is to lead the development and
implementation of innovative curriculum,
instructional programs, and services that
promote academic excellence for all students
and focus on improving teaching and learning
to ensure equitable readiness for college,
career, and community for all students.
MAJOR FUNCTIONSStrategic Planning
In support of the strategic priority, Focus on Operational Excellence, the three departments in OCIP are struc-tured to strategically align with the Office of School Sup-port and Improvement to support schools and to provide innovative curriculum, instructional programs, and services that promote academic excellence. This struc-ture facilitates collaboration and prioritization of the work that is critical to effectively and efficiently support instruction. The three departments are responsible for grant-funded programs, school choice processes, col-lege and career readiness initiatives, curriculum devel-opment, and program implementation. Staff members in all departments, divisions, and units are committed to a culture of innovation and adhere to the belief that high-performing teams, with an expectation of excel-lence and a commitment to mutual accountability, are essential to effectively produce high-quality products, programs, and services that address the various needs of our diverse school communities.
Curriculum, Assessment, and Instructional Programs and Services
The Department of Secondary Curriculum and District-wide Programs (DSCDP) supports schools in raising student achievement by providing research-based cur-riculum, assessments, and instructional materials, and creating and delivering professional learning. DSCDP functions include curriculum, instruction, and assess-ment; school support and programs; professional learning for teachers, teacher leaders, and administra-tors; and strategic stakeholder involvement that pro-motes effective teaching and learning. The department comprises 11 major disciplines (English language arts; secondary mathematics; fine arts; literacy; secondary
English for Speakers of Other Languages (ESOL); health and physical education; outdoor environmental educa-tion programs; school library media programs; science, technology, and engineering; social studies; and world languages. DSCDP promotes educational achievement for all students by providing differentiated support to schools and developing and disseminating rigor-ous curriculum, assessments, and proven instructional practices.
The Department of Secondary Curriculum and District-wide Programs (DECDP) develops and implements curriculum, assessment, instructional strategies, and programs and services that provide students with a vari-ety of learning opportunities that foster success for all learners. DECDP consists of the Elementary Integrated Curriculum team, the Division of Title I and Early Child-hood Programs and Services, the Division of Acceler-ated and Enriched Instruction, and ESOL/Bilingual Programs. DECDP strives to provide students, teachers, and administrators with effective curriculum products, assessment measures, instructional programs, profes-sional learning, and services that afford all students in MCPS schools access to an instructional program that improves performance and outcomes for all students.
The Department of Career Readiness and Innovative Programs (DCRIP) develops, implements, and monitors innovative instructional programs that engage students and increase academic achievement to ensure college and career readiness for all learners. DCRIP includes the Division of Consortia Choice and Application Program Services, Student Online Learning, Career and Postsec-ondary Partnerships, Foundations, Secondary School Support Programs, Interim Instructional Services, and the newly created Career Readiness Education Acad-emy. DCRIP engages in parent and student outreach to promote program participation based on students’ interests and needs. Furthermore, DCRIP coordinates and monitors programs that specifically support stu-dents who need additional resources to achieve educa-tional success.
Communication and CollaborationIn alignment with the strategic priorities, Focus on Operational Excellence, and Focus on Community Part-nerships and Engagement, the goal of all departments, divisions, and units in OCIP is to cultivate strong rela-tionships with school-based staff members, parents, and community organizations by establishing processes and practices to ensure ongoing communication and collaboration. Well-developed communication strate-gies and existing professional venues are used to gather information, input, and feedback to inform and improve
CHAPTER 4 – 3 CURRICULUM AND INSTRUCTIONAL PROGRAMS
Office of Curriculum and Instructional Programs211
the work of OCIP. Additionally, OCIP provides materials and services so that parents can access information and be effective partners in their children’s education.
OVERVIEW OF BUDGET CHANGES
FY 2018 RECOMMENDED BUDGET
The FY 2018 recommended budget for this office is
$634,369, a decrease of $105,604 from the current
FY 2017 budget. An explanation of this change
follows.
Same Service Level Changes—($105,604)Realignments to Meet Expenditure Requirements and Program Priorities—($105,604) The FY 2018 recommended budget includes realign-ments that result in an overall budget neutral set of realignments between departments and offices. The realignment includes a 1.0 coordinator and $105,604 from this office to a 1.0 instructional specialist and $105,604 in the Office of Student and Family Support and Engagement.
CHAPTER 4 – 4 CURRICULUM AND INSTRUCTIONAL PROGRAMS

Office of the Associate Superintendent of Curriculum and Instructional Programs
F.T.E. positions 5.0
Associate Superintendent 1.0Assistant to the Associate Superintendent (N) 1.0Administrative Services Manager I (17) 1.0Administrative Secretary III (16) 1.0Administrative Secretary II (15) 1.0
FY 2018 OPERATING BUDGET
Department of Elementary Curriculum and
Districtwide Programs
Department of Secondary Curriculum and
Districtwide Programs
Department of Career Readiness and Innovative Programs
CH
AP
TER 4 – 5 C
UR
RIC
ULU
M A
ND
INS
TRU
CTIO
NA
L PR
OG
RA
MS

Office of Curriculum & Instructional Programs - 211
Actual FY 2017Budget
FY 2017Current
FY 2018Request
FY 2018
Summer EmploymentProfessional Substitutes
Total Positions (FTE)Position Salaries
6.000$539,510
6.000$641,588
6.000$641,588
5.000$535,984
Other Salaries
01 Salaries & Wages
Stipends 24,799 24,799 24,799Professional Part Time
ConsultantsOther Contractual
OfficeOther Supplies & Materials
MediaInstructional Supplies & Materials
Textbooks
Subtotal Other Salaries
Leased Equipment
Grand Total
Other Equipment
Total Salaries & Wages
02 Contractual Services
Total Contractual Services
03 Supplies & Materials
Total Supplies & Materials
04 Other
Total Other
05 Equipment
Total Equipment
Supporting Services Part TimeOther
4,07641,478
4,07641,478
4,07641,478
17,507
15,900
15,900
15,900
15,900
15,900
15,900
7,689
2,5966,767
9,363
2,5966,767
9,363
2,5966,767
9,363
611,701 711,941 711,941 606,337 (105,604)
72,191 70,353 70,353 70,353
$637,246 $739,973 $739,973 $634,369 ($105,604)
ChangeDescription FY 2016
(1.000)($105,604)
Insur & Employee BenefitsUtilitiesMiscellaneous
349 2,769 2,769 2,769
Local/Other Travel 2,769 2,769 2,769
CHAPTER 4 – 6 CURRICULUM AND INSTRUCTIONAL PROGRAMS

DESCRIPTION CURRENTFYBUDGET
FYACTUAL
20172016 10Mon
FY 2017CAT
Office of Curriculum & Instructional Programs - 211
FY 2018CHANGE
FY 2018
REQUEST
1 1.000 1.000 1.000Associate Superintendent 1.000
1 1.000 1.000 1.000Asst. to Assoc SuptN 1.000
2 1.000 1.000 1.000CoordinatorN (1.000)1 1.000 1.000 1.000Admin Services Manager I17 1.000
2 1.000 1.000 1.000Administrative Secretary III16 1.000
2 1.000 1.000 1.000Administrative Secretary II15 1.000
6.0006.000 6.000Total Positions 5.000 (1.000)
CHAPTER 4 – 7 CURRICULUM AND INSTRUCTIONAL PROGRAMS
Department of Elementary Curriculum and Districtwide Programs233/239/650/903/927/237/294/235/296/297/904/905/932/941
M I S S I O N The mission of the
Department of Elementary Curriculum and
Districtwide Programs (DECDP) is to support
schools in raising student performance and
closing the achievement gap by providing
research-based curriculum, assessments,
and instructional materials; collaborating with
other offices and departments, community
partners, and families to develop and
implement high-quality, innovative programs
and services that meet the diverse needs
of all learners; and creating and delivering
professional development aligned with the
Maryland College and Career Readiness
Standards (MCCRS) and other local, state, and
national content standards.
MAJOR FUNCTIONSDivision of Title I and Early Childhood Programs and Services (DTECPS)
DTECPS oversees the implementation of the Every Stu-dent Succeeds Act of 2015 (Title I, Part A); Improving Head Start for School Readiness Act of 2007; prekinder-garten programs; Prekindergarten Expansion grants; and the
Judith P. Hoyer Early Child Care and Family Educa-tion and Enhancement Programs. The funds associated with these programs support the development of school improvement strategies; staffing models and instruc-tional programs aimed at closing the achievement gap in performance among all subgroups by monitoring and analyzing formal and informal student data; examining the current educational program data in collaboration with staff members from other offices; and to improve academic achievement in the 25 Title I elementary schools identified for FY 2018.
The goal of DTECPS programs is to improve teach-ing and learning in Head Start and prekindergarten classes and in Title I schools so that every prekindergar-ten through Grade 5 student is considered ready for a
rigorous instructional program and to have successful grade-level transitions.
• DTECPS guides school improvement efforts among Title I schools to ensure that student performance is not predictable by race, ethnicity, socioeconomic sta-tus, or disability. DTECPS monitors the investment of resources and effectiveness of Title I programs, such as Extended Learning Opportunities (ELO) Sum-mer Adventures in Learning and ELO Summer Title I Enrichment Program (STEP), and adjusts accord-ingly to ensure that resources are used effectively to achieve the system goal of Academic Excellence for All. In summer 2017, Grade 5 students will be included in ELO STEP.
• For the 2016–2017 school year, DTECPS invested in new positions, Primary Talent Development (PTD) coaches, for each Title I school. In collaboration with the Division of Accelerated and Enriched Instruction, DTECPS guides PTD coaches to surface talent in all Title I kindergarten classes and to serve as coaches for teachers to identify talent among students in primary classes. PTD coaches monitor student performance data, facilitate discussions, and make instructional recommendations for students.
• DTECPS implements the newly released Head Start performance standards in 17 partial-day Head Start classes and 17 full-day Head Start classes in 15 Title I schools.
• DTECPS monitors the implementation of literacy- and mathematics-rich, comprehensive, full- and partial-day instructional prekindergarten programs.
• Program funding supports parent engagement, lunch, health, transportation, and social services for children from low-income families.
Elementary Integrated Curriculum The major responsibility for the EIC Team is providing students the opportunity to learn through the devel-opment, maintenance, and implementation of a high-quality curriculum in all subject areas, and especially targeting student success in literacy and mathematics. The EIC Team is responsible for reviewing, revising, and maintaining Curriculum 2.0, including enhancing the online resources as well as formatting and organizing the curriculum tasks to maximize their accessibility for teachers. Additionally, the EIC Team:
• Provides targeted professional learning to specific stakeholder groups including, but not limited to, prin-cipals, assistant principals, reading specialists, math content coaches, staff development teachers, ESOL teachers, and classroom teachers.
CHAPTER 4 – 8 CURRICULUM AND INSTRUCTIONAL PROGRAMS

Department of Elementary Curriculum and Districtwide Programs233/239/650/903/927/237/294/235/296/297/904/905/932/941
• Delivers direct support to individual schools to assist them with implementing curriculum and assessment system expectations including, but not limited to, monitoring instructional reading levels and elemen-tary mathematics assessments.
• Provides curricular enhancement to increase strate-gies to make content comprehensible and support the development of academic language for English learn-ers (ELs).
• Initiates supports for the Dual Language program with the goal of future expansion to additional schools.
• Supports select schools with curriculum resource alternatives and professional development.
• Supports select schools in piloting an innovative plat-form that allows for teachers and school leaders to analyze formative data to make sound instructional decisions.
• Provides professional learning for the Elementary Mathematics Assessment Tasks, formative assess-ments directly aligned with the critical content in the MCCRS.
The EIC Team is working for the success of ALL students in the following new ways:
• All the instructional specialists are adding enhance-ments to Curriculum 2.0 that support teachers with differentiating instruction based on student needs. This change was based on data, including feedback from teachers and school-based leaders, as well as student outcome data. Specifically, ELs are targeted because the student outcome data highlights this as a group who need additional instructional support.
• The EIC Team is providing innovative training and professional learning models that maximize non-school hours and take advantage of school-based con-tent specialists.
Accelerated and Enriched Instruction AEI provides instructional and programming support for talent development; Gifted and Talented (GT) iden-tification; academic programming for highly able stu-dents (local, magnet, and GT/learning disabled); and the implementation of the International Baccalaureate (IB) program K–12 in selected schools. Additionally, AEI leads the development of high-quality professional development that promotes enriched and accelerated instruction in teaching and learning at a system and school-based level to promote access for all students to rigorous and challenging instruction. In 2016-2017, AEI is highly involved in responding to the Choice Study for elementary, middle and high school magnet programs and will re-evaluate assessment strategies,
professional development and expansion of programs. Additionally, the Enriched and Accelerated Title I pro-fessional learning community and primary talent coach positions support the planning and implementation of culturally responsive instruction of highly able students in Title I schools and build a shared knowledge in advo-cacy for Title I schools to access advanced programming pathways.
English for Speakers of Other Languages (ESOL)/Bilingual Programs
ESOL/Bilingual Programs supports academic excellence for ESOL students by ensuring that English language development instruction and professional learning for staff members meet or exceed state and federal require-ments for students learning English as a new language. The ESOL/Bilingual Unit oversees the implementation of Title III—Language Instruction for English Learners and Immigrant Students and the American Indian Edu-cation Program. Through the Division of School Coun-seling, Residency, and International Admissions, the ESOL/Bilingual Unit screens potential ESOL students who enroll in MCPS for eligibility of ESOL services and provides information and supports to school staff mem-bers in the identification, enrollment, annual assess-ment, and program exit of all ESOL students.
Strengthen Supports to New ESOL/Multidisciplinary Educational Training and Support (METS) Students and Parents
• Provide positive, culturally proficient support throughout the initial English language proficiency (ELP)/METS screening and enrollment process.
• Provide an orientation to MCPS and the American education system.
• Support families with school enrollment by assist-ing them with appointments and connecting them to appropriate school staff members.
• Provide information about school and/or community resources to students and families as appropriate.
Implement Title III Program Accountability with Fidelity
• Accurately assess, identify, and place ESOL and METS students.
• Implement supports to the school staff to accurately implement the ESOL testing and accountability pro-cesses to meet state and federal requirements.
• Collaborate with other MCPS offices and Maryland State Department of Education (MSDE) Title III/EL specialists to implement supplemental programs and professional development plans to increase
CHAPTER 4 – 9 CURRICULUM AND INSTRUCTIONAL PROGRAMS

Department of Elementary Curriculum and Districtwide Programs233/239/650/903/927/237/294/235/296/297/904/905/932/941
English learners’ and immigrant students’ academic achievement.
• Focus on refining the ESOL staffing allocation model to ensure equitable staffing to schools.
Focus on Results of Student Achievement in the American Indian Education Program (AIEP)
• Develop a data-driven strategic plan for improving achievement of students who participate in the AIEP.
MEASURESElementary Integrated Curriculum Team
M E A S U R E : Number of revised or new elementary courses in Curriculum 2.0, with interactive multimedia curriculum, instruction, assessment, and professional development resources, which align with CCSS or other state or national standards; provide models of challenge and support; and are posted in the Instruction Center on myMCPS.
FY 2016Actual
FY 2017Estimate
FY 2018Recommended
13 22 22
E X P L A N A T I O N : Curriculum, instruction, assessment, and professional development resources must be disseminated digitally, in order to improve timeliness and quality of support provided to teachers implementing the curriculum. Digital dissemination encourages teacher collaboration and participation in resource development. It also increases agility to revise curriculum and update instructional and professional development resources by facilitating collection, analysis, and application of feedback.
Division of Title I and Early Childhood Programs and Services
Extended Learning Opportunities (ELO)M E A S U R E : Percentage of first and second grade ELO SAIL students demonstrating improved performance from spring 2016 to fall 2016 in literacy as measured by the reading level on the Assessment Program in Primary Reading (AP-PR).
FY 2016Actual
FY 2017Estimate
FY 2018Recommended
* 60% 75%
E X P L A N A T I O N : In summer 2016, approximately 2,350 eligible first and second grade students attended the ELO SAIL program. DTECPS will measure the percentage of first and second grade students whose reading level increased from spring 2016 to fall 2016. By providing an additional month of reading instruction, fewer students in Title I schools are expected to experience a loss of skills
over the summer, and a greater number will maintain or gain literacy skills necessary for the upcoming grade level.
DTECPS
Head Start Kindergarten ReadinessM E A S U R E : Percentage of Head Start students who demonstrated full readiness as measured by the Kinder-garten Readiness Assessment (KRA).
FY 2016Actual
FY 2017Estimate
FY 2018Recommended
38% 40% 42%
E X P L A N A T I O N : KRA is the measure used by Maryland State to determine school readiness skills in kindergarten students. KRA assesses skill development in the following domains: Social Foundations, Language and Literacy, Mathematics, and Physical Well-Being and Motor Development.
Accelerated and Enriched Instruction (AEI)M E A S U R E : Number of students who completed the IB Full Diploma Program or students who took one or more Advanced Placement (AP) exams.
IB Full DiplomaFY 2016Actual
FY 2017Estimate
FY 2018Recommended
333 350 375
Advanced PlacementFY 2016Actual
FY 2017Estimate
FY 2018Recommended
17,569 18,580 20,690
I B E X P L A N A T I O N : MCPS administered over 3,400 IB exams to MCPS students in 2016, with 2,603 students scoring a 4 or better on at least one exam. The final measure of success is the number of students who earn the diploma in Grade 12. This year, 333 IB full diplomas and 53 IB career program diplomas were earned.
A P E X P L A N A T I O N : One MCPS district milestone to gauge college readiness is measured by an AP score of 3 or higher. In 2016, 17,569 students took one or more AP exams, with 75.8 percent of them scoring a 3 or higher.
CHAPTER 4 – 10 CURRICULUM AND INSTRUCTIONAL PROGRAMS

Department of Elementary Curriculum and Districtwide Programs233/239/650/903/927/237/294/235/296/297/904/905/932/941
ESOLM E A S U R E : Percentage of ESOL students progressing toward ELP, as measured by the state-mandated ELP assessment.
FY 2016Actual
FY 2017Estimate
FY 2018Recommended
TBD TBD TBD
E X P L A N A T I O N : The state-mandated ELP assessment is used by MSDE to determine the percentage of ESOL students progressing toward proficiency in English. In FY 2015, 66.62 percent of the ESOL student population demonstrated progress toward proficiency in English.
M E A S U R E : Percentage of ESOL students attaining ELP, as measured by the state-mandated ELP assessment.
FY 2016Actual
FY 2017Estimate
FY 2018Recommended
TBD TBD TBD
E X P L A N A T I O N : The state-mandated ELP assessment is used by MSDE to determine the percentage of ESOL students attaining proficiency in English. In FY 2015, 21.63 percent of the ESOL student population demonstrated attainment of proficiency in English.
OVERVIEW OF BUDGET CHANGES
FY 2017 CURRENT BUDGET
The current FY 2017 budget for this department is
changed from the budget adopted by the Board of
Education on June 14, 2016. The change includes
the realignment of school-based resources that
provide direct services to students to Chapter 1,
Schools. In addition, there is a realignment of 4.0
instructional specialist positions and $430,718
to this department from the Department of
Secondary Curriculum and Districtwide Programs.
Also, there is a realignment of $22,800 in summer
employment teaching salaries to substitute salaries
in Secondary ESOL under the Department of
Secondary Education and Districtwide Programs.
There also is a realignment of $2,000 in dues,
registration and fees to the Department of
Secondary Curriculum and Districtwide Programs
and the Department of Career Readiness and
Districtwide Programs.
FY 2018 RECOMMENDED BUDGET
The FY 2018 recommended budget for this
department is $7,894,336, a decrease of $190,339
from the current FY 2017 budget. An explanation of
this change follows.
Same Service Level Changes—$75,261Realignments to Meet Expenditure Requirements and Program Priorities—$75,261 Realignments are budgeted to address priority spending needs within the Department of Elementary Curricu-lum and Districtwide Programs. There is a decrease of $21,577 for instructional materials and $619 for dues, reg-istration, and fees and a corresponding increase of $3,131 for substitute teaching salaries and $17,488 for summer employment—non teaching salaries. In addition, $1,577 is realigned in the budget for employee benefits to the Department of Employee and Retiree Services.
There are a several realignments budgeted to address priority spending needs within the Division of Acceler-ated and Enriched Instruction. There is a decrease of $4,614 in instructional materials and $329 to program supplies. There are increases of $1,388 to professional part-time salaries to provide additional part-time support for the division, $2,695 to dues, registration and fees, and $754 to travel for professional development. In addition, $106 is realigned to the budget for employee benefits in the Department of Employee and Retiree Services.
Realignments are budgeted to address priority spend-ing needs in the Division of Early Childhood and Title I Programs and Services. There is a realignment of $1,500 from office supplies to fund local travel mileage reimbursement. In addition, $1,145 from substitutes is realigned from this department’s budget to fund a .025 paraeducator position and $1,059 in the budget for Elementary Schools in Chapter 1. In addition, $86 is realigned to the budget for employee benefits in the Department of Employee and Retiree Services.
The FY 2018 recommended budget includes a realign-ments that result in an overall budget neutral set of realignments between departments and offices. The realignment includes a 1.0 instructional specialist posi-tion and $73,589 to this department, from the Depart-ment of Technology Integration and Support in Chapter 8. In addition, there is a realignment of $4,500 in local travel to this department from the Department of Sec-ondary Curriculum and Districtwide Programs.
CHAPTER 4 – 11 CURRICULUM AND INSTRUCTIONAL PROGRAMS
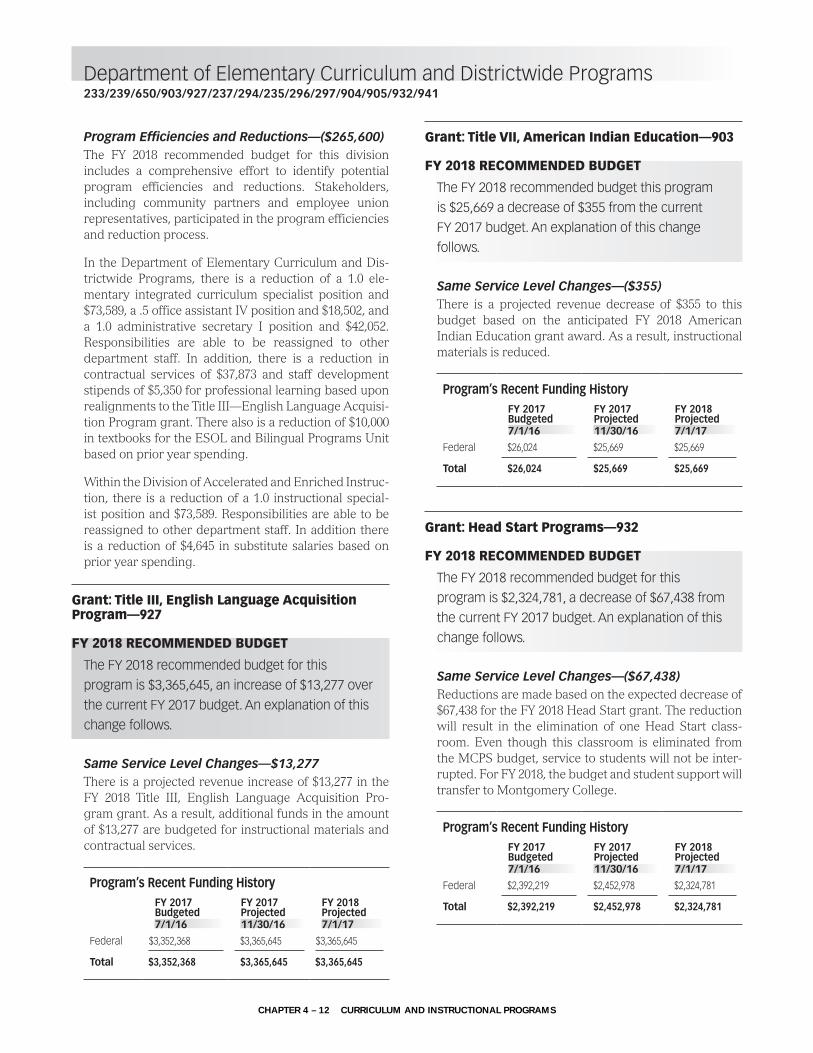
Department of Elementary Curriculum and Districtwide Programs233/239/650/903/927/237/294/235/296/297/904/905/932/941
Program Efficiencies and Reductions—($265,600)The FY 2018 recommended budget for this division includes a comprehensive effort to identify potential program efficiencies and reductions. Stakeholders, including community partners and employee union representatives, participated in the program efficiencies and reduction process.
In the Department of Elementary Curriculum and Dis-trictwide Programs, there is a reduction of a 1.0 ele-mentary integrated curriculum specialist position and $73,589, a .5 office assistant IV position and $18,502, and a 1.0 administrative secretary I position and $42,052. Responsibilities are able to be reassigned to other department staff. In addition, there is a reduction in contractual services of $37,873 and staff development stipends of $5,350 for professional learning based upon realignments to the Title III—English Language Acquisi-tion Program grant. There also is a reduction of $10,000 in textbooks for the ESOL and Bilingual Programs Unit based on prior year spending.
Within the Division of Accelerated and Enriched Instruc-tion, there is a reduction of a 1.0 instructional special-ist position and $73,589. Responsibilities are able to be reassigned to other department staff. In addition there is a reduction of $4,645 in substitute salaries based on prior year spending.
Grant: Title III, English Language Acquisition Program—927
FY 2018 RECOMMENDED BUDGET
The FY 2018 recommended budget for this
program is $3,365,645, an increase of $13,277 over
the current FY 2017 budget. An explanation of this
change follows.
Same Service Level Changes—$13,277There is a projected revenue increase of $13,277 in the FY 2018 Title III, English Language Acquisition Pro-gram grant. As a result, additional funds in the amount of $13,277 are budgeted for instructional materials and contractual services.
Program’s Recent Funding HistoryFY 2017Budgeted7/1/16
FY 2017Projected11/30/16
FY 2018Projected7/1/17
Federal $3,352,368 $3,365,645 $3,365,645
Total $3,352,368 $3,365,645 $3,365,645
Grant: Title VII, American Indian Education—903
FY 2018 RECOMMENDED BUDGET
The FY 2018 recommended budget this program
is $25,669 a decrease of $355 from the current
FY 2017 budget. An explanation of this change
follows.
Same Service Level Changes—($355)There is a projected revenue decrease of $355 to this budget based on the anticipated FY 2018 American Indian Education grant award. As a result, instructional materials is reduced.
Program’s Recent Funding HistoryFY 2017Budgeted7/1/16
FY 2017Projected11/30/16
FY 2018Projected7/1/17
Federal $26,024 $25,669 $25,669
Total $26,024 $25,669 $25,669
Grant: Head Start Programs—932
FY 2018 RECOMMENDED BUDGET
The FY 2018 recommended budget for this
program is $2,324,781, a decrease of $67,438 from
the current FY 2017 budget. An explanation of this
change follows.
Same Service Level Changes—($67,438)Reductions are made based on the expected decrease of $67,438 for the FY 2018 Head Start grant. The reduction will result in the elimination of one Head Start class-room. Even though this classroom is eliminated from the MCPS budget, service to students will not be inter-rupted. For FY 2018, the budget and student support will transfer to Montgomery College.
Program’s Recent Funding HistoryFY 2017Budgeted7/1/16
FY 2017Projected11/30/16
FY 2018Projected7/1/17
Federal $2,392,219 $2,452,978 $2,324,781
Total $2,392,219 $2,452,978 $2,324,781
CHAPTER 4 – 12 CURRICULUM AND INSTRUCTIONAL PROGRAMS

Department of Elementary Curriculum and Districtwide Programs233/239/650/903/927/237/294/235/296/297/904/905/932/941
Grant: Judith P. Hoyer Early Childhood Centers (Judy Centers)—904/905
FY 2018 RECOMMENDED BUDGET
The FY 2018 recommended budget for this
program is $644,000. There is no change from
current FY 2017 budget.
Program’s Recent Funding HistoryFY 2017Budgeted7/1/16
FY 2017Projected11/30/16
FY 2018Projected7/1/17
State $644,000 $644,000 $644,000
Total $644,000 $644,000 $644,000
Grant: Title 1, Part A Programs—941
FY 2018 RECOMMENDED BUDGET
The FY 2018 recommended budget for this
program is $13,263,151, an increase of $219,050
over the current FY 2017 budget. An explanation of
this change follows.
Same Service Level Changes—$219,050There is a projected revenue increase of $219,050 for the FY 2018 Title I Programs. As a result there is an increase to contractual services, employee benefits, and student transportation.
Program’s Recent Funding HistoryFY 2017Budgeted7/1/16
FY 2017Projected11/30/16
FY 2018Projected7/1/17
Federal $13,044,101 $13,465,719 $13,263,151
Total $13,044,101 $13,465,719 $13,263,151
CHAPTER 4 – 13 CURRICULUM AND INSTRUCTIONAL PROGRAMS

FY 2018 OPERATING BUDGET
F.T.E. Positions 53.9
* This chart includes 14.9 positions from the Title III,Limited English Proficiency Grant also shown in Chapter 6.Including a 1.0 coordinator, 9.9 ESOL transition counselors,and 4.0 parent community coordinators.
** .6 funded by the Title III Grant
*** This chart includes a 3.0 Instructional Specialist funded by the Title III grant. A 1.0 Instructional Specialist is also shown on the Department of Secondary Curriculum and Districtwide Programs chart, a 1.0 Instructional Specialist is also shown on the Department of Career Readiness and Innovative Programs chart, and a 1.0 Instructional Specialist is also shown on the Office of Student and Family Support and Engagement shown in Chapter 6.
**** Funded by the Title III Grant
Department of Elementary Curriculum and Districtwide Programs
Director II (Q) 1.0Instructional Specialist (B–D) 1.0Accountant (22) 1.0Administrative Secretary III (16) 1.0
American Indian Education
Prekindergarten and Head Start Programs
Division of Title I and Early Childhood Programs
Division of Accelerated and Enriched Instruction
Elementary Integrated Curriculum Team
Director I (P) 1.0Supervisor (O) 3.0Integrated Curriculum Specialist (B–D) 15.0Administrative Secretary II (15) 1.0Administrative Secretary I (14) 1.0
ESOL/Bilingual Programs Unit
Supervisor (O) 1.0Coordinator (N) 1.0*Instructional Specialist (B–D) 3.0***Instructional Assessment
Specialist (B–D) 1.0ESOL Transition Counselor (22) 10.9*ESOL/METS Intake Specialist (20) 1.0***Parent Community Coordinator (20) 5.0*Fiscal Assistant IV (18) 1.0**ESOL Testing Assistant (13) 4.0Secretary (12) 1.0
CH
AP
TER 4 – 14 C
UR
RIC
ULU
M A
ND
INS
TRU
CTIO
NA
L PR
OG
RA
MS

Dept of Elementary Cur & Districtwide Prgms - 233/239/650/927
Actual FY 2017Budget
FY 2017Current
FY 2018Request
FY 2018
Summer EmploymentProfessional Substitutes
192,802 228,202 213,174 (15,028)66,150
Total Positions (FTE)Position Salaries
669.585$5,818,320
688.385$55,907,436
55.400$5,092,528
53.900$5,014,290
Other Salaries
01 Salaries & Wages
44,721 72,921 139,071
Stipends 32,071 55,471 39,428 (16,043)Professional Part Time
ConsultantsOther Contractual
OfficeOther Supplies & Materials
MediaInstructional Supplies & Materials
Textbooks
Subtotal Other Salaries
Leased Equipment
Grand Total
Other Equipment
Total Salaries & Wages
02 Contractual Services
Total Contractual Services
03 Supplies & Materials
Total Supplies & Materials
04 Other
Total Other
05 Equipment
Total Equipment
Supporting Services Part TimeOther
10,40452,400
174,20352,400
175,81772,800
1,61420,400
445,311
70,466
70,466
70,466
70,466
91,654
91,654 21,188
21,188
213,014
12,000
55,85814,52416,150
98,532
12,000
55,85814,52416,150
98,532
78,85414,52415,885
2,000
111,263
(265)
(10,000)
22,996
12,731
6,217,286 56,239,834 5,675,725 5,654,580 (21,145)
398,966 332,398 583,197 640,290 57,093
$7,778,996 $57,400,837 $6,834,728 $6,737,151 ($97,577)
ChangeDescription FY 2016
(1.500)($78,238)
Insur & Employee BenefitsUtilitiesMiscellaneous
903,385
957,088
992,005
957,088
990,005
844,456
879,654
(112,632)
(110,351)
Local/Other Travel 34,917 32,917 35,198 2,281
CHAPTER 4 – 15 CURRICULUM AND INSTRUCTIONAL PROGRAMS

DESCRIPTION CURRENTFYBUDGET
FYACTUAL
20172016 10Mon
FY 2017CAT
Dept of Elementary Curriculum & Districtwide Prgs - 233/239/650/927
CHANGE2018FYFY 2018
REQUEST
233 Dept of Elementary Cur & Districtwide Prgms
2 1.000 1.000 1.000Director IIQ 1.000
2 Instructional SpecialistBD 1.0001.000
2 1.000 1.000 1.000Accountant22 1.000
2 1.000 1.000 1.000Administrative Secretary III16 1.000
3.000 3.000 3.000Subtotal 4.000 1.000
239 Division of ESOL & Bilingual Prgs.
2 1.000Director IP 2 1.000 1.000SupervisorO 1.000
3 1.000CoordinatorN 3 1.000 1.000 1.000Instruct Assessment SpecBD 1.000
2 1.000Instructional SpecialistBD 3 9.500XCounselorBD 3 540.790 577.390XTeacher, ESOLAD 3 18.000 18.000XTeacher, ESOL ResourceAD 3 4.300ESOL Transition Counselor22 3 1.000Parent Community Coord20 2 .400 .400 .400Fiscal Assistant IV18 .400
2 1.000Administrative Secretary II15 2 1.000 1.000Administrative Secretary I14 (1.000)2 1.000Fiscal Assistant I13 3 4.000 4.000 4.000ESOL Testing Assistant13 4.000
3 38.895 38.895XParaeducator - ESOL13 2 1.000 1.000 1.000Secretary12 1.000
623.885 642.685 8.400Subtotal 7.400 (1.000)
650 Elementary Integrated Curriculum Team
2 1.000 1.000 1.000Director IP 1.000
2 2.000 3.000 3.000SupervisorO 3.000
2 3.000 2.000 4.000Instructional SpecialistBD (4.000)2 9.000 10.000 10.000Elem Integrated Curr SpecBD 5.00015.000
2 2.000Pre K-12 Content SpecialistBD (2.000)2 1.000 1.000 1.000Administrative Secretary II15 1.000
2 1.000 1.000Administrative Secretary I14 1.000
2 .500 .500Office Assistant IV11 (.500)
16.000 18.500 22.500Subtotal 21.000 (1.500)
927 Limited English Proficiency (ESOL) - Grant
3 1.000 1.000 1.000CoordinatorN 1.000
3 2.000 2.000 3.000Instructional SpecialistBD 3.000
3 1.000XTeacher, ESOLAD (1.000)3 8.100 6.600 10.900ESOL Transition Counselor22 10.900
3 ESOL/Mets Intake Specialist20 1.0001.000
CHAPTER 4 – 16 CURRICULUM AND INSTRUCTIONAL PROGRAMS

DESCRIPTION CURRENTFYBUDGET
FYACTUAL
20172016 10Mon
FY 2017CAT
Dept of Elementary Curriculum & Districtwide Prgs - 233/239/650/927
CHANGE2018FYFY 2018
REQUEST
927 Limited English Proficiency (ESOL) - Grant
3 15.000 14.000 5.000Parent Community Coord20 5.000
2 .600 .600 .600Fiscal Assistant IV18 .600
26.700 24.200 21.500Subtotal 21.500
688.385669.585 55.400Total Positions 53.900 (1.500)
CHAPTER 4 – 17 CURRICULUM AND INSTRUCTIONAL PROGRAMS

Grant: Title VII, American Indian Education - 903
Actual FY 2017Budget
FY 2017Current
FY 2018Request
FY 2018
Summer EmploymentProfessional Substitutes
Total Positions (FTE)Position Salaries
Other Salaries
01 Salaries & Wages
StipendsProfessional Part Time
ConsultantsOther Contractual
OfficeOther Supplies & Materials
MediaInstructional Supplies & Materials
Textbooks
Subtotal Other Salaries
Leased Equipment
Grand Total
Other Equipment
Total Salaries & Wages
02 Contractual Services
Total Contractual Services
03 Supplies & Materials
Total Supplies & Materials
04 Other
Total Other
05 Equipment
Total Equipment
Supporting Services Part TimeOther
12,000 12,000 12,000
8,385
8,385
8,385
8,385
8,385
8,385
8,385
4,673
4,673
4,673
4,673
4,673
4,318
4,318
(355)
(355)
12,000 12,000 12,000 12,000
12,000 12,000 12,000 12,000
$26,024 $26,024 $26,024 $25,669 ($355)
ChangeDescription FY 2016
Insur & Employee BenefitsUtilitiesMiscellaneous
966
966
966
966
966
966
966
Local/Other Travel
CHAPTER 4 – 18 CURRICULUM AND INSTRUCTIONAL PROGRAMS

FY 2018 OPERATING BUDGET
F.T.E. Positions 9.25
Division of Accelerated and Enriched Instruction
Director I (P) 1.0Supervisor (O) 1.0Coordinator (N) 1.0Instructional Specialist (B–D) 4.5Data Management Coordinator (17) 0.75Administrative Secretary II (15) 1.0
CH
AP
TER 4 – 19 C
UR
RIC
ULU
M A
ND
INS
TRU
CTIO
NA
L PR
OG
RA
MS

Division of Accelerated and Enriched Instruction - 237
Actual FY 2017Budget
FY 2017Current
FY 2018Request
FY 2018
Summer EmploymentProfessional Substitutes (4,645)
Total Positions (FTE)Position Salaries
10.250$1,114,428
10.250$1,159,892
10.250$1,159,892
9.250$1,086,303
Other Salaries
01 Salaries & Wages
6,920 6,920 2,275
StipendsProfessional Part Time
ConsultantsOther Contractual
OfficeOther Supplies & Materials
MediaInstructional Supplies & Materials
Textbooks
Subtotal Other Salaries
Leased Equipment
Grand Total
Other Equipment
Total Salaries & Wages
02 Contractual Services
Total Contractual Services
03 Supplies & Materials
Total Supplies & Materials
04 Other
Total Other
05 Equipment
Total Equipment
Supporting Services Part TimeOther
26,112 26,112 27,500 1,388
91,337
91,337
91,337
91,337
91,337
91,337
91,337
97,712
83,03115,693
4,648
103,372
83,03115,693
4,648
103,372
78,41715,693
4,319
98,429
(329)
(4,614)
(4,943)
1,129,337 1,192,924 1,192,924 1,116,078 (76,846)
14,909 33,032 33,032 29,775 (3,257)
$1,322,893 $1,393,017 $1,393,017 $1,314,677 ($78,340)
ChangeDescription FY 2016
(1.000)($73,589)
Insur & Employee BenefitsUtilitiesMiscellaneous
4,507 5,384 5,384 8,833 3,449
Local/Other Travel 5,384 5,384 8,833 3,449300 3 449 3 449
CHAPTER 4 – 20 CURRICULUM AND INSTRUCTIONAL PROGRAMS

DESCRIPTION CURRENTFYBUDGET
FYACTUAL
20172016 10Mon
FY 2017CAT
Division of Accelerated and Enriched Instruction - 237
FY 2018CHANGE
FY 2018
REQUEST
2 1.000 1.000 1.000Director IP 1.000
2 1.000 1.000 1.000SupervisorO 1.000
2 1.000 1.000CoordinatorN 1.000
2 6.500 5.500 5.500Instructional SpecialistBD (1.000)4.500
2 .750 .750 .750Data Management Coordinator17 .750
2 1.000 1.000 1.000Administrative Secretary II15 1.000
10.25010.250 10.250Total Positions 9.250 (1.000)
CHAPTER 4 – 21 CURRICULUM AND INSTRUCTIONAL PROGRAMS

FY 2018 OPERATING BUDGET
Division of Title I and Early Childhood Programs and Services
F.T.E. Positions 83.446
* There are 13.7 Head Start grant positions shown on this chart.
**0.5 is locally funded
***1.0 is locally funded
Division of Title I and Early Childhood Programs and Services
Director I (P)** 1.0Supervisor (O) 1.0Coordinator (N) 1.0Instructional Specialist (B–D) 7.0Teacher, Central Office (A–D) 14.3Accountant (22) 1.0Administrative Secretary II (15)*** 1.0Data Systems Operator II (15) 0.4Fiscal Assistant II (15) 1.6Administrative Secretary I (14) 2.0
Prekindergarten Programs and Services
Head Start Programs and Services
Supervisor (O) 1.0Psychologist (B–D) 1.884Social Worker (B–D) 1.68Speech Pathologist (B–D) 5.908Social Services Assistant (13) 11.41
Judy Centers
Instructional Specialist (B–D) 2.0Parent Community Coordinator (17) 0.5Social Services Assistant (13) 1.0Secretary (12)*** 1.75
Supervisor (O) 1.0Education Services Specialist (B–D) 1.0Instructional Specialist (B–D) 1.0Psychologist (B–D)* 1.15Social Worker (B–D)* 1.15Speech Pathologist (B–D)* 4.8Parent Involvement Specialist (A–D) 1.0Teacher, Special Education (A–D) 1.014Accountant (22) 1.0Data Systems Operator II (15) 1.0Administrative Secretary I (14) 1.0Registrar (13) 1.0Social Services Assistant (13)* 6.6
CH
AP
TER 4 – 22 C
UR
RIC
ULU
M A
ND
INS
TRU
CTIO
NA
L PR
OG
RA
MS

Div of Title I & Early Childhood Prgms/Svcs - 294/235/296/297/904/905/932
Actual FY 2017Budget
FY 2017Current
FY 2018Request
FY 2018
Summer EmploymentProfessional Substitutes 628
Total Positions (FTE)Position Salaries
190.521$4,025,876
190.371$13,425,363
54.646$4,246,953
54.646$4,246,953
Other Salaries
01 Salaries & Wages
69,084 69,084 69,712
Stipends 17,900 17,900Professional Part Time
ConsultantsOther Contractual
OfficeOther Supplies & Materials
MediaInstructional Supplies & Materials
Textbooks
Subtotal Other Salaries
Leased Equipment
Grand Total
Other Equipment
Total Salaries & Wages
02 Contractual Services
Total Contractual Services
03 Supplies & Materials
Total Supplies & Materials
04 Other
Total Other
05 Equipment
Total Equipment
Supporting Services Part TimeOther
15,486161,806
15,486161,806
20,174145,714
4,688(16,092)
138,238
35,78379,810
115,593
35,78379,810
115,593
29,67581,810
111,485 (4,108)
2,000(6,108)
186,924
108,2928,777
71,308
188,377
108,2928,777
71,308
188,377
108,5277,277
71,308
187,112
235(1,500)
(1,265)
4,231,317 13,671,739 4,493,329 4,500,453 7,124
205,441 246,376 246,376 253,500 7,124
$5,960,246 $15,423,927 $6,245,517 $6,176,934 ($68,583)
ChangeDescription FY 2016
Insur & Employee BenefitsUtilitiesMiscellaneous
1,403,767
1,327,961
73,439
1,448,218
1,327,961
73,439
1,448,218
1,258,718
73,228
1,377,884
(69,243)
(211)
(70,334)
Local/Other Travel 46,818 46,818 45,938 (880)
CHAPTER 4 – 23 CURRICULUM AND INSTRUCTIONAL PROGRAMS

DESCRIPTION CURRENTFYBUDGET
FYACTUAL
20172016 10Mon
FY 2017CAT CHANGE
2018FY
Div of Title I and Early Childhood Prgms & Svcs - 294/296/297/904/905/932/235
REQUEST
2018FY
294 Div of Title I & Early Childhood Prgms/Svcs
2 .500 .500 .500Director IP .500
2 1.000 1.000 1.000SupervisorO 1.000
2 1.000 1.000 1.000Instructional SpecialistBD 1.000
2 1.000 1.000 1.000Education Services SpecBD 1.000
2 1.000 1.000 1.000Parent Involvement SpecialistAD 1.000
3 1.014 1.014 1.014XTeacher, Special EducationAD 1.014
2 1.000 1.000 1.000Accountant22 1.000
2 1.000 1.000 1.000Administrative Secretary II15 1.000
2 1.000 1.000 1.000Data Systems Operator II15 1.000
2 1.000 1.000 1.000Administrative Secretary I14 1.000
2 1.000 1.000 1.000Registrar13 1.000
2 1.000 1.000 1.000Secretary12 1.000
2 1.000Office Assistant II9
12.514 11.514 11.514Subtotal 11.514
296 Head Start -Local
3 8.900 8.900XTeacher, Head StartAD 3 9.700 9.700XParaeducator - Head Start13 7 3.300 3.300 3.300Social Services Assistant13 3.300
21.900 21.900 3.300Subtotal 3.300
297 Prekindergarten
2 1.000 1.000 1.000SupervisorO 1.000
7 1.680 1.680 1.680Social WorkerBD 1.680
3 1.884 1.884 1.884PsychologistBD (.850)1.034
3 5.908 5.908 5.908XSpeech PathologistBD 5.908
3 Psychologist - 10 MonthBD .850.850
3 54.500 54.500XTeacher, PrekindergartenAD 3 40.875 40.475XParaeducator - Pre-K13 7 9.710 9.710 9.710XSocial Services Assistant13 9.710
7 1.700 1.700 1.700Social Services Assistant13 1.700
117.257 116.857 21.882Subtotal 21.882
904 Judith B. Hoyer Silver Spring Center
14 1.000 1.000 1.000Instructional SpecialistBD 1.000
14 .500 .500XSocial Services Assistant13 .500
14 .500 .750 .750Secretary12 .750
1.500 2.250 2.250Subtotal 2.250
905 Judith B. Hoyer Gaithersburg Center
14 1.000 1.000 1.000Instructional SpecialistBD 1.000
14 .500 .500 .500XParent Comm Coordinator17 .500
CHAPTER 4 – 24 CURRICULUM AND INSTRUCTIONAL PROGRAMS

DESCRIPTION CURRENTFYBUDGET
FYACTUAL
20172016 10Mon
FY 2017CAT CHANGE
2018FY
Div of Title I and Early Childhood Prgms & Svcs - 294/296/297/904/905/932/235
REQUEST
2018FY
905 Judith B. Hoyer Gaithersburg Center
14 .500 .500XSocial Services Assistant13 .500
1.500 2.000 2.000Subtotal 2.000
932 Head Start Program - Grant
7 1.150 1.150 1.150Social WorkerBD 1.150
3 1.150 1.150 1.150PsychologistBD (.150)1.000
3 4.800 4.800 4.800XSpeech PathologistBD 4.800
3 Psychologist - 10 MonthBD .150.150
3 11.300 11.300XTeacher, Head StartAD 3 10.850 10.850XParaeducator - Head Start13 7 5.600 5.600 5.600XSocial Services Assistant13 5.600
7 1.000 1.000 1.000Social Services Assistant13 1.000
35.850 35.850 13.700Subtotal 13.700
190.371190.521 54.646Total Positions 54.646
CHAPTER 4 – 25 CURRICULUM AND INSTRUCTIONAL PROGRAMS

Grant: Title I, Part A Programs - 941
Actual FY 2017Budget
FY 2017Current
FY 2018Request
FY 2018
Summer EmploymentProfessional Substitutes (30,034)
Total Positions (FTE)Position Salaries
193.088$1,302,380
201.408$14,899,884
28.100$2,669,793
28.800$2,744,615
Other Salaries
01 Salaries & Wages
263,315 263,315 233,281
StipendsProfessional Part Time
ConsultantsOther Contractual
OfficeOther Supplies & Materials
MediaInstructional Supplies & Materials
Textbooks
Subtotal Other Salaries
Leased Equipment
Grand Total
Other Equipment
Total Salaries & Wages
02 Contractual Services
Total Contractual Services
03 Supplies & Materials
Total Supplies & Materials
04 Other
Total Other
05 Equipment
Total Equipment
Supporting Services Part TimeOther
2,345,289202,628
2,345,289202,628
1,754,990367,909
(590,299)165,281
56,966
60,822
60,822
60,822
60,822
415,152
415,152 354,330
354,330
542,674
262,4388,000
270,438
262,4388,000
270,438
396,9527,942
404,894
134,514(58)
134,456
3,330,473 17,711,116 5,481,025 5,100,795 (380,230)
2,028,093 2,811,232 2,811,232 2,356,180 (455,052)
$10,315,938
142,096
47,571
$25,274,192
47,571
47,571
47,571
$13,044,101
31,770
31,770
$13,263,151
(15,801)
(15,801)
$219,050
ChangeDescription FY 2016
.700$74,822
Insur & Employee BenefitsUtilitiesMiscellaneous
6,243,729
7,017,904
142,651
7,184,245
7,017,904
142,651
7,184,245
7,092,063
198,547
7,310,540
74,159
55,896
126,295
Local/Other Travel 23,690 23,690 19,930 (3,760)5 690 -3 760 (3 760)
CHAPTER 4 – 26 CURRICULUM AND INSTRUCTIONAL PROGRAMS

DESCRIPTION CURRENTFYBUDGET
FYACTUAL
20172016 10Mon
FY 2017CAT
Grant: Title I, Part A Programs - 941
FY 2018CHANGE
FY 2018
REQUEST
2 .500 .500 .500Director IP .500
2 1.000 1.000 1.000SupervisorO 1.000
2 1.000 1.000 1.000CoordinatorN 1.000
2 6.000 6.000 6.000Instructional SpecialistBD 1.0007.000
3 2.700 14.600 14.600XCentral Off TeacherAD (.300)14.300
3 102.800 101.600XTeacher, FocusAD 3 7.200 7.200XTeacher, Head StartAD 2 1.000 1.000 1.000Accountant22 1.000
3 8.063 8.063XParent Comm Coordinator17 2 1.000 1.000 1.000Administrative Secretary II15 (1.000)2 .400 .400 .400Data Systems Operator II15 .400
2 1.600 1.600 1.600Fiscal Assistant II15 1.600
2 1.000 1.000 1.000Administrative Secretary I14 1.0002.000
3 49.375 46.995XParaeducator - Focus13 3 9.450 9.450XParaeducator - Head Start13
201.408193.088 28.100Total Positions 28.800 .700
CHAPTER 4 – 27 CURRICULUM AND INSTRUCTIONAL PROGRAMS

Department of Secondary Curriculum and Districtwide Programs232/164/238/261/263/264/265
M I S S I O N The mission of the
Department of Secondary Curriculum
and Districtwide Programs (DSCDP) is to
improve teaching and learning through
a rigorous curriculum and culturally
proficient instruction in a 21st Century
learning environment that prepares all
students for success in college, careers,
and life. DSDCP develops research-based
curriculum, assessments, and instructional
programs aligned to the Maryland College
and Career Readiness Standards (MCCRS)
and other state, national, or industry content
standards; provides direct support to schools;
collaborates with other offices, departments,
school-based stakeholders, and community
partners to develop and implement high-
quality instructional programs; and leads
professional learning so that student
performance is not predictable by race,
ethnicity, socioeconomic status, or disability.
MAJOR FUNCTIONSCurriculum, Instruction, and Assessment
DSCDP leads the development and implementation of rigorous curriculum across all major disciplines, aligned to the MCCRS, to ensure that all students are prepared for postsecondary success and a competitive global workforce. Deployed to schools and teachers in an online digital platform, DSCDP develops curriculum that fosters creativity, engagement, collaboration, prob-lem-solving, and critical thinking through differentiated and student-centered approaches that meet the needs of all students, and also provides a rigorous STEM curricu-lum that prepares students for the 21st Century work-force. Curriculum development incorporates a variety of learning opportunities based on the identified needs and myriad interests of students, and infuses prin-ciples of Universal Design for Learning to ensure that
all students have access to the curriculum and are able to engage in and demonstrate their learning in multiple and varied ways.
DSCDP leads the implementation of the districtwide assessment strategy to provide timely data to students, their families, and staff to enable schools to monitor stu-dent progress and improve student learning. In 2016, DSCDP began development and implementation of the secondary assessment strategy, which includes replace-ment of semester exams with required quarterly assess-ments and use of new assessment platforms that use technology to deliver assessments and gather data on student learning to inform instruction. DSCDP also leads implementation of the College and Career Readiness and College Completion Act, so that all students are assessed for college and career readiness in Grade 11 and receive the necessary supports and instruction to ensure they are college and career ready upon graduation. Strategic budget allocations are supporting new assessments and college and career readiness in FY 2018.
School Support and ProgramsIn collaboration with other offices, DSCDP provides direct, differentiated support to schools to guide improvement efforts and reduce variability in outcomes across schools, and classrooms within schools, to ensure outcomes are not predictable by race, ethnicity, socio-economic status, or disability. DSCDP works closely with OSSI to use performance data to allocate resources and central services support to schools based on the needs of students and areas of lower-than-expected student performance. DSCDP works closely with other offices to align services to schools and strengthen collabora-tion and coordination to serve schools and ensure they have the support and resources necessary to meet the needs of students. Through job-embedded and onsite school support, content and pedagogical experts build the capacity of teachers and instructional leaders to pro-mote effective teaching and learning. In 2015, DSCDP began co-leadership and management of the secondary Instructional Core Teams (ICT) in literacy and mathemat-ics, serving as core structures to align professional learn-ing and provide coordinated support to schools. DSDCP uses central services measures to monitor the effective-ness of supports to schools and alignment of central ser-vices support across offices. Strategic budget allocations are supporting ICT efforts in schools in FY 2018.
DSCDP also supervises language immersion programs in elementary and middle schools and develops trans-lated instructional materials and assessments that align with MCPS curriculum. DSCDP collaborates with the
CHAPTER 4 – 28 CURRICULUM AND INSTRUCTIONAL PROGRAMS
Department of Secondary Curriculum and Districtwide Programs232/164/238/261/263/264/2655
Department of Career Readiness and Innovative Pro-grams to support implementation of college-level courses in high school as well as elective and advanced courses for middle schools. DSCDP also leads develop-ment and implementation of fine arts programs, man-aging choral and instrumental music programs in all grades; coordinating local and state music festivals and competitions; and leading curriculum development, implementation, and professional learning in music, art, theater, and dance. DSCDP leads curriculum, school support, and countywide initiatives in health and physi-cal education.
Secondary ESOL Instruction In 2015, the ESOL team was incorporated into the sec-ondary curriculum department to ensure alignment, access, and improved levels of student performance for ESOL students within the content areas, alongside the deployment of English Language Development (ELD) Teacher Coaches in 20 middle schools. DSCDP supports academic excellence for secondary ESOL students by focusing on high quality ELD instruction and supporting 21st century teaching and learning for ESOL students across all content areas in middle and high schools. Secondary ESOL Instruction also provides curricu-lum resources, professional learning, and instructional supports to secondary schools to bolster the academic success of secondary ESOL students. Secondary ESOL Instruction curriculum resources are aligned with the World-Class Instructional Design and Assessment ELD standards and are correlated to the literacy and lan-guage standards to support the development of aca-demic English for college and career readiness. ESOL students who have had little or no previous schooling benefit from the intensive basic skills literacy, numeracy, and language instruction provided by the Multidisci-plinary Educational Training and Support program.
Outdoor Environmental Education ProgramsOEEP promotes the integration of environmental literacy lessons in the prekindergarten–12 curriculum and uses the outdoor environment as an essential classroom for teaching and learning. MCPS curriculum-based experi-ences at outdoor environmental education sites engage students in authentic field investigations that specifically target MSDE science, environmental education, and social studies indicators, while nurturing an awareness, appreciation, and stewardship for the natural environ-ment. Through academically focused lessons and the residential living program, Grade 6 students experience unique opportunities for social-emotional learning.
School Library Media ProgramsSLMP leads the implementation of a 21st. Century vision for library media programs and integration of informa-tion literacy into the curriculum across content areas to maximize student learning in two ways: 1) building capacity of library media staff to provide for teaching and learning of digital, visual, textual, and technologi-cal literacy; and 2) collaborating with other MCPS staff and students, community, and business partners, as well as state and local education agencies to access and use high-quality and innovative resources and tech-nologies. The Evaluation and Selection Unit of SLMP ensures the development of diverse collections of print, nonprint, and digital resources to support curriculum implementation.
Professional Learning DSCDP leads professional learning in curriculum, instruction, intervention, and assessment to ensure systemic efforts to improve the skills and capabilities of teachers and staff, so that students have the skills and knowledge needed to be college and career ready. DSDCP also develops and implements professional learning for instructional leaders and school leadership teams through secondary leader professional learning, principal curriculum updates, administrator profes-sional learning communities, resource teacher meetings, and administrative and supervisory sessions. Through-out all professional development, DSCDP infuses princi-ples and learning so that all staff members are culturally proficient and possess the skills, knowledge, and beliefs necessary to create a learning environment that is stu-dent-centered and meets the individual and diverse needs of students. In 2016, DSCDP began implemen-tation of new, innovative models of professional devel-opment, including cohort professional learning which provides extended professional learning in content alike teams, to a smaller subset of schools based on need. Strategic budget allocations are continuing to support this new approach to professional learning in FY 2018.
Strategic Stakeholder Involvement and Partnerships
DSCDP facilitates two-way communication with parents, students, employees, and community members using a wide array of tools to engage and communicate infor-mation. DSCDP provides information to, and solicits input and feedback from, a wide range of stakeholders in the development and review of products, programs, and services. DSCDP benchmarks effective practices in similar districts, analyzes current research, and consults with state and federal agencies, higher education, and
CHAPTER 4 – 29 CURRICULUM AND INSTRUCTIONAL PROGRAMS

Department of Secondary Curriculum and Districtwide Programs232/164/238/261/263/264/265
business. DSCDP liaises with national education orga-nizations and assessment consortia to inform product development and service delivery.
DSCDP also develops, expands, and sustains partner-ships that meet the in-school and out-of-school needs of students and families, with focus on science, technology, engineering, and mathematics, equity, Advanced Place-ment, the arts, financial literacy, environmental literacy, and project-based learning.
MEASURESM E A S U R E : Increase the number of students in all student groups who met or exceeded standards on the Partnership for Readiness for College and Careers assessment in English language arts/literacy (ELA) in Grades 8 and 10, and in Algebra 1.
FY 2016Actual
FY 2017Estimate
FY 2018Recommended
ELA Grade 8 47.9% 55.9% 60.9%ELA Grade 10 48.1% 53.1% 58.1%Algebra 1 MS 65.1% 70.1% 75.1%Algebra 1 HS 17.0% 37.0% 57.0%
M E A S U R E : Increase the number of graduating stu-dents determined college and career ready, as defined by MSDE (new data will be collected in FY 2017).
FY 2016Actual
FY 2017Estimate
FY 2018Recommended
* New Data TBD
E X P L A N A T I O N : The Maryland College and Career Readiness and College Completion Act of 2013 requires that all students take a MSDE-approved college readiness assessment by the end of Grade 11 and if not determined college and career ready, enroll in a transition course and reassessed in Grade 12. The 2016–2017 school year is the first year of implementation for graduating seniors.
OVERVIEW OF BUDGET CHANGES
FY 2017 CURRENT BUDGET
The current FY 2017 budget for the Department of
Secondary Curriculum and Districtwide Programs is
changed from the budget adopted by the Board of
Education on June 14, 2016. The change includes the
realignment of school-based resources that provide
direct services to students to Chapter 1, Schools. In
addition, there is a realignment of 4.0 instructional
specialist positions and $430,718 from this department
to the Department of Elementary Curriculum and
Districtwide Programs. Also, there is a realignment
of $28,200 in substitutes, $23,400 in stipends, and
$15,222 in contractual services to the Department of
Elementary Curriculum and Districtwide Programs,
and to the Department of Career Readiness and
Innovative Programs.
FY 2018 RECOMMENDED BUDGET
The FY 2018 recommended budget for this
Department is $8,600,086, a decrease of $382,727
from the current FY 2017 budget. An explanation of
this change follows.
Same Service Level Changes—$58,809Realignments to Meet Expenditure Requirements and Program Priorities—$38,911 There are a number of realignments budgeted to address priority spending needs within this department. There is a decrease of $14,700 for instructional materials and a cor-responding increase of $2,322 to professional part-time salaries and $9,700 to contractual services. In addition, $2,678 is realigned in the budget for employee benefits to the Department of Employee and Retiree Services.
The FY 2018 recommended budget includes a realign-ment that result in an overall budget neutral set of realignments between departments and offices. The realignment includes a 1.0 instructional specialist posi-tion and $73,589 to this department from the Department of Technology Integration and Support in Chapter 8. In addition, $4,500 is realigned from this department’s bud-get to the Department of Career Readiness and Innova-tive Programs, and $30,178 is realigned in the budget for employee benefits to the Department of Employee and Retiree Services.
CHAPTER 4 – 30 CURRICULUM AND INSTRUCTIONAL PROGRAMS

Department of Secondary Curriculum and Districtwide Programs232/164/238/261/263/264/2655
Other—$19,898There is an increase in contractual services of $19,898 for the Outdoor Environmental Education program due to rate increases for the outdoor education facilities.
Program Efficiencies and Reductions—($441,536)The FY 2018 recommended budget for this department includes a comprehensive effort to identify potential program efficiencies and reductions. Stakeholders, including community partners and employee union representatives, participated in the program efficiencies and reduction process.
There is a reduction of a 1.0 instructional materials assis-tant I position and $59,495, 1.5 administrative secretary I positions and $63,078, a 1.0 content specialist position and $73,589, and 2.0 instructional specialist positions and $147,178. Responsibilities are able to be reassigned to other department staff. In addition, there is a reduc-tion of $37,351 for contractual services for assessments, $21,750 for instructional materials, and $39,095 in con-tractual services are made based on prior year spending.
CHAPTER 4 – 31 CURRICULUM AND INSTRUCTIONAL PROGRAMS

FY 2018 OPERATING BUDGET
English
Supervisor (O) 1.0Content Specialist (B–D) 4.0Administrative Secretary I (14) 0.5
Social Studies
Supervisor (O) 1.0Content Specialist (B–D) 2.0Administrative Secretary I (14) 0.5
World Languages
Supervisor (O) 1.0Content Specialist (B–D) 2.0Administrative Secretary II (15) 0.5
Fine Arts
Supervisor (O) 1.0Coordinator (N) 1.0Content Specialist (B–D) 2.0Administrative Secretary I (14) 0.5
Science, Technology and Engineering
Supervisor (O) 1.0Coordinator (N) 1.0Content Specialist (B–D) 3.0Administrative Secretary I (14) 0.5
School Library Media Programs
Supervisor (O) 1.0Content Specialist (B–D) 1.0Administrative Secretary II (15) 1.0Outdoor Environmental
Education Programs
Supervisor (O) 1.0Teacher (A–D) 5.0Administrative Secretary II (15) 1.0
Evaluation and Selection of Instructional Materials
Coordinator (N) 1.0Instructional Materials Assistant II (14) 1.0Administrative Secretary I (14) 1.0
Mathematics Development and Implementation Team
Supervisor (O) 1.0Instructional Specialist (B–D) 2.0Content Specialist (B–D) 5.0Administrative Secretary II (15) 0.5
F.T.E. Positions 69.5
* In addition, a 1.0 Instructional Specialist shown onthis chart is funded by the Title III grant.
Department of Secondary Curriculum and Districtwide Programs
Director II (Q) 1.0Supervisor (O) 1.0Instructional Specialist (B–D) 1.0Accountant (22) 1.0Administrative Secretary III (16) 1.0
ESOL
Supervisor (O) 1.0Instructional Specialist (B–D)* 5.0Teachers (A–D) 10.0Administrative Secretary (14) 1.0
Physical Education & Health
Supervisor (O) 1.0Content Specialist (B–D) 3.0Administrative Secretary I (14) 0.5
CH
AP
TER 4 – 32 C
UR
RIC
ULU
M A
ND
INS
TRU
CTIO
NA
L PR
OG
RA
MS

Dept of Secondary Cur & Districtwide Prgms - 232/164/238/261/263/264/265
Actual FY 2017Budget
FY 2017Current
FY 2018Request
FY 2018
Summer EmploymentProfessional Substitutes
1,539 1,539 1,539
Total Positions (FTE)Position Salaries
78.500$8,003,658
78.000$8,260,319
74.000$7,829,601
69.500$7,559,850
Other Salaries
01 Salaries & Wages
36,964 8,764 8,764
Stipends 166,939 143,539 143,539Professional Part Time
ConsultantsOther Contractual
OfficeOther Supplies & Materials
MediaInstructional Supplies & Materials
Textbooks
Subtotal Other Salaries
Leased Equipment
Grand Total
Other Equipment
Total Salaries & Wages
02 Contractual Services
Total Contractual Services
03 Supplies & Materials
Total Supplies & Materials
04 Other
Total Other
05 Equipment
Total Equipment
Supporting Services Part TimeOther
41,30014,606
41,30014,606
43,62214,606
2,322
379,334
607,032
607,032
591,810
591,810
393,662
393,662 (198,148)
(198,148)
388,505
48,901
174,55329,12354,290
306,867
48,901
174,55329,12354,290
306,867
138,10329,123
175,590
48,901
391,717
121,300
(36,450)
84,850
8,148,755 8,521,667 8,039,349 7,771,920 (267,429)
145,097 261,348 209,748 212,070 2,322
$8,955,189 $9,479,353 $8,982,813 $8,600,086 ($382,727)
ChangeDescription FY 2016
(4.500)($269,751)
Insur & Employee BenefitsUtilitiesMiscellaneous
38,595
16,532
43,787
16,532
44,787
16,532
42,787 (2,000)
Local/Other Travel 27,255 28,255 26,255 (2,000)
CHAPTER 4 – 33 CURRICULUM AND INSTRUCTIONAL PROGRAMS

DESCRIPTION CURRENTFYBUDGET
FYACTUAL
20172016 10Mon
FY 2017CAT CHANGE
2018FY
Dept of Secondary Curriculum & Districtwide Prgs - 232/164/238/261/263/264
REQUEST
2018FY
232 Dept. of Curriculum & Instruction
2 1.000 1.000 1.000Director IIQ 1.000
1 1.000Director IP 2 8.000 8.000 8.000SupervisorO 8.000
2 2.000 2.000 2.000CoordinatorN 2.000
2 5.000 5.000 3.000Instructional SpecialistBD (1.000)2.000
2 24.000 24.000 22.000Pre K-12 Content SpecialistBD (1.000)21.000
3 1.000 1.000 1.000Pre K-12 Content SpecialistBD 1.000
2 1.000 1.000 1.000Accountant22 1.000
2 1.000 1.000 1.000Administrative Secretary III16 1.000
1 1.000 1.000 1.000Administrative Secretary II15 1.000
2 4.500 4.000 4.000Administrative Secretary I14 (1.500)2.500
49.500 48.000 44.000Subtotal (3.500)40.500
261 Outdoor Environmental Education Programs
2 1.000 1.000 1.000SupervisorO 1.000
3 5.000 5.000 5.000XTeacherAD 5.000
2 1.000 1.000 1.000Administrative Secretary II15 1.000
7.000 7.000 7.000Subtotal 7.000
238 Secondary ESOL
2 1.000 1.000 1.000SupervisorO 1.000
2 3.000 4.000 4.000Instructional SpecialistBD 4.000
3 10.000 10.000 10.000XTeacher, ESOLAD 10.000
2 1.000 1.000 1.000Administrative Secretary I14 1.000
15.000 16.000 16.000Subtotal 16.000
263 School Library Media Program
2 1.000 1.000 1.000SupervisorO 1.000
2 1.000 1.000 1.000Pre K-12 Content SpecialistBD 1.000
2 1.000 1.000 1.000Administrative Secretary II15 1.000
3.000 3.000 3.000Subtotal 3.000
264 Eval & Selec of Instruct Materials
2 1.000 1.000 1.000CoordinatorN 1.000
2 1.000 1.000 1.000Administrative Secretary I14 1.000
2 1.000 1.000 1.000Instruct Materials Asst II14 1.000
2 1.000 1.000 1.000Instruct Materials Asst I12 (1.000)
4.000 4.000 4.000Subtotal (1.000)3.000
78.00078.500 74.000Total Positions (4.500)69.500
CHAPTER 4 – 34 CURRICULUM AND INSTRUCTIONAL PROGRAMS

Department of Career Readiness and Innovative Programs212/144/215/145/951/553/908/213
M I S S I O N The mission of the
Department of Career Readiness and
Innovative Programs (DCRIP) is to develop,
implement, and monitor empirical and
evidenced based innovative instructional
programs which have been reviewed
collaboratively with other departments and
community leaders to provide students
and schools with rigorous and relevant
opportunities for postsecondary success.
DCRIP is committed to providing direct
services and support to students, parents,
and schools to maximize their awareness of
Montgomery County Public Schools (MCPS)
special programs.
MAJOR FUNCTIONSCareer and Postsecondary Partnerships
The CPP team supports instruction and enhances cur-riculum by leveraging business and postsecondary partnerships and providing innovative college and career program options which create environments that foster creativity and collaboration, preparing stu-dents for the 21st. Century workforce. CPP guides stu-dents in 34 programs of study across all 25 high schools as well as Thomas Edison High School of Technology to earn industry credentials and or college credits as they explore options for postsecondary education and/or careers. In addition, CPP manages dual enrollment programs, internship programs, and JROTC programs throughout the district. CPP programs provide students with opportunities to grow and develop based on their identified needs and interests.
FoundationsFoundations, a collaborative program between MCPS and the local business community leaders, offers students state-of-the-art technology and supports education and training in a full range of Career and Technology Edu-cation programs of study. The Foundations office pro-grams include automotive trades, construction trades, and computer science and information technology
offering hands-on learning, fostering engagement and critical thinking to prepare students for graduation and postsecondary success. Students have opportunities to gain entrepreneurial experiences through student-run businesses and/or earn industry credentialing that mea-sures competitive workforce skills. Students also have opportunities to earn articulated college credits and advanced placement with local colleges. The unique business partnership of each foundation ensures that all stakeholders monitor and invest their resources to promote the effectiveness of the programs and provide greater access to programs. The Foundations office also manages all computer science programs in the district.
SEPA and CREAStudents Engaged in Pathways to Achievement (SEPA) and the Career Readiness Education Academy (CREA) provide supportive, alternative pathways for older Eng-lish language learners (ELL) enrolled in any MCPS high school. In order to be eligible for the SEPA and CREA programs, students must be 18–20 years of age and they are unable to complete all of the requirements neces-sary to graduate with a diploma prior to aging out of the school system at 21. SEPA, offered during the school day, provides opportunities for students to complete career pathways including the Construction Trades (electricity, HVAC, carpentry, plumbing, and masonry), Automo-tive Technology, Nail Technology, Restaurant Manage-ment, and Hospitality and Tourism. In FY 2017, MCPS established the Career Readiness Education Academy (CREA), an alternative program to decrease the number of older adult ESOL high school students who drop out of school. CREA is an evening program offered four nights a week for ELLs who must work or care for a dependent during the day. CREA prepares ELLs to take classes in a career pathway and earn industry certification (either in Foundations of Construction, Hospitality and Tourism/Restaurant Management, or in Foundations of Automo-tive Technology). In FY 2018, DCRIP continues to focus our efforts on industry certifications by providing more flexible schedules and increasing student enrollment.
Regional Summer SchoolRegional Summer School provides students a wide range of high school courses for original credit or for credit recovery during a six-week period in July and August. In an effort to improve the quality of Regional Summer School, a workgroup was formed with the purpose of identifying areas for upgrades and innova-tion. As a result, a blended learning summer school site (hybrid of online and face-to-face learning) is being pro-posed for the summer of 2017.
CHAPTER 4 – 35 CURRICULUM AND INSTRUCTIONAL PROGRAMS
Department of Career Readiness and Innovative Programs212/144/215/145/951/553/908/213
Middle School Extended Day/Extended YearThe Middle School Extended Day/Extended Year Program ensures that students are offered learning opportunities based on identified needs by providing additional instructional time to students to support their meeting or exceeding grade-level course expectations. Extended-day programs address specific needs of Eng-lish language learners, students with reading difficulties, and students who struggle in on-level math courses.
Interim Instructional ServicesIIS, formerly Home and Hospital Teaching, provides short-term instruction for approximately 800 students yearly, for physical or mental health reasons, cannot attend school for four or more weeks, and for students who have been administratively placed outside of a traditional school setting. The new IIS model provides students with personalized learning plans, blended learning opportunities, and social emotional supports to foster academic progress toward graduation and, when appropriate, transition back to their home schools. In order to improve teaching and learning, ensure oppor-tunities for all students to learn, and create 21st. Century learning environments for students who cannot attend schools, IIS offers a variety of web-based courses in core academic subjects that are aligned to MCPS curriculum and PARCC assessments. With the realignment of staff-ing resources, 5.0 permanent IIS staff members with exemplary classroom teaching experiences developed and taught online courses, provided professional devel-opment to more than 400 temporary part-time teachers, and served as case managers for students.
Student Online LearningThe Student Online Learning program provides the opportunity for high school students to take courses outside of the traditional classroom setting. Utilizing technology and the internet, the primary goal of the Stu-dent e-Learning program is to provide all high school students with the opportunity to accelerate their learn-ing, provide scheduling flexibility or to retake previously failed courses. During the FY 2016 year, a new online course, Foundations of Computer Science, was made available to students and the Online Pathway to Grad-uation program has implemented program changes to increase student accountability and success. An expansion of current course offerings is planned with an emphasis on Career Technology Education (CTE) to provide students access to courses not available at their home schools for completion of CTE Programs of Study, credit recovery, and acceleration.
Bridge Plan for Academic ValidationThrough the Bridge Plan for Academic Validation, a component of the Maryland High School Assessment (MHSA) and Partnership for Assessment of Readiness for College and Careers (PARCC) testing requirements, staff work with students who did not earn passing test scores on MHSA and PARCC assessments to complete projects in these content areas. The Bridge Plan coor-dinator provides professional learning for team leaders and project monitors, regular data updates on students’ progress towards meeting the MHSA and PARCC test-ing requirement, facilitates scoring sessions and reports scoring results for the program.
Division of Consortia Choice and Application Program Services
The division was established to align the parent/student outreach and school assignment processes of Consortia Choice, elementary and middle school language immer-sion, elementary and secondary countywide magnet, and local academy and signature programs to provide choice and access to programs that prepare students for college and career. Key aspects include parent/student outreach using a wide variety of tools, application and process timelines, parent and school communication, student school assignments, school notification, articu-lation, annual enrollment reports and appeal processes. DCCAPS’s Consortia Choice supports the lottery and school assignment processes in the Northeast Con-sortium, Downcounty Consortium, and Middle School Magnet Consortium. Staff members also facilitate the elementary and middle school language immersion lot-tery and articulation process, and support high school academy and signature programs in 23 high schools. DCCAPS’s Application Program facilitates the elemen-tary and secondary countywide application program parent communication, student selection and assign-ment, and appeal processes. Since FY 2015, DCCAPS has collaborated to identify more students capable of accelerated learning through Early Learning Opportu-nities Summer Title I Enrichment Programs.
CHAPTER 4 – 36 CURRICULUM AND INSTRUCTIONAL PROGRAMS

Department of Career Readiness and Innovative Programs212/144/215/145/951/553/908/213
MEASURESM E A S U R E : To increase the percentage of CTE students who attain completion status and/or industry certifica-tions/credentialing in CTE programs.
FY 2016Actual
FY 2017Estimate
FY 2018Recommended
>5% 5% 8%
E X P L A N A T I O N : In FY 2016, DCRIP began working with the employer community to offer high quality career pathways aligned with high-skill and relevant industry sectors, providing all students the opportunity to earn a meaningful postsecondary degree or credential, and making career readiness matter to schools and students.
M E A S U R E : To increase the percentage of students in SEPA/CREA who become certified in a trade/skill or enroll in the Montgomery College Adult Education program.
FY 2016Actual
FY 2017Estimate
FY 2018Recommended
N/A 80% 90%
E X P L A N A T I O N : As SEPA and CREA students are likely to reach age 21 prior to completing graduation requirements, success of these programs is best measured based on industry certification and articulation to adult education programs.
M E A S U R E : To increase the number of blended or online learning courses available to MCPS students.
FY 2016Actual
FY 2017Estimate
FY 2018Recommended
46 60 70
E X P L A N A T I O N : MCPS curriculum-aligned blended courses are being developed and taught In IIS, with expansion to summer school in 2017. Student Online Learning has begun an expansion of course offerings with an emphasis on CTE courses and credit recovery.
OVERVIEW OF BUDGET CHANGES
FY 2017 CURRENT BUDGET
The current FY 2017 budget for this program is
changed from the budget adopted by the Board of
Education on June 14, 2016. The change includes
the realignment of school-based resources that
provide direct services to students to Chapter 1,
Schools. In addition, there is a change that is the
result of a realignment of ESOL Teacher salaries to
fund $322 for local travel mileage reimbursement,
$14,900 for other program costs, $1,000 for dues,
registration and fees, and $38,000 for professional
part-time salaries to support the Career Readiness
and Education Academy.
FY 2018 RECOMMENDED BUDGET
The FY 2018 recommended budget for this
department is $5,328,406, a decrease of $124,834
from the current FY 2017 budget. An explanation of
this change follows.
Same Service Level Changes—$73,283Realignments to Meet Expenditure Requirements and Program Priorities—$73,283 There are several realignments budgeted to address pri-ority spending needs within the Department of Career Readiness and Innovative Programs. There is a decrease of $1,000 for dues, registration, and fees and a corre-sponding increase of $1,000 for program supplies. There also is a decrease of $800 in office supplies and a corre-sponding increase of $800 in student meals and snacks. In addition, there is a decrease of $4,000 for other pro-gram costs as funds are realigned to provide $3,694 for supporting services support for the division. As a result, $306 is realigned in the budget for employee benefits to the Department of Employee and Retiree Services
Realignments for the Perkins local match are budgeted to address priority spending needs in this program. There is a realignment of $10,000 from local travel mile-age reimbursement to fund instructional materials based on program requirements.
CHAPTER 4 – 37 CURRICULUM AND INSTRUCTIONAL PROGRAMS

Department of Career Readiness and Innovative Programs212/144/215/145/951/553/908/213
Realignments for the Division of Consortia Choice and Application Program Services are budgeted to address priority spending needs in this division. There is a realignment of $101 from supporting services part-time salaries and $45 from substitutes to fund professional part-time salaries for this division.
Realignments for Interim Instructional Services are budgeted to address priority spending needs in this program. There is a realignment of $18,067 from profes-sional part-time salaries to fund support services part-time salaries for this program.
The FY 2018 recommended budget includes a realign-ment that result in an overall budget neutral set of realignments between departments and offices. The realignment includes a 1.0 instructional specialist posi-tion and $73,589 to the Department of Career Readiness and Innovative Programs from the Department of Tech-nology Integration and Support in Chapter 8.
Program Efficiencies and Reductions—($198,117)The FY 2018 recommended budget for this department includes a comprehensive effort to identify potential program efficiencies and reductions. Stakeholders, including community partners and employee union representatives, participated in the program efficiencies and reduction process.
In the Department of Career Readiness and Innovative Programs, there is a reduction of a 1.0 coordinator posi-tion and $105,604 and a 1.0 content specialist position and $73,589. Responsibilities are able to be reassigned to other department staff.
In the Interim Instructional Services program, there is a reduction of $18,924 budgeted for professional part-time salaries based on program requirements.
Grant: Carl D. Perkins Career & Technology Education Improvement Program—951
FY 2017 CURRENT BUDGET
The current FY 2017 budget for this program is
changed from the budget adopted by the Board of
Education on June 14, 2016. The change includes the
realignment of school-based resources that provide
direct services to students to Chapter 1, Schools.
FY 2018 RECOMMENDED BUDGET
The FY 2018 recommended budget for this
program is $902,257. There is no change from
current FY 2017 budget.
Program’s Recent Funding HistoryFY 2017Budgeted7/1/16
FY 2017Projected11/30/16
FY 2018Projected7/1/16
Federal $902,257 $897,080 $902,257
Total $902,257 $897,080 $902,257
Grant: National Institutes of Health Program—908
FY 2018 RECOMMENDED BUDGET
The FY 2018 recommended budget for this
program is $281,388, an increase of $6,181 over
the current FY 2017 budget. An explanation of this
change follows.
Same Service Level Changes - $6,181There is a projected revenue increase of $6,181 to this budget based on the expected FY 2018 National Insti-tutes of Health Program grant award. As a result, there is an increase to professional part-time salaries.
Program’s Recent Funding HistoryFY 2017Budgeted7/1/16
FY 2017Projected11/30/16
FY 2018Projected7/1/16
Federal $275,207 $275,903 $281,388
Total $275,207 $275,903 $281,388
CHAPTER 4 – 38 CURRICULUM AND INSTRUCTIONAL PROGRAMS

FY 2018 OPERATING BUDGET
F.T.E. Positions 33.75* 3.0 Paraeducator positions are budgeted in the Perkins Vocational and Technical Education Program grant.
** 1.2 positions (0.2 Fiscal Assistant and 1.0 Administrative Secretary) are budgeted in the Perkins Vocational and Technical Education Program shown on page 4-48.
*** In addition, 1.6 positions are budgeted in the Entrepreneurial Funds in Chapter 7.**** In addition, 1.0 Instructional Specialist, a 1.0 ESOL Transition Counselor, and a
1.0 Parent Community Coordinator positions are budgeted in the Title III, Limited English Proficiency Grant
Department of Career Readiness and Innovative Programs
Director II (Q) 1.0Instructional Specialist (B–D) 1.0Accountant (22) 1.0Administrative Secretary III (16) 1.0
Division of Consortia Choice and Application Program Services
Foundations
Supervisor (O) 1.0Instructional Specialist (B–D) 3.0Teacher, Career Preparation (A–D) 2.0Fiscal Assistant II (15) 1.0Paraeducator (12) 0.75
Career, Postsecondary Partnerships & Perkins
Supervisor (O) 1.0Coordinator (N) 1.0Content Specialist (B–D) 1.0Fiscal Assistant IV (18) (**) 1.0Administrative Secretary II (15) (**) 1.0Paraeducator (12)* 3.0
Interim Instructional Services/Home and Hospital Teaching
Supervisor (O) 1.0Instructional Specialist (B–D) 2.0Classroom Teacher, High (A–D) 5.0Teacher, Special Education (A–D) 1.0Administrative Secretary I (14) 2.0
Innovative Programs
Supervisor (O) 1.0Coordinator (N) 1.0Instructional Specialist (B–D) 1.0Instructional Specialist (B–D)**** 1.0ESOL Transition Counselor (22)**** 1.0Communication Specialist/Web
Producer (21)*** 1.0Parent Community Coordinator (20)**** 1.0Online Course Registrar (16)*** 0.6
CH
AP
TER 4 – 39 C
UR
RIC
ULU
M A
ND
INS
TRU
CTIO
NA
L PR
OG
RA
MS

Dept of Career Readiness & Innovative Programs - 212/144/145/215
Actual FY 2017Budget
FY 2017Current
FY 2018Request
FY 2018
Summer EmploymentProfessional Substitutes
Total Positions (FTE)Position Salaries
21.250$2,169,829
20.750$2,205,033
20.750$2,205,033
19.750$2,099,429
Other Salaries
01 Salaries & Wages
3,795 3,795 3,795
Stipends 14,153 14,153 14,153Professional Part Time
ConsultantsOther Contractual
OfficeOther Supplies & Materials
MediaInstructional Supplies & Materials
Textbooks
Subtotal Other Salaries
Leased Equipment
Grand Total
Other Equipment
Total Salaries & Wages
02 Contractual Services
Total Contractual Services
03 Supplies & Materials
Total Supplies & Materials
04 Other
Total Other
05 Equipment
Total Equipment
Supporting Services Part TimeOther
104,0188,501
142,0188,501
142,01812,195 3,694
147,130
147,130
147,130
147,130
147,130
147,130
147,130
81,376
34,6185,9052,496
43,019
34,6185,9052,496
43,019
45,6185,1053,296
54,019
800
11,000(800)
11,000
2,259,413 2,335,500 2,373,500 2,271,590 (101,910)
89,584 130,467 168,467 172,161 3,694
$2,513,293 $2,548,422 $2,602,644 $2,496,734 ($105,910)
ChangeDescription FY 2016
(1.000)($105,604)
Insur & Employee BenefitsUtilitiesMiscellaneous
25,374
5,000
22,773
19,900
38,995
15,900
23,995
(4,000)
(15,000)
Local/Other Travel 17,773 19,095 8,095 (11,000)
CHAPTER 4 – 40 CURRICULUM AND INSTRUCTIONAL PROGRAMS
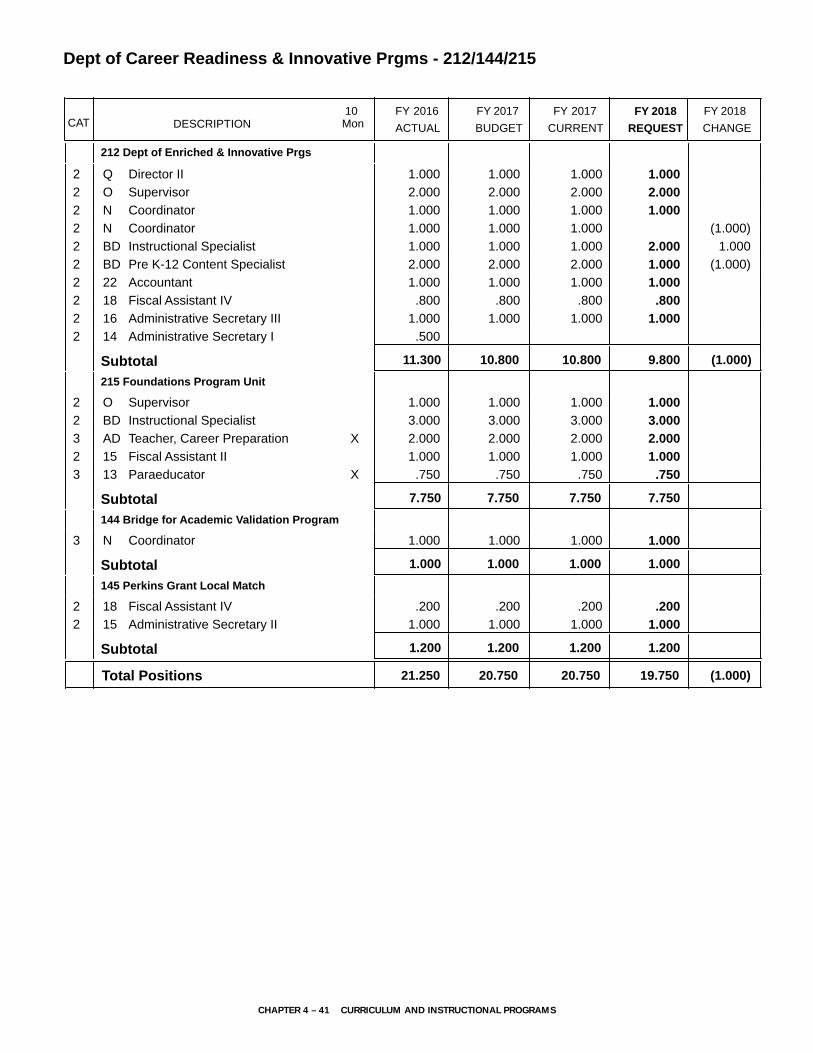
DESCRIPTION CURRENTFYBUDGET
FYACTUAL
20172016 10Mon
FY 2017CAT CHANGE
2018FY
Dept of Career Readiness & Innovative Prgms - 212/144/215
REQUEST
2018FY
212 Dept of Enriched & Innovative Prgs
2 1.000 1.000 1.000Director IIQ 1.000
2 2.000 2.000 2.000SupervisorO 2.000
2 1.000 1.000 1.000CoordinatorN 1.000
2 1.000 1.000 1.000CoordinatorN (1.000)2 1.000 1.000 1.000Instructional SpecialistBD 1.0002.000
2 2.000 2.000 2.000Pre K-12 Content SpecialistBD (1.000)1.000
2 1.000 1.000 1.000Accountant22 1.000
2 .800 .800 .800Fiscal Assistant IV18 .800
2 1.000 1.000 1.000Administrative Secretary III16 1.000
2 .500Administrative Secretary I14
11.300 10.800 10.800Subtotal (1.000)9.800
215 Foundations Program Unit
2 1.000 1.000 1.000SupervisorO 1.000
2 3.000 3.000 3.000Instructional SpecialistBD 3.000
3 2.000 2.000 2.000XTeacher, Career PreparationAD 2.000
2 1.000 1.000 1.000Fiscal Assistant II15 1.000
3 .750 .750 .750XParaeducator13 .750
7.750 7.750 7.750Subtotal 7.750
144 Bridge for Academic Validation Program
3 1.000 1.000 1.000CoordinatorN 1.000
1.000 1.000 1.000Subtotal 1.000
145 Perkins Grant Local Match
2 .200 .200 .200Fiscal Assistant IV18 .200
2 1.000 1.000 1.000Administrative Secretary II15 1.000
1.200 1.200 1.200Subtotal 1.200
20.75021.250 20.750Total Positions (1.000)19.750
CHAPTER 4 – 41 CURRICULUM AND INSTRUCTIONAL PROGRAMS

Interim Instructional Services - 553
Actual FY 2017Budget
FY 2017Current
FY 2018Request
FY 2018
Summer EmploymentProfessional Substitutes
Total Positions (FTE)Position Salaries
11.000$900,159
11.000$996,097
11.000$996,097
11.000$996,097
Other Salaries
01 Salaries & Wages
StipendsProfessional Part Time
ConsultantsOther Contractual
OfficeOther Supplies & Materials
MediaInstructional Supplies & Materials
Textbooks
Subtotal Other Salaries
Leased Equipment
Grand Total
Other Equipment
Total Salaries & Wages
02 Contractual Services
Total Contractual Services
03 Supplies & Materials
Total Supplies & Materials
04 Other
Total Other
05 Equipment
Total Equipment
Supporting Services Part TimeOther
921,337 921,337 884,34618,067
(36,991)18,067
45,969
50,936
50,936
50,936
50,936
50,936
50,936
5,204
4,750944
5,694
4,750944
5,694
4,750944
5,694
2,065,766 1,917,434 1,917,434 1,898,510 (18,924)
1,165,607 921,337 921,337 902,413 (18,924)
$2,144,393 $2,002,538 $2,002,538 $1,983,614 ($18,924)
ChangeDescription FY 2016
Insur & Employee BenefitsUtilitiesMiscellaneous
27,454 28,474 28,474 28,474
Local/Other Travel 28,474 28,474 28,474
CHAPTER 4 – 42 CURRICULUM AND INSTRUCTIONAL PROGRAMS

DESCRIPTION CURRENTFYBUDGET
FYACTUAL
20172016 10Mon
FY 2017CAT
Interim Instructional Services - 553
FY 2018CHANGE
FY 2018
REQUEST
2 1.000SupervisorO 1.000
2 1.000 1.000CoordinatorN 6 2.000 2.000 2.000Instructional SpecialistBD 2.000
3 5.000 5.000 5.000XTeacherAD 5.000
6 1.000 1.000 1.000XTeacher, Special EducationAD 1.000
2 2.000 2.000 2.000Administrative Secretary I14 2.000
11.00011.000 11.000Total Positions 11.000
CHAPTER 4 – 43 CURRICULUM AND INSTRUCTIONAL PROGRAMS

Grant: National Institutes of Health Program - 908
Actual FY 2017Budget
FY 2017Current
FY 2018Request
FY 2018
Summer EmploymentProfessional Substitutes
Total Positions (FTE)Position Salaries
Other Salaries
01 Salaries & Wages
Stipends 1,428 1,428 1,428Professional Part Time
ConsultantsOther Contractual
OfficeOther Supplies & Materials
MediaInstructional Supplies & Materials
Textbooks
Subtotal Other Salaries
Leased Equipment
Grand Total
Other Equipment
Total Salaries & Wages
02 Contractual Services
Total Contractual Services
03 Supplies & Materials
Total Supplies & Materials
04 Other
Total Other
05 Equipment
Total Equipment
Supporting Services Part TimeOther
219,31418,067
219,31418,067
225,49518,067
6,181
229,356 238,809 238,809 244,990 6,181
229,356 238,809 238,809 244,990 6,181
$266,187 $275,207 $275,207 $281,388 $6,181
ChangeDescription FY 2016
Insur & Employee BenefitsUtilitiesMiscellaneous
36,831
18,199
18,199
36,398
18,199
18,199
36,398
18,199
18,199
36,398
Local/Other Travel
CHAPTER 4 – 44 CURRICULUM AND INSTRUCTIONAL PROGRAMS
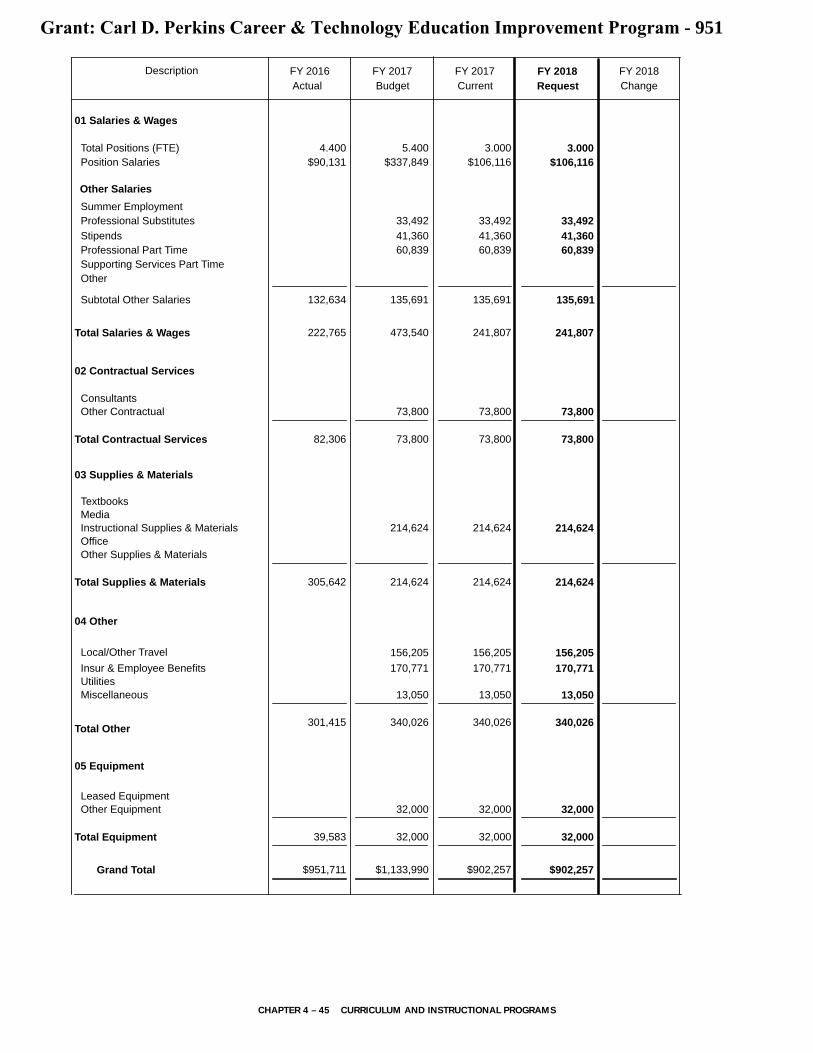
Grant: Carl D. Perkins Career & Technology Education Improvement Program - 951
Actual FY 2017Budget
FY 2017Current
FY 2018Request
FY 2018
Summer EmploymentProfessional Substitutes
Total Positions (FTE)Position Salaries
4.400$90,131
5.400$337,849
3.000$106,116
3.000$106,116
Other Salaries
01 Salaries & Wages
33,492 33,492 33,492
Stipends 41,360 41,360 41,360Professional Part Time
ConsultantsOther Contractual
OfficeOther Supplies & Materials
MediaInstructional Supplies & Materials
Textbooks
Subtotal Other Salaries
Leased Equipment
Grand Total
Other Equipment
Total Salaries & Wages
02 Contractual Services
Total Contractual Services
03 Supplies & Materials
Total Supplies & Materials
04 Other
Total Other
05 Equipment
Total Equipment
Supporting Services Part TimeOther
60,839 60,839 60,839
82,306
73,800
73,800
73,800
73,800
73,800
73,800
305,642
214,624
214,624
214,624
214,624
214,624
214,624
222,765 473,540 241,807 241,807
132,634 135,691 135,691 135,691
$951,711
39,583
32,000
$1,133,990
32,000
32,000
32,000
$902,257
32,000
32,000
$902,257
ChangeDescription FY 2016
Insur & Employee BenefitsUtilitiesMiscellaneous
301,415
170,771
13,050
340,026
170,771
13,050
340,026
170,771
13,050
340,026
Local/Other Travel 156,205 156,205 156,205156 205
CHAPTER 4 – 45 CURRICULUM AND INSTRUCTIONAL PROGRAMS
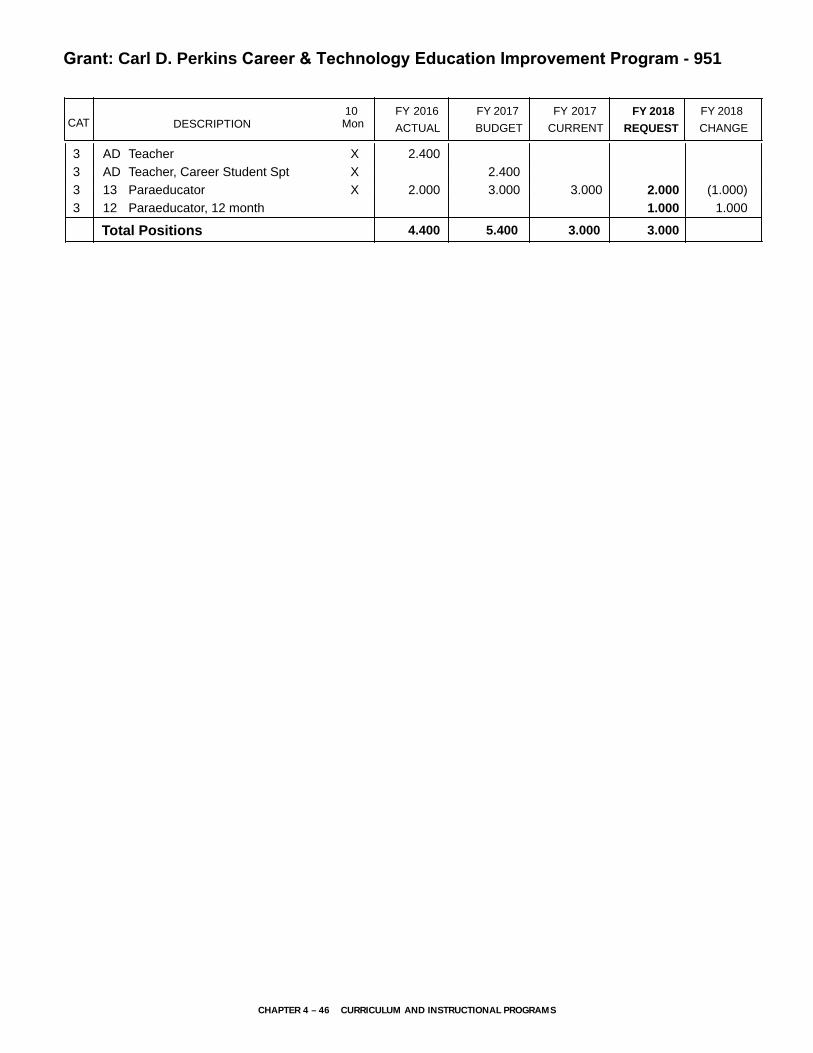
DESCRIPTION CURRENTFYBUDGET
FYACTUAL
20172016 10Mon
FY 2017CAT
Grant: Carl D. Perkins Career & Technology Education Improvement Program - 951
FY 2018CHANGE
FY 2018
REQUEST
3 2.400XTeacherAD 3 2.400XTeacher, Career Student SptAD 3 2.000 3.000 3.000XParaeducator13 (1.000)2.000
3 Paraeducator, 12 month12 1.0001.000
5.4004.400 3.000Total Positions 3.000
CHAPTER 4 – 46 CURRICULUM AND INSTRUCTIONAL PROGRAMS
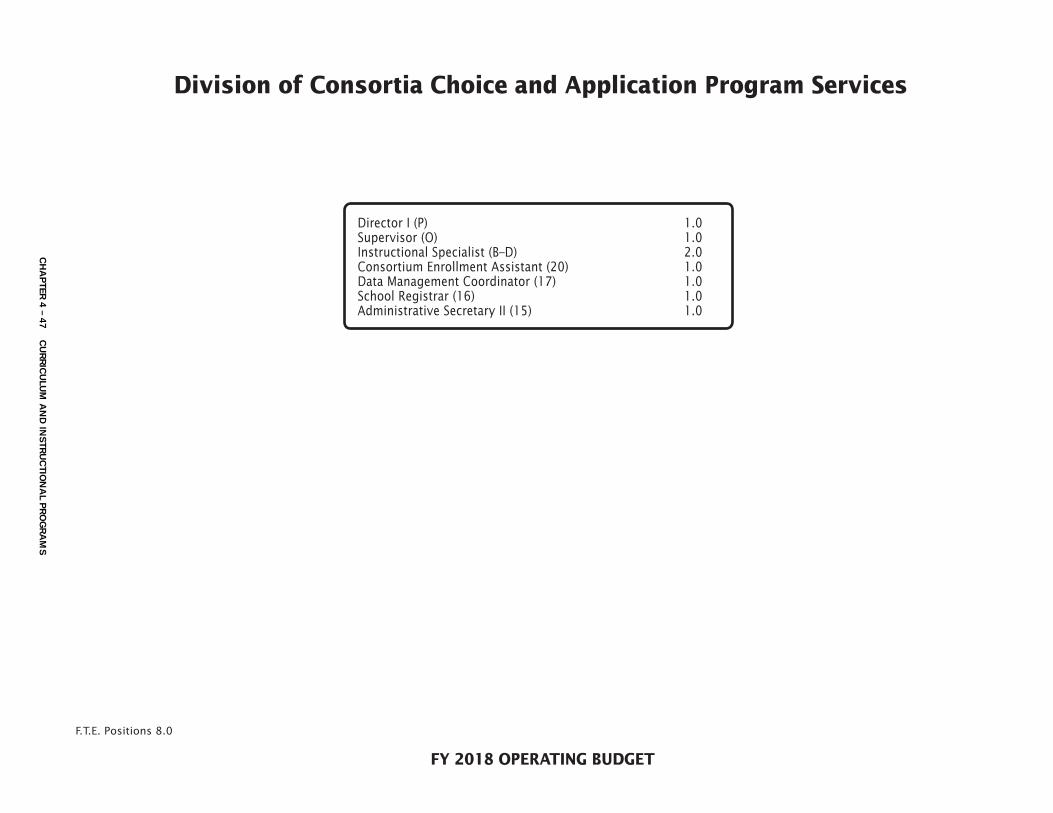
FY 2018 OPERATING BUDGET
F.T.E. Positions 8.0
Division of Consortia Choice and Application Program Services
Director I (P) 1.0Supervisor (O) 1.0Instructional Specialist (B–D) 2.0Consortium Enrollment Assistant (20) 1.0Data Management Coordinator (17) 1.0School Registrar (16) 1.0Administrative Secretary II (15) 1.0
CH
AP
TER 4 – 47 C
UR
RIC
ULU
M A
ND
INS
TRU
CTIO
NA
L PR
OG
RA
MS

Div. of Consortia Choice & Application Program Services - 213
Actual FY 2017Budget
FY 2017Current
FY 2018Request
FY 2018
Summer EmploymentProfessional Substitutes (45)
Total Positions (FTE)Position Salaries
8.000$794,662
8.000$812,471
8.000$812,471
8.000$812,471
Other Salaries
01 Salaries & Wages
45 45StipendsProfessional Part Time
ConsultantsOther Contractual
OfficeOther Supplies & Materials
MediaInstructional Supplies & Materials
Textbooks
Subtotal Other Salaries
Leased Equipment
Grand Total
Other Equipment
Total Salaries & Wages
02 Contractual Services
Total Contractual Services
03 Supplies & Materials
Total Supplies & Materials
04 Other
Total Other
05 Equipment
Total Equipment
Supporting Services Part TimeOther
26,279101
26,279101
26,425 146(101)
295
295
295
295
295
295
295
8,029
4,666526
5,192
4,666526
5,192
4,666526
5,192
830,139 838,896 838,896 838,896
35,477 26,425 26,425 26,425
$841,454 $848,058 $848,058 $848,058
ChangeDescription FY 2016
Insur & Employee BenefitsUtilitiesMiscellaneous
2,991 3,675 3,675 3,675
Local/Other Travel 3,675 3,675 3,675
CHAPTER 4 – 48 CURRICULUM AND INSTRUCTIONAL PROGRAMS

DESCRIPTION CURRENTFYBUDGET
FYACTUAL
20172016 10Mon
FY 2017CAT
Div. of Consortia Choice & Application Program Services - 213
FY 2018CHANGE
FY 2018
REQUEST
2 1.000 1.000 1.000Director IP 1.000
2 1.000 1.000 1.000SupervisorO 1.000
2 2.000 2.000 2.000Instructional SpecialistBD 2.000
2 1.000 1.000 1.000Consortium Enrollment Asst20 1.000
2 1.000 1.000 1.000Data Management Coordinator17 1.000
2 1.000 1.000 1.000School Registrar16 1.000
2 1.000 1.000 1.000Administrative Secretary II15 1.000
8.0008.000 8.000Total Positions 8.000
CHAPTER 4 – 49 CURRICULUM AND INSTRUCTIONAL PROGRAMS

Chapter 5
Special Education
Special Education PAGE
Associate Superintendent ................................................ 5-3
Resolution and Compliance Unit ............................................. 5-6
Central Placement Unit ......................................................... 5-6
Division of Business, Fiscal, and Information Systems ................. 5-9
Grant: Medical Assistance Program ..................................... 5-12
Department of Special Education Services ................. 5-16
Prekindergarten, Special Programs, and Related Services .................................................................. 5-24
Infants and Toddlers, Preschool, Special Education Programs, and InterACT................................ 5-29
Grant: Infants and Toddlers ................................................ 5-29

29.000
By Object of Expenditure
Summary of Resources
Special Education
(1.000)
OBJECT OF EXPENDITURE FY 2016 FY 2017 FY 2017 FY 2018 FY 2018ACTUAL BUDGET CURRENT BUDGET CHANGE
30.00030.000
1,944.740 508.827 (5.830)1,933.155
7,358,838
1,071,548 1,199,837 1,729,125
1,409,200 1,261,580
1,199,837
5,294,842
1,185,021
8,566,373
4,457,052
2,901,786 3,271,531 3,271,531 3,672,967 401,436
5,290,358 5,430,064 139,706
8,561,889 9,103,031 541,142
139,459,538
1,374,394
143,829,684 52,291,132 52,353,606 62,474
411,500
529,288
447,094
(147,620)
(13,448)460,542 460,542
1,616,068 1,700,869 1,700,869 1,742,011 41,142
42,293,075 42,990,062 42,990,062 45,520,981 2,530,919
44,320,643 45,151,473 45,151,473 47,710,086 2,558,613
$191,555,388 $103,054,397
POSITIONS
Administrative
TOTAL POSITIONS
01 SALARIES & WAGES
Administrative
OTHER SALARIES
Administrative
Professional
Supporting Services
TOTAL OTHER SALARIES
TOTAL SALARIES AND WAGES
02 CONTRACTUAL SERVICES
03 SUPPLIES & MATERIALS
04 OTHER
Local/Other Travel
Insur & Employee Benefits
Utilities
Miscellaneous
TOTAL OTHER
05 EQUIPMENT
GRAND TOTAL AMOUNTS
$3,955,105 $4,143,365 $4,143,365
502.997
TOTAL POSITION DOLLARS 132,100,700 135,263,311 43,729,243 43,250,575 (478,668)
$4,004,678 ($138,687)
$100,051,642 $3,002,755
8,994
$186,045,744
1.000 1.000 1.000
307.390 (3.410)
165.607 (1.420)788.920 167.027310.8001,124.820Professional
Supporting Services
29.0001.000
1,128.120775.035
31,087,009 30,817,913
8,330,266
(269,096)
8,401,151 (70,885)97,627,511
30,421,72698,557,606
32,464,622
Professional
Supporting Services
96,358 97,718 97,718 97,718Business/Operations Admin.
Business/Operations Admin.
CHAPTER 5 – 1 SPECIAL EDUCATION
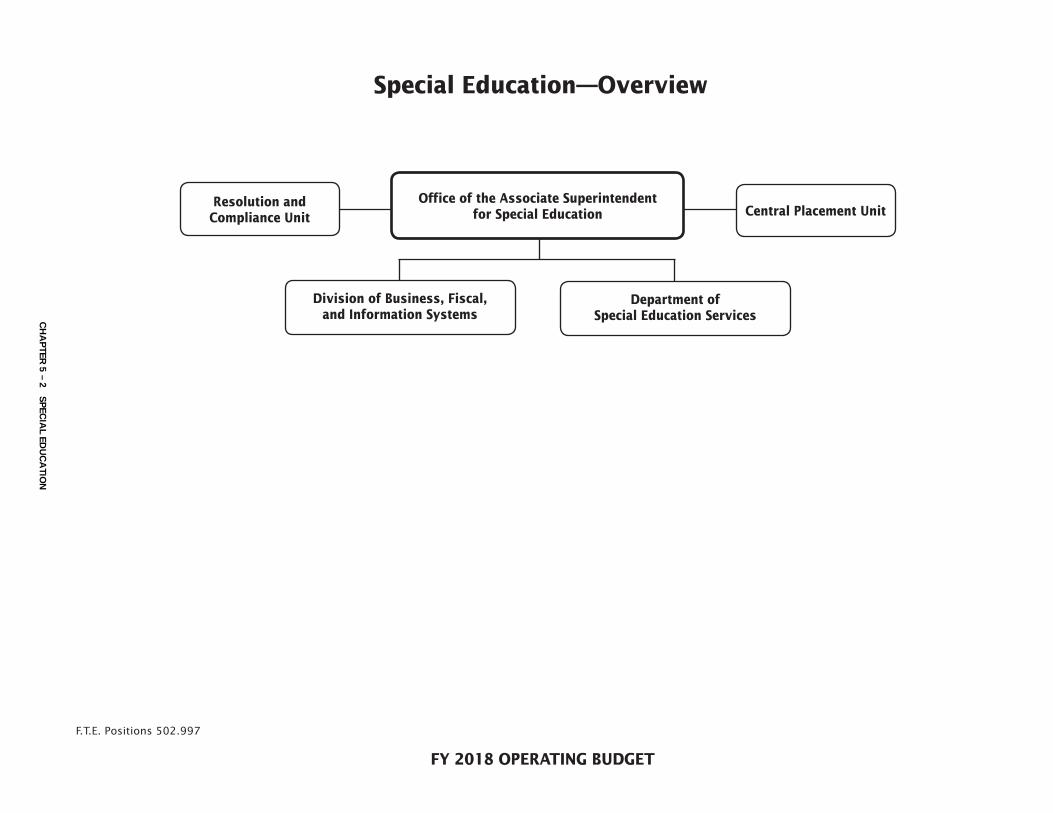
FY 2018 OPERATING BUDGET
F.T.E. Positions 502.997
Office of the Associate Superintendent for Special Education
Resolution and Compliance Unit Central Placement Unit
Special Education—Overview
Division of Business, Fiscal, and Information Systems
Department of Special Education ServicesC
HA
PTER
5 – 2 SP
ECIA
L EDU
CA
TION
Office of Special Education511/257/255
M I S S I O N The mission of the Office
of Special Education (OSE) is to clearly and
effectively communicate and engage in
meaningful collaboration with stakeholders
to ensure the success of students through
continuous improvement efforts.
MAJOR FUNCTIONSOSE provides a comprehensive, collaborative, and indi-vidualized support system offering students with dis-abilities from birth to age 21 access to high-quality and rigorous instruction within the least restrictive environ-ment (LRE). OSE develops, coordinates, and enhances efforts to align general and special education instruc-tion; and develops and monitors a broad continuum of special education service models and supports the Extended School Year (ESY) program. OSE promotes and coordinates the use of technology necessary to meet the needs of students with disabilities and provides comprehensive professional learning opportunities for offices and school-based staff members.
OSE interfaces with students, families, staff members, and community members and organizations across Montgomery County, and therefore, is closely aligned with each of the five strategic priorities. In response to the 2014–2015 Special Education Review recommen-dations, OSE continues to collaborate closely with the offices of the Chief Technology Officer, School Support and Improvement, and Student and Family Support and Engagement, in developing and focusing on the recom-mendations by:
• Conducting an analysis on the impact of elementary staffing models on student outcomes
• Enhancing key documents and other information pro-vided to parents/guardians about the IEP process and continuum of special education services
• Developing an annual mechanism to assess and report parent/guardian satisfaction with their experiences in the Individualized Education Program (IEP) process
• Providing training opportunities for parents/guard-ians to understand measurable IEP goals
• Designing and delivering professional learning opportunities for staff members focused on working with and supporting parents/guardians and families
Special Education Services (DSES) focuses on how we use resources to improve teaching and learning for
students with disabilities by increasing their access to rigorous differentiated instruction, and authentic assess-ment for learning in the LRE. Although MCPS has made steady progress in improving access to general educa-tion classes for school-age students with disabilities, we continue to explore avenues that will support inclusive opportunities and improve student outcomes. Examples of how OSE will address the strategic priorities include:
• Utilizing classroom, school/district, and external mea-sures such as the Measures of Academic Progress in reading and mathematics to gauge student progress against MCPS milestones established for all students and address the achievement gap across grades in the areas of both reading and mathematics when com-pared to the results of typical peers
• Analyzing data related to implementation of Alternate Learning Outcomes based on Curriculum 2.0 as a way to improve outcomes for non-diploma bound students
• Expanding professional learning sessions for staff members in comprehensive schools to emphasize col-laborative planning, co-teaching models, and the use of nonviolent crisis intervention techniques for gen-eral and special education teachers to meet the needs of the diverse learners in our classrooms
• Developing new models and expanding existing mod-els of prekindergarten special education services to capitalize on inclusive opportunities by enrolling non-disabled community peers in collaborative preschool special education classrooms
• Providing professional learning opportunities for staff members focused on effective implementation of reading and mathematics interventions in order to support students in the LRE
Business, Fiscal, and Information Systems DBFIS develops and implements an effective budgeting process to provide special education services through staffing, technology support, and resources for students from birth to age 21. DBFIS monitors financial and oper-ational activities to ensure compliance with required grant reporting and applicable district policies; imple-ments the Medical Assistance Program (MAP), including the verification of student eligibility, claims processing, and monitoring; as well as the Medicaid Home and Community-based Autism Waiver (Autism Waiver) pro-gram. DBFIS provides comprehensive extended school year services and services to eligible special educa-tion students enrolled in private and parochial schools. DBFIS will focus on the strategic priorities by:
• Supporting special education students in the 21st Century learning environment. Team members will be more directly involved in the design of professional
CHAPTER 5 – 3 SPECIAL EDUCATION

Office of Special Education511/257/255
learning and ongoing efforts to enhance the skill sets of staff members who support student use of these new technology advances as a way to support opera-tional excellence
• To access the maximum allowable federal revenue from MAP through the use of continuous improve-ment practices and intensive monitoring of participa-tion among providers within all schools
The Autism Waiver program is a collaborative effort that relies on its partnerships with the Maryland State Department of Education (MSDE), the Department of Health and Mental Hygiene (DHMH), and Autism Waiver service providers so that non-educational ser-vices may be provided to qualified students with autism and their families. This collaboration focuses on com-munity partnerships and engagement by:
• Strengthening partnerships with MSDE, DHMH, and Autism Waiver service providers
• Including a dedicated 0.5 Full-Time Equivalent school psychologist in the FY 2018 budget to support stu-dents more effectively and efficiently who participate in the Autism Waiver program
• Investigating options regarding the use of the MSDE IEP tool
Resolution and Compliance UnitRACU works with families to provide technical support in understanding and assessing their procedural safe-guards under the Individuals with Disabilities Educa-tion and Section 504 of the Rehabilitation of 1973. RACU facilitates requests for administrative reviews, media-tion, due process hearings, and responds to the Office of Civil Rights and MSDE complaints; and provides pro-fessional learning opportunities for offices and school-based staff members related to compliance. To enhance excellence on strategic priorities, RACU will be:
• Revising the Section 504 of the Rehabilitation of 1973 guidance documents and forms to ensure alignment with procedural requirements
• Collaborating with OCTO to transition to an online Section 504 Plan to enhance our ability to efficiently report data and monitor student outcomes
• Providing central office and school-based staff mem-bers with professional learning to support compli-ance with the implementation of the Section 504 of the Rehabilitation of 1973
• Using data from parent/guardian surveys regarding their experiences during IEP meetings to identify pro-fessional learning needs of staff members in establish-ing a welcoming environment
Central Placement UnitIn response to IDEA and COMAR mandates to provide a continuum of services from least to more restrictive, the Central Placement Unit (CPU) ensures that IEP services to students in nonpublic programs are delivered in com-pliance with all regulations.
CPU also plays a key role in identifying opportunities to expand services in public programs in order to prevent students with disabilities from having to enter more restrictive nonpublic programs.
Our focus is on increasing access to less restrictive set-tings with more rigorous instruction by identifying groups of students who are at risk for placement in non-public settings and identifying services that can be put into place within comprehensive public schools to pre-vent nonpublic placements.
CPU analyzed students who were considered for a new nonpublic program during the time period of July 1, 2014 through June 30, 2015. During that time, students with autism and students with ED represented 73.6 per-cent of the new referrals to more restrictive nonpublic programs. In FY 2016 and FY 2017, MCPS obtained a Public/Private Partnership grant from MSDE to contract with a nonpublic provider for mental health and behav-ioral support services for students who were at risk for referral to a nonpublic setting. Licensed clinical social workers funded by this grant provided students with significant social-emotional challenges the crisis inter-vention, individual counseling, emergency assessments and home visits that were required in order to serve them in public schools. The unit will continue to moni-tor quarterly nonpublic referral data in order to measure our success in meeting student needs.
CHAPTER 5 – 4 SPECIAL EDUCATION

Office of Special Education511/257/255
OVERVIEW OF BUDGET CHANGES
FY 2018 RECOMMENDED BUDGET
The FY 2018 recommended budget for this office
is $48,919,816, an increase of $2,727,764 over the
current FY 2017 budget. An explanation of this
change follows.
Same Service Level Changes—$2,789,477Student Enrollment—$1,667,115There is a net increase of $1,667,115 for tuition for stu-dents served in nonpublic schools. Funding is included to account for a net budget-to-budget increase of 34 stu-dents over the 565 students budgeted for FY 2017.
Realignments to Meet Expenditure Requirements and Program Priorities—$258,461There are several realignments budgeted to address priority spending needs within this office. There is a realignment decreasing contractual services by $38,292 to fund a 0.6 instructional specialist position and $44,153. There also is a realignment of $2,600 from local travel mileage reimbursement in the Department of Special Education Services and Support to this office. In addi-tion, there is a realignment of $250,000 from the Spe-cial Education School-Based Programs and Services in Chapter 1, Schools to fund professional part-time sala-ries in this office.
Other—$863,901A projected rate increase of 1.5 percent for tuition for students in nonpublic settings requires a budgetary increase of $863,901.
Program Efficiencies and Reductions—($61,713)The FY 2018 recommended budget for this office includes a comprehensive effort to identify potential program efficiencies and reductions. Stakeholders, including community partners and employee union representatives, participated in the program efficiencies and reduction process.
Within the Office of Special Education, there are reduc-tions totaling $61,713. This amount includes $38,837 for the reduction of a 1.0 secretary position. Responsibilities will be reassigned to other office staff to ensure a seam-less transition of services provided. In addition, $3,239 for testing materials and $19,637 for legal settlement fees is reduced based upon prior year spending trends.
CHAPTER 5 – 5 SPECIAL EDUCATION

FY 2018 OPERATING BUDGET
Office of the Associate Superintendent for Special Education
F.T.E. Positions 28.1
Associate Superintendent 1.0Assistant to Associate Superintendent (N) 1.0Instructional Specialist
(Research and Data Analysis) (B–D) 1.0Fiscal Supervisor (27) 1.0Administrative Services Manager I (17) 1.0Administrative Secretary III (16) 1.0
Division of Business, Fiscal, and Information Systems
Department of Special Education Services
Resolution and Compliance Unit
Supervisor (O) 1.0Instructional Specialist (B–D) 3.6Paralegal (18) 1.0Administrative Secretary I (14) 1.0Secretary (12) 1.0
Central Placement Unit
Supervisor (O) 1.0Coordinator (N) 1.0Instructional Specialist (B–D) 6.0Psychologist (B–D) 2.5Teacher, Resource (A–D) 1.0Administrative Secretary I (14) 1.0Secretary (12) 2.0
CH
AP
TER 5 – 6 S
PEC
IAL ED
UC
ATIO
N

Office of Special Education - 511/255/257
Actual FY 2017Budget
FY 2017Current
FY 2018Request
FY 2018
Summer EmploymentProfessional Substitutes
Total Positions (FTE)Position Salaries
28.500$2,741,484
28.500$2,901,319
28.500$2,901,319
28.100$2,906,635
Other Salaries
01 Salaries & Wages
StipendsProfessional Part Time
ConsultantsOther Contractual
OfficeOther Supplies & Materials
MediaInstructional Supplies & Materials
Textbooks
Subtotal Other Salaries
Leased Equipment
Grand Total
Other Equipment
Total Salaries & Wages
02 Contractual Services
Total Contractual Services
03 Supplies & Materials
Total Supplies & Materials
04 Other
Total Other
05 Equipment
Total Equipment
Supporting Services Part TimeOther
140,1204,404
140,1204,404
351,8284,208
211,708(196)
123,215
209,637
209,637
209,637
209,637
190,000
190,000 (19,637)
(19,637)
14,991
3,23915,983
19,222
3,23915,983
19,222
16,179
16,179
(3,239)196
(3,043)
2,857,815 3,045,843 3,045,843 3,262,671 216,828
116,331 144,524 144,524 356,036 211,512
$44,972,082 $46,192,052 $46,192,052 $48,919,816 $2,727,764
ChangeDescription FY 2016
(.400)$5,316
Insur & Employee BenefitsUtilitiesMiscellaneous
41,976,061
42,902,922
42,917,350
42,902,922
42,917,350
45,433,938
45,450,966
2,531,016
2,533,616
Local/Other Travel 14,428 14,428 17,028 2,600
CHAPTER 5 – 7 SPECIAL EDUCATION

DESCRIPTION CURRENTFYBUDGET
FYACTUAL
20172016 10Mon
FY 2017CAT CHANGE
2018FY
Office of Special Education - 511/257/255
REQUEST
2018FY
511 Office of Special Education
1 1.000 1.000 1.000Associate Superintendent 1.000
1 1.000 1.000 1.000Asst. to Assoc SuptN 1.000
6 1.000 1.000 1.000Instructional SpecialistBD 1.000
1 1.000 1.000 1.000Fiscal Supervisor27 1.000
1 1.000 1.000 1.000Admin Services Manager I17 1.000
1 1.000 1.000 1.000Administrative Secretary III16 1.000
6.000 6.000 6.000Subtotal 6.000
257 Resolution & Compliance Unit
6 1.000 1.000 1.000SupervisorO 1.000
6 3.000 3.000 3.000Instructional SpecialistBD .6003.600
6 1.000 1.000 1.000Paralegal18 1.000
6 1.000 1.000 1.000Administrative Secretary I14 1.000
6 1.000 1.000 1.000Secretary12 1.000
7.000 7.000 7.000Subtotal .6007.600
255 Central Placement Unit
6 1.000 1.000 1.000SupervisorO 1.000
6 1.000 1.000 1.000CoordinatorN 1.000
6 6.000 6.000 6.000Instructional SpecialistBD 6.000
3 2.500 2.500 2.500PsychologistBD 2.500
6 1.000 1.000 1.000XTeacher, Resource Spec EdAD 1.000
6 1.000 1.000 1.000Administrative Secretary I14 1.000
6 3.000 3.000 3.000Secretary12 (1.000)2.000
15.500 15.500 15.500Subtotal (1.000)14.500
28.50028.500 28.500Total Positions (.400)28.100
CHAPTER 5 – 8 SPECIAL EDUCATION

Division of Business, Fiscal, and Information Systems241/939
M I S S I O N The mission of the Division
of Business, Fiscal and Information Systems
(DBFIS) is to manage services, value
collaboration, and consistently respond to
and respect the needs of special education
students, staff members, and parents
countywide.
MAJOR FUNCTIONSAdministrative Support and Program Coordination/Monitoring
DBFIS ensures that financial and student data are effi-ciently collected and monitored and that the information is used to strategically budget federal, state, and local funds. This work drives our efforts to strategically sup-port the Office of Special Education and our schools as we strive to improve teaching and learning, focus on accountability, maintain excellent services to schools and ensure efficient and timely operations. Budget development and implementation are key components of the work. In order to implement the varied require-ments linked to the operational requirements of the Individual with Disabilities Education Act, the Medicaid Assistance Program (MAP), and the Medicaid Home and Community-based Autism Waiver program (Autism Waiver), key units aligned to these functions are housed in DBFIS. These units, including the Extended School Year and Private and Parochial School group, Fiscal Management, which includes fiscal monitoring of non-public school accounts, the Online Administrative Stu-dent Information System/Special Services (O/SS), the Medicaid unit, the Technology Team, and the Autism Waiver section form the basis of this division. Each unit engages in continuous improvement efforts and strives for operational excellence so that schools will be pro-vided with the resources and supports needed to serve students with disabilities.
The DBFIS Technology Team is focused on improving teaching and learning through an emphasis on sup-porting special education students in the 21st. Century learning environment. The team identifies specific appli-cations that supplement existing technology and new devices as a way to enhance teaching and learning by ensuring access to instruction for students with disabili-ties. Extensive data was collected on offices and school-based staff requests for support. Available technology is making a significant difference in the lives of students
with disabilities. For example, we are exploring the use of current technology, such as iPads and Chromebooks, with specific applications that enhance communication, support engagement, and reinforce skills linked to the goals of individual students. Results indicated a need to identify and deploy specialized technology linked in order for students to achieve individualized outcomes. As a result, the Technology Team will be more directly involved in the design of professional learning and ongoing efforts to enhance the skill sets of staff mem-bers who support student use of these new technology advances as a way to support operational excellence.
The Autism Waiver is a collaborative effort that relies on its partnerships with MSDE, the Department of Health and Mental Hygiene, and Autism Waiver service provid-ers so that non-educational services may be provided to qualified students with autism and their families. This collaboration reflects our focus on community partner-ships and engagement. Through the Autism Waiver, students and families receive respite care and a wide range of services that help to ensure that a student can remain in their home to the maximum extent pos-sible. This allows students to better access their educa-tional program on a daily basis. To remain eligible for the Autism Waiver, a school psychologist is required to complete a Level of Care (LOC) assessment for each stu-dent annually. During FY 2016, each student’s assigned school psychologist administered the complex LOC assessment to over 250 students. Ongoing training is required to ensure consistency and accuracy, along with flexible scheduling and coordination to meet timelines. To increase operational excellence and enhance support to students and families, the FY 2018 budget includes a dedicated 0.5 Full Time Equivalent school psycholo-gist to be assigned to the Autism Waiver Unit. An esti-mated 450 total hours of work efficiency will be gained by school psychologists who were previously assigned to complete LOC assessments through the implemen-tation of this more efficient and effective model. The school psychologist in this position will have the expe-rience and expertise to provide the support to families and students who participate in the Autism Waiver and help to ensure that much needed services are available.
The O/SS unit is focused on operational excellence through collaboration with MSDE, the Office of the Chief Technology Officer (OCTO), and Montgomery County Public Schools (MCPS) stakeholders to collect, manage and monitor the online Individualized Educa-tion Program (IEP) process, comply with state report-ing timelines, and produce comprehensive IEP reports for various special programs. O/SS and OCTO meet on a regular basis to propose and develop enhancements
CHAPTER 5 – 9 SPECIAL EDUCATION
Division of Business, Fiscal, and Information Systems241/939
and system updates to ensure that the online IEP sys-tem is in compliance with MSDE. O/SS is responsible for the annual MSDE Child and Exit Counts that are used to determine funding. The following strategies were implemented to develop a more efficient process to vali-date the data MCPS submits to MSDE:
• Complete analysis of errors and develop a process to complete required changes
• Analyze Enrollment Reports to identify students who have not been enrolled or withdrawn following estab-lished procedures
• Provide quarterly reports of overdue IEPs to Depart-ment of Special Education Services cluster supervi-sors for follow up
• Provide technical assistance directly to schools to assist them with meeting the IEP process timelines
MCPS is working with MSDE to investigate options regarding the use of the state’s online IEP tool in the future. A transition to the MSDE IEP tool requires fund-ing for professional development for special education staff members on the use of the tool, as well as funds to support the technology requirements when shifting from one platform to another.
An additional component of our efforts to achieve oper-ational excellence centers on MAP, which enables MCPS to receive federal Medicaid funding for eligible IEP health-related services, including speech and language, occupational and physical therapies, audiological ser-vices, specified social work services and case manage-ment service coordination. MAP funding supplements existing special education services including staffing and instructional materials. MSDE audit data and self-monitoring indicated a need for more comprehensive health-related progress notes, process improvement to ensure effective communication with parents/guard-ians regarding case management interactions, and a more rapid identification of student Medicaid eligibil-ity. As a result, DBFIS MAP staff members worked with supervisors and specialists from the Division of Prekin-dergarten, Special Programs, and Related Services to implement a “universal” automated progress note cap-ture instrument. In addition, design and implementation of standardized two-way case management processes for the federally required annual notification of parents/guardians will be used this year. A critical next step is to collaborate with OCTO to develop a more timely notification of student Medical Assistance eligibility to ensure that all available funding opportunities are cap-tured. These current and pending efforts will ensure that MCPS is able to better account for and maximize access to eligible federal revenue through MAP and
apply this revenue to improve services to our students with disabilities.
Budget Development and AdministrationThe essential work of DBFIS to develop, implement, and monitor the special education budget and school based staffing allocations incorporates both a focus on human capital, operational excellence and community partner-ships. DBFIS staff members organize and analyze data from O/SS when developing the special education bud-get. The enrollment of students with disabilities and the settings in which they receive services drives the bud-get planning and preparation process, including fund-ing for students placed in nonpublic special education schools. Current enrollment and trend data are used to allocate special education personnel and fund nonpublic placements. The process to develop and submit federal and state grants is strategically planned to both focus on identified needs and ensure that timelines are met. Close monitoring of federal, state, and local funds is key to ensuring that we are operating in alignment with fiscal regulations and implementing programs and services as described in the grants. Grant funds are allocated to support the identified professional learning needs of school based staff members who provide services to students with disabilities across multiple environments. Student outcome data is critical to the establishment of professional learning priorities. DBFIS is collaborating with the Office of Curriculum and Instructional Pro-grams and OCTO to implement a shared professional development calendar as a way to increase the efficiency of professional learning opportunities and to monitor and limit the amount of time school staff members are out of the classroom. This online tool will provide a high level of data collection to include a range of data for each professional learning session. This data will support a model for professional learning that crosses offices and better meets the needs of MCPS staff members.
Project Management DBFIS is responsible for monitoring the investment of resources and is currently investigating the effective-ness of programs through the Special Education Review Accountability Project Team. The Accountability Project Team is collaborating with the Office of Shared Account-ability to evaluate the elementary schools special educa-tion staffing models. An additional recommendation is to develop a plan to measure parent/guardian experiences with the special education process as a way to gather feedback that will be used to develop professional learn-ing opportunities for staff members and parents/guard-ians and to promote a positive, collaborative climate.
CHAPTER 5 – 10 SPECIAL EDUCATION

Division of Business, Fiscal, and Information Systems241/939
MEASURESM E A S U R E : To access the maximum allowable fed-eral revenue from MAP through the use of continuous improvement practices and intensive monitoring of par-ticipation among providers within all schools.Revenue Collection—FY 2016 actual: 1 percent over target revenue
FY 2017 estimate: to meet or exceed target revenue
FY 2018 recommended: meet or exceed target revenue through ongoing support and monitoring
E X P L A N A T I O N : This measure indicates revenue generated by matching recommended IEP services with the MAP fee-for-services claim processing that can be used to support and enhance special educational services.
M E A S U R E : To increase participation in MAP form sub-missions by providers within each school. Average provider participation—FY 2016 actual: 94 percent
FY 2017 projected: 95 percent or above
FY 2018 recommended: equal to or greater than FY 2017
E X P L A N A T I O N : Increased form submission provides for greater reimbursement revenue.
M E A S U R E : This measure indicates the successful completion of data reporting to MSDE by maintaining a less than 2 percentage error rate for Child Count and a decreasing number of errors on exit count.
State Reporting Errors 2013 2014 2015 2016
Child Count <2% <2% <2% Not Yet Available
Exit Count 335 189 133 54
E X P L A N A T I O N : Maintaining a less than 2 percent error rate in reporting demonstrates a high level of accuracy in the funding provided by the state to MCPS.
M E A S U R E : To continue to expand iPad technology in the 21st. Century Learning Space FY 2018 projection: 10 percent expansion of iPads to
special education programs
FY 2018 projection: 15 percent expansion of specific disability related applications
E X P L A N A T I O N : To provide programmatic access through the use of technology for students with IEPs.
OVERVIEW OF BUDGET CHANGES
FY 2018 RECOMMENDED BUDGET
The FY 2018 recommended budget for this office
is $3,345,987, an increase of $760,577 over the
current FY 2017 budget. An explanation of this
change follows.
Same Service Level Changes—$147,879Realignments to Meet Expenditure Requirements and Program Priorities—$137,479There are several realignments budgeted to address priority spending needs within this division. There are realignments decreasing local travel mileage reimburse-ment, office supplies, and contractual maintenance by $12,848 to fund increases in cell phone and data device support for $9,956 and supporting services part-time salaries for $1,097. In addition, there is a realignment of $139,274 from the Special Education School-Based Pro-grams and Services in Chapter 1, Schools to fund sti-pends in this division.
Other—$10,400In order to meet the needs of this division, there is a net increase of $10,400, which includes $10,000 for profes-sional part-time assessments, $100 for training supplies, and $300 for dues, registration, and fees.
Program Efficiencies and Reductions—($42,052)The FY 2018 recommended budget for this office includes a comprehensive effort to identify potential program efficiencies and reductions. Stakeholders, including community partners and employee union representatives, participated in the program efficiencies and reduction process.
There is a reduction of $42,052 for the reduction of a 1.0 administrative secretary I position. Responsibilities will be reassigned to other division staff to ensure a seamless transition of services provided.
Strategic Accelerator—$654,750Focus on Learning, Accountability and ResultsFor FY 2018, an additional $654,750 is added to this bud-get to implement a new online Individualized Education Program (IEP)/504 system, allowing MCPS to analyze IEP data and access other tools including providing sup-port students with disabilities in early childhood, as well as secondary transitions.
CHAPTER 5 – 11 SPECIAL EDUCATION

Division of Business, Fiscal, and Information Systems241/939
Grant: Medical Assistance Program—939
FY 2018 RECOMMENDED BUDGETThe FY 2018 recommended budget for this grant is $5,117,501, an increase of $106,979 over the FY 2017 bud-get. An explanation of this change follows.
Same Service Level Changes—$106,979Realignments to Meet Expenditure Requirements and Program Priorities—$106,979It is projected that MCPS will receive increased revenue for FY 2018, and as a result there is a program increase of $106,979 to support one-on-one paraeducator ser-vices. In addition, there are several realignments bud-geted to address priority spending needs within this grant, including reductions in consultants and offsetting increases in employee benefits and other program costs.
Program’s Recent Funding HistoryFY 2017Budgeted7/1/16
FY 2017Projected11/30/16
FY 2018Projected7/1/17
Federal $5,010,522 $5,160,546 $5,117,501
Total $5,010,522 $5,160,546 $5,117,501
CHAPTER 5 – 12 SPECIAL EDUCATION

FY 2018 OPERATING BUDGET
Division of Business, Fiscal, and Information Systems
F.T.E. Positions 71.0
* Positions are funded by the Grant—Medical Assistance Program
Grant—Medical Assistance Program
Teacher, Special Education (A–D) 3.5Project Specialist (27) 1.0Fiscal Assistant V (22) 1.0Account Assistant III (14) 1.0Paraeducator, Itinerant (13) 51.4
Budget, Communications, and Data/Parentally Placed
Instructional Specialist (B–D) 2.0IT Systems Specialist (18–25) 2.0Fiscal Specialist I (24) 2.0Tech Help Desk Assistant (18) 1.0Fiscal Assistant IV (18) 1.6
Autism Waiver*
Coordinator (N)* 1.0Psychologist (B–D)* 10-month 0.5
Director I (P) 1.0Instructional Specialist (B–D) 1.0Administrative Secretary II (15) 1.0
CH
AP
TER 5 – 13 S
PEC
IAL ED
UC
ATIO
N

Division of Business, Fiscal, & Information Systems - 241/939
Actual FY 2017Budget
FY 2017Current
FY 2018Request
FY 2018
Summer EmploymentProfessional Substitutes
273,382 273,382 273,221 (161)
Total Positions (FTE)Position Salaries
73.400$3,495,989
71.500$3,859,129
71.500$3,859,129
71.000$3,816,825
Other Salaries
01 Salaries & Wages
5,545 5,545 5,545
Stipends 139,274 139,274Professional Part Time
ConsultantsOther Contractual
OfficeOther Supplies & Materials
MediaInstructional Supplies & Materials
Textbooks
Subtotal Other Salaries
Leased Equipment
Grand Total
Other Equipment
Total Salaries & Wages
02 Contractual Services
Total Contractual Services
03 Supplies & Materials
Total Supplies & Materials
04 Other
Total Other
05 Equipment
Total Equipment
Supporting Services Part TimeOther
169,412883,460
169,412883,460
179,412991,250
10,000107,790
888,333
31,725892,475
924,200
31,725892,475
924,200
1,539,125
1,539,125 614,925
646,650(31,725)
28,822
12,0461,307
13,353
12,0461,307
13,353
10,1901,407
11,597
100(1,856)
(1,756)
3,694,031 5,190,928 5,190,928 5,405,527 214,599
198,042 1,331,799 1,331,799 1,588,702 256,903
$6,263,869 $7,595,932 $7,595,932 $8,463,488 $867,556
ChangeDescription FY 2016
(.500)($42,304)
Insur & Employee BenefitsUtilitiesMiscellaneous
1,652,683
1,417,699
39,000
1,467,451
1,417,699
39,000
1,467,451
1,447,826
50,156
1,507,239
30,127
11,156
39,788
Local/Other Travel 10,752 10,752 9,257 (1,495)
CHAPTER 5 – 14 SPECIAL EDUCATION

DESCRIPTION CURRENTFYBUDGET
FYACTUAL
20172016 10Mon
FY 2017CAT CHANGE
2018FY
Division of Business, Fiscal, & Information Systems - 241/939
REQUEST
2018FY
241 Div. Business, Fiscal, & Info Systems
6 1.000 1.000 1.000Director IP 1.000
6 3.000 3.000 3.000Instructional SpecialistBD 3.000
6 2.000 2.000 2.000IT Systems Specialist25 2.000
6 2.000 2.000 2.000Fiscal Specialist I24 2.000
6 1.600 1.600 1.600Fiscal Assistant IV18 1.600
6 1.000 1.000 1.000Technical Help Desk Asst18 1.000
6 1.000 1.000 1.000Administrative Secretary II15 1.000
6 1.000 1.000 1.000Administrative Secretary I14 (1.000)
12.600 12.600 12.600Subtotal (1.000)11.600
939 Grant - Medical Assistance Program
6 1.000 1.000 1.000CoordinatorN 1.000
6 Psychologist - 10 MonthBD .500.500
6 3.500 3.500 3.500XTeacher, Special EducationAD 3.500
6 1.000 1.000 1.000Project Specialist27 1.000
6 1.000 1.000 1.000Fiscal Assistant V22 1.000
6 1.000 1.000 1.000Account Assistant III14 1.000
6 53.300 51.400 51.400XSpec Ed Itinerant Paraeducator13 51.400
60.800 58.900 58.900Subtotal .50059.400
71.50073.400 71.500Total Positions (.500)71.000
CHAPTER 5 – 15 SPECIAL EDUCATION

Department of Special Education Services250/251/271/245/249/252/253/254/256/258/259/277/276/278/930
M I S S I O N The mission of the
Department of Special Education Services
(DSES) is to provide, implement, and monitor
the delivery of a seamless continuum of
services for students with disabilities, from
birth through age 21, to prepare for college,
career, and community readiness.
MAJOR FUNCTIONSSchool-Based Services
The Individuals with Disabilities Education Act (IDEA) and Code of Maryland Regulations (COMAR) mandate that “to the maximum extent appropriate” students with disabilities will be “educated with children who are not disabled.” In addition to this least restrictive environ-ment (LRE) mandate, IDEA regulations require school districts to ensure that a student with disabilities is edu-cated in the school they would attend if nondisabled, unless their Individualized Education Program (IEP) requires some other arrangement.
The focus of DSES is using resources to improve teach-ing and learning for students with disabilities by increas-ing their access to rigorous differentiated instruction and authentic assessment for learning in the LRE. The opportunity to receive instruction in general education classrooms and interact with nondisabled peers leads to success for students with disabilities. To evaluate our progress, LRE data and student outcome data are ana-lyzed at the individual student level, the program and school level, and the state level. The department uses Results Driven Accountability meetings to evaluate our performance.
The Maryland State Department of Education (MSDE) sets LRE targets for local school systems which require students with disabilities to receive special education and related services in a general education setting or a combined general education and special education set-ting. The current MSDE targets are to increase LRE A (in general education greater than 80 percent of the day) and decrease LRE C (removed from general education greater than 60 percent of the day—i.e., self-contained classrooms). It is assumed that as the number of stu-dents in LRE C decreases, students will transition into more inclusive environments. The LRE target ensures that established standards are met and holds schools and local school systems accountable for student access
to general education classrooms. In FY 2016, with 66.3 percent of students with disabilities being served in the general education environment, MCPS did not meet the increased MSDE target of 69.9 percent. In the same fis-cal year, 13.4 percent of students with disabilities were served in LRE C, which missed the decreased MSDE target of 5.95 percent.
Although MCPS has made steady progress in improv-ing access to general education classes for school-age students with disabilities, we continue to explore avenues that will support inclusive opportunities and improve student outcomes. For example, the elementary Home School Model (HSM) provides special education services to students in general education classrooms in their home schools. The HSM model considers each school’s total number of students with IEPs and the total number of instructional IEP hours needed within the school. HSM special education teachers are allocated based on a guideline linked to this data. In FY 2017, the number of HSM elementary schools increased from 68 to 88 schools. Each new HSM school will be provided with a series of professional learning sessions designed to build the capacity of staff members to instruct stu-dents with more complex disabilities. This initiative will increase access for students to special education ser-vices within their neighborhood schools and to inclu-sion opportunities. LRE and student outcome data will be monitored to analyze the impact of this staffing model change as a part of the work of the Special Educa-tion Review Accountability Project Team.
The Every Student Succeeds Act holds schools account-able for improved educational outcomes for all students and mandates testing and disaggregation of test results to show progress for students with disabilities. DSES is committed to using multiple data points to evaluate student achievement in alignment with the system goal of ensuring academic excellence for all. An analysis of the FY 2016 Partnership for Assessment of Readiness for College and Career (PARCC) revealed an achieve-ment gap across grades in the areas of both reading and mathematics when compared to the results of typical peers.
• In English Language Arts/Literacy for Grades 3 through 8 and Grade 10 English, the percentage of students with IEPs who achieved Level 3, 4, or 5, approaching, meeting, or exceeding PARCC expecta-tions, in comparison to their general education peers, reflects an achievement gap range of 45.1 percent-age points in Grade 6 to 32.7 percentage points in Grade 10.
CHAPTER 5 – 16 SPECIAL EDUCATION

Department of Special Education Services250/251/271/245/249/252/253/254/256/258/259/277/276/278/930
• In mathematics for Grades 3 through 8, the percent-age of students who achieved Level 3, 4, or 5, reflects an achievement gap range of 34.8 percentage in Grade 3 to 39 percentage points in Grade 6.
In the future, the department will utilize classroom, school/district, and external measures such as the Mea-sures of Academic Progress in reading and mathematics to gauge student progress against MCPS milestones set for all students.
In order to narrow the achievement gap of students with disabilities, DSES supervisors, instructional specialists, and itinerant resource teachers develop and imple-ment professional learning opportunities to improve the instructional outcomes for students with disabili-ties in the LRE. In FY 2017, grant funds in the amount of $109,593 were utilized to provide mandatory profes-sional learning opportunities offered to both general and special education teachers with the goal of expanding capacity to implement evidence-based strategies that benefit all students during instruction. It is anticipated that in FY 2018, the system will need to expand profes-sional learning opportunities that emphasize collabora-tive planning and co-teaching models for general and special education teachers in order to meet the needs of the diverse learners in our classrooms.
For FY 2018, Special education school-based resources that provide direct services to students are realigned from Chapter 5 to Chapter 1, Schools. For more details on the budget associated with this realignment, please refer to Chapter 1, Schools.
Prekindergarten, Special Programs, and Related Services
In accordance with IDEA and COMAR, the Division of Prekindergarten, Special Programs, and Related Ser-vices (DPSPRS) ensures the infrastructure is in place to support a seamless, comprehensive and coordinated system of services for young students with disabilities and their families, ages birth to kindergarten. DPSPRS ensures the provision of a free appropriate public edu-cation by offering specially designed services to meet the unique needs of students with physical disabili-ties, autism spectrum disorders, emotional disabilities, speech/language and hearing and/or vision impair-ments, and developmental delays. Related services of speech/language, occupational, and physical therapy are provided to students with disabilities throughout the school district.
Staff members from the Emotional Disabilities (ED) Services unit in DPSPRS provide a variety of behavioral techniques and supports to ensure that students receive access to high-quality instruction. Social workers and behavior support teachers deliver ongoing consultation to school-based staff members on behavior manage-ment strategies and social skills instruction, and facilitate the development of Functional Behavioral Assessments and Behavioral Intervention Plans.
The division is committed to providing services to stu-dents with ED in comprehensive schools to ensure access to high-quality, rigorous instruction with nondis-abled peers. In order to achieve at high levels, students with ED must be fully engaged in classroom instruction and receive appropriate services in general education to the greatest extent possible. An overreliance on punitive consequences such as suspension and expulsion leads to lower academic achievement.
Our focus is on reducing the suspension and expulsion risk ratio, the measure of risk for multiple suspensions of students with disabilities. In FY 2015, MCPS had a risk ratio of 2.78, failing to meet the MSDE target of less than 2.0. The division continues to strive to identify strate-gies to reduce the risk of suspension and expulsion. School administrators and staff members in compre-hensive schools must enhance their skills in restorative practices and conflict resolution. MCPS implemented a restorative justice pilot program in nine middle schools and two high schools this year, after providing profes-sional learning sessions for all administrators and key staff members during FY 2015 and 2016. Division efforts involve a focus on prevention of violent behaviors at the earliest possible stage. In FY 2017, grant funds in the amount of $74,995 were utilized to provide professional learning focused on de-escalation techniques, crisis intervention, and safe physical restraint. These tech-niques are designed to promote dialogue, repair rela-tionships, and resolve conflicts peacefully. In FY 2018, it is anticipated that the system will require an expansion of professional learning sessions reaching a wide range of school administrators and staff members in compre-hensive schools. The division is anticipating that the use of nonviolent crisis intervention techniques will result in students remaining in the classroom where teaching and learning take place.
For FY 2018, Special education school-based resources that provide direct services to students are realigned from Chapter 5 to Chapter 1, Schools. For more details on the budget associated with this realignment, please refer to Chapter 1, Schools.
CHAPTER 5 – 17 SPECIAL EDUCATION

Department of Special Education Services250/251/271/245/249/252/253/254/256/258/259/277/276/278/930
Infants and Toddlers, Prekindergarten Special Education Programs, and InterAct
MCPS is committed to increasing inclusive opportuni-ties for prekindergarten students with disabilities to ensure that children enter kindergarten fully ready to learn. Providing prekindergarten special education ser-vices in regular early childhood settings continues to be challenging due to the limited number of regular pre-kindergarten programs and services available in the sys-tem. Over the past several years, MCPS has collaborated with community childcare centers and the Division of Title I and Early Childhood Services to increase the number of students with disabilities receiving services in co-located regular early childhood settings. However, MCPS has not achieved the state LRE targets designed to ensure that children enter kindergarten demonstrat-ing positive social emotional skills, appropriate behav-iors, and knowledge.
The focus is on developing new models and expanding existing models of prekindergarten special education services to capitalize on inclusive opportunities. Increas-ing access to high-quality, rigorous instruction in the general education curriculum with nondisabled peers leads to enhanced early childhood outcomes.
In FY 2016, 42.58 percent of students received services in a regular early childhood setting, falling short of MSDE targets. In order to reach the 65.1 percent state target in FY 2018, MCPS will increase the number of classes enrolling nondisabled community peers and the num-ber of collaborative classes that integrate our MCPS pre-kindergarten classes with preschool classes for students with disabilities. A proposed model of co-teaching in general education prekindergarten classes will enable teachers to serve a greater number of students with dis-abilities alongside of their nondisabled peers.
In the FY 2018 recommended budget, a shift in the ser-vice delivery model for prekindergarten student with disabilities is proposed. In order to better meet the needs of students and families, we will offer Preschool Educa-tion Program (PEP) classes as either a 2.5 hour or a 5.0 hour model, five-days a week. This will allow students to attend PEP classes closer to their homes, reducing travel time, and better integrating students and families into the life of their neighborhood. Differentiated staffing guidelines will ensure that students and families receive the services needed to ensure progress.
In FY 2018, we plan to continue to offer professional learning opportunities to staff members to incorporate Social and Emotional Foundations for Early Learn-ing (SEFEL), an evidence-based program, into their
instruction. SEFEL includes a job embedded coach-ing component designed to enhance their knowledge, leading to development of positive social emotional/behavioral skills and access to regular early childhood environments. It is anticipated that substitute funds will be required for additional teachers and paraeducators to participate in this professional learning opportunity linked to improved student performance.
Special Schools and Center-Based Programs for Students with Disabilities
Delivery of a comprehensive instructional program for students with disabilities requires implementation of services in a continuum of settings. DSES provides ser-vices to non-diploma bound students who range in age from 5 to 21, in special schools and centers: Rock Terrace School, Stephen Knolls School, Longview School, and Carl Sandburg Learning Center.
Since the adoption of the Maryland Standards for Col-lege and Career Readiness, the department has been providing systematic professional learning opportuni-ties to special education teachers of non-diploma bound students focused on how to effectively teach Alternate Learning Outcomes based on Curriculum 2.0. Special education supervisors and instructional specialists will analyze alternative assessment data in order to mea-sure our success. The department will use data from the MSDE FY 2016 Multi State Alternate Assessment results as a baseline for measuring success and planning for future initiatives.
For FY 2018, Special education school-based resources that provide direct services to students are realigned from Chapter 5 to Chapter 1, Schools. For more details on the budget associated with this realignment, please refer to Chapter 1, Schools.
MEASURESM E A S U R E : To increase the percentage of students with disabilities in general education settings for 80 percent or more of the time, or LRE A, surpassing the target set by MSDE:
FY 2016Actual
FY 2017Estimate
FY 2018Recommended
66.85% 69.0% 70.00%
E X P L A N A T I O N : This measure indicates the degree to which students with disabilities are educated in general education settings. In 2016, 66.85 percent of students with disabilities were provided services inside regular education classrooms 80 percent or more of the time.
CHAPTER 5 – 18 SPECIAL EDUCATION

Department of Special Education Services250/251/271/245/249/252/253/254/256/258/259/277/276/278/930
M E A S U R E : Increase the percentage of Grade 3 students with disabilities who approached, met, or exceeded Partnership for Assessment of Readiness for College and Careers (PARCC) English Language Arts/Literacy expectations.
FY 2016Actual
FY 2017Estimate
FY 2018Recommended
26.1% 40% 45%
E X P L A N A T I O N : This measure indicates the percentage of students with disabilities who are approaching, meeting, or exceeding PARCC expectations for Grade 3 in reading. By providing professional learning focused on reading interventions, MCPS will reduce the achievement gap in reading each year.
M E A S U R E : Increase the percentage of Grade 5 students with disabilities who approached, met, or exceeded PARCC mathematics expectations.
FY 2016Actual
FY 2017Estimate
FY 2018Recommended
33.4% 40% 45%
E X P L A N A T I O N : This measure indicates the percentage of students with disabilities who are approaching, meeting, or exceeding PARCC expectations for Grade 5 in mathematics. By providing professional learning focused on mathematics interventions, MCPS will reduce the achievement gap in mathematics each year.
M E A S U R E : To decrease the risk ratio for multiple sus-pensions of students with disabilities to less than 2.0.
FY 2016Actual
FY 2017Estimate
FY 2018Recommended
2.78 2.0 <2.0
E X P L A N A T I O N : This measure indicates the risk for multiple suspensions of students with disabilities. In 2016, students with disabilities were 2.78 times more likely to be suspended for multiple days than their typically developing peers. The MSDE target is a risk ratio of less than 2.
M E A S U R E : Increase the percentage of students ages three to kindergarten who receive services in a regular early childhood setting the majority of the day.
FY 2016Actual
FY 2017Estimate
FY 2018Recommended
42.58% 46% 65.1%
E X P L A N A T I O N : This measure indicates improvement toward LRE mandates and promotes special education instruction in early childhood environments.
M E A S U R E : Increase the percentage of preschool stu-dents ages three to kindergarten with IEPs who dem-onstrate Improved Positive Social Emotional Skills (Outcome A), Acquisition and Use of Knowledge and Skills (Outcome B), and Use of Appropriate Behaviors to Meet Their Needs (Outcome C), as measured by the Child Outcomes Summary process and the Work Sam-pling System.
FY 2016Actual
FY 2017Estimate
FY 2018Recommended
Outcome A 66.51% 68.52% 71%Outcome B 69.77% 73.12% 75%Outcome C 67.81% 69.82% 72%
E X P L A N A T I O N : This measure indicates the number of students who substantially increase their rate of skill growth by the time they exit from early childhood special education services.
OVERVIEW OF BUDGET CHANGES
FY 2017 CURRENT BUDGET
The current FY 2017 budget for this department is
changed from the budget adopted by the Board of
Education on June 14, 2016. The change includes
the realignment of special education school-based
resources that provide direct services to students
from Chapter 5 to Chapter 1, Schools.
FY 2018 RECOMMENDED BUDGET
The FY 2018 recommended budget for this
department is $45,671,093, a decrease of $592,565
from the current FY 2017 budget. An explanation of
this change follows.
Same Service Level Changes—($63,431)Student Enrollment—($131,013)Projected changes in enrollment requires a net decrease of 3.43 positions and $131,013. Changes for each pro-gram are listed below.
The Department of Special Education Services’ bud-get has a net an increase of $78,588, which includes an increase of $40,615 for substitutes and $37,973 for para-educator substitutes.
The Infants and Toddlers Program budget has a net to a decrease of 4.43 positions and $270,515, which includes decreases of 3.6 Infants and Toddlers teacher positions
CHAPTER 5 – 19 SPECIAL EDUCATION

Department of Special Education Services250/251/271/245/249/252/253/254/256/258/259/277/276/278/930
and $199,812; a 1.0 speech-language pathologist posi-tion and $79,313; and a net increase of a 0.090 occupa-tional/physical therapist position and $6,137 and a 0.080 paraeducator position and $2,473.
In addition, in the Division of Prekindergarten, Special Programs, and Related Services there is an increase of a 1.0 social worker position and $60,914.
Realignments to Meet Expenditure Requirements and Program Priorities—$41,706There are technical realignments budgeted to address both the student enrollment growth needs listed above and spending priority needs within this department, resulting in a net increase of 1.5 positions and $41,707. The realignments include decreases in annual review part-time salaries, textbooks, and instructional materi-als, and local travel mileage reimbursement totaling $111,151, with offsetting increases for media centers, program supplies, assistive technology equipment, office supplies and resource room materials for $106,490. In addition, there is an increase of 1.5 paraeducator posi-tions and $46,367.
Other—$25,876Applying an inflation factor of 2 percent increases the budget for textbooks and instructional materials by $25,876.
Program Efficiencies and Reductions—($529,134)The FY 2018 recommended budget for this department includes a comprehensive effort to identify potential program efficiencies and reductions. Stakeholders, including community partners and employee union representatives, participated in the program efficiencies and reduction process.
The reductions in the Department of Special Education Services’ budget total $190,860, which includes $132,821 for instructional materials due to prior year spending trends and the inflation amount of $19,202 budgeted for textbooks and instructional materials is eliminated. Effi-ciencies will be necessary to ensure that schools have required textbooks and instructional materials. In addi-tion, there is a reduction of $38,837 and a 1.0 secretary position. Responsibilities will be reassigned to other department staff to ensure a seamless transition of ser-vices provided.
The reductions in the Division of Prekindergarten, Spe-cial Programs, and Related Services Support budget, total $232,670. These reductions include $10,000 for transition service program supplies due to prior year spending trends and $66,000 for contractual services, which will discontinue the Marriott Foundation for People with Disabilities contract. In addition, $94,076 is decreased from the budget to convert 11.0 social worker positions from a 12-month schedule to 10-month and 20 summer days. The social worker allocations assigned to the Bridge and Extensions programs will be carefully constructed to ensure that the extended school year ser-vices will continue with adequate support. There also are reductions of a 1.0 special education teacher position and $55,920 and the inflation amount of $6,674 budgeted for textbooks and instructional materials is eliminated. Efficiencies will be necessary to ensure that schools have required textbooks and instructional materials.
There is a reduction in the Preschool Program Educa-tion Office of $105,604 and a 1.0 coordinator position. Responsibilities will be reassigned to other office staff to ensure a seamless transition of services provided.
Grant: Infants and Toddlers Program—930
FY 2018 RECOMMENDED BUDGETThe FY 2018 recommended budget for this grant is $1,023,737, no change from the FY 2017 award amount. An explanation of this change follows.
Same Service Level Changes—$0Realignments to Meet Expenditure Requirements and Program Priorities—$0There are several realignments budgeted to address pri-ority spending needs within this grant, including reduc-tions in local travel mileage reimbursement, indirect costs, and employee benefits with offsetting increases in other program costs.
Program’s Recent Funding HistoryFY 2017Budgeted7/1/16
FY 2017Projected11/30/16
FY 2018Projected7/1/17
Federal $ 791,315 $ 837,602 $ 837,602
State $ 232,423 $ 186,135 $ 186,135
Total $1,023,738 $1,023,737 $1,023,737
CHAPTER 5 – 20 SPECIAL EDUCATION

FY 2018 OPERATING BUDGET
Department of Special Education Services
Director II (Q) 1.0Instructional Specialist (B–D) 1.0Administrative Secretary III (16) 1.0
F.T.E. Positions 20.0* In addition, 3.5 FTE positions for the School Support
Team are shown in the Medical Assistance Program on the Division of Business, Fiscal, and Information Sytems chart.
School Support Team
Supervisor (O) 6.0Coordinator (N) 1.0Instructional Specialist (B–D) 6.0Teacher, Special Education (A–D)* Administrative Secretary I (14) 2.0
Interdisciplinary Team
Instructional Specialist (B–D) 2.0
Transition Services
Autism Programs
Programs for Students with Emotional Disabilities (ED)
Programs—Deaf and Hard of Hearing, Visually Impaired
InterACT Programs
Infants/Toddlers and Preschool Services Unit/Child Find
Preschool Education Program
Single Point of Entry for Identification of Birth to
Kindergarten/Developmental Evaluation Services of
Children (DESC)
Programs for Physically Disabled
Speech and Language Programs
Division of Prekindergarten, Special Programs, and
Related Services
CH
AP
TER 5 – 21 S
PEC
IAL ED
UC
ATIO
N
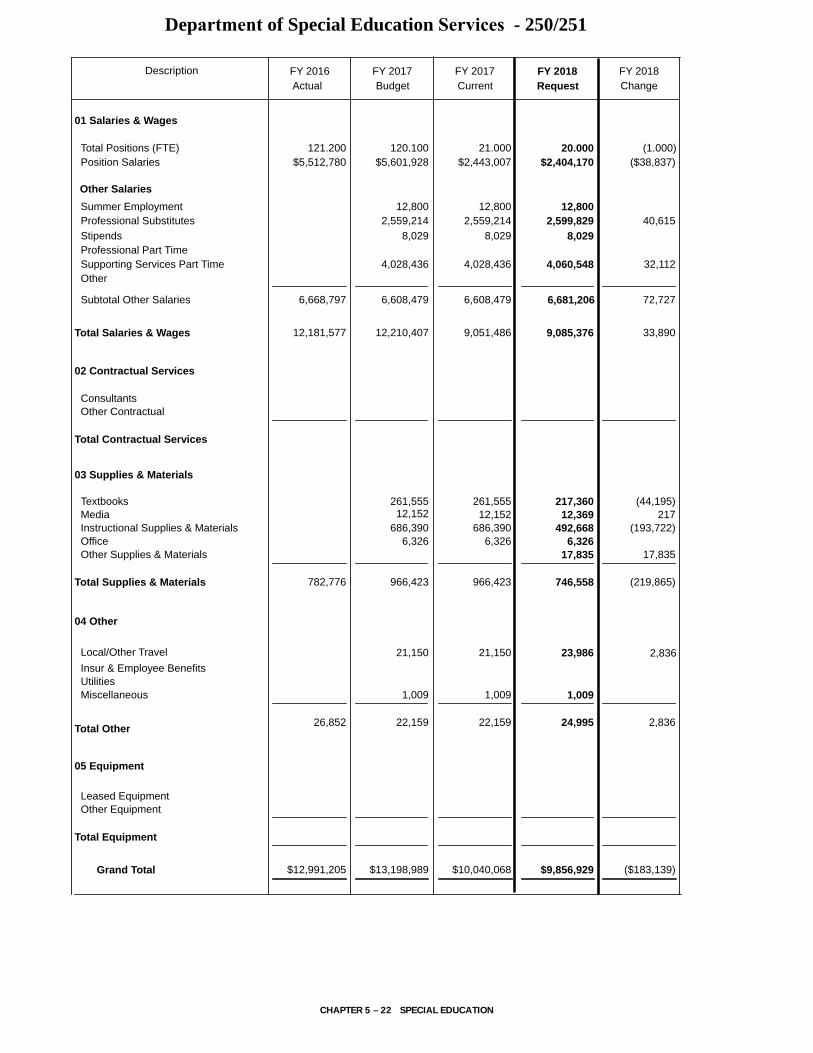
Department of Special Education Services - 250/251
Actual FY 2017Budget
FY 2017Current
FY 2018Request
FY 2018
Summer EmploymentProfessional Substitutes
12,800 12,800 12,80040,615
Total Positions (FTE)Position Salaries
121.200$5,512,780
120.100$5,601,928
21.000$2,443,007
20.000$2,404,170
Other Salaries
01 Salaries & Wages
2,559,214 2,559,214 2,599,829
Stipends 8,029 8,029 8,029Professional Part Time
ConsultantsOther Contractual
OfficeOther Supplies & Materials
MediaInstructional Supplies & Materials
Textbooks
Subtotal Other Salaries
Leased Equipment
Grand Total
Other Equipment
Total Salaries & Wages
02 Contractual Services
Total Contractual Services
03 Supplies & Materials
Total Supplies & Materials
04 Other
Total Other
05 Equipment
Total Equipment
Supporting Services Part TimeOther
4,028,436 4,028,436 4,060,548 32,112
782,776
261,55512,152
686,3906,326
966,423
261,55512,152
686,3906,326
966,423
492,6686,326
17,835
217,36012,369
746,558
17,835
(44,195)217
(193,722)
(219,865)
12,181,577 12,210,407 9,051,486 9,085,376 33,890
6,668,797 6,608,479 6,608,479 6,681,206 72,727
$12,991,205 $13,198,989 $10,040,068 $9,856,929 ($183,139)
ChangeDescription FY 2016
(1.000)($38,837)
Insur & Employee BenefitsUtilitiesMiscellaneous
26,852
1,009
22,159
1,009
22,159
1,009
24,995 2,836
Local/Other Travel 21,150 21,150 23,986 2,836
CHAPTER 5 – 22 SPECIAL EDUCATION

DESCRIPTION CURRENTFYBUDGET
FYACTUAL
20172016 10Mon
FY 2017CAT CHANGE
2018FY
Department of Special Education Services - 250/251
REQUEST
2018FY
250 Dept. of Special Education
6 1.000 1.000Director IIQ 1.000
6 1.000 1.000Instructional SpecialistBD 1.000
6 1.000 1.000Administrative Secretary III16 1.000
3.000 3.000Subtotal 3.000
251 Department of Special Education Services
6 1.000Director IIQ 6 7.000 7.000 7.000SupervisorO (1.000)6.000
6 CoordinatorN 1.0001.000
6 9.000 8.000 8.000Instructional SpecialistBD 8.000
6 2.500 .500XTeacher, Special EducationAD 6 1.000Administrative Secretary III16 6 2.000 2.000 2.000Administrative Secretary I14 2.000
6 96.700 98.600XSpec Ed Itinerant Paraeducator13 6 1.000 1.000 1.000Secretary12 (1.000)6 1.000Office Assistant IV11
121.200 117.100 18.000Subtotal (1.000)17.000
120.100121.200 21.000Total Positions (1.000)20.000
CHAPTER 5 – 23 SPECIAL EDUCATION
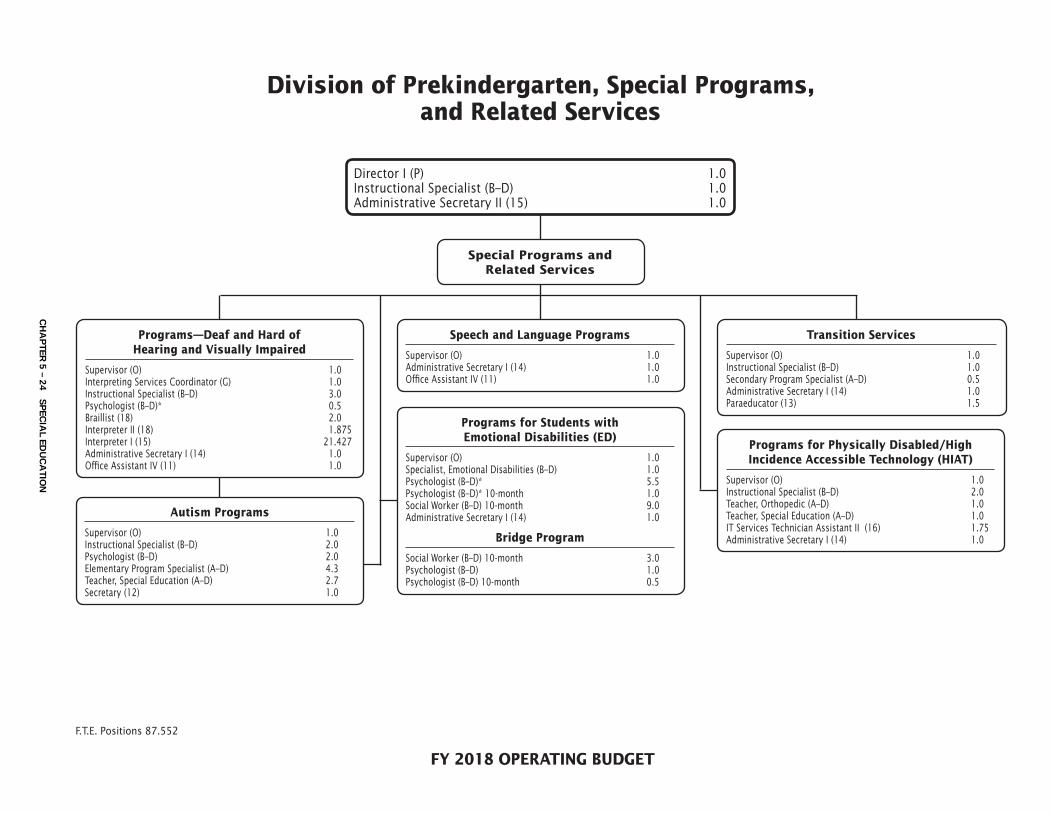
FY 2018 OPERATING BUDGET
Division of Prekindergarten, Special Programs, and Related Services
Director I (P) 1.0Instructional Specialist (B–D) 1.0Administrative Secretary II (15) 1.0
Autism Programs
Supervisor (O) 1.0Instructional Specialist (B–D) 2.0Psychologist (B–D) 2.0Elementary Program Specialist (A–D) 4.3Teacher, Special Education (A–D) 2.7Secretary (12) 1.0
Programs for Students with Emotional Disabilities (ED)
Supervisor (O) 1.0Specialist, Emotional Disabilities (B–D) 1.0Psychologist (B–D)* 5.5Psychologist (B–D)* 10-month 1.0Social Worker (B–D) 10-month 9.0Administrative Secretary I (14) 1.0
Bridge Program
Social Worker (B–D) 10-month 3.0Psychologist (B–D) 1.0Psychologist (B–D) 10-month 0.5
Programs—Deaf and Hard of Hearing and Visually Impaired
Supervisor (O) 1.0Interpreting Services Coordinator (G) 1.0Instructional Specialist (B–D) 3.0Psychologist (B–D)* 0.5Braillist (18) 2.0Interpreter II (18) 1.875Interpreter I (15) 21.427Administrative Secretary I (14) 1.0Office Assistant IV (11) 1.0
Programs for Physically Disabled/High Incidence Accessible Technology (HIAT)
Supervisor (O) 1.0Instructional Specialist (B–D) 2.0Teacher, Orthopedic (A–D) 1.0Teacher, Special Education (A–D) 1.0IT Services Technician Assistant II (16) 1.75Administrative Secretary I (14) 1.0
Special Programs and Related Services
Transition Services
Supervisor (O) 1.0Instructional Specialist (B–D) 1.0Secondary Program Specialist (A–D) 0.5Administrative Secretary I (14) 1.0Paraeducator (13) 1.5
Speech and Language Programs
Supervisor (O) 1.0Administrative Secretary I (14) 1.0Office Assistant IV (11) 1.0
F.T.E. Positions 87.552
CH
AP
TER 5 – 24 S
PEC
IAL ED
UC
ATIO
N

PreK, Special Programs, & Related Svcs. - 271/245/249/252/253/254/256/258/259
Actual FY 2017Budget
FY 2017Current
FY 2018Request
FY 2018
Summer EmploymentProfessional Substitutes
Total Positions (FTE)Position Salaries
1,098.548$71,082,175
1,113.207$75,394,167
86.052$7,556,656
87.552$7,513,942
Other Salaries
01 Salaries & Wages
13,883 13,883 13,883
StipendsProfessional Part Time
ConsultantsOther Contractual
OfficeOther Supplies & Materials
MediaInstructional Supplies & Materials
Textbooks
Subtotal Other Salaries
Leased Equipment
Grand Total
Other Equipment
Total Salaries & Wages
02 Contractual Services
Total Contractual Services
03 Supplies & Materials
Total Supplies & Materials
04 Other
Total Other
05 Equipment
Total Equipment
Supporting Services Part TimeOther
184,621 184,621 184,621
60,000
66,000
66,000
66,000
66,000 (66,000)
(66,000)
302,389
27,683
306,0284,970
338,681
27,683
306,0284,970
34,806
373,487
395,6565,170
24,806
24,899
450,531
(10,000)
(2,784)
89,628200
77,044
71,241,632 75,597,155 7,755,160 7,712,446 (42,714)
4,484
159,457 202,988 198,504 198,504
$71,744,462
8,994
$76,167,183 $8,359,994 $8,326,188 ($33,806)
ChangeDescription FY 2016
1.500($42,714)
Insur & Employee BenefitsUtilitiesMiscellaneous
131,447
35,878
165,347
35,878
165,347
35,878
163,211 (2,136)
Local/Other Travel 129,469 129,469 127,333 (2,136)
CHAPTER 5 – 25 SPECIAL EDUCATION

DESCRIPTION CURRENTFYBUDGET
FYACTUAL
20172016 10Mon
FY 2017CAT CHANGE
2018FY
PreK, Special Programs, & Related Svcs. - 271/245/249/252/253/254/256/258/259
REQUEST
2018FY
271 Div. of Prschl Sp Ed & Related Svc
6 1.000 1.000 1.000Director IP 1.000
6 1.000 1.000 1.000Instructional SpecialistBD 1.000
6 1.000 1.000 1.000XTeacher, Special EducationAD (1.000)6 1.000 1.000 1.000Administrative Secretary II15 1.000
4.000 4.000 4.000 (1.000)3.000Subtotal245 Bridge Program
7 2.000 3.000 3.000Social WorkerBD (3.000)3 1.000 1.000 1.000PsychologistBD 1.000
3 .500 .500XPsychologist - 10 MonthBD .500
7 XSocial Worker - 10 MonthBD 3.0003.000
6 24.800 29.000XTeacher, Special EducationAD 6 2.100 2.900XTeacher, Physical EducationAD 6 4.000 6.000XTeacher, Resource Spec EdAD 6 2.000 3.000School Secretary II13 6 30.000 36.250XParaeducator13
65.900 81.650 4.500 4.500Subtotal249 Prgs.-Deaf & Hard of Hearing
6 1.000 1.000 1.000SupervisorO 1.000
6 1.000 1.000 1.000Interpreting Svcs CoordinatorG 1.000
6 2.000 2.000 2.000Instructional SpecialistBD 2.000
3 .500 .500 .500PsychologistBD .500
6 .800 .800XTeacher, Special EducationAD 6 36.000 36.000XTeacher, AuditoryAD 6 7.200 7.200XAuditory Development SpecAD 6 4.500 4.500 1.875XInterpreter Hearing Impair II18 1.875
6 32.500 32.000 21.427XInterpreter Hearing Impair I15 21.427
6 1.000 1.000 1.000Administrative Secretary I14 1.000
6 20.563 20.125XParaeducator13
107.063 106.125 28.802 28.802Subtotal252 Speech & Language Programs
6 1.000 1.000 1.000SupervisorO 1.000
6 210.200 207.100XSpeech PathologistBD 6 2.300 1.700XTeacher, Special EducationAD 6 1.000 1.000 1.000Administrative Secretary I14 1.000
6 .800XSpeech/Language Path Asst14 6 6.125 4.812XParaeducator13 6 1.000 1.000 1.000Office Assistant IV11 1.000
222.425 216.612 3.000Subtotal 3.000
CHAPTER 5 – 26 SPECIAL EDUCATION

DESCRIPTION CURRENTFYBUDGET
FYACTUAL
20172016 10Mon
FY 2017CAT CHANGE
2018FYREQUEST
2018FY
253 Prgs.-Visually Impaired
6 1.000 1.000 1.000Instructional SpecialistBD 1.000
6 15.000 14.500XTeacher, VisionAD 6 .200 .200XTeacher, Special EducationAD 6 2.000 2.000 2.000Braillist18 2.000
6 4.375 4.000XParaeducator13 6 1.000 1.000 1.000Office Assistant IV11 1.000
23.575 22.700 4.000 4.000Subtotal254 Prgs.-Physically Disabled
6 1.000 1.000 1.000SupervisorO 1.000
6 2.000 2.000 2.000Instructional SpecialistBD 2.000
6 7.500 7.500 1.000XTeacher, OrthopedicAD 1.000
6 1.000 1.000 1.000XTeacher, Special EducationAD 1.000
6 .400 .400XTeacher, Physical EducationAD 6 25.600 25.600XPhysical TherapistAD 6 67.200 66.600XOccupational TherapistAD 6 1.750 1.750 1.750IT Services Tech Asst II16 1.750
6 1.000 1.000 1.000Administrative Secretary I14 1.000
6 .375XPhysical Therapy Assistant14 6 9.125 9.125XParaeducator13
116.950 115.975 7.750 7.750Subtotal256 Transition Services
6 1.000 1.000 1.000SupervisorO 1.000
6 1.000 1.000 1.000Instructional SpecialistBD 1.000
6 47.600 42.300XTeacher, Sp Ed TransitionAD 6 .500 .500 .500XSp Ed Secondary Prgm SpecAD .500
6 1.000 1.000 1.000Administrative Secretary I14 1.000
6 22.000 20.250XParaeducator13 1.5001.500
73.100 66.050 3.500 1.5005.000Subtotal258 Prgs.-Students w/Emotional Disab.
6 1.000 1.000 1.000SupervisorO 1.000
6 1.000 1.000 1.000Specialist Emotional DisabBD 1.000
7 8.000 8.000 8.000Social WorkerBD (8.000)3 5.500 5.500 5.500PsychologistBD 5.500
3 1.000 1.000 1.000XPsychologist - 10 MonthBD 1.000
7 XSocial Worker - 10 MonthBD 9.0009.000
6 56.000 56.000XTeacher, Special EducationAD 6 .500 .500XTeacher, Physical EducationAD 6 12.000 10.000XSp Ed Secondary Prgm SpecAD 6 1.000 1.000 1.000Administrative Secretary I14 1.000
PreK, Special Programs, & Related Svcs. - 271/245/249/252/253/254/256/258/259
CHAPTER 5 – 27 SPECIAL EDUCATION

DESCRIPTION CURRENTFYBUDGET
FYACTUAL
20172016 10Mon
FY 2017CAT CHANGE
2018FYREQUEST
2018FY
258 Prgs.-Students w/Emotional Disab.
6 77.250 77.250XParaeducator13
163.250 161.250 17.500 1.00018.500Subtotal259 Autism Porgrams
6 1.000 1.000SupervisorO 1.000
6 3.000 2.000 2.000Instructional SpecialistBD 2.000
3 2.000 2.000 2.000PsychologistBD 2.000
6 4.300 4.300 4.300XSp Ed Elem Prgrm SpecAD 4.300
6 107.200 113.200 2.700XTeacher, Special EducationAD 2.700
6 204.785 215.345XParaeducator13 6 1.000 1.000 1.000Secretary12 1.000
322.285 338.845 13.000Subtotal 13.000
1,113.2071,098.548 86.052Total Positions 1.50087.552
PreK, Special Programs, & Related Svcs. - 271/245/249/252/253/254/256/258/259
CHAPTER 5 – 28 SPECIAL EDUCATION

Child Find
Supervisor (O) 1.0Instructional Specialist (B–D) 3.0Administrative Secretary I (14) 1.0Program Secretary (13) 1.0
Single Point of Entry for Identification of Birth to Kindergarten/DESC
Instructional Specialist (B–D) 4.0Psychologist (B–D) 1.5Speech Pathologist (B–D) 3.0Occupational Therapist (A–D) 2.7Program Secretary (13) 2.0
InterACT Programs
Instructional Specialist (B–D) 1.0Occupational Therapist (A–D) 1.6Physical Therapist (A–D) 0.5IT Services Technical Assistant II (16) 1.0Paraeducator (13) 0.875
Preschool Education Program (PEP) Office
Coordinator (N) 1.0Instructional Specialist (B–D) 1.0Psychologist (B–D) 3.0Elementary Program Specialist (A–D) 2.0Teacher, Preschool (A–D) 0.2Administrative Secretary I (14) 1.0
Infants and Toddlers Program
Coordinator (N) 5.0Speech Pathologist (B–D) 71.2Elementary Program Specialist (A–D)* 5.0Occupational Therapist (A–D) 29.39Physical Therapist (A–D) 30.6Physical Therapist (A–D)* 1.0Teacher, Auditory (A–D) 3.0Teacher, Infants and Toddlers (A–D) 68.6Teacher, Vision (A–D) 3.0Administrative Secretary I (14) 5.0Paraeducator (13) 42.18
Division of Prekindergarten, Special Programs, and Related Services
FY 2018 OPERATING BUDGET
Infants and Toddlers, Preschool Education Programs, and InterACT
F.T.E. Positions 296.345
** Positions grant funded by the Montgomery County Infants and Toddlers Program
CH
AP
TER 5 – 29 S
PEC
IAL ED
UC
ATIO
N

Infants & Toddlers, Preschool Education, & InterACT - 277/262/276/278/930
Actual FY 2017Budget
FY 2017Current
FY 2018Request
FY 2018
Summer EmploymentProfessional Substitutes
Total Positions (FTE)Position Salaries
611.507$49,268,272
611.433$47,506,768
301.775$26,969,132
296.345$26,609,003
Other Salaries
01 Salaries & Wages
StipendsProfessional Part Time
ConsultantsOther Contractual
OfficeOther Supplies & Materials
MediaInstructional Supplies & Materials
Textbooks
Subtotal Other Salaries
Leased Equipment
Grand Total
Other Equipment
Total Salaries & Wages
02 Contractual Services
Total Contractual Services
03 Supplies & Materials
Total Supplies & Materials
04 Other
Total Other
05 Equipment
Total Equipment
Supporting Services Part TimeOther
89,146189,437
89,146189,437
89,146189,437
56,043
79935,916
36,715
79935,916
36,715
79935,916
36,715
49,484,483 47,785,351 27,247,715 26,887,586 (360,129)
216,211 278,583 278,583 278,583
$50,074,126 $48,401,232 $27,863,596 $27,487,976 ($375,620)
ChangeDescription FY 2016
(5.430)($360,129)
Insur & Employee BenefitsUtilitiesMiscellaneous
533,600
283,170
11,253
579,166
283,170
11,253
579,166
294,185
563,675
11,015
(11,253)
(15,491)
Local/Other Travel 284,743 284,743 269,490 (15,253)
CHAPTER 5 – 30 SPECIAL EDUCATION

DESCRIPTION CURRENTFYBUDGET
FYACTUAL
20172016 10Mon
FY 2017CAT CHANGE
2018FY
Infants & Toddlers, Preschool Education, & InterACT Programs - 277/276/262/278/930
REQUEST
2018FY
277 Infants and Toddlers Program
6 5.000 5.000 5.000CoordinatorN 5.000
6 73.000 72.200 72.200XSpeech PathologistBD (1.000)71.200
6 76.000 72.200 72.200XTeacher, Infants & ToddlersAD (3.600)68.600
6 3.500 3.000 3.000XTeacher, VisionAD 3.000
6 .200XTeacher, Special EducationAD 6 30.500 29.400 29.400XPhysical TherapistAD 1.20030.600
6 29.000 30.500 30.500XOccupational TherapistAD (1.110)29.390
6 3.500 3.000 3.000XTeacher, AuditoryAD 3.000
6 5.000 5.000 5.000Administrative Secretary I14 5.000
6 42.100 42.100 42.100XParaeducator13 .08042.180
267.800 262.400 262.400Subtotal (4.430)257.970
276 PEP Program Office
6 1.000 1.000SupervisorO 6 2.000 2.000 2.000CoordinatorN (1.000)1.000
6 8.000 8.000 1.000Instructional SpecialistBD 1.000
3 4.500 4.500 3.000PsychologistBD 3.000
6 18.200 18.500XSpeech PathologistBD 6 2.120 2.120XTeacher, BeginningsAD 6 109.200 111.100 .200XTeacher, Preschool EducationAD .200
6 2.000 2.000 2.000XSp Ed Elem Prgrm SpecAD 2.000
6 23.200 23.600XTeacher, Special EducationAD 6 7.300 7.400XPhysical TherapistAD 6 20.000 20.000XOccupational TherapistAD 6 3.000 2.000 1.000Administrative Secretary I14 1.000
6 3.000 3.000Program Secretary13 6 112.812 116.438XParaeducator13
316.332 321.658 9.200Subtotal (1.000)8.200
262 Child Find/DESC
6 1.000SupervisorO 1.000
6 7.000Instructional SpecialistBD 7.000
3 1.500PsychologistBD 1.500
6 3.000XSpeech PathologistBD 3.000
6 2.700XOccupational TherapistAD 2.700
6 1.000Administrative Secretary I14 1.000
6 3.000Program Secretary13 3.000
19.200Subtotal 19.200
278 InterACT Programs and Resource Office
6 1.000 1.000 1.000Instructional SpecialistBD 1.000
6 6.900 6.900XSpeech PathologistBD 6 6.000 6.000XTeacher, Special EducationAD
CHAPTER 5 – 31 SPECIAL EDUCATION
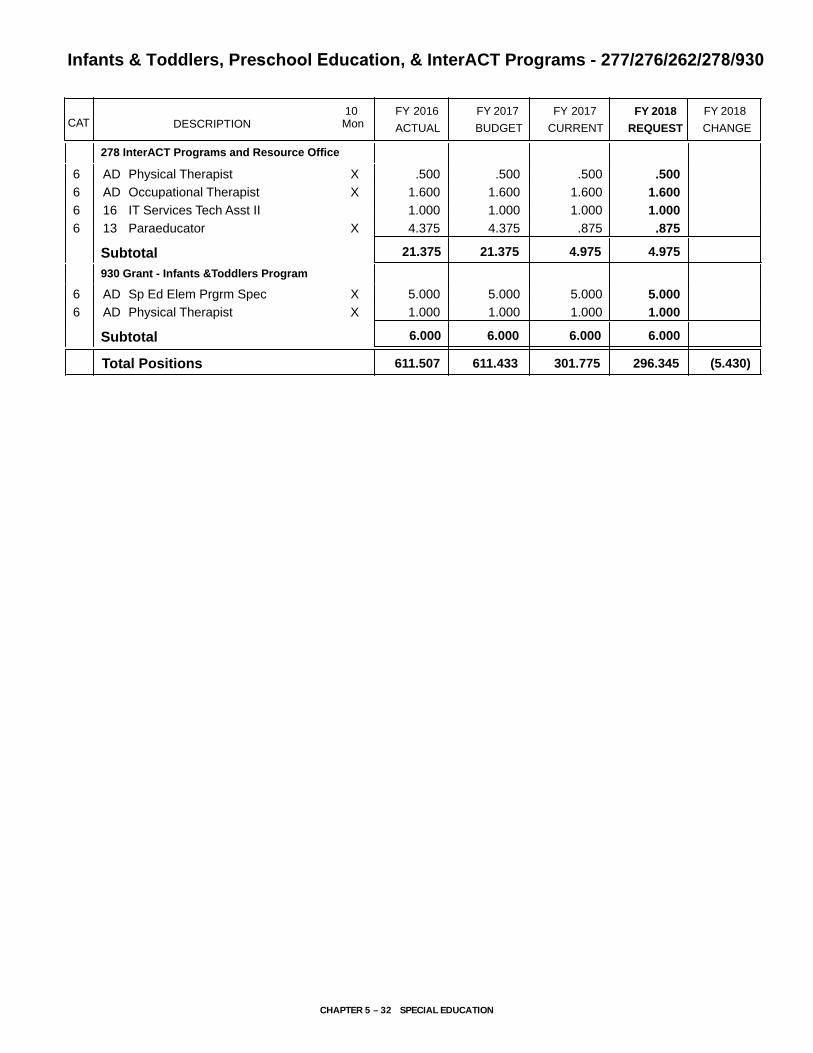
DESCRIPTION CURRENTFYBUDGET
FYACTUAL
20172016 10Mon
FY 2017CAT CHANGE
2018FYREQUEST
2018FY
278 InterACT Programs and Resource Office
6 .500 .500 .500XPhysical TherapistAD .500
6 1.600 1.600 1.600XOccupational TherapistAD 1.600
6 1.000 1.000 1.000IT Services Tech Asst II16 1.000
6 4.375 4.375 .875XParaeducator13 .875
21.375 21.375 4.975Subtotal 4.975
930 Grant - Infants &Toddlers Program
6 5.000 5.000 5.000XSp Ed Elem Prgrm SpecAD 5.000
6 1.000 1.000 1.000XPhysical TherapistAD 1.000
6.000 6.000 6.000Subtotal 6.000
611.433611.507 301.775Total Positions (5.430)296.345
Infants & Toddlers, Preschool Education, & InterACT Programs - 277/276/262/278/930
CHAPTER 5 – 32 SPECIAL EDUCATION

Chapter 6
Student Services and Engagement
Student Services and Engagement PAGE
Office of Student and Family Support and Engagement ............................................................. 6-2

13.000
By Object of Expenditure
Summary of Resources
Student Services and Engagement
2.000
OBJECT OF EXPENDITURE FY 2016 FY 2017 FY 2017 FY 2018 FY 2018ACTUAL BUDGET CURRENT BUDGET CHANGE
11.00011.000
220.900 224.600 2.000198.900
435,747
339,421 498,753 370,372
317,452 261,952
533,755
177,506
208,526
687,906
121,917
313,830 510,400 490,007 383,441 (106,566)
177,506 161,858 (15,648)
667,513 545,299 (122,214)
20,511,611
320,452
23,388,393 23,659,040 23,797,535 138,495
106,346
(128,381)
119,754
(55,500)
119,754 119,754
97,749 116,286 116,286 156,286 40,000
204,095 236,040 236,040 276,040 40,000
$24,478,640 $24,705,899
POSITIONS
Administrative
TOTAL POSITIONS
01 SALARIES & WAGES
Administrative
OTHER SALARIES
Administrative
Professional
Supporting Services
TOTAL OTHER SALARIES
TOTAL SALARIES AND WAGES
02 CONTRACTUAL SERVICES
03 SUPPLIES & MATERIALS
04 OTHER
Local/Other Travel
Insur & Employee Benefits
Utilities
Miscellaneous
TOTAL OTHER
05 EQUIPMENT
GRAND TOTAL AMOUNTS
$2,023,517 $1,548,129 $1,548,129
226.600
TOTAL POSITION DOLLARS 20,075,864 22,700,487 22,991,527 23,252,236 260,709
$1,741,071 $192,942
$24,711,285 ($5,386)$21,263,653
165.600 1.000
48.000 (1.000)42.300 49.000164.600167.600Professional
Supporting Services
14.000
150.90034.000
18,017,359 18,152,805
3,358,360
135,446
3,426,039 (67,679)15,809,100
2,243,24718,360,836
2,791,522
Professional
Supporting Services
Business/Operations Admin.
Business/Operations Admin.
CHAPTER 6 – 1 STUDENT SERVICES AND ENGAGEMENT

Office of Student and Family Support and Engagement522/556/551/552/555/557/558
M I S S I O N The mission of the Office of
Student and Family Support and Engagement
(OSFSE) is to provide an integrated and
seamless framework of school-based and
community supports for students and their
families. OSFSE’s primary focus is to ensure a
supportive and nurturing school environment
that promotes student achievement and well-
being by removing barriers to learning.
MAJOR FUNCTIONSPupil Services and Attendance
Pupil Services and Attendance (PSA) works to support learning, accountability and results by providing atten-dance and disciplinary management support and pupil services. This work is accomplished by consulting with schools and families, advocating for students and fami-lies, and serving as a liaison between schools, families, and community resources. PSA provides leadership in the area of early, effective attendance interventions, working preventatively to identify problem attendance patterns and intervene with students and families prior to the development of a pattern of habitual truancy. The Maryland State Department of Education (MSDE) defines a student as habitually truant “if the student has been in membership in a school for 91 or more days in a school year and is unlawfully absent from school for a number of days or portion of days in excess of 20% of the school days within any marking period, semes-ter, or year.” Under this definition 2,191 students were considered habitually truant in FY 2016. Locally, MCPS has operated under the definition of habitual truancy as “the student has been in membership in a school for 91 or more days in a school year and has greater than 15 days of unlawful absences within any marking period, semester, or year.” Under this definition, 9,372 were con-sidered habitually truant in FY 2016. OSFSE is working to establish an enhanced framework to target interven-tions to students experiencing attendance challenges earlier to avoid students becoming habitual truants.
Out-of-school suspensions similarly impact academic and career outcomes; as such OSFSE will focus its efforts in 2018 on supporting schools to utilize alterna-tive consequences such as restorative justice to address and correct behavior within schools. During FY 2016, 2,993 incidents involved out-of-school suspensions. Of
this number, 1,538 incidents involved African American students; 920 incidents involved Latino students; and 300 incidents involved White students. 2,074 of the 2,993 incidents involved students identified as receiving free and reduced-priced meals.
In addition, PSA refers students and families to appropri-ate community agencies and service providers, and eval-uates, processes and responds to requests for Changes of School Assignments (COSA). PSA reviews cases of stu-dents who have been recommended for expulsion, con-ducts expulsion investigative conferences, and provides case management and follow-up support to students fol-lowing the disciplinary process. PSA also liaises between the home schooling specialist and families, reviews home schooling programs, and family home schooling plans. In FY 2017, $184,540 was added to the program budget, to provide 2.0 FTE pupil personnel worker positions to address student needs in schools. PSA leads services to address student attendance and will establish targets to escalate interventions earlier in the cycle of poor atten-dance. PSA also provides support to schools, students and families in understanding the disciplinary process and identifying ways to negotiate consequences that cor-rect student behavior.
Student, Family and School ServicesSFSS works to promote family and community engage-ment, and effective collaborations with community organizations by providing coordinated and directed assistance to families to increase positive connections to the school environment to support academic and career success for all students. SFSS works collaboratively with school leaders, staff, and community organiza-tions to create culturally-responsive engagement plans/activities and to build capacity of families to success-fully navigate the school environment. SFSS delivers direct interventions to families, connecting them with community and school resources to address cultural, familial, financial, housing and other challenges that impact learning. In FY 2017, $602,528 was added to the program budget, providing 13.0 FTE parent community coordinator positions, directly assigned to high needs elementary schools, and to augment supports to cultur-ally relevant programs, such as (ESOL and METS). SFSS supports parents and guardians with understanding the educational process and identifying resources and sup-ports to improve attendance and behavioral outcomes.
Student Health and Psychological ServicesSHPS supports learning, accountability and results by working to ensure that all students have an opportunity to learn, by providing comprehensive, culturally proficient,
CHAPTER 6 – 2 STUDENT SERVICES AND ENGAGEMENT

Office of Student and Family Support and Engagement522/556/551/552/555/557/558
and evidence-based direct and indirect psychological and mental health supports and services, including: con-sultation with staff members and families; psychological assessments; and counseling and crisis support services for students, families and staff members. Psychologists are assigned full- or part-time to comprehensive schools as well as to special programs, and are instrumental in promoting social emotional competence, student engagement, resilience, and mental health wellness, which contribute to academic success in school and col-lege and career readiness. School psychologists provide essential services that address behavioral, emotional, social, and learning needs and administer comprehen-sive psychological assessments for students based on the identified needs to help improve academic and behav-ioral outcomes for students who are struggling with school. School psychologists collaborate with teachers, administrators, related service providers, and com-munity partners to provide learning opportunities and supports for students based on their identified needs. School psychologists help school teams develop Behav-ioral Intervention Plans to address behavioral needs/challenges in a positive and supportive manner. SHPS provides leadership in coordination of the districtwide mental health response to crisis events at schools and in the community that involve students and staff members, by deploying staff members and liaising with community partners to support schools, thereby returning them to a sense of normalcy so that education and learning may occur. SHPS provides leadership to MCPS student health programming in collaboration with the County’s public health officer, to ensure that parents and school leaders are aware of health requirements, such as vaccinations, and to communicate state mandates related to student health. In FY 2017, $745,398 was added to the budget, providing 8.0 FTE psychologist positions to increase availability of interventions and psycho-educational sup-ports to schools.
School Counseling ServicesSCS works to promote learning, accountability and results by providing leadership, coordination and guid-ance to school counselors in implementation of a com-prehensive school counseling program. SCS works to promote the academic success and personal growth and social development of every student to foster and moni-tor progress toward high school completion and college and career readiness; provide staff development, consul-tation, and resources that enhance the knowledge and skills of school counselors; collaborate with other MCPS departments, higher education, and community agen-cies; and provide education and outreach to parents and other community members. School counselors provide
services to students who are English Language Learn-ers (ELL) in prekindergarten through Grade 12, helping ELL students understand and adjust to the American school system and local community, acquire socio-cul-tural skills, and develop positive self-concepts that are necessary to succeed in MCPS and American society. School-based English for Speakers of Other Language (ESOL) counselors determines students’ availability for learning by assessing the extent and impact of traumatic events, as well as family status and reunification issues, and makes appropriate referrals to county agencies and service providers. In FY 2017, $30,000 was added to the budget to expand the Access to College Excellence and Success (ACES) program to two additional schools, pro-viding increased opportunities to minority students to participate in college readiness and preparation.
International Admissions and EnrollmentIAE supports operational excellence and learning, accountability and results, through provision of high quality and welcoming intake and admissions services to international families who are entering MCPS for the first time and/or United States citizens returning to the community after a period abroad. IAE assists all MCPS families requesting residency determinations for admission. The admissions intake process includes an assessment of high school transcripts from other states and other countries to make accurate grade-level place-ments. IAE staff assists with addressing care and cus-tody, and tuition requirements as needed. IAE works closely with school staff to complete the enrollment pro-cess as quickly as possible, and directly supports and monitors homeless families to ensure that students are enrolled in school and receive needed supports.
MEASURES M E A S U R E : To reduce by 10% the number of students who have more than 15 days unexcused absences.
FY 2016Actual
FY 2017Estimate
FY 2018Recommended
9,372 8,435 7,592
E X P L A N A T I O N : Beginning FY 2018, OSFSE will establish 15 unexcused absences as the benchmark for attendance interventions, to heighten attention to the importance of regular school attendance, and to implement strategies to get students back into regular school attendance.
CHAPTER 6 – 3 STUDENT SERVICES AND ENGAGEMENT

Office of Student and Family Support and Engagement522/556/551/552/555/557/558
M E A S U R E : To reduce by 10% the number of students suspended.
FY 2016Actual
FY 2017Estimate
FY 2018Recommended
2,142 1,928- 1,735
E X P L A N A T I O N : Reducing the number of suspensions will allow more students to remain in school and have the opportunity to learn.
OVERVIEW OF BUDGET CHANGES
FY 2017 CURRENT BUDGET
The current FY 2017 budget for the Office of
Student and Family Support and Engagement is
changed from the budget adopted by the Board of
Education on June 14, 2016. The change includes
realignments that decrease this office budget
by $475,956 and 5.3 FTE positions. This includes
the realignment of $35,000 from contractual
services, $20,393 from substitutes, and $3,000
from program supplies to support Study Circles
in Chapter 3, Office of the Chief Academic Officer.
In addition, there is a realignment of 4.3 English
Speakers of Other Languages (ESOL) transition
counselor positions and $288,501 to the Title III
Limited English Proficiency (ESOL) Grant, and a 1.0
instructional specialist position and $129,062 to the
ESOL Grant.
There also is a budget increase that includes 9.0
parent community coordinator positions and
$923,018 from the ESOL Grant to the Office of
Student and Family Support and Engagement.
Lastly, within this office, there is a budget neutral
realignment of 2.0 ESOL counselor positions and
$214,417 from the International Admissions and
Enrollments division to 2.0 parent community
coordinator positions in the Student, Family, and
School Services division.
FY 2018 RECOMMENDED BUDGET
The FY 2018 recommended budget for this office is
$24,705,899, a decrease of $5,386 from the current
FY 2017 budget. An explanation of this change
follows.
Same Service Level Changes—$253,061Realignments to Meet Expenditure Requirements and Program Priorities—$253,061 Realignments are budgeted to address priority spend-ing needs within this office. There are a number of bud-get neutral realignments to provide operational and leadership support for the Office of Student and Fam-ily Support and Engagement. While budget neutral, some of these realignments result in positions being eliminated and other positions being created. These include, a 1.0 office assistant position and $40,340 from School Counseling Services to fund a 1.0 fiscal assistant position within the Office of Student and Family Sup-port and Engagement; a 0.6 court liaison position and $79,994 from the Office of Student and Family Support and Engagement to Pupil Personnel and Attendance; a 1.0 coordinator position and $105,604 from Pupil Person-nel and Attendance to the Office of Student and Fam-ily Support and Engagement; $12,000 in psychologist part-time salaries from Psychological Services and a 1.0 secretary position and $37,837 from Pupil Personnel and Attendance Services to support a 1.0 supervisor posi-tion within the International Admissions and Enroll-ments unit, a 1.0 director I position and $146,276 from School Counseling Services to support a 1.0 supervisor position for International Admissions and Enrollments; and a 1.0 supervisor position for School Counseling Ser-vices. Lastly, there is a realignment of a 1.0 instructional specialist position and $106,840, a 1.0 elementary coun-selor position and $116,447, a 1.0 secretary position and 64,532, and a 1.0 administrative secretary I position and $63,275 from School Counseling Services to Interna-tional Admissions and Enrollments.
In addition to position realignments, there also are budget neutral realignments of non-position resources which include, $41,732 in professional part-time salaries, $40,636 in student transportation, $26,087 in instruc-tional materials, $9,400 in contractual services, $8,385 in stipends, $3,180 in office supplies, $868 in local travel mileage reimbursement, and $300 in dues, registrations, and fees from School Counseling Services to Interna-tional Admissions and Enrollments. These realignments will support operational needs for International Admis-sions and Enrollments.
CHAPTER 6 – 4 STUDENT SERVICES AND ENGAGEMENT

Office of Student and Family Support and Engagement522/556/551/552/555/557/558
There also are realignments that have increased this office budget by $253,061 and 2.0 FTE positions. These include, a 1.0 instructional specialist position and $105,604 to Pupil Personnel and Attendance from the Office of Curriculum and Instructional Programs in Chapter 4; a 1.0 supervisor position and $138,429 from Partnerships in Chapter 10, $4,621 in instructional mate-rials from Elementary Schools in Chapter 1 to fund the 1.0 fiscal assistant position within the Office of Student and Family Support and Engagement, and $29,842 to support pupil personnel worker salary adjustments. Lastly, there is a realignment of $22,435 from this budget to the Department of Employee and Retiree Services for employee benefits.
Program Efficiencies and Reductions—($378,447)The FY 2018 recommended budget for this office includes a comprehensive effort to identify potential program efficiencies and reductions. Stakeholders, including community partners and employee union representatives, participated in the program efficiencies and reduction process.
There is a reduction of $135,381 for contractual services, $65,000 for consultants, $61,920 for stipends, $30,500 for instructional materials, $25,000 for program sup-plies, $20,000 for supporting services part-time salaries, $19,274 for substitutes, $13,372 for professional part-time salaries, $5,000 for student transportation, and $3,000 for contractual maintenance. In summary, these reductions reflect current fiscal year spending, and will enable this office to effectively allocate needed resources to achieve more efficient business operations.
Strategic Accelerators—$120,000Focus on Community Partnerships and Engagement—$120,000For FY 2018, an additional $120,000 is added to the bud-get for the Office of Student and Family Support and Engagement. This additional funding will be used to create community and business partnerships to estab-lish summer work programs for Montgomery County high school teenagers and to enhance existing partner-ships focused on tutoring and instruction.
CHAPTER 6 – 5 STUDENT SERVICES AND ENGAGEMENT

FY 2018 OPERATING BUDGET
Office of Student and Family Support and Engagement
F.T.E. Positions 226.6
* Positions funded by the Title III LimitedEnglish Proficiency (ESOL) Grant referencedin Chapter 4, Office of Curriculum &Instructional Programs. Total fundedequals 15.9 positions.
Associate Superintendent 1.0Assistant to Associate Superintendent (N) 1.0Coordinator (N) 2.0Instructional Specialist (B–D) 1.0Administrative Services Manager I (17) 1.0Administrative Secretary I (14) 1.0Fiscal Assistant I (13) 1.0
Pupil Personnel and Attendance Services
Director I (P) 1.0Coordinator (N) 1.0Court Liaison Specialist (B–D) 0.6Instructional Specialist (B–D) 1.0Pupil Personnel Worker (B–D) 52.0Administrative Secretary II (15) 1.0
School Counseling Services
Supervisor (O) 1.0Instructional Specialist (B–D) 1.0Elementary Counselor (B–D) 1.0Administrative Secretary I (14) 1.0Secretary (12) 1.0
International Admissions and
Enrollments
Supervisor (O) 1.0Coordinator (N)* 1.0Admissions Specialist (B–D) 2.0ESOL Counselor (B–D) 7.5ESOL Transition
Counselor (22)* 9.9Intake Specialist II (20) 1.0Intake Specialist I (17) 2.0Administrative Secretary II (15) 1.0Office Assistant IV (11) 1.0
Student, Family, and School Services
Director I (P) 1.0Supervisor (O) 1.0Instructional Specialist (B–D)* 1.0Instructional Specialist (B–D) 1.0Parent Community
Coordinator (20) 32.0Parent Community
Coordinator (20)* 4.0Communication Assistant (16) 1.0Administrative Secretary II (15) 1.0Office Assistant IV (11) 1.0
Psychological Services
Director I (P) 1.0Coordinator (N) 2.0Instructional Assessment
Specialist (B–D) 5.0Psychologist (B–D) 91.5Speech Pathologist (B–D) 2.0Administrative Secretary II (15) 1.0Secretary (12) 1.0
CH
AP
TER 6 – 6 S
TUD
ENT S
ERV
ICES
AN
D EN
GA
GEM
ENT

Office of Student & Family Support & Engagement - 556/522/551/552/555/557/558
Actual FY 2017Budget
FY 2017Current
FY 2018Request
FY 2018
Summer EmploymentProfessional Substitutes (19,274)
Total Positions (FTE)Position Salaries
198.900$20,075,864
220.900$22,700,487
224.600$22,991,527
226.600$23,252,236
Other Salaries
01 Salaries & Wages
49,667 29,274 10,000
Stipends 221,359 221,359 159,439 (61,920)Professional Part Time
ConsultantsOther Contractual
OfficeOther Supplies & Materials
MediaInstructional Supplies & Materials
Textbooks
Subtotal Other Salaries
Leased Equipment
Grand Total
Other Equipment
Total Salaries & Wages
02 Contractual Services
Total Contractual Services
03 Supplies & Materials
Total Supplies & Materials
04 Other
Total Other
05 Equipment
Total Equipment
Supporting Services Part TimeOther
239,374177,506
239,374177,506
214,002161,858
(25,372)(15,648)
339,421
65,000468,755
533,755
65,000433,753
498,753
370,372
370,372 (128,381)
(63,381)(65,000)
208,526
192,26332,34495,845
320,452
192,26332,34492,845
317,452
161,76332,34467,845
261,952
(25,000)
(30,500)
(55,500)
20,511,611 23,388,393 23,659,040 23,797,535 138,495
435,747 687,906 667,513 545,299 (122,214)
$21,263,653 $24,478,640 $24,711,285 $24,705,899 ($5,386)
ChangeDescription FY 2016
2.000$260,709
Insur & Employee BenefitsUtilitiesMiscellaneous
204,095
116,286
236,040
116,286
236,040
156,286
276,040
40,000
40,000
Local/Other Travel 119,754 119,754 119,754
CHAPTER 6 – 7 STUDENT SERVICES AND ENGAGEMENT

DESCRIPTION CURRENTFYBUDGET
FYACTUAL
20172016 10Mon
FY 2017CAT
Office of Student & Family Support & Engagement 556/551/552/555/557/558/522
CHANGE2018FYFY 2018
REQUEST
556 Office of Stud. & Fam. Sup. & Egmt.
1 1.000 1.000Associate Superintendent 1.000
2 1.000 1.000Asst. to Assoc SuptN 1.000
7 1.000 1.000CoordinatorN 1.0002.000
7 .600 .600Court Liaison SpecialistBD (.600)7 1.000 1.000Instructional SpecialistBD 1.000
7 1.000 1.000Admin Services Manager I17 1.000
7 1.000 1.000Administrative Secretary I14 1.000
7 Fiscal Assistant I13 1.0001.000
6.600 6.600Subtotal 8.000 1.400
522 Student, Family, and School Services
2 1.000Chief Engage & Partn Officer2 1.000 1.000 1.000Director IP 1.000
3 1.000SupervisorO 2 1.000SupervisorO 1.0001.000
2 1.000Asst. to Assoc SuptN 2 1.000CoordinatorN 2 1.000 1.000 1.000Instructional SpecialistBD 1.000
3 1.000 1.000Instructional SpecialistBD 2 .800XTeacherAD 2 3.000Partnerships Manager24 3 12.000 21.000 32.000Parent Community Coord20 32.000
1 1.000Admin Services Manager I17 2 1.000 1.000 1.000Communications Assistant16 1.000
2 2.000 1.000 1.000Administrative Secretary II15 1.000
2 1.000 1.000 1.000Office Assistant IV11 1.000
28.800 27.000 37.000Subtotal 38.000 1.000
555 International Admin. & Enroll.
7 1.000 1.000 1.000Director IP (1.000)7 SupervisorO 1.0001.000
7 2.000 2.000 2.000Intnl Students Admission SpecBD 2.000
3 1.000 1.000 1.000Instructional SpecialistBD (1.000)3 9.500 7.500XCounselorBD 7.500
3 1.000 1.000 1.000Elem Counselor Spec AssignBD (1.000)3 4.300ESOL Transition Counselor22 7 1.000 1.000 1.000ISAO Intake Specialist II20 1.000
7 2.000 2.000 2.000ISAO Intake Specialist I17 2.000
7 1.000 1.000 1.000Administrative Secretary II15 1.000
7 1.000 1.000 1.000Administrative Secretary I14 (1.000)7 1.000 1.000 1.000Secretary12 (1.000)7 2.000 2.000 2.000Office Assistant IV11 (1.000)1.000
13.000 26.800 20.500Subtotal 15.500 (5.000)
557 Pupil Personnel & Attendance Services
1 1.000 1.000Director IP 1.000
7 2.000 2.000CoordinatorN (1.000)1.000
7 Court Liaison SpecialistBD .600.600
7 Instructional SpecialistBD 1.0001.000
CHAPTER 6 – 8 STUDENT SERVICES AND ENGAGEMENT

DESCRIPTION CURRENTFYBUDGET
FYACTUAL
20172016 10Mon
FY 2017CAT CHANGE
2018FYFY 2018
REQUEST
557 Pupil Personnel & Attendance Services
7 52.000 52.000Pupil Personnel WorkerBD 52.000
1 1.000 1.000Administrative Secretary II15 1.000
7 1.000 1.000Secretary12 (1.000)
57.000 57.000Subtotal 56.600 (.400)
551 Psychological Services
7 1.000Director IIQ 7 2.000 1.000 1.000Director IP 1.000
7 4.000 1.000 1.000CoordinatorN 1.000
7 .600Court Liaison SpecialistBD 7 2.000Instructional SpecialistBD 7 50.000Pupil Personnel WorkerBD 3 61.000 66.000 66.000PsychologistBD 66.000
3 17.500 20.500 20.500XPsychologist - 10 MonthBD 20.500
7 1.000Administrative Secretary III16 7 2.000 1.000 1.000Administrative Secretary II15 1.000
7 1.000Administrative Secretary I14 2 1.000Secretary12
143.100 89.500 89.500Subtotal 89.500
552 Bilingual Assessment Team
2 1.000 1.000CoordinatorN 1.000
2 6.000 5.000 5.000Instruct Assessment SpecBD 5.000
3 5.000 5.000 5.000PsychologistBD 5.000
3 2.000 2.000 2.000XSpeech PathologistBD 2.000
2 1.000 1.000 1.000Secretary12 1.000
14.000 14.000 14.000Subtotal 14.000
558 School Counseling
7 SupervisorO 1.0001.000
3 Instructional SpecialistBD 1.0001.000
3 Elem Counselor Spec AssignBD 1.0001.000
7 Administrative Secretary I14 1.0001.000
7 Secretary12 1.0001.000
Subtotal 5.000 5.000
220.900198.900 224.600Total Positions 226.600 2.000
Office of Student & Family Support & Engagement 556/551/552/555/557/558/522
CHAPTER 6 – 9 STUDENT SERVICES AND ENGAGEMENT

Chapter 7
Operations
Operations PAGE
Chief Operating Officer ..................................................... 7-3
Entrepreneurial Activities Fund........................................... 7-8
Office of the Chief Financial Officer ............................. 7-11
Budget Unit ......................................................................... 7-14
School and Financial Operations Team ..................................... 7-14
Financial Services ................................................................ 7-14
Division of Controller ............................................................ 7-18
Department of Employee and Retiree Services .......... 7-21
Department of Association Relations .......................... 7-28
Department of Facilities Management ........................ 7-33
Real Estate Management Fund .......................................... 7-39
Division of Construction ........................................................ 7-42
Division of Long-range Planning .............................................. 7-45
Division of Maintenance ........................................................ 7-48
Division of School Plant Operations ......................................... 7-53
Department of Transportation ...................................... 7-57
Field Trip Fund ................................................................ 7-65
Department of Materials Management ....................... 7-68
Editorial, Graphics, and Publishing Services ............................... 7-74
Procurement Unit ................................................................ 7-77
Division of Food and Nutrition Services .................................... 7-80
Department of School Safety and Security ................. 7-84

34.750
By Object of Expenditure
Summary of Resources
Operations
(.850)
OBJECT OF EXPENDITURE FY 2016 FY 2017 FY 2017 FY 2018 FY 2018ACTUAL BUDGET CURRENT BUDGET CHANGE
35.60035.600
4,316.776 4,316.776 46.9004,280.626
18,800,010
12,415,964 11,327,652 13,719,140
39,058,415 39,444,379
11,297,652
14,120,870
39,160,473
15,166,368
18,304,405
495,605 1,045,498 1,048,498 1,116,978 68,480
14,169,159 14,499,842 330,683
15,217,657 15,616,820 399,163
202,051,246
39,078,415
212,103,472 212,229,761 209,885,598 (2,344,163)
197,110
2,391,488
245,894
385,964
(1,227)247,121 247,121
505,370,490 566,688,636 566,688,636 582,140,108 15,451,472
35,805,655 38,716,618 38,716,618 37,716,588 (1,000,030)
8,952,159 9,876,032 9,876,032 10,884,709 1,008,677
550,325,414 615,528,407 615,528,407 630,987,299 15,458,892
16,475,490 16,475,490 17,205,406 729,916
$894,483,436 $911,241,822
POSITIONS
Administrative
TOTAL POSITIONS
01 SALARIES & WAGES
Administrative
OTHER SALARIES
Administrative
Professional
Supporting Services
TOTAL OTHER SALARIES
TOTAL SALARIES AND WAGES
02 CONTRACTUAL SERVICES
03 SUPPLIES & MATERIALS
04 OTHER
Local/Other Travel
Insur & Employee Benefits
Utilities
Miscellaneous
TOTAL OTHER
05 EQUIPMENT
GRAND TOTAL AMOUNTS
$4,784,194 $5,020,031 $5,055,031
4,363.676
TOTAL POSITION DOLLARS 183,251,236 196,937,104 197,012,104 194,268,778 (2,743,326)
$4,894,201 ($160,830)
$894,619,725 $16,622,097
15,512,273
$819,465,370
49.650 49.650 51.500 1.850
3.0004,274.426 45.9004,228.526 4,228.526
3.0003.000ProfessionalSupporting Services
34.70049.650
5.0004,191.276
370,852 370,852
183,693,389186,449,070 (2,755,681)526,603
173,058,005370,852
186,409,070
Professional
Supporting Services
4,882,434 5,137,151 5,137,151 5,310,336 173,185Business/Operations Admin.
Business/Operations Admin.
CHAPTER 7 – 1 OPERATIONS
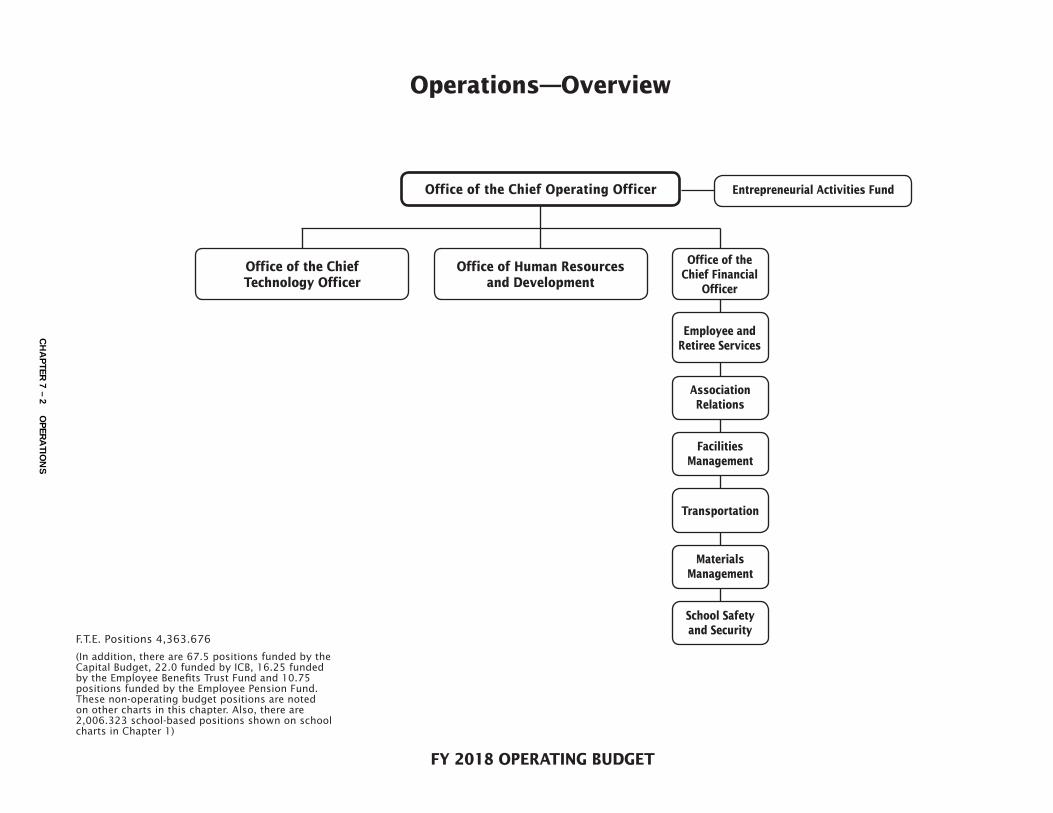
FY 2018 OPERATING BUDGET
Operations—Overview
Office of the Chief Operating Officer Entrepreneurial Activities Fund
F.T.E. Positions 4,363.676
(In addition, there are 67.5 positions funded by the Capital Budget, 22.0 funded by ICB, 16.25 funded by the Employee Benefits Trust Fund and 10.75 positions funded by the Employee Pension Fund. These non-operating budget positions are noted on other charts in this chapter. Also, there are 2,006.323 school-based positions shown on school charts in Chapter 1)
Office of Human Resources and Development
Employee and Retiree Services
Office of the Chief Financial
Officer
School Safety and Security
Facilities Management
Association Relations
Materials Management
Transportation
Office of the Chief Technology Officer
CH
AP
TER 7 – 2 O
PER
ATIO
NS
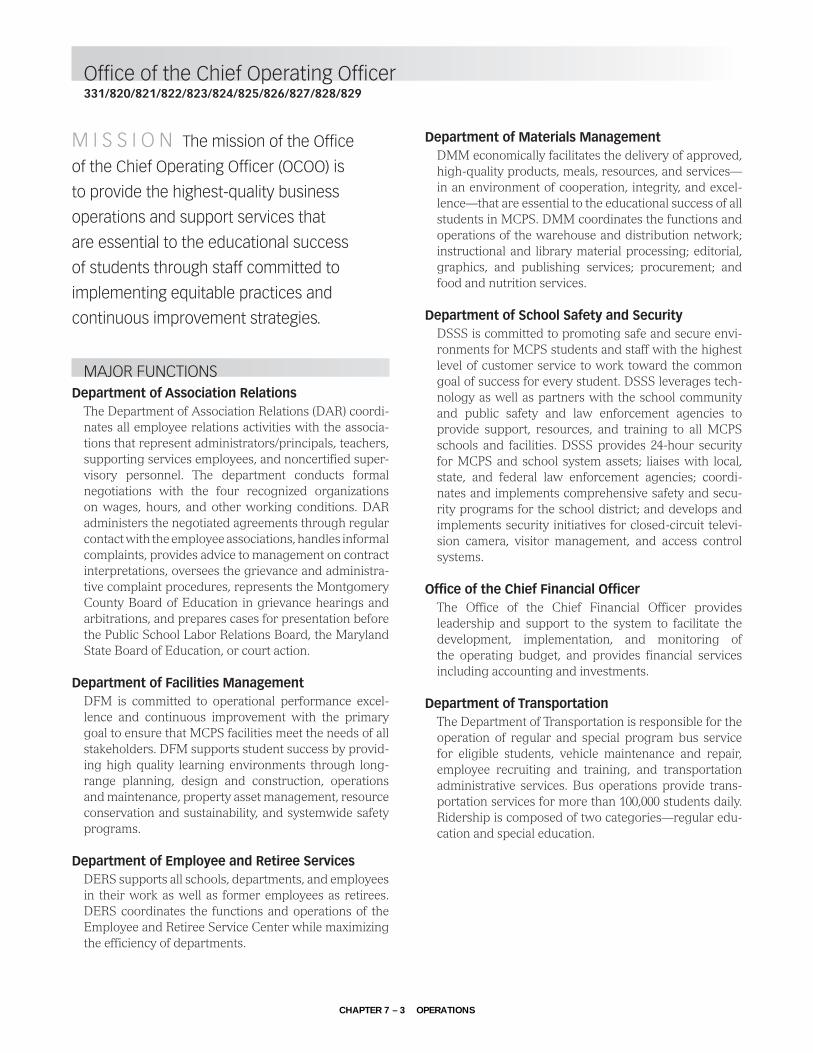
Office of the Chief Operating Officer331/820/821/822/823/824/825/826/827/828/829
M I S S I O N The mission of the Office
of the Chief Operating Officer (OCOO) is
to provide the highest-quality business
operations and support services that
are essential to the educational success
of students through staff committed to
implementing equitable practices and
continuous improvement strategies.
MAJOR FUNCTIONSDepartment of Association Relations
The Department of Association Relations (DAR) coordi-nates all employee relations activities with the associa-tions that represent administrators/principals, teachers, supporting services employees, and noncertified super-visory personnel. The department conducts formal negotiations with the four recognized organizations on wages, hours, and other working conditions. DAR administers the negotiated agreements through regular contact with the employee associations, handles informal complaints, provides advice to management on contract interpretations, oversees the grievance and administra-tive complaint procedures, represents the Montgomery County Board of Education in grievance hearings and arbitrations, and prepares cases for presentation before the Public School Labor Relations Board, the Maryland State Board of Education, or court action.
Department of Facilities ManagementDFM is committed to operational performance excel-lence and continuous improvement with the primary goal to ensure that MCPS facilities meet the needs of all stakeholders. DFM supports student success by provid-ing high quality learning environments through long-range planning, design and construction, operations and maintenance, property asset management, resource conservation and sustainability, and systemwide safety programs.
Department of Employee and Retiree ServicesDERS supports all schools, departments, and employees in their work as well as former employees as retirees. DERS coordinates the functions and operations of the Employee and Retiree Service Center while maximizing the efficiency of departments.
Department of Materials ManagementDMM economically facilitates the delivery of approved, high-quality products, meals, resources, and services—in an environment of cooperation, integrity, and excel-lence—that are essential to the educational success of all students in MCPS. DMM coordinates the functions and operations of the warehouse and distribution network; instructional and library material processing; editorial, graphics, and publishing services; procurement; and food and nutrition services.
Department of School Safety and SecurityDSSS is committed to promoting safe and secure envi-ronments for MCPS students and staff with the highest level of customer service to work toward the common goal of success for every student. DSSS leverages tech-nology as well as partners with the school community and public safety and law enforcement agencies to provide support, resources, and training to all MCPS schools and facilities. DSSS provides 24-hour security for MCPS and school system assets; liaises with local, state, and federal law enforcement agencies; coordi-nates and implements comprehensive safety and secu-rity programs for the school district; and develops and implements security initiatives for closed-circuit televi-sion camera, visitor management, and access control systems.
Office of the Chief Financial OfficerThe Office of the Chief Financial Officer provides leadership and support to the system to facilitate the development, implementation, and monitoring of the operating budget, and provides financial services including accounting and investments.
Department of TransportationThe Department of Transportation is responsible for the operation of regular and special program bus service for eligible students, vehicle maintenance and repair, employee recruiting and training, and transportation administrative services. Bus operations provide trans-portation services for more than 100,000 students daily. Ridership is composed of two categories—regular edu-cation and special education.
CHAPTER 7 – 3 OPERATIONS

Office of the Chief Operating Officer331/820/821/822/823/824/825/826/827/828/829
OVERVIEW OF BUDGET CHANGES
FY 2018 RECOMMENDED BUDGET
The FY 2018 recommended budget for this office
is $5,443,093, an increase of $1,720,000 over the
current FY 2017 budget.
Same Service Level Changes—$1,720,000Realignments to Meet Expenditure Requirements and Priorities—($280,000)There are no realignments that impact the overall tax-supported budget within the Office of the Chief Operating Officer. Within the Entrepreneurial Activities Fund, there are a number of realignments budgeted to address pri-ority spending needs that are neutral overall and reflect the actual costs of the programs. There is a realignment of $280,000 from the Tech Services Fund to the Field Trip Fund to support additional costs for field trip services. The increase can be made as a result of increased revenue in the Field Trip Fund.
Other—$2,000,000There are no increases that impact the overall tax-sup-ported budget within the Office of the Chief Operating Officer. Within the Entrepreneurial Activities Fund, there is a $2,000,000 increase to accommodate the purchase of cameras on buses to enforce traffic laws for drivers who pass stopped school buses. Several MCPS school buses are currently equipped with automated cameras that will capture images of vehicles that pass buses that are stopped to pick up or drop off students. It is antici-pated that over 100 buses will have cameras by the end of FY 2017. When a violation is detected by the camera, and verified by the police, a $125 ticket will be issued to the owner of the vehicle. The revenue received from tick-ets will be used to cover the costs of the cameras, and all funds will be redistributed back to the Montgomery County Government.
CHAPTER 7 – 4 OPERATIONS

FY 2018 OPERATING BUDGET
Office of the Chief Operating Officer
F.T.E. Positions 12.5
Chief Operating Officer 1.0Executive Director (P) 1.0Director I (P) 2.0Instructional Specialist (B–D) 2.0Administrative Services Manager III (19) 1.0Copy Editor/Administrative Secretary I (17) 1.0Administrative Services Manager I (17) 1.0Administrative Secretary II (15) 1.0Administrative Secretary I (14) 1.0Secretary (12) 1.5C
HA
PTER
7 – 5 OP
ERA
TION
S

Office of the Chief Operating Officer - 331
Actual FY 2017Budget
FY 2017Current
FY 2018Request
FY 2018
Summer EmploymentProfessional Substitutes
Total Positions (FTE)Position Salaries
16.500$1,682,499
12.500$1,322,249
12.500$1,322,249
12.500$1,322,249
Other Salaries
01 Salaries & Wages
StipendsProfessional Part Time
ConsultantsOther Contractual
OfficeOther Supplies & Materials
MediaInstructional Supplies & Materials
Textbooks
Subtotal Other Salaries
Leased Equipment
Grand Total
Other Equipment
Total Salaries & Wages
02 Contractual Services
Total Contractual Services
03 Supplies & Materials
Total Supplies & Materials
04 Other
Total Other
05 Equipment
Total Equipment
Supporting Services Part TimeOther
15,300 15,300 15,300
2,579
21,536
2,500900
3,400
2,500900
3,400
2,500900
3,400
7,243
6,900
6,900
6,900
6,900
6,900
6,900
1,691,808 1,340,128 1,340,128 1,340,128
2,579 2,579
9,309 17,879 17,879 17,879
$1,727,120 $1,358,291 $1,358,291 $1,358,291
ChangeDescription FY 2016
Insur & Employee BenefitsUtilitiesMiscellaneous
6,533 7,863 7,863 7,863
Local/Other Travel 7,863 7,863 7,863
CHAPTER 7 – 6 OPERATIONS

DESCRIPTION CURRENTFYBUDGET
FYACTUAL
20172016 10Mon
FY 2017CAT
Office of the Chief Operating Officer - 331
FY 2018CHANGE
FY 2018
REQUEST
1 1.000 1.000 1.000Chief Operating Officer 1.000
2 1.000 1.000 1.000Director IP 1.000
2 1.000 1.000 1.000Director IP 1.000
1 2.000 1.000 1.000Executive DirectorP 1.000
1 1.000Admin for Business and FinanceM 2 2.000 2.000 2.000Instructional SpecialistBD 2.000
2 1.000Fiscal Specialist I24 1 1.000 1.000 1.000Admin Services Mgr III19 1.000
1 1.000 1.000 1.000Copy Editor/Admin Sec17 1.000
1 1.000 1.000 1.000Admin Services Manager I17 1.000
2 1.000 1.000 1.000Administrative Secretary II15 1.000
2 1.000Fiscal Assistant II15 2 1.000 1.000 1.000Administrative Secretary I14 1.000
2 1.500 1.500 1.500Secretary12 1.500
12.50016.500 12.500Total Positions 12.500
CHAPTER 7 – 7 OPERATIONS

FY 2018 OPERATING BUDGET
F.T.E. Positions 12.0
Entrepreneurial Activities Fund
Instructional Specialist (B–D) 1.0Communications Specialist/Web Producer (21) 1.0Printing Equipment Operator IV (18) 1.0Customer Service Specialist (16) 1.0School Registrar (16) 1.0Copier Repair Technician (15) 1.0Fiscal Assistant II (15) 2.0Printing Equipment Operator I (11) 2.0Truck Driver/Warehouse Worker Shift 1 (11) 2.0
CH
AP
TER 7 – 8 O
PER
ATIO
NS

Entrepreneurial Activities Fund - 820/821/822/823/824/825/826/827/828/829
Actual FY 2017Budget
FY 2017Current
FY 2018Request
FY 2018
Summer EmploymentProfessional Substitutes
Total Positions (FTE)Position Salaries
13.600$832,826
11.600$756,770
11.600$756,770
12.000$764,045
Other Salaries
01 Salaries & Wages
Stipends 44,457 44,457 47,937 3,480Professional Part Time
ConsultantsOther Contractual
OfficeOther Supplies & Materials
MediaInstructional Supplies & Materials
Textbooks
Subtotal Other Salaries
Leased Equipment
Grand Total
Other Equipment
Total Salaries & Wages
02 Contractual Services
Total Contractual Services
03 Supplies & Materials
Total Supplies & Materials
04 Other
Total Other
05 Equipment
Total Equipment
Supporting Services Part TimeOther
232,8095,798
232,8095,798
297,8095,798
16,239
65,000
572,090
490556,942
557,432
490556,942
557,432
4902,054,500
2,054,990 1,497,558
1,497,558
372,685
114,066
273,320
387,386
114,066
273,320
387,386
188,238
343,320
531,558
70,000
74,172
144,172
1,143,755 1,056,073 1,056,073 1,131,828 75,755
16,239 16,239
310,929 299,303 299,303 367,783 68,480
$2,421,382
55,109
10,000
$2,364,802
26,980
36,980
10,00026,980
36,980
$2,364,802
25,91526,980
52,895
$4,084,802
15,915
15,915
$1,720,000
ChangeDescription FY 2016
.400$7,275
Insur & Employee BenefitsUtilitiesMiscellaneous
277,743
308,146
326,931
308,146
326,931
294,746
313,531
(13,400)
(13,400)
Local/Other Travel 18,785 18,785 18,785
CHAPTER 7 – 9 OPERATIONS

DESCRIPTION CURRENTFYBUDGET
FYACTUAL
20172016 10Mon
FY 2017CAT CHANGE
2018FY
Entrepreneurial Activities Fund - 820/821/822/823/824/825/826/827/828
REQUEST
2018FY
820 Entrepreneurial Activities Fund
81 1.000 1.000 1.000Instructional SpecialistBD 1.000
81 1.000 1.000 1.000Fiscal Assistant II15 1.000
81 2.000 2.000 2.000Truck Drive/Whr Wkr Shift 111 2.000
4.000 4.000 4.000Subtotal 4.000
822 Printing Services
81 1.000 1.000 1.000Printing Equipment Operator IV18 1.000
81 1.000 1.000 1.000Customer Service Spec16 1.000
81 1.000 1.000 1.000Fiscal Assistant II15 1.000
81 1.000 1.000 1.000Copier Repair Technician15 1.000
81 2.000 2.000 2.000Printing Equip Operator I11 2.000
6.000 6.000 6.000Subtotal 6.000
823 Student Online Learning
81 1.000 1.000 1.000Comm Spec/Web Producer21 1.000
81 .600 .600 .600School Registrar16 .4001.000
1.600 1.600 1.600Subtotal .4002.000
827 Pearson North Star Project
81 2.000Instructional SpecialistBD
2.000Subtotal
11.60013.600 11.600Total Positions .40012.000
CHAPTER 7 – 10 OPERATIONS

Office of the Chief Financial Officer312/336/340/798/999/155/332
M I S S I O N The office of the Chief
Financial Officer (OCFO) facilitates the
alignment of the district strategic priorities
with financial resources that results in MCPS
providing the highest quality education and
opportunities for all students to succeed.
MAJOR FUNCTIONS
Operating Budget DevelopmentOCFO provides guidance and support to executive staff and program managers on the preparation and formu-lation of the operating budget for MCPS. The budget is developed using student outcomes, demographic data, fiscal data and trends, and enrollment data to ensure resources are aligned with strategic priorities. OCFO works closely with county government, county coun-cil, and state education officials to monitor funding and develop options and recommendations on the operat-ing budget that are provided to the superintendent of schools and the Board of Education. The office facilitates the review of the operating budget and communicates budget information within MCPS, to the county and state, and to the public through a variety of publications, forums, and presentations to strengthen collaboration and to ensure resources are available to address student and school needs.
In order to enhance transparency, and engage parents, students, employees, and community, the office is focus-ing on improving the clarity of budget and fiscal infor-mation in all budget documents, on the MCPS Budget 101 webpage and through other forms of communica-tion. The enhanced communication will emphasize how MCPS operating budget resources are aligned with the district strategic priorities.
Operating Budget Administration Through regular financial monitoring and data-driven analysis, OCFO maintains controls for current-year revenues and expenditures to ensure that the operat-ing budget is implemented as approved. OCFO strives to make accurate forecasts in order to make decisions regarding current and future budgets. In FY 2017 new processes are being implemented to improve accuracy of forecasts. The office conducts regular reviews of the financial condition of the MCPS operating budget with executive staff by examining all expenditure accounts and preparing expenditure and revenue projections.
Detailed financial reports are prepared for the super-intendent of schools and the Board of Education. In addition, OCFO collaborates with the Office of Human Resources and Development to review position man-agement data to ensure fiscal control.
Financial ServicesThe Division of Controller (DOC) prepares the financial statements, statistical reports, and other accounting reports; provides for internal controls of all accounting activities; prepares required federal, state, and other reports; processes accounting transactions; supports procurement card activity; collects amounts owed to MCPS; makes all payments on behalf of MCPS; and coordinates system cash including the Centralized Investment fund. DOC provides accounting services to the MCPS Educational Foundation, a 501(c)(3) corpora-tion. DOC brings central services resources to support schools through support of the School Funds Online and Online School Payments systems, along with a visiting bookkeeper program for elementary schools and special centers. This central effort reduces burden on schools so that school-based employees can focus on the critical work of teaching and learning for all students. DOC also collects the student extracurricular activity fund fee and manages the federal Impact Aid program.
The investment and retirement function of this unit administers contracts related to the MCPS Employees’ Retirement and Pension Systems, oversees the opera-tion of the 403(b) and 457(b) plans, serves as liaison to the Board of Investment Trustees, and monitors plan investment performance. DOC supports these areas through accounting and reporting.
Resource Allocation, Management, and SupportOCFO works closely with all offices and schools to implement a system to allocate resources to schools based on school, student, and program need. The office collaborates with stakeholders to ensure guidelines for allocations are aligned with system priorities and differ-entiated to meet student need.
All positions and resources are allocated based on a careful review of data. Initial staffing allocations occur in March before the start of the school year and are adjusted throughout the year based on a review of enrollment as well as program and student data. In FY 2017, additional staffing funds were approved to lower class size in schools with the most need based on student performance data.
OCFO uses data to guide the equitable allocation of resources and to monitor the responsible management of
CHAPTER 7 – 11 OPERATIONS
Office of the Chief Financial Officer312/336/340/798/999/155/332
financial, material, and staffing resources for schools that are essential to high quality educational programs and Academic Excellence for All students. Non-position allo-cations for textbooks, media center, instructional materi-als, and guidance/clerical support are differentiated based on enrollment to ensure that teachers have the resources needed to teach and students have the resources needed to learn. Other non-position allocations are strategically aligned with system goals and differentiated based on the percent of Free and Reduced-price Meals (FARMS) stu-dents and/or proportion of at-risk groups of students in an effort to leverage additional resources to more highly impacted schools. Examples include allocations for fur-niture/equipment replacement and minority achieve-ment extracurricular activity programs. Also, funds are allocated to high schools to help defray the costs asso-ciated with drama, newspapers, and literary magazines. Beginning in FY 2017, additional funding for drama, newspapers, and literary magazines is allocated based on the school’s FARMS percentage, rather than through mini-grants, to ensure support for the neediest schools that may struggle to build new or more robust programs where fund-raising, ticket sales, and donations are not sufficient to offset program expenses.
Non-position allocations including funding for text-books, media, and instructional materials are made in May prior to the start of the school year and are adjusted when final enrollment numbers are confirmed in the fall. Other non-position allocations to schools include extra-curricular program funding, furniture and equipment replacement funds, music program support, and out-door education staffing resources. Utilization is moni-tored throughout the year through financial monitoring, reporting, and analysis of financial data.
OCFO works to promote operational excellence by ensuring that schools have the knowledge, understand-ing, and tools necessary to manage their resources efficiently and effectively. The office collaborates with offices and schools to ensure an understanding of the resources available to support K-12 teaching and learn-ing including the purpose of funding, the guidelines and timelines for use of the funds, and processes for accessing the funds. The office provides leadership for the coordination of resources and supports related to school business and financial management of operating fund allocations and local school Independent Activ-ity Funds (IAF). OCFO utilizes data from school audit reports and surveys to identify target areas where addi-tional supports are needed and to guide the continuous improvement of training and resources for school finan-cial agents and school administrators.
MEASURESM E A S U R E : Financial projections are within 5% of the end-of-year funds available.
FY 2016Actual
FY 2017Estimate
FY 2018Recommended
6.3% 5.5% 5.0%
E X P L A N A T I O N : This measure reflects the difference between projected end of year funds available and actual surplus/deficit. The office minimizes these variances through the use of regular financial monitoring and data-driven analysis.
M E A S U R E : The percentage of schools with less than three repeat audit findings will increase as resources and supports for school finance are improved*
FY 2016Actual
FY 2017Estimate
FY 2018Recommended
85% 87% 93%
*Percentage is based on the number of schools audited each year which is variable. Typically, high schools are audited every 12-18 months, middle schools are audited every 18 months, elementary and special schools are audited every three years.
E X P L A N A T I O N : This measures the effectiveness of supports and resources for school financial agents and administrators.
Division of Controller Accounts Payable
Invoice-to-Payment DaysFY 2016Actual
FY 2017Estimate
FY 2018Recommended
15.75 days 15 days 15 days
Number of Invoices Processed Monthly Per FTEFY 2016Actual
FY 2017Estimate
FY 2018Recommended
956 1,000 1,000
Percentage of Supplier Invoices Received Electronically
FY 2016Actual
FY 2017Estimate
FY 2018Recommended
16.11% 18% 18%
E X P L A N A T I O N : Measures the efficiency of the accounts payable operation in paying MCPS vendors.
CHAPTER 7 – 12 OPERATIONS

Office of the Chief Financial Officer312/336/340/798/999/155/332
OVERVIEW OF BUDGET CHANGES
FY 2018 RECOMMENDED BUDGET
The FY 2018 recommended budget for this office
is $10,745,291, an increase of $22,037 over the
current FY 2017 budget. An explanation of this
change follows.
Same Service Level Changes—$22,037Realignments to Meet Expenditure Requirements and Program Priorities—$22,037 Realignments are budgeted to address priority spend-ing needs in this office. There are several budget neutral position realignments within this office that reflect the overall operations of this office. The following include a realignment of a 1.0 chief strategy officer position to a 1.0 chief financial officer position; a 1.0 administra-tive secretary III position to a 1.0 administrative services manager position; and a 0.75 fiscal assistant III position to a 0.75 position management assistant position.
In addition, the FY 2018 recommended budget includes realignments that result in an overall budget neutral set of realignments between departments and offices. There is a realignment of a 1.0 supervisor position and $147,830 from this office to the Office of the Chief Academic Offi-cer. In addition, there is a realignment of $141,398 and a 1.0 position from the Department of Employee and Retiree Services to this office to create a 1.0 director of finance position. These realignments result in a net reduction of $6,432 in this office. Lastly, there is a budget neutral realignment within this office allowing for the creation of a 0.5 administrative secretary III position.
In the Division of Controller, there is a realignment of $31,415 from supporting services part-time salaries to partially fund the creation of a 1.0 extracurricular activi-ties (ECA) receipts assistant position. In addition, there is a realignment from the Department of Facilities Man-agement of $28,469 to this division to support costs for bank fees related to extracurricular activity fee transac-tions, software upgrades for production of the Compre-hensive Annual Financial Report, and remaining funds to support the ECA receipts assistant position. Realign-ments to the Division of Controller result in an overall net increase of $28,469 to this division.
Provision for Future Support Projects Recent Funding History
FY 2017Budgeted7/1/16
FY 2017Projected11/30/16
FY 2018Projected7/1/17
Other $6,731,204 $6,731,204 $6,731,204
Total $6,731,204 $6,731,204 $6,731,204
CHAPTER 7 – 13 OPERATIONS

FY 2018 OPERATING BUDGET
Office of the Chief Financial Officer
Chief Financial Officer (Q) 1.0Administrative Services Manager (17) 1.0
F.T.E. Positions 17.25
(* In addition, the chart includes 1.0 position funded by the Employee Benefits Trust Fund and 3.25 positions funded by the Employee Pension fund.)
Budget Unit
Supervisor (O) 1.0Budget Specialist IV (27) 2.0Budget Specialist III (26) 2.0Budget Specialist II (25) 1.0Budget Specialist I (24) 2.0Position Management
Assistant (17) 0.75Administrative
Secretary I (14) 1.0
School and Financial Operations Team
Supervisor, Allocations and Support (O) 1.0
Administrator for Business and Finance Support (M) 1.0
Fiscal Specialist I (24) 1.0Fiscal Assistant II (15) 1.0
Financial Services
Director of Finance II (Q) 1.0Administrative Secretary III (16) 0.5
Investments
Chief Investment Officer (P) 1.0**Investment Analyst (26) 1.75**Specialist, Insurance,
and Retirement (19) 1.0*Administrative Secretary III (16) 0.5**
Division of Controller
CH
AP
TER 7 – 14 O
PER
ATIO
NS

Office of the Chief Financial Officer - 312/336/340/798
Actual FY 2017Budget
FY 2017Current
FY 2018Request
FY 2018
Summer EmploymentProfessional Substitutes
Total Positions (FTE)Position Salaries
11.375$945,852
16.750$1,654,863
16.750$1,729,863
17.250$1,726,187
Other Salaries
01 Salaries & Wages
StipendsProfessional Part Time
ConsultantsOther Contractual
OfficeOther Supplies & Materials
MediaInstructional Supplies & Materials
Textbooks
Subtotal Other Salaries
Leased Equipment
Grand Total
Other Equipment
Total Salaries & Wages
02 Contractual Services
Total Contractual Services
03 Supplies & Materials
Total Supplies & Materials
04 Other
Total Other
05 Equipment
Total Equipment
Supporting Services Part TimeOther
50,0002,824
53,00051,113
53,00048,357 (2,756)
5,270
65,304
65,304
65,304
65,304
65,304
65,304
3,402
3,24826,357
29,605
13,24826,357
39,605
13,24826,357
39,605
945,852 1,707,687 1,833,976 1,827,544 (6,432)
52,824 104,113 101,357 (2,756)
$1,012,906 $1,871,105 $2,007,394 $2,000,962 ($6,432)
ChangeDescription FY 2016
.500($3,676)
Insur & Employee BenefitsUtilitiesMiscellaneous
58,382
68,200
68,509
68,200
68,509
68,200
68,509
Local/Other Travel 309 309 309
CHAPTER 7 – 15 OPERATIONS

Provision for Future Supported Projects - 999
Actual FY 2017Budget
FY 2017Current
FY 2018Request
FY 2018
Summer EmploymentProfessional Substitutes
Total Positions (FTE)Position Salaries
Other Salaries
01 Salaries & Wages
StipendsProfessional Part Time
ConsultantsOther Contractual
OfficeOther Supplies & Materials
MediaInstructional Supplies & Materials
Textbooks
Subtotal Other Salaries
Leased Equipment
Grand Total
Other Equipment
Total Salaries & Wages
02 Contractual Services
Total Contractual Services
03 Supplies & Materials
Total Supplies & Materials
04 Other
Total Other
05 Equipment
Total Equipment
Supporting Services Part TimeOther 4,389,256
277,994
662,328
662,328
662,328
662,328
662,328
662,328
232,428
837,525
837,525
837,525
837,525
837,525
837,525
2,340,199 4,389,256 4,389,256 4,389,256
4,389,256 4,389,256
2,340,199 4,389,256 4,389,256 4,389,256
$3,307,875
26,751
598
$6,731,204
598
598
598
$6,731,204
598
598
$6,731,204
ChangeDescription FY 2016
Insur & Employee BenefitsUtilitiesMiscellaneous
430,503
841,497
841,497
841,497
841,497
841,497
841,497
Local/Other Travel
CHAPTER 7 – 16 OPERATIONS

DESCRIPTION CURRENTFYBUDGET
FYACTUAL
20172016 10Mon
FY 2017CAT CHANGE
2018FY
Office of the Chief Financial Officer - 312/336/798/340
REQUEST
2018FY
312 Office of Chief Financial Officer
1 Chief Financial OfficerQ 1.0001.000
1 1.000 1.000Chief Strategy OfficerQ (1.000)1 2.000 1.000SupervisorO (1.000)2 1.000SupervisorO (1.000)1 Admin Services Manager I17 1.0001.000
1 1.000 1.000Administrative Secretary III16 (1.000)
4.000 4.000Subtotal (2.000)2.000
336 Budget Unit
1 1.000Director IIQ 1 1.000 1.000 1.000SupervisorO 1.000
1 1.000Grants Specialist27 1 1.000 2.000 2.000Management & Budget Spec IV27 2.000
1 2.000 2.000 2.000Management & Budget Spec III26 2.000
1 1.000 1.000 1.000Management & Budget Spec II25 1.000
1 2.000 2.000 2.000Management & Budget Spec I24 2.000
1 Position Management Assistant17 .750.750
1 1.000Administrative Secretary III16 1 .750 .750 .750Fiscal Assistant III16 (.750)1 Administrative Secretary I14 1.0001.000
1 .625 1.000 1.000Secretary12 (1.000)
11.375 9.750 9.750Subtotal 9.750
798 K-12 and Financial Operations Team
2 SupervisorO 1.0001.000
1 1.000Admin for Business and FinanceM 2 1.000Admin for Business and FinanceM 1.000
2 1.000 1.000Fiscal Specialist I24 1.000
2 1.000 1.000Fiscal Assistant II15 1.000
3.000 3.000Subtotal 1.0004.000
340 Department of Financial Services
1 Director IIQ 1.0001.000
1 Administrative Secretary III16 .500.500
Subtotal 1.5001.500
16.75011.375 16.750Total Positions .50017.250
CHAPTER 7 – 17 OPERATIONS

FY 2018 OPERATING BUDGET
Division of Controller
F.T.E. Positions 24.0
(*In addition, the chart includes 2.0 positions funded by the Employee Benefits Trust Fund.)
Controller (P) 1.0Assistant Controller (N) 1.0Data Integration Specialist (23) 1.0Administrative Secretary II (15) 1.0
Payroll Accounting
Payroll Specialist (24) 1.0Staff Accountant (24) 1.0
General Accounting and Reporting
Senior Accountant (26) 1.0Staff Accountant (24) 2.0Staff Accountant (24) 1.0*
Elementary School Visiting Bookkeeper
Extracurricular Activities Fee Collection
ECA Receipts Assistant (15) 1.0
Accounts Receivable
Accounts Receivable Specialist (24) 1.0Accounts Receivable Assistant (16) 2.0Benefits Assistant (15) 1.0*
Accounts Payable
Accounts Payable Supervisor (G) 1.0Accounts Payable Assistant Supervisor (19) 1.0Accounts Payable Assistant (14) 9.0
CH
AP
TER 7 – 18 O
PER
ATIO
NS

Division of Controller - 332/155
Actual FY 2017Budget
FY 2017Current
FY 2018Request
FY 2018
Summer EmploymentProfessional Substitutes
Total Positions (FTE)Position Salaries
23.000$1,762,951
23.000$1,881,250
23.000$1,881,250
24.000$1,925,244
Other Salaries
01 Salaries & Wages
StipendsProfessional Part Time
ConsultantsOther Contractual
OfficeOther Supplies & Materials
MediaInstructional Supplies & Materials
Textbooks
Subtotal Other Salaries
Leased Equipment
Grand Total
Other Equipment
Total Salaries & Wages
02 Contractual Services
Total Contractual Services
03 Supplies & Materials
Total Supplies & Materials
04 Other
Total Other
05 Equipment
Total Equipment
Supporting Services Part TimeOther
44,166 44,166 12,75188,771
(31,415)
3,000
3,000 3,000
3,000
25,689
22,691
22,691
22,691
22,691
30,191
30,191
7,500
7,500
1,896,827 2,014,187 2,014,187 2,026,766 12,579
88,771 88,771
133,876 132,937 132,937 101,522 (31,415)
$1,896,156 $1,984,656 $1,984,656 $2,013,125 $28,469
ChangeDescription FY 2016
1.000$43,994
Insur & Employee BenefitsUtilitiesMiscellaneous
(26,360)
(52,786)
(52,222)
(52,786)
(52,222)
(47,396)
(46,832)
5,390
5,390
Local/Other Travel 564 564 564
CHAPTER 7 – 19 OPERATIONS

DESCRIPTION CURRENTFYBUDGET
FYACTUAL
20172016 10Mon
FY 2017CAT CHANGE
2018FY
Division of Controller - 332/155
REQUEST
2018FY
332 Division of Controller
1 1.000 1.000 1.000ControllerP 1.000
1 1.000 1.000 1.000Assistant ControllerN 1.000
1 1.000 1.000 1.000Accounts Payable SupervisorG 1.000
1 1.000 1.000 1.000Senior Accountant26 1.000
1 1.000 1.000 1.000Payroll Specialist24 1.000
1 1.000 1.000 1.000Accounts Receivable Specialist24 1.000
1 3.000 3.000 3.000Staff Accountant24 3.000
1 1.000 1.000 1.000Data Integration Specialist23 1.000
1 1.000 1.000 1.000Accts Payable Asst Supervisor19 1.000
1 2.000 2.000 2.000Accounts Receivable Assistant16 2.000
1 1.000 1.000 1.000Administrative Secretary II15 1.000
1 9.000 9.000 9.000Accounts Payable Assistant14 9.000
23.000 23.000 23.000Subtotal 23.000
155 Extracurricular Activity Fee Admin.
2 ECA Receipts Assistant15 1.0001.000
Subtotal 1.0001.000
23.00023.000 23.000Total Positions 1.00024.000
CHAPTER 7 – 20 OPERATIONS
Department of Employee and Retiree Services334/333
M I S S I O N The mission of the
Department of Employee and Retiree Services
(DERS) is to ensure broad access to accurate
and timely information using a fully integrated
suite of business applications that include
the Human Resources Information System
(HRIS), and the Lifeworks Retirement System.
We provide high-quality services to schools
and employees; and operate a comprehensive
employee compensation and benefits, loss
prevention, and risk management program
that supports success for every student
through the role of employee compensation
and benefits in attracting and retaining highly-
qualified staff.
MAJOR FUNCTIONSEmployee and Retiree Service Center
DERS is a single point of contact for employees and retirees for information about compensation and ben-efits. The unit provides administration of employee pro-grams such as payroll, health and retirement benefits, leave, salary administration, and workforce reporting. Smooth and effective operations of these functions are critical to provide prompt and careful response for employees’ questions and needs. DERS operates a call center, transactions unit, and communications pro-gram; provides support for policy implementation; and continually expands the use of technology to improve service and efficiency. The introduction and continued expansion of employee self-service applications have improved employee access to data, benefits enrollment, ePaystub, and tax forms, supporting employees’ ability to focus their efforts and attention on the needs of stu-dents and schools.
The cost of health insurance, including prescription plans, is a significant part of the MCPS Operating Budget, and this unit initiates efforts to contain costs, educates employees and retirees to become better health-care consumers, and provides high-quality health care at competitive prices. MCPS has taken the lead in working with other county agencies in joint procurement efforts
that combine the purchasing power of the agencies that resulted in millions of dollars of savings for each. High-quality benefits are a key contributor to the stra-tegic priority of human capital management, improving recruitment and retention of valuable employees.
The Benefits Strategy and Vendor Relations Unit is responsible for the design and delivery of employee and retiree benefit programs and manages all aspects of contract and vendor relations associated with the bene-fit plans. The unit collaborates with DERS staff to ensure that the benefit plans are administered according to contracts and regulations and that all stakeholders are operating from a common framework of understanding about the benefit plans. Staff is responsible for evaluat-ing vendor performance; conducting ongoing financial monitoring, budget, and rate development; managing the competitive bid process; and measuring perfor-mance on an ongoing basis.
MCPS compares its experience with the cost increases of our health benefits to national and regional peers. Over recent years, we have benefited from early adop-tion of wellness initiatives and plan design changes. DFS continually analyzes available data to evaluate current practices and strategically plan improvements, enhancements, and efficiencies that will strengthen the benefits offered to employees as well as ensure effective use of resources.
This unit prepares and disseminates information about plan provisions, maintains and analyzes statistical and demographic data, tracks plan utilization and expense data, remits monthly premiums to vendors, and over-sees all benefit-plan-related contracts. In addition, the unit manages required filings with the Internal Revenue Service to maintain qualified plan status and oversees banking and cash management arrangements for the employee benefit program. The unit also coordinates MCPS retiree benefits with Medicare.
CHAPTER 7 – 21 OPERATIONS

Department of Employee and Retiree Services334/333
MEASURESDERS Call Center Efficiency and Service
FY 2016Actual
FY 2017Estimate
FY 2018Recommended
Average wait time
1 min. 28 sec. 1 min. 30 sec. 1 min. 30 sec.Average duration
4 min. 42 sec. 4 min. 30 sec. 4 min. 30 sec. Average volume/business day
285 calls 290 calls 300 callsAverage wait time for abandoned calls
2 min. 10 sec. 2 min. 2 min.Percentage of abandoned calls
11.4% 10% 10%Percentage of calls answered within 1 minute
49% 50% 51%
DERS Satisfaction Survey ResultsPercentage of employees responding that the staff mem-ber assisting them was courteous.FY 2016Actual
FY 2017Estimate
FY 2018Recommended
Telephone
95.3% 96% 97%E-mail
88.9% 90% 91%
Percentage of employees responding that they received a timely response.FY 2016Actual
FY 2017Estimate
FY 2018Recommended
Telephone
86.3% 88% 89%E-mail
76.3% 77% 78%
E X P L A N A T I O N : These measures help the unit assess service levels to employees and retirees through the call center as well as customer satisfaction levels.
Health BenefitsYear-to-year trend in growth rates of benefit costs com-pared with national averages.
FY 2016Actual
FY 2017Estimate
FY 2018Recommended
-2.4% -1.0% -1.0%
Trend in growth rate of benefit costs compared with regional peers.
FY 2016Actual
FY 2017Estimate
FY 2018Recommended
-1.5% -1.0% -1.0%
E X P L A N A T I O N : These two measures compare the rate of increase in costs for employee and retiree health
benefits (medical, prescription, dental, and vision programs) compared with other organizations, either in the region or the nation. The rate of increase in costs is a measure of the effectiveness of the program administration and design. Differences in costs may be a result of a state-mandated coverage that is different from other parts of the country, so the regional comparison is important.
OVERVIEW OF BUDGET CHANGES
FY 2018 RECOMMENDED BUDGET
The FY 2018 recommended budget for this
department is $570,079,583, an increase of $15,524,014 over the current FY 2017 budget.
An explanation of this change follows.
Same Service Level Changes—$19,270,524Continuing Salary Costs—($2,434,251)Negotiations with our employee associations for new contracts (effective July 1, 2017) began in October 2016, and are continuing as of this publication. As a result, the proposed FY 2018 Superintendent’s Operating Bud-get does not include employee negotiated salary costs. There is decrease of $1,630,948 for social security ben-efits and $803,303 for retirement benefits for current employees as a result of the reduction in salaries for lapse and turnover totaling $20,370,303.
Realignments to Meet Expenditure Requirements and Program Priorities—($75,414)Realignments are budgeted to address priority spending needs for the organization. Due to the need to realign funds to create additional position and non-position salaries within specific organizational units, there are increases in social security contributions of $33,107 and retirement contributions of $16,077.
Within the Department of Employee and Retiree Ser-vices, the FY 2018 recommended budget includes a reor-ganization that results in an overall budget neutral set of realignments between departments and offices. There is a realignment of $141,398 and a 1.0 director position from this department to the Office of the Chief Finan-cial Officer. In addition, there were several budget neu-tral realignments resulting from a change in status for employee salary charges by funding source. These posi-tions have been reevaluated and appropriately charged to either the Employee Pension Fund, Employee Benefits Plan Fund and/or the Tax-Supported Operating Budget.
CHAPTER 7 – 22 OPERATIONS

Department of Employee and Retiree Services334/333
In addition, there is a realignment of $16,800 from other areas within the Office of the Chief Operating Officer to this department to support additional costs for contrac-tual services, supporting services part-time salaries and the position realignments.
Other—$286,447As part of the periodic evaluation of employee salary charges by fund, there was a shift in charges of 4.5 transaction assistant positions and $197,973 from the Employee Benefits Plan Fund to the Tax-Supported Operating Budget under the Department of Employee and Retiree Services. The budget also includes an addi-tional $88,474 in employee benefits for these positions.
Grant Shifts—$74,846Due to funding changes and program needs for grants, there are increases in social security and retirement con-tributions of $74,846.
Enrollment Changes—$3,834,612The budget includes an increase for current enrollment projections, budgeted salaries, and positions related to changes in student enrollment. There is an increase for social security contributions of $942,353, employee health benefits of $2,377,913, and retirement contribu-tions of $514,346.
New Schools—$895,077Due to additional square footage added as a result of the opening of the new Bethesda Chevy Chase Middle School, and modernization of facilities, 46.0 positions are added to the budget. The staffing increases result in additional social security contributions of $218,181, employee health benefits of $557,658, and retirement contributions of $119,238.
Employee Health Benefits—$8,000,000Health and life insurance coverage for current active and retired employees and their families are provided through the Employee Benefit Plan (EBP). The health and life insurance budget for FY 2018 will increase by $5.5 million for active employees and $2.5 million for retirees, for a combined total of $8.0 million. The MCPS Employees Group Insurance Fund beginning balance in FY 2017 was ($4.7) million. However, based on theCounty Council’s action in funding the FY 2017 Oper-ating Budget, as well as reviewing current projections for FY 2017, the fund balance for both active employees and retirees is projected to be in surplus by the end of FY 2017. Although projections for medical and prescrip-tion drug claims for FY 2018 are expected to increase by over 6 percent, it is anticipated that fund balance reserves at the end of FY 2017 will be used to cover a
portion of these expected increases. The request of $8.0 million will be used to cover remaining medical and prescription drug costs, while also allowing the fund to maintain a small reserve balance by the end of FY 2018.
Retirement Contributions—$7,512,139The normal pension cost for current retirement pro-grams is based on a percentage of salary, as provided by the annual actuarial study. The rate applied in FY 2018 has increased from 4.18 to 4.68 percent. As a result of this rate increase, the budget has increased by $7,481,174 for retirement contributions. The new contribution rate assumes an investment return of 7.25% annually, a decrease in the assumption of .25% from 7.50% in the FY 2017 Operating Budget. In addition, there is an increase of $30,965 for administrative retirement fees owed to the state.
Social Security Contributions—($385,784)The budget includes a decrease in social security contri-butions of $385,784 primarily due to adjusting the cur-rent budget for past rate increases in employee health insurance premiums over calendar year 2016. Increases in employee health insurance premiums result in a higher deduction in payroll before calculating social security contributions.
Self-Insurance—$1,562,852The budget includes an increase in contributions to the county’s self-insurance program. As a result of achiev-ing an acceptable reserve fund balance over the past year, while also experiencing slight increases to pro-jected claims, there is an increase in worker’s compensa-tion of $1,469,482 in the budget. There also is an increase in fire and property insurance of $93,370.
Program Efficiencies and Reductions—($4,274,006)The budget includes overall program efficiencies and reductions totaling $20.1 million. Included in this amount is a $4,274,006 reduction in employee benefits associated with the elimination of 196.290 positions and part-time salaries. This includes reductions in employee health benefits of $2,662,834, social security contributions of $1,041,819, and retirement contributions of $569,353.
Strategic Accelerator—$527,496Details on increases in strategic accelerators are included in various chapters of the budget. As a result of these strategic accelerators, there is an increase of $128,581 for social security contributions, $328,646 for employee health benefits, and $70,269 for retirement contributions.
CHAPTER 7 – 23 OPERATIONS
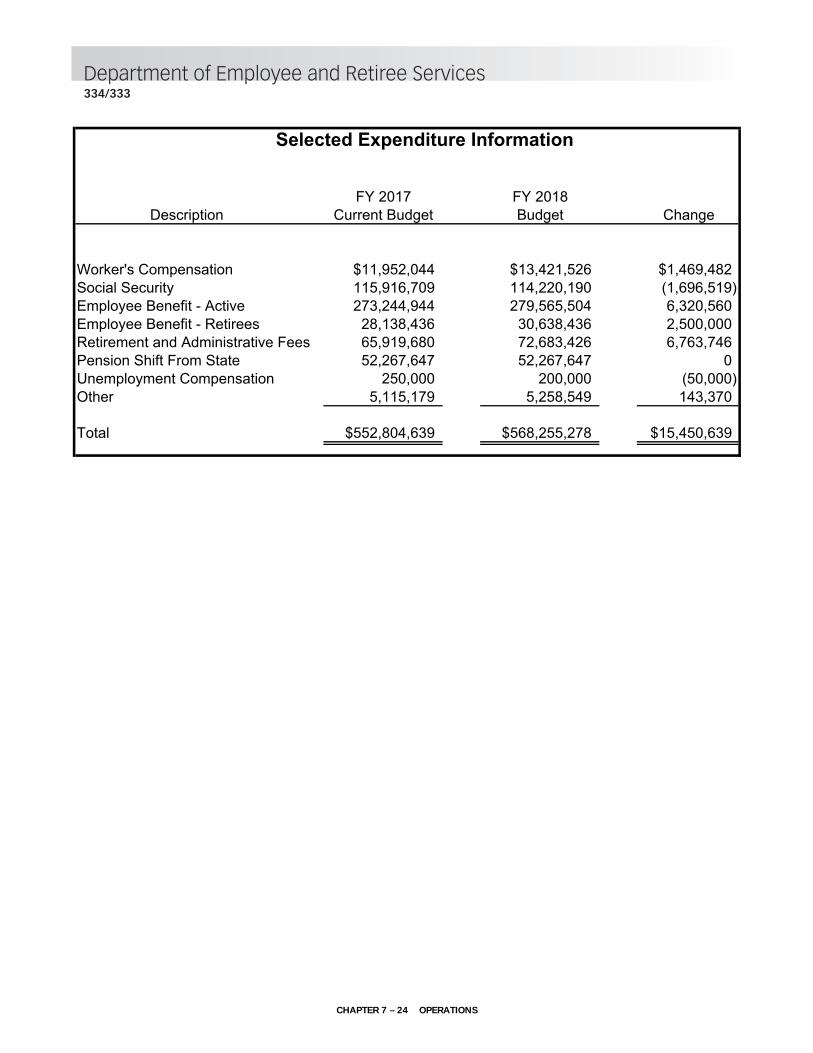
Department of Employee and Retiree Services334/333
Selected Expenditure Information
FY 2017 FY 2018Description Current Budget Budget Change
Worker's Compensation $11,952,044 $13,421,526 $1,469,482Social Security 115,916,709 114,220,190 (1,696,519)Employee Benefit - Active 273,244,944 279,565,504 6,320,560Employee Benefit - Retirees 28,138,436 30,638,436 2,500,000Retirement and Administrative Fees 65,919,680 72,683,426 6,763,746Pension Shift From State 52,267,647 52,267,647 0Unemployment Compensation 250,000 200,000 (50,000)Other 5,115,179 5,258,549 143,370
Total $552,804,639 $568,255,278 $15,450,639
CHAPTER 7 – 24 OPERATIONS

FY 2018 OPERATING BUDGET
F.T.E. Positions 23.75
( * In addition, the chart includes 13.25 positions funded by the Employee Benefits Trust Fund and 7.5 positions funded by the Employee Pension Fund.)
Department of Employee and Retiree Services
Director II (Q) 1.0* (.25 EBP & .75 Local)Administrative Secretary III (16) 1.0
Call Center and Payroll Team
Supervisor (K) 1.0
Call Center
Supervisor (G) 1.0**(.25 Pension & .25 EBP & .5 Local)
Transactions Assistant I (15) 2.0Transactions Assistant I (15) 3.0*Transactions Assistant I (15) 1.0**
Payroll
Payroll Supervisor (G) 1.0Specialist, Payroll (19) 2.0Garnishments Specialist (19) 1.0Payroll Assistant (15) 3.0
Retirement
Senior Specialist, Insurance and Retirement (J) 1.0**
Specialist, Insurance and Retirement (19) 3.0**Administrative Secretary II (15) 1.0**
Employee Services Administration
Senior Specialist, Position and Salary Administration (K) 1.0
Specialist, Position and Salary Administration (19) 2.0
Transactions Assistant (15) 4.0
Benefits Strategy and Vendor
Director I (P) 1.0*Senior Specialist, Insurance
and Retirement (J) 1.0*Wellness Coordinator (26) 1.0*Risk Management Specialist (24) 1.0*Specialist, Insurance
and Retirement II (21) 1.0*Specialist, Insurance
and Retirement (19) 2.0*Transactions Assistant I (15) 1.5
Leave Administration
Senior Specialist, Leave and Workers Compensation (I) 1.0
Specialist, Leave and Workers Compensation (19) 1.0*
Assistant, Leave and Workers Compensation (15) 1.0
Workforce Reporting and Communication
Data Integration Specialist II (25) 1.0*Data Integration Specialist I (23) 1.0**Data Support Specialist I (21) 1.0Communication Specialist (21) 0.75*Communication Specialist (21) 0.25**
CH
AP
TER 7 – 25 O
PER
ATIO
NS
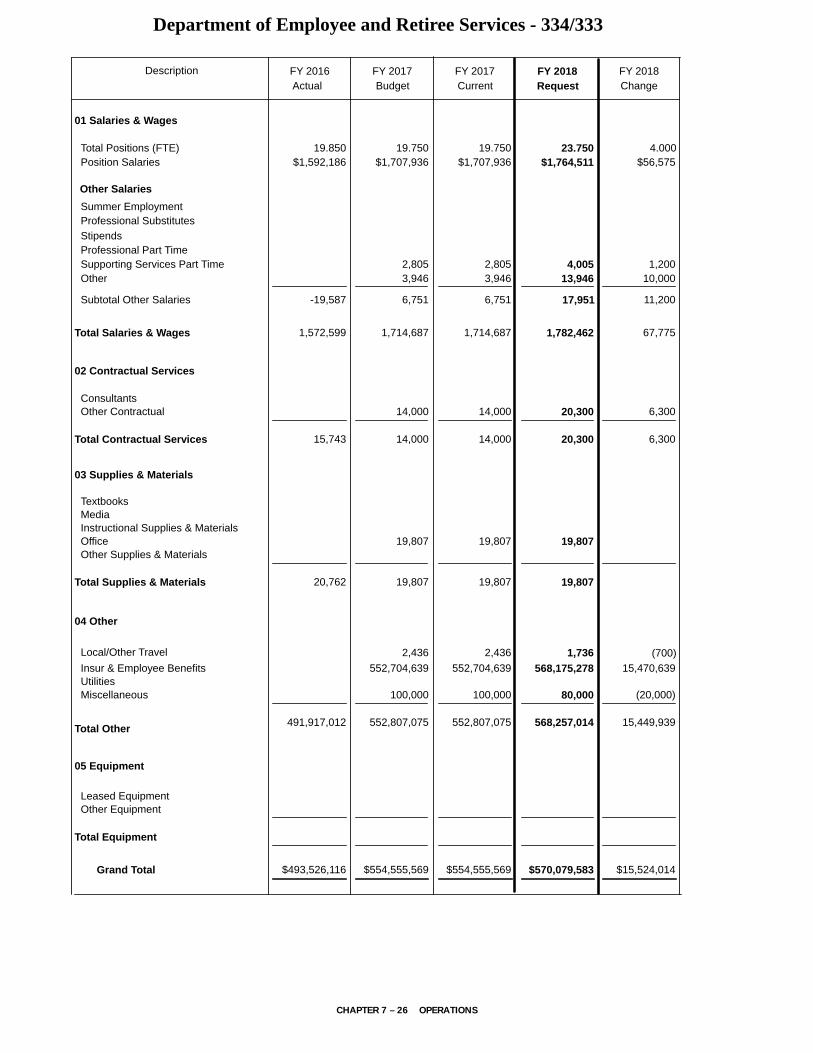
Department of Employee and Retiree Services - 334/333
Actual FY 2017Budget
FY 2017Current
FY 2018Request
FY 2018
Summer EmploymentProfessional Substitutes
Total Positions (FTE)Position Salaries
19.850$1,592,186
19.750$1,707,936
19.750$1,707,936
23.750$1,764,511
Other Salaries
01 Salaries & Wages
StipendsProfessional Part Time
ConsultantsOther Contractual
OfficeOther Supplies & Materials
MediaInstructional Supplies & Materials
Textbooks
Subtotal Other Salaries
Leased Equipment
Grand Total
Other Equipment
Total Salaries & Wages
02 Contractual Services
Total Contractual Services
03 Supplies & Materials
Total Supplies & Materials
04 Other
Total Other
05 Equipment
Total Equipment
Supporting Services Part TimeOther
2,805 2,805 4,00513,946 10,000
1,200
15,743
14,000
14,000
14,000
14,000
20,300
20,300 6,300
6,300
20,762
19,807
19,807
19,807
19,807
19,807
19,807
1,572,599 1,714,687 1,714,687 1,782,462 67,775
3,946 3,946
-19,587 6,751 6,751 17,951 11,200
$493,526,116 $554,555,569 $554,555,569 $570,079,583 $15,524,014
ChangeDescription FY 2016
4.000$56,575
Insur & Employee BenefitsUtilitiesMiscellaneous
491,917,012
552,704,639
100,000
552,807,075
552,704,639
100,000
552,807,075
568,175,278
80,000
568,257,014
15,470,639
(20,000)
15,449,939
Local/Other Travel 2,436 2,436 1,736 (700)
CHAPTER 7 – 26 OPERATIONS

DESCRIPTION CURRENTFYBUDGET
FYACTUAL
20172016 10Mon
FY 2017CAT
Department of Employee and Retiree Services- 334/333
FY 2018CHANGE
FY 2018
REQUEST
1 .700 .700 .700Chief Financial Officer (.700)1 Director IIQ .750.750
1 1.000 .900 .900Director IP (.900)1 1.000 1.000 1.000Sr Spec Pos & Sal AdminK 1.000
1 .650 .650 .650ERSC Call Ctr/Transaction SupvK .3501.000
1 1.000 1.000 1.000Sr Spec Leave/Wkrs ComI 1.000
1 1.000 1.000 1.000Payroll SupervisorG 1.000
1 1.000 1.000 1.000ERSC Call Ctr/Trans Asst SupvG (.500).500
1 1.000 1.000 1.000Data Support Specialist I21 1.000
1 1.000 1.000 1.000Garnishments Specialist19 1.000
1 2.000 2.000 2.000Specialist, Payroll19 2.000
1 2.000 2.000 2.000Spec, Position/Salary Admin19 2.000
1 .500 .500 .500Administrative Secretary III16 .5001.000
1 3.000 3.000 3.000Transactions Assistant I15 4.5007.500
1 3.000 3.000 3.000Payroll Assistant15 3.000
1 1.000 1.000 1.000Assist, Leave Admin/Wkrs Comp15 1.000
19.75019.850 19.750Total Positions 23.750 4.000
CHAPTER 7 – 27 OPERATIONS
Department of Association Relations661
M I S S I O N The mission of the
Department of Association Relations (DAR)
is to establish and maintain productive
relationships with the three employee
associations, to enhance the school system’s
ability to provide the most effective education
to students by negotiating and administering
realistic and relevant union contracts, and
to assist school system administrators in
implementing union contracts and Board of
Education policies and regulations.
MAJOR FUNCTIONSLabor Contract Administration
DAR coordinates all employee relations activities with the associations that represent administrators/prin-cipals, teachers, supporting services employees, and noncertified supervisory personnel. It conducts formal negotiations with the four recognized organizations on wages, hours, and other working conditions. It admin-isters the negotiated agreements through regular con-tact with the employee associations, handles informal complaints, provides advice to management on contract interpretations, oversees the grievance and administra-tive complaint procedures, represents the Montgomery County Board of Education in grievance hearings and arbitrations, and prepares cases for presentation before the Public School Labor Relations Board, the Maryland State Board of Education, or court action.
Negotiations with Employee GroupsSpecifically, DAR is responsible for negotiating with the Montgomery County Education Association (MCEA), the Service Employees International Union (SEIU) Local 500, and the Montgomery County Association of Admin-istrators and Principals (MCAAP). MCAAP represents administrative and supervisory personnel and noncer-tificated supervisory personnel (MCAAP/Montgomery County Business and Operations Administrators) in sep-arate bargaining units under one contract. The depart-ment administers all three negotiated agreements, handles informal complaints and grievances, prepares and presents arbitration cases, supports collaboration efforts enumerated in all three negotiated agreements, and provides support and training to MCPS supervisors
and administrators. The department also is responsible for processing any requests for recognition of additional bargaining units or challenges of existing exclusive rep-resentatives by competing organizations.
MEASURESM E A S U R E : Number of supporting services grievances and administrative complaints filed.
FY 2016Actual
FY 2017Estimate
FY 2018Recommended
Formal 70 70 70Informal 45 45 45
E X P L A N A T I O N : This measure reflects the amount of time and energy devoted by school system administrators to address possible contract and/or regulation violations related to supporting services employees. It also is an indication, along with the third performance measure below, of either the degree to which school system administrators are applying the contract and MCPS policies and regulations appropriately and/or the degree to which the employee association and/or employees are challenging administrative decisions.
M E A S U R E : Number of teacher grievances and admin-istrative complaints filed.
FY 2016Actual
FY 2017Estimate
FY 2018Recommended
Formal 20 20 20Informal 24 24 24
E X P L A N A T I O N : This measure reflects the amount of time devoted to address possible contract and/or regulation violations related to teachers and other certificated personnel. It also is an indication, along with the third performance measure below, of either the degree to which school system administrators are applying the contract and MCPS policies and regulations appropriately and/or the degree to which the employee association and/or employees are challenging administrative decisions.
CHAPTER 7 – 28 OPERATIONS

Department of Association Relations661
M E A S U R E : Number and percentage of completed sup-porting services grievances and administrative com-plaints awarded in favor of the grievant/complainant or settled by providing some remedy to the grievant/complainant.
FY 2016Actual
FY 2017Estimate
FY 2018Recommended
Formal 14 (20%) 12 (18.5%) 12 (17.14%)Informal 18 (40%) 15 (33.3%) 12 (26.66%)
E X P L A N A T I O N : This measure reflects the degree to which there are actual or arguable violations of the contracts or regulations, or problems existing, which justify adjustments being made through the appeals processes. Also, it may reflect the manner in which the grievance process is being used. The informal review of potential grievances or administrative complaints is resulting in a significant percentage of legitimate employee concerns being addressed.
M E A S U R E : Number and percentage of completed teacher grievances and administrative complaints awarded in favor of the grievant/complainant or settled by providing some remedy to the grievant/complainant.
FY 2016Actual
FY 2017Estimate
FY 2018Recommended
Formal 5 (25%) 4 (20%) 3 (15%)Informal 8 (33.3%) 7 (29.1%) 6 (25%)
E X P L A N A T I O N : This measure reflects the degree to which there are actual violations of the contracts or regulations or problems existing that justify adjustments being made through the appeals processes. It also may reflect the manner in which the grievance process is being used. Informal grievances or administrative complaints are as likely to raise legitimate employee concerns as formal grievances or complaints.
OVERVIEW OF BUDGET CHANGES
FY 2018 RECOMMENDED BUDGET
The FY 2018 recommended budget for this
department is $264,865, resulting in no change
over the current FY 2017 budget.
CHAPTER 7 – 29 OPERATIONS

FY 2018 OPERATING BUDGET
Department of Association Relations
F.T.E. Positions 2.0
Director II 1.0Administrative Secretary III (16) 1.0
CH
AP
TER 7 – 30 O
PER
ATIO
NS

Department of Association Relations - 661
Actual FY 2017Budget
FY 2017Current
FY 2018Request
FY 2018
Summer EmploymentProfessional Substitutes
Total Positions (FTE)Position Salaries
2.000$229,798
2.000$231,460
2.000$231,460
2.000$231,460
Other Salaries
01 Salaries & Wages
StipendsProfessional Part Time
ConsultantsOther Contractual
OfficeOther Supplies & Materials
MediaInstructional Supplies & Materials
Textbooks
Subtotal Other Salaries
Leased Equipment
Grand Total
Other Equipment
Total Salaries & Wages
02 Contractual Services
Total Contractual Services
03 Supplies & Materials
Total Supplies & Materials
04 Other
Total Other
05 Equipment
Total Equipment
Supporting Services Part TimeOther
15,300844
15,300844
15,300844
18,514
11,385
11,385
11,385
11,385
11,385
11,385
1,278
3,000
3,000
3,000
3,000
3,000
3,000
248,161 247,604 247,604 247,604
18,363 16,144 16,144 16,144
$270,011 $264,865 $264,865 $264,865
ChangeDescription FY 2016
Insur & Employee BenefitsUtilitiesMiscellaneous
2,058
2,500
2,876
2,500
2,876
2,500
2,876
Local/Other Travel 376 376 376
CHAPTER 7 – 31 OPERATIONS

DESCRIPTION CURRENTFYBUDGET
FYACTUAL
20172016 10Mon
FY 2017CAT
Department of Association Relations - 661
FY 2018CHANGE
FY 2018
REQUEST
1 1.000 1.000 1.000Director II 1.000
1 1.000 1.000 1.000Administrative Secretary III16 1.000
2.0002.000 2.000Total Positions 2.000
CHAPTER 7 – 32 OPERATIONS

Department of Facilities Management321/311/315/322/326/327/328/329/330/323/335/850
M I S S I O N The mission of the
Department of Facilities Management (DFM)
is to create and maintain high-quality public
facilities for learning through staff dedicated
to excellence and continuous improvement.
MAJOR FUNCTIONSCapital Programming and Long-range Planning
The Division of Long-range Planning develops plans to address the changes in student enrollment and instruc-tional programs through development of high-quality data analysis, planning strategies, and long-range facil-ity plans. Enrollment forecasts are developed in align-ment with the six-year Capital Improvements Program and for long-term future projections. The accuracy of the forecast is critical as it is used for resource and staff-ing allocations, relocatable classroom placements, and by other offices and departments in MCPS that provide instructional programs required for student success. The division currently achieves 99.8 percent accuracy in the enrollment forecast.
Facility Design and ConstructionDFM facilitates the design and construction processes for major capital projects including new schools, addi-tions, the revitalization/expansion of aging facilities, and countywide systemic replacement projects. While the majority of staff and resources for these functions are funded through the capital budget, on-time and within-budget completions to ensure school openings and operations are critical measures in supporting the stra-tegic priority of operational excellence through creating modern, safe, and nurturing physical environments for staff and students.
Building Operations and Maintenance Together, the divisions of School Plant Operations and Maintenance provide a safe, healthy, high-quality learn-ing environment for all staff and students. Averaging approximately 19,000 square feet of building per staff, currently 1,403 school-based building service positions directly support operational excellence by providing numerous services such as housekeeping, safety inspec-tions, preventative maintenance, and maintenance work request coordination. Building service staff also support the schools’ important role in the community by assist-ing with outside use of school facilities by community partners.
Facility maintenance and repair, facility emergency response, environmental compliance, systemic asset replacement, and building automated controls services are accomplished through 377 maintenance staff posi-tions. These services are critical to provide safe, comfort-able, and operational facilities on a daily basis. As Figure 1 indicates, the maintenance staffing level has slightly decreased as building square footage increased by approximately 2.7 million square feet since 2009. Various efficiency and productivity initiatives have helped meet the challenge to maintain performance. DFM is priori-tizing staff and resource allocation to Indoor Air Quality and roofing teams, both high priority facility issue areas for schools, to ensure that support of critical facility issues affecting the school environment are addressed.
As environmental regulations and policies continue to increase, so does the needed funding to comply with various codes and regulations as indicated in Figure 2. This funding is necessary for many critical safety and health services, including mold prevention, fire code compliance, pest management, storm water manage-ment facilities, forest conservation efforts, and Wash-ington Suburban Sanitary Commission’s fat/oil/grease mitigations.
Real Estate ManagementThrough a self-supporting entrepreneurial fund, the Real Estate Management Team negotiates and manages tenant leases, assists with the development of county-wide master plans, acquires and manages future school sites, manages the artificial turf program, and generates revenue through joint tenant agreements and cellular tower leases that are used to offset MCPS-leased admin-istrative and support space expenditures and, as a result, reduce funding requested from the county.
Systemwide Safety ProgramsThe department implements online safety and health training programs, responds to safety-related incidents and concerns, and ensures compliance with student and employee safety and health regulations. In efforts to improve safety in schools and minimize work-related injuries, the department administers seven major safety programs and provides 10 online safety training courses to over 23,000 staff members on an annual basis. DFM provides essential central office support to schools in coordinating compliance efforts centrally to relieve schools of this additional work and allow the focus to remain on teaching and learning.
CHAPTER 7 – 33 OPERATIONS

Department of Facilities Management321/311/315/322/326/327/328/329/330/323/335/850
Utility Management and Resource Conservation Services
In context of the MCPS Environmental Sustainability Management Plan, the department continues to focus on energy conservation, water efficiency, and environ-mental stewardship. Through an array of efficiency measures and energy procurement strategies, such as energy retrofit projects and wholesale energy procure-ment, the department continues to achieve substantial energy cost avoidance.
MEASURESM E A S U R E : Customer Focus Results—Principal Satis-faction with DFM Services.
FY 2016Actual
FY 2017Estimate
FY 2018Recommended
3.9 4.0 4.1
E X P L A N A T I O N : This principal satisfaction is measured through an annual survey.
M E A S U R E : Financial Results—Facility Operating and Maintenance Costs per Building Square Foot.
FY 2016Actual
FY 2017Estimate
FY 2018Recommended
$5.44 $5.41 $5.45
E X P L A N A T I O N : This measures the cost per square foot to operate and maintain MCPS facilities including the cost of utilities.
M E A S U R E : Organizational Effectiveness Results—Stu-dent Enrollment Trend and Forecast Accuracy.
FY 2016Actual
FY 2017Estimate
FY 2018Recommended
156,447 159,016 161,08599.8% 99.5% 99.5%
E X P L A N A T I O N : This measures the accuracy of the countywide enrollment projections which is critical to the development of the overall operating and capital budgets.
M E A S U R E : Workforce Excellence Results—Safety Training Completion.
FY 2016Actual
FY 2017Estimate
FY 2018Recommended
75% 80% 85%
E X P L A N A T I O N : This measures the annual percent completion of mandatory online safety training courses by all MCPS staff. Courses are assigned to help teach employees to know how to prevent injuries and illnesses from workplace hazards and to comply with Maryland State law.
OVERVIEW OF BUDGET CHANGES
FY 2018 RECOMMENDED BUDGET
The FY 2018 recommended budget for this
department is $150,355,370, a decrease of
$344,671 from the current FY 2017 budget. An
explanation of this change follows.
Same Service Level Changes—$755,329Continuing Salary Costs—($2,891,492)Negotiations with our employee associations for new contracts (effective July 1, 2017) began in October 2016, and are continuing as of this publication. As a result, the proposed FY 2018 Superintendent’s Operating Bud-get does not include employee negotiated salary costs. The decrease of $2,891,492 for continuing salary is the cost associated with lapse and turnover; the amount of unused budgeted salary that remains when an employee terminates service and is not immediately replaced or an employee terminates service and the backfill is hired at a lower salary.
Realignments to Meet Expenditure Requirements and Program Priorities—$767,094 The FY 2018 recommended budget includes realign-ments that result in an overall budget neutral set of realignments between departments and offices. There is a realignment of $750,000 from utilities, in which $588,564 is used to support contractual services within the Systemwide Safety Program. These funds are used to improve safety initiatives for school theatres, includ-ing rigging inspections and other repairs, and for lead paint abatement in all schools. The additional funds of $161,436 is realigned to other divisions and departments within the Office of the Chief Operating Officer to sup-port specific needs within those areas.
In the Division of Maintenance, there is a realignment of $928,530 from the Department of Transportation to the Division of Maintenance to fund the creation of a new HVAC and IAQ Team. The teams combined con-sist of 15.0 positions, including 11.0 mechanical system technician positions and 2.0 team leader positions, one for each team. Furthermore, there is an additional 2.0 roof mechanic positions for the roofing team, which was established in the FY 2017 Operating Budget. The additional teams will help reduce the overall backlog of maintenance work orders, focus on mold prevention, and improve the overall indoor air quality at schools. The associated employee benefits for these positions have been realigned to the Department of Employee and Retiree Services.
CHAPTER 7 – 34 OPERATIONS

Department of Facilities Management321/311/315/322/326/327/328/329/330/323/335/850
New Schools/Space—$1,667,927There is an increase of $849,970 in utilities for electricity, gas, and water and sewer expenses related to an addi-tional 515,724 square feet of space for the opening of the new Bethesda Chevy Chase Middle School and other modernizations of schools.
In the Division of School Plant Operations, the budget includes an additional 24.0 building services positions and $740,070 as a result of an additional 515,724 square feet of space for the opening of the new Bethesda Chevy Chase Middle School and other modernizations of schools. The budget also includes an increase of $52,887 for custodial and uniform supplies and $25,000 for sup-porting services part-time salaries.
Other—$1,211,800In the Department of Facilities Management, the budget includes an increase of $611,800 for relocatable class-rooms as a result in a shift in costs of 55 units from the Capital Budget to the Operating Budget after one year of funding in the Capital Budget.
In the Division of Maintenance, the budget includes $50,000 in grounds care for specialized playground mulch required for safety regulations. In addition, there is an increase of $250,000 for recurrent radon testing and environmental compliance mandates related to green roofs and bioretention facilities.
In the Real Estate Management Fund, there is an increase of $300,000 in contractual services for reno-vation improvements to the 5025 Edgemoor property. The increase in contractual costs is offset by increased revenue anticipated within the Real Estate Manage-ment Fund. Furthermore, there is sufficient fund bal-ance within the fund to allow for these renovation improvements.
Program Efficiencies and Reductions—($1,100,000)The FY 2018 recommended budget for this department includes a comprehensive effort to identify potential program reductions and efficiencies. Stakeholders including community partners and employee union rep-resentatives participated in the program efficiencies and reduction process.
The budget includes a decrease of $1,100,000 in utilities for electricity and natural gas expenses due to signifi-cantly lower rates from previously budgeted in FY 2017. Electricity rates have decreased by nearly three percent, while natural gas rates have decreased by over four percent.
FY 2017 FY 2018 FY 2018 INC/(DEC)CURRENT FY 2017 REQUESTED REQUESTED FY 18 - FY 17
BUDGET RATE AMOUNT RATE AMOUNT
Electricity (1) 27,399,801$ 0.1210 26,610,979$ 0.1172 (788,822)$ Fuel Oil #2 87,742 2.75 69,742 1.50 (18,000) Natural Gas 6,397,819 1.02 6,043,714 0.98 (354,105) Propane 73,606 2.00 47,606 1.50 (26,000) Water and Sewer 4,757,650 10.90 4,944,547 11.04 186,897 Total 38,716,618$ 37,716,588$ (1,000,030)$
Electricity (1) - Funds for the Energy Awards Program of $444,646 are not included.
UTILITIES
CHAPTER 7 – 35 OPERATIONS

FY 2018 OPERATING BUDGET
Director II (Q) 1.0Assistant Director II (O) 1.0Administrative Secretary III (16) 1.0
Department of Facilities Management
Real Estate Management Team(Enterprise Fund)
Budget and Operations Team
Team Leader (M) 1.0 Fiscal Specialist II (25) 1.0Fiscal Assistant V (22)* 1.0
Systemwide Safety Program
Team Leader (M) 1.0Program Technician (17) 1.0Data Control Technician II (15) 0.5
Division of Maintenance Division of School Plant Operations
Energy and Utilities Unit
Energy Program Manager (K) 1.0Utilities Analyst (25) 1.0
School Energy and Recycling (SERT) Unit
SERT Program Manager (K) 1.0Resource Conservation Assistant (17–23) 3.0Recycling Manager (21) 1.0 SERT Information Specialist (20) 1.0Program Technician (17) 2.0
Division of Construction Division of Long-range Planning
F.T.E. Positions 17.5
(*In addition, the chart includes a 1.0 position funded by the Capital Budget.)
CH
AP
TER 7 – 36 O
PER
ATIO
NS

Department of Facilities Management - 321/311/315/324/325/326
Actual FY 2017Budget
FY 2017Current
FY 2018Request
FY 2018
Summer EmploymentProfessional Substitutes
Total Positions (FTE)Position Salaries
17.500$1,495,312
17.500$1,671,647
17.500$1,671,647
17.500$1,671,647
Other Salaries
01 Salaries & Wages
StipendsProfessional Part Time
ConsultantsOther Contractual
OfficeOther Supplies & Materials
MediaInstructional Supplies & Materials
Textbooks
Subtotal Other Salaries
Leased Equipment
Grand Total
Other Equipment
Total Salaries & Wages
02 Contractual Services
Total Contractual Services
03 Supplies & Materials
Total Supplies & Materials
04 Other
Total Other
05 Equipment
Total Equipment
Supporting Services Part TimeOther
1,509,963
12,0001,838,655
1,850,655
12,0001,838,655
1,850,655
12,0002,427,219
2,439,219 588,564
588,564
64,391
1,00076,480
77,480
1,00076,480
77,480
1,00076,480
77,480
1,495,312 1,671,647 1,671,647 1,671,647
$42,419,052
12,122
$45,915,641 $45,915,641 $46,115,975 $200,334
ChangeDescription FY 2016
Insur & Employee BenefitsUtilitiesMiscellaneous
39,337,264
38,716,6183,592,926
42,315,859
38,716,6183,592,926
42,315,859
37,716,5884,205,353
41,927,629
(1,000,030)612,427
(388,230)
Local/Other Travel 6,315 6,315 5,688 (627)
CHAPTER 7 – 37 OPERATIONS
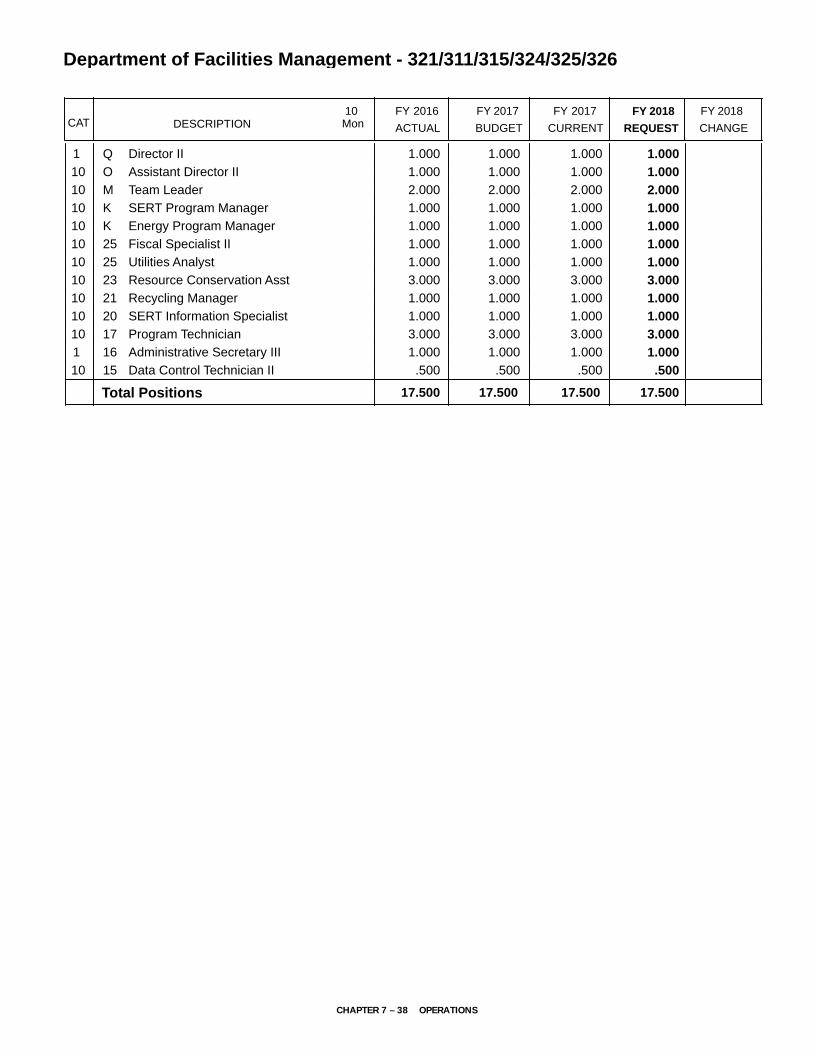
DESCRIPTION CURRENTFYBUDGET
FYACTUAL
20172016 10Mon
FY 2017CAT
Department of Facilities Management - 321/311/315/324/325/326
FY 2018CHANGE
FY 2018
REQUEST
1 1.000 1.000 1.000Director IIQ 1.000
10 1.000 1.000 1.000Assistant Director IIO 1.000
10 2.000 2.000 2.000Team LeaderM 2.000
10 1.000 1.000 1.000SERT Program ManagerK 1.000
10 1.000 1.000 1.000Energy Program ManagerK 1.000
10 1.000 1.000 1.000Fiscal Specialist II25 1.000
10 1.000 1.000 1.000Utilities Analyst25 1.000
10 3.000 3.000 3.000Resource Conservation Asst23 3.000
10 1.000 1.000 1.000Recycling Manager21 1.000
10 1.000 1.000 1.000SERT Information Specialist20 1.000
10 3.000 3.000 3.000Program Technician17 3.000
1 1.000 1.000 1.000Administrative Secretary III16 1.000
10 .500 .500 .500Data Control Technician II15 .500
17.50017.500 17.500Total Positions 17.500
CHAPTER 7 – 38 OPERATIONS

FY 2018 OPERATING BUDGET
Team Leader (M) 1.0*Real Estate Management Specialist (25) 1.0*Fiscal Assistant III (16) 1.0Data Systems Operator II (15) 1.0Building Services Manager II (12) 4.0Secretary (12) 1.0Building Services Assistant Manager I (10) 2.0Building Services Worker (6) 2.0
Real Estate Management Fund
F.T.E. Positions 12.0
(*In addition, the chart includes a 1.0 position funded by the Capital Budget.)
CH
AP
TER 7 – 39 O
PER
ATIO
NS

Real Estate Management Fund - 850
Actual FY 2017Budget
FY 2017Current
FY 2018Request
FY 2018
Summer EmploymentProfessional Substitutes
Total Positions (FTE)Position Salaries
8.500$440,654
12.000$673,024
12.000$673,024
12.000$673,024
Other Salaries
01 Salaries & Wages
StipendsProfessional Part Time
ConsultantsOther Contractual
OfficeOther Supplies & Materials
MediaInstructional Supplies & Materials
Textbooks
Subtotal Other Salaries
Leased Equipment
Grand Total
Other Equipment
Total Salaries & Wages
02 Contractual Services
Total Contractual Services
03 Supplies & Materials
Total Supplies & Materials
04 Other
Total Other
05 Equipment
Total Equipment
Supporting Services Part TimeOther
35,519 35,519 35,51930,101
1,979,537
2,064,281
2,064,281
2,064,281
2,064,281
2,376,281
2,376,281 312,000
312,000
14,630
5,70032,604
38,304
5,70032,604
38,304
2,70028,604
31,304
(4,000)(3,000)
(7,000)
508,111 738,644 738,644 738,644
30,101 30,101
67,457 65,620 65,620 65,620
$3,240,952
15,861
9,700
$3,686,191
9,700
9,700
9,700
$3,686,191
4,700
4,700
$3,986,191
(5,000)
(5,000)
$300,000
ChangeDescription FY 2016
Insur & Employee BenefitsUtilitiesMiscellaneous
722,813
262,244
567,825
835,262
262,244
567,825
835,262
262,244
569,525
835,262
1,700
Local/Other Travel 5,193 5,193 3,493 (1,700)6 500
CHAPTER 7 – 40 OPERATIONS

DESCRIPTION CURRENTFYBUDGET
FYACTUAL
20172016 10Mon
FY 2017CAT
Real Estate Management Fund - 850
FY 2018CHANGE
FY 2018
REQUEST
51 1.000 1.000 1.000Team LeaderM 1.000
51 1.000 1.000 1.000Fiscal Assistant III16 1.000
51 .500 1.000 1.000Data Systems Operator II15 1.000
51 1.000 1.000 1.000Secretary12 1.000
51 3.000 4.000 4.000Building Service Manager II12 4.000
51 1.000 2.000 2.000Build Svcs Asst Mgr I Shft 210 2.000
51 1.000 2.000 2.000Building Service Wkr Shft 16 2.000
12.0008.500 12.000Total Positions 12.000
CHAPTER 7 – 41 OPERATIONS

FY 2018 OPERATING BUDGET
F.T.E. Positions 2.0*
(*In addition, the chart includes 40.0 positions funded by the Capital Budget)
Division of Construction
Design Team
Facilities Team Leader (K) 1.0Architect for School Facilities (M)* 1.0LEED Program Manager (26) 1.0Electrical Engineer (25) 1.0Facilities Designer (25) 4.0Mechanical Engineer (25) 1.0Site Development Coordinator (23) 1.0Project Designer (20) 1.0Secretary (12) 1.0
Construction/Inspection Team
Facilities Team Leader (K) 1.0Construction Management Specialist (25) 1.0Construction Inspector Supervisor (23) 1.0Electrical Construction Technician II (22) 2.0Mechanical Construction Technician (22) 2.0Construction Technician (21) 4.0Office Assistant III (10) 1.0
Special Projects Team
Facilities Team Leader (K) 1.0Mechanical Engineer (25) 1.0Commissioning Coordinator (23) 1.0Construction Technician (21) 2.0Mechanical Construction Specialist (21) 3.0EMS Specialist (20) 1.0Building and Grounds Contract Assistant (18) 1.0
Director I (P)* 1.0Assistant to the Director (K) 1.0Project Specialist (24) 1.0Administrative Secretary II (15) 1.0
Contract/Finance Team
Facilities Team Leader (K) 1.0Fiscal Assistant V (22) 1.0Fiscal Assistant IV (18) 1.0Fiscal Assistant I (13) 1.0
CH
AP
TER 7 – 42 O
PER
ATIO
NS

Division of Construction - 322
Actual FY 2017Budget
FY 2017Current
FY 2018Request
FY 2018
Summer EmploymentProfessional Substitutes
Total Positions (FTE)Position Salaries
2.000$232,025
2.000$260,906
2.000$260,906
2.000$260,906
Other Salaries
01 Salaries & Wages
StipendsProfessional Part Time
ConsultantsOther Contractual
OfficeOther Supplies & Materials
MediaInstructional Supplies & Materials
Textbooks
Subtotal Other Salaries
Leased Equipment
Grand Total
Other Equipment
Total Salaries & Wages
02 Contractual Services
Total Contractual Services
03 Supplies & Materials
Total Supplies & Materials
04 Other
Total Other
05 Equipment
Total Equipment
Supporting Services Part TimeOther
232,025 260,906 260,906 260,906
$232,025 $260,906 $260,906 $260,906
ChangeDescription FY 2016
Insur & Employee BenefitsUtilitiesMiscellaneous
Local/Other Travel
CHAPTER 7 – 43 OPERATIONS

DESCRIPTION CURRENTFYBUDGET
FYACTUAL
20172016 10Mon
FY 2017CAT
Division of Construction - 322
FY 2018CHANGE
FY 2018
REQUEST
1 1.000 1.000 1.000Director IP 1.000
1 1.000 1.000 1.000Architect - School FacilitiesM 1.000
2.0002.000 2.000Total Positions 2.000
CHAPTER 7 – 44 OPERATIONS

FY 2018 OPERATING BUDGET
F.T.E. Positions 4.0
(*In addition, the chart includes 2.0 positions funded by the Capital Budget)
Division of Long–range Planning
Director I (P) 1.0Senior Facilities Planner (27) 1.0Coordinator GIS Services (26) 1.0Planner II (24) 2.0*Administrative Secretary II (15) 1.0
CH
AP
TER 7 – 45 O
PER
ATIO
NS

Division of Long-range Planning - 335
Actual FY 2017Budget
FY 2017Current
FY 2018Request
FY 2018
Summer EmploymentProfessional Substitutes
Total Positions (FTE)Position Salaries
4.000$436,619
4.000$441,549
4.000$441,549
4.000$441,549
Other Salaries
01 Salaries & Wages
StipendsProfessional Part Time
ConsultantsOther Contractual
OfficeOther Supplies & Materials
MediaInstructional Supplies & Materials
Textbooks
Subtotal Other Salaries
Leased Equipment
Grand Total
Other Equipment
Total Salaries & Wages
02 Contractual Services
Total Contractual Services
03 Supplies & Materials
Total Supplies & Materials
04 Other
Total Other
05 Equipment
Total Equipment
Supporting Services Part TimeOther
10,900
10,900
10,900
10,900
9,900
9,900 (1,000)
(1,000)
3,276
1,2832,002
3,285
1,2832,002
3,285
1,2832,002
3,285
436,619 441,549 441,549 441,549
$446,209 $462,029 $462,029 $462,029
ChangeDescription FY 2016
Insur & Employee BenefitsUtilitiesMiscellaneous
6,314
1,600
6,295
1,600
6,295
2,600
7,295
1,000
1,000
Local/Other Travel 4,695 4,695 4,6952 600
CHAPTER 7 – 46 OPERATIONS

DESCRIPTION CURRENTFYBUDGET
FYACTUAL
20172016 10Mon
FY 2017CAT
Division of Long-range Planning
FY 2018CHANGE
FY 2018
REQUEST
1 1.000 1.000 1.000Director IP 1.000
1 1.000 1.000 1.000Sr. Facilities Planner27 1.000
1 1.000 1.000 1.000Coordinator GIS Services26 1.000
1 1.000 1.000 1.000Administrative Secretary II15 1.000
4.0004.000 4.000Total Positions 4.000
CHAPTER 7 – 47 OPERATIONS

F.T.E. Positions 369.0
(* In addition, the chart includes 23.5 positions funded by the Capital Budget and 1.0 is funded by ICB.)
ND Night Differential = Shift 2
Division of Maintenance
Heavy Equipment Shop
General Maintenance Central Supervisor (21) 1.0
Automotive Technician II (19) 2.0Automotive Technician I (17) 2.0Small Equipment Mechanic (16) 4.0Maintenance Welder (15) 1.0Equipment Operator (12) 3.0Compactor Truck Operator (11) 1.0Service Writer (11) 1.0General Maintenance Worker II (10) 1.0Sanitation Service Worker (9) 1.0General Maintenance Worker I (9) 2.0
Materials Fabrication and Rigging Shop
Material Fabrication/Rigging Supervisor (18) 1.0Mason (15) 2.0Reupholster/Seamster II (13) 2.0Materials Fabrication Worker (12) 4.0
Industrial Equipment Repair
Industrial Equipment Supervisor (18) 1.0Electric Motor Mechanic (17) 1.0Equipment Mechanic (17) 1.0Tool Mechanic (15) 2.0Maintenance Painter I (13) 2.0
Asbestos Abatement/Pest Control
Environmental Health Specialist (23) 1.0*Environmental Design Assistant (20) 1.0*Environmental Abatement Supervisor (19/ND) 1.0*Environmental Abatement Technician (16/ND) 5.0*Integrated Pest Mgt. Associate II (15) 4.0Water Treatment Tester (14) 2.0Data Systems Operator (13) 1.0*
PLAR/Contract Office
Capital Improvement Construction Supervisor (J) 1.0
PLAR/Contracting Assistant Supervisor (23) 1.0*
Bldg. & Grounds Contracts Assistant (18) 4.0Bldg. & Grounds Contracts Assistant (18) 3.0*Fiscal Assistant II (15) 1.0*Fire Safety Compliance Tech. (14) 1.0Secretary (12) 1.0
Roofing Shop
Roof Program Manager (24) 1.0*Roof Inspector (18) 1.0*Roof Inspector (18) 1.0Roof Mechanic (15) 7.0Roof Maintenance Worker (11) 4.0Roof Maintenance Worker (11) 1.0*
Electronics Shop
Electronics Technician Supervisor (20) 1.0Electronics Technician Asst. Supervisor (19) 1.0Electronics Technician II (18) 3.0Electronics Technician I (17) 13.0
Director I (P) 1.0Assistant Director I (N) 1.0Maintenance Training and Safety Specialist (24) 1.0Maintenance/Facility Area Assistant Manager (23) 1.0Fiscal Assistant V (22) 1.0Administrative Secretary II (15) 1.0
Automated Energy Management
Energy Management Supervisor (24) 1.0Energy Management Technology
Administrator (22) 1.0Energy Management Specialist (20) 5.0Energy Management Specialist (20) 1.5*Energy Management Assistant (19) 1.0*Energy Management Assistant (19) 0.5Mechanical Systems Technician (16–19/ND) 1.0Fiscal Assistant II (15) 1.0
Environmental Services IAQ
Team Leader (M) 3.0Environmental Safety Specialist (23) 2.0*Environmental Specialist (23) 1.0Environmental Specialist (23) 1.0* Mechanical Systems Technician
Team Leader (20/ND) 1.0Mechanical Systems Safety
Team Leader (20/ND) 1.0Mechanical Systems Technician (16–19/ND) 12.0Asset Technician (16) 1.0*Maintenance Carpenter I (15) 1.0Fiscal Assistant II (15) 1.0*
Fiscal Assistant III (16) 1.0Account Assistant II (12) 3.0
Automation Center
IT Systems Specialist (18–25) 1.0Maintenance Automation Specialist (24) 1.0
Maintenance Depots
Maintenance/Facility Area Manager (J) 4.0Maintenance/Facility Area Assistant
Manager (23) 3.0Mechanical Systems Supervisor (21) 3.0Mechanical Systems Team Leader I (20) 7.0Electrician Area Supervisor (19) 3.0Mechanical Systems Technician (16–19) 78.0Carpentry Area Supervisor (18) 3.0General Maintenance Area Supervisor (18) 3.0Carpentry Assistant Area Supervisor (17) 3.0Maintenance Electrician II (17) 3.0General Maintenance Supervisor (16) 3.0Maintenance Electrician I (16) 18.0Floor Covering Mechanic (15) 6.0
Glazier (15) 6.0Maintenance Carpenter I (15) 27.0Maintenance Painter II (14) 3.0Mechanical Systems Worker (10–14) 3.0Administrative Operations Secretary (14) 3.0Locksmith (14) 3.0General Maintenance Worker III (13) 6.0Maintenance Painter I (13) 3.0HVAC Apprentice (12) 4.0Compactor Truck Operator (11) 3.0General Maintenance Worker II (10) 33.0Office Assistant III (10) 1.5Sanitation Service Worker (9) 3.0General Maintenance Worker I (9) 15.0
FY 2018 OPERATING BUDGET
CH
AP
TER 7 – 48 O
PER
ATIO
NS
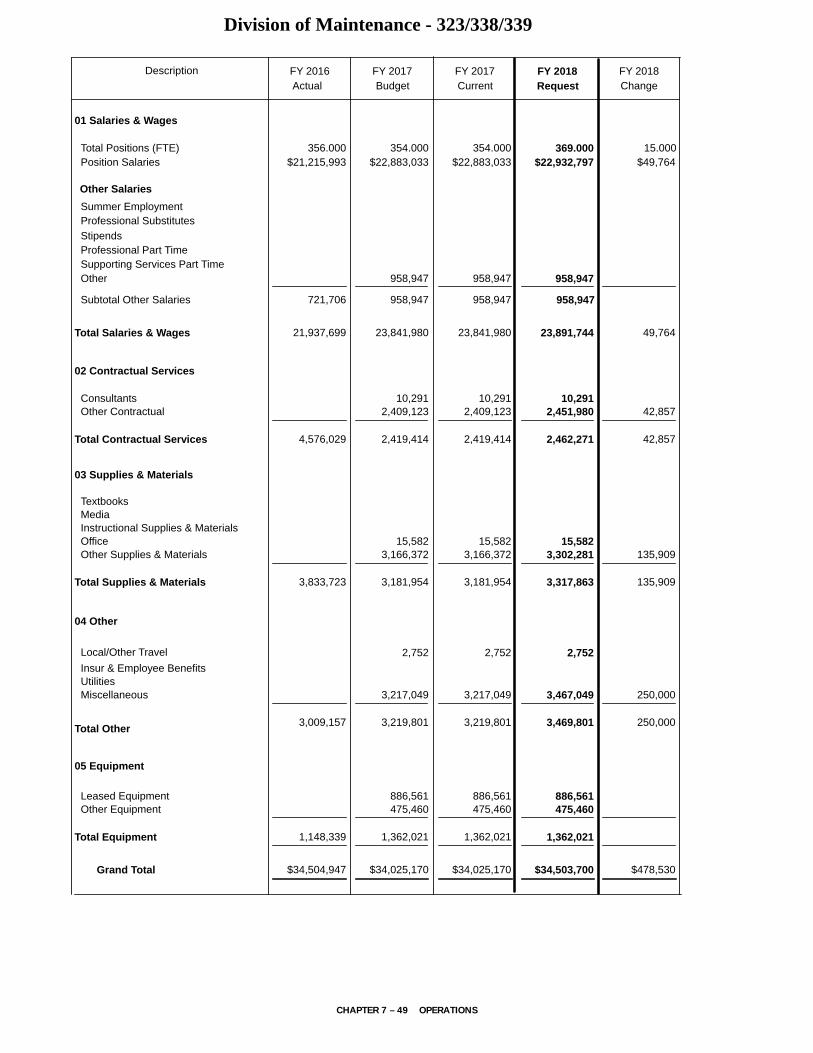
Division of Maintenance - 323/338/339
Actual FY 2017Budget
FY 2017Current
FY 2018Request
FY 2018
Summer EmploymentProfessional Substitutes
Total Positions (FTE)Position Salaries
356.000$21,215,993
354.000$22,883,033
354.000$22,883,033
369.000$22,932,797
Other Salaries
01 Salaries & Wages
StipendsProfessional Part Time
ConsultantsOther Contractual
OfficeOther Supplies & Materials
MediaInstructional Supplies & Materials
Textbooks
Subtotal Other Salaries
Leased Equipment
Grand Total
Other Equipment
Total Salaries & Wages
02 Contractual Services
Total Contractual Services
03 Supplies & Materials
Total Supplies & Materials
04 Other
Total Other
05 Equipment
Total Equipment
Supporting Services Part TimeOther 958,947
4,576,029
10,2912,409,123
2,419,414
10,2912,409,123
2,419,414
10,2912,451,980
2,462,271 42,857
42,857
3,833,723
15,5823,166,372
3,181,954
15,5823,166,372
3,181,954
15,5823,302,281
3,317,863
135,909
135,909
21,937,699 23,841,980 23,841,980 23,891,744 49,764
958,947 958,947
721,706 958,947 958,947 958,947
$34,504,947
1,148,339
475,460
$34,025,170
886,561
1,362,021
475,460886,561
1,362,021
$34,025,170
475,460886,561
1,362,021
$34,503,700 $478,530
ChangeDescription FY 2016
15.000$49,764
Insur & Employee BenefitsUtilitiesMiscellaneous
3,009,157
3,217,049
3,219,801
3,217,049
3,219,801
3,467,049
3,469,801
250,000
250,000
Local/Other Travel 2,752 2,752 2,752
CHAPTER 7 – 49 OPERATIONS
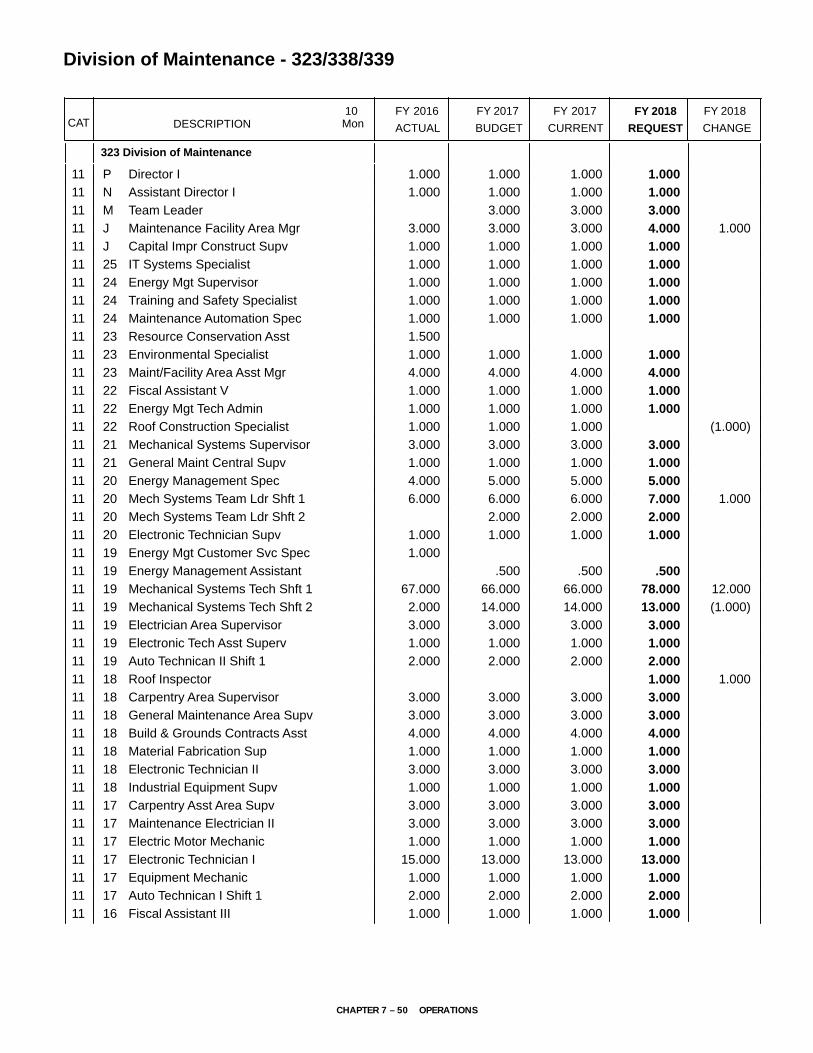
DESCRIPTION CURRENTFYBUDGET
FYACTUAL
20172016 10Mon
FY 2017CAT CHANGE
2018FY
Division of Maintenance - 323/338/339
REQUEST
2018FY
323 Division of Maintenance
11 1.000 1.000 1.000Director IP 1.000
11 1.000 1.000 1.000Assistant Director IN 1.000
11 3.000 3.000Team LeaderM 3.000
11 3.000 3.000 3.000Maintenance Facility Area MgrJ 1.0004.000
11 1.000 1.000 1.000Capital Impr Construct SupvJ 1.000
11 1.000 1.000 1.000IT Systems Specialist25 1.000
11 1.000 1.000 1.000Energy Mgt Supervisor24 1.000
11 1.000 1.000 1.000Training and Safety Specialist24 1.000
11 1.000 1.000 1.000Maintenance Automation Spec24 1.000
11 1.500Resource Conservation Asst23 11 1.000 1.000 1.000Environmental Specialist23 1.000
11 4.000 4.000 4.000Maint/Facility Area Asst Mgr23 4.000
11 1.000 1.000 1.000Fiscal Assistant V22 1.000
11 1.000 1.000 1.000Energy Mgt Tech Admin22 1.000
11 1.000 1.000 1.000Roof Construction Specialist22 (1.000)11 3.000 3.000 3.000Mechanical Systems Supervisor21 3.000
11 1.000 1.000 1.000General Maint Central Supv21 1.000
11 4.000 5.000 5.000Energy Management Spec20 5.000
11 6.000 6.000 6.000Mech Systems Team Ldr Shft 120 1.0007.000
11 2.000 2.000Mech Systems Team Ldr Shft 220 2.000
11 1.000 1.000 1.000Electronic Technician Supv20 1.000
11 1.000Energy Mgt Customer Svc Spec19 11 .500 .500Energy Management Assistant19 .500
11 67.000 66.000 66.000Mechanical Systems Tech Shft 119 12.00078.000
11 2.000 14.000 14.000Mechanical Systems Tech Shft 219 (1.000)13.000
11 3.000 3.000 3.000Electrician Area Supervisor19 3.000
11 1.000 1.000 1.000Electronic Tech Asst Superv19 1.000
11 2.000 2.000 2.000Auto Technican II Shift 119 2.000
11 Roof Inspector18 1.0001.000
11 3.000 3.000 3.000Carpentry Area Supervisor18 3.000
11 3.000 3.000 3.000General Maintenance Area Supv18 3.000
11 4.000 4.000 4.000Build & Grounds Contracts Asst18 4.000
11 1.000 1.000 1.000Material Fabrication Sup18 1.000
11 3.000 3.000 3.000Electronic Technician II18 3.000
11 1.000 1.000 1.000Industrial Equipment Supv18 1.000
11 3.000 3.000 3.000Carpentry Asst Area Supv17 3.000
11 3.000 3.000 3.000Maintenance Electrician II17 3.000
11 1.000 1.000 1.000Electric Motor Mechanic17 1.000
11 15.000 13.000 13.000Electronic Technician I17 13.000
11 1.000 1.000 1.000Equipment Mechanic17 1.000
11 2.000 2.000 2.000Auto Technican I Shift 117 2.000
11 1.000 1.000 1.000Fiscal Assistant III16 1.000
CHAPTER 7 – 50 OPERATIONS

DESCRIPTION CURRENTFYBUDGET
FYACTUAL
20172016 10Mon
FY 2017CAT CHANGE
2018FY
Division of Maintenance - 323/338/339
REQUEST
2018FY
323 Division of Maintenance
11 3.000 3.000 3.000General Maintenance Supervisor16 3.000
11 18.000 18.000 18.000Maintenance Electrician I16 18.000
11 4.000 4.000 4.000Small Equipment Mechanic16 4.000
11 1.000 1.000 1.000Administrative Secretary II15 1.000
11 1.000 1.000Fiscal Assistant II15 1.000
11 4.000 4.000 4.000Integr Pest Mgt Assoc II15 4.000
11 27.000 28.000 28.000Maintenance Carpenter I15 28.000
11 6.000 6.000 6.000Floor Covering Mechanic15 6.000
11 6.000 6.000 6.000Roof Mechanic15 1.0007.000
11 6.000 6.000 6.000Glazier15 6.000
11 2.000 2.000 2.000Tool Mechanic15 2.000
11 1.000Cabinet Maker15 11 1.000 1.000 1.000Maintenance Welder15 1.000
11 2.000 2.000 2.000Mason15 2.000
11 3.000 3.000 3.000Admin Operations Secretary14 3.000
11 3.000 3.000 3.000Mechanical Sys Worker Shift 114 3.000
11 1.000Mechanical Sys Worker Shift 214 11 3.000 3.000 3.000Locksmith14 3.000
11 3.000 3.000 3.000Maintenance Painter II14 3.000
11 2.000 2.000 2.000Water Treatment Tester14 2.000
11 1.000 1.000 1.000Fire Safety Compliance Tech.14 1.000
11 6.000 6.000 6.000General Maintenance Worker III13 6.000
11 2.000 2.000 2.000Reupholsterer Seamster II13 2.000
11 5.000 5.000 5.000Maintenance Painter I13 5.000
11 1.000 1.000 1.000Secretary12 1.000
11 3.000 3.000 3.000Account Assistant II12 3.000
11 3.000 3.000 3.000Equipment Operator12 3.000
11 4.000 4.000 4.000Materials Fabrication Worker12 4.000
11 4.000 4.000HVAC Apprentice12 4.000
11 3.000 3.000 3.000Roof Maintenance Worker11 1.0004.000
11 1.000 1.000 1.000Service Writer11 1.000
11 4.000 4.000 4.000Compactor Truck Operator11 4.000
11 1.500 1.500Office Assistant III10 1.500
11 34.000 34.000 34.000General Maintenance Worker II10 34.000
11 1.500Office Assistant II911 17.000 17.000 17.000General Maintenance Worker I9 17.000
11 4.000 4.000 4.000Sanitation Serv Worker9 4.000
337.000 354.000 354.000Subtotal 15.000369.000
338 Indoor Air Quality Unit
11 3.000Team LeaderM 11 2.000Mech Systems Team Ldr Shft 220
CHAPTER 7 – 51 OPERATIONS

DESCRIPTION CURRENTFYBUDGET
FYACTUAL
20172016 10Mon
FY 2017CAT CHANGE
2018FY
Division of Maintenance - 323/338/339
REQUEST
2018FY
338 Indoor Air Quality Unit
11 9.000Mechanical Systems Tech Shft 219 11 1.000Maintenance Carpenter I15
15.000Subtotal339 Maintenance Apprenticeship Program
11 4.000HVAC Apprentice12
4.000Subtotal
354.000356.000 354.000Total Positions 15.000369.000
CHAPTER 7 – 52 OPERATIONS

FY 2018 OPERATING BUDGET
Field and Central Facilities
Building Service Worker Training Specialist (17) 2.0Tool Mechanic (15) 2.0Outdoor Education Facilities Manager (14) 1.0Building Service Manager IV (14) 1.0Building Service Manager III (13) 12.0Building Service Manager II (12) 6.0Building Service Assistant Manager III (12/ND) 1.0Building Service Assistant Manager II (11/ND) 5.0Plant Equipment Operator II (11) 1.0Building Service Assistant Manager I (10/ND) 2.5Maintenance Worker I (Outdoor Ed) (10/ND) 3.0Building Service Worker (6) 21.7Building Service Worker (6/ND) 10.0
Schools
Building Service Manager VI (16) 4.0Building Service Manager V (15) 19.0Building Service Manager IV (14) 2.0Building Service Assistant Manager V (14/ND) 4.0Building Service Assistant Manager IV (13/ND) 19.0Building Service Manager III (13) 153.0Building Service Assistant Manager III (12/ND) 2.0Building Service Manager II (12) 25.0Plant Equipment Operator II (11) 25.0Building Service Assistant Manager II (11/ND) 153.0Plant Equipment Operator I (10) 42.0Building Service Assistant Manager I (10/ND) 25.0Building Service Worker (6) 545.5Building Service Worker (6/ND) 304.0
Division of School Plant Operations
Community Use of Public Facilities
Building Service Area Supervisor (G) 2.0*Customer Services Specialist (16) 1.0*Building Service Worker (6) 12.0Building Service Worker (6) 18.0*
School Supervision
Building Service Area Supervisor (G) 6.0
Director I (P) 1.0Assistant to the Director (K) 1.0Building Service Trainer (21) 1.0Fiscal Assistant II (15) 1.0 Administrative Secretary II (15) 1.0
F.T.E. Positions 1,413.7
(*In addition, the chart includes 21.0 positions funded by ICB. The 1,322.5 positions in schools also are shown on K–12 charts in Chapter 1)
ND Night Differential = Shift 2
CH
AP
TER 7 – 53 O
PER
ATIO
NS

Division of School Plant Operations - 329/327/328/330
Actual FY 2017Budget
FY 2017Current
FY 2018Request
FY 2018
Summer EmploymentProfessional Substitutes
Total Positions (FTE)Position Salaries
1,373.200$58,909,783
1,389.700$61,946,298
1,389.700$61,946,298
1,413.700$60,544,876
Other Salaries
01 Salaries & Wages
StipendsProfessional Part Time
ConsultantsOther Contractual
OfficeOther Supplies & Materials
MediaInstructional Supplies & Materials
Textbooks
Subtotal Other Salaries
Leased Equipment
Grand Total
Other Equipment
Total Salaries & Wages
02 Contractual Services
Total Contractual Services
03 Supplies & Materials
Total Supplies & Materials
04 Other
Total Other
05 Equipment
Total Equipment
Supporting Services Part TimeOther
392,910 392,910 417,9101,021,579
25,000
14,061
53,000
53,000
83,000
83,000
83,000
83,000
2,336,862
7172,520,095
2,520,812
7172,490,095
2,490,812
7172,542,982
2,543,699
52,887
52,887
60,852,597 63,360,787 63,360,787 61,984,365 (1,376,422)
1,021,579 1,021,579
1,942,814 1,414,489 1,414,489 1,439,489 25,000
$63,551,434
234,783
246,601
$66,350,104
36,210
282,811
246,60136,210
282,811
$66,350,104
246,60136,210
282,811
$65,026,569 ($1,323,535)
ChangeDescription FY 2016
24.000($1,401,422)
Insur & Employee BenefitsUtilitiesMiscellaneous
113,131
76,560
132,694
76,560
132,694
76,560
132,694
Local/Other Travel 56,134 56,134 56,134
CHAPTER 7 – 54 OPERATIONS

DESCRIPTION CURRENTFYBUDGET
FYACTUAL
20172016 10Mon
FY 2017CAT CHANGE
2018FY
Division of School Plant Operations - 329/327/328/330
REQUEST
2018FY
329 Field and Central Facilities
10 1.000 1.000 1.000Director IP 1.000
10 1.000 1.000 1.000Assistant to the DirectorK 1.000
10 6.000 6.000 6.000Building Service Area SupvG 6.000
10 1.000 1.000 1.000Building Service Trainer21 1.000
10 2.000 2.000 2.000Building Service Training Spec17 2.000
10 1.000 1.000 1.000Administrative Secretary II15 1.000
10 1.000 1.000 1.000Fiscal Assistant II15 1.000
10 2.000 2.000 2.000Tool Mechanic15 2.000
10 1.000 1.000 1.000Outdoor Ed Facilities Manager14 1.000
10 1.000 1.000 1.000Building Service Manager IV14 1.000
10 12.000 12.000 12.000Building Service Manager III13 12.000
10 1.000 1.000 1.000Build Svc Asst Mgr III Shft 212 1.000
10 4.000 5.000 5.000Building Service Manager II12 1.0006.000
10 1.000 1.000 1.000Plant Equipment Operator II11 1.000
10 4.000 5.000 5.000Build Svc Asst Mgr II Shft 211 5.000
10 3.000 3.000 3.000Outdoor Ed Maint Wkr I Shft 210 3.000
10 3.000 2.000 2.000Build Svcs Asst Mgr I Shft 210 .5002.500
10 34.700 33.700 33.700Building Service Wkr Shft 16 33.700
10 10.000 10.000 10.000Building Service Wkr Shft 26 10.000
89.700 89.700 89.700Subtotal 1.50091.200
327 Elementary School/Plant Operations
10 113.000 111.000 111.000Building Service Manager III13 111.000
10 20.000 22.000 22.000Building Service Manager II12 22.000
10 113.000 111.000 111.000Build Svc Asst Mgr II Shft 211 111.000
10 1.000Plant Equipment Operator I10 10 20.000 22.000 22.000Build Svcs Asst Mgr I Shft 210 22.000
10 281.000 283.000 283.000Building Service Wkr Shft 16 283.000
10 62.000 61.000 61.000Building Service Wkr Shft 26 61.000
610.000 610.000 610.000Subtotal 610.000
328 Secondary School/Plant Operations
10 3.000 4.000 4.000Building Service Manager VI16 4.000
10 20.000 19.000 19.000Building Service Manager V15 19.000
10 3.000 4.000 4.000Build Svc Asst Mgr V Shft 214 4.000
10 1.000 2.000 2.000Building Service Manager IV14 2.000
10 20.000 19.000 19.000Building Svs. Asst Mgr IV sh 213 19.000
10 39.000 39.000 39.000Building Service Manager III13 1.00040.000
10 1.000 2.000 2.000Build Svc Asst Mgr III Shft 212 2.000
10 25.000 25.000 25.000Plant Equipment Operator II11 25.000
10 39.000 39.000 39.000Build Svc Asst Mgr II Shft 211 1.00040.000
10 38.000 39.000 39.000Plant Equipment Operator I10 2.00041.000
10 221.500 240.000 240.000Building Service Wkr Shft 16 18.500258.500
CHAPTER 7 – 55 OPERATIONS
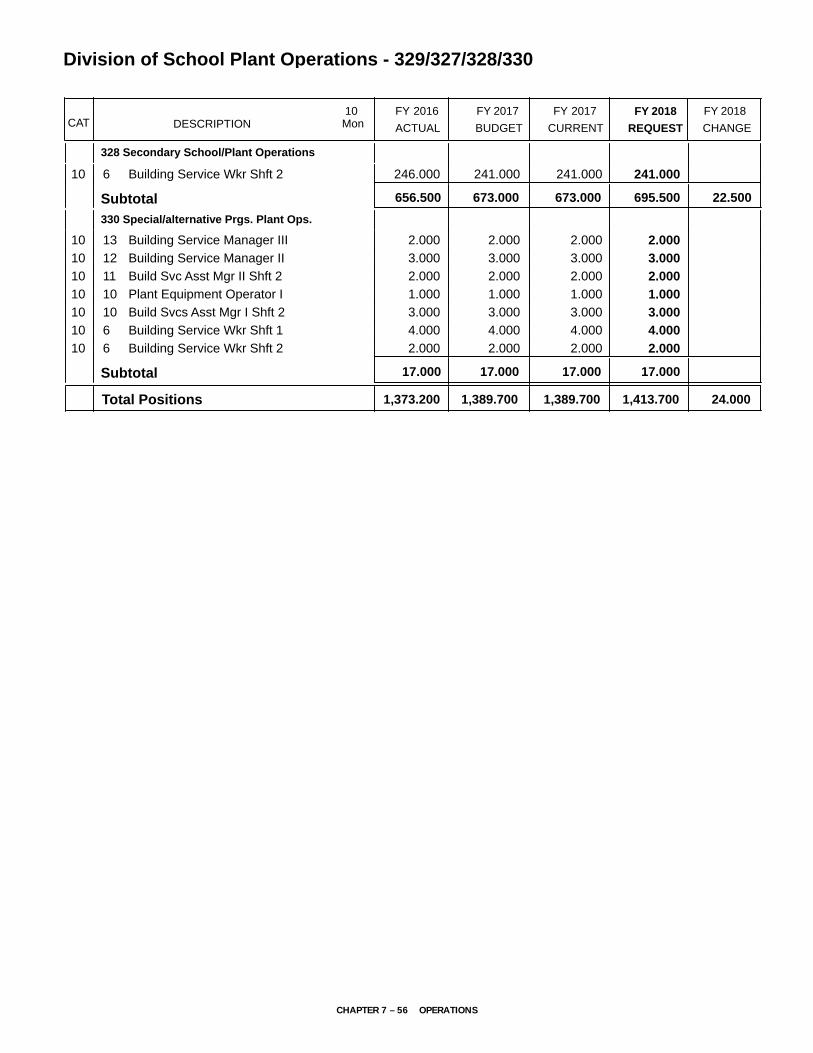
DESCRIPTION CURRENTFYBUDGET
FYACTUAL
20172016 10Mon
FY 2017CAT CHANGE
2018FY
Division of School Plant Operations - 329/327/328/330
REQUEST
2018FY
328 Secondary School/Plant Operations
10 246.000 241.000 241.000Building Service Wkr Shft 26 241.000
656.500 673.000 673.000Subtotal 22.500695.500
330 Special/alternative Prgs. Plant Ops.
10 2.000 2.000 2.000Building Service Manager III13 2.000
10 3.000 3.000 3.000Building Service Manager II12 3.000
10 2.000 2.000 2.000Build Svc Asst Mgr II Shft 211 2.000
10 1.000 1.000 1.000Plant Equipment Operator I10 1.000
10 3.000 3.000 3.000Build Svcs Asst Mgr I Shft 210 3.000
10 4.000 4.000 4.000Building Service Wkr Shft 16 4.000
10 2.000 2.000 2.000Building Service Wkr Shft 26 2.000
17.000 17.000 17.000Subtotal 17.000
1,389.7001,373.200 1,389.700Total Positions 24.0001,413.700
CHAPTER 7 – 56 OPERATIONS

Department of Transportation344/830
M I S S I O N The Department of
Transportation (DOT) strives to achieve
“Customer Delight” by providing safe, timely,
equitable, and efficient transportation that
contributes to the educational success of
all students through staff committed to
excellence and continuous improvement.
MAJOR FUNCTIONSDOT is responsible for the operation of regular and spe-cial program bus service for eligible students, vehicle maintenance and repair, employee recruiting and train-ing, and transportation-related administrative services. Bus operations provide daily transportation services for more than 100,000 students. Ridership is composed of two categories—regular education and special educa-tion. DOT will further incorporate the use of performance data to evaluate our service delivery effectiveness, con-tinuously improve safety measures, and ensure excellent service to students, schools, and families. DOT works collaboratively with all schools and offices to support the systemwide mission of academic excellence for all.
Regular Education TransportationDOT supports the strategic focus on learning, results, and accountability, through daily transportation of around 99,000 students on regular education school buses to neighborhood schools and Head Start, magnet, International Baccalaureate, language immersion, con-sortium, and other programs. DOT’s framework for rout-ing in support of consortium schools allows students to choose from a variety of magnet programs that match their interests and skills and to ensure that our students are challenged, demonstrate progress in an area of interest, and maximize their potential to keep them on track for graduation and postsecondary success. DOT continually evaluates safety and on-time arrival data to improve key performance outcomes in these areas. On-time bus arrivals at schools are a key indicator for the effectiveness of ensuring that students are in class ready for instruction at the prescribed time. Late arrival of students at schools causes disruption in classrooms and may preclude some students from having school-provided breakfast. DOT currently achieves 93 percent on-time arrival at the elementary level; 95 percent on-time arrival at the middle school level; and 96 percent on-time arrival at the high school level.
Special Education TransportationWith a focus on learning, results, and accountability, as well as community partnerships and engagement, approximately 5,000 students are transported daily on special education buses to special education programs. Many students require transportation to specialized programs outside of their home school or require spe-cialized equipment and/or a bus attendant. DOT fully supports the system goal of academic excellence for all students by closely monitoring our investment of resources and aligning resources to meet the individual needs of each student. Additionally, DOT is commit-ted to developing and maintaining partnerships with our parents and schools so that communication among all partners is achieved to support student and family needs.
Field TripsOver 14,000 supplemental transportation services are provided on an annual basis for field trips and extra-curricular activities for instructional programs and to enrich the educational experience for MCPS students on a cost-recovery basis. DOT recognizes and supports the importance of additional learning opportunities pro-vided by field trips, clubs, and sports which require a strong partnership and collaboration with our schools and communities. Student involvement and engage-ment in these activities contributes to academic and personal success as they move toward graduation and postsecondary careers.
Career and Technology Education, Outdoor Education, and After-school Activities
Community partnerships and engagement are sup-ported by providing transportation for students to attend various career and technology programs that enhance the educational options for students. All stu-dents at some point in their MCPS journey are trans-ported to one or more outdoor education programs. Middle and high schools are provided bus service to take students to their neighborhoods following after-school activities, ensuring equitable access to extracur-ricular experiences. DOT cultivates strong partnerships and collaboration with our schools and communities to realize the additional learning opportunities provided by career and technology education, outdoor education, and after-school activities. Student involvement and engagement in these activities enhance academic and personal success as students move toward college and career readiness.
CHAPTER 7 – 57 OPERATIONS

Department of Transportation344/830
Vehicle Maintenance and RepairFocusing on operational excellence, the Fleet Mainte-nance Unit manages vehicle maintenance and repair facilities, provides fuel distribution, and repairs 1,287 buses and 150 other MCPS vehicles. Most repair ser-vices are provided by the five depot repair facilities; some specialized services are contracted out. Ensuring safe, reliable, and on-time service to the over 100,000 students transported on a daily basis is a key element of ensuring academic excellence for all.
Human Resources and TrainingHuman resource services managed within the depart-ment include advertising and recruiting; hiring; pre-employment record checks and drug testing; safety training; and maintenance of licensing, certification, and medical record assessments. DOT continues to facilitate the rapid deployment of new school bus operators by authorization from the state of Maryland to conduct Motor Vehicle Administration driver record checks and commercial driver’s license testing on MCPS premises. The training and employment plan is aimed at employee retention with an overall goal of reducing training and recruiting needs and costs. DOT contributes to the stra-tegic priority of human capital management through an emphasis on professional growth and development. School bus operator and attendant training and reten-tion is facilitated by ongoing cooperative professional growth activities with Service Employees International Union (SEIU) Local 500. DOT plans to work collabora-tively with our labor partners on a professional devel-opment program to encourage our diverse group of employees to consider future careers as teachers. Addi-tionally, in a Maryland State Department of Education comparison of statewide transportation training pro-grams, MCPS DOT offers more learning opportunities for its staff than any other Maryland school system.
Transportation Administrative ServicesDOT designs all bus routes and manages employee assignments, planning, training, personnel services, accounting, and related services to more than 2,100 permanent and temporary employees. The systemwide bidding process for midday and other extra work devel-oped jointly between SEIU Local 500 and DOT continues to provide assignment stability resulting in improved service to customers. Preemployment, post-accident, random, and reasonable suspicion drug-testing pro-grams required by federal law also are administered. DOT’s motto of “Customer Delight” continues to guide our workforce as the department’s foundation of build-ing a positive, supportive culture of trust and respect that is based on collaboration and strong relationships to improve department and system performance.
MEASURESM E A S U R E : Number of preventable accidents per mil-lion miles.
FY 2016Actual
FY 2017Estimate
FY 2018Recommended
4.2 4.0 3.8
E X P L A N A T I O N : A measure of the delivery of safe transportation services is the preventable accident rate per million miles.
M E A S U R E : Ensure satisfactory performance by having no more than a seven percent absence rate for school bus operators and attendants.
FY 2016Actual
FY 2017Estimate
FY 2018Recommended
7.6% 8.0% 7.5%
E X P L A N A T I O N : Satisfactory customer service requires school bus operators and attendants, with knowledge of routes and the students they serve, to be at work daily. Substitutes, while skilled as drivers, cannot replace the personal touch and knowledge of the regular school bus operator and/or attendant.
M E A S U R E : Every route has an appropriately config-ured school bus available every day (i.e., 95 percent of the fleet is available for daily service).
FY 2016Actual
FY 2017Estimate
FY 2018Recommended
96% 95.4% 95.4%
E X P L A N A T I O N : While spare buses are available to fill in for buses out of service, the mix of specialized equipment and the geographical distribution of the spare fleet means that the needed spare bus is not always at the right location when needed. Timely service and customer satisfaction is directly related to adequate school buses being available each morning.
CHAPTER 7 – 58 OPERATIONS

Department of Transportation344/830
M E A S U R E : Review diesel fuel miles per gallon (MPG) for operational efficiency.
FY 2016Actual
FY 2017Estimate
FY 2018Recommended
6.33 6.5 7.0
E X P L A N A T I O N : MPG data are used to evaluate operational cost of the school bus fleet. Higher MPG will decrease diesel fuel purchases and help control expenditures since a $0.01 per gallon increase in the price of fuel will cost the school system an additional $29,000. MPG information and other operational data by bus manufacturers are used in the selection process of new school buses. Because of the high cost of diesel fuel, the MPG data by vehicle will be reviewed and evaluated to control waste from bus idling. DOT reviews diesel fuel miles per gallon for operational efficiency.
M E A S U R E : Number of students transported per bus.
FY 2016Actual
FY 2017Estimate
FY 2018Recommended
139 142 143
E X P L A N A T I O N : The number of students transported per bus measures the efficiency of the MCPS transportation system. Efficiency increases as each bus is able to serve more schools and more students. Regular education routes are the most efficient as they serve smaller school attendance areas. Special education routes serve much larger attendance areas. While bus capacity is a major factor in regular education route efficiency, time and distance between students and schools are the most significant limiting factors in special education route efficiency.
M E A S U R E : Percentage of on-time bus arrivals.
FY 2016Actual
FY 2017Estimate
FY 2018Recommended
93% 94% 95%
E X P L A N A T I O N : On-time bus arrivals at schools are a key indicator for the effectiveness of ensuring that students are in class ready for instruction at the prescribed time. Late arrival of students at schools causes disruption in classrooms and may preclude some students from having school-provided breakfast. This measure is based on the successful arrival of buses at least five minutes before the morning bell and no later than 20 minutes after the afternoon bell.
OVERVIEW OF BUDGET CHANGES
FY 2018 RECOMMENDED BUDGET
The FY 2018 recommended budget for this
department is $106,023,326, a decrease of
$1,168,601 from the current FY 2017 budget. An
explanation of this change follows.
Same Service Level Changes—($590,793)Continuing Salary Costs—($810,121)Negotiations with our employee associations for new contracts (effective July 1, 2017) began in October 2016, and are continuing as of this publication. As a result, the proposed FY 2018 Superintendent’s Operating Bud-get does not include employee negotiated salary costs. The decrease of $810,121 for continuing salary is the cost associated with lapse and turnover; the amount of unused budgeted salary that remains when an employee terminates service and is not immediately replaced or an employee terminates service and the backfill is hired at a lower salary.
Realignments to Meet Expenditure Requirements and Program Priorities—($705,703) The FY 2018 recommended budget includes realign-ments that result in an overall budget neutral set of realignments between departments and offices. The realignment includes a reduction of $299,943 and 6.5 bus route supervisor positions, $142,904 and 4.0 auto tech apprentice positions, $471,360 in bus fuel from low-ering the cost from $2.18 to $2.02 per gallon, and $91,496 in bus tires and parts. Of this realignment, a total of $928,530 has been realigned to the Division of Mainte-nance to create two additional teams in the HVAC and IAQ units. The remaining $77,173 is realigned to support other departments within the Chief Operating Officer.
Realignments are budgeted to address priority spend-ing needs in the Field Trip Fund. There is a realignment of $280,000 from the Tech Services Fund and $20,000 from the Division of Food and Nutrition Services to the Field Trip Fund to support additional increases for field trip services. The realignment can be made as a result of increased revenue in the Field Trip Fund.
Student Enrollment—$409,724Due to projected enrollment growth, there is an increase for 6 additional buses at an annual lease/purchase cost of $133,416. In addition, there is an increase of $152,066 for 5.625 bus operator I positions, and $42,986 for 1.875 bus attendant positions. Furthermore, there is an addi-tional $81,256 budgeted for substitute bus drivers, bus repairs, parts, and supplies.
CHAPTER 7 – 59 OPERATIONS

Department of Transportation344/830
Bus Replacement—$551,074The department’s budget reflects a reduction of $1,889,838 in lease payments on buses purchased in prior years. Offsetting this reduction is a $2,440,912 increase for the lease/purchase of 106 buses to replace those that have reached the end of their normal service life.
Other—($35,767)There is a decrease of $35,767 for insurance based on projected claims and reserve requirements. Insurance for MCPS is provided under the county’s self-insurance program.
Program Efficiencies and Reductions—($770,968)The FY 2018 recommended budget for this department includes a comprehensive effort to identify potential program efficiencies and reductions. Stakeholders, including community partners and employee union representatives, participated in the program efficiencies and reduction process.
There is a reduction of $50,968 and a 1.0 regional router position, $60,000 for contractual services and $35,000 for staff vehicle fuel resulting from lower fuel prices. In addition, there is a reduction of $300,000 for bus tires due to more frequent retreading of tires, resulting in fewer purchases, and $325,000 for bus parts from lower contract pricing.
Strategic Accelerator—$193,160Focus on Improve Teaching and Learning - $193,160There is an increase of $173,160 for activity buses and one after school field trip per semester to expand transporta-tion services for minority achievement extra-curricular programs to 39 middle schools. This strategic accelera-tor also includes $20,193 for employee benefits shown in this chapter within the Department of Employee and Retiree Services, and $263,958 for part-time salaries for school improvement planning shown in Chapter 1.
In addition, there is an increase of $20,000 in student transportation services to implement a high school diploma program for students who are over-aged, under-credited, and in need of an alternative path to graduation. The program will increase access and completion of Career Technical Education programs and start the implementation of apprenticeship pro-grams that result in more graduates with an industry certification and ready to enter the world of work. This strategic accelerator also includes $64,915 for employee benefits shown in this chapter within the Department of Employee and Retiree Services; $360,000 for stipends and materials shown in Chapter 1; $118,737 for position salaries shown in Chapter 3; and $630,000 for contrac-tual services shown in Chapter 4.
Selected Expenditure Information Operation and Maintenance of Buses and Vehicles
FY 2017 FY 2018Description Current Budget Budget Change
Diesel Fuel $6,371,304 $5,949,444 ($421,860)Bus Parts 3,917,215 3,586,915 (330,300)Bus Tires 652,409 332,409 (320,000)Indirect Shop Supplies 302,085 303,477 1,392Service Vehicle Parts and Fuel 665,966 635,966 (30,000)Other Supplies 129,777 129,777 0Total $12,038,756 $10,937,988 ($1,100,768)
Fiscal YearPurchased Replacement Growth Total
2006 95 26 1212007 90 12 1022008 121 9 1302009 58 0 582010 42 0 422011 96 0 962012 106 0 1062013 89 0 892014 104 3 1072015 107 5 1122016 106 2 1082017 106 10 1162018 106 6 112
1,299
LEASE / PURCHASE OF BUSES
CHAPTER 7 – 60 OPERATIONS

FY 2018 OPERATING BUDGET
Department of Transportation
F.T.E. Positions 1,736.653
ND Night Differential = Shifts 2 and 3
Fleet Maintenance
Auto Repair Supervisor III (K) 1.0Auto Repair Supervisor II (H) 1.0Auto Parts Supervisor (23) 1.0Auto Repair Supervisor I (22) 4.0Auto Technician II (19) 1.0Auto Technician II (19/ND) 10.0Fiscal Assistant IV (18) 1.0Auto Technician I (17) 21.0Auto Technician I (17/ND) 33.0Auto Parts Specialist (15) 1.0Administrative Operations Secretary (14) 1.0Auto Parts Assistant (13) 1.0Auto Parts Assistant (13/ND) 2.0Satellite Parts Assistant (12) 4.0Auto Technician Apprentice (11) 3.0Auto Technician Apprentice (11/ND) 5.0Service Writer (11) 5.0Account Assistant I (10) 1.0Auto Service Worker (8) 4.0Auto Service Worker (8)/ND 8.0Fueling Assistant (8) 5.0
Bus Operations
Bus Operations Manager (K) 1.0Transportation Depot Manager (J) 8.0Transportation Cluster Manager (19) 23.0Transportation Dispatcher (19) 6.0Bus Route Supervisor (17) 68.0Administrative Operations
Secretary (14) 7.0Bus Radio Operator (10 Mth.) (14) 20.0Transportation Time and
Attendance Ast. (12) 6.0Transportation Staff Assistant (11) 1.0Bus Operator I (10 Mth.) (11) 1,013.35Bus Operator I
(Head Start) (10 Mth.) (11) 14.8Bus Attendant (SPED) (10 Mth.) (7) 410.003
Safety Training
Safety & Staff Development Manager (J) 1.0Senior Trainer (19) 1.0Safety Trainer II (17) 3.0Wellness Coach (17) 1.0Administrative Operations Secretary (14) 1.0Safety Trainer I (14) 12.0
Transportation Support
Supervisor (K) 1.0Transportation Specialist (SPED) (J) 0.75Transportation Routing Specialist (H) 1.0IT Systems Engineer (27) 1.0Transportation Administrative Svc. Mgr. (26) 1.0Database Administrator II (25) 1.0IT Systems Specialist (18-25) 2.0Route/Program Specialist (21) 1.0Transportation Assignment Specialist (20) 1.0Employment Process Coordinator (19) 1.0Transportation Ast. Supervisor (SPED) (19) 1.0Regional Router (18) 1.0Transportation Router (16) 4.0Account Assistant III (14) 2.0Administrative Operations Secretary (14) 2.0
Director II (Q) 1.0Assistant Director II (O) 1.0Fiscal Specialist I (24) 0.75Administrative Secretary III (16) 1.0Transportation Special Assistant (15) 1.0Office Assistant IV (11) 1.0
CH
AP
TER 7 – 61 O
PER
ATIO
NS

Department of Transportation - 344
Actual FY 2017Budget
FY 2017Current
FY 2018Request
FY 2018
Summer EmploymentProfessional Substitutes
500,000 500,000 500,000
Total Positions (FTE)Position Salaries
1,720.653$65,354,532
1,740.653$70,686,583
1,740.653$70,686,583
1,736.653$69,577,699
Other Salaries
01 Salaries & Wages
StipendsProfessional Part Time
ConsultantsOther Contractual
OfficeOther Supplies & Materials
MediaInstructional Supplies & Materials
Textbooks
Subtotal Other Salaries
Leased Equipment
Grand Total
Other Equipment
Total Salaries & Wages
02 Contractual Services
Total Contractual Services
03 Supplies & Materials
Total Supplies & Materials
04 Other
Total Other
05 Equipment
Total Equipment
Supporting Services Part TimeOther
3,146,535 3,146,535 3,160,1891,394,973
13,654
1,243,721
1,509,442
1,509,442
1,509,442
1,509,442
1,429,956
1,429,956 (79,486)
(79,486)
9,164,509
42,99111,995,765
12,038,756
42,99111,995,765
12,038,756
42,99110,894,997
10,937,988
(1,100,768)
(1,100,768)
75,658,427 75,728,091 75,728,091 74,632,861 (1,095,230)
1,394,973 1,394,973
10,303,895 5,041,508 5,041,508 5,055,162 13,654
$100,987,502
12,570,981
172,323
$105,185,566
13,250,275
13,422,598
172,32313,250,275
13,422,598
$105,185,566
172,32313,934,765
14,107,088
$103,716,965
684,490
684,490
($1,468,601)
ChangeDescription FY 2016
(4.000)($1,108,884)
Insur & Employee BenefitsUtilitiesMiscellaneous
2,349,864
1,357,010
1,075,147
2,486,679
1,357,010
1,075,147
2,486,679
1,321,243
1,233,307
2,609,072
(35,767)
158,160
122,393
Local/Other Travel 54,522 54,522 54,52220 355
CHAPTER 7 – 62 OPERATIONS

DESCRIPTION CURRENTFYBUDGET
FYACTUAL
20172016 10Mon
FY 2017CAT
Department of Transportation - 344
FY 2018CHANGE
FY 2018
REQUEST
9 1.000 1.000 1.000Director IIQ 1.000
9 1.000 1.000 1.000Assistant Director IIO 1.000
9 1.000 1.000 1.000SupervisorK 1.000
9 1.000 1.000 1.000Auto Repair Supervisor IIIK 1.000
9 1.000 1.000 1.000Bus Operations ManagerK 1.000
9 1.000 1.000 1.000Safety/Staff Development MgrJ 1.000
9 .750 .750 .750Transportation Spec - Spec EdJ .750
9 7.000 7.000 7.000Transportation Depot ManagerJ 1.0008.000
9 1.000 1.000 1.000Auto Repair Supervisor IIH 1.000
9 1.000 1.000 1.000Transportation Routing SpecH 1.000
9 1.000 1.000 1.000IT Systems Engineer27 1.000
9 1.000 1.000 1.000Transport Admin Svcs Mgr26 1.000
9 2.000 2.000 2.000IT Systems Specialist25 2.000
9 1.000 1.000 1.000Database Administrator II25 1.000
9 .750 .750 .750Fiscal Specialist I24 .750
9 2.000 2.000 2.000Auto Parts Supervisor23 (1.000)1.000
9 4.000 4.000 4.000Auto Repair Supv I22 4.000
9 1.000 1.000 1.000Route/Program Specialist21 1.000
9 1.000 1.000 1.000Transportation Assignment Spec20 1.000
9 1.000 1.000 1.000Employment Process Coordinator19 1.000
9 1.000 1.000 1.000Auto Technican II Shift 119 1.000
9 5.000 5.000 5.000Auto Technican II Shift 219 5.000
9 5.000 5.000 5.000Auto Technican II Shift 319 5.000
9 1.000 1.000 1.000Transportation Asst Supv19 1.000
9 6.000 6.000 6.000Transportation Dispatcher19 6.000
9 23.000 23.000 23.000Transportation Cluster Mgr19 23.000
9 1.000 1.000 1.000Senior Trainer19 1.000
9 1.000 1.000 1.000Fiscal Assistant IV18 1.000
9 2.000 2.000 2.000Regional Router18 (1.000)1.000
9 1.000 1.000 1.000Wellness Coach17 1.000
9 3.000 3.000 3.000Safety Trainer II17 3.000
9 21.000 21.000 21.000Auto Technican I Shift 117 21.000
9 17.000 17.000 17.000Auto Technican I Shift 217 17.000
9 16.000 16.000 16.000Auto Technican I Shift 317 16.000
9 74.500 74.500 74.500Bus Route Supervisor17 (6.500)68.000
9 1.000 1.000 1.000Administrative Secretary III16 1.000
9 4.000 4.000 4.000Transportation Router16 4.000
9 1.000 1.000 1.000Transport Special Assistant15 1.000
9 1.000 1.000 1.000Auto Parts Specialist15 1.000
9 11.000 11.000 11.000Admin Operations Secretary14 11.000
9 2.000 2.000 2.000Account Assistant III14 2.000
9 20.000 20.000 20.000XRadio Bus Operator14 20.000
9 12.000 12.000 12.000Safety Trainer I14 12.000
CHAPTER 7 – 63 OPERATIONS

DESCRIPTION CURRENTFYBUDGET
FYACTUAL
20172016 10Mon
FY 2017CAT
Department of Transportation - 344
FY 2018CHANGE
FY 2018
REQUEST
9 2.000 2.000 2.000Tire Repairer13 (2.000)9 1.000 1.000 1.000Auto Parts Asst Shift 113 1.000
9 1.000 1.000 1.000Auto Parts Asst Shift 213 1.000
9 Auto Parts Assistant Shift 313 1.0001.000
9 4.000 4.000 4.000Satellite Parts Asst Shift I12 4.000
9 6.000 6.000 6.000Transport Time/Attend Asst12 6.000
9 1.000 1.000 1.000Office Assistant IV11 1.000
9 2.000 2.000 2.000Service Writer11 3.0005.000
9 3.000 3.000 3.000Auto Tech Apprentice Shift 111 3.000
9 2.000 4.000 4.000Auto Tech Apprentice Shift 211 (2.000)2.000
9 3.000 5.000 5.000Auto Tech Apprentice Shift 311 (2.000)3.000
9 1,014.525 1,022.525 1,022.525XBus Operator I11 5.6251,028.150
9 1.000 1.000 1.000Transportation Staff Assistant11 1.000
9 3.000 3.000 3.000Account Assistant I10 (2.000)1.000
9 4.000 4.000 4.000Auto Service Worker Shift 18 4.000
9 5.000 5.000 5.000Auto Service Worker Shift 28 5.000
9 3.000 3.000 3.000Auto Service Worker Shift 38 3.000
9 5.000 5.000 5.000Transportation Fueling Asst8 5.000
9 400.128 408.128 408.128XBus Attendant Spec Ed7 1.875410.003
1,740.6531,720.653 1,740.653Total Positions 1,736.653 (4.000)
CHAPTER 7 – 64 OPERATIONS

FY 2018 OPERATING BUDGET
F.T.E. Positions 4.5
Field Trip Fund
Transportation Specialist (SPED) (J) 0.25Fiscal Specialist (24) 0.25Business Services Analyst (23) 1.0 Senior Field Trip Coordinator (19) 1.0Field Trip Assistant (12) 2.0
CH
AP
TER 7 – 65 O
PER
ATIO
NS
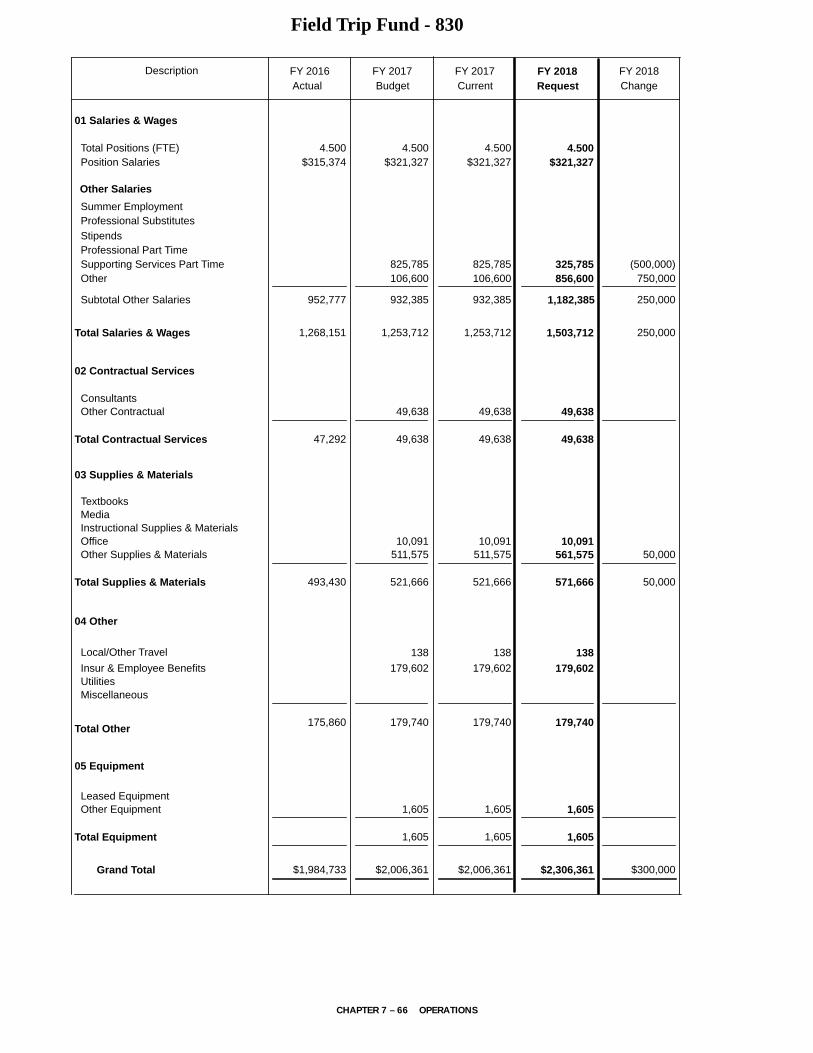
Field Trip Fund - 830
Actual FY 2017Budget
FY 2017Current
FY 2018Request
FY 2018
Summer EmploymentProfessional Substitutes
Total Positions (FTE)Position Salaries
4.500$315,374
4.500$321,327
4.500$321,327
4.500$321,327
Other Salaries
01 Salaries & Wages
StipendsProfessional Part Time
ConsultantsOther Contractual
OfficeOther Supplies & Materials
MediaInstructional Supplies & Materials
Textbooks
Subtotal Other Salaries
Leased Equipment
Grand Total
Other Equipment
Total Salaries & Wages
02 Contractual Services
Total Contractual Services
03 Supplies & Materials
Total Supplies & Materials
04 Other
Total Other
05 Equipment
Total Equipment
Supporting Services Part TimeOther
825,785 825,785 325,785856,600 750,000
(500,000)
47,292
49,638
49,638
49,638
49,638
49,638
49,638
493,430
10,091511,575
521,666
10,091511,575
521,666
10,091561,575
571,666
50,000
50,000
1,268,151 1,253,712 1,253,712 1,503,712 250,000
106,600 106,600
952,777 932,385 932,385 1,182,385 250,000
$1,984,733
1,605
$2,006,361
1,605
1,605
1,605
$2,006,361
1,605
1,605
$2,306,361 $300,000
ChangeDescription FY 2016
Insur & Employee BenefitsUtilitiesMiscellaneous
175,860
179,602
179,740
179,602
179,740
179,602
179,740
Local/Other Travel 138 138 138
CHAPTER 7 – 66 OPERATIONS

DESCRIPTION CURRENTFYBUDGET
FYACTUAL
20172016 10Mon
FY 2017CAT
Field Trip Fund - 830
FY 2018CHANGE
FY 2018
REQUEST
71 .250 .250 .250Transportation Spec - Spec EdJ .250
71 .250 .250 .250Fiscal Specialist I24 .250
71 1.000 1.000 1.000Business Services Analyst23 1.000
71 1.000 1.000 1.000Sr Field Trip Coordinator19 1.000
71 2.000 2.000 2.000XField Trip Assistant12 2.000
4.5004.500 4.500Total Positions 4.500
CHAPTER 7 – 67 OPERATIONS

Department of Materials Management351/352/354/355/417/353/810/811/812/813/814/815
M I S S I O N The mission of the
Department of Materials Management (DMM)
is to economically facilitate the delivery of
approved, high-quality products, meals,
resources, and services, in an environment
of cooperation, integrity, and excellence, that
are essential to the educational success of all
students in MCPS and support the programs
of our community partners.
MAJOR FUNCTIONS
Supply and Property ManagementDMM manages a warehouse and distribution network that provide the necessary textbooks, classroom and office supplies, science kits, furniture, equipment, and test materials to MCPS schools and offices. An efficient and effective mail service, for both internal (Pony) and external mail, is provided. DMM, with a laser-like focus on operational effectiveness and a culture of commit-ment to supporting schools, strives to effectively deliver the resources and services required of all instructional programs. This is accomplished by listening to the needs of its customers, understanding requirement expecta-tions, and anticipating needs to formulate strategies to meet targeted goals, align work across other offices, and benchmark best practices in the supply chain industry.
Instructional and Library Material ProcessingDMM maintains a database of approved textbooks and library and instructional materials. It also circu-lates videos requested by teachers for classroom use. School library media purchases are processed centrally to ensure uniformity, facilitate systematic cataloging of records, and to save time for school staff. Staff engage collaboratively with offices and school-based staff to ensure all materials fully support the instructional program.
Editorial, Graphics, and Publishing ServicesEGPS is responsible for providing document prepara-tion, graphic content, and editorial support to schools and offices. Products include public information mate-rials, student daily planners and handbooks, student diplomas and certificates, and other guides used in the academic programs. Custom color printing also is pro-vided. Copy-Plus provides centralized duplication for
instructional materials permitting teachers to maximize time spent providing instruction. TeamWorks provides copier equipment and maintenance for the high-volume copiers located in all schools and many offices. There is a focus to provide additional copier resources to highly impacted schools and schools with large enrollments.
ProcurementThe Procurement Unit purchases goods and services through contract awards to vendors who meet product specifications. Vendor performance and product quality are monitored to ensure maximum customer satisfac-tion. Maryland State law requires MCPS to advertise for sealed bids for materials, equipment, and supplies that cost more than $25,000. During FY 2010, the state passed a funding accountability law (pertaining to MCPS only) that provides for web-based reporting to the public; sev-eral other jurisdictions have since followed with similar information. In addition, the Board of Education has tasked the Procurement Unit with promoting outreach efforts and actively recruiting minority, female, and dis-abled vendors. Excellent customer service is paramount to providing the resources needed to successfully sup-port instructional programs.
Food and Nutrition ServicesThe Division of Food and Nutrition Services provides high-quality, nutritious meals in a cost-effective and efficient operation. The division administers five child nutrition programs, a central production facility, and a food warehouse and distribution center. A hungry child cannot learn, therefore, breakfast and lunch meals, as well as afterschool snacks and suppers, are provided to students during the school year. Summer meals are provided to MCPS students enrolled in academic and other programs. The division also provides nutrition education and support to schools and various commu-nity groups. This division strives to continually identify, through the use of data and process review, opportuni-ties to reach more students in need of food supports to improve their opportunities to learn.
CHAPTER 7 – 68 OPERATIONS

Department of Materials Management351/352/354/355/417/353/810/811/812/813/814/815
MEASURESM E A S U R E : Warehouse supply orders with original line fill rate greater than 98 percent.
FY 2016Actual
FY 2017Estimate
FY 2018Recommended
98% 98.5% 99%
E X P L A N A T I O N : This measure reflects the outcome of shipping supply orders with a product completion rate of 98 percent or greater. The measure is used to maintain excellent service to schools, ensuring efficient and timely delivery of products required to support the instructional program.
M E A S U R E : Number of printed pages requested by school staff and produced by the Copy-Plus work group in EGPS.
FY 2016Actual
FY 2017Estimate
FY 2018Recommended
152 million 155 million 158 million
E X P L A N A T I O N : This measures the expansion of work performed centrally and the reduction of school staff time spent duplicating materials for instructional purposes. It is estimated that for every 2,500 copies generated by Copy-Plus, one hour of school-based staff time is saved that can be used for instructional planning and preparation. For example, 152 million pages printed by Copy-Plus in FY 2016 is estimated to equal 60,800 hours of time saved by school-based staff.
M E A S U R E : Average number of pages printed within the schools in between copier repair service requests by school offices and performed by TeamWorks in EGPS.
FY 2016Actual
FY 2017Estimate
FY 2018Recommended
62,822 66,000 66,000
E X P L A N A T I O N : This measures the operational efficiency of the high-volume copiers located in all schools and the effectiveness of the repairs completed by TeamWorks.
M E A S U R E : Number of material transactions.
FY 2016Actual
FY 2017Estimate
FY 2018Recommended
Number of requisition lines 164,306 165,000 165,500
Number of online purchase orders 37,929 38,500 39,000
Number of purchasing card transactions 45,188 47,000 50,000
E X P L A N A T I O N : This measure continues to evaluate the Procurement Unit on workload distribution, status of projects, forecasting future personnel needs, types of personnel needed, and planning for future district initiatives.
M E A S U R E : Elementary school lunch participation as a percentage of enrollment.
FY 2016Actual
FY 2017Estimate
FY 2018Recommended
50.5% 50.7% 50.9%
E X P L A N A T I O N : This measure reflects customer satisfaction by tracking the number of elementary school students receiving a school lunch. This measure is used to gauge the voice of the customer and ensure resources are allocated to align with the schools’ needs.
M E A S U R E : Secondary school meal participation as a percentage of enrollment.
FY 2016Actual
FY 2017Estimate
FY 2018Recommended
26.5% 26.6% 26.7%
E X P L A N A T I O N : This measure reflects customer satisfaction by tracking the number of secondary school students receiving a school lunch. This measure, along with other sales, is used to gauge the voice of the customer and ensure resources are allocated to align with the schools’ needs.
CHAPTER 7 – 69 OPERATIONS

Department of Materials Management351/352/354/355/417/353/810/811/812/813/814/815
FY 2018 RECOMMENDED BUDGET
The FY 2018 recommended budget for this
department is $66,343,844, an increase of $758,429
over the current FY 2017 budget. An explanation of
this change follows.
Same Service Level Changes—$349,831Realignments to Meet Expenditure Requirements and Priorities—($5,580)Realignments are budgeted to address priority spend-ing needs in this department. Within the Department of Materials Management, there is a realignment of a 1.0 administrative secretary III position to create a 1.0 fiscal assistant IV position. There is a realignment of $70,072 from furniture and equipment to support additional costs in contractual services for the storage of trailers, and program supplies to replace the supply warehouse scanning system. In addition, there is a realignment from the Department of Facilities Management of $12,920 to this department to support costs for additional vehicles.
In the Procurement Unit, there is a realignment of a 1.0 buyer assistant I position to create a 1.0 buyer assistant II position. In addition, there is a realignment from the Department of Facilities Management of $1,500 to this unit to support costs for professional development.
In the Division of Food and Nutrition Services, there is a realignment of $20,000 to the Field Trip Fund to support additional increases for field trip services.
New Schools/Space—$325,411Within the Division of Food and Nutrition Services, there is an increase of a 1.0 cafeteria manager posi-tion and 3.0 cafeteria worker positions and $100,411 for the opening of the new Bethesda Chevy Chase Middle School. In addition, there is an increase in food supplies of $225,000.
Other—$30,000Within the Division of Food and Nutrition Services, the budget includes an increase of $30,000 in contributions to the county’s self-insurance program for worker’s compensation.
Program Efficiencies and Reductions—($71,402)The FY 2018 recommended budget for this department, division, unit, office includes a comprehensive effort to identify potential program reductions and efficien-cies. Stakeholders including community partners and employee union representatives participated in the pro-gram efficiencies and reduction process.
There is reduction of $40,340 and a 1.0 tractor trailer operator position. In addition, there is a reduction of $6,740 for contractual maintenance and $24,322 for fur-niture and equipment. These reductions can be made as result of overall efficiencies within the department.
Strategic Accelerator—$480,000Focus on Community Partnerships and Engagement—$480,000The FY 2018 Operating Budget accelerators focus on improving community partnerships and engagement. As a result, there is an increase in instructional materials of $480,000 to include more materials for parents to help children succeed in school. This strategic accelerator also includes $254,959 for position salaries and contrac-tual services shown in Chapter 10.
CHAPTER 7 – 70 OPERATIONS
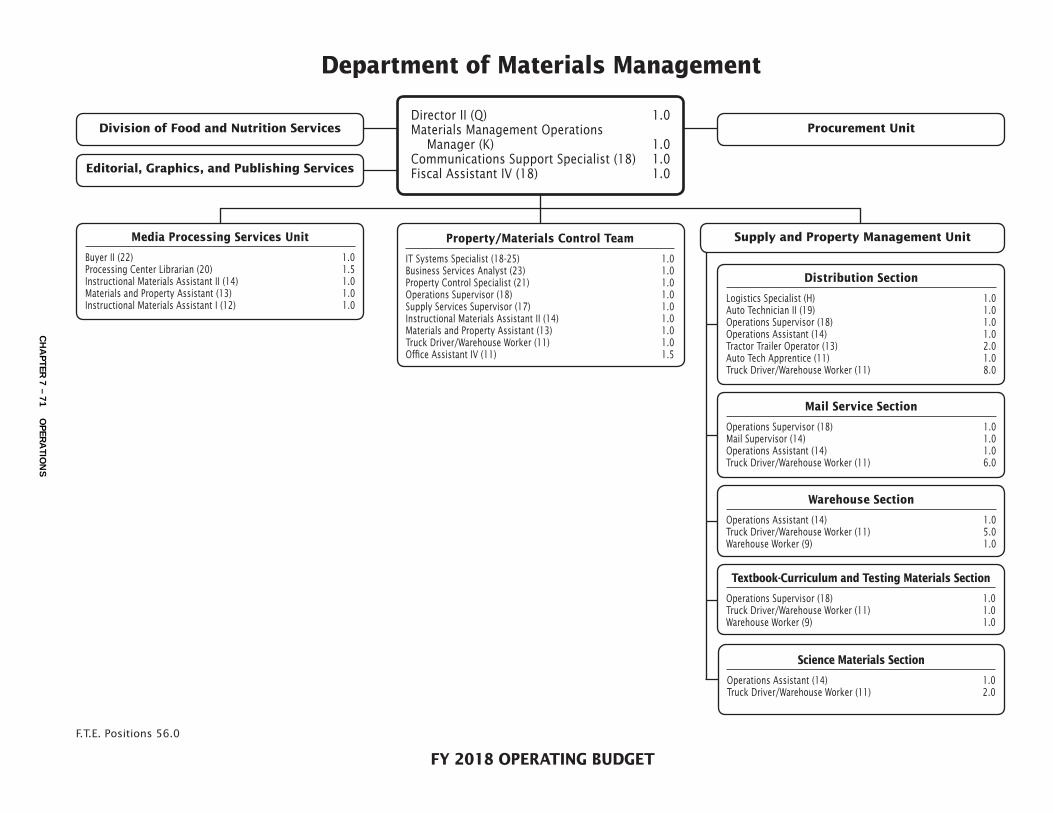
FY 2018 OPERATING BUDGET
Department of Materials Management
F.T.E. Positions 56.0
Division of Food and Nutrition Services
Editorial, Graphics, and Publishing Services
Distribution Section
Logistics Specialist (H) 1.0Auto Technician II (19) 1.0Operations Supervisor (18) 1.0Operations Assistant (14) 1.0Tractor Trailer Operator (13) 2.0Auto Tech Apprentice (11) 1.0 Truck Driver/Warehouse Worker (11) 8.0
Textbook-Curriculum and Testing Materials Section
Operations Supervisor (18) 1.0Truck Driver/Warehouse Worker (11) 1.0Warehouse Worker (9) 1.0
Science Materials Section
Operations Assistant (14) 1.0Truck Driver/Warehouse Worker (11) 2.0
Warehouse Section
Operations Assistant (14) 1.0Truck Driver/Warehouse Worker (11) 5.0Warehouse Worker (9) 1.0
Mail Service Section
Operations Supervisor (18) 1.0Mail Supervisor (14) 1.0Operations Assistant (14) 1.0Truck Driver/Warehouse Worker (11) 6.0
Media Processing Services Unit
Buyer II (22) 1.0Processing Center Librarian (20) 1.5Instructional Materials Assistant II (14) 1.0 Materials and Property Assistant (13) 1.0Instructional Materials Assistant I (12) 1.0
Director II (Q) 1.0Materials Management Operations
Manager (K) 1.0Communications Support Specialist (18) 1.0Fiscal Assistant IV (18) 1.0
Supply and Property Management UnitProperty/Materials Control Team
IT Systems Specialist (18-25) 1.0Business Services Analyst (23) 1.0Property Control Specialist (21) 1.0Operations Supervisor (18) 1.0Supply Services Supervisor (17) 1.0Instructional Materials Assistant II (14) 1.0 Materials and Property Assistant (13) 1.0Truck Driver/Warehouse Worker (11) 1.0Office Assistant IV (11) 1.5
Procurement Unit
CH
AP
TER 7 – 71 O
PER
ATIO
NS

Department of Materials Management - 351/352/354/355
Actual FY 2017Budget
FY 2017Current
FY 2018Request
FY 2018
Summer EmploymentProfessional Substitutes
Total Positions (FTE)Position Salaries
58.000$3,511,286
57.000$3,940,660
57.000$3,940,660
56.000$3,876,408
Other Salaries
01 Salaries & Wages
StipendsProfessional Part Time
ConsultantsOther Contractual
OfficeOther Supplies & Materials
MediaInstructional Supplies & Materials
Textbooks
Subtotal Other Salaries
Leased Equipment
Grand Total
Other Equipment
Total Salaries & Wages
02 Contractual Services
Total Contractual Services
03 Supplies & Materials
Total Supplies & Materials
04 Other
Total Other
05 Equipment
Total Equipment
Supporting Services Part TimeOther
446,506 446,506 446,506210,785
98,794
63,922
63,922
63,922
63,922
85,917
85,917 21,995
21,995
336,676
32,8602,668
382,732
418,260
32,8602,668
382,732
418,260
32,8602,668
405,996
441,524
23,264
23,264
4,181,872 4,597,951 4,597,951 4,533,699 (64,252)
210,785 210,785
670,586 657,291 657,291 657,291
$5,544,626
688,812
36,488
$6,013,971
707,091
743,579
36,488707,091
743,579
$6,013,971
91,393612,697
704,090
$5,955,489
(39,489)
54,905(94,394)
($58,482)
ChangeDescription FY 2016
(1.000)($64,252)
Insur & Employee BenefitsUtilitiesMiscellaneous
238,472
188,629
190,259
188,629
190,259
188,629
190,259
Local/Other Travel 1,630 1,630 1,630
CHAPTER 7 – 72 OPERATIONS

DESCRIPTION CURRENTFYBUDGET
FYACTUAL
20172016 10Mon
FY 2017CAT CHANGE
2018FY
Department of Materials Management - 351/352/354/355
REQUEST
2018FY
351 Department of Materials Management
1 1.000 1.000 1.000Director IIQ 1.000
1 1.000 1.000 1.000Materials Mgt Oper MgrK 1.000
1 Fiscal Assistant IV18 1.0001.000
1 1.000 1.000 1.000Communications Support Spec18 1.000
1 1.000 1.000 1.000Administrative Secretary III16 (1.000)
4.000 4.000 4.000Subtotal 4.000
352 Supply and Property Management Unit
10 1.000 1.000 1.000Logistics SpecialistH 1.000
10 1.000 1.000 1.000IT Systems Specialist25 1.000
10 1.000 1.000 1.000Business Services Analyst23 1.000
10 1.000 1.000 1.000Property Control Specialist21 1.000
10 1.000 1.000 1.000Auto Technican II Shift 119 1.000
10 4.000 4.000 4.000Operations Supervisor18 4.000
10 1.000 1.000 1.000Supply Services Supervisor17 1.000
10 1.000 1.000 1.000Mail Supervisor14 1.000
10 4.000 4.000 4.000Operations Assistant14 4.000
10 1.000 1.000 1.000Instruct Materials Asst II14 1.000
10 3.000 3.000 3.000Tractor Trailer Operator13 (1.000)2.000
10 1.000 1.000 1.000Materials & Property Asst13 1.000
10 1.500 1.500 1.500Office Assistant IV11 1.500
10 1.000 1.000Auto Tech Apprentice Shift 111 1.000
10 23.000 23.000 23.000Truck Drive/Whr Wkr Shift 111 23.000
10 2.000 2.000 2.000Warehouse Worker9 2.000
10 1.000Auto Service Worker Shift 18
47.500 47.500 47.500Subtotal (1.000)46.500
354 Media Processing Services Unit
2 1.000 1.000 1.000Buyer II22 1.000
2 1.500 1.500 1.500Processing Center Librarian20 1.500
2 1.000 1.000 1.000Instruct Materials Asst II14 1.000
2 1.000 1.000 1.000Materials & Property Asst13 1.000
2 2.000 1.000 1.000Instruct Materials Asst I12 1.000
6.500 5.500 5.500Subtotal 5.500
57.00058.000 57.000Total Positions (1.000)56.000
CHAPTER 7 – 73 OPERATIONS

FY 2018 OPERATING BUDGET
Editorial, Graphics, and Publishing Services
Supervisor (O) 1.0Printing Supervisor (H) 1.0Publications Supervisor (G) 2.0Publications Art Director (23) 1.0Communications Specialist/Web Producer (21) 1.0Electronic Graphic Artist (20) 1.0Graphic Designer I (18) 2.0Printing Equipment Operator IV (18) 2.0Equipment Mechanic (17) 1.0Customer Service Specialist (16) 2.0Printing Equipment Operator III (16) 2.0Copier Repair Technician (15) 5.0Administrative Secretary I (14) 1.0Printing Equipment Operator II (14) 5.5Printing Equipment Operator I (11) 6.0
F.T.E. Positions 33.5
CH
AP
TER 7 – 74 O
PER
ATIO
NS

Editorial, Graphics, and Publishing Services - 417
Actual FY 2017Budget
FY 2017Current
FY 2018Request
FY 2018
Summer EmploymentProfessional Substitutes
Total Positions (FTE)Position Salaries
34.500$2,283,637
33.500$2,292,880
33.500$2,292,880
33.500$2,292,880
Other Salaries
01 Salaries & Wages
Stipends 187,632 187,632 187,632Professional Part Time
ConsultantsOther Contractual
OfficeOther Supplies & Materials
MediaInstructional Supplies & Materials
Textbooks
Subtotal Other Salaries
Leased Equipment
Grand Total
Other Equipment
Total Salaries & Wages
02 Contractual Services
Total Contractual Services
03 Supplies & Materials
Total Supplies & Materials
04 Other
Total Other
05 Equipment
Total Equipment
Supporting Services Part TimeOther
55,298 55,298 55,29838,523
427,560
430,078
430,078
430,078
430,078
430,078
430,078
1,508,523
915,237
559,250
1,474,487
915,237
559,250
1,474,487
1,395,237
559,250
1,954,487
480,000
480,000
2,524,309 2,574,333 2,574,333 2,574,333
38,523 38,523
240,672 281,453 281,453 281,453
$4,692,461
220,798
$4,719,531
231,530
231,530
231,530
231,530
$4,719,531
231,530
231,530
$5,199,531 $480,000
ChangeDescription FY 2016
Insur & Employee BenefitsUtilitiesMiscellaneous
11,271
8,633
9,103
8,633
9,103
8,633
9,103
Local/Other Travel 470 470 470
CHAPTER 7 – 75 OPERATIONS

DESCRIPTION CURRENTFYBUDGET
FYACTUAL
20172016 10Mon
FY 2017CAT
Editorial, Graphics, and Publishing Services - 417
FY 2018CHANGE
FY 2018
REQUEST
1 1.000 1.000 1.000SupervisorO 1.000
10 1.000 1.000 1.000Printing SupervisorH 1.000
1 1.000 1.000 1.000Publications SupervisorG 1.000
10 1.000 1.000 1.000Publications SupervisorG 1.000
1 1.000 1.000 1.000Publications Art Director23 1.000
1 1.000 1.000 1.000Comm Spec/Web Producer21 1.000
1 1.000 1.000 1.000Electronics Graph Artist20 1.000
1 2.000 2.000 2.000Graphics Designer I18 2.000
10 2.000 2.000 2.000Printing Equipment Operator IV18 2.000
10 1.000 1.000 1.000Equipment Mechanic17 1.000
1 2.000 2.000 2.000Customer Service Spec16 2.000
10 2.000 2.000 2.000Printing Equip Operator III16 2.000
10 5.000 5.000 5.000Copier Repair Technician15 5.000
1 1.000 1.000 1.000Administrative Secretary I14 1.000
10 5.500 5.500 5.500Printing Equip Operator II14 5.500
10 7.000 6.000 6.000Printing Equip Operator I11 6.000
33.50034.500 33.500Total Positions 33.500
CHAPTER 7 – 76 OPERATIONS

FY 2018 OPERATING BUDGET
Procurement Unit
F.T.E. Positions 11.0
Team Leader (M) 1.0Business Services Analyst (23) 1.0Buyer II (22) 2.0Buyer I (18) 3.0Materials Support Specialist (16) 1.0Buyer Assistant II (14) 3.0
CH
AP
TER 7 – 77 O
PER
ATIO
NS
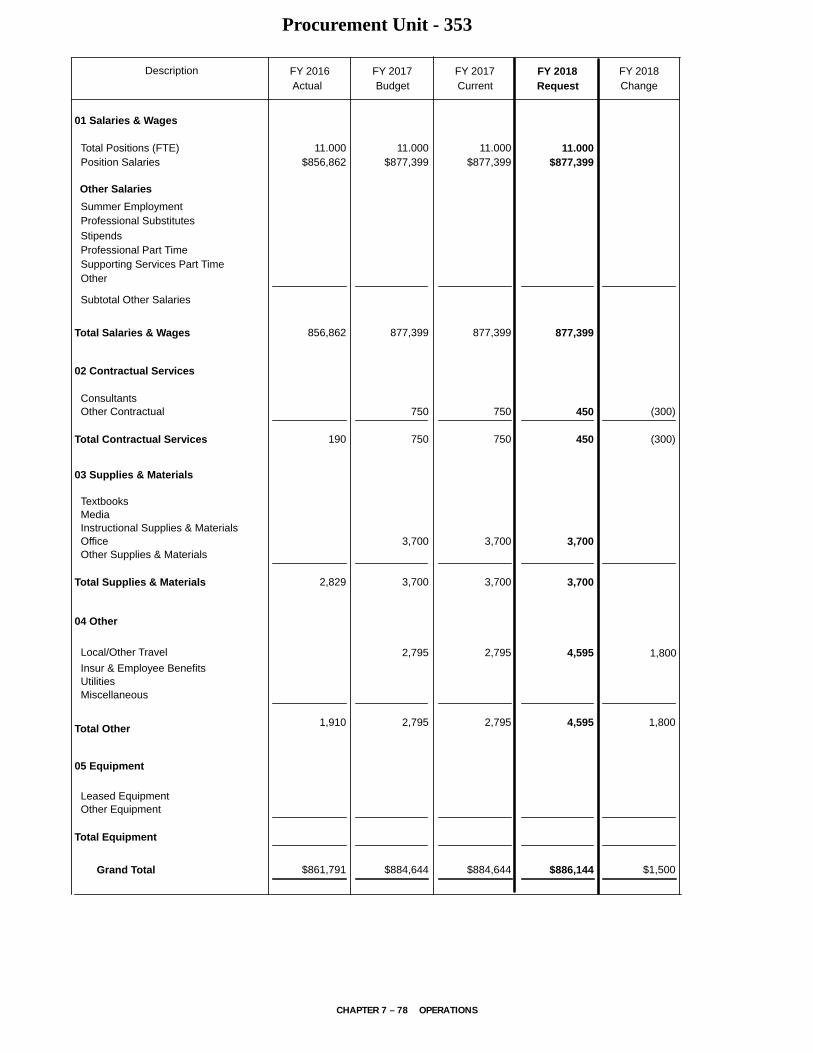
Procurement Unit - 353
Actual FY 2017Budget
FY 2017Current
FY 2018Request
FY 2018
Summer EmploymentProfessional Substitutes
Total Positions (FTE)Position Salaries
11.000$856,862
11.000$877,399
11.000$877,399
11.000$877,399
Other Salaries
01 Salaries & Wages
StipendsProfessional Part Time
ConsultantsOther Contractual
OfficeOther Supplies & Materials
MediaInstructional Supplies & Materials
Textbooks
Subtotal Other Salaries
Leased Equipment
Grand Total
Other Equipment
Total Salaries & Wages
02 Contractual Services
Total Contractual Services
03 Supplies & Materials
Total Supplies & Materials
04 Other
Total Other
05 Equipment
Total Equipment
Supporting Services Part TimeOther
190
750
750
750
750
450
450 (300)
(300)
2,829
3,700
3,700
3,700
3,700
3,700
3,700
856,862 877,399 877,399 877,399
$861,791 $884,644 $884,644 $886,144 $1,500
ChangeDescription FY 2016
Insur & Employee BenefitsUtilitiesMiscellaneous
1,910 2,795 2,795 4,595 1,800
Local/Other Travel 2,795 2,795 4,595 1,8002 325 1 800 1 800
CHAPTER 7 – 78 OPERATIONS

DESCRIPTION CURRENTFYBUDGET
FYACTUAL
20172016 10Mon
FY 2017CAT
Procurement Unit - 353
FY 2018CHANGE
FY 2018
REQUEST
1 1.000 1.000 1.000Team LeaderM 1.000
1 1.000 1.000 1.000Business Services Analyst23 1.000
1 2.000 2.000 2.000Buyer II22 2.000
1 3.000 3.000 3.000Buyer I18 3.000
1 1.000 1.000 1.000Materials Support Specialist16 1.000
1 2.000 2.000 2.000Buyer Assistant II14 1.0003.000
1 1.000 1.000 1.000Buyer Assistant I12 (1.000)
11.00011.000 11.000Total Positions 11.000
CHAPTER 7 – 79 OPERATIONS

FY 2018 OPERATING BUDGET
Division of Food and Nutrition Services
Director I (P) 1.0Assistant Director (N) 1.0Wellness Specialist (23) 1.0Administrative Secretary II (15) 1.0
Operations/Monitoring
Food Services Supervisor II (H) 1.0Food Services Supervisor I (G) 6.0Food Service Field Manager (17) 6.0Family Day Care Manager (16) 1.0Data Systems Operator (13) 2.0Family Day Care Assistant (12) 1.0 Office Assistant IV (11) 2.0
Production
CPF/Warehouse Operations Specialist (J) 1.0
Food Services Supervisor II (H) 1.0Mechanical Systems
Technician (19) 1.0Cafeteria Manager V—CPF (16) 3.0Food Services Special
Program Manager (16) 2.0CPF Mechanic (15) 1.0CPF Worker II (9) 1.0Catering Service Worker (6) 2.0CPF Worker I (6) 42.5Food Service Sanitation
Technician—CPF (6) 1.0
Fiscal Control
Fiscal Specialist I (24) 1.0Account Technician II (19) 1.0Account Payable Assistant (14) 1.0
Warehousing and Distribution
Logistics Specialist (H) 1.0Auto Technician II (19) 1.0Graphic Designer I (18) 1.0Operations Supervisor (18) 2.0Auto Technician I (17) 1.0Operations Assistant (14) 2.0Operations Assistant (14/ND) 1.0Auto Tech Apprentice (11) 1.0Office Assistant IV (11) 2.0Truck Driver/Warehouse
Worker (11) 25.0Truck Driver/Warehouse
Worker (11/ND) 3.0Warehouse Worker (9) 9.0
Schools
Cafeteria Manager IV (16) 41.439Cafeteria Manager III (15) 18.688Cafeteria Manager II (14) 9.624Cafeteria Manager I (13) 4.313Food Services Satellite
Manager III (12) 47.251Food Services Satellite
Manager II (11) 25.476Food Services Satellite
Manager I (10) 36.920Cafeteria Perm Substitute (7) 21.5Cafeteria Worker I (6) 253.612
Technical Services
Supervisor (K) 1.0IT Systems Specialist (18–25) 1.0IT Systems Technician (18) 1.0Food Service Field
Manager (17) 1.0
F.T.E. Positions 593.323
(The 458.823 positions in schools also are shown on K–12 charts in Chapter 1)
ND Night Differential = Shift 3
CH
AP
TER 7 – 80 O
PER
ATIO
NS

Division of Food and Nutrition Services - 810/811/812/813/814/815
Actual FY 2017Budget
FY 2017Current
FY 2018Request
FY 2018
Summer EmploymentProfessional Substitutes
Total Positions (FTE)Position Salaries
585.448$19,697,132
588.323$21,938,463
588.323$21,938,463
593.323$21,534,874
Other Salaries
01 Salaries & Wages
StipendsProfessional Part Time
ConsultantsOther Contractual
OfficeOther Supplies & Materials
MediaInstructional Supplies & Materials
Textbooks
Subtotal Other Salaries
Leased Equipment
Grand Total
Other Equipment
Total Salaries & Wages
02 Contractual Services
Total Contractual Services
03 Supplies & Materials
Total Supplies & Materials
04 Other
Total Other
05 Equipment
Total Equipment
Supporting Services Part TimeOther
467,750 467,750 527,750240,084 (25,000)
60,000
1,551,643
1,472,313
1,472,313
1,472,313
1,472,313
1,472,313
1,472,313
20,616,782
17,345,497
17,345,497
17,345,497
17,345,497
17,945,497
17,945,497
600,000
600,000
20,648,047 22,671,297 22,671,297 22,302,708 (368,589)
265,084 265,084
950,915 732,834 732,834 767,834 35,000
$54,979,926
469,967
35,800
$53,967,269
298,268
334,068
35,800298,268
334,068
$53,967,269
85,800322,268
408,068
$54,302,680
74,000
50,00024,000
$335,411
ChangeDescription FY 2016
5.000($403,589)
Insur & Employee BenefitsUtilitiesMiscellaneous
11,693,487
11,876,995
185,202
12,144,094
11,876,995
185,202
12,144,094
11,906,995
185,202
12,174,094
30,000
30,000
Local/Other Travel 81,897 81,897 81,897
CHAPTER 7 – 81 OPERATIONS

DESCRIPTION CURRENTFYBUDGET
FYACTUAL
20172016 10Mon
FY 2017CAT
Division of Food and Nutrition Services - 810/811/812/813/814/815
FY 2018CHANGE
FY 2018
REQUEST
61 1.000 1.000 1.000Director IP 1.000
61 1.000 1.000 1.000Assistant Director IN 1.000
61 1.000 1.000 1.000SupervisorK 1.000
61 1.000 1.000 1.000CPF/Warehouse Operations SpecJ 1.000
61 2.000 2.000 2.000Food Services Supervisor IIH 2.000
61 1.000 1.000 1.000Logistics SpecialistH 1.000
61 6.000 6.000 6.000Food Services Supervisor IG 6.000
61 1.000 1.000 1.000IT Systems Specialist25 1.000
61 1.000 1.000 1.000Fiscal Specialist I24 1.000
61 1.000 1.000 1.000Wellness Specialist23 1.000
61 1.000 1.000 1.000Account Technician II19 1.000
61 1.000 1.000 1.000Auto Technican II Shift 119 1.000
61 1.000 1.000 1.000Mechanical Systems Tech Shft 119 1.000
61 1.000 1.000 1.000IT Systems Technician18 1.000
61 1.000 1.000 1.000Graphics Designer I18 1.000
61 2.000 2.000 2.000Operations Supervisor18 2.000
61 6.000 6.000 6.000Food Service Field Manager17 6.000
61 1.000 1.000 1.000Food Svcs Field Manager 12 mo17 1.000
61 1.000 1.000Auto Technican I Shift 117 1.000
61 35.314 36.439 36.439XCafeteria Manager IV16 5.00041.439
61 2.000 2.000 2.000Food Svcs Spec Prog Mgr16 2.000
61 1.000CPF Manager V16 61 2.000 3.000 3.000CPF Manager V16 3.000
61 1.000 1.000 1.000Family Day Care Manager16 1.000
61 1.000 1.000 1.000Administrative Secretary II15 1.000
61 18.813 17.688 17.688XCafeteria Manager III15 1.00018.688
61 1.000 1.000 1.000CPF Mechanic15 1.000
61 1.000 1.000 1.000Accounts Payable Assistant14 1.000
61 7.749 7.749 7.749XCafeteria Manager II14 7.749
61 3.875 3.875 3.875Cafeteria Manager II 9 mo14 (2.000)1.875
61 2.000 2.000 2.000Operations Assistant14 2.000
61 1.000 1.000 1.000Operations Assist Shift 314 1.000
61 2.000 2.000 2.000Data Systems Operator13 2.000
61 5.438 6.313 6.313XCafeteria Manager I13 (2.000)4.313
61 47.376 48.251 48.251Food Svcs Satellite Mgr III12 (1.000)47.251
61 1.000 1.000 1.000Family Day Care Assistant12 1.000
61 3.000 3.000 3.000Office Assistant IV11 1.0004.000
61 1.000 1.000 1.000XOffice Assistant IV CPF11 (1.000)61 28.601 25.476 25.476Food Svcs Satellite Mgr II11 25.476
61 1.000 1.000 1.000Auto Tech Apprentice Shift 111 1.000
61 8.000 8.000 8.000Truck Drive/Whr Wkr Shift 111 8.000
61 17.000 17.000 17.000Truck Drive/Whr Wkr Shift 111 17.000
61 4.000 3.000 3.000Truck Drive/Wrh Wkr Shift 311 3.000
CHAPTER 7 – 82 OPERATIONS

DESCRIPTION CURRENTFYBUDGET
FYACTUAL
20172016 10Mon
FY 2017CAT
Division of Food and Nutrition Services - 810/811/812/813/814/815
FY 2018CHANGE
FY 2018
REQUEST
61 34.670 36.920 36.920Food Svcs Satellite Mgr I10 36.920
61 6.000 6.000 6.000XWarehouse Worker9 6.000
61 2.000 2.000 2.000Warehouse Worker9 1.0003.000
61 4.000 1.000 1.000XCPF Worker II9 1.000
61 21.500 21.500 21.500Cafeteria Perm Substitute7 21.500
61 67.477 67.477 67.477Cafeteria Worker I 9 mo6 (65.477)2.000
61 178.135 183.135 183.135XCafeteria Worker I6 68.477251.612
61 42.500 42.500 42.500XCPF Worker I6 42.500
61 2.000 2.000 2.000XCatering Services Worker6 2.000
61 1.000 1.000 1.000Food Svc Sanit Tech CPF6 1.000
588.323585.448 588.323Total Positions 593.323 5.000
CHAPTER 7 – 83 OPERATIONS

Department of School Safety and Security337
M I S S I O N The mission of the
Department of School Safety and Security
(DSSS) is to promote a safe and secure
learning and working environment for
students and staff.
MAJOR FUNCTIONSComprehensive School System Emergency Preparedness
DSSS staff members design, develop, and conduct safety and security training programs for all security staff, school-based administrators, and all other school and facility-based staff. DSSS is responsible for devel-oping overall school system emergency response pro-tocols and working in partnership with public safety agencies to mitigate emergency scenarios that affect the school system. Staff provides security support and per-forms security assessments for all existing schools and facilities. Staff investigates and recommends corrective action regarding serious security issues and responds to critical incidents that occur in schools and facili-ties. DSSS staff reviews and assesses the readiness of all staff to react in emergency situations and develops lesson-learned summaries for review with Montgom-ery County Public Schools (MCPS) stakeholders and public safety partners. Assessment data is used to make sure that schools are prepared to manage any type of emergency. Ensuring a safe and secure environment for students and staff to teach and learn contributes to academic success and operational excellence. DSSS supports community partnerships through provid-ing after-hours security for community use of schools. During the current fiscal year, DSSS will analyze data to develop strategies to obtain 100 percent compliance with all schools and facilities to complete the minimum number of emergency preparedness and fire drills.
School Security Program Infrastructure Development and Management
DSSS staff members facilitate the design and installa-tion of all security systems. These systems include, but are not limited to, access control systems, visitor man-agement systems, and digital surveillance systems. Staff works with selected security contractors and MCPS technology staff to survey and study all new security technology. DSSS staff members perform site evalu-ations and review construction plans for safety and security concerns in new and modernization construc-tion projects. Maintenance records are reviewed to help
determine failure and replacement rates. DSSS works with the Office of the Chief Technology Officer and the Department of Facilities Management to identify and assess new security and innovative security systems.
Staffing Management The director and his designee are responsible for assist-ing in the development of security position job descrip-tions and professional expectations. Staff coordinates with the Office of Human Resources and Development staffing analyst to review all prospective employee applications for highly effective and diverse candidates committed to the values of MCPS. Training is conducted that identifies priorities and learning expectations. DSSS staff work with school-based security staff to improve their skills and capabilities and to help build a positive and supportive culture of trust and respect among all students and staff. The department will analyze recruit-ing, hiring, training, promotion, and retention data to ensure that all security staff understand their role in sup-porting academic excellence for all students.
24-Hour Facility and Property SecurityThe DSSS Electronic Detection Section monitors perim-eter intrusion, motion detectors, glass breakage, refrig-eration, boiler, and power outage alarms at all MCPS schools and facilities after hours and on weekends and holidays. DSSS patrollers respond to schools and facili-ties for reports of alarms, burglaries, vandalism, suspi-cious individuals, trespassers, and various other calls for service. This section aligns work across central services by working closely with the divisions of Maintenance and School Plant Operations to ensure that any build-ing service staff set all alarms properly, that damaged or inoperable alarm sensors are repaired or replaced, and that any damage to schools can be corrected in a timely way. The department will work with the Division of School Plant Operations to develop and deliver training on the proper procedures for setting alarms and secur-ing the building at night and on weekends.
CHAPTER 7 – 84 OPERATIONS

Department of School Safety and Security337
MEASURESM E A S U R E : Percentage of schools and facilities that successfully complete the minimum required number of emergency preparedness drills and fire drills.
FY 2016Actual
FY 2017Estimate
FY 2018Recommended
95% 97% 100%
E X P L A N A T I O N : Department cluster security coordinators coordinate with administrators and facilitate the completion of six scenario-based emergency preparedness drills and 10 fire drills at all schools each school year.
M E A S U R E : Percentage of school-based on-site emer-gency team (OSET) members that receive formal emer-gency preparedness training and have the awareness and knowledge of MCPS emergency procedures.
FY 2016Actual
FY 2017Estimate
FY 2018Recommended
80% 95% 100%
E X P L A N A T I O N : Percentage of OSET staff members who completed the training and are knowledgeable about MCPS emergency procedures. Percentages take into account annual turnover of school-based staff.
M E A S U R E : Number of alarms patrollers responded to at schools and facilities
FY 2016Actual
FY 2017Estimate
FY 2018Recommended
4,773 7,500 3,000
E X P L A N A T I O N : Through analysis of data, alarm signals can be significantly reduced through proper procedures for securing the buildings and setting the alarm pads. In FY 2016 there were a total of 4,773 alarms received at schools and facilities. In the first 3 1/2 months of FY 2017 there were 3,099 alarm signals received. Through training and supervision of night building service workers, these numbers should drop substantially.
OVERVIEW OF BUDGET CHANGES
FY 2018 RECOMMENDED BUDGET
The FY 2018 recommended budget for this
department is $1,986,450, an increase of $110,889
over the current FY 2017 budget. An explanation of
this change follows.
Same Service Level Changes—$0Realignments to Meet Expenditure Requirements and Program Priorities—$0 Realignments are budgeted to address priority spend-ing needs in this department. There is a realignment of a 1.0 security patroller shift II position to create a 1.0 secu-rity patroller shift III position.
Strategic Accelerator—$110,889Focus on Operational Excellence—$110,889The FY 2018 Operating Budget includes an additional $38,837 and a 1.0 secretary position and $42,052 and a 1.0 office security monitor position. In addition, there is an increase of $30,000 for supporting services part-time salaries for security monitoring. These accelera-tors have been added in order to improve the safety and security within the Carver Education Services Center building. This strategic accelerator also includes $36,149 for employee benefits shown in this chapter within the Department of Employee and Retiree Services.
CHAPTER 7 – 85 OPERATIONS

FY 2018 OPERATING BUDGET
Department of School Safety and Security
Electronic Detection
Supervisor (20) 1.0Office Security Monitor (14) 1.0Security Patroller (14/ND) 3.0Security System Monitor (11/ND) 3.0
Field Services
Cluster Security Coordinator (22) 6.0
Schools
Security Team Leader (16) 26.0*Security Assistant (14) 199.0*
Director II (Q) 1.0Supervisor (K) 1.0Administrative Secretary III (16) 1.0Secretary (12) 2.0
F.T.E. Positions 19.0
(*The 225.0 positions in schools also are shown on K–12 charts in Chapter 1 and Office of Special Education and Student Services in Chapter 5)
ND Night Differential = Shifts 2 and 3
CH
AP
TER 7 – 86 O
PER
ATIO
NS

Department of School Safety and Security - 337
Actual FY 2017Budget
FY 2017Current
FY 2018Request
FY 2018
Summer EmploymentProfessional Substitutes
Total Positions (FTE)Position Salaries
19.000$1,455,915
17.000$1,448,807
17.000$1,448,807
19.000$1,529,696
Other Salaries
01 Salaries & Wages
StipendsProfessional Part Time
ConsultantsOther Contractual
OfficeOther Supplies & Materials
MediaInstructional Supplies & Materials
Textbooks
Subtotal Other Salaries
Leased Equipment
Grand Total
Other Equipment
Total Salaries & Wages
02 Contractual Services
Total Contractual Services
03 Supplies & Materials
Total Supplies & Materials
04 Other
Total Other
05 Equipment
Total Equipment
Supporting Services Part TimeOther
135,515 135,515 165,51531,232
30,000
56,027
59,410
59,410
59,410
59,410
59,410
59,410
121,355
3,355143,945
147,300
3,355143,945
147,300
3,355143,945
147,300
1,612,014 1,615,554 1,615,554 1,726,443 110,889
31,232 31,232
156,099 166,747 166,747 196,747 30,000
$1,858,146
68,750
50,000
$1,875,561
50,000
50,000
50,000
$1,875,561
50,000
50,000
$1,986,450 $110,889
ChangeDescription FY 2016
2.000$80,889
Insur & Employee BenefitsUtilitiesMiscellaneous 3,050
3,297
3,050
3,297
3,050
3,297
Local/Other Travel 247 247 2472 600
CHAPTER 7 – 87 OPERATIONS

DESCRIPTION CURRENTFYBUDGET
FYACTUAL
20172016 10Mon
FY 2017CAT
Department of School Safety and Security - 337
FY 2018CHANGE
FY 2018
REQUEST
10 1.000 1.000 1.000Director IIQ 1.000
10 1.000 1.000 1.000SupervisorK 1.000
10 6.000 6.000 6.000Cluster Security Coordinator22 6.000
10 1.000 1.000 1.000Supv Electronic Detection20 1.000
10 1.000 1.000 1.000Administrative Secretary III16 1.000
10 1.000Office Security Monitor14 1.0001.000
10 2.000 2.000 2.000Security Patroller Shift 214 (1.000)1.000
10 2.000 1.000 1.000Security Patroller Shift 314 1.0002.000
10 1.000 1.000 1.000Secretary12 1.0002.000
10 2.000 2.000 2.000Security Sys Monitor Shft 211 2.000
10 1.000 1.000 1.000Security Sys Monitor Shift 311 1.000
17.00019.000 17.000Total Positions 19.000 2.000
CHAPTER 7 – 88 OPERATIONS
Chapter 8
Technology Support and Infrastructure
Technology Support and Infrastructure PAGE
Office of Chief Technology Officer .................................. 8-3
Department of Technology Integration and Support .................................................................... 8-7
Department of Infrastructure and Operations ............ 8-12
Department of Business Information Services ............ 8-19
Department of Learning Management Systems ......... 8-25

11.000
By Object of Expenditure
Summary of Resources
Technology Support and Infrastructure
OBJECT OF EXPENDITURE FY 2016 FY 2017 FY 2017 FY 2018 FY 2018ACTUAL BUDGET CURRENT BUDGET CHANGE
11.00011.000
145.000 145.000 (15.000)150.000
206,311
6,539,809 6,718,067 9,258,925
423,364 422,949
6,718,067
40,255
258,727
216,715
60,577
145,734 176,460 176,460 112,955 (63,505)
40,255 39,746 (509)
216,715 152,701 (64,014)
13,569,268
423,364
14,699,424 14,699,424 13,576,852 (1,122,572)
29,574
2,540,858
38,582
(415)
(12,009)50,591 50,591
3,072,954 2,847,626 2,847,626 2,985,129 137,503
431,894 634,405 634,405 615,000 (19,405)
3,534,422 3,532,622 3,532,622 3,638,711 106,089
677,614 677,614 478,219 (199,395)
$26,051,091 $27,375,656
POSITIONS
Administrative
TOTAL POSITIONS
01 SALARIES & WAGES
Administrative
OTHER SALARIES
Administrative
Professional
Supporting Services
TOTAL OTHER SALARIES
TOTAL SALARIES AND WAGES
02 CONTRACTUAL SERVICES
03 SUPPLIES & MATERIALS
04 OTHER
Local/Other Travel
Insur & Employee Benefits
Utilities
Miscellaneous
TOTAL OTHER
05 EQUIPMENT
GRAND TOTAL AMOUNTS
$1,475,706 $1,574,762 $1,574,762
130.000
TOTAL POSITION DOLLARS 13,362,957 14,482,709 14,482,709 13,424,151 (1,058,558)
$1,588,116 $13,354
$26,051,091 $1,324,565
702,122
$24,604,348
8.000 8.000 8.000
7.000 (13.000)
104.000 (2.000)106.000 106.00020.00020.000Professional
Supporting Services
13.00011.000
20.000106.000
2,408,662 1,474,058
9,437,917
(934,604)
9,575,225 (137,308)2,262,587
8,689,0182,408,662
9,575,225
Professional
Supporting Services
935,646 924,060 924,060 924,060Business/Operations Admin.
Business/Operations Admin.
CHAPTER 8 – 1 TECHNOLOGY SUPPORT AND INFRASTRUCTURE

FY 2018 OPERATING BUDGET
Office of the Chief Technology Officer
F.T.E. Positions 130.0
(In addition, there are 34.5 positions funded by the Capital Budget, and a 0.5 position funded by the Employee Benefits Trust Fund)
Technology Support & Infrastructure—Overview
Office of the Chief Technology Officer
Department of Technology Integration and Support
Department of Infrastructure and
Operations
Department of Business Information
Services
Department of Learning Management Systems
CH
AP
TER 8 – 2 TEC
HN
OLO
GY
SU
PP
OR
T AN
D IN
FRA
STR
UC
TUR
E

Office of the Chief Technology Officer411
M I S S I O N The mission of the Office of the Chief Technology Officer (OCTO) is to provide high-quality technology systems and services essential to the success of every student. The office is committed to excellence in providing technology solutions to support teachers, engage students, and assist in the effective business operations of MCPS. These solutions are reflective of the requirements and priorities of our stakeholders. They are developed following best practices for project management and are implemented with continuous collaboration and communication. The office is dedicated to creating an organizational culture of respect, where individuals are aware of and understand the impact of their behavior and decisions on others and have an awareness, understanding, and tolerance of other interests, viewpoints,
cultures, and backgrounds.
MAJOR FUNCTIONSDepartment of Technology Integration and Support
OCTO leads the selection, integration, training, and support of innovative technologies for our schools and offices to ensure operational excellence and staff productivity.
Department of Infrastructure and Operations OCTO manages the enterprise-wide technical sys-tems, including the Data Center, network connections, e-mail, and telephones to facilitate the implementation of effective, secure, and reliable hardware and software solutions. OCTO also provides technical assistance to schools and offices.
Department of Business Information Services OCTO plans, develops, implements, and supports high-quality business solutions contributing to the transfor-mation of learning environments through the innovative integration of technology across all aspects of the school system.
Department of Learning Management Systems OCTO provisions instructional and information sys-tems that enhance the education of students through the innovative application of technology; facilitates the design of connected systems, processes, and informa-tion; increases the efficiency of the educator; and trans-forms access to information in support of teaching and learning for staff, students, parents/guardians, employee associations, and the community.
OVERVIEW OF BUDGET CHANGES
FY 2018 RECOMMENDED BUDGET
The FY 2018 recommended budget for this office
is $4,762,545, an increase of $118,161 over the
current FY 2017 budget. An explanation of this
change follows.
Same Service Level Changes—$147,632Realignments to Meet Expenditure Requirements and Program Priorities—$137,503 Realignments are budgeted to address priority spend-ing needs within this office. There is a realignment of $137,503 from the Department of Infrastructure and Operations to support Internet and telephone provider fees. The telecommunications budget was increased to support the greater demand for Internet as a result of increased online testing.
Other—$10,129There is a projected rate increase of $7,370 for stream-ing media for Board of Education meetings, and a rate increase of $2,940 for an information technology research and advisory company. Also, there is a soft-ware rate decrease in the amount of $181.
Program Efficiencies and Reductions—($29,471)The FY 2018 recommended budget for this office includes a comprehensive effort to identify potential program efficiencies and reductions. Stakeholders, including community partners and employee union representatives, participated in the program efficiencies and reduction process.
There is a reduction of $19,405 for training support and a reduction of $10,066 for dues, registrations, and fees. The reduction in training support reflects current year spending. In addition, staff within this office will reduce the amount of conferences attended throughout the year in order to reduce the amount of registration expenses and fees.
CHAPTER 8 – 3 TECHNOLOGY SUPPORT AND INFRASTRUCTURE
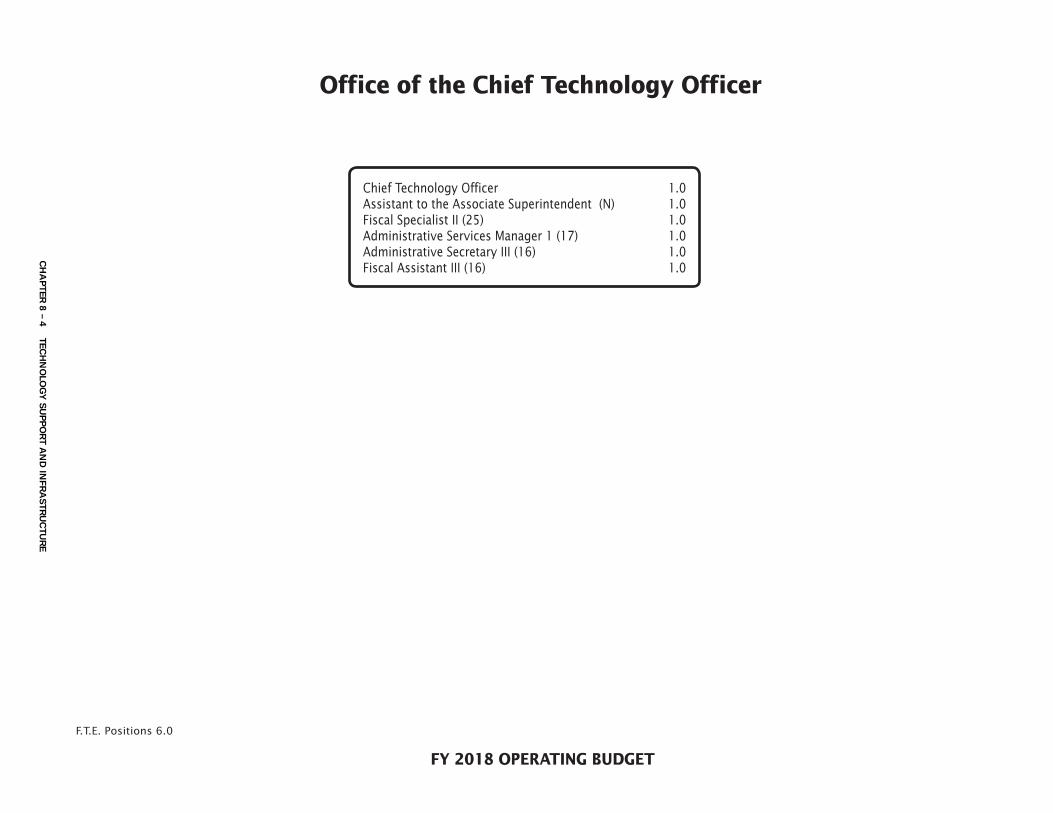
FY 2018 OPERATING BUDGET
F.T.E. Positions 6.0
Office of the Chief Technology OfficerOffice of the Chief Technology Officer
Chief Technology Officer 1.0Assistant to the Associate Superintendent (N) 1.0Fiscal Specialist II (25) 1.0Administrative Services Manager 1 (17) 1.0Administrative Secretary III (16) 1.0Fiscal Assistant III (16) 1.0
CH
AP
TER 8 – 4 TEC
HN
OLO
GY
SU
PP
OR
T AN
D IN
FRA
STR
UC
TUR
E

Office of the Chief Technology Officer - 411
Actual FY 2017Budget
FY 2017Current
FY 2018Request
FY 2018
Summer EmploymentProfessional Substitutes
Total Positions (FTE)Position Salaries
7.000$665,078
6.000$613,407
6.000$613,407
6.000$613,407
Other Salaries
01 Salaries & Wages
StipendsProfessional Part Time
ConsultantsOther Contractual
OfficeOther Supplies & Materials
MediaInstructional Supplies & Materials
Textbooks
Subtotal Other Salaries
Leased Equipment
Grand Total
Other Equipment
Total Salaries & Wages
02 Contractual Services
Total Contractual Services
03 Supplies & Materials
Total Supplies & Materials
04 Other
Total Other
05 Equipment
Total Equipment
Supporting Services Part TimeOther
471,399
471,055
471,055
471,055
471,055
481,365
481,365 10,310
10,310
80,496
10,79951,000
61,799
10,79951,000
61,799
10,79950,819
61,618
(181)
(181)
665,078 613,407 613,407 613,407
$4,724,127 $4,644,384 $4,644,384 $4,762,545 $118,161
ChangeDescription FY 2016
Insur & Employee BenefitsUtilitiesMiscellaneous
3,507,154
2,847,626634,405
3,498,123
2,847,626634,405
3,498,123
2,985,129615,000
3,606,155
137,503(19,405)
108,032
Local/Other Travel 16,092 16,092 6,026 (10,066)110 121 -29 471 (29 471)
CHAPTER 8 – 5 TECHNOLOGY SUPPORT AND INFRASTRUCTURE

DESCRIPTION CURRENTFYBUDGET
FYACTUAL
20172016 10Mon
FY 2017CAT
Office of the Chief Technology Officer - 411
FY 2018CHANGE
FY 2018
REQUEST
1 1.000 1.000 1.000Chief Technology Officer 1.000
1 1.000 1.000 1.000Asst. to Assoc SuptN 1.000
1 1.000 1.000 1.000Fiscal Specialist II25 1.000
1 1.000 1.000 1.000Admin Services Manager I17 1.000
1 1.000 1.000 1.000Administrative Secretary III16 1.000
1 1.000 1.000 1.000Fiscal Assistant III16 1.000
1 1.000Administrative Secretary II15
6.0007.000 6.000Total Positions 6.000
CHAPTER 8 – 6 TECHNOLOGY SUPPORT AND INFRASTRUCTURE

Department of Technology Integration and Support435/424/428/422
M I S S I O N The mission of the
Department of Technology Integration
and Support (DTIS) is to lead the selection,
integration, training, and support of
innovative technologies for our schools and
offices to ensure operational excellence and
staff productivity.
MAJOR FUNCTIONSThe Department of Technology Integration and Sup-port (DTIS) leads the selection, integration, training, and support of innovative technologies for our schools and offices to ensure operational excellence and staff produc-tivity. The work of the department includes the full life-cycle of research, design, procurement, implementation, technical, and implementation training supports. Staff works closely with offices and school leadership to sup-port technology implementation strategies and training. Staff manages the Technology Modernization program, overseeing the planning and implementation of mobile computers (Chromebooks, tablets, and laptops), desktop computers, and interactive whiteboard technology and a wide range of other hardware and software technolo-gies in connection with redefining 21st Century learning spaces to support new uses of technology in classrooms.
Technology Modernization is responsible for research-ing, purchasing, configuring, and supporting instruc-tional technologies. For the past three years, DTIS has led the deployment of more than 100,000 Chromebooks as well as laptops, desktops, and other mobile technolo-gies across classrooms. The deployment of new learn-ing technologies provides equity of access to digital content and resources. It also allows for anywhere, any-time access to learning resources for students and staff. These technologies increase opportunities for learning and directly support the superintendent’s strategic pri-ority for high academic achievement for all students.
Instructional Technology works closely with offices and individual school leadership teams in order to design, develop, and deliver high-quality professional develop-ment on the integration of these learning technologies in teaching and learning and professional offices. In FY 2018, the work of professional learning to integrate technology in offices will be realigned and moved to meet the increased demand for professional learning support. This move requires a new model for profes-sional leaning to support technology integration that
supports offices to reach a broader audience and develop a broader pool of resources to ensure that professional learning can be accessed anytime and anywhere.
Technology Support provides technical support to schools while maintaining the operational readiness of new and existing hardware and software. The School Technology Support (STS) team consists of first- and second-level information technology support specialists (ITSS) who are responsible for ensuring that all technol-ogy works or is entered into a repair or replacement process. DTIS is responsible for network administra-tion—servers, workstations, printer maintenance and repair, and software installation and upgrades. DTIS partners with administrators, teachers, media specialists and central services staff to prepare for distance learn-ing, online testing, and other events requiring technical assistance.
MEASURES M E A S U R E : To increase the percentage of participants’ satisfaction with training outcomes.
FY 2016Actual
FY 2017Estimate
FY 2018Recommended
96% 97% 98%
E X P L A N A T I O N : Percentage of attendees reporting mastery of all stated training session outcomes as indicated on post-training survey (Guskey, Level 2).
M E A S U R E : To increase the percentage of teachers’ integration of technology in teaching and learning at the highest levels of integration.
FY 2016Actual
FY 2017Estimate
FY 2018Recommended
40% 50% 55%
E X P L A N A T I O N : Percentage of classroom observations scoring in the adaptation, infusion, and transformational categories in the Technology Integration Matrix (Guskey, Level 4). These are the highest levels of integration on a relatively new initiative.
M E A S U R E : To increase the percentage of customers who indicate satisfaction with the level of knowledge and service demonstrated by their ITSS.
FY 2016Actual
FY 2017Estimate
FY 2018Recommended
88% 90% 92%
E X P L A N A T I O N : This percentage reflects the level of customer satisfaction with the services provided by the assigned technologist, according to customers who reply to the customer satisfaction survey cards.
CHAPTER 8 – 7 TECHNOLOGY SUPPORT AND INFRASTRUCTURE
Department of Technology Integration and Support435/424/428/422
OVERVIEW OF BUDGET CHANGES
FY 2018 RECOMMENDED BUDGET
The FY 2018 recommended budget for this
department is $2,503,825, a decrease of $1,171,540
from the current FY 2017 budget. An explanation of
this change follows.
Same Service Level Changes—($884,848)Realignments to Meet Expenditure Requirements and Program Priorities—($884,848) Realignments are budgeted to address priority spending needs within this department. There is a realignment of $234 from office supplies to fund increased costs within contractual maintenance.
Realignments are also budgeted to address spending needs for other units within the Office of Technology Support and Infrastructure. There is an increase of $982 for local travel mileage reimbursement for the School Technology Support unit from the Technology Mod-ernization unit, and a decrease of $2,762 for local travel mileage reimbursement for both Technology Modern-ization and the Department of Infrastructure and Opera-tions. In addition, there is a realignment of 9.0 positions and $662,301 from this department to the Department of Business Information Services. Funds from this realign-ment will support needed system upgrades. Finally, there is a realignment of 3.0 positions and $220,767 from this department to Chapter 4, Curriculum and Instruc-tional Programs.
Program Efficiencies and Reductions—($286,692)The FY 2018 recommended budget for this office includes a comprehensive effort to identify potential program efficiencies and reductions. Stakeholders, including community partners and employee union representatives, participated in the program efficiencies and reduction process.
There is a reduction of $63,505 for stipends. Based on prior year actuals, this department is able to recognize the reductions for stipends without any impact to opera-tions. In addition, there is a reduction of a 1.0 coordina-tor position and $105,604, a 1.0 administrative secretary II position and $43,994, and a 1.0 instructional specialist position and $73,589. The responsibilities that would be managed by the coordinator position, the administra-tive secretary position, and the instructional specialist position will be absorbed by other employees within the Department of Technology Integration and Support.
CHAPTER 8 – 8 TECHNOLOGY SUPPORT AND INFRASTRUCTURE

FY 2018 OPERATING BUDGET
Department of Technology Integration and Support
F.T.E. Positions 17.0
(*In addition, there are 27.5 positions funded by the Capital Budget)
Director II (Q) 1.0Administrative Secretary III (16) 1.0
Instructional Technology
Instructional Specialist (B–D) 4.0Instructional Specialist (B–D) 1.0*
Technology Modernization
Supervisor (K) 1.0IT Systems Engineer (27) 1.0IT Systems Engineer (27) 1.0*IT Systems Specialist (18–25) 3.0IT Systems Specialist (18–25) 5.0*Office Assistant III (10) 0.5*
School Technology Support
Supervisor (K) 1.0IT Systems Specialist (18–25) 5.0IT Systems Specialist (18–25) 20.0*
CH
AP
TER 8 – 9 TEC
HN
OLO
GY
SU
PP
OR
T AN
D IN
FRA
STR
UC
TUR
E

Department of Technology Integration and Support - 435/422/424/428
Actual FY 2017Budget
FY 2017Current
FY 2018Request
FY 2018
Summer EmploymentProfessional Substitutes
Total Positions (FTE)Position Salaries
32.000$3,190,471
32.000$3,526,082
32.000$3,526,082
17.000$2,419,827
Other Salaries
01 Salaries & Wages
Stipends 81,600 81,600 18,095 (63,505)Professional Part Time
ConsultantsOther Contractual
OfficeOther Supplies & Materials
MediaInstructional Supplies & Materials
Textbooks
Subtotal Other Salaries
Leased Equipment
Grand Total
Other Equipment
Total Salaries & Wages
02 Contractual Services
Total Contractual Services
03 Supplies & Materials
Total Supplies & Materials
04 Other
Total Other
05 Equipment
Total Equipment
Supporting Services Part TimeOther
7,094
13,900
13,900
13,900
13,900
14,134
14,134 234
234
23,366
10,29215,261
25,553
10,29215,261
25,553
10,05815,261
25,319
(234)
(234)
3,259,610 3,607,682 3,607,682 2,437,922 (1,169,760)
(63,505)
$3,312,799 $3,675,365 $3,675,365 $2,503,825 ($1,171,540)
ChangeDescription FY 2016
(15.000)($1,106,255)
Insur & Employee BenefitsUtilitiesMiscellaneous
22,729 28,230 28,230 26,450 (1,780)
Local/Other Travel 28,230 28,230 26,450 (1,780)
CHAPTER 8 – 10 TECHNOLOGY SUPPORT AND INFRASTRUCTURE
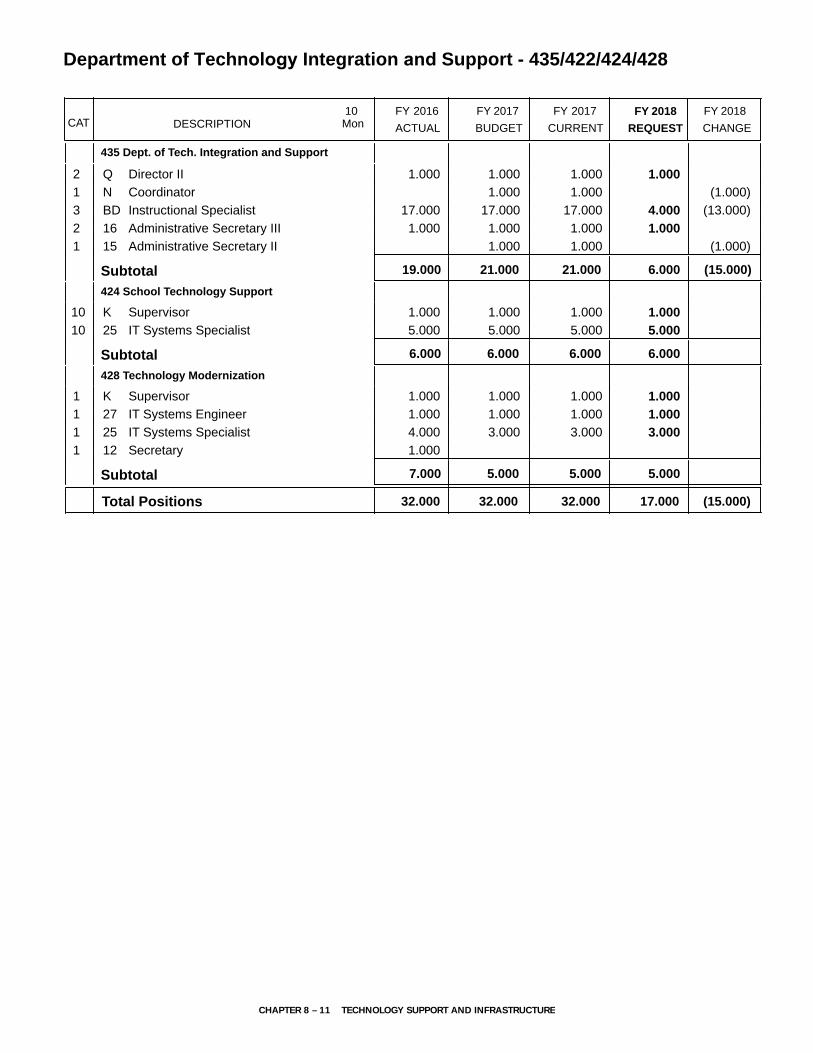
DESCRIPTION CURRENTFYBUDGET
FYACTUAL
20172016 10Mon
FY 2017CAT CHANGE
2018FY
Department of Technology Integration and Support - 435/422/424/428
REQUEST
2018FY
435 Dept. of Tech. Integration and Support
2 1.000 1.000 1.000Director IIQ 1.000
1 1.000 1.000CoordinatorN (1.000)3 17.000 17.000 17.000Instructional SpecialistBD (13.000)4.000
2 1.000 1.000 1.000Administrative Secretary III16 1.000
1 1.000 1.000Administrative Secretary II15 (1.000)
19.000 21.000 21.000Subtotal (15.000)6.000
424 School Technology Support
10 1.000 1.000 1.000SupervisorK 1.000
10 5.000 5.000 5.000IT Systems Specialist25 5.000
6.000 6.000 6.000Subtotal 6.000
428 Technology Modernization
1 1.000 1.000 1.000SupervisorK 1.000
1 1.000 1.000 1.000IT Systems Engineer27 1.000
1 4.000 3.000 3.000IT Systems Specialist25 3.000
1 1.000Secretary12
7.000 5.000 5.000Subtotal 5.000
32.00032.000 32.000Total Positions (15.000)17.000
CHAPTER 8 – 11 TECHNOLOGY SUPPORT AND INFRASTRUCTURE
Department of Infrastructure and Operations446/423/433/434/447/448/451
M I S S I O N The mission of the
Department of Infrastructure and Operations
(DIO) is to manage the enterprise-wide
technical systems, including the data center,
network connections, e-mail, and telephones,
and to facilitate the implementation of
effective, secure, and reliable hardware and
software solutions.
MAJOR FUNCTIONSDatabase Administration
The Database Administration Unit is responsible for cre-ating, maintaining, backing-up, recovering, and moni-toring enterprise databases including:
• Online Administrative Student Information System(OASIS)
• Online student look-up• Period-by-period attendance• Grading and reporting• Financial Management System (payroll and
retirement)• All student and business systems
The focus for this group in FY 2018 is to continue to improve the capacity, performance, and configura-tion of the hardware and database operating systems, while considering ways to expand the accessibility of the data through opportunities in the cloud. This work is underway with the procurement of more powerful server hardware in FY 2016 and FY 2017, as well as the migration of critical databases to improved database operating systems. This work will help to fortify the data infrastructure that will strengthen and support parent and community engagement efforts.
Data CenterThe Data Center operates, monitors, and provides tech-nical support for the MCPS central servers and related equipment. This includes:
• High-speed printers and scanners• 24-hour access to essential student and administrative
databases• 24-hour access to applications including payroll, stu-
dent attendance and enrollment, retirement, asset
management, financial management, report cards, and online materials ordering application systems
• Responsible for maintaining the data center facility
This work supports the nucleus of all of the core tech-nologies that serve as host to nearly all of the MCPS applications and network connections.
Telecommunications Services The Telecommunications Services Unit designs, installs, and supports local- and wide-area networks (LAN/WAN), which include wired and wireless networks in schools and offices.
• Maintains all telephone systems—wired, wireless, andcellular including school and office voice mail sys-tems, data transmission lines, and voice circuits
• Supports converged telephony which combines voice,data, cellular, and video on data circuits
• Researches, plans, expands, and modernizes existingsystems as both technology and location needs evolve
• Monitors and maintains the MCPS WAN• Monitors the connection to the Internet and county
government, the security firewall, and the intrusiondetection/prevention equipment
• Reviews telecommunication invoices
Throughout FY 2016 and FY 2017, staff and students have experienced one of the greatest shifts in modern communications technology through the emergence of cloud-based computing. Among this group’s most criti-cal work is ensuring proper capacity and accessibility for the thousands of MCPS and personal devices that depend on that for daily communication. In anticipation of this change, additional Internet capacity was added in both FY 2016 and FY 2017. Performance also was enhanced in FY 2017 with the introduction of caching devices which will store frequently-accessed web con-tent locally for faster access.
Network Security The Network Security Unit is responsible for the Inter-net protection systems required by the Children’s Inter-net Protection Act and Protecting Children in the 21st Century Act.
• Monitors and investigates all violations of MCPS Reg-ulation IGT-RA
• Processes all legal eDiscovery requests• Responsible for the business continuity of the Data
Center functions and maintains an off-site recoverylocation
• Maintains the E-Rate Program funded under the Tele-communications Act of 1996
CHAPTER 8 – 12 TECHNOLOGY SUPPORT AND INFRASTRUCTURE

Department of Infrastructure and Operations446/423/433/434/447/448/451
Cloud computing and an increased reliability on Inter-net resources not only enhances the access to those resources for MCPS staff and students, but it also increases the risks associated with network security. Major work has been underway since FY 2016 to phase-in improved network security technologies, includ-ing enhanced Internet-content filtering and systems to detect and prevent malicious attacks on our network, systems, and associated applications and data. The focus for FY 2018 will be to continue to improve the sophistica-tion and configuration of these technologies to keep up with our dependency on the Internet.
In addition to working to prevent attacks, a major focus for FY 2018 will be to reduce the amount of time it takes to stay connected to critical functions and services in the event of a major outage of critical systems. This work began in FY 2016 with the enhancement of our offsite systems and capacity.
Enterprise Systems Administration The Enterprise Systems Administration Unit designs systems architecture for new or upgraded applications and installs, manages, and supports enterprise servers that house the technology systems used by staff and stu-dents as well as parents/guardians.
• Responsible for the efficient operation of systems aswell as preventive security measures
• Responsible for systemwide user account manage-ment for the network and all application systems
• Manages the operation of the MCPS e-mail systemand system upgrades
• Responsible for the operation and maintenance ofStorage Area Networks
• Responsible for researching emerging industry trends and standards, and recommending enhancements tosystems
• Manage Enterprise-wide data backup solutions anddisaster recovery Technology Support
The focus for this team in FY 2018 will be to continue to improve access to MCPS systems and applications through cloud-hosted directory services and iden-tity management. This work began in FY 2016 with an upgrade of our identity management system for all MCPS users and continued in FY 2017 with the imple-mentation of a dedicated system for staff. The second system allows for unique management of each of the students and staff, which in turn provides for faster pro-cessing of changes and updates for those units.
Help DeskThe Help Desk supports a wide range of technology infrastructure, hardware, and more than 100 enterprise-wide and school- and office-based applications. Staff will:
• Attend ongoing training to prepare them to resolvebasic network issues, support new application inqui-ries, and respond to software questions
• Attend operation and application training to ensurethat the most current information available is sharedwith MCPS staff
• Research and collaborate with other technologistsin order to post useful information and timely solu-tions to frequently asked questions on the Help Deskwebsite
• Collaborate with appropriate staff and departmentsto create support plans for all MCPS enterpriseapplications.
The focus for FY 2018 will be the implementation of a new trouble-ticketing system to allow for more conve-nient access to Help Desk resources for staff, as well as improved reporting to increase the response time for enterprise trends. This work began in FY 2017 with the implementation of a major update of hardware and version of the current trouble-ticketing software. It is through this work that we expect a significant improve-ment in the metric for the number of tickets resolved by the Help Desk within two hours.
Technical Services and SupportThe Technical Services and Support team is responsible for computer software and hardware support in non-school-based offices.
• Maintains the closed-circuit security camera systemsand access control systems
• Provides integration services, application deploy-ment, network administration, computer image sup-port, and on-site equipment repair and upgrades
• Maintains a parts database and inventory for bothwarranty and non-warranty maintenance of sup-ported equipment
• Provides technical support for computers and multi-media equipment
• Provides warranty repair of equipment purchasedfrom the AV bid list
• Collaborate with the Procurement Unit and MCPSTelevision staff in reviewing and making recommen-dations on all multimedia equipment
CHAPTER 8 – 13 TECHNOLOGY SUPPORT AND INFRASTRUCTURE

Department of Infrastructure and Operations446/423/433/434/447/448/451
MEASURES M E A S U R E : Percentage of uptime for the WAN.
FY 2016Actual
FY 2017Estimate
FY 2018Recommended
99.95% 99.98% 99.99%
E X P L A N A T I O N : This is a measure of availability of switches, routers, and vendor-supplied lines that provide access to schools, offices, and the ISP connection.
M E A S U R E : Percentage of uptime for e-mail system.
FY 2016Actual
FY 2017Estimate
FY 2018Recommended
99.9% 99.0% 99.9%
E X P L A N A T I O N : This measure indicates the amount of time e-mail is available to end users, other than regularly scheduled maintenance hours.
M E A S U R E : Percentage of phone requests both opened and closed by the Help Desk staff on first customer con-tact (as measured by closure in USD issue tracking sys-tem within two hours).
FY 2016Actual
FY 2017Estimate
FY 2018Recommended
84% 85% 90%
E X P L A N A T I O N : This measure is an indication of the timeliness of problem resolution by Help Desk staff within the service level agreement.
M E A S U R E : Percentage of emergency tickets closed within 48 hours for non-school-based offices.
FY 2016Actual
FY 2017Estimate
FY 2018Recommended
80% 84% 91%
E X P L A N A T I O N : This measure reflects the number of tickets closed within 48 hours from opening.
OVERVIEW OF BUDGET CHANGES
FY 2018 RECOMMENDED BUDGET
The FY 2018 recommended budget for this office
is $8,003,973, a decrease of $255,362 from the
current FY 2017 budget. An explanation of this
change follows.
Same Service Level Changes—($98,368)Realignments to Meet Expenditure Requirements and Program Priorities—($135,723) There are a number of realignments budgeted to address priority spending needs within this department. There is a realignment of $337 from the Department of Tech-nology Integration and Support for local travel mileage reimbursement. In addition, there is a realignment of resources from this department to provide operational support in the Office of the Chief Technology Officer. This realignment includes $500 from dues, registra-tions, and fees, $509 from supporting services part-time salaries, $25,822 from contractual maintenance, $47,569 from lease/purchases, and $61,660 from consultants.
Other—$37,355There is a projected rate increase of $10,762 for phone system software support, a rate change of $10,817 for Avamar maintenance, and a rate increase of $15,776 for required licensing and maintenance for Oracle Database.
Program Efficiencies and Reductions—($156,994)The FY 2018 recommended budget for this office includes a comprehensive effort to identify potential program efficiencies and reductions. Stakeholders, including community partners and employee union representatives, participated in the program efficiencies and reduction process.
There is a reduction of $5,168 for contractual mainte-nance and a reduction of $151,826 for lease/purchases. The reduction in contractual maintenance reflects cur-rent year spending, and the reduction for lease/pur-chases reflects lease completion for both servers and telecom vehicles.
CHAPTER 8 – 14 TECHNOLOGY SUPPORT AND INFRASTRUCTURE

Technology Support
Supervisor (K) 1.0Technical Help Desk Specialist I (20) 8.0IT Systems Specialist (18–25) 8.0IT Systems Technician (18) 1.0Data Systems Operator I (13) 1.0Secretary (12) 1.0
FY 2018 OPERATING BUDGET
Department of Infrastructure and Operations
F.T.E. Positions 57.5
(*In addition, there are 5.0 positions funded by the Capital Budget)
Enterprise System Administration
Supervisor (O) 1.0IT Systems Engineer (27) 5.0Senior Client Server Engineer (27) 2.0IT Systems Specialist (18–25) 2.5
Telecommunications Systems
Supervisor (O) 1.0IT Systems Engineer (27) 1.0*IT Systems Specialist (18–25) 11.0IT Systems Specialist (18–25) 4.0*IT Systems Technician (18) 1.0
Database Administration
Supervisor (K) 1.0Database Analyst III (27) 2.0Database Administrator II (25) 2.0
Data Center
Computer Operations Manager (H) 1.0Computer Operator II (16) 2.0Computer Operator I (14) 4.0
Director II (Q) 1.0IT Systems Engineer (27) 1.0
CH
AP
TER 8 – 15 TEC
HN
OLO
GY
SU
PP
OR
T AN
D IN
FRA
STR
UC
TUR
E

Department of Infrastructure & Operations - 446/423/433/434/447/448/451
Actual FY 2017Budget
FY 2017Current
FY 2018Request
FY 2018
Summer EmploymentProfessional Substitutes
Total Positions (FTE)Position Salaries
60.500$5,267,013
57.500$5,242,496
57.500$5,242,496
57.500$5,242,496
Other Salaries
01 Salaries & Wages
StipendsProfessional Part Time
ConsultantsOther Contractual
OfficeOther Supplies & Materials
MediaInstructional Supplies & Materials
Textbooks
Subtotal Other Salaries
Leased Equipment
Grand Total
Other Equipment
Total Salaries & Wages
02 Contractual Services
Total Contractual Services
03 Supplies & Materials
Total Supplies & Materials
04 Other
Total Other
05 Equipment
Total Equipment
Supporting Services Part TimeOther
14,210 14,210 13,7017,676
(509)
1,825,471
66,6601,972,171
2,038,831
66,6601,972,171
2,038,831
5,0001,978,536
1,983,536 (55,295)
6,365(61,660)
186,927
10,040268,767
278,807
10,040268,767
278,807
10,040268,767
278,807
5,305,947 5,264,382 5,264,382 5,263,873 (509)
7,676 7,676
38,934 21,886 21,886 21,377 (509)
$8,013,789
693,039
$8,259,335
673,114
673,114
673,114
673,114
$8,259,335
473,719
473,719
$8,003,973
(199,395)
(199,395)
($255,362)
ChangeDescription FY 2016
Insur & Employee BenefitsUtilitiesMiscellaneous
2,405 4,201 4,201 4,038 (163)
Local/Other Travel 4,201 4,201 4,038 (163)
CHAPTER 8 – 16 TECHNOLOGY SUPPORT AND INFRASTRUCTURE

DESCRIPTION CURRENTFYBUDGET
FYACTUAL
20172016 10Mon
FY 2017CAT CHANGE
2018FY
Department of Infrastructure & Operations- 446/423/433/434/447/448/451
REQUEST
2018FY
446 Dept of Infrastructure & Operations
1 1.000 1.000 1.000Director IIQ 1.000
1 1.000 1.000 1.000IT Systems Engineer27 1.000
1 1.000Administrative Secretary III16
3.000 2.000 2.000Subtotal 2.000
423 Technology Support
10 1.000 1.000 1.000SupervisorK 1.000
10 8.000 8.000 8.000IT Systems Specialist25 8.000
1 8.000 8.000 8.000Technical Help Desk Spec I20 8.000
10 1.000 1.000 1.000IT Systems Technician18 1.000
10 1.000 1.000 1.000Data Systems Operator13 1.000
1 1.000 1.000Secretary12 1.000
19.000 20.000 20.000Subtotal 20.000
433 Telecommunications Systems
10 1.000 1.000 1.000SupervisorO 1.000
10 11.000 11.000 11.000IT Systems Specialist25 11.000
10 1.000 1.000 1.000IT Systems Technician18 1.000
13.000 13.000 13.000Subtotal 13.000
447 Database Administration
1 1.000 1.000 1.000SupervisorK 1.000
1 2.000 2.000 2.000Database Analyst III27 2.000
1 2.000 2.000 2.000Database Administrator II25 2.000
5.000 5.000 5.000Subtotal 5.000
448 Data Center
1 1.000 1.000 1.000Computer Operations MgrH 1.000
1 1.000 1.000 1.000Computer Operator II Shift 216 1.000
1 1.000 1.000 1.000Computer Operator II Shift 316 1.000
1 2.000 2.000 2.000Computer Operator I Shift 114 2.000
1 1.000 1.000 1.000Computer Operator I Shift 214 1.000
1 1.000 1.000 1.000Computer Operator I Shift 314 1.000
7.000 7.000 7.000Subtotal 7.000
451 Enterprise System Administration
1 1.000 1.000 1.000SupervisorO 1.000
1 1.000SupervisorK 1 2.000 2.000 2.000Sr Client Server Engineer27 2.000
1 5.000 5.000 5.000IT Systems Engineer27 5.000
1 3.500 2.500 2.500IT Systems Specialist25 2.500
CHAPTER 8 – 17 TECHNOLOGY SUPPORT AND INFRASTRUCTURE

DESCRIPTION CURRENTFYBUDGET
FYACTUAL
20172016 10Mon
FY 2017CAT CHANGE
2018FY
Department of Infrastructure & Operations- 446/423/433/434/447/448/451
REQUEST
2018FY
451 Enterprise System Administration
1 1.000Technical Analyst25
13.500 10.500 10.500Subtotal 10.500
57.50060.500 57.500Total Positions 57.500
CHAPTER 8 – 18 TECHNOLOGY SUPPORT AND INFRASTRUCTURE
Department of Business Information Services421
M I S S I O N The mission of the Department of Business Information Services (DBIS) is to plan, develop, implement, and support high-quality business solutions contributing to the transformation of learning environments through the innovative integration of technology across all aspects of the school system.
MAJOR FUNCTIONS
Human Capital Management SolutionsDBIS implements and supports human capital manage-ment solutions by providing applications and systems to facilitate operational excellence in the delivery of ser-vices for human resource management, professional development, and career management. These applica-tions and systems include:
• Human Resources Information System
• Payroll Attendance and Collection System
• School Allocation Execution application
• Employee Self-Service Portal and Application
• Professional Development Online system
• MCPS Careers/Applicant Tracking System
• Extracurricular Activity Salary Processes
• Substitute Employee Management System
The Human Resource Information System (HRIS) is the authoritative source for all personnel information inte-grating demographic information, leave management, time accrual, payroll and employee benefit functions that are essential to the effective management of human cap-ital. In collaboration with the Office of Human Resource and Development and the Employee and Retiree Service Center (ERSC), we continue to streamline operations for staff functions in schools and offices. Manual-paper processes are being replaced with online functions that enable staff to enter and view data for areas including benefits, salary and retirement planning. Online col-lection of such data eliminates multiple points of paper handling and expedites office processes. For example, in FY 2016 over 17,000 staff members processed their Tobacco Attestation online during open enrollment. Prior to the release of the Employee Self-Service appli-cation, this would have required paper forms to be com-pleted by each person and sent to ERSC for data entry and integration into the HRIS system.
Financial Management SolutionsDBIS staff implements and develops new functionalities for financial management solutions and provides opera-tional support for integrated enterprise systems. These systems include:
• Financial Management System
• Financial Monitoring System
• Salary Simulation Administration
• School Funds Online
• Online Independent Activity Funds collection system
• Budget Management System
• E-Rate
The Financial Management System integrates supply chain, financial, and budgeting functions, providing access to essential information and streamlining finan-cial processes for schools and offices, service providers and external agencies. In collaboration with the Depart-ment of Financial Services, we redesigned and devel-oped a new Funding Accountability and Transparency application incorporating it into the Financial Manage-ment System. The E-rate program continues to provide rebates on telecommunication, internet, and broadband services. These rebates provide a source of funds for digital technologies essential for creating 21st Century learning environments. Additionally, and in collabora-tion with the Office of the Chief Financial Officer and other departments within Office of the Chief Operat-ing Officer, we integrated capital budget data and con-tracted expenditure into the OpenDataMCPS portal. This portal provides the citizens of Montgomery County with the ability to perform inquires on these new data-sets in addition to the wide range of currently available data.
School and Business Operational TechnologiesDBIS develops, implements, and supports a variety of solutions essential to the operation of schools and cen-tral offices. Systems include:
• Transportation Information Management System
• Document Management System (Fortis)
• Student Member of the Board election system
• Capital Improvement Plan application
• Database of Accountable Evaluations system
• Destiny Library Management system
• Facility Availability System
CHAPTER 8 – 19 TECHNOLOGY SUPPORT AND INFRASTRUCTURE

Department of Business Information Services421
The Transportation Information Management System supports the management of the human and automotive resources used by MCPS. Fortis provides MCPS with an electronic document management system that dramati-cally increases access to information previously available only on paper such as information related to person-nel, finances, and student records. In collaboration with the Division of Long Range Planning, we upgraded and enhanced the reporting capability of the Capital Improve-ment Plan application. We also delivered a major upgrade to the Facility Availability System with various improve-ments that enhanced the user’s experience.
MEASURES M E A S U R E : Increase the percentage of systems/appli-cations on a supported release level:
FY 2016Actual
FY 2017Estimate
FY 2018Recommended
61% 70% 70%
E X P L A N A T I O N : To implement 21st Century solutions and learning environments with agility and ensure successful daily operations, systems require updating to ensure these foundational systems are responsive to the dynamic, changing digital workplace. We have a strategic plan to ensure that all identified systems are upgraded to currently support release levels by the end of FY 2020.
M E A S U R E : Increase the percentage of paper-based processes converted to online web-based applications for school and office operations based on the three year plan:
FY 2016Actual
FY 2017Estimate
FY 2018Recommended
32% 71% 100%
E X P L A N A T I O N : In collaboration with schools and offices, new areas as well as major enhancements to current systems are identified to save thousands of hours of time for school and central office staff in paper handling, sending via Pony, e-mailing, data entry, correcting, and updating numerous related systems. In addition, the one-stop access to information provided by these systems improves the quality of the result by giving staff time for analysis and critical thinking about decisions rather than searching for information in multiple sources.
OVERVIEW OF BUDGET CHANGES
FY 2017 CURRENT BUDGET
The current FY 2017 budget for the Department of
Business Information Services is changed from the
budget adopted by the Board of Education on June
14, 2016. The change is a result of a realignment
of a 1.5 developer manager position to crate a
1.5 application developer III position within the
department.
FY 2018 RECOMMENDED BUDGET
The FY 2018 recommended budget for this office
is $5,849,516, an increase of $2,552,220 over the
current FY 2017 budget. An explanation of this
change follows.
Same Service Level Changes—$1,049,226Realignments to Meet Expenditure Requirements and Program Priorities—$883,576 Realignments are budgeted to address priority spend-ing needs within this office. There is a realignment of $662,301 from the Department of Technology Integra-tion and Support for contractual maintenance. This additional funding will be used to enhance current busi-ness systems to create effective and efficient business operations. Also, an additional $221,275 is budgeted for employee benefits in the Department of Employee and Retiree Services budget.
Other—$165,650There is a projected rate increase of $37 for contractual services based upon active users for online business sys-tems, and a rate increase of $165,513 for contractual main-tenance for online subscriptions and software licensing.
Program Efficiencies and Reductions—($48,862)The FY 2018 recommended budget for this office includes a comprehensive effort to identify potential program efficiencies and reductions. Stakeholders, including community partners and employee union representatives, participated in the program efficiencies and reduction process.
There is a reduction of $37,041 for consultants and $11,821 for contractual maintenance. Based on prior year actuals, this department is able to recognize the reductions for consultants and contractual maintenance without any impact to operations.
CHAPTER 8 – 20 TECHNOLOGY SUPPORT AND INFRASTRUCTURE

Department of Business Information Services421
Strategic Accelerators—$1,551,856Focus on Operational Excellence—$976,856For FY 2018, an additional $857,898 is added to the department budget for contractual services. This addi-tional funding is to improve current business systems. Also, a 1.0 FTE team leader position and $118,958 is added to support business operations within the depart-ment. In addition, there is $30,560 allocated to the Department of Employee & Retiree Services budget for employee benefits.
Focus on Human Capital—$575,000There also is an additional $575,000 for consultants to provide business systems support for Human Resources/Lawson systems for schools.
CHAPTER 8 – 21 TECHNOLOGY SUPPORT AND INFRASTRUCTURE

FY 2018 OPERATING BUDGET
F.T.E. Positions 18.5
(*In addition, there is a 0.5 position funded by the Employee Benefits Trust Fund)
Department of Business Information Services
Director II (Q) 1.0Team Leader (M) 1.0Supervisor (K) 1.0Application Developer III (27) 4.5Development Project Manager (27) 2.0Development Project Manager (27) 0.5*Applications Developer II (25) 5.0Technical Analyst (25) 1.0IT Systems Specialist (18–25) 1.0IT Systems Technician (18) 1.0Administrative Secretary III (16) 1.0
CH
AP
TER 8 – 22 TEC
HN
OLO
GY
SU
PP
OR
T AN
D IN
FRA
STR
UC
TUR
E
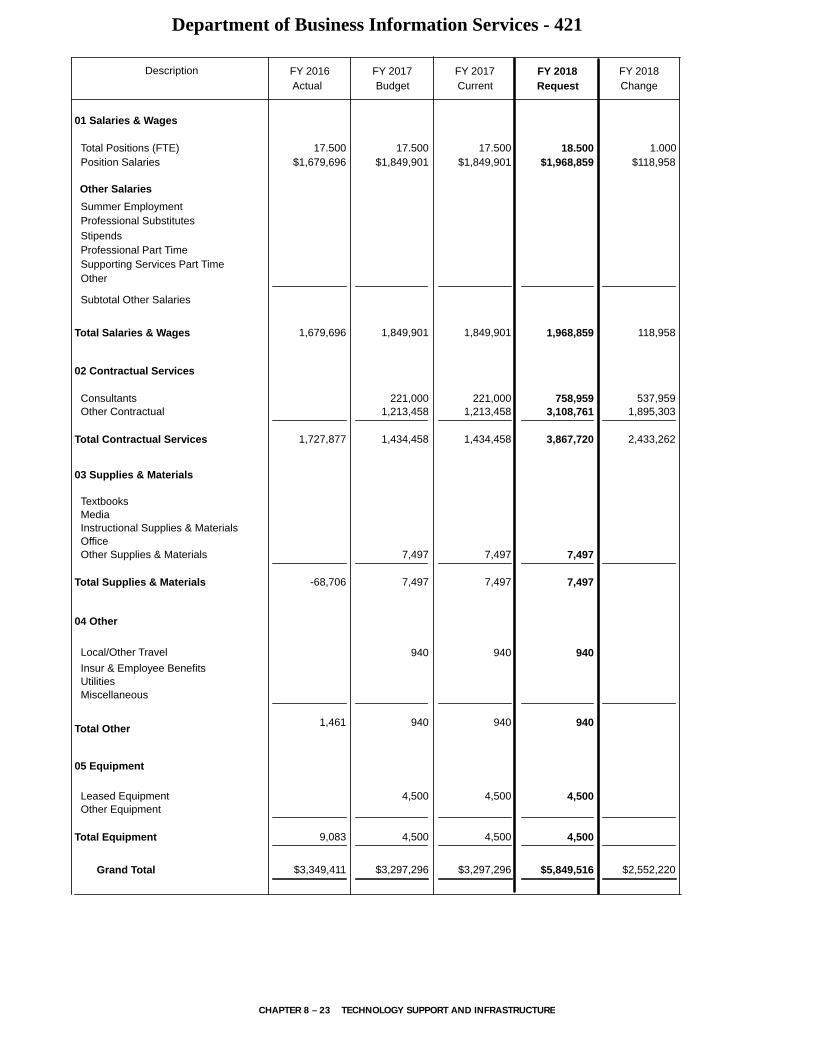
Department of Business Information Services - 421
Actual FY 2017Budget
FY 2017Current
FY 2018Request
FY 2018
Summer EmploymentProfessional Substitutes
Total Positions (FTE)Position Salaries
17.500$1,679,696
17.500$1,849,901
17.500$1,849,901
18.500$1,968,859
Other Salaries
01 Salaries & Wages
StipendsProfessional Part Time
ConsultantsOther Contractual
OfficeOther Supplies & Materials
MediaInstructional Supplies & Materials
Textbooks
Subtotal Other Salaries
Leased Equipment
Grand Total
Other Equipment
Total Salaries & Wages
02 Contractual Services
Total Contractual Services
03 Supplies & Materials
Total Supplies & Materials
04 Other
Total Other
05 Equipment
Total Equipment
Supporting Services Part TimeOther
1,727,877
221,0001,213,458
1,434,458
221,0001,213,458
1,434,458
758,9593,108,761
3,867,720 2,433,262
1,895,303537,959
-68,706
7,497
7,497
7,497
7,497
7,497
7,497
1,679,696 1,849,901 1,849,901 1,968,859 118,958
$3,349,411
9,083
$3,297,296
4,500
4,500
4,500
4,500
$3,297,296
4,500
4,500
$5,849,516 $2,552,220
ChangeDescription FY 2016
1.000$118,958
Insur & Employee BenefitsUtilitiesMiscellaneous
1,461 940 940 940
Local/Other Travel 940 940 940
CHAPTER 8 – 23 TECHNOLOGY SUPPORT AND INFRASTRUCTURE
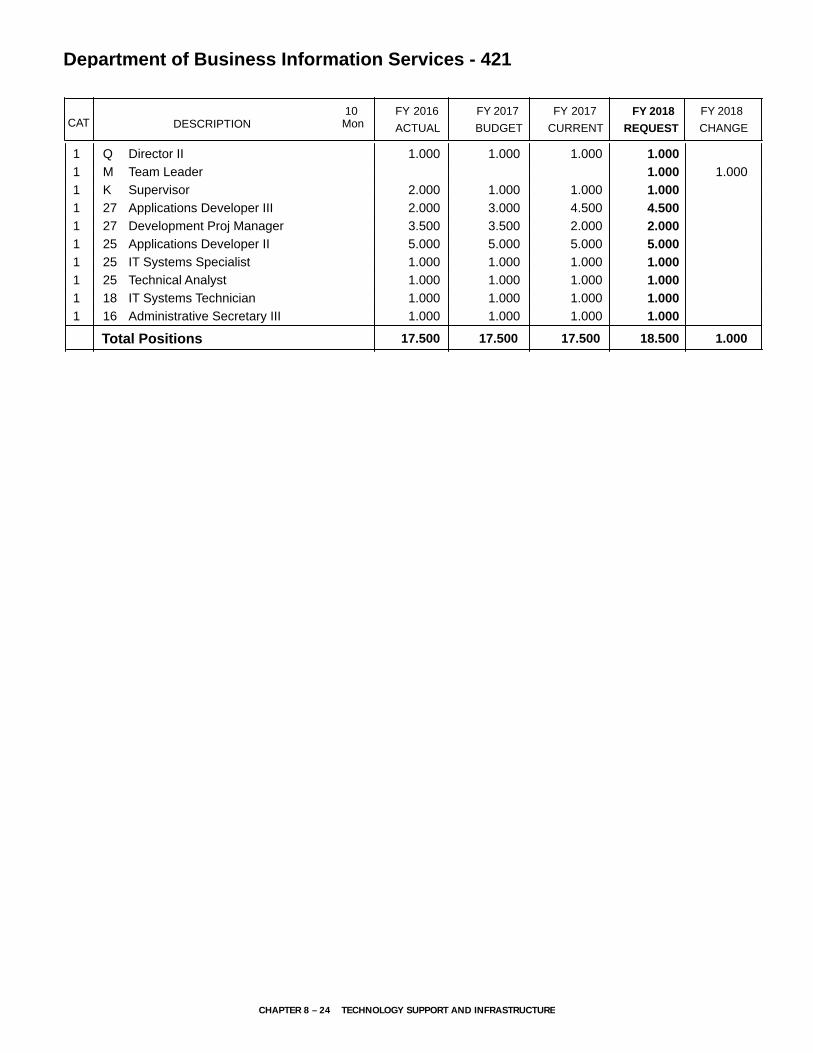
DESCRIPTION CURRENTFYBUDGET
FYACTUAL
20172016 10Mon
FY 2017CAT
Department of Business Information Services - 421
FY 2018CHANGE
FY 2018
REQUEST
1 1.000 1.000 1.000Director IIQ 1.000
1 Team LeaderM 1.0001.000
1 2.000 1.000 1.000SupervisorK 1.000
1 2.000 3.000 4.500Applications Developer III27 4.500
1 3.500 3.500 2.000Development Proj Manager27 2.000
1 5.000 5.000 5.000Applications Developer II25 5.000
1 1.000 1.000 1.000IT Systems Specialist25 1.000
1 1.000 1.000 1.000Technical Analyst25 1.000
1 1.000 1.000 1.000IT Systems Technician18 1.000
1 1.000 1.000 1.000Administrative Secretary III16 1.000
17.50017.500 17.500Total Positions 18.500 1.000
CHAPTER 8 – 24 TECHNOLOGY SUPPORT AND INFRASTRUCTURE

Department of Learning Management Systems442/445
M I S S I O N The mission of the
Department of Learning Management
Systems (DLMS) is to provide instructional
and information systems that enhance the
education of students through the innovative
application of technology; facilitate the
design of connected systems, processes,
and information; increase the efficiency
of the educator; and transform access to
information in support of teaching and
learning for staff, students, parents/guardians,
and the community.
MAJOR FUNCTIONSApplication Development
DLMS collaborates with offices, schools, and local gov-ernment agencies to develop, implement, and continu-ously improve MCPS applications and services. Based on goals and priorities, the department implements and supports instructional technology solutions for stu-dents, parents/guardians, schools, and offices. These solutions support data-driven decision-making and planning; dissemination of accurate and timely infor-mation; and operational effectiveness that streamlines and enhances the management of teaching and learn-ing, as well as MCPS’ compliance with state and federal regulations. DLMS focuses on providing and manag-ing student systems to support greater accountability and sharing of knowledge among staff, students, and parents/guardians.
Implementation and Support of Instructional Applications
DLMS staff supports offices and schools by provisioning and administering student systems. The Online Admin-istrative Student Information System (OASIS) is the source system for managing all student administrative information, including enrollment, attendance, report cards and transcripts, scheduling, course management, and assessment information. In FY 2016 OASIS under-went a major revision required to maintain support-ability and reliability. The OASIS Special Services (OSS) module is a component of OASIS that greatly increases the efficiency of managing the special education process for families, schools, and central services administrators,
and enables creation of the electronic Individualized Education Program (IEP). DLMS staff also manages the Online Achievement and Reporting System (OARS), comprising of an electronic grade book and classroom-to-home communication solution, as well as electronic assessment systems to support timely delivery and reporting of assessments aligned with MCPS and Mary-land State standards. In FY 2017 DLMS will lead an eval-uation of the current OARS system which will extend the systems’ current capabilities.
Information from the student systems and other infor-mation services is published in the myMCPS portal, which provides end users with the information they need in a single place. The myMCPS portal is designed to deliver a personalized user experience based on a user’s roles and responsibilities in the school system. The portal facilitates team and peer-group communica-tion and collaboration; provides access to role-specific applications, data warehouse dashboards, and reports; and offers information services, including the elemen-tary integrated curriculum, teacher and student atten-dance data.
• Online Administrative Student Information System(OASIS)
• Online Student Services (OSS)• Student Information Management System(SIMS)• Online Achievement and Reporting System (OARS)• myMCPS Scheduler• myMCPS Staff Portal• Community Engagement Systems
Information and Application Infrastructure and Support
DLMS systems provides data to district staff, students, and parents/guardians, as well as to the Maryland State Department of Education. DLMS staff monitor and support the infrastructure needed to integrate external systems such as Naviance, NWEA, Performance Mat-ters, Achievement Series and others. These applications and reporting solutions provide current and historical reports to support both detail and summary-level data analysis for strategic decision making.
• Data Warehouse• System Integrations• Operational Reporting• Open Data
CHAPTER 8 – 25 TECHNOLOGY SUPPORT AND INFRASTRUCTURE

Department of Learning Management Systems442/445
Quality ManagementThis department adds value to the overall operations within OCTO through the implementation of quality assurance processes across all OCTO departments. This department provides leadership in the use of quality assurance best practices focused on meeting commit-ments for high-quality products and services that satisfy customer needs and performs reliably when delivered. Quality assurance practices encompass the entire soft-ware development process, including requirements, change management, configuration management, test-ing, and release. Quality assurance tools and techniques provide for tracking the effective use of development processes with measurement and verification through-out the development life cycle to final readiness review.
• Team Foundation Server• Performance Testing
MEASURES M E A S U R E : Percentage of users satisfied with the cus-tomer service provided by the department.
FY 2016Actual
FY 2017Estimate
FY 2018Recommended
95% 97% 98%
E X P L A N A T I O N : This is a measure of customer satisfaction with DLMS staff service as measured by surveying stakeholders in work group sessions.
M E A S U R E : The percentage of software implemented without major defects.
FY 2016Actual
FY 2017Estimate
FY 2018Recommended
94% 95% 99%
E X P L A N A T I O N : This measure indicates the percentage of software implemented that performs without error, based on design specifications, as measured by source control work item management software.
OVERVIEW OF BUDGET CHANGES
FY 2018 RECOMMENDED BUDGET
The FY 2018 recommended budget for this office is
$6,255,797, an increase of $81,086 over the current
FY 2017 budget. An explanation of this change
follows.
Same Service Level Changes—$67,347Other—$67,347There is a projected rate increase of $21,337 for Unit-edStreaming, a subscription-based provider of educa-tional video streaming services meetings. Also, there is a rate increase of $54,495 for Naviance, and an increase of $8,698 for computerized assessments. Lastly, there is a rate decrease of $17,183 for Amplify due to student enrollment forecast.
Program Efficiencies and Reduction—($71,261)The FY 2018 recommended budget for this office includes a comprehensive effort to identify potential program efficiencies and reductions. Stakeholders, including community partners and employee union representatives, participated in the program efficiencies and reduction process.
There is a reduction of a 1.0 application developer II position and $71,261. The responsibilities of the applica-tion developer position will be absorbed by other appli-cation developers within the department.
Strategic Accelerators—$85,000Focus on Learning, Accountability and Results—$85,000For FY 2018, an additional $85,000 is added to the depart-ment budget for contractual services. This additional funding will be used to implement an online high school planner for college and career readiness.
CHAPTER 8 – 26 TECHNOLOGY SUPPORT AND INFRASTRUCTURE

FY 2018 OPERATING BUDGET
F.T.E. Positions 31.0
(*In addition, there are 2.0 positions funded by the Capital Budget)
Department of Learning Management Systems
Enterprise Learning Systems
Supervisor (O) 2.0Instructional Specialist (B–D) 3.0Application Developer III (27) 1.0Database Administrator III (27) 1.0IT Systems Engineer (27) 1.0*Application Developer II (25) 7.0Technical Analyst (25) 1.0Student Systems Specialist (24) 1.0Applications Specialist I (23) 1.0IT Systems Specialist (18–25) 1.0*Data Control Technician I (13) 2.0
Information and Application Architecture Unit
Supervisor (K) 2.0Database Administrator III (27) 3.0ETL Analyst/Programmer (25) 1.0IT Systems Specialist (25) 1.0Technical Analyst (25) 1.0Application Developer II (25) 1.0Administrative Secretary II (15) 1.0
Director II (Q) 1.0Administrative Secretary III (16) 1.0
CH
AP
TER 8 – 27 TEC
HN
OLO
GY
SU
PP
OR
T AN
D IN
FRA
STR
UC
TUR
E

Department of Learning Management Systems - 442/445
Actual FY 2017Budget
FY 2017Current
FY 2018Request
FY 2018
Summer EmploymentProfessional Substitutes
Total Positions (FTE)Position Salaries
33.000$2,560,699
32.000$3,250,823
32.000$3,250,823
31.000$3,179,562
Other Salaries
01 Salaries & Wages
StipendsProfessional Part Time
ConsultantsOther Contractual
OfficeOther Supplies & Materials
MediaInstructional Supplies & Materials
Textbooks
Subtotal Other Salaries
Leased Equipment
Grand Total
Other Equipment
Total Salaries & Wages
02 Contractual Services
Total Contractual Services
03 Supplies & Materials
Total Supplies & Materials
04 Other
Total Other
05 Equipment
Total Equipment
Supporting Services Part TimeOther
94,86018,369
94,86018,369
94,86018,369
2,507,968
440,5192,319,304
2,759,823
440,5192,319,304
2,759,823
440,5192,471,651
2,912,170 152,347
152,347
36,644
4,14645,562
49,708
4,14645,562
49,708
4,14645,562
49,708
2,658,937 3,364,052 3,364,052 3,292,791 (71,261)
98,238 113,229 113,229 113,229
$5,204,222 $6,174,711 $6,174,711 $6,255,797 $81,086
ChangeDescription FY 2016
(1.000)($71,261)
Insur & Employee BenefitsUtilitiesMiscellaneous
673 1,128 1,128 1,128
Local/Other Travel 1,128 1,128 1,128
CHAPTER 8 – 28 TECHNOLOGY SUPPORT AND INFRASTRUCTURE

DESCRIPTION CURRENTFYBUDGET
FYACTUAL
20172016 10Mon
FY 2017CAT CHANGE
2018FY
Department of Learning Management Systems - 442/445
REQUEST
2018FY
442 Dept. of Learning Management Systems
1 1.000 1.000 1.000Director IIQ 1.000
1 3.000 2.000 2.000SupervisorO 2.000
1 1.000SupervisorK 1 3.000 3.000 3.000Instructional SpecialistBD 3.000
1 1.000 1.000 1.000Applications Developer III27 1.000
1 1.000 1.000 1.000Database Administrator III27 1.000
1 7.000 8.000 8.000Applications Developer II25 (1.000)7.000
1 1.000 1.000 1.000Technical Analyst25 1.000
1 1.000 1.000 1.000Student Systems Specialist24 1.000
1 1.000 1.000 1.000Applications Specialist I23 1.000
1 1.000 1.000 1.000Administrative Secretary III16 1.000
1 2.000 2.000 2.000Data Control Technician I13 2.000
23.000 22.000 22.000Subtotal (1.000)21.000
445 Information & Application Architecture Unit
1 1.000Director IP 1 1.000SupervisorO 1 2.000 2.000 2.000SupervisorK 2.000
1 2.000 3.000 3.000Database Administrator III27 3.000
1 1.000 1.000Applications Developer II25 1.000
1 1.000 1.000IT Systems Specialist25 1.000
1 2.000 1.000 1.000ETL Analyst/Programmer25 1.000
1 1.000 1.000Technical Analyst25 1.000
1 1.000Applications Developer I23 1 1.000 1.000 1.000Administrative Secretary II15 1.000
10.000 10.000 10.000Subtotal 10.000
32.00033.000 32.000Total Positions (1.000)31.000
CHAPTER 8 – 29 TECHNOLOGY SUPPORT AND INFRASTRUCTURE

Chapter 9
Human Capital Management
Human Capital Management PAGE
Office of the Associate Superintendent for Human Resources and Development ....................... 9-3
Department of Certification and Staffing .................... 9-8
Department of Performance Evaluation and Compliance ............................................................. 9-13
Department of Professional Growth Systems ............. 9-18
Grant: Title II, Part A Preparing, Training and Recruiting High-Quality Teachers and Principals .................... 9-25

22.000
By Object of Expenditure
Summary of Resources
Human Capital Management
OBJECT OF EXPENDITURE FY 2016 FY 2017 FY 2017 FY 2018 FY 2018ACTUAL BUDGET CURRENT BUDGET CHANGE
22.00022.000
111.475 111.475 1.100110.475
1,267,473
102,769 215,028 178,133
109,962 138,850
215,028
156,803
154,521
1,257,929
142,827
1,124,646 1,101,126 1,108,126 1,123,844 15,718
150,153 128,694 (21,459)
1,258,279 1,252,538 (5,741)
11,926,547
109,962
12,356,550 12,363,550 12,041,476 (322,074)
68,777
(36,895)
99,105
28,888
9,80989,296 89,296
6,326,977 3,839,154 3,839,154 4,120,691 281,537
8,757 1,016,900 1,016,900 1,619,829 602,929
6,404,511 4,945,350 4,945,350 5,839,625 894,275
$17,626,890 $18,198,084
POSITIONS
Administrative
TOTAL POSITIONS
01 SALARIES & WAGES
Administrative
OTHER SALARIES
Administrative
Professional
Supporting Services
TOTAL OTHER SALARIES
TOTAL SALARIES AND WAGES
02 CONTRACTUAL SERVICES
03 SUPPLIES & MATERIALS
04 OTHER
Local/Other Travel
Insur & Employee Benefits
Utilities
Miscellaneous
TOTAL OTHER
05 EQUIPMENT
GRAND TOTAL AMOUNTS
$2,973,869 $3,114,961 $3,121,611
112.575
TOTAL POSITION DOLLARS 10,659,074 11,098,621 11,105,271 10,788,938 (316,333)
$3,062,691 ($58,920)
$17,633,890 $564,194$18,588,348
39.200 1.100
51.37551.375 51.37538.10038.100Professional
Supporting Services
22.000
38.10050.375
4,036,762 3,851,093
3,875,154
(185,669)
3,946,898 (71,744)3,992,363
3,692,8424,036,762
3,946,898
Professional
Supporting Services
Business/Operations Admin.
Business/Operations Admin.
CHAPTER 9 – 1 HUMAN CAPITAL MANAGEMENT
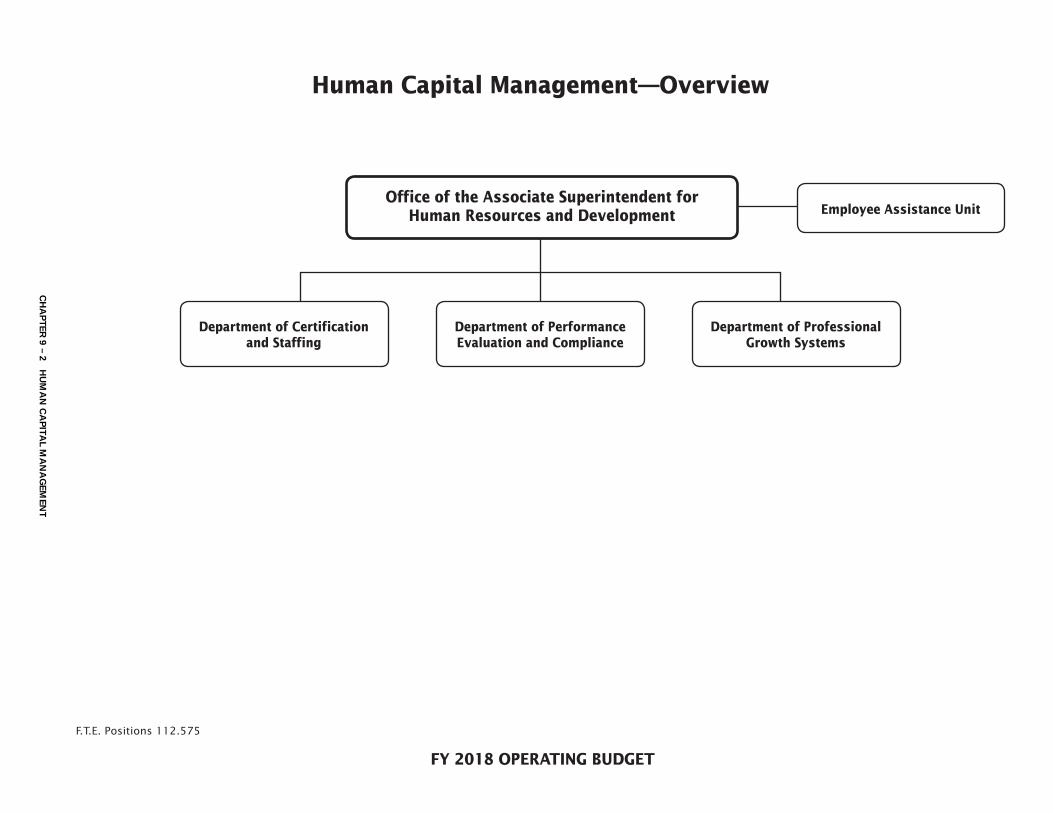
FY 2018 OPERATING BUDGET
Human Capital Management—Overview
Department of Performance Evaluation and Compliance
Department of Professional Growth Systems
Department of Certification and Staffing
Employee Assistance UnitOffice of the Associate Superintendent for
Human Resources and Development
F.T.E. Positions 112.575
CH
AP
TER 9 – 2 H
UM
AN
CA
PITA
L MA
NA
GEM
ENT
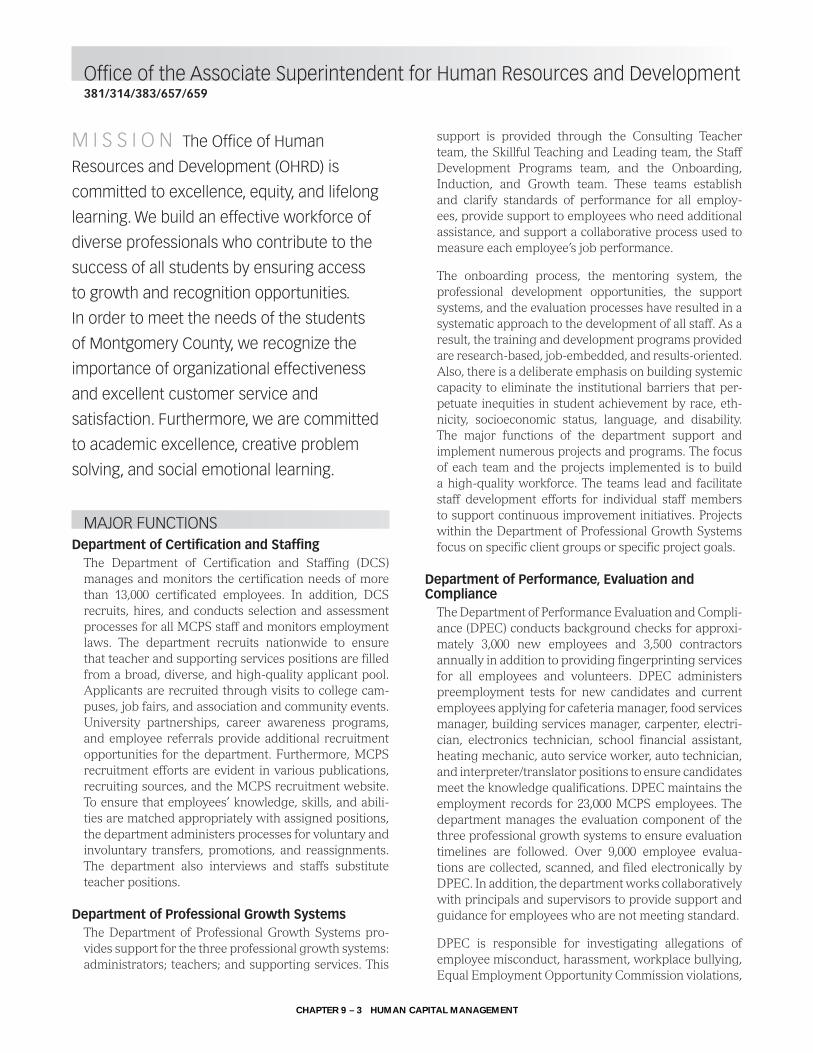
Office of the Associate Superintendent for Human Resources and Development381/314/383/657/659
M I S S I O N The Office of Human
Resources and Development (OHRD) is
committed to excellence, equity, and lifelong
learning. We build an effective workforce of
diverse professionals who contribute to the
success of all students by ensuring access
to growth and recognition opportunities.
In order to meet the needs of the students
of Montgomery County, we recognize the
importance of organizational effectiveness
and excellent customer service and
satisfaction. Furthermore, we are committed
to academic excellence, creative problem
solving, and social emotional learning.
MAJOR FUNCTIONSDepartment of Certification and Staffing
The Department of Certification and Staffing (DCS) manages and monitors the certification needs of more than 13,000 certificated employees. In addition, DCS recruits, hires, and conducts selection and assessment processes for all MCPS staff and monitors employment laws. The department recruits nationwide to ensure that teacher and supporting services positions are filled from a broad, diverse, and high-quality applicant pool. Applicants are recruited through visits to college cam-puses, job fairs, and association and community events. University partnerships, career awareness programs, and employee referrals provide additional recruitment opportunities for the department. Furthermore, MCPS recruitment efforts are evident in various publications, recruiting sources, and the MCPS recruitment website. To ensure that employees’ knowledge, skills, and abili-ties are matched appropriately with assigned positions, the department administers processes for voluntary and involuntary transfers, promotions, and reassignments. The department also interviews and staffs substitute teacher positions.
Department of Professional Growth SystemsThe Department of Professional Growth Systems pro-vides support for the three professional growth systems: administrators; teachers; and supporting services. This
support is provided through the Consulting Teacher team, the Skillful Teaching and Leading team, the Staff Development Programs team, and the Onboarding, Induction, and Growth team. These teams establish and clarify standards of performance for all employ-ees, provide support to employees who need additional assistance, and support a collaborative process used to measure each employee’s job performance.
The onboarding process, the mentoring system, the professional development opportunities, the support systems, and the evaluation processes have resulted in a systematic approach to the development of all staff. As a result, the training and development programs provided are research-based, job-embedded, and results-oriented. Also, there is a deliberate emphasis on building systemic capacity to eliminate the institutional barriers that per-petuate inequities in student achievement by race, eth-nicity, socioeconomic status, language, and disability. The major functions of the department support and implement numerous projects and programs. The focus of each team and the projects implemented is to build a high-quality workforce. The teams lead and facilitate staff development efforts for individual staff members to support continuous improvement initiatives. Projects within the Department of Professional Growth Systems focus on specific client groups or specific project goals.
Department of Performance, Evaluation and Compliance
The Department of Performance Evaluation and Compli-ance (DPEC) conducts background checks for approxi-mately 3,000 new employees and 3,500 contractors annually in addition to providing fingerprinting services for all employees and volunteers. DPEC administers preemployment tests for new candidates and current employees applying for cafeteria manager, food services manager, building services manager, carpenter, electri-cian, electronics technician, school financial assistant, heating mechanic, auto service worker, auto technician, and interpreter/translator positions to ensure candidates meet the knowledge qualifications. DPEC maintains the employment records for 23,000 MCPS employees. The department manages the evaluation component of the three professional growth systems to ensure evaluation timelines are followed. Over 9,000 employee evalua-tions are collected, scanned, and filed electronically by DPEC. In addition, the department works collaboratively with principals and supervisors to provide support and guidance for employees who are not meeting standard.
DPEC is responsible for investigating allegations of employee misconduct, harassment, workplace bullying, Equal Employment Opportunity Commission violations,
CHAPTER 9 – 3 HUMAN CAPITAL MANAGEMENT

Office of the Associate Superintendent for Human Resources and Development381/314/383/657/659
and working with principals and supervisors to address findings and implement progressive discipline as appro-priate. DPEC also works with principals and supervisors to ensure appropriate accommodations are provided as outlined in the Americans with Disabilities Act of 1990. In addition, DPEC consults with the Office of General Council and provides the research of employee records in cases involving litigation and unemployment claims.
Employee Assistance The Employee Assistance Unit provides counseling and consultation services to intervene in and prevent work performance issues.
Continuing Education and Tuition ReimbursementThe Office of the Associate Superintendent provides oversight of Continuing Professional Development (CPD) courses that are available primarily to teaching staff seeking academic credit for salary advancement and certification renewal. In addition, the Office of the Associate Superintendent is responsible for the over-sight and processing of tuition reimbursement requests for administrators, supporting services, and teachers. The office serves as the MCPS liaison to the Maryland State Department of Education for matters related to certification, CPD courses, and selected higher educa-tion partnerships, and works collaboratively with the Montgomery County Association of Administrators and Principals/Montgomery County Business and Opera-tions Administrators, the Service Employees Interna-tional Union Local 500, and the Montgomery County Education Association to promote the ongoing profes-sional growth and development of the MCPS workforce.
OVERVIEW OF BUDGET CHANGES
FY 2017 CURRENT BUDGET
The current FY 2017 budget for office is changed
from the budget adopted by the Board of
Education on June 14, 2016. The change is a result
of a realignment of $7,000 to fund professional
part-time salaries.
FY 2018 RECOMMENDED BUDGET
The FY 2018 recommended budget for this office
is $5,750,802, an increase of $551,279 over the
current FY 2017 budget. An explanation of this
change follows.
Same Service Level Changes—$1,008,400Realignments to Meet Expenditure Requirements and Program Priorities—$8,400 There are several realignments budgeted to address pri-ority spending needs within this office. There is a budget neutral realignment of $400 from contractual services to local travel mileage reimbursement. There is a realign-ment of $15,000 to this office for consultant services from the Department of Certification and Staffing (DCS), in addition to a realignment of $6,600 for contractual ser-vices from this office to DCS.
Other—$1,000,000A projected increase in requests from employees within the Service Employees International Union, Local 500 (SEIU) for tuition reimbursement requires a budgetary increase of $250,000. Furthermore, a projected increase in requests from employees within the Montgom-ery County Education Association (MCEA) union for tuition reimbursement requires a budgetary increase of $750,000.
Program Efficiencies and Reductions—$803,901The FY 2018 recommended budget for this office includes a comprehensive effort to identify potential program efficiencies and reductions. Stakeholders, including community partners and employee union representatives, participated in the program efficiencies and reduction process.
There is a reduction of $750,000 for tuition reimburse-ment that is budgeted to support requests from employ-ees within the MCEA union, and there is a reduction of $50,000 for tuition reimbursement that is budgeted to support requests from employees within the SEIU.. In addition, there is a reduction of $3,901 for contractual services.
Strategic Accelerators—$346,780Focus on Human Capital—$346,780For FY 2018, $346,780 is added to this budget for tuition reimbursement to support requests submitted by sup-port-staff employees in SEIU that pursue a college path-way towards a teaching opportunity.
CHAPTER 9 – 4 HUMAN CAPITAL MANAGEMENT

FY 2018 OPERATING BUDGET
Tuition Reimbursement
Fiscal Assistant I (13) 1.0
Continuing Education
CPD Registrar (14) 1.0Secretary (12) 1.0
F.T.E. Positions 12.1
Office of the Associate Superintendent ofHuman Resources and Development
Associate Superintendent 1.0Assistant to Associate Superintendent (N) 1.0Classification Coordinator (26) 1.0Fiscal Specialist II (25) 1.0Administrative Services Manager I (17) 1.0Administrative Secretary III (16) 1.0
Employee Assistance Unit
Employee Assistance Specialist (B–D) 2.1Secretary (12) 1.0
CH
AP
TER 9 – 5 H
UM
AN
CA
PITA
L MA
NA
GEM
ENT

Actual FY 2017Budget
FY 2017Current
FY 2018Request
FY 2018
Summer EmploymentProfessional Substitutes 500
Total Positions (FTE)Position Salaries
29.975$2,108,258
12.100$1,127,238
12.100$1,127,238
12.100$1,127,238
Other Salaries
01 Salaries & Wages
4,194 4,194 4,694
Stipends 124,440 124,440 124,440Professional Part Time
ConsultantsOther Contractual
OfficeOther Supplies & Materials
MediaInstructional Supplies & Materials
Textbooks
Subtotal Other Salaries
Leased Equipment
Grand Total
Other Equipment
Total Salaries & Wages
02 Contractual Services
Total Contractual Services
03 Supplies & Materials
Total Supplies & Materials
04 Other
Total Other
05 Equipment
Total Equipment
Supporting Services Part TimeOther
3,8763,632
10,8763,632
16,3763,632
78,283 (6,000)
5,500
34,352
58,573
58,573
58,573
58,573
15,00047,672
62,672 4,099
(10,901)15,000
11,120
12,23312,891
25,124
12,23312,891
25,124
12,23312,891
25,124
2,304,721 1,347,663 1,354,663 1,354,663
84,283 84,283
196,463 220,425 227,425 227,425
$7,550,436 $5,192,523 $5,199,523 $5,750,802 $551,279
ChangeDescription FY 2016
Insur & Employee BenefitsUtilitiesMiscellaneous
5,200,243
2,739,746
1,016,900
3,761,163
2,739,746
1,016,900
3,761,163
3,286,526
1,016,900
4,308,343
546,780
547,180
Local/Other Travel 4,517 4,517 4,917 400
Office of the Associate Superintendent for Human Resources and Development - 381/314/383/657/659
CHAPTER 9 – 6 HUMAN CAPITAL MANAGEMENT

DESCRIPTION CURRENTFYBUDGET
FYACTUAL
20172016 10Mon
FY 2017CAT CHANGE
2018FY
Office of the Associate Superintendent for Human Resources & Developement - 381/314/383/657/659
REQUEST
2018FY
381 Office of HR and Development
1 1.000 1.000 1.000Associate Superintendent 1.000
1 1.000Director IIQ 1 1.000SupervisorO 1 1.000 1.000 1.000Asst. to Assoc SuptN 1.000
1 1.000CoordinatorN 1 1.000 1.000 1.000Classification Coordinator26 1.000
1 1.000 1.000 1.000Fiscal Specialist II25 1.000
1 1.000Investigation Specialist25 1 1.000Data Management Specialist19 1 1.000 1.000 1.000Admin Services Manager I17 1.000
1 2.000 1.000 1.000Administrative Secretary III16 1.000
1 2.000Personnel Assistant III12 1 .875Personnel Assistant I10
14.875 6.000 6.000Subtotal 6.000
314 Employee Assistance Unit
1 2.100 2.100 2.100Employee Assistance SpecBD 2.100
1 1.000 1.000 1.000Secretary12 1.000
3.100 3.100 3.100Subtotal 3.100
383 Department of Certification & Continuing Educ
2 1.000Director IP 1 1.000CoordinatorN 1 1.000Sr. Certification Specialist24 1 1.000Certification Specialist19 2 1.000Administrative Secretary II15 1 3.000Personnel Assistant IV15 1 1.000Personnel Assistant III12
9.000Subtotal657 Continuing Education
2 1.000 1.000 1.000CPD Registrar14 1.000
2 1.000 1.000 1.000Secretary12 1.000
2.000 2.000 2.000Subtotal 2.000
659 Tuition Reimbursement
2 1.000 1.000 1.000Fiscal Assistant I13 1.000
1.000 1.000 1.000Subtotal 1.000
12.10029.975 12.100Total Positions 12.100
CHAPTER 9 – 7 HUMAN CAPITAL MANAGEMENT

Department of Certification and Staffing382/386/658
M I S S I O N The Department of
Certification and Staffing (DCS) is committed
to promoting workforce excellence by
recruiting, hiring, and retaining highly
qualified, diverse individuals and providing
certification services for teaching, supporting
services, and substitute positions through
a variety of human capital management
structures and processes that support and
sustain student achievement for all students.
MAJOR FUNCTIONSTalent Acquisition
The Talent Acquisition Initiatives Unit (TAIU) leads all talent acquisition initiatives including implementa-tion of the teacher workforce diversity strategic plan, higher education partnerships, and administrative and supervisory staffing and recruitment. TAIU supports the development and implementation of diversity and inclusion strategies, initiatives, and programs to sup-port employee success and retention. An essential func-tion of TAIU is the collaboration with the Teacher and Supporting Services Staffing Teams centered on staff-ing and recruitment, workforce planning, and strategic analytics/methodologies with other human resources directors across the MCPS human resources team. In addition, TAIU manages MCPS preemployment and recruitment partnerships with local universities to increase the number of applicants in critical shortage areas. This ensures vast applicant pools of qualified people with diverse backgrounds and experiences to employ in schools and offices.
For FY 2018, TAIU will utilize a strategic recruiting plan, including participating in on-campus seminars with education majors and utilizing new marketing and advertising efforts that will be focused on social media, theater media, and print media to attract diverse candi-dates from various areas. In addition, TAIU will continue to forge partnerships with local apartment management companies to ensure that the educators who are relo-cating have housing options available. Data collection methods will be deliberate and focused on ensuring that each recruitment and marketing effort yields an effec-tive, diverse workforce.
Teacher and Supporting Services Staffing Teacher and Supporting Services Staffing (TSST) recruits, hires, and conducts selection and assessment processes for all teachers and supporting services staff. The depart-ment recruits nationwide to ensure that teacher and supporting services positions are filled from a broad, diverse, and high-quality applicant pool. The Teacher Staffing Team works in tandem with TAIU to establish a recruitment plan that prioritizes developing a diverse candidate pool that will result in a diverse workforce. The staffing teams interview and evaluate the credentials of all candidates and works closely with school-based administrators and program managers to hire the most qualified applicants to work with students. The depart-ment also works in collaboration with other departments within the Office of the Chief Operating Officer and the Office of the Chief Financial Officer to ensure proper uti-lization of allocated resources.
For FY 2018, TSST will continue to use strategic and continuous improvement processes to build and main-tain excellent services to schools, ensuring efficient and timely operations; engage collaboratively and respect-fully with all schools, recognizing that they are our pri-mary customers; and align work across central services offices to strengthen collaboration and coordination to serve schools and ensure they have the support and resources necessary to meet the needs of students.
TSST is focused on streamlining the application pro-cess for interested candidates to apply through MCPS Careers; making the MCPS Careers application acces-sible and useable through mobile devices; redesigning the applicant reference format and process as well as interview questions used for teacher candidates; utiliz-ing MCPS “ambassadors” to support the recruitment and interview process; developing a new repository with all prequalified candidates for hiring managers to access throughout the hiring season; and restructuring the staffing teams to better align with the needs of schools.
Certification The Certification Unit focuses on Human Capital Man-agement to align systematic efforts to improve the skills and capabilities of the workforce that is responsible for ensuring students have the skills and knowledge needed to be college and career ready. The unit ensures that only qualified instructional professionals work directly with students. This unit evaluates the credentials of pro-spective and new to MCPS teachers, administrators, and specialists; evaluates educator records for endorse-ment requests; processes all certificate-related requests through the Maryland State Department of Education
CHAPTER 9 – 8 HUMAN CAPITAL MANAGEMENT

Department of Certification and Staffing382/386/658
(MSDE) Educator Information System; maintains certi-fication records for all educators; monitors and informs educators of requirements to renew certificates; moni-tors and informs educators of requirements to maintain any national licenses; and implements the Maryland Quality Teacher Incentive Act.
Additionally, the unit monitors local contingencies and state requirements for compliance; complies with state audits for Title I and related MSDE requests; processes requests for salary lane changes and national license supplements for educators on the A–D professional salary schedule; provides post-baccalaureate records requested by educators; and reviews professional leave requests and clearance for professional and supporting services staff.
Substitute Management The Substitute Management Team uses strategic plan-ning and continuous improvement process to build and maintain excellent services to schools ensuring efficient and timely operations. The department interviews and evaluates the credentials of all candidates to acquire and provide highly-qualified and competent substitutes during the absences of classroom teachers (short- and long-term assignments) and paraeducators (short-term assignments). The Substitute Calling Office works collab-oratively with school staff, employees, the Montgomery County Education Association, and substitute teachers. The Substitute Calling Office ensures that our Substitute Employee Management System allows classroom teach-ers, special education paraeducators, substitutes, and administrators to prearrange substitute assignments; match teachers to the most highly-qualified substitutes available; integrate with the Human Resources Informa-tion System to more efficiently track employee leave and time; use text-to-speech and attach lesson plans to pre-pare substitutes for assignments; improve the monitor-ing of staff absences; and more easily identify substitutes in their schools through enhanced reporting capabilities.
MEASURESM E A S U R E : Percentage of filled vacancies for teaching positions at the opening of school.
FY 2016Actual
FY 2017Estimate
FY 2018Recommended
93% 95% 100%
E X P L A N A T I O N : This measure reports the percentage of vacant teacher-level positions filled with qualified contracted teachers.
M E A S U R E : The percentage of fill rate for teacher absences.
FY 2016Actual
FY 2017Estimate
FY 2018Recommended
93% 94% 95%
E X P L A N A T I O N : This measure reports the percentage of filled rate for teacher absences.
OVERVIEW OF BUDGET CHANGES
FY 2018 RECOMMENDED BUDGET
The FY 2018 recommended budget for this
department is $3,832,626, an increase of $358,319
over the current FY 2017 budget. An explanation of
this change follows.
Same Service Level Changes—$218,424Realignments to Meet Expenditure Requirements and Program Priorities—$218,424 There are several realignments budgeted to address priority spending needs within this department. There is a budget neutral realignment of $17,745 from adver-tising to fund other needs areas in this department; $3,970 for local travel mileage reimbursement, $6,000 for dues, registrations and fees, $4,000 for program sup-plies, and $3,775 for supporting service part-time sala-ries. In addition, there are several realignments from other departments to address spending needs areas in this department; $202,749 from the Department of Pro-fessional Growth Systems (DPGS) and $8,459 from the Department of Employee and Retiree Services to fund 2.0 coordinator positions, $3,593 from the Office of the Associate Superintendent for Human Resources and Development (OHRD) and $15,616 from DPGS to fund a 0.5 staffing assistant position, and $3,007 from OHRD to fund supporting service part-time salaries. Further-more, there is a realignment of $15,000 for consultant services from this department to the OHRD.
Strategic Accelerators—$139,895Intensify Equity and Excellence in Hiring—$139,895In FY 2018, 1.5 staffing assistant positions and $64,895, $35,000 for staff development stipends, $35,000 for pro-gram supplies and $5,000 for out of area travel reim-bursement is added to intensify equity and excellence in MCPS hiring efforts, in addition to expanding and accelerating recruiting efforts to develop and retain employees.
CHAPTER 9 – 9 HUMAN CAPITAL MANAGEMENT
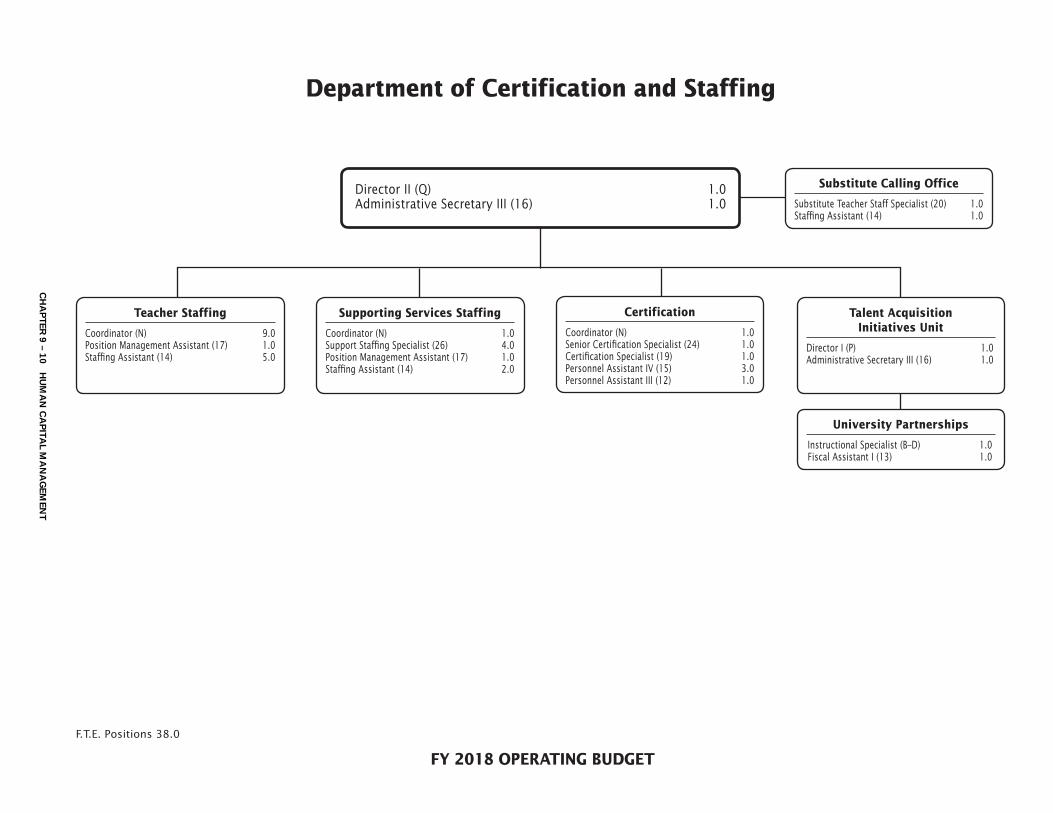
FY 2018 OPERATING BUDGET
F.T.E. Positions 38.0
Department of Certification and Staffing
Director II (Q) 1.0Administrative Secretary III (16) 1.0
Supporting Services Staffing
Coordinator (N) 1.0Support Staffing Specialist (26) 4.0Position Management Assistant (17) 1.0Staffing Assistant (14) 2.0
Certification
Coordinator (N) 1.0Senior Certification Specialist (24) 1.0Certification Specialist (19) 1.0Personnel Assistant IV (15) 3.0Personnel Assistant III (12) 1.0
Talent Acquisition Initiatives Unit
Director I (P) 1.0Administrative Secretary III (16) 1.0
Teacher Staffing
Coordinator (N) 9.0Position Management Assistant (17) 1.0Staffing Assistant (14) 5.0
Substitute Calling Office
Substitute Teacher Staff Specialist (20) 1.0Staffing Assistant (14) 1.0
University Partnerships
Instructional Specialist (B–D) 1.0Fiscal Assistant I (13) 1.0
CH
AP
TER 9 – 10 H
UM
AN
CA
PITA
L MA
NA
GEM
ENT

Department of Certification and Staffing - 382/386/658
Actual FY 2017Budget
FY 2017Current
FY 2018Request
FY 2018
Summer EmploymentProfessional Substitutes
Total Positions (FTE)Position Salaries
25.000$2,775,908
34.000$3,235,739
34.000$3,242,389
38.000$3,537,701
Other Salaries
01 Salaries & Wages
Stipends 35,000 35,000Professional Part Time
ConsultantsOther Contractual
OfficeOther Supplies & Materials
MediaInstructional Supplies & Materials
Textbooks
Subtotal Other Salaries
Leased Equipment
Grand Total
Other Equipment
Total Salaries & Wages
02 Contractual Services
Total Contractual Services
03 Supplies & Materials
Total Supplies & Materials
04 Other
Total Other
05 Equipment
Total Equipment
Supporting Services Part TimeOther
19,868 13,2185,000
15,0005,0001,782
26,872
15,00059,975
74,975
15,00059,975
74,975
42,230
42,230 (32,745)
(17,745)(15,000)
10,138
3,000
3,000
3,000
3,000
42,000
42,000
39,000
39,000
2,816,032 3,255,607 3,255,607 3,592,701 337,094
40,124 19,868 13,218 55,000 41,782
$3,052,179 $3,474,307 $3,474,307 $3,832,626 $358,319
ChangeDescription FY 2016
4.000$295,312
Insur & Employee BenefitsUtilitiesMiscellaneous
199,137
110,000
140,725
110,000
140,725
110,000
155,695 14,970
Local/Other Travel 30,725 30,725 45,695 14,970
CHAPTER 9 – 11 HUMAN CAPITAL MANAGEMENT

DESCRIPTION CURRENTFYBUDGET
FYACTUAL
20172016 10Mon
FY 2017CAT CHANGE
2018FY
Department of Certification & Staffing - 382/386/658
REQUEST
2018FY
382 Dept of Certification & Staffing
1 1.000 1.000 1.000Director IIQ 1.000
1 8.000 9.000 9.000CoordinatorN 2.00011.000
1 4.000 4.000 4.000Support Staffing Specialist26 4.000
1 1.000 1.000Sr. Certification Specialist24 1.000
1 1.000 1.000 1.000Substitute Teacher Staff Spec20 1.000
1 1.000 1.000Certification Specialist19 1.000
1 2.000 2.000 2.000Position Management Assistant17 2.000
1 1.000Administrative Secretary III16 1.0001.000
2 1.000 1.000Administrative Secretary III16 (1.000)1 3.000 3.000Personnel Assistant IV15 3.000
1 6.000 6.000 6.000Staffing Assistant14 2.0008.000
1 1.000 1.000Personnel Assistant III12 1.000
23.000 30.000 30.000Subtotal 4.00034.000
386 Talent Acquisition Initiatives Unit
1 1.000Director IP 1.000
1 1.000SupervisorO 1 1.000 1.000Administrative Secretary III16 1.000
2.000 2.000Subtotal 2.000
658 University Partnerships
2 1.000 1.000 1.000Instructional SpecialistBD 1.000
2 1.000 1.000 1.000Fiscal Assistant I13 1.000
2.000 2.000 2.000Subtotal 2.000
34.00025.000 34.000Total Positions 4.00038.000
CHAPTER 9 – 12 HUMAN CAPITAL MANAGEMENT

Department of Performance Evaluation and Compliance385
M I S S I O N The Department of
Performance Evaluation and Compliance
(DPEC) is committed to providing outstanding
customer service to principals and
supervisors by providing comprehensive
background checks of new employees,
managing the evaluation process for the
three professional growth systems, and
supporting schools and offices in addressing
employee issues.
MAJOR FUNCTIONSDPEC focuses on building a positive, supportive culture of trust and respect that is based on collaboration and strong relationships to improve school and system per-formance. Our work in this area includes the following responsibilities:
• Conduct background checks for approximately 3,000 employees and 3,500 contractors annually.
• Conduct fingerprint background checks for 5,000 to 8,000 parent volunteers.
• Administer preemployment tests for candidates for various supporting services positions.
• Maintain employment records for all 23,000 employees.• Manage the evaluation process for approximately
9,000 employees annually.• Provide support and guidance to principals and
supervisors in addressing employee issues.• Conduct Child Protective Services background checks
for all new and current MCPS employees. Current employees will be completed over a multi-year process.
• Support schools with the implementation of two newly enacted regulations, Regulation ACH-RA, Workplace Bullying, and Regulation GCC-RA, Staff Self-Report-ing of Arrests, Criminal Charges, and Convictions.
DPEC also focuses on engaging collaboratively and respectfully with all schools recognizing that they are our primary customers. We use strategic planning and continuous improvement processes to build and main-tain excellent service to schools by ensuring efficient and timely operations with regard to investigations into allegations of employee misconduct. DPEC also uses data to evaluate our services and to guide improvement efforts throughout our department. DPEC is responsible for investigating allegations involving:
• Employee misconduct related to various MCPS poli-cies and regulations
• Workplace bullying, particularly allegations in which the supervisor is accused of the bullying behavior
• Allegations of Equal Employment Opportunity Com-mission violations
Given the time-sensitive nature of allegations in each of these areas, DPEC will focus this year on reducing the average length of time it takes to resolve issues that are brought to the department. Data will be maintained as part of our record keeping to monitor the time taken to complete the investigation.
MEASURESM E A S U R E : Reduce the average length of time for DPEC investigations.
FY 2016Actual
FY 2017Estimate
FY 2018Recommended
35 days 25 days 20 days
E X P L A N A T I O N : By reducing the average length of time it takes to complete an investigation, this will limit disruption to the instructional program and workplace
M E A S U R E : Reduce the average length of time to resolve ADA requests for accommodations.
FY 2016Actual
FY 2017Estimate
FY 2018Recommended
17 days 15 days 15 days
E X P L A N A T I O N : It is incumbent upon DPEC to address ADA issues as expeditiously as possible in order to ensure that the employee has the essential accommodations in order to perform his/her duties in a satisfactory manner.
CHAPTER 9 – 13 HUMAN CAPITAL MANAGEMENT

Department of Performance Evaluation and Compliance385
OVERVIEW OF BUDGET CHANGES
FY 2018 RECOMMENDED BUDGET
The FY 2018 recommended budget for this
department is $850,873, an increase of $8,604 over
the current FY 2017 budget. An explanation of this
change follows.
Same Service Level Changes—$8,604Realignments to Meet Expenditure Requirements and Program Priorities—$8,604There are a number of realignments budgeted to address priority spending needs within this department. There is a budget neutral realignment in this department of $20,793 from supporting service part-time salaries and $10,000 from health evaluations, in addition to $8,044 from the Department of Professional Growth Systems (DPGS), to fund a 1.0 secretary position in this depart-ment. Furthermore, there is a realignment of $560 for local travel mileage reimbursement from DPGS.
CHAPTER 9 – 14 HUMAN CAPITAL MANAGEMENT
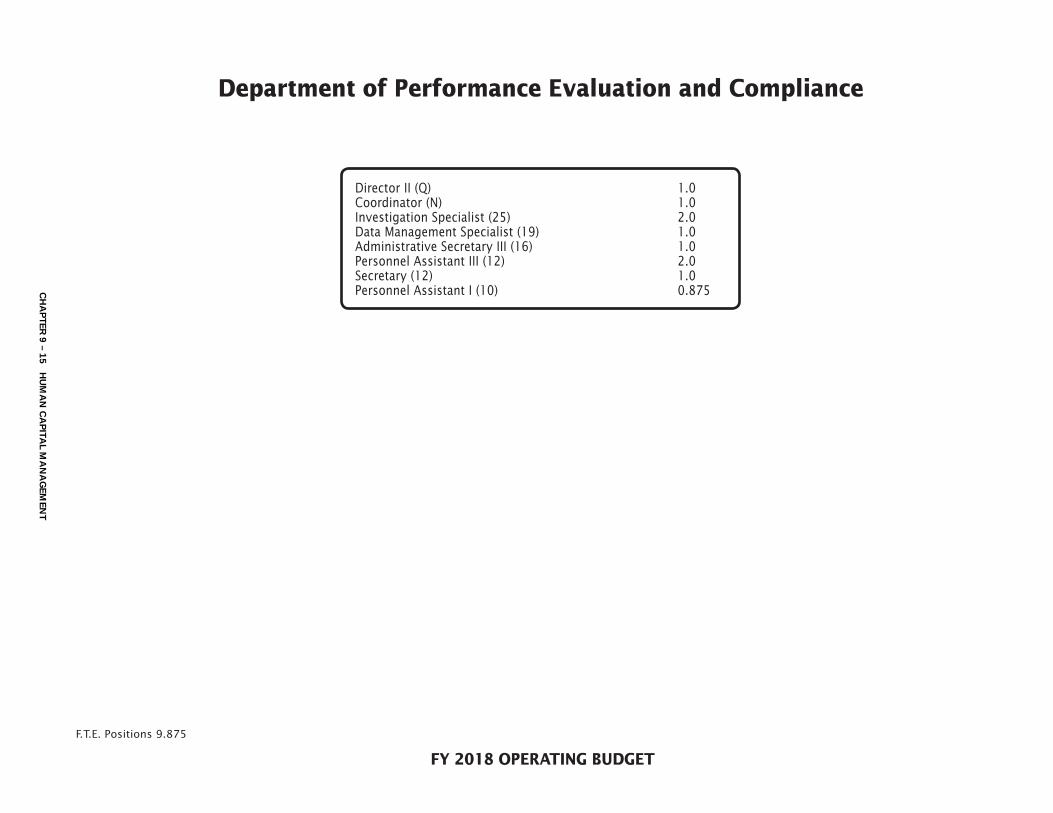
FY 2018 OPERATING BUDGET
F.T.E. Positions 9.875
Department of Performance Evaluation and Compliance
Director II (Q) 1.0Coordinator (N) 1.0Investigation Specialist (25) 2.0Data Management Specialist (19) 1.0Administrative Secretary III (16) 1.0Personnel Assistant III (12) 2.0Secretary (12) 1.0Personnel Assistant I (10) 0.875C
HA
PTER
9 – 15 HU
MA
N C
AP
ITAL M
AN
AG
EMEN
T
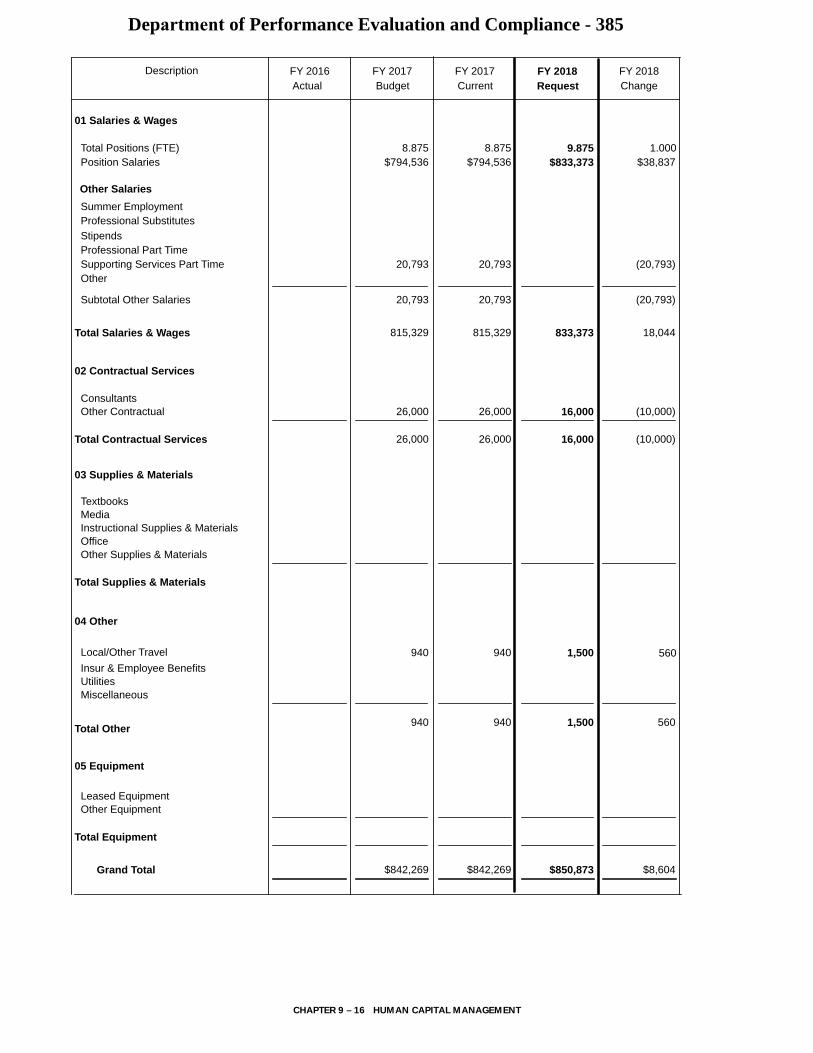
Department of Performance Evaluation and Compliance - 385
Actual FY 2017Budget
FY 2017Current
FY 2018Request
FY 2018
Summer EmploymentProfessional Substitutes
Total Positions (FTE)Position Salaries
8.875$794,536
8.875$794,536
9.875$833,373
Other Salaries
01 Salaries & Wages
StipendsProfessional Part Time
ConsultantsOther Contractual
OfficeOther Supplies & Materials
MediaInstructional Supplies & Materials
Textbooks
Subtotal Other Salaries
Leased Equipment
Grand Total
Other Equipment
Total Salaries & Wages
02 Contractual Services
Total Contractual Services
03 Supplies & Materials
Total Supplies & Materials
04 Other
Total Other
05 Equipment
Total Equipment
Supporting Services Part TimeOther
20,793 20,793 (20,793)
26,000
26,000
26,000
26,000
16,000
16,000 (10,000)
(10,000)
815,329 815,329 833,373 18,044
20,793 20,793 (20,793)
$842,269 $842,269 $850,873 $8,604
ChangeDescription FY 2016
1.000$38,837
Insur & Employee BenefitsUtilitiesMiscellaneous
940 940 1,500 560
Local/Other Travel 940 940 1,500 560
CHAPTER 9 – 16 HUMAN CAPITAL MANAGEMENT

DESCRIPTION CURRENTFYBUDGET
FYACTUAL
20172016 10Mon
FY 2017CAT
Department of Performance Evaluation and Compliance - 385
FY 2018CHANGE
FY 2018
REQUEST
1 1.000 1.000Director IIQ 1.000
1 1.000 1.000CoordinatorN 1.000
1 1.000 1.000Investigation Specialist25 1.0002.000
2 1.000 1.000Investigation Specialist25 (1.000)1 1.000 1.000Data Management Specialist19 1.000
1 1.000 1.000Administrative Secretary III16 1.000
1 Secretary12 1.0001.000
1 2.000 2.000Personnel Assistant III12 2.000
1 .875 .875Personnel Assistant I10 .875
8.875 8.875Total Positions 9.875 1.000
CHAPTER 9 – 17 HUMAN CAPITAL MANAGEMENT

Department of Professional Growth Systems384/654/656/665/915/917/660/961
M I S S I O N The mission of the
Department of Professional Growth Systems
(PGS) is threefold: 1) to establish and clarify
standards of performance for all employees,
including administrators, teachers, and
support professionals; 2) to provide
support to employees who need additional
assistance; and 3) to support a collaborative
process used to measure each employee’s
job performance.
MAJOR FUNCTIONSSupport for Novice and Underperforming Teachers
The human capital management function of the Con-sulting Teacher Team is to support novice and under-performing teachers through ongoing coaching, modeling, observation, and review. Consulting teachers provide intensive, individualized instructional support and resources to teachers based on observational data and student achievement data from multiple sources in order to raise student achievement for all students and to close achievement gaps. Consulting teachers’ casel-oads are comprised of both novice and underperform-ing teachers and are dependent on the number of novice teachers hired in a year and the number of teachers identified as underperforming. An implementation team ensures that the work of the Teacher Professional Growth System (PGS) is put into practice at a high-quality level.
The Consulting Teacher Team focus on operational excel-lence uses data to evaluate and continually improve pro-grams and services. In FY 2016, the team’s plan focused on improving the rate of meets standard evaluations for tenured teachers referred to the Peer Assistance and Review (PAR) process. Based on the results from FY 2016, the team is focusing its efforts on implementing identi-fied best practices, including fostering a growth mindset and a reflective stance, writing student learning objec-tives (SLOs), and engaging in professional development strategies to meet the needs of tenured teachers.
Support for PrincipalsThe human capital management function of the Con-sulting Principals Team is to provide individualized sup-port to novice principals, principals who have moved to a new level (elementary, middle, or high school),
principals new to MCPS, principal interns, and princi-pals and other administrators who have been identified as underperforming. Individualized support is based on observational data and student achievement data from multiple sources and is delivered in the form of individ-ual mentoring, coaching, providing feedback on both formal and informal observations, and working closely with the principals’ school leadership teams and school improvement teams on raising student achievement for all students and closing achievement gaps. The con-sulting principal collaborates with the directors in the Office of School Support and Improvement (OSSI) and the Principals PAR Panel team members.
The Consulting Principal Team focus on operational excellence uses data to evaluate and continually improve programs and services. In FY 2016, the team’s plan focused on improving the rate of meets standard evaluations for novice principals, acting principals, and principals new to the district by differentiating coaching and supports. In FY 2017, the team is focusing its efforts on strategies to reduce achievement gaps by coaching principals on data analysis and instructional strategies for their school improvement process and their SLOs.
Skillful Teaching and LeadingThe human capital management functions of the Skill-ful Teaching and Leading (STL) Team are the train-ing and support of staff to implement the knowledge, skills, strategies, beliefs, and practices of six courses taught by the team in support of the MCPS PGS. The core knowledge presented in the STL courses focuses on raising student achievement for all students, closing achievement gaps, and professional learning through expert instruction and leadership. Human capital man-agement also is enhanced through aligning systemic efforts to improve the skills of the administrative work-force through professional development provided to first- and second-year assistant principal cohorts in the Leadership Development Program, the team’s delivery of both the OAT1 Recertification for the Assistant Prin-cipal/Assistant School Administrator promotional pool sessions, and the OAT1 Update sessions for leaders.
The STL Team focus on operational excellence is cen-tered on courses built on the premise that effective effort and belief in continuous improvement processes create a cycle of motivation and success.
In FY 2016, the team’s plan focused on insuring that all course participants identify and implement research-based strategies to eliminate achievement gaps. In FY 2017, the team’s focus is on refining the instructional strategies in the courses to enable participants to imple-ment gap-reduction strategies in their schools.
CHAPTER 9 – 18 HUMAN CAPITAL MANAGEMENT

Department of Professional Growth Systems384/654/656/665/915/917/660/961
Supporting Services Professional Growth SystemsThe human capital management function of the Sup-porting Services PGS (SSPGS) team includes an evalu-ation process, training and development opportunities, career pathways options, and a peer assistance program for underperforming staff. When a support professional is identified as not meeting competency due to his/her performance, one of the options provided by the SSPGS is support from a professional growth consultant (PGC). Individualized support is based on observational data and data from multiple sources and is delivered in the form of individual mentoring, coaching, and providing feedback on performance. The SSPGS also includes:
• Professional development for employees new to supervisory positions in which a PGC is assigned to each new supervisor to provide coaching and resource assistance to that employee during his/her 6 month probationary period in the new job.
• The Career Pathways Program supports employees to identify career goals and obtain training and direc-tion to attain those goals. The Career Pathways Pro-gram offers opportunities for employees to improve their knowledge and skills in content areas in order to reach their career goals.
• The Supporting Services Training and Development (SSTD) program provides professional development experiences that are aligned with the seven core com-petencies identified in the SSPGS. Trainings include face to-face computer classes; school finance train-ing; English language instruction courses; training for new and aspiring supervisors; curriculum, technol-ogy tools, and instructional strategies for paraeduca-tors; and training on technology and data software for instructional data analysts. Attendance at FY 2016 trainings totaled 3,304.
An implementation team ensures that the work of SSPGS is aligned with the 2016–2017 priorities and put into practice at a high-quality level.
The SSPGS Team focus on operational excellence uses data to evaluate and continually improve programs and services. In FY 2016, the team’s plan focused on increas-ing participation in trainings in courses such as SSPGS Evaluator Training: Effective Documentation for the Support Professional Evaluation, in order to provide professional development resulting in excellent services to schools and offices. In FY 2017, the team’s plan focuses on completing training for experienced assistant princi-pals and school business administrators and developing a plan for training principals and other administrative and supporting services supervisors.
New Teacher Induction The human capital management function of the New Teacher Induction (NTI) Program is to welcome and orient all new educators into the school district and prepare them to succeed in their positions by becom-ing fully engaged, productive members of their school and of the school system. The program provides a com-prehensive induction program to all educators new to MCPS through a seamless, consistent and positive expe-rience for all new hires. It includes orientation, peer sup-port, courses, mentoring, and workshops to enhance instructional practices and ensure professional growth in order to promote achievement for all students and close achievement gaps.
The NTI focus on operational excellence uses data to evaluate and continually improve programs and ser-vices. In FY 2016, the program’s plan focused on increas-ing the number of mentors assigned to experienced new-to-MCPS educators in order to support their effec-tiveness raising student achievement for all students and closing achievement gaps.
MEASURES M E A S U R E : Percentage of tenured teachers referred to PAR who successfully meet standard on their evaluations.
FY 2016Actual
FY 2017Estimate
FY 2018Recommended
39% 40% 41%
E X P L A N A T I O N : This measure (percentage of tenured teachers meeting standard of their evaluations) represents the goal of supporting a group of experienced teachers referred for PAR support.
CHAPTER 9 – 19 HUMAN CAPITAL MANAGEMENT

Department of Professional Growth Systems384/654/656/665/915/917/660/961
M E A S U R E : Percentage of participants (experienced assistant principals, school business administrators) who complete the course SSPGS Evaluator Training: Effective Documentation for the Support Professional Evaluation.
FY 2016Actual
FY 2017Estimate
FY 2018Recommended
SSPGS Evaluator Training * 85% 95%
E X P L A N A T I O N : This measure is a new goal (therefore FY 2017 is a baseline year) and represents a new level of the team’s work by confirming that all experienced assistant principal and school business administrator participants complete the course and possess the skills to implement SSPGS including the evaluation process.
M E A S U R E : Percentage of experienced new-to-MCPS educators assigned mentors.
FY 2016Actual
FY 2017Estimate
FY 2018Recommended
94% 95% 96%
E X P L A N A T I O N : Data indicates that participants report that the courses offered through the New Teacher Induction Program are relevant and support improved instructional practices. This measure was established to insure that all teachers receive the support they need to provide high quality teaching and learning.
OVERVIEW OF BUDGET CHANGES
Department of Professional Growth Systems (DPGS)
FY 2018 RECOMMENDED BUDGET
The FY 2018 recommended budget for this
department is $2,970,088, a decrease of $751,687
from the current FY 2017 budget. An explanation of
this change follows.
Same Service Level Changes—($593,498)Realignments to Meet Expenditure Requirements and Program Priorities—($593,498) Realignments are budgeted to address priority spend-ing needs within this department. There is a budget neutral realignment of $8,928 from teacher mentor sala-ries to fund a 0.1 increase to the existing central office teacher position, in addition to a realignment of $1,751 from program supplies to contractual services.
There are several realignments from this department to other needs areas in the Office of Human Resources and
Development. There is a realignment of a 1.0 director I position and $111,939, in addition to 2.5 instructional specialist positions and $255,790, to the Professional Growth Systems for Teachers program to fund 3.5 con-sulting teacher positions.
Furthermore, $5,561 from local travel mileage reim-bursement, $7,161 from program supplies, $6,624 from substitute teacher salaries, $3,134 from teacher mentor salaries, and 3.0 professional growth consultant posi-tions and $194,685 are realigned to the Department of Certification and Staffing (DCS) to fund 2.0 coordinator positions and a 0.5 staffing assistant position. In addi-tion, $8,044 from teacher mentor salaries is realigned to fund a 1.0 secretary position, and $560 is realigned from local travel mileage reimbursement to fund this same resource in the Department of Performance Evaluation and Compliance (DPEC).
Program Efficiencies and Reductions—($158,189)The FY 2018 recommended budget for this department includes a comprehensive effort to identify potential program efficiencies and reductions. Stakeholders, including community partners and employee union representatives, participated in the program efficiencies and reduction process.
There is a reduction of a 1.0 consulting principal posi-tion and $158,189. Responsibilities will be absorbed by the remaining 2.0 consulting principal positions in this department.
Grant: Title II, Part A Improving Teacher Quality, Skillful Teaching and Leading Program
FY 2018 RECOMMENDED BUDGET
The FY 2018 recommended budget for this
program is $874,542, an increase of $523,339 over
the current FY 2017 budget. An explanation of this
change follows.
Other—$523,339Beginning in FY 2018, a regulation change for the Title II, Part A–Improving Teacher Quality grant will allow non-public educational entities to receive an increased allo-cation of the total grant funds allocated to Montgomery County Public Schools (MCPS). Therefore, $417,343 is realigned from the consulting teacher program to sup-port the need for additional funding, in addition to an overall budget increase for this program of an additional $105,996.
CHAPTER 9 – 20 HUMAN CAPITAL MANAGEMENT

Department of Professional Growth Systems384/654/656/665/915/917/660/961
Program’s Recent Funding HistoryFY 2017Budgeted7/1/16
FY 2017Projected11/30/16
FY 2018Projected7/1/17
Federal $351,203 $432,683 $874,542
Total $351,203 $432,683 $874,542
Grant: Title II, Part A Improving Teacher Quality, Teacher Mentoring Program
The FY 2018 recommended budget for this program of $253,720 is unchanged from the current FY 2017 budget.
Program’s Recent Funding HistoryFY 2017Budgeted7/1/16
FY 2017Projected11/30/16
FY 2018Projected7/1/17
Federal $253,720 $172,240 $253,720
Total $253,720 $172,240 $253,720
Professional Growth Systems for Teachers
FY 2018 RECOMMENDED BUDGET
The FY 2018 recommended budget for this
program is $1,453,605, an increase of $564,683
over the current FY 2017 budget. An explanation of
this change follows.
Same Service Level Changes—$564,683Realignments to Meet Expenditure Requirements and Program Priorities—$564,683Realignments are budgeted to address priority spend-ing needs in this program. There is realignment of $367,729 from DPGS to this program to fund 3.5 consult-ing teacher positions, in addition to a shift of 2.0 con-sulting teacher positions and $198,154 from the grant funded portion of this program. Furthermore, there is a realignment of $1,200 from program supplies to DCS.
Grant: Title II, Part A Improving Teacher Quality, Consulting Teacher Program
FY 2018 RECOMMENDED BUDGET
The FY 2018 recommended budget for this
program is $2,211,828, a decrease of $690,343
from the current FY 2017 budget. An explanation of
this change follows.
Salaries and Wages—($504,690)Beginning in FY 2018, a regulation change for the Title II, Part A–Improving Teacher Quality grant will allow non-public educational entities to receive an increased allocation of the total grant funds allocated to MCPS. Therefore, $231,690 is realigned from this program to the skillful teaching and leading program. In addition, it is projected that the funding allocation to MCPS for this grant will continue to decrease over the next several years, therefore, 2.0 consulting teacher positions and $198,154 is shifted to the local portion of the program, in addition to $74,846 to the Department of Employee and Retiree Services to support employee benefits.
Other—($185,653)There is a realignment of $185,653 to the skillful teaching and leading program to support the increased need for funding in the non-public educational entity portion of the program.
Program’s Recent Funding HistoryFY 2017Budgeted7/1/16
FY 2017Projected11/30/16
FY 2018Projected7/1/17
Federal $2,902,171 $2,846,399 $2,221,828
Total $2,902,171 $2,846,399 $2,221,828
CHAPTER 9 – 21 HUMAN CAPITAL MANAGEMENT

FY 2018 OPERATING BUDGET
F.T.E. Positions 34.6
(In addition, there are 18.0 positions funded by the Title II, Part A grant.)
Department of Professional Growth Systems
Director II (Q) 1.0Consulting Principal (Q) 2.0Administrative Secretary III (16) 1.0
Onboarding, Induction and Growth
MCAAP Liaison to MCPS PGS (Q) 1.0Instructional Specialist (B–D) 1.0Teacher (A–D) 1.0Secretary (12) 0.5
Skillful Teaching and Leading
Specialist (M) 1.0*Instructional Specialist (B–D) 2.0Administrative Secretary II (15) 1.0
Professional Growth System for Supporting Services Staff
Teacher (A–D) 0.6Staff Development Specialist (26) 1.0Liaison–Supporting Services PGS (26) 1.0Coordinator Paraeducator Program (24) 1.0Professional Growth Consultant (23) 4.0Administrative Secretary I (14) 1.0
Professional Growth System for Teachers
Consulting Teacher (B–D) 14.5Consulting Teacher (B–D) 17.0*Administrative Secretary I (14) 1.0
CH
AP
TER 9 – 22 H
UM
AN
CA
PITA
L MA
NA
GEM
ENT
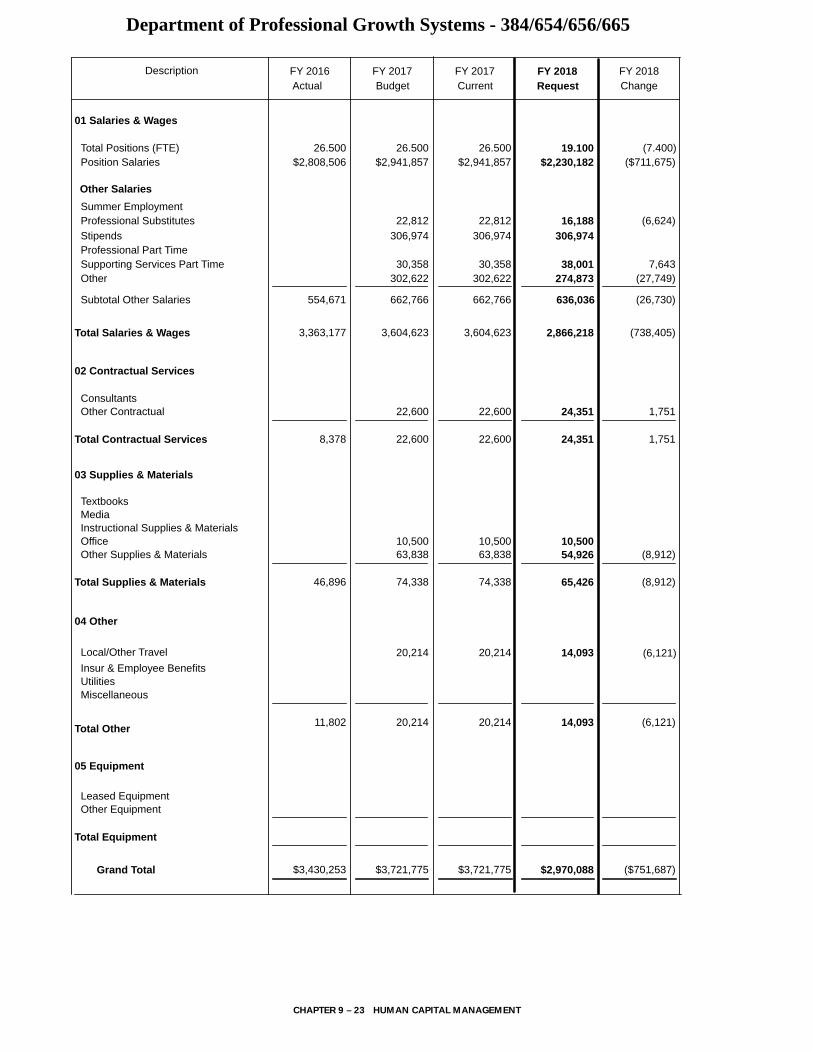
Department of Professional Growth Systems - 384/654/656/665
Actual FY 2017Budget
FY 2017Current
FY 2018Request
FY 2018
Summer EmploymentProfessional Substitutes (6,624)
Total Positions (FTE)Position Salaries
26.500$2,808,506
26.500$2,941,857
26.500$2,941,857
19.100$2,230,182
Other Salaries
01 Salaries & Wages
22,812 22,812 16,188
Stipends 306,974 306,974 306,974Professional Part Time
ConsultantsOther Contractual
OfficeOther Supplies & Materials
MediaInstructional Supplies & Materials
Textbooks
Subtotal Other Salaries
Leased Equipment
Grand Total
Other Equipment
Total Salaries & Wages
02 Contractual Services
Total Contractual Services
03 Supplies & Materials
Total Supplies & Materials
04 Other
Total Other
05 Equipment
Total Equipment
Supporting Services Part TimeOther
30,358 30,358 38,001274,873 (27,749)
7,643
8,378
22,600
22,600
22,600
22,600
24,351
24,351 1,751
1,751
46,896
10,50063,838
74,338
10,50063,838
74,338
10,50054,926
65,426
(8,912)
(8,912)
3,363,177 3,604,623 3,604,623 2,866,218 (738,405)
302,622 302,622
554,671 662,766 662,766 636,036 (26,730)
$3,430,253 $3,721,775 $3,721,775 $2,970,088 ($751,687)
ChangeDescription FY 2016
(7.400)($711,675)
Insur & Employee BenefitsUtilitiesMiscellaneous
11,802 20,214 20,214 14,093 (6,121)
Local/Other Travel 20,214 20,214 14,093 (6,121)
CHAPTER 9 – 23 HUMAN CAPITAL MANAGEMENT

DESCRIPTION CURRENTFYBUDGET
FYACTUAL
20172016 10Mon
FY 2017CAT CHANGE
2018FY
Department of Professional Growth Systems - 384/654/656/665
REQUEST
2018FY
384 Department of Professional Growth Systems
2 1.000 1.000 1.000Director IIQ 1.000
2 3.000 3.000 3.000Consulting PrincipalQ (1.000)2.000
2 1.000 1.000 1.000Administrative Secretary III16 1.000
5.000 5.000 5.000Subtotal (1.000)4.000
654 Onboarding Induction & Professional Growth
2 1.000 1.000 1.000MCAAP Liaison to MCPS PGSQ 1.000
3 1.000 1.000 1.000Instructional SpecialistBD 1.000
3 1.000 1.000 1.000TeacherAD 1.000
2 .500 .500 .500Secretary12 .500
3.500 3.500 3.500Subtotal 3.500
656 Prof. Growth System-Support Services Employ
3 .500 .500 .500XCentral Off TeacherAD .100.600
2 1.000 1.000 1.000Staff Development Specialist26 1.000
2 1.000 1.000 1.000Liaison - Supporting Svcs PGS26 1.000
3 1.000 1.000 1.000Coordinator Paraeducator Prog24 1.000
3 7.000 7.000 7.000Professional Growth Consultant23 (3.000)4.000
2 1.000 1.000 1.000Administrative Secretary I14 1.000
11.500 11.500 11.500Subtotal (2.900)8.600
665 Skillful Teaching and Leading
2 1.000 1.000 1.000Director IP (1.000)3 4.500 4.500 4.500Instructional SpecialistBD (2.500)2.000
2 1.000 1.000 1.000Administrative Secretary II15 1.000
6.500 6.500 6.500Subtotal (3.500)3.000
26.50026.500 26.500Total Positions (7.400)19.100
CHAPTER 9 – 24 HUMAN CAPITAL MANAGEMENT

Grant: Title II, Part A Skillful Teaching and Leading Program - 915
Actual FY 2017Budget
FY 2017Current
FY 2018Request
FY 2018
Summer EmploymentProfessional Substitutes
Total Positions (FTE)Position Salaries $82,715
1.000$123,496
1.000$123,496
1.000$123,496
Other Salaries
01 Salaries & Wages
70,000 70,000 70,000
StipendsProfessional Part Time
ConsultantsOther Contractual
OfficeOther Supplies & Materials
MediaInstructional Supplies & Materials
Textbooks
Subtotal Other Salaries
Leased Equipment
Grand Total
Other Equipment
Total Salaries & Wages
02 Contractual Services
Total Contractual Services
03 Supplies & Materials
Total Supplies & Materials
04 Other
Total Other
05 Equipment
Total Equipment
Supporting Services Part TimeOther
16,8916,466
16,8916,466
16,8916,466
33,167
32,880
32,880
32,880
32,880
32,880
32,880
85,472
5,000
5,000
5,000
5,000
5,000
5,000
112,237 216,853 216,853 216,853
29,522 93,357 93,357 93,357
$358,570 $351,203 $351,203 $874,542 $523,339
ChangeDescription FY 2016
Insur & Employee BenefitsUtilitiesMiscellaneous
127,694
96,470
96,470
96,470
96,470
16,880
602,929
619,809
(79,590)
602,929
523,339
Local/Other Travel602 929 602 929
CHAPTER 9 – 25 HUMAN CAPITAL MANAGEMENT

DESCRIPTION CURRENTFYBUDGET
FYACTUAL
20172016 10Mon
FY 2017CAT
Grant: Title II, Part A Skillful Teaching and Leading Program - 915
FY 2018CHANGE
FY 2018
REQUEST
3 1.000 1.000SpecialistM 1.000
1.000 1.000Total Positions 1.000
CHAPTER 9 – 26 HUMAN CAPITAL MANAGEMENT

Grant: Title II, Part A Teacher Mentoring Program - 917
Actual FY 2017Budget
FY 2017Current
FY 2018Request
FY 2018
Summer EmploymentProfessional Substitutes
Total Positions (FTE)Position Salaries
Other Salaries
01 Salaries & Wages
Stipends 61,200 61,200 61,200Professional Part Time
ConsultantsOther Contractual
OfficeOther Supplies & Materials
MediaInstructional Supplies & Materials
Textbooks
Subtotal Other Salaries
Leased Equipment
Grand Total
Other Equipment
Total Salaries & Wages
02 Contractual Services
Total Contractual Services
03 Supplies & Materials
Total Supplies & Materials
04 Other
Total Other
05 Equipment
Total Equipment
Supporting Services Part TimeOther 179,520
446,693 240,720 240,720 240,720
179,520 179,520
446,693 240,720 240,720 240,720
$481,545 $253,720 $253,720 $253,720
ChangeDescription FY 2016
Insur & Employee BenefitsUtilitiesMiscellaneous
34,852
13,000
13,000
13,000
13,000
13,000
13,000
Local/Other Travel
CHAPTER 9 – 27 HUMAN CAPITAL MANAGEMENT

Professional Growth System for Teachers - 660/961
Actual FY 2017Budget
FY 2017Current
FY 2018Request
FY 2018
Summer EmploymentProfessional Substitutes
Total Positions (FTE)Position Salaries
29.000$2,883,687
29.000$2,875,755
29.000$2,875,755
32.500$2,936,948
Other Salaries
01 Salaries & Wages
StipendsProfessional Part Time
ConsultantsOther Contractual
OfficeOther Supplies & Materials
MediaInstructional Supplies & Materials
Textbooks
Subtotal Other Salaries
Leased Equipment
Grand Total
Other Equipment
Total Salaries & Wages
02 Contractual Services
Total Contractual Services
03 Supplies & Materials
Total Supplies & Materials
04 Other
Total Other
05 Equipment
Total Equipment
Supporting Services Part TimeOther
895
2,500
2,500
2,500
2,500
1,300
1,300
(1,200)
(1,200)
2,883,687 2,875,755 2,875,755 2,936,948 61,193
$3,715,365 $3,791,093 $3,791,093 $3,665,433 ($125,660)
ChangeDescription FY 2016
3.500$61,193
Insur & Employee BenefitsUtilitiesMiscellaneous
830,783
879,938
912,838
879,938
912,838
694,285
727,185
(185,653)
(185,653)
Local/Other Travel 32,900 32,900 32,900
CHAPTER 9 – 28 HUMAN CAPITAL MANAGEMENT

DESCRIPTION CURRENTFYBUDGET
FYACTUAL
20172016 10Mon
FY 2017CAT CHANGE
2018FY
Professional Growth System for Teachers - 660/961
REQUEST
2018FY
660 Professional Growth System for Teachers
3 9.000 9.000 9.000XTeacher, ConsultingAD 5.50014.500
2 1.000 1.000 1.000Administrative Secretary I14 1.000
10.000 10.000 10.000Subtotal 5.50015.500
961 Grant - Title II, Part A - Consulting Tchr Prog.
3 19.000 19.000 19.000XTeacher, ConsultingAD (2.000)17.000
19.000 19.000 19.000Subtotal (2.000)17.000
29.00029.000 29.000Total Positions 3.50032.500
CHAPTER 9 – 29 HUMAN CAPITAL MANAGEMENT

Chapter 10
Administration and Oversight
Administration and Oversight PAGE
Board of Education ............................................................ 10-2
Office of the Superintendent of Schools ....................... 10-6
Chief of Staff .................................................................. 10-10
Office of Shared Accountability .................................... 10-15
Department of Communications .................................. 10-21
Television Special Revenue Fund ..................................... 10-26
Office of the General Counsel ....................................... 10-28

22.000
By Object of Expenditure
Summary of Resources
Administration and Oversight
(1.000)
OBJECT OF EXPENDITURE FY 2016 FY 2017 FY 2017 FY 2018 FY 2018ACTUAL BUDGET CURRENT BUDGET CHANGE
23.00023.000
103.500 103.500 1.75099.500
826,095
2,045,600 1,780,089 1,987,581
182,841 181,550
1,577,640
143,484
141,103
905,368
144,249
681,846 761,884 836,884 797,523 (39,361)
143,484 134,517 (8,967)
980,368 932,040 (48,328)
10,028,805
182,841
11,094,180 11,001,731 11,098,055 96,324
141,439
207,492
160,970
(1,291)
9,200151,770 151,770
341,822 401,785 401,785 358,519 (43,266)
65,905 58,724 58,724 58,724
549,166 612,279 612,279 578,213 (34,066)
6,204 6,204 25,000 18,796
$13,473,144 $13,870,399
POSITIONS
Administrative
TOTAL POSITIONS
01 SALARIES & WAGES
Administrative
OTHER SALARIES
Administrative
Professional
Supporting Services
TOTAL OTHER SALARIES
TOTAL SALARIES AND WAGES
02 CONTRACTUAL SERVICES
03 SUPPLIES & MATERIALS
04 OTHER
Local/Other Travel
Insur & Employee Benefits
Utilities
Miscellaneous
TOTAL OTHER
05 EQUIPMENT
GRAND TOTAL AMOUNTS
$3,058,613 $3,426,787 $3,255,026
105.250
TOTAL POSITION DOLLARS 9,202,710 10,188,812 10,021,363 10,166,015 144,652
$3,294,791 $39,765
$13,583,144 $287,255
18,204
$12,782,878
3.000 3.000 3.000
7.500 1.000
72.750 1.75071.000 71.0006.5006.500Professional
Supporting Services
22.0002.000
6.50069.000
772,672 846,261
5,732,134
73,589
5,665,330 66,804746,201
5,193,930772,672
5,661,018
Professional
Supporting Services
203,966 328,335 328,335 292,829 (35,506)Business/Operations Admin.
Business/Operations Admin.
CHAPTER 10 – 1 ADMINISTRATION AND OVERSIGHT

Board of Education711/623
M I S S I O N The mission of the Boardof Education is to provide leadership and oversight for a high-quality educational system with community-supported goals, policies, and resources committed to benefit our diverse student population. The Office of the Board of Education enables the elected Board members to function as a cohesive and effective body in performing its responsibilities to adopt educational policy, ensure accountability, promote intergovernmental relations, and respond to community and student concerns.
MAJOR FUNCTIONSDevelopment and Adoption of Educational Policy and Rules and Regulation for Managing the School System
The Board of Education (Board) determines, with the advice of the superintendent of schools, the educational policies of the county school system. It also adopts, codifies, and makes available to the public the rules and regulations for conducting and managing the public schools. The powers and mandatory duties of the Board of Education are defined in the Education Article of the Annotated Code of Maryland and Title 13A of the Code of Maryland Regulations. The Board’s primary functions, aligned to support the strategic planning framework, Building Our Future Together: Students, Staff, and Com-munity, for Montgomery County Public Schools (MCPS) include, but are not limited to, the following:
• Selecting and appointing the superintendent ofschools
• Adopting operating and capital budgets
• Making decisions on educational, budgetary, facility,and financial matters
• Establishing curriculum guides and courses of study
• Making continuous appraisal of the educational andadministrative management of the school system
• Establishing school boundaries
• Acting in a quasi-judicial capacity, in particular,deciding appeals
• Advancing a legislative agenda
• Appointing personnel
To carry out its duties, the Board usually meets twice each month, convening for one all-day meeting and one evening meeting. Other meetings are held to hear
appeals; review and act on budgets and facilities; pre-side over public hearings; meet with other elected offi-cials and public bodies; host community forums; hold parent, student, and employee meetings; and hold local, state, and national association meetings. In order to more efficiently perform fiscal oversight for the school district, beginning in FY 2017, the MCPS Internal Audit Unit reports directly to the Board of Education.
Community Stakeholder EngagementThe Board performs its functions as a committee of the whole and through the work of standing and ad hoc committees, including Fiscal Management, Policy Man-agement, Special Populations, and Strategic Planning. These committees all work in alignment with their indi-vidual charters and the strategic planning framework to further the mission of the Board of Education by provid-ing leadership and oversight of the school system.
The Board office works with the community and appro-priate MCPS offices to address concerns related to school-system decisions or actions. The office also researches and analyzes educational policies, practices, and budgets; coordinates all appeals before the Board; and provides legislative and intergovernmental information, as well as represents the Board’s positions on these matters. The office maintains all of the Board’s records and handles its correspondence, calendars, and meeting materials.
FY 2018 RECOMMENDED BUDGET
The FY 2018 recommended budget for this office is
$1,848,132, an increase of $30,000 over the current
FY 2017 budget. An explanation of this change follows.
Same Service Level Changes—$10,000Realignments to Meet Expenditure Requirements and Program Priorities—$0 Realignments are budgeted to address priority spend-ing needs in this office. There is a realignment of $2,664 to contractual services from lease/purchase funding.
Other—$10,000A projected rate increase of 6 percent for the Maryland Association of Boards of Education (MABE) systemwide dues memberships for the MCPS Board of Education requires a budgetary increase of $10,000.
Strategic Accelerators—$20,000Focus on Community Partnerships and Engagement—$20,000For FY 2018, an additional $20,000 will be added to pro-vide funding for an upgrade to the existing BoardDocs software application.
CHAPTER 10 – 2 ADMINISTRATION AND OVERSIGHT

FY 2018 OPERATING BUDGET
Board of Education
F.T.E. Positions 11.0
Chief of Staff–Ombudsman 1.0Staff Assistant, Policy and Communications (P) 1.0Legislative Aide (I) 1.0Administrative Services Manager IV (21) 1.0Administrative Secretary, Board of Education (20) 1.0Administrative Secretary, Board of Education (17) 1.0Administrative Secretary II (15) 1.0
Internal Audit Unit
Supervisor (O) 1.0Internal Audit Analyst II (25) 3.0
CH
AP
TER 10 – 3 A
DM
INIS
TRA
TION
AN
D O
VER
SIG
HT

Board of Education - 711/623
Actual FY 2017Budget
FY 2017Current
FY 2018Request
FY 2018
Summer EmploymentProfessional Substitutes
Total Positions (FTE)Position Salaries
11.000$1,157,506
11.000$1,166,989
11.000$1,166,989
11.000$1,166,989
Other Salaries
01 Salaries & Wages
StipendsProfessional Part Time
ConsultantsOther Contractual
OfficeOther Supplies & Materials
MediaInstructional Supplies & Materials
Textbooks
Subtotal Other Salaries
Leased Equipment
Grand Total
Other Equipment
Total Salaries & Wages
02 Contractual Services
Total Contractual Services
03 Supplies & Materials
Total Supplies & Materials
04 Other
Total Other
05 Equipment
Total Equipment
Supporting Services Part TimeOther
192,686100,607
192,686100,607
192,686100,607
2,680
78,020
21,336153,414
174,750
21,336153,414
174,750
41,336156,078
197,414 22,664
2,66420,000
7,116
7,228
7,228
7,228
7,228
7,228
7,228
1,426,340 1,462,962 1,462,962 1,462,962
2,680 2,680
268,834 295,973 295,973 295,973
$1,705,417
2,664
$1,818,132
2,664
2,664
2,664
2,664
$1,818,132 $1,848,132
(2,664)
(2,664)
$30,000
ChangeDescription FY 2016
Insur & Employee BenefitsUtilitiesMiscellaneous
191,277
46,162
170,528
46,162
170,528
46,162
180,528 10,000
Local/Other Travel 124,366 124,366 134,366 10,000
CHAPTER 10 – 4 ADMINISTRATION AND OVERSIGHT

DESCRIPTION CURRENTFYBUDGET
FYACTUAL
20172016 10Mon
FY 2017CAT CHANGE
2018FY
Board of Education - 711/623
REQUEST
2018FY
711 Board of Education
1 1.000 1.000 1.000Chief of Staff-Ombudsman 1.000
1 2.000 1.000 1.000Staff AssistantP 1.000
1 1.000 1.000Legislative AideI 1.000
1 1.000 1.000 1.000Admin Services Manager IV21 1.000
1 1.000 1.000 1.000Admin Secretary to the Board20 1.000
1 1.000 1.000 1.000Admin Secretary to the Board17 1.000
1 1.000 1.000 1.000Administrative Secretary II15 1.000
7.000 7.000 7.000Subtotal 7.000
623 Internal Audit Unit
1 1.000 1.000 1.000SupervisorO 1.000
1 3.000 3.000 3.000Internal Audit Analyst II25 3.000
4.000 4.000 4.000Subtotal 4.000
11.00011.000 11.000Total Positions 11.000
CHAPTER 10 – 5 ADMINISTRATION AND OVERSIGHT

Office of the Superintendent of Schools611
M I S S I O N The mission of the Office of
the Superintendent of Schools is to provide
high-quality educational leadership in
attaining excellence in teaching and learning
for ALL students in Montgomery County
Public Schools (MCPS).
MAJOR FUNCTIONSLeadership
The superintendent supports the policies and helps shape the priorities of the Board of Education (Board) and has the overall responsibility of attaining rigorous standards of performance for students and employ-ees. The superintendent leads educational initiatives designed to improve achievement for all students from prekindergarten through Grade 12, ensures high-qual-ity teaching and accountability through data-driven decision-making, provides the resources necessary to engage students and their families in the learning com-munity of their schools, and ensures that all students have the academic credentials necessary to thrive now and in the future. The superintendent is focusing efforts on the elimination of achievement gaps and is placing a priority on culturally proficient classrooms. The superin-tendent leads the work of all schools and offices through senior leadership team, with the primary assistance of the chief of staff, chief operating officer, chief academic officer, and deputy superintendent for school support and improvement.
Strategic PlanningThe superintendent directs the academic and admin-istrative functions of the school system and provides leadership in the implementation of the MCPS strate-gic priorities; the annual operating budget; the capi-tal improvements program; and other initiatives. The superintendent’s duties and responsibilities include those identified by law, by the policies and decisions of the Board, and by administrative regulations governing the operation of the school system.
The superintendent and leadership team use and ana-lyze multiple measures, both quantitative and quali-tative, to determine instructional and administrative directions. The focus of all departments, instructional and administrative, is teaching and learning. Recent ini-tiatives funded by allocations from the County Council have focused on strengthening instructional practices
in culturally proficient classrooms where all students thrive. These initiatives support MCPS’ priority of elimi-nating achievement gaps and include class size reduc-tion, targeted professional development, increased staffing to raise literacy and mathematics proficiency, and the implementation of effective interventions for identified students. The effectiveness of these initiatives will be evaluated by analyzing identified measures of success.
Shared GovernanceThe superintendent supports the responsibilities and functions of the Board as both superintendent and secretary-treasurer. The superintendent works closely with the president and vice president of the Board and provides them with guidance and counsel on matters of educational and public policy, academic standards and accountability, public funding, personnel, land use, and legal matters. The superintendent’s leadership team and office personnel work collaboratively with the Board’s staff to develop thorough responses to inquiries and requests, prepare meeting documents, and successfully complete the business of the Board.
OVERVIEW OF BUDGET CHANGES
FY 2018 RECOMMENDED BUDGET
The FY 2018 recommended budget for this office
is $505,850, and is unchanged from the current
FY 2017 budget.
CHAPTER 10 – 6 ADMINISTRATION AND OVERSIGHT

FY 2018 OPERATING BUDGET
Office of the Superintendent of Schools
F.T.E. Positions 3.0
Superintendent of Schools 1.0Administrative Services Manager IV (21) 1.0Copy Editor/Administrative Secretary (17) 1.0
Chief of StaffOffice of the General Counsel
Policy Unit
Department of Communications
Special Education Legal Services
Partnerships
Office of Shared Accountability
CH
AP
TER 10 – 7 A
DM
INIS
TRA
TION
AN
D O
VER
SIG
HT

Office of the Superintendent of Schools - 611
Actual FY 2017Budget
FY 2017Current
FY 2018Request
FY 2018
Summer EmploymentProfessional Substitutes
Total Positions (FTE)Position Salaries
5.000$601,594
3.000$433,745
3.000$433,745
3.000$433,745
Other Salaries
01 Salaries & Wages
StipendsProfessional Part Time
ConsultantsOther Contractual
OfficeOther Supplies & Materials
MediaInstructional Supplies & Materials
Textbooks
Subtotal Other Salaries
Leased Equipment
Grand Total
Other Equipment
Total Salaries & Wages
02 Contractual Services
Total Contractual Services
03 Supplies & Materials
Total Supplies & Materials
04 Other
Total Other
05 Equipment
Total Equipment
Supporting Services Part TimeOther
45,0001,455
10,0001,455
10,0001,455
4,035
4,100
4,100
35,0004,100
39,100
35,0004,100
39,100
4,099
10,500
10,500
10,500
10,500
10,500
10,500
601,594 480,200 445,200 445,200
46,455 11,455 11,455
$610,251 $505,850 $505,850 $505,850
ChangeDescription FY 2016
Insur & Employee BenefitsUtilitiesMiscellaneous
523
5,300
11,050
5,300
11,050
5,300
11,050
Local/Other Travel 5,750 5,750 5,7509 790
CHAPTER 10 – 8 ADMINISTRATION AND OVERSIGHT

DESCRIPTION CURRENTFYBUDGET
FYACTUAL
20172016 10Mon
FY 2017CAT
Office of the Superintendent of Schools - 611
FY 2018CHANGE
FY 2018
REQUEST
1 1.000 1.000 1.000Superintendent of Schools 1.000
1 1.000Executive DirectorP 1 1.000 1.000 1.000Admin Services Manager IV21 1.000
1 1.000 1.000 1.000Copy Editor/Admin Sec17 1.000
1 1.000Admin Services Manager I17
3.0005.000 3.000Total Positions 3.000
CHAPTER 10 – 9 ADMINISTRATION AND OVERSIGHT
Office of the Chief of Staff609
M I S S I O N The mission of the Office of
the Chief of Staff is to provide administrative
and strategic leadership in support of the
Office of the Superintendent of Schools’
initiatives and priorities while working
closely with other leaders, both school and
community, schools, parents and the Board of
Education.
MAJOR FUNCTIONSAdministrative and Strategic Leadership
The Office of the Chief of Staff reports directly to the superintendent and works closely with the superin-tendent on a wide variety of administrative and execu-tive duties, special projects and initiatives involving the superintendent’s office and its priorities. These include, but are not limited to, promoting and supporting the mission and values of the school system; overseeing the administrative, operational, and financial affairs of the superintendent’s office; serving as a primary liaison between the superintendent and the various deputies, governmental leaders and community stakeholders. The Office of the Chief of Staff also is responsible for devel-oping and coordinating special and high priority proj-ects, handling questions, concerns, issues and requests on the superintendent’s behalf while serving as a special advisor to the superintendent through the coordina-tion of communications and the preparation of special correspondence for a variety of internal and external constituencies.
Communications The Office of the Chief of Staff works with the Depart-ment of Communications to communicate and provide effective and useful information and services that sup-ports student success and connects MCPS to members of its diverse community.
Shared Accountability The Office of the Chief of Staff works with the Office of Shared Accountability to provide timely, responsive, and useful information that will assist schools in their work to establish and maintain conditions for every student to have a high-quality learning experience. This mission involves eliminating barriers to opportunity, achieving progress toward closing achievement gaps, and for ensuring continuous improvement throughout MCPS.
OVERVIEW OF BUDGET CHANGES
FY 2017 CURRENT BUDGET
The current FY 2017 budget for office is changed
from the budget adopted by the Board of
Education on June 14, 2016. The change is a
result of realignments to this office of $80,000 for
professional part-time salaries and $167,449 for
contractual services.
FY 2018 RECOMMENDED BUDGET
The FY 2018 recommended budget for this office is
$908,522, a decrease of $319,030 from the current
FY 2017 budget. An explanation of this change
follows.
Same Service Level Changes—($250,878)Realignments to Meet Expenditure Requirements and Program Priorities—($250,878)Realignments are budgeted to address priority spend-ing needs in this office. There is a realignment of a 1.0 supervisor position and $138,429 to the Office of Student Services and Engagement, in addition to a realignment of $117,449 from contractual services to Elementary Schools for long-term leave payments. Furthermore, there is a realignment to this office budget of $5,000 for office supplies.
Program Efficiencies and Reductions—($68,152)The FY 2018 recommended budget for this office includes a comprehensive effort to identify potential program efficiencies and reductions. Stakeholders, including community partners and employee union representatives, participated in the program efficiencies and reduction process.
There is a reduction of a 1.0 partnerships manager posi-tion and $68,152. Responsibilities will be absorbed by the remaining partnership manager positions in the office.
CHAPTER 10 – 10 ADMINISTRATION AND OVERSIGHT

FY 2018 OPERATING BUDGET
F.T.E. Positions 3.0
Chief of Staff—Overview
Chief of Staff 1.0Supervisor (O) 1.0Administrative Services Manager I (17) 1.0
Office of Shared Accountability
PartnershipsDepartment of Communications
CH
AP
TER 10 – 11 A
DM
INIS
TRA
TION
AN
D O
VER
SIG
HT

FY 2018 OPERATING BUDGET
F.T.E. Positions 7.0
Chief of Staff
Chief of Staff 1.0Supervisor (O) 1.0Administrative Services Manager I (17) 1.0
Partnerships
Director II (Q) 1.0Partnerships Manager (24) 2.0Administrative Secretary III (16) 1.0
CH
AP
TER 10 – 12 A
DM
INIS
TRA
TION
AN
D O
VER
SIG
HT

Chief of Staff - 609
Actual FY 2017Budget
FY 2017Current
FY 2018Request
FY 2018
Summer EmploymentProfessional Substitutes
Total Positions (FTE)Position Salaries
9.000$976,353
9.000$976,353
7.000$769,772
Other Salaries
01 Salaries & Wages
StipendsProfessional Part Time
ConsultantsOther Contractual
OfficeOther Supplies & Materials
MediaInstructional Supplies & Materials
Textbooks
Subtotal Other Salaries
Leased Equipment
Grand Total
Other Equipment
Total Salaries & Wages
02 Contractual Services
Total Contractual Services
03 Supplies & Materials
Total Supplies & Materials
04 Other
Total Other
05 Equipment
Total Equipment
Supporting Services Part TimeOther
80,000 80,000
167,449
167,449
50,000
50,000 (117,449)
(117,449)
2,000
2,000
2,000
2,000
7,000
7,000
5,000
5,000
976,353 1,056,353 849,772 (206,581)
80,000 80,000
$980,103 $1,227,552 $908,522 ($319,030)
ChangeDescription FY 2016
(2.000)($206,581)
Insur & Employee BenefitsUtilitiesMiscellaneous
1,750 1,750 1,750
Local/Other Travel 1,750 1,750 1,750
CHAPTER 10 – 13 ADMINISTRATION AND OVERSIGHT

DESCRIPTION CURRENTFYBUDGET
FYACTUAL
20172016 10Mon
FY 2017CAT
Chief of Staff - 609
FY 2018CHANGE
FY 2018
REQUEST
1 1.000 1.000Chief of Staff 1.000
2 1.000 1.000Director IIQ 1.000
1 1.000 1.000SupervisorO 1.000
2 1.000 1.000SupervisorO (1.000)2 3.000 3.000Partnerships Manager24 (1.000)2.000
1 1.000 1.000Admin Services Manager I17 1.000
1 1.000 1.000Administrative Secretary III16 1.000
9.000 9.000Total Positions 7.000 (2.000)
CHAPTER 10 – 14 ADMINISTRATION AND OVERSIGHT
Office of Shared Accountability624/621/622/625/626/627
M I S S I O N The mission of the Office
of Shared Accountability (OSA) is to provide
timely, responsive, and useful information that
will assist schools in their work to establish
and maintain conditions for every student
to have a high-quality learning experience.
This mission involves eliminating barriers
to opportunity, achieving progress toward
closing achievement gaps, and for ensuring
continuous improvement throughout MCPS.
MAJOR FUNCTIONSApplied Research of Student Performance
OSA provides focus on learning, results, and account-ability by conducting rigorous research studies focused on data-driven monitoring and analysis of student per-formance to guide improvement efforts and reduce variability in outcomes across schools. By studying and identifying and understanding factors that influence student outcomes and perceptions of school quality, the work of the office improves the timeliness and quality of interventions, programs, and partnerships to scaf-fold support necessary to accelerate students’ learning. Prediction models and monitoring tools inform articula-tion and instructional decisions also are developed by OSA. Furthermore, OSA conducts analysis associated with district milestones and performance targets to monitor the MCPS strategic priorities, and guide school improvement planning. In addition, OSA oversees the external research request process to ensure interruption to the instructional day is minimized. Surveys regarding the quality of services and supports provided by MCPS developed and distributed by OSA are administered to parents/guardians to provide information for continu-ous improvement throughout the school system. OSA also responds to ad hoc requests from MCPS offices and staff to allow for continuous improvement of programs and educational supports to students.
Evaluation of Programs that Support Student Learning and Instruction
Strategically, the office is moving toward providing more concise and brief evaluations, applied as an action research model as programs are evaluated through the lens of student achievement and return on investment. The comprehensive evaluations of MCPS programs
and initiatives will monitor the investment of resources and the effectiveness of programs. Quantitative and qualitative studies deliver information on fidelity of programs’ or initiatives’ implementation and their out-comes support informed data-driven decision-making to use resources effectively to achieve the district goal of academic excellence for all. Evaluations are done for key curricula that support the strategic priority areas and initiatives, and federal and state grants. In addition, OSA provides technical assistance and consultation to other MCPS program staff, developing evaluation plans for major grant proposals sought by the school system, providing psychometric consultation and analyses; con-ducting longitudinal analysis of achievement data; eval-uating community-based programs; and collaborating with outside higher education institutions in the evalu-ation of programs operating within the school system.
Student, Staff, and Office Records Maintenance and Retention
In accordance with state and federal laws, OSA is responsible for the maintenance and permanent reten-tion of student records, some employee records, as well as certain office records; and monitoring and imple-menting state requirements for maintenance of student records. The focus is operational excellence—support-ing schools by ensuring the timely and accurate entry of information into a student’s electronic and paper record; and serving the needs of individuals who require access to their records.
Reporting (Federal, State, and Local) Student DataA mandated function of OSA is to ensure compliance with federal, state, and local reporting requirements. OSA supports the infrastructure for collecting and shar-ing data, monitoring data to ensure accuracy, verifying and transmitting data reports to state and federal agen-cies, and serving as a resource for the school system and the community for ad hoc student data requests. This work ensures that the district receives equitable federal and state resource allocations based on student enroll-ment and need.
Student Assessments (Systemwide Assessments)OSA supports a comprehensive assessment framework that provides timely data to students, their families and staff to enable schools to monitor student progress and improve student learning. The work involves oversight of the administration of a wide-ranging system of stu-dent assessments and provides timely data for measur-ing and monitoring student achievement. This includes local assessments and all facets of assessments man-dated by the Maryland State Department of Education
CHAPTER 10 – 15 ADMINISTRATION AND OVERSIGHT

Office of Shared Accountability624/621/622/625/626/627
(MSDE) in compliance with the Every Student Succeeds Act (i.e., Partnership for Assessing Readiness for College and Careers assessments, the new Maryland science assessment, and Maryland High School Assessments). OSA supports the administration of cognitive assess-ments of students for gifted and talented identification, the National Assessment of Educational Progress, and the Assessing Comprehension and Communication in English State to State for English Language Learners English Language Proficiency Assessment. OSA staff members have primary responsibility for overseeing the administration (training, materials, security) of these assessments, supporting school assessment coordina-tors in each school, as well as the analysis and reporting of the results to MSDE, the MCPS Board of Education, MCPS staff, and the public.
All OSA units receive, process, and respond to ad hoc requests by stakeholders to support continuous improvement throughout the school system.
MEASURESM E A S U R E : Number of ad hoc data analysis requests to which OSA reviews and responds.
FY 2016Actual
FY 2017Estimate
FY 2018Recommended
48 55 60
E X P L A N A T I O N : OSA is receiving an increasing number of ad hoc requests for data analysis as the system leverages data-driven decisionmaking and accountability.
OVERVIEW OF BUDGET CHANGES
FY 2017 CURRENT BUDGET
The current FY 2017 budget for office is changed
from the budget adopted by the Board of Education
on June 14, 2016. The change is a result of a
realignment of $30,000 to professional part-time
salaries from the Office of the Chief Financial Officer.
FY 2018 RECOMMENDED BUDGET
The FY 2018 recommended budget for this office
is $3,655,194, an increase of $506,769 over the
current FY 2017 budget. An explanation of this
change follows.
Same Service Level Changes—($4,278)Realignments to Meet Expenditure Requirements and Program Priorities—($4,278)There are a several realignments budgeted to address priority spending needs within this office. There is a budget neutral realignment of a 1.0 coordinator position and $105,604, in addition to $7,279 from professional part-time salaries, and $5,723 from contractual ser-vices to fund a 1.0 evaluation specialist position and to increase a current logistics support specialist position by 0.5. Furthermore, there is a realignment of $4,278 from contractual services to the Department of Employee and Retiree Services to support employee benefits.
Program Efficiencies and Reductions—($55,889)The FY 2018 recommended budget for this office includes a comprehensive effort to identify potential program efficiencies and reductions. Stakeholders, including community partners and employee union representatives, participated in the program efficiencies and reduction process.
The current reports specialist position is reduced by 0.25 and $24,289, in addition to a reduction of $31,600 from professional part-time salaries.
Strategic Accelerators—$566,936Focus on Learning, Accountability and Results—$566,936For FY 2018, $450,000 is added to this budget for con-tractual services to cover the cost for any 11th grade student interested in taking the PSAT, SAT and/or ACT college assessments. Furthermore, 2.0 data analyst posi-tions and $91,936, in addition to $25,000 for equipment replacement is added to this budget to support the sys-temwide implementation of data systems for all schools.
CHAPTER 10 – 16 ADMINISTRATION AND OVERSIGHT

FY 2018 OPERATING BUDGET
Office of Shared Accountability
F.T.E. Positions 32.125
Associate Superintendent 1.0Assistant to Associate Superintendent (N) 1.0Administrative Services Manager I (17) 1.0Data Analyst (16) 2.0Program Secretary (13) 0.625
Testing Unit
Supervisor (O) 1.0Evaluation Specialist (B–D) 2.0Technical Analyst (25) 2.0Senior Reporting Specialist (24) 1.0Data Integration Specialist (23) 1.0Testing Support Specialist (20) 1.0Testing Materials Coordinator (16) 1.0Testing Support Assistant (15) 1.0
Program Evaluation Unit
Supervisor (O) 1.0Evaluation Specialist (B–D) 2.5Logistics Support Specialist (25) 1.0Evaluation Support Specialist (21) 0.75Office Assistant IV (11) 1.0
Applied Research Unit
Supervisor (O) 1.0Evaluation Specialist (B–D) 3.0Technical Analyst (25) 0.5Data Integration Specialist (23) 1.0
Records and Reporting Unit
Records Management Supervisor (H) 1.0Reports Specialist (22) 0.75Office Assistant IV (11) 3.0
CH
AP
TER 10 – 17 A
DM
INIS
TRA
TION
AN
D O
VER
SIG
HT

Office of Shared Accountability - 624/621/622/625/626/627
Actual FY 2017Budget
FY 2017Current
FY 2018Request
FY 2018
Summer EmploymentProfessional Substitutes
Total Positions (FTE)Position Salaries
35.500$3,346,269
29.875$2,980,390
29.875$2,980,390
32.125$3,061,039
Other Salaries
01 Salaries & Wages
StipendsProfessional Part Time
ConsultantsOther Contractual
OfficeOther Supplies & Materials
MediaInstructional Supplies & Materials
Textbooks
Subtotal Other Salaries
Leased Equipment
Grand Total
Other Equipment
Total Salaries & Wages
02 Contractual Services
Total Contractual Services
03 Supplies & Materials
Total Supplies & Materials
04 Other
Total Other
05 Equipment
Total Equipment
Supporting Services Part TimeOther
42,58922,632
72,58922,632
33,71022,632
(38,879)
184,041
43,946
43,946
43,946
43,946
483,945
483,945 439,999
439,999
7,075
7,80016,859
24,659
7,80016,859
24,659
7,80016,859
24,659
3,421,803 3,045,611 3,075,611 3,117,381 41,770
75,534 65,221 95,221 56,342 (38,879)
$3,616,249 $3,118,425 $3,148,425
25,000
25,000
$3,655,194
25,000
25,000
$506,769
ChangeDescription FY 2016
2.250$80,649
Insur & Employee BenefitsUtilitiesMiscellaneous
3,330 4,209 4,209 4,209
Local/Other Travel 4,209 4,209 4,209
CHAPTER 10 – 18 ADMINISTRATION AND OVERSIGHT

DESCRIPTION CURRENTFYBUDGET
FYACTUAL
20172016 10Mon
FY 2017CAT CHANGE
2018FY
Office of Shared Accountibility - 624/621/622/625/626/627
REQUEST
2018FY
624 Office of Shared Accountability
1 1.000 1.000 1.000Associate Superintendent 1.000
1 2.000Director IP 1 1.000 1.000 1.000Asst. to Assoc SuptN 1.000
1 1.000 1.000 1.000Data Integration Specialist23 (1.000)1 1.000Copy Editor/Admin Sec17 1 Admin Services Manager I17 1.0001.000
1 1.000 1.000 1.000Administrative Secretary III16 (1.000)1 Data Analyst16 2.0002.000
1 Program Secretary13 .625.625
7.000 4.000 4.000Subtotal 1.6255.625
621 Records and Reporting Unit
1 1.000 1.000Records Management SupervisorH 1.000
1 1.000 1.000 1.000Senior Reporting Specialist24 (1.000)1 1.000 1.000 1.000Data Integration Specialist23 (1.000)1 1.000 1.000 1.000Reports Specialist22 (.250).750
1 .625 .625 .625Program Secretary13 (.625)1 3.000 3.000Office Assistant IV11 3.000
3.625 7.625 7.625Subtotal (2.875)4.750
622 Policy and Records Unit
1 1.000Records Management SupervisorH 1 1.625Policy/Forms Specialist22 1 3.000Office Assistant IV11
5.625Subtotal625 Testing Unit
1 1.000 1.000 1.000SupervisorO 1.000
1 2.000 2.000 2.000Evaluation SpecialistBD 2.000
1 2.000 2.000 2.000Technical Analyst25 2.000
1 Senior Reporting Specialist24 1.0001.000
1 Data Integration Specialist23 1.0001.000
1 1.000 1.000 1.000Testing Support Specialist20 1.000
1 1.000 1.000 1.000Testing Materials Coordinator16 1.000
1 1.000 1.000 1.000Testing Support Assistant15 1.000
8.000 8.000 8.000Subtotal 2.00010.000
626 Applied Research Unit
1 1.000 1.000 1.000SupervisorO 1.000
1 2.000 2.000 2.000Evaluation SpecialistBD 1.0003.000
1 .500 .500 .500Technical Analyst25 .500
1 1.000Logistics Support Specialist25
CHAPTER 10 – 19 ADMINISTRATION AND OVERSIGHT
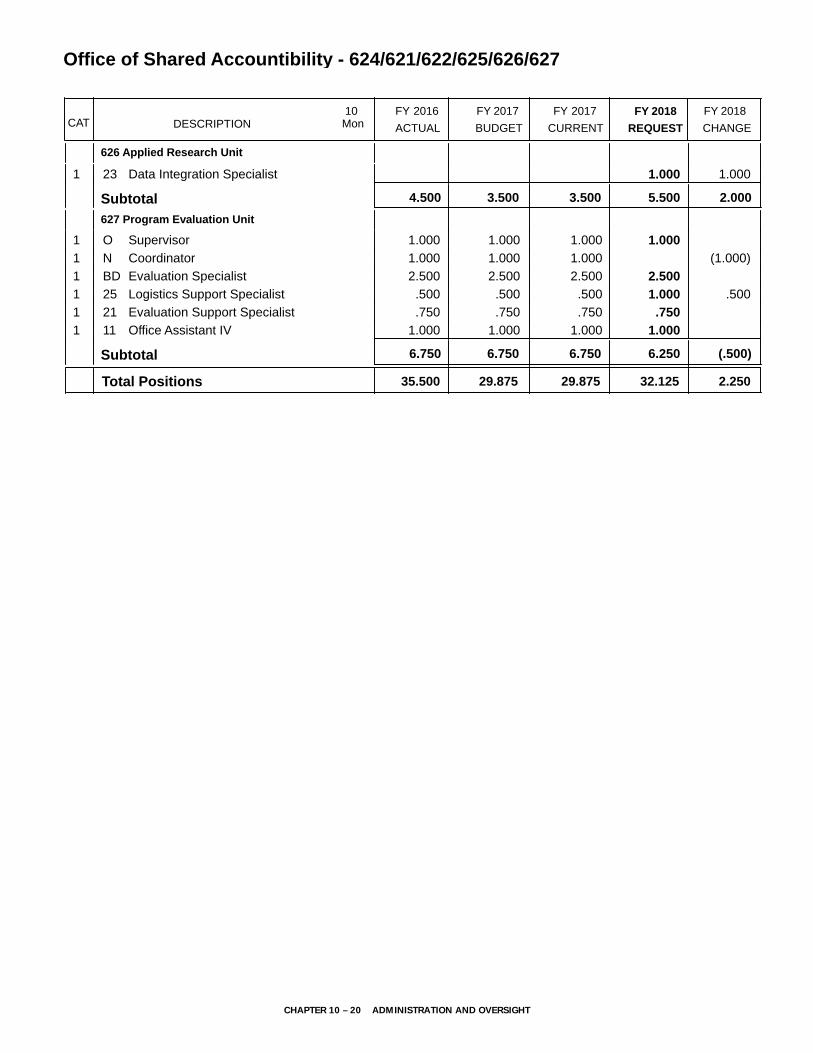
DESCRIPTION CURRENTFYBUDGET
FYACTUAL
20172016 10Mon
FY 2017CAT CHANGE
2018FY
Office of Shared Accountibility - 624/621/622/625/626/627
REQUEST
2018FY
626 Applied Research Unit
1 Data Integration Specialist23 1.0001.000
4.500 3.500 3.500Subtotal 2.0005.500
627 Program Evaluation Unit
1 1.000 1.000 1.000SupervisorO 1.000
1 1.000 1.000 1.000CoordinatorN (1.000)1 2.500 2.500 2.500Evaluation SpecialistBD 2.500
1 .500 .500 .500Logistics Support Specialist25 .5001.000
1 .750 .750 .750Evaluation Support Specialist21 .750
1 1.000 1.000 1.000Office Assistant IV11 1.000
6.750 6.750 6.750Subtotal (.500)6.250
29.87535.500 29.875Total Positions 2.25032.125
CHAPTER 10 – 20 ADMINISTRATION AND OVERSIGHT

Department of Communications642/412/860
M I S S I O N The mission of the
Department of Communications (OC) is to
communicate and provide effective and
useful information and services that supports
student success and connects Montgomery
County Public Schools (MCPS) to members of
its diverse community.
MAJOR FUNCTIONSPublic Information and Web Services (PIO/Web)
Coordinates all systemwide messaging and produces both regular and time sensitive internal and external communications to support and inform MCPS admin-istration, schools, students, parents, and the media. The work of PIO/Web is focused on supporting schools so that the district’s mission, programs and initiatives are clearly conveyed; providing information that facilitates communication between and amongst stakeholders; and ensuring that stakeholders have access to infor-mation that meets their needs. PIO/Web is developing new ways to engage and reach a wider audience of stakeholders. In addition to increasing outreach efforts to the Latino/Hispanic community through its Spanish website, Facebook page and Spanish Twitter account, PIO/Web is undertaking the launch of an MCPS Face-book page to engage the wider MCPS community. The department is also working to make the MCPS website more accessible through the MCPS smartphone app. PIO/Web is exploring ways to better employ website and social media performance data when making deci-sions about systemwide content and messaging.
Language Assistance Services Unit (LASU)Provides translation of important documents and com-munication materials into the six most spoken languages of MCPS families, and maintains six mini-websites in the same six languages. In addition, the Language Assis-tance Services Unit (LASU) offers interpretation services in more than forty languages to families and schools. The unit also manages the use of Language Line, a telephone interpretation service available to all MCPS schools and offices. LASU’s Translation Management tool enables schools to increase their translation capac-ity and minimize the time required to translate essential information for parents. These services aid in minimiz-ing cultural and linguistic barriers so that families can be effectively engaged in their children’s education. LASU
will continue to promote its services, train employees on the use of tools available that will assist them in commu-nicating more successfully with their multicultural com-munities. The unit will continue to work collaboratively with schools and offices to provide families and students with the awareness of and access to the services and information needed to successfully recognize and fulfill their potential. As part of its effort to ensure that mul-ticultural communities are reached, LASU is commit-ted to keeping the six language mini-websites updated and will work to engage these unique communities by directing more traffic to these sites.
Montgomery County Public Schools Television (MCPS-TV)
A full-service television and multimedia facility that produces programs for students, staff, parents, and the general community; many of which are produced in multiple languages to reach the district’s growing multicultural community. MCPS-TV directly supports schools by maintaining and repairing school-based TV studios. MCPS-TV produces multimedia resources, such as training videos for the purpose of staff development and engagement and supports students through stu-dent-focused programming. The benchmark program Homework Hotline Live! (HHL) ensures students have access to direct, real-time homework support outside of school hours. MCPS-TV is extending this support by expanding its online offerings. In support of the dis-trict’s efforts to close the achievement gap, MCPS-TV is considering ways to reach a more targeted audience of students from our most impacted schools and will col-laborate with those schools to develop ways to reach these students.
MEASURES M E A S U R E : Engagement of audience on MCPS Span-ish Social Media Sites
FY 2016Actual
FY 2017Estimate
FY 2018Recommended
Facebook Reach* 3,184 3,280 3,378Twitter Impressions 26,400 27,192 28,007YouTube views 45,915 47,292 48,710
E X P L A N A T I O N : This measure indicates audience size of the Spanish MCPS Social Media channels and is an indicator of how stakeholders are engaging with the messaging that MCPS sends out to this targeted community. It considers the number of followers, subscribers, likes and impressions from Facebook, Twitter, and YouTube. (*number of people reached, plus likes, comments, and shares).
CHAPTER 10 – 21 ADMINISTRATION AND OVERSIGHT

Department of Communications642/412/860
M E A S U R E : Engagement of audience of MCPS lan-guage mini-sites
FY 2016Actual
FY 2017Estimate
FY 2018Recommended
85,594 94,100 103,600
E X P L A N A T I O N : This measures the total number of times pages were view on the MCPS language mini-sites for Amharic, Chinese, French, Korean, and Vietnamese and indicates the engagement of stakeholders actively seeking information posted by MCPS.
M E A S U R E : One-on-One Homework Help for Students
FY 2016Actual
FY 2017Estimate
FY 2018Recommended
2,647 2,911 3,202
E X P L A N A T I O N : This measures the total number of times pages were view on the MCPS language mini-sites for Amharic, Chinese, French, Korean, and Vietnamese and indicates the engagement of stakeholders actively seeking information posted by MCPS.
OVERVIEW OF BUDGET CHANGES
FY 2018 RECOMMENDED BUDGET
The FY 2018 recommended budget for this
department is $3,126,543, an increase of $177,757
over the current FY 2017 budget. An explanation of
this change follows.
Same Service Level Changes—($17)Realignments to Meet Expenditure Requirements and Program Priorities—($17) Realignments are budgeted to address priority spend-ing needs in this department. There is a budget neutral realignment of $800 from local travel mileage reim-bursement, $3,147 from program supplies, $322 from office supplies, $221 from position salaries, $8,967 from supporting services part-time salaries, and $482 from professional part-time salaries to contractual services. There is a realignment of $17 to the Department of Employee and Retiree Services to support employee benefits.
Program Efficiencies and Reductions—($30,944)The FY 2018 recommended budget for this department includes a comprehensive effort to identify potential program efficiencies and reductions. Stakeholders, including community partners and employee union representatives, participated in the program efficiencies and reduction process.
There is a reduction of a 0.5 multimedia producer/director position and $30,944. Responsibilities will be absorbed by the remaining multimedia producer/direc-tor position in this department.
Strategic Accelerators—$208,718Focus on Community Partnerships and Engagement—$208,718For FY 2018, a 1.0 communication specialist/web pro-ducer position and $58,718 is added to this budget to support the increase in Amharic document translation requests. In addition, $150,000 is added to this budget for contractual services to fund the cost associated with increased usage of the Language Line interpretation service.
Montgomery County Public Schools Instructional Television Special Revenue Fund
FY 2018 RECOMMENDED BUDGET
The FY 2018 recommended budget for this special
revenue fund is $1,697,504, a decrease of $45,287
over the current FY 2017 budget. An explanation of
this change follows.
Same Service Level Changes—$45,287Other—$45,287There is a reduction of $2,021 from position salaries in order to maintain a budget that is consistent with cur-rent salaries paid for positions funded by the Instruc-tional Television Special Revenue Fund. Furthermore, as salaries for those employees who are paid from the spe-cial revenue fund change, there also is a change in the benefit costs paid to these employees; therefore, there is a decrease of $43,266 for employee benefits.
CHAPTER 10 – 22 ADMINISTRATION AND OVERSIGHT

FY 2018 OPERATING BUDGET
F.T.E. Positions 40.5
(*In addition, 2.0 positions are funded by the Capital Budget.)
Department of Communications
Director II (Q) 1.0Administrative Services Manager I (17) 1.0
Department of Public Information and Web Services
Supervisor (O) 1.0IT Systems Engineer (27) 1.0*Communications Specialist (27) 1.0IT Systems Specialist (18–25) 1.0*Communications Specialist/
Web Producer (21) 6.0Administrative Services
Manager I (17) 1.0Administrative Secretary II (15) 1.0
Language Assistance Services Unit
Publications Manager (23) 1.0Communications Specialist/
Web Producer (21) 6.0Administrative Secretary I (14) 1.0Language Services Assistant (13) 4.0
Montgomery County Public Schools Television
Operations Manager (J) 1.0Chief Engineer (27) 1.0Multimedia Producer/Director (22) 1.0
Special Revenue Fund
Supervisor (O) 1.0Television Engineer (25) 1.0Data Integration Specialist (23) 1.0Multimedia Designer (23) 1.0Production Manager (23) 1.0Projects Specialist (23) 1.0Multimedia Producer/Director (22) 2.5Production Technician II (20) 1.0Associate Producer/Director (17) 3.0Program Director (17) 1.0
CH
AP
TER 10 – 23 A
DM
INIS
TRA
TION
AN
D O
VER
SIG
HT

Department of Communications - 642/412
Actual FY 2017Budget
FY 2017Current
FY 2018Request
FY 2018
Summer EmploymentProfessional Substitutes
Total Positions (FTE)Position Salaries
28.500$2,179,301
27.500$2,320,296
27.500$2,152,847
27.000$2,180,400
Other Salaries
01 Salaries & Wages
StipendsProfessional Part Time
ConsultantsOther Contractual
OfficeOther Supplies & Materials
MediaInstructional Supplies & Materials
Textbooks
Subtotal Other Salaries
Leased Equipment
Grand Total
Other Equipment
Total Salaries & Wages
02 Contractual Services
Total Contractual Services
03 Supplies & Materials
Total Supplies & Materials
04 Other
Total Other
05 Equipment
Total Equipment
Supporting Services Part TimeOther
418,3698,967
418,3698,967
417,887
1,974
(482)(8,967)
407,575
316,118
316,118
316,118
316,118
480,040
480,040 163,922
163,922
34,536
1,0008,379
33,853
43,232
1,0008,379
33,853
43,232
1,0008,057
30,706
39,763
(3,147)(322)
(3,469)
2,569,581 2,749,606 2,582,157 2,600,261 18,104
1,974 1,974
390,280 429,310 429,310 419,861 (9,449)
$3,015,413 $3,116,235 $2,948,786 $3,126,543 $177,757
ChangeDescription FY 2016
(.500)$27,553
Insur & Employee BenefitsUtilitiesMiscellaneous
3,721
4,197
7,279
4,197
7,279
4,197
6,479 (800)
Local/Other Travel 3,082 3,082 2,282 (800)
CHAPTER 10 – 24 ADMINISTRATION AND OVERSIGHT

DESCRIPTION CURRENTFYBUDGET
FYACTUAL
20172016 10Mon
FY 2017CAT CHANGE
2018FY
Department of Communications - 642/412
REQUEST
2018FY
642 Department of Communications
1 1.000 1.000 1.000Chief Communications Officer (1.000)1 Director IIQ 1.0001.000
1 1.000 1.000 1.000Director IP (1.000)1 1.000 1.000 1.000SupervisorO 1.000
1 1.000 1.000 1.000Communications Specialist27 1.000
2 1.000 1.000 1.000Publications Manager23 1.000
1 11.000 11.000 11.000Comm Spec/Web Producer21 1.00012.000
1 2.000 2.000 2.000Admin Services Manager I17 2.000
1 1.000 1.000Administrative Secretary II15 1.000
2 1.000 1.000 1.000Administrative Secretary I14 1.000
3 3.500 3.500 3.500Language Services Assistant13 .5004.000
3 .500 .500 .500Paraeducator - ESOL13 (.500)
23.000 24.000 24.000Subtotal 24.000
412 MCPS Television
1 1.000 1.000 1.000Operations ManagerJ 1.000
1 1.000 1.000 1.000Chief Engineer27 1.000
1 1.500 1.500 1.500Multimedia Producer/Director22 (.500)1.000
1 1.000Fiscal Assistant II15 1 1.000Secretary12
5.500 3.500 3.500Subtotal (.500)3.000
27.50028.500 27.500Total Positions (.500)27.000
CHAPTER 10 – 25 ADMINISTRATION AND OVERSIGHT

Instructional Television Special Revenue Fund - 860
Actual FY 2017Budget
FY 2017Current
FY 2018Request
FY 2018
Summer EmploymentProfessional Substitutes
Total Positions (FTE)Position Salaries
13.500$1,194,854
13.500$1,225,087
13.500$1,225,087
13.500$1,223,066
Other Salaries
01 Salaries & Wages
StipendsProfessional Part Time
ConsultantsOther Contractual
OfficeOther Supplies & Materials
MediaInstructional Supplies & Materials
Textbooks
Subtotal Other Salaries
Leased Equipment
Grand Total
Other Equipment
Total Salaries & Wages
02 Contractual Services
Total Contractual Services
03 Supplies & Materials
Total Supplies & Materials
04 Other
Total Other
05 Equipment
Total Equipment
Supporting Services Part TimeOther
3,588 3,588 3,5881,581
7,229
11,1006,500
17,600
11,1006,500
17,600
11,1006,500
17,600
84,889
17,88068,670
86,550
17,88068,670
86,550
17,88068,670
86,550
1,216,613 1,230,256 1,230,256 1,228,235 (2,021)
1,581 1,581
21,759 5,169 5,169 5,169
$1,654,339
880
$1,742,791 $1,742,791 $1,697,504 ($45,287)
ChangeDescription FY 2016
($2,021)
Insur & Employee BenefitsUtilitiesMiscellaneous
344,728
401,785
2,600
408,385
401,785
2,600
408,385
358,519
2,600
365,119
(43,266)
(43,266)
Local/Other Travel 4,000 4,000 4,0002 600
CHAPTER 10 – 26 ADMINISTRATION AND OVERSIGHT

DESCRIPTION CURRENTFYBUDGET
FYACTUAL
20172016 10Mon
FY 2017CAT
Instructional Televison Special Revenue Fund - 860
FY 2018CHANGE
FY 2018
REQUEST
37 1.000 1.000 1.000SupervisorO 1.000
37 1.000 1.000 1.000Television Engineer25 1.000
37 1.000 1.000 1.000Data Integration Specialist23 1.000
37 1.000 1.000 1.000Production Manager23 1.000
37 1.000 1.000 1.000Multimedia Designer23 1.000
37 1.000 1.000 1.000Projects Specialist23 1.000
37 2.500 2.500 2.500Multimedia Producer/Director22 2.500
37 1.000 1.000 1.000Production Technician II20 1.000
37 3.000 3.000 3.000Assoc Producer/Director17 3.000
37 1.000 1.000 1.000Program Director17 1.000
13.50013.500 13.500Total Positions 13.500
CHAPTER 10 – 27 ADMINISTRATION AND OVERSIGHT

Office of the General Counsel610/608
M I S S I O N The Office of the General
Counsel (OGC) is committed to cost-effective,
creative, and proactive legal problem
solving of the highest quality to assist the
Montgomery County Board of Education,
the superintendent of schools, and other
Montgomery County Public Schools (MCPS)
staff to navigate legal requirements, evaluate
and manage legal risk, align and conserve
resources, promote collaborative dispute
resolution and reduce avoidable litigation,
if possible, and engage in strategic decision
making to promote equity and academic
excellence for all students.
MAJOR FUNCTIONSOGC provides timely advice and legal counsel in a wide range of fields, including personnel issues, student mat-ters, special education, policy development and imple-mentation, real estate and land use, contracting and procurement, and civil rights for the school district. OGC seeks to proactively anticipate legal issues relevant to decision making, and to identify legal matters with significant policy or administrative implications. OGC helps to facilitate review of key initiatives by the Board and the school system as a whole, and to offer advice on legal opportunities to promote equity and excellence in the system’s work, as well as continued enhancements to promote operational excellence.
OGC conducts and supervises all aspects of litigation and administrative agency proceedings in which the Board, superintendent, or staff are named as plaintiffs or defendants. These duties include, but are not lim-ited to, review and preparation of pleadings, trial, and appellate briefs; negotiation between parties including settlements; the conduct of trial and hearings at the level of original jurisdiction or on appeal; and partici-pation in other court or hearing appearances in order to represent the interests of the school system. In addi-tion, OGC provides direction in drafting, reviewing, and the application of policies and regulations. OGC also coordinates responses to subpoenas regarding student, school, and personnel matters, and it offers legal advice
in responding to record requests under the Maryland Public Information Act.
OGC is responsible for monitoring and evaluating all internal and external providers of legal services. It works closely with all internal and external counsel to review strategy and supervise resources applied to legal matters. OGC manages the process of selection and approval of outside counsel and coordinates with the Montgomery County Attorney’s Office, which provides counsel to the Board through the Board’s participation in the Montgomery County Self-Insurance Fund. To sup-port MCPS’ work to sustain and expand existing public and private partnerships, OGC provides legal review and advice regarding the drafting, negotiation, execu-tion, and implementation of contracts, agreements, and other transactional documents that structure the rela-tionships with government agencies, vendors, contrac-tors, and other parties in support of MCPS’ educational mission.
OGC provides regular updates to the Board, superinten-dent, and MCPS staff on relevant court and administra-tive decisions that are likely to impact MCPS policy or practice. OGC provides legal assistance in interpreting the impact of legislation and regulations based on the interests of the school system and helps spearhead key initiatives with significant legal implications to advance MCPS’ strategic priorities. For Instance, OGC has pro-vided legal advice regarding the development and implementation of MCPS’ workforce diversity initia-tive, as well as other systemic Initiatives to enhance our human capital management processes.
Development and Implementation of Board Policies and MCPS Regulations
Working with the Board of Education’s Policy Manage-ment Committee and the MCPS senior leadership team, OGC develops and manages revisions to and codifi-cation of policies and regulations; collaborates with responsible offices, departments, divisions, and exter-nal stakeholders for reviewing, updating, and revising policies and regulations; and monitors, reviews, and analyzes state and federal legislation to ensure align-ment between MCPS policies and regulations and local, state, and federal laws, as well as the district’s strategic priorities. Additionally, OGC administers a systemwide forms management and control program that ensures accurate and consistent data collection, consistent with the district’s strategic focus on data-driving monitoring and accountability.
CHAPTER 10 – 28 ADMINISTRATION AND OVERSIGHT

Office of the General Counsel610/608
Special Education Legal ServicesOGC facilitates legal support for due process hearings and other special education legal matters, consistent with the Board’s Policy BLC, Procedure for Review and Resolution of Special Education Disputes.
MEASURESM E A S U R E : Number of updates to MCPS policies and regulations.
FY 2016Actual
FY 2017Estimate
FY 2018Recommended
36 29 29
E X P L A N A T I O N : Well written policies and regulations promote districtwide efficiency, effectiveness, and consistency while upholding the school system’s mission, vision, and core values. This includes review of existing, drafting of new, revisions to current, and rescissions of policies and regulations for the purpose of having formal political, management, financial, and administrative mechanisms to guide the school system and advance the district’s strategic priorities.
M E A S U R E : Number of subpoenas processed each month.
FY 2016Actual
FY 2017Estimate
FY 2018Recommended
29 36 38
E X P L A N A T I O N : This measure indicates effective and timely support for schools in coordinating responses to subpoenas for records regarding student, school, and personnel matters, as well as for MCPS personnel to serve as witnesses, including legal review of records and filing objections or other legal motions as appropriate.
M E A S U R E : Number of contracts and significant land transactions reviewed.
FY 2016Actual
FY 2017Estimate
FY 2018Recommended
43 51 60
E X P L A N A T I O N : This measure indicates effective support for schools and offices that OGC provides regarding the drafting, negotiation, execution, and implementation of contracts, agreements, and other transactional documents that structure the relationships with government agencies, vendors, contractors, and other parties in support of MCPS’ educational mission and its strategic efforts to sustain and expand existing public and private partnerships.
OVERVIEW OF BUDGET CHANGES
FY 2018 RECOMMENDED BUDGET
The FY 2018 recommended budget for this office is
$2,128,654, a decrease of $62,954 from the current
FY 2017 budget. An explanation of this change
follows.
Same Service Level Changes—($62,954)Realignments to Meet Expenditure Requirements and Program Priorities—($62,954) There are several budget neutral realignments budgeted to address priority spending needs within this office. There is a budget neutral realignment of $238,690 from contractual services, $2,822 from program supplies, and $3,540 from lease/purchase funding to fund 2.0 assis-tant general counsel positions. In addition, there is a realignment of $62,954 from contractual services to the Department of Employee and Retiree Services to sup-port employee benefits.
CHAPTER 10 – 29 ADMINISTRATION AND OVERSIGHT

FY 2018 OPERATING BUDGET
Office of the General Counsel
F.T.E. Positions 11.625
General Counsel 1.0Assistant General Counsel (M) 2.0Paralegal (18) 1.0
Policy Unit
Director I (P) 1.0Policy/Forms Specialist (22) 1.625Legal Secretary (15) 1.0
Special Education Legal Services
Associate General Counsel (Q) 1.0Assistant General Counsel (M) 2.0Legal Secretary (15) 1.0
CH
AP
TER 10 – 30 A
DM
INIS
TRA
TION
AN
D O
VER
SIG
HT

Office of the General Counsel - 610/608
Actual FY 2017Budget
FY 2017Current
FY 2018Request
FY 2018
Summer EmploymentProfessional Substitutes
Total Positions (FTE)Position Salaries
6.000$723,186
9.625$1,085,952
9.625$1,085,952
11.625$1,331,004
Other Salaries
01 Salaries & Wages
StipendsProfessional Part Time
ConsultantsOther Contractual
OfficeOther Supplies & Materials
MediaInstructional Supplies & Materials
Textbooks
Subtotal Other Salaries
Leased Equipment
Grand Total
Other Equipment
Total Salaries & Wages
02 Contractual Services
Total Contractual Services
03 Supplies & Materials
Total Supplies & Materials
04 Other
Total Other
05 Equipment
Total Equipment
Supporting Services Part TimeOther
63,240 63,240 63,240
1,364,700
1,021,126
1,021,126
1,021,126
1,021,126
719,482
719,482 (301,644)
(301,644)
3,388
4,3504,322
8,672
4,3504,322
8,672
5,850
5,850
(4,322)1,500
(2,822)
792,874 1,149,192 1,149,192 1,394,244 245,052
69,688 63,240 63,240 63,240
$2,181,209
14,660
$2,191,608
3,540
3,540
3,540
3,540
$2,191,608 $2,128,654
(3,540)
(3,540)
($62,954)
ChangeDescription FY 2016
2.000$245,052
Insur & Employee BenefitsUtilitiesMiscellaneous
5,587
465
9,078
465
9,078
465
9,078
Local/Other Travel 8,613 8,613 8,613
CHAPTER 10 – 31 ADMINISTRATION AND OVERSIGHT
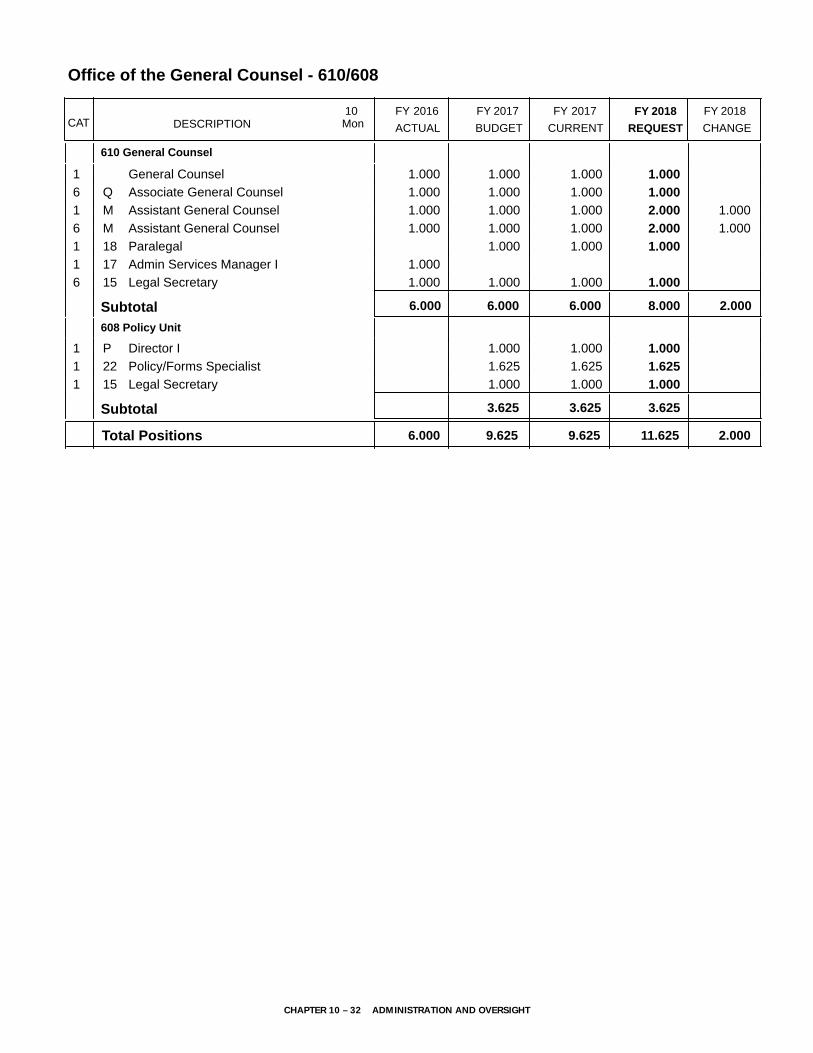
DESCRIPTION CURRENTFYBUDGET
FYACTUAL
20172016 10Mon
FY 2017CAT CHANGE
2018FY
Office of the General Counsel - 610/608
REQUEST
2018FY
610 General Counsel
1 1.000 1.000 1.000General Counsel 1.000
6 1.000 1.000 1.000Associate General CounselQ 1.000
1 1.000 1.000 1.000Assistant General CounselM 1.0002.000
6 1.000 1.000 1.000Assistant General CounselM 1.0002.000
1 1.000 1.000Paralegal18 1.000
1 1.000Admin Services Manager I17 6 1.000 1.000 1.000Legal Secretary15 1.000
6.000 6.000 6.000Subtotal 2.0008.000
608 Policy Unit
1 1.000 1.000Director IP 1.000
1 1.625 1.625Policy/Forms Specialist22 1.625
1 1.000 1.000Legal Secretary15 1.000
3.625 3.625Subtotal 3.625
9.6256.000 9.625Total Positions 2.00011.625
CHAPTER 10 – 32 ADMINISTRATION AND OVERSIGHT
Appendices
Appendices
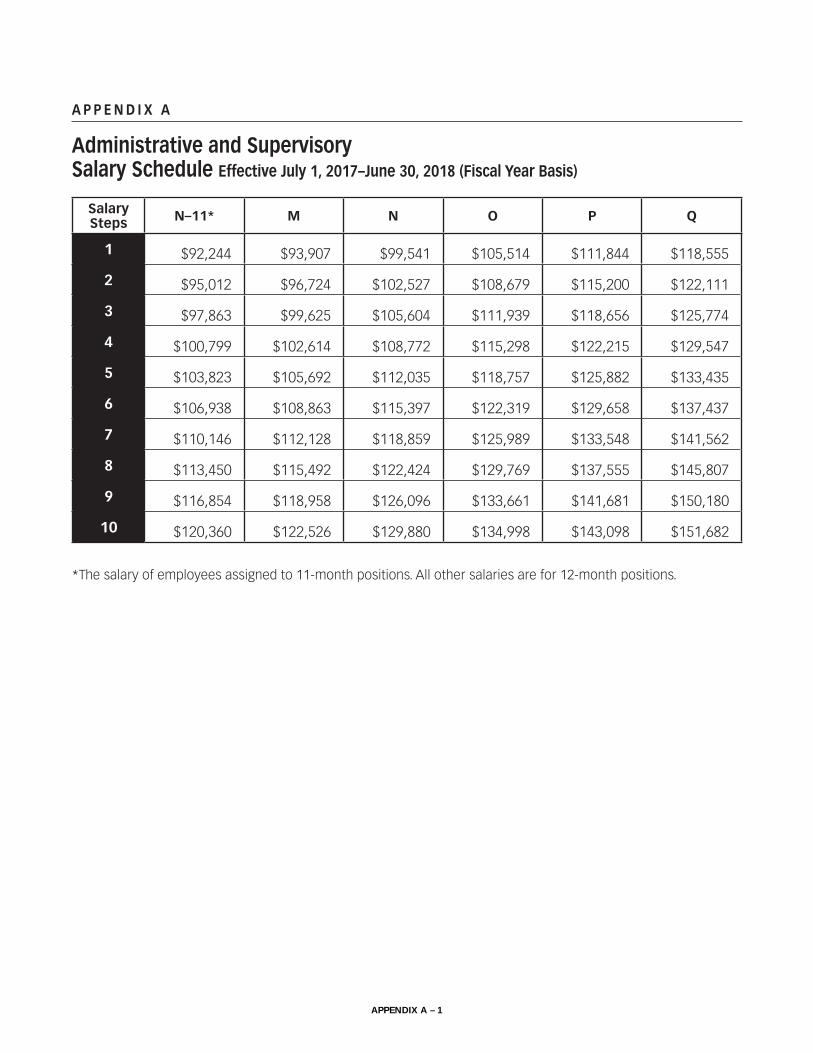
A P P E N D I X A
Administrative and Supervisory Salary Schedule Effective July 1, 2017–June 30, 2018 (Fiscal Year Basis)
Salary Steps N–11* M N O P Q
1 $92,244 $93,907 $99,541 $105,514 $111,844 $118,555
2 $95,012 $96,724 $102,527 $108,679 $115,200 $122,111
3 $97,863 $99,625 $105,604 $111,939 $118,656 $125,774
4 $100,799 $102,614 $108,772 $115,298 $122,215 $129,547
5 $103,823 $105,692 $112,035 $118,757 $125,882 $133,435
6 $106,938 $108,863 $115,397 $122,319 $129,658 $137,437
7 $110,146 $112,128 $118,859 $125,989 $133,548 $141,562
8 $113,450 $115,492 $122,424 $129,769 $137,555 $145,807
9 $116,854 $118,958 $126,096 $133,661 $141,681 $150,180
10 $120,360 $122,526 $129,880 $134,998 $143,098 $151,682
* The salary of employees assigned to 11-month positions. All other salaries are for 12-month positions.
APPENDIX A – 1

A P P E N D I X A
Business and Operations Administrators Salary Schedule Effective July 1, 2017–June 30, 2018 (Fiscal Year Basis)
Salary Steps G H I J K
1 $67,418 $71,462 $75,749 $80,295 $85,112
2 $69,440 $73,606 $78,021 $82,704 $87,665
3 $71,523 $75,814 $80,363 $85,185 $90,295
4 $73,668 $78,088 $82,773 $87,741 $93,005
5 $75,879 $80,430 $85,256 $90,373 $95,794
6 $78,155 $82,844 $87,813 $93,084 $98,669
7 $80,500 $85,330 $90,449 $95,877 $101,629
8 $82,915 $87,889 $93,162 $98,754 $104,678
9 $85,403 $90,526 $95,957 $101,716 $107,819
10 $87,965 $93,242 $98,837 $104,767 $111,053
11 $90,604 $96,039 $101,801 $107,910 $114,384
12 $93,321 $98,919 $104,855 $111,147 $117,815
APPENDIX A – 2

A P P E N D I X A
Teacher and Other Professional Salary Schedule Effective July 1, 2017– June 30, 2018 (Fiscal Year Basis)
Grade Step BA MA/MEQ MA/MEQ+30 MA/MEQ+60
1 $48,528 $53,462 $55,033 $56,455
2 $49,277 $54,359 $56,674 $58,098
3 $50,754 $56,452 $58,856 $60,335
4 $52,278 $58,625 $61,122 $62,657
5 $53,845 $60,883 $63,475 $65,070
6 $55,920 $63,226 $65,919 $67,575
7 $58,072 $65,661 $68,458 $70,178
8 $60,307 $68,189 $71,094 $72,879
9 $62,629 $70,815 $73,830 $75,685
10 $65,041 $73,541 $76,672 $78,598
11 $76,372 $79,624 $81,625
12 $79,313 $82,689 $84,767
13 $82,367 $85,873 $88,031
14 $85,537 $89,179 $91,419
15 $88,102 $91,854 $94,162
16 $90,747 $94,611 $96,987
17 $93,468 $97,449 $99,896
18 $96,272 $100,372 $102,895
19 $99,162 $103,384 $105,981
20 $99,162 $103,384 $105,981
21 $99,162 $103,384 $105,981
22 $99,162 $103,384 $105,981
23 $99,162 $103,384 $105,981
24 $99,162 $103,384 $105,981
25 $101,393 $105,711 $108,365
The salary of employees assigned to 12-month positions will be 117.5 percent of the salary of the step/grade (B/D) for which employee would qualify if employed in a 10-month position.
APPENDIX A – 3

A P P E N D I X A
Supporting Services Hourly Rate Schedule Effective July 1, 2017–June 30, 2018 (Fiscal Year Basis)*
GradeStep 1 2 3 4 5 6 7 8 9 10
4 12.94 13.41 13.93 14.51 15.14 15.80 16.41 16.73 17.08 17.39
5 13.41 13.93 14.51 15.14 15.80 16.41 17.11 17.40 17.79 18.15
6 13.93 14.51 15.14 15.80 16.41 17.11 17.79 18.18 18.53 18.91
7 14.51 15.14 15.80 16.41 17.11 17.79 18.60 18.91 19.32 19.68
8 15.14 15.80 16.41 17.11 17.79 18.60 19.32 19.68 20.08 20.48
9 15.80 16.41 17.11 17.79 18.60 19.32 20.14 20.53 20.96 21.37
10 16.41 17.11 17.79 18.60 19.32 20.14 21.07 21.54 21.97 22.39
11 17.11 17.79 18.60 19.32 20.14 21.07 22.10 22.59 23.02 23.47
12 17.79 18.60 19.32 20.14 21.07 22.10 23.32 23.78 24.23 24.68
13 18.60 19.32 20.14 21.07 22.10 23.32 24.41 24.86 25.32 25.86
14 19.32 20.14 21.07 22.10 23.32 24.41 25.61 26.12 26.63 27.15
15 20.14 21.07 22.10 23.32 24.41 25.61 26.89 27.47 28.04 28.60
16 21.07 22.10 23.32 24.41 25.61 26.89 28.23 28.80 29.34 29.92
17 22.10 23.32 24.41 25.61 26.89 28.23 29.64 30.26 30.88 31.45
18 23.32 24.41 25.61 26.89 28.23 29.64 31.08 31.67 32.34 33.00
19 24.41 25.61 26.89 28.23 29.64 31.08 32.64 33.27 33.97 34.63
20 25.61 26.89 28.23 29.64 31.08 32.64 34.26 35.00 35.66 36.38
21 26.89 28.23 29.64 31.08 32.64 34.26 35.92 36.64 37.40 38.14
22 28.23 29.64 31.08 32.64 34.26 35.92 37.57 38.33 39.12 39.90
23 29.64 31.08 32.64 34.26 35.92 37.57 39.34 40.15 40.97 41.77
24 31.08 32.64 34.26 35.92 37.57 39.34 41.21 42.03 42.84 43.76
25 32.64 34.26 35.92 37.57 39.34 41.21 43.12 44.01 44.85 45.77
26 34.26 35.92 37.57 39.34 41.21 43.12 45.15 46.04 46.97 47.88
27 35.92 37.57 39.34 41.21 43.12 45.15 47.23 48.25 49.19 50.14
28 37.57 39.34 41.21 43.12 45.15 47.23 49.46 50.42 51.44 52.48
29 39.34 41.21 43.12 45.15 47.23 49.46 51.84 52.89 53.92 54.99
30 41.21 43.12 45.15 47.23 49.46 51.84 54.31 55.40 56.53 57.70
APPENDIX A – 4

A P P E N D I X B
State Budget Categories
State law requires all counties and Baltimore City to appropri-ate and record expenditures for education in accordance with standardized state budget categories. This is so the Maryland State Department of Education may collect and compare data on local education spending from across the state. These state budget categories are based generally on broad functional clas-sifications such as administration, instructional costs, special education, and student transportation.
Below are summaries of the types of expenditures in each of the state categories of expenditure and the percent of each category to the total operating budget.
Category 1—Administration (1.8 percent)Administration includes activities associated with the general direction and control of the school district and includes such activities as establishing and administering policy, providing fiscal and business services, and central information systems and supporting each of the other instructional and supporting services programs. Administration includes expenditures for the Board of Education, executive staff units, evaluation and supporting services, administrators, supervisors, and human resources. These expenditures affect the district as a whole and are not confined to a single school building.
Category 2—Mid-level Administration (6.1 percent)Mid-level Administration includes supervision of district-wide and school-level instructional programs and activities. It in-cludes all school-based administration, including the office of the principal. Mid-level Administration includes school business and clerical activities, graduation expenses, curriculum develop-ment, supervision of guidance and psychological services, su-pervision of career and technology programs, and educational media services. Mid-level Administration also includes central district school support and improvement activities.
Category 3—Instructional Salaries (39.1 percent)Instructional Salaries includes expenditures for teaching stu-dents in general education settings. It includes most activities that occur on a regular basis at the school level or for the benefit of the instructional program. Instructional Salaries includes all salary expenditures for providing these activities, including sal-aries for teachers, paraeducators, school aides, teaching special-ists, resource teachers, psychologists, school counselors, media staff, part-time salaries, substitutes, and stipends but does not include employee benefits. Salaries for staff involved in profes-sional development activities also are included in this category.
Category 4—Textbooks and Instructional Supplies (1.2 percent)Textbooks and Instructional Supplies includes all supplies and materials used in support of Instruction. This category includes
books, media materials, computer materials, art and music sup-plies, science and laboratory supplies, and physical education supplies. This category also includes supplies used for extracur-ricular activities.
Category 5—Other Instructional Costs (0.5 percent)Other Instructional Costs includes all other expenditures for instruction, including contractual services, contractual copier maintenance, reimbursement for out-of-county tuition, consul-tants, equipment, school furniture, local travel, facilities rental, and miscellaneous expenditures related to instruction.
Category 6—Special Education (13.4 percent)Special Education includes instructional activities for students with disabilities. Special education includes expenditures for students in public schools and for tuition and other expen-ditures for students in nonpublic institutions. This category includes instructional salaries, textbooks and instructional supplies, and other instructional costs for special education students. This category also includes school administrative expenditures for schools dedicated to special education and professional development activities related to special education instruction.
Category 7—Student Personnel Services (0.5 percent)Student Personnel Services includes activities designed to improve student attendance at school and to prevent or solve student problems in the home, school, and community. This category includes pupil personnel workers and school social workers. This category also includes international student ser-vices, student affairs, and court liaison.
Category 8—Student Health Services (0.1 percent)Student Health Services includes physical and mental health activities that are not instructional and that provide students with appropriate medical, dental, and nursing services. In Mont-gomery County, nearly all student health services are provided by the Department of Health and Human Services, Division of School Health Services.
Category 9—Student Transportation (4.4 percent)Student Transportation includes activities concerned with the conveyance of students between home, school, and school activities. Included are vehicle operation services, monitoring services, vehicle servicing and maintenance services, transpor-tation training, and other student transportation services. This category does not include vehicle operations related to other school support activities.
APPENDIX B – 1

Category 10—Operation of Plant and Equipment (5.6 percent)Operation of Plant and Equipment includes activities concerned with keeping the physical plant open, comfortable, and safe for use. These activities include cleaning and regular upkeep of plant and equipment in schools, grounds, and other facilities; utilities expenditures, including telecommunications, materials management, and security services.
Category 11—Maintenance of Plant (1.4 percent)Maintenance of Plant includes activities concerned with keep-ing the grounds, buildings, fixed equipment (other than student transportation assets, and furniture and movable equipment) in their original condition of completeness or efficiency through repair, scheduled and preventive maintenance, or replacement of property.
Category 12—Fixed Charges (23.2 percent)Fixed Charges, primarily used for employee benefits expendi-tures, are charges of a generally recurrent nature that are not readily allocable to other expenditure categories. The following are included:
¡ Board contributions to employee retirement and social security
¡ Employee insurance benefits (health, life, accident, disability, etc.)
¡ Fidelity insurance, personal liability insurance, and judg-ments
¡ Interest on current loans ¡ Tuition reimbursement
Category 13—Food Service (0 percent)Food Service includes activities concerned with providing food to students and staff in schools. For budgetary purposes, MCPS chooses to allocate food service expenditures to the Food Ser-vice Fund (Category 61).
Category 14—Community Services (0.1 percent)Community Services are activities that are provided for the com-munity or some segment of the community and do not include public school activities and adult education programs. These services generally are provided to adults rather than to school-aged children. These services do not include parent support or engagement activities for the benefit of school instruction.
Category 37—MCPS Television Special Revenue Fund (0.1 percent)Through the MCPS Television Special Revenue Fund, MCPS is receiving revenue from the Montgomery County Cable TV Fund as part of the county Cable Television Plan. The majority of the Cable TV Fund revenue comes from license fees. This revenue is used to support MCPS television services.
Category 51—Real Estate Fund (0.1 percent)The Real Estate Fund is used to manage real estate lease rev-enues and expenditures as an enterprise activity. Revenue for the fund comes from real estate lease rentals, mainly from former schools.
Category 61—Food Service Fund (2.2 percent)The Food Service Fund provides all food service and nutrition programs for schools and other customers as an enterprise ac-tivity. Revenue for the fund comes from federal and state food aid programs and from the sale of meals to students and other customers.
Category 71—Field Trip Fund (0.1 percent)The Field Trip Fund provides transportation services for school field trips and external customers on a cost- recovery basis as an enterprise activity. Revenue for the fund comes from reimburse-ments by students and other customers.
Category 81—Entrepreneurial Activities Fund (0.1 percent)The Entrepreneurial Activities Fund provides entrepreneurial activities that earn outside revenue to help defray system costs. Revenue for the fund comes from sales of goods and services to external customers, including other government agencies and non-profit organizations. Entrepreneurial activities do not com-pete with commercial firms or engage in any activities unrelated to the instructional program. Entrepreneurial activities include warehouse services, printing, sales of curriculum materials, sales of science kits, and other entrepreneurial development activities.
The following tables display actual, budgeted, and recom-mended funding by state budget category.
APPENDIX B – 2
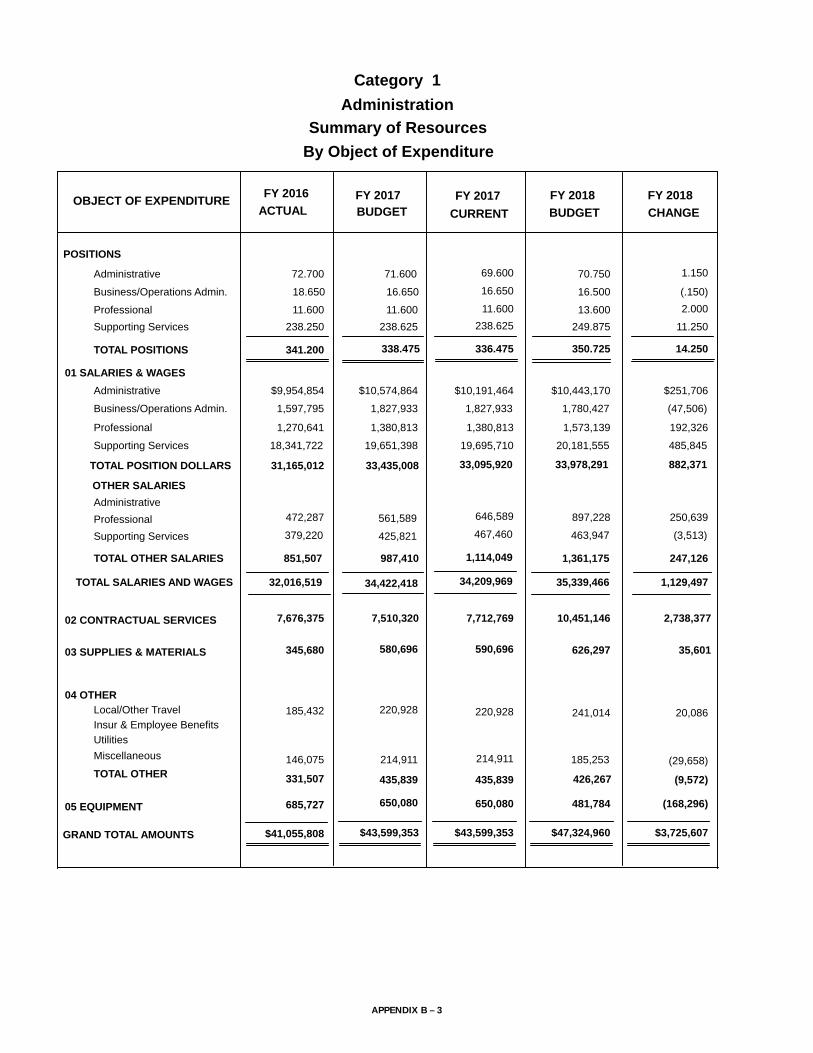
FY 2016
ACTUALFY 2017BUDGET
OBJECT OF EXPENDITURE
Category 1
CURRENT
FY 2017 FY 2018
BUDGET
FY 2018
Administration
Summary of Resources
By Object of Expenditure
CHANGE
$9,954,854 $251,706$10,443,170
31,165,012 33,435,008 33,095,920 33,978,291
646,589
425,821
32,016,519
882,371
472,287 561,589 897,228 250,639
379,220 467,460 463,947 (3,513)
851,507 987,410 1,114,049 1,361,175 247,126
34,422,418 34,209,969 35,339,466 1,129,497
7,676,375 7,510,320 7,712,769 10,451,146 2,738,377
345,680 580,696 590,696 626,297 35,601
220,928 220,928 241,014 20,086
146,075 214,911 214,911 185,253 (29,658)
331,507 435,839
685,727 650,080 650,080 481,784 (168,296)
$41,055,808 $3,725,607
TOTAL POSITION DOLLARS
OTHER SALARIES
AdministrativeProfessionalSupporting Services
TOTAL OTHER SALARIES
TOTAL SALARIES AND WAGES
02 CONTRACTUAL SERVICES
03 SUPPLIES & MATERIALS
05 EQUIPMENT
GRAND TOTAL AMOUNTS
POSITIONS
$10,574,864 $10,191,464Administrative
TOTAL POSITIONS 341.200 338.475 336.475 350.725 14.250
01 SALARIES & WAGES
Administrative 72.700 71.600 69.600 1.15070.750
$43,599,353 $47,324,960$43,599,353
185,43204 OTHER
Local/Other TravelInsur & Employee BenefitsUtilitiesMiscellaneous
TOTAL OTHER435,839 426,267 (9,572)
Professional 11.600 11.600238.250
11.600 13.600Supporting Services
2.000
238.625 238.625 249.875 11.250
16.650 16.650 16.500 (.150)
Professional 1,573,139
Supporting Services
1,270,641 1,380,813 192,3261,380,813
18,341,722 19,651,398 19,695,710 20,181,555 485,845
1,597,795 1,827,933 1,827,933 1,780,427 (47,506)
18.650Business/Operations Admin.
Business/Operations Admin.
APPENDIX B – 3

FY 2016
ACTUALFY 2017BUDGET
OBJECT OF EXPENDITURE
Category 2
CURRENT
FY 2017 FY 2018
BUDGET
FY 2018
Mid-level Administration
Summary of Resources
By Object of Expenditure
CHANGE
$74,570,904 ($268,070)$78,625,036
134,912,887 142,007,588 142,007,588 141,776,015
328,037 385,5281,106,315
1,196,471
137,475,454
(231,573)
385,528 335,528 (50,000)813,912 1,106,315 1,010,911 (95,404)
1,420,618 1,196,471 1,163,237 (33,234)
2,562,567 2,688,314 2,688,314 2,509,676 (178,638)
144,695,902 144,695,902 144,285,691 (410,211)
686,174 704,442 704,442 852,720 148,278
197,722 220,311 220,311 212,926 (7,385)
135,081 135,081 149,445 14,364
204,571 190,820 190,820 238,960 48,140
315,956 325,901
$138,675,306 ($206,814)
TOTAL POSITION DOLLARS
OTHER SALARIES
AdministrativeProfessionalSupporting Services
TOTAL OTHER SALARIES
TOTAL SALARIES AND WAGES
02 CONTRACTUAL SERVICES
03 SUPPLIES & MATERIALS
05 EQUIPMENT
GRAND TOTAL AMOUNTS
POSITIONS
$78,893,106 $78,893,106Administrative
TOTAL POSITIONS 1,654.800 1,674.500 1,676.500 1,682.000 5.500
01 SALARIES & WAGES
Administrative 569.500 583.500 585.500 (2.500)583.000
$145,946,556 $145,739,742$145,946,556
111,38504 OTHER
Local/Other TravelInsur & Employee BenefitsUtilitiesMiscellaneous
TOTAL OTHER325,901 388,405 62,504
Professional 80.800 78.000979.500
78.000 76.000Supporting Services
(2.000)
988.000 988.000 998.000 10.000
25.000 25.000 25.000
Professional 8,525,595
Supporting Services
8,516,439 8,615,249 (89,654)8,615,249
49,654,623 52,226,023 52,226,023 52,352,174 126,151
2,170,921 2,273,210 2,273,210 2,273,210
25.000Business/Operations Admin.
Business/Operations Admin.
APPENDIX B – 4

FY 2016
ACTUALFY 2017BUDGET
OBJECT OF EXPENDITURE
Category 3
CURRENT
FY 2017 FY 2018
BUDGET
FY 2018
Instructional Salaries
Summary of Resources
By Object of Expenditure
CHANGE
$616,613 $392,595
850,522,798 917,089,230 916,852,031 901,313,498
53,391,976
6,019,687
902,563,774
(15,538,533)
47,421,039 53,154,777 105,316,106 51,924,130
4,619,937 6,019,687 6,202,088 182,401
52,040,976 59,174,464 59,411,663 111,518,194 52,106,531
976,263,694 976,263,694 1,012,831,692 36,567,998
$902,563,774 $36,567,998
TOTAL POSITION DOLLARS
OTHER SALARIES
AdministrativeProfessionalSupporting Services
TOTAL OTHER SALARIES
TOTAL SALARIES AND WAGES
02 CONTRACTUAL SERVICES
03 SUPPLIES & MATERIALS
05 EQUIPMENT
GRAND TOTAL AMOUNTS
POSITIONS
$392,595 $392,595Administrative
TOTAL POSITIONS 11,088.072 11,721.177 11,716.177 11,671.704 (44.473)
01 SALARIES & WAGES
Administrative 4.000 3.000 3.000 3.000
$976,263,694 $1,012,831,692$976,263,694
04 OTHERLocal/Other TravelInsur & Employee BenefitsUtilitiesMiscellaneous
TOTAL OTHER
Professional 10,029.046 10,578.9561,055.026
10,571.956 10,616.371Supporting Services
44.415
1,139.221 1,141.221 1,052.333 (88.888)
Professional 859,702,503
Supporting Services
810,706,751 871,468,481 (11,335,133)871,037,636
39,199,434 45,228,154 45,421,800 41,218,400 (4,203,400)
Business/Operations Admin.
Business/Operations Admin.
APPENDIX B – 5
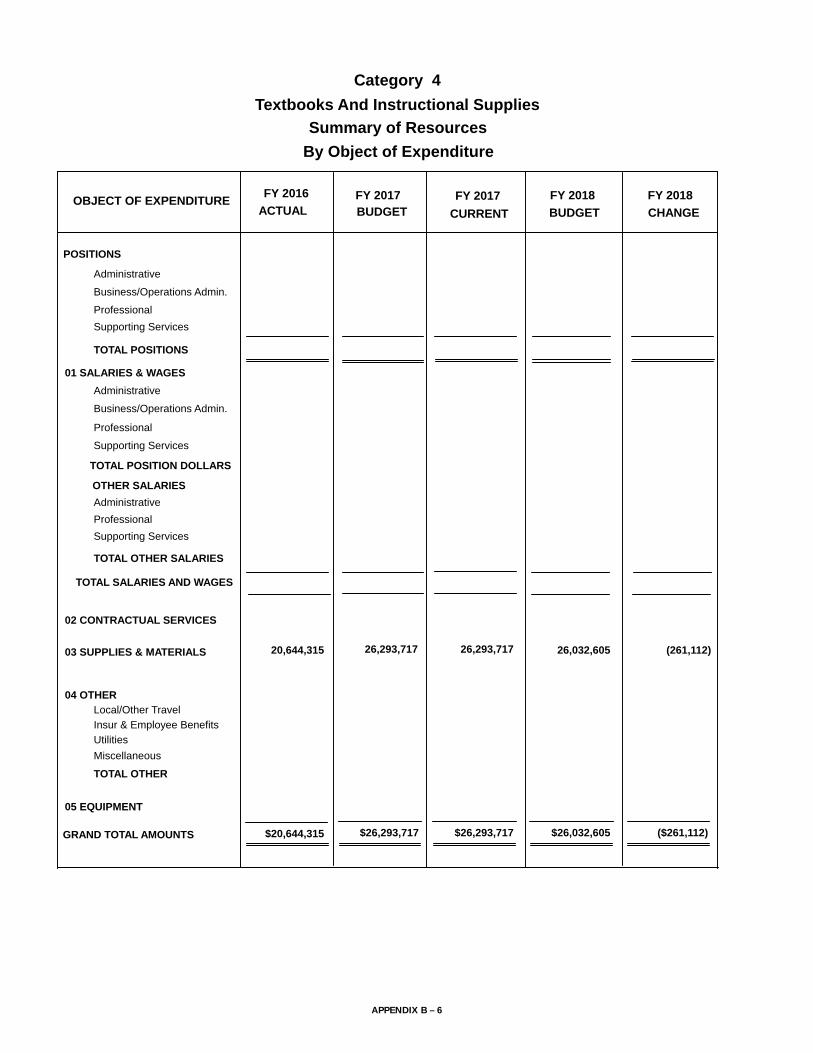
FY 2016
ACTUALFY 2017BUDGET
OBJECT OF EXPENDITURE
Category 4
CURRENT
FY 2017 FY 2018
BUDGET
FY 2018
Textbooks And Instructional Supplies
Summary of Resources
By Object of Expenditure
CHANGE
20,644,315 26,293,717 26,293,717 26,032,605 (261,112)
$20,644,315 ($261,112)
TOTAL POSITION DOLLARS
OTHER SALARIES
AdministrativeProfessionalSupporting Services
TOTAL OTHER SALARIES
TOTAL SALARIES AND WAGES
02 CONTRACTUAL SERVICES
03 SUPPLIES & MATERIALS
05 EQUIPMENT
GRAND TOTAL AMOUNTS
POSITIONS
Administrative
TOTAL POSITIONS
01 SALARIES & WAGES
Administrative
$26,293,717 $26,032,605$26,293,717
04 OTHERLocal/Other TravelInsur & Employee BenefitsUtilitiesMiscellaneous
TOTAL OTHER
ProfessionalSupporting Services
Professional
Supporting Services
Business/Operations Admin.
Business/Operations Admin.
APPENDIX B – 6

FY 2016
ACTUALFY 2017BUDGET
OBJECT OF EXPENDITURE
Category 5
CURRENT
FY 2017 FY 2018
BUDGET
FY 2018
Other Instructional Costs
Summary of Resources
By Object of Expenditure
CHANGE
4,232,391 5,168,980 5,153,758 7,198,455 2,044,697
1,145,71179,590
1,146,03379,590
1,008,580 (137,453)94,449 (79,590)
3,177,978 3,904,695 3,932,995 4,704,112 771,117
4,181,353 5,129,996
1,552,250 1,896,718 1,883,318 1,609,127 (274,191)
$9,965,994 $2,324,580
TOTAL POSITION DOLLARS
OTHER SALARIES
AdministrativeProfessionalSupporting Services
TOTAL OTHER SALARIES
TOTAL SALARIES AND WAGES
02 CONTRACTUAL SERVICES
03 SUPPLIES & MATERIALS
05 EQUIPMENT
GRAND TOTAL AMOUNTS
POSITIONS
Administrative
TOTAL POSITIONS
01 SALARIES & WAGES
Administrative
$12,195,694 $14,520,274$12,195,694
908,92604 OTHER
Local/Other TravelInsur & Employee BenefitsUtilitiesMiscellaneous
TOTAL OTHER5,158,618 5,712,692 554,074
ProfessionalSupporting Services
Professional
Supporting Services
Business/Operations Admin.
Business/Operations Admin.
APPENDIX B – 7

FY 2016
ACTUALFY 2017BUDGET
OBJECT OF EXPENDITURE
Category 6
CURRENT
FY 2017 FY 2018
BUDGET
FY 2018
Special Education
Summary of Resources
By Object of Expenditure
CHANGE
$4,842,696 $108,210$5,159,949
254,287,294 264,306,465 264,306,465 265,133,302
6,010,162
6,952,053
265,639,446
826,837
5,557,351 6,010,162 6,092,104 81,942
5,794,801 6,947,465 6,949,218 1,753
11,352,152 12,962,215 12,957,627 13,041,322 83,695
277,268,680 277,264,092 278,174,624 910,532
2,752,739 2,623,423 2,623,423 2,971,349 347,926
2,066,812 2,561,892 2,566,480 2,325,134 (241,346)
514,251 514,251 488,898 (25,353)
42,315,756 43,006,799 43,006,799 45,520,981 2,514,182
42,839,381 43,521,050
496,666 394,899 394,899 266,443 (128,456)
$313,795,044 $3,377,485
TOTAL POSITION DOLLARS
OTHER SALARIES
AdministrativeProfessionalSupporting Services
TOTAL OTHER SALARIES
TOTAL SALARIES AND WAGES
02 CONTRACTUAL SERVICES
03 SUPPLIES & MATERIALS
05 EQUIPMENT
GRAND TOTAL AMOUNTS
POSITIONS
$5,051,739 $5,051,739Administrative
TOTAL POSITIONS 3,967.536 4,018.583 4,018.583 4,094.884 76.301
01 SALARIES & WAGES
Administrative 36.000 37.000 37.000 1.00038.000
$326,369,944 $329,747,429$326,369,944
523,62504 OTHER
Local/Other TravelInsur & Employee BenefitsUtilitiesMiscellaneous
TOTAL OTHER43,521,050 46,009,879 2,488,829
Professional 2,271.900 2,299.0501,658.636
2,299.050 2,357.190Supporting Services
58.140
1,681.533 1,681.533 1,698.694 17.161
1.000 1.000 1.000
Professional 193,536,098
Supporting Services
184,712,040 191,332,602 2,203,496191,332,602
64,636,200 67,824,406 67,824,406 66,339,537 (1,484,869)
96,358 97,718 97,718 97,718
1.000Business/Operations Admin.
Business/Operations Admin.
APPENDIX B – 8

FY 2016
ACTUALFY 2017BUDGET
OBJECT OF EXPENDITURE
Category 7
CURRENT
FY 2017 FY 2018
BUDGET
FY 2018
Student Personnel Services
Summary of Resources
By Object of Expenditure
CHANGE
$1,106,094 $54,513$887,584
11,147,175 11,489,033 11,489,033 11,600,056
50,301
238,350
11,277,862
111,023
19,162 50,301 50,301
111,525 238,350 222,702 (15,648)
130,687 288,651 288,651 273,003 (15,648)
11,777,684 11,777,684 11,873,059 95,375
22,246 43,527 43,525 40,525 (3,000)
14,053 14,403 14,403 14,403
97,338 97,338 97,338
78,163 97,338
$11,392,324 $92,375
TOTAL POSITION DOLLARS
OTHER SALARIES
AdministrativeProfessionalSupporting Services
TOTAL OTHER SALARIES
TOTAL SALARIES AND WAGES
02 CONTRACTUAL SERVICES
03 SUPPLIES & MATERIALS
05 EQUIPMENT
GRAND TOTAL AMOUNTS
POSITIONS
$833,071 $833,071Administrative
TOTAL POSITIONS 111.740 111.740 111.740 114.240 2.500
01 SALARIES & WAGES
Administrative 8.000 6.000 6.000 1.0007.000
$11,932,952 $12,025,325$11,932,950
78,16304 OTHER
Local/Other TravelInsur & Employee BenefitsUtilitiesMiscellaneous
TOTAL OTHER97,338 97,338
Professional 70.430 72.43033.310
72.430 74.930Supporting Services
2.500
33.310 33.310 32.310 (1.000)
Professional 8,954,926
Supporting Services
8,323,180 8,830,737 124,1898,830,737
1,717,901 1,825,225 1,825,225 1,757,546 (67,679)
Business/Operations Admin.
Business/Operations Admin.
APPENDIX B – 9

FY 2016
ACTUALFY 2017BUDGET
OBJECT OF EXPENDITURE
Category 8
CURRENT
FY 2017 FY 2018
BUDGET
FY 2018
Health Services
Summary of Resources
By Object of Expenditure
CHANGE
2,0402,040 2,040
2,040 2,040 2,040
2,040 2,040 2,040
836 1,590 1,590 1,590
$836
TOTAL POSITION DOLLARS
OTHER SALARIES
AdministrativeProfessionalSupporting Services
TOTAL OTHER SALARIES
TOTAL SALARIES AND WAGES
02 CONTRACTUAL SERVICES
03 SUPPLIES & MATERIALS
05 EQUIPMENT
GRAND TOTAL AMOUNTS
POSITIONS
Administrative
TOTAL POSITIONS
01 SALARIES & WAGES
Administrative
$3,630 $3,630$3,630
04 OTHERLocal/Other TravelInsur & Employee BenefitsUtilitiesMiscellaneous
TOTAL OTHER
ProfessionalSupporting Services
Professional
Supporting Services
Business/Operations Admin.
Business/Operations Admin.
APPENDIX B – 10

FY 2016
ACTUALFY 2017BUDGET
OBJECT OF EXPENDITURE
Category 9
CURRENT
FY 2017 FY 2018
BUDGET
FY 2018
Student Transportation
Summary of Resources
By Object of Expenditure
CHANGE
$268,372 $285,978
65,354,532 70,686,583 70,686,583 69,577,699
660,778
4,541,508
76,050,354
(1,108,884)
391,927 660,778 660,778
10,303,895 4,541,508 4,555,162 13,654
10,695,822 5,202,286 5,202,286 5,215,940 13,654
75,888,869 75,888,869 74,793,639 (1,095,230)
1,264,704 1,648,741 1,648,741 1,569,255 (79,486)
9,164,509 12,038,756 12,038,756 10,937,988 (1,100,768)
54,522 54,522 54,522
1,195,183 1,346,140 1,346,140 1,586,887 240,747
1,248,963 1,400,662
12,570,981 13,422,598 13,422,598 14,107,088 684,490
$100,299,511 ($1,350,247)
TOTAL POSITION DOLLARS
OTHER SALARIES
AdministrativeProfessionalSupporting Services
TOTAL OTHER SALARIES
TOTAL SALARIES AND WAGES
02 CONTRACTUAL SERVICES
03 SUPPLIES & MATERIALS
05 EQUIPMENT
GRAND TOTAL AMOUNTS
POSITIONS
$285,978 $285,978Administrative
TOTAL POSITIONS 1,720.653 1,740.653 1,740.653 1,736.653 (4.000)
01 SALARIES & WAGES
Administrative 2.000 2.000 2.000 2.000
$104,399,626 $103,049,379$104,399,626
53,78004 OTHER
Local/Other TravelInsur & Employee BenefitsUtilitiesMiscellaneous
TOTAL OTHER1,400,662 1,641,409 240,747
Professional1,704.903Supporting Services 1,724.903 1,724.903 1,719.903 (5.000)
13.750 13.750 14.750 1.000
Professional
Supporting Services 63,639,316 68,918,229 68,918,229 67,709,345 (1,208,884)
1,446,844 1,482,376 1,482,376 1,582,376 100,000
13.750Business/Operations Admin.
Business/Operations Admin.
APPENDIX B – 11

FY 2016
ACTUALFY 2017BUDGET
OBJECT OF EXPENDITURE
Category 10
CURRENT
FY 2017 FY 2018
BUDGET
FY 2018
Operation Of Plant And Equipment
Summary of Resources
By Object of Expenditure
CHANGE
$823,020 $838,502
74,270,825 78,359,461 78,359,461 76,998,588
647,767
2,240,017
77,938,687
(1,360,873)
885,825 647,767 647,767
2,782,037 2,240,017 2,294,508 54,491
3,667,862 2,887,784 2,887,784 2,942,275 54,491
81,247,245 81,247,245 79,940,863 (1,306,382)
2,103,318 2,491,250 2,521,250 3,108,540 587,290
2,986,428 3,294,247 3,264,247 3,340,398 76,151
80,493 80,493 86,226 5,733
38,878,609 41,564,244 41,564,244 40,701,717 (862,527)4,235,972 4,401,165 4,401,165 5,013,592 612,427
43,194,575 46,045,902
383,406 403,037 403,037 445,639 42,602
$126,606,414 ($844,706)
TOTAL POSITION DOLLARS
OTHER SALARIES
AdministrativeProfessionalSupporting Services
TOTAL OTHER SALARIES
TOTAL SALARIES AND WAGES
02 CONTRACTUAL SERVICES
03 SUPPLIES & MATERIALS
05 EQUIPMENT
GRAND TOTAL AMOUNTS
POSITIONS
$838,502 $838,502Administrative
TOTAL POSITIONS 1,578.700 1,592.200 1,592.200 1,617.200 25.000
01 SALARIES & WAGES
Administrative 6.000 6.000 6.000 6.000
$133,481,681 $132,636,975$133,481,681
79,99404 OTHER
Local/Other TravelInsur & Employee BenefitsUtilitiesMiscellaneous
TOTAL OTHER46,045,902 45,801,535 (244,367)
Professional1,557.700Supporting Services 1,571.200 1,571.200 1,596.200 25.000
15.000 15.000 15.000
Professional
Supporting Services 71,954,649 75,982,039 75,982,039 74,621,166 (1,360,873)
1,493,156 1,538,920 1,538,920 1,538,920
15.000Business/Operations Admin.
Business/Operations Admin.
APPENDIX B – 12

FY 2016
ACTUALFY 2017BUDGET
OBJECT OF EXPENDITURE
Category 11
CURRENT
FY 2017 FY 2018
BUDGET
FY 2018
Maintenance Of Plant
Summary of Resources
By Object of Expenditure
CHANGE
$630,376 $624,716
21,215,993 22,883,033 22,883,033 22,932,797
162,053
958,947
22,096,029
49,764
158,330 162,053 162,053
721,706 958,947 958,947
880,036 1,121,000 1,121,000 1,121,000
24,004,033 24,004,033 24,053,797 49,764
4,576,029 2,419,414 2,419,414 2,462,271 42,857
3,833,723 3,181,954 3,181,954 3,317,863 135,909
2,752 2,752 2,752
3,008,481 3,217,049 3,217,049 3,467,049 250,000
3,009,157 3,219,801
1,148,339 1,362,021 1,362,021 1,362,021
$34,663,277 $478,530
TOTAL POSITION DOLLARS
OTHER SALARIES
AdministrativeProfessionalSupporting Services
TOTAL OTHER SALARIES
TOTAL SALARIES AND WAGES
02 CONTRACTUAL SERVICES
03 SUPPLIES & MATERIALS
05 EQUIPMENT
GRAND TOTAL AMOUNTS
POSITIONS
$624,716 $624,716Administrative
TOTAL POSITIONS 356.000 354.000 354.000 369.000 15.000
01 SALARIES & WAGES
Administrative 5.000 5.000 5.000 5.000
$34,187,223 $34,665,753$34,187,223
67604 OTHER
Local/Other TravelInsur & Employee BenefitsUtilitiesMiscellaneous
TOTAL OTHER3,219,801 3,469,801 250,000
Professional347.000Supporting Services 345.000 345.000 359.000 14.000
4.000 4.000 5.000 1.000
Professional
Supporting Services 20,153,189 21,812,012 21,812,012 21,776,591 (35,421)
432,428 446,305 446,305 531,490 85,185
4.000Business/Operations Admin.
Business/Operations Admin.
APPENDIX B – 13

FY 2016
ACTUALFY 2017BUDGET
OBJECT OF EXPENDITURE
Category 12
CURRENT
FY 2017 FY 2018
BUDGET
FY 2018
Fixed Charges
Summary of Resources
By Object of Expenditure
CHANGE
576,580,786 576,580,786517,624,739 15,760,431592,341,217
384,052 1,638,404 1,638,404 1,618,404 (20,000)
518,008,791 578,219,190
$518,008,791 $15,740,431
TOTAL POSITION DOLLARS
OTHER SALARIES
AdministrativeProfessionalSupporting Services
TOTAL OTHER SALARIES
TOTAL SALARIES AND WAGES
02 CONTRACTUAL SERVICES
03 SUPPLIES & MATERIALS
05 EQUIPMENT
GRAND TOTAL AMOUNTS
POSITIONS
Administrative
TOTAL POSITIONS
01 SALARIES & WAGES
Administrative
$578,219,190 $593,959,621$578,219,190
04 OTHERLocal/Other TravelInsur & Employee BenefitsUtilitiesMiscellaneous
TOTAL OTHER578,219,190 593,959,621 15,740,431
ProfessionalSupporting Services
Professional
Supporting Services
Business/Operations Admin.
Business/Operations Admin.
APPENDIX B – 14

FY 2016
ACTUALFY 2017BUDGET
OBJECT OF EXPENDITURE
Category 14
CURRENT
FY 2017 FY 2018
BUDGET
FY 2018
Community Services
Summary of Resources
By Object of Expenditure
CHANGE
252,939 272,059 272,059 272,059
13,912
41,970
317,108
12,945 13,912 13,912
51,224 41,970 41,970
64,169 55,882 55,882 55,882
327,941 327,941 327,941
179,223 355,775 355,775 430,775 75,000
48,240 42,515 42,515 42,515
17,747 17,747 17,747
72,807 69,111 69,111 114,111 45,000
90,334 86,858
$634,905 $120,000
TOTAL POSITION DOLLARS
OTHER SALARIES
AdministrativeProfessionalSupporting Services
TOTAL OTHER SALARIES
TOTAL SALARIES AND WAGES
02 CONTRACTUAL SERVICES
03 SUPPLIES & MATERIALS
05 EQUIPMENT
GRAND TOTAL AMOUNTS
POSITIONS
Administrative
TOTAL POSITIONS 3.000 4.250 4.250 4.250
01 SALARIES & WAGES
Administrative
$813,089 $933,089$813,089
17,52704 OTHER
Local/Other TravelInsur & Employee BenefitsUtilitiesMiscellaneous
TOTAL OTHER86,858 131,858 45,000
Professional 2.000 2.0001.000
2.000 2.000Supporting Services 2.250 2.250 2.250
Professional 167,000
Supporting Services
158,561 167,000 167,000
94,378 105,059 105,059 105,059
Business/Operations Admin.
Business/Operations Admin.
APPENDIX B – 15

FY 2016
ACTUALFY 2017BUDGET
OBJECT OF EXPENDITURE
Category 37
CURRENT
FY 2017 FY 2018
BUDGET
FY 2018
MCPS Television Special Revenue Fund
Summary of Resources
By Object of Expenditure
CHANGE
$144,750 $504$148,357
1,194,854 1,225,087 1,225,087 1,223,066
5,169
1,216,613
(2,021)
21,759 5,169 5,169
21,759 5,169 5,169 5,169
1,230,256 1,230,256 1,228,235 (2,021)
7,229 17,600 17,600 17,600
84,889 86,550 86,550 86,550
4,000401,785
4,000401,785
4,000341,822 (43,266)358,519
1,395 2,600 2,600 2,600
344,728 408,385
880
$1,654,339 ($45,287)
TOTAL POSITION DOLLARS
OTHER SALARIES
AdministrativeProfessionalSupporting Services
TOTAL OTHER SALARIES
TOTAL SALARIES AND WAGES
02 CONTRACTUAL SERVICES
03 SUPPLIES & MATERIALS
05 EQUIPMENT
GRAND TOTAL AMOUNTS
POSITIONS
$147,853 $147,853Administrative
TOTAL POSITIONS 13.500 13.500 13.500 13.500
01 SALARIES & WAGES
Administrative 1.000 1.000 1.000 1.000
$1,742,791 $1,697,504$1,742,791
1,51104 OTHER
Local/Other TravelInsur & Employee BenefitsUtilitiesMiscellaneous
TOTAL OTHER408,385 365,119 (43,266)
Professional12.500Supporting Services 12.500 12.500 12.500
Professional
Supporting Services 1,050,104 1,077,234 1,077,234 1,074,709 (2,525)
Business/Operations Admin.
Business/Operations Admin.
APPENDIX B – 16

FY 2016
ACTUALFY 2017BUDGET
OBJECT OF EXPENDITURE
Category 51
CURRENT
FY 2017 FY 2018
BUDGET
FY 2018
Real Estate Fund
Summary of Resources
By Object of Expenditure
CHANGE
$120,606 $123,313
440,654 673,024 673,024 673,024
65,620
508,111
67,457 65,620 65,620
67,457 65,620 65,620 65,620
738,644 738,644 738,644
1,979,537 2,064,281 2,064,281 2,376,281 312,000
14,630 38,304 38,304 31,304 (7,000)
5,193262,244
5,193262,244
3,493 (1,700)195,396 262,244
525,641 567,825 567,825 569,525 1,700
722,813 835,262
15,861 9,700 9,700 4,700 (5,000)
$3,240,952 $300,000
TOTAL POSITION DOLLARS
OTHER SALARIES
AdministrativeProfessionalSupporting Services
TOTAL OTHER SALARIES
TOTAL SALARIES AND WAGES
02 CONTRACTUAL SERVICES
03 SUPPLIES & MATERIALS
05 EQUIPMENT
GRAND TOTAL AMOUNTS
POSITIONS
$123,313 $123,313Administrative
TOTAL POSITIONS 8.500 12.000 12.000 12.000
01 SALARIES & WAGES
Administrative 1.000 1.000 1.000 1.000
$3,686,191 $3,986,191$3,686,191
1,77604 OTHER
Local/Other TravelInsur & Employee BenefitsUtilitiesMiscellaneous
TOTAL OTHER835,262 835,262
Professional7.500Supporting Services 11.000 11.000 11.000
Professional
Supporting Services 320,048 549,711 549,711 549,711
Business/Operations Admin.
Business/Operations Admin.
APPENDIX B – 17
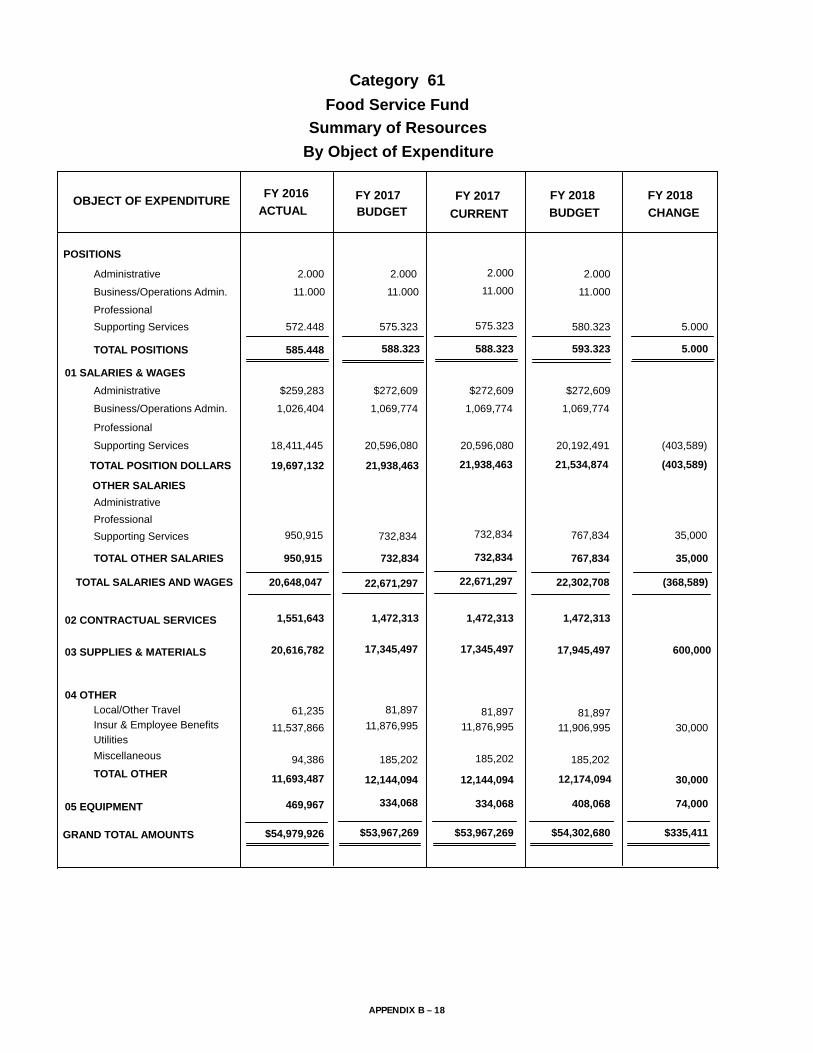
FY 2016
ACTUALFY 2017BUDGET
OBJECT OF EXPENDITURE
Category 61
CURRENT
FY 2017 FY 2018
BUDGET
FY 2018
Food Service Fund
Summary of Resources
By Object of Expenditure
CHANGE
$259,283 $272,609
19,697,132 21,938,463 21,938,463 21,534,874
732,834
20,648,047
(403,589)
950,915 732,834 767,834 35,000
950,915 732,834 732,834 767,834 35,000
22,671,297 22,671,297 22,302,708 (368,589)
1,551,643 1,472,313 1,472,313 1,472,313
20,616,782 17,345,497 17,345,497 17,945,497 600,000
81,89711,876,995
81,89711,876,995
81,89711,537,866 30,00011,906,995
94,386 185,202 185,202 185,202
11,693,487 12,144,094
469,967 334,068 334,068 408,068 74,000
$54,979,926 $335,411
TOTAL POSITION DOLLARS
OTHER SALARIES
AdministrativeProfessionalSupporting Services
TOTAL OTHER SALARIES
TOTAL SALARIES AND WAGES
02 CONTRACTUAL SERVICES
03 SUPPLIES & MATERIALS
05 EQUIPMENT
GRAND TOTAL AMOUNTS
POSITIONS
$272,609 $272,609Administrative
TOTAL POSITIONS 585.448 588.323 588.323 593.323 5.000
01 SALARIES & WAGES
Administrative 2.000 2.000 2.000 2.000
$53,967,269 $54,302,680$53,967,269
61,23504 OTHER
Local/Other TravelInsur & Employee BenefitsUtilitiesMiscellaneous
TOTAL OTHER12,144,094 12,174,094 30,000
Professional572.448Supporting Services 575.323 575.323 580.323 5.000
11.000 11.000 11.000
Professional
Supporting Services 18,411,445 20,596,080 20,596,080 20,192,491 (403,589)
1,026,404 1,069,774 1,069,774 1,069,774
11.000Business/Operations Admin.
Business/Operations Admin.
APPENDIX B – 18

FY 2016
ACTUALFY 2017BUDGET
OBJECT OF EXPENDITURE
Category 71
CURRENT
FY 2017 FY 2018
BUDGET
FY 2018
Field Trip Fund
Summary of Resources
By Object of Expenditure
CHANGE
315,374 321,327 321,327 321,327
932,385
1,268,151
952,777 932,385 1,182,385 250,000
952,777 932,385 932,385 1,182,385 250,000
1,253,712 1,253,712 1,503,712 250,000
47,292 49,638 49,638 49,638
493,430 521,666 521,666 571,666 50,000
138179,602
138179,602
138175,860 179,602
175,860 179,740
1,605 1,605 1,605
$1,984,733 $300,000
TOTAL POSITION DOLLARS
OTHER SALARIES
AdministrativeProfessionalSupporting Services
TOTAL OTHER SALARIES
TOTAL SALARIES AND WAGES
02 CONTRACTUAL SERVICES
03 SUPPLIES & MATERIALS
05 EQUIPMENT
GRAND TOTAL AMOUNTS
POSITIONS
Administrative
TOTAL POSITIONS 4.500 4.500 4.500 4.500
01 SALARIES & WAGES
Administrative
$2,006,361 $2,306,361$2,006,361
04 OTHERLocal/Other TravelInsur & Employee BenefitsUtilitiesMiscellaneous
TOTAL OTHER179,740 179,740
Professional4.250Supporting Services 4.250 4.250 4.250
.250 .250 .250
Professional
Supporting Services 289,955 297,089 297,089 297,089
25,419 24,238 24,238 24,238
.250Business/Operations Admin.
Business/Operations Admin.
APPENDIX B – 19

FY 2016
ACTUALFY 2017BUDGET
OBJECT OF EXPENDITURE
Category 81
CURRENT
FY 2017 FY 2018
BUDGET
FY 2018
Entrepreneurial Activities
Summary of Resources
By Object of Expenditure
CHANGE
832,826 756,770 756,770 764,045
277,266
22,037
1,143,755
7,275
287,877 277,266 345,746 68,480
23,052 22,037 22,037
310,929 299,303 299,303 367,783 68,480
1,056,073 1,056,073 1,131,828 75,755
572,090 557,432 557,432 2,054,990 1,497,558
372,685 387,386 387,386 531,558 144,172
18,785308,146
18,785308,146
18,785276,801 (13,400)294,746
277,743 326,931
55,109 36,980 36,980 52,895 15,915
$2,421,382 $1,720,000
TOTAL POSITION DOLLARS
OTHER SALARIES
AdministrativeProfessionalSupporting Services
TOTAL OTHER SALARIES
TOTAL SALARIES AND WAGES
02 CONTRACTUAL SERVICES
03 SUPPLIES & MATERIALS
05 EQUIPMENT
GRAND TOTAL AMOUNTS
POSITIONS
Administrative
TOTAL POSITIONS 13.600 11.600 11.600 12.000 .400
01 SALARIES & WAGES
Administrative
$2,364,802 $4,084,802$2,364,802
94204 OTHER
Local/Other TravelInsur & Employee BenefitsUtilitiesMiscellaneous
TOTAL OTHER326,931 313,531 (13,400)
Professional 3.000 1.00010.600
1.000 1.000Supporting Services 10.600 10.600 11.000 .400
Professional 130,056
Supporting Services
311,484 130,056 130,056
521,342 626,714 626,714 633,989 7,275
Business/Operations Admin.
Business/Operations Admin.
APPENDIX B – 20

K–12 Budget Staffing Guidelines for Professional Staff—FY 2018Position Elementary Guidelines Middle School Guidelines High School GuidelinesPrincipal 1.0 FTE per school 1.0 FTE per school 1.0 FTE per school
Assistant Principal Staffing is based on enrollment and number of professional staff. Schools with the largest student enrollment and/or professional staff are allocated an assistant principal.
1.0 FTE per school. Schools projected to have 650 or more students receive a second assistant principal or coordinator (magnet programs). Every effort is made not to remove the second assistant principal one year and have to restore it the next year and maintain administrative stability.
2.0 FTE per school. Schools projected to have more than 1,800 students receive a third assistant principal. Schools with projected enrollment greater than 2,500 receive a fourth assistant principal. Every effort is made not to remove the third assistant principal one year and have to restore it the next year and maintain administrative stability. If school has a coordinator, subtract 1.0 FTE from AP allocation. An additional AP is allocated to schools with FARMs >35% and large student to administrator ratio.
Assistant School Administrator (ASA)
1.0 FTE Allocated to the largest elementary schools
These positions are allocated (a) to schools with projected enrollment greater than 600 without a second assistant principal or coordinator (magnet programs), and (b) to schools that maintain enrollment greater than 1,000 students for more than one year.
These positions are allocated (a) to schools with projected enrollment greater than 1,250 without a third assistant principal or a coordinator, (b) to schools with projected enrollment greater than 2,000 without a fourth assistant principal or a coordinator, and (c) to schools with identified needs.
Magnet/Special Program Coordinator
1.0 FTE for each for cluster magnet and middle school consortium school.
One each for countywide magnet programs at Montgomery Blair and Poolesville high schools and the International Baccalaureate (IB) Program at Richard Montgomery High School.
School Business Administrator
1.0 FTE per school
Classroom Teacher These positions for Grades 1–5 are allocated based on enrollment projections for principals to organize the school with class sizes of 27 or less in Grades 1–3, 29 or less in Grades 4–5. Additional classroom teacher positions are provided to the focus schools to Grades 1–2 using a guideline of 18, to Grade 3 using a guideline of 26, and to Grades 4–5 using a guideline of 28. When numbers support it, positions are allocated for combination classes.
These positions are provided by formula [Enrollment x 7/(class size x 5)]. For schools with higher FARMs rates, a 0.8 FTE is subtracted from the class size divisor. For each resource teacher, content specialist, and team leader, 0.8 FTE of this calculation is moved to the resource teacher (RT) allocation. In additional, 0.8 FTE is added for reading and a 1.0 FTE is added for mathematics support.
These positions are provided by formula [Enrollment x 7/(class size x 5)]. For schools with higher FARMs rates, a 1.0 FTE is subtracted from the class size divisor. An additional 0.4 FTE is allocated to each school for release time for RTs. A 0.4 FTE of this calculation is removed for the athletic director allocation and 0.8 FTE of this calculation is moved to the resource teacher (RT) allocation.
Academic Intervention Teacher
These positions are allocated based on percent of FARMS
These positions are allocated based on percent of FARMS
These positions are allocated based on percent of FARMS
AP
PEN
DIX
C – 1

K–12 Budget Staffing Guidelines for Professional Staff—FY 2018Position Elementary Guidelines Middle School Guidelines High School GuidelinesSpecial Program Teacher These positions are allocated to support special
programs in schools including immersion, Primary Years International Baccalaureate (PYIB), and magnet programs.
These teacher positions are allocated to support home school and special program classes at schools with magnet programs and the Middle years Programmes.
These positions are allocated to schools with magnet, special, or signature programs.
Staff Development Teacher Staff development teachers, reading specialists, media specialists, and counselors are allocated to schools based on enrollment and FARMS. Schools determine which positions are staffed at 1.0 and which at 0.5 based on school priorities and needs.
0.8 FTE per school 0.6 FTE per school
ESOL Teacher ESOL teachers are allocated using proficiency based formulas for initial allocations and then scheduling once the school year has started. METS teacher allocations are based on pupil/teacher ratio of 15:1. METS students are not included in the ESOL teacher formula. Specific formulas for ESOL are provided in a separate memorandum.
ESOL teachers are allocated using proficiency based formulas for initial allocations and then scheduling once the school year has started. METS teacher allocations are based on the pupil/teacher ratio of 15:1. METS students are not included in the ESOL teacher formula. Specific formulas for ESOL are provided in a separate memorandum.
ESOL teachers are allocated using proficiency based formulas for initial allocations and then scheduling once the school year has started. METS teacher position are allocated to schools based on METS enrollment. Specific formulas for ESOL and METS are provided in a separate memorandum.
Media Specialist Staff development teachers, reading specialists, media specialists, and counselors are allocated to schools based on enrollment and FARMS. Schools determine which positions are staffed at 1.0 FTE and which at 0.5 FTE based on school priorities and needs.
1.0 FTE per school 1.0 FTE per school
Counselor Staff development teachers, reading specialists, media specialists, and counselors are allocated to schools based on enrollment and FARMS. Schools determine which positions are staffed at 1.0 FTE and which at 0.5 FTE based on school priorities and needs. An additional 0.5 counselor is allocated to non-focus schools with projected Grades K–5 enrollment >800, to focus schools with projected Grades K–5 enrollment >700, and to Title I schools with projected Grades K–5 enrollment >600.
These positions are allocated to schools based on projected enrollment and student to staff ratios using guideline of 250:1 ratio.
These positions are allocated to schools based on projected enrollment and student to staff ratios using guideline of 250:1 ratio.
Focus Teacher These positions are allocated to the schools with the highest FARMS percentages with formulas based on FARMS and enrollment. Focus teachers are locally funded and Title I funded.
These positions are allocated to schools based on enrollment and percent FARMS to lower class size in English and mathematics.
These positions are allocated to schools based on enrollment and percent FARMS to lower class size in English and mathematics.
AP
PEN
DIX
C – 2

K–12 Budget Staffing Guidelines for Professional Staff—FY 2018Position Elementary Guidelines Middle School Guidelines High School GuidelinesReading Initiative Teacher Staffing is allocated based on individual school
needs. For schools receiving additional staffing for class-size reduction in Grades 1 and 2, no additional allocations are authorized for the program.
Prekindergarten Teacher Positions are allocated with a 0.5 FTE teacher per 2.5 hour class.
Kindergarten Teacher These positions are allocated on a ratio of one teacher for every 25 students and one for every 18 students at the focus schools.
Instrumental Music Teacher These positions are allocated to schools based on the participation in instrumental music programs, Grades 4–5.
Reading Support Teachers These positions provide support to schools that are identified to implement reading intervention programs.
Reading Specialist/ Reading Teacher
Staff development teachers, reading specialists, media specialists, and counselors are allocated to schools based on enrollment and FARMS. Schools determine which positions are staffed at 1.0 FTE and which at 0.5 FTE based on school priorities and needs.
Content Specialist 6.0 FTE per middle school using the leadership model (1 release period); all content specialists must teach 4 classes, in a 7 period schedule.
Team Leader 3.0–6.0 FTE per middle school using the leadership model depending on school size and need (1 release period), all team leaders must teach 4 classes in a 7 period schedule.
Resource Teacher (RT)/Interdisciplinary Resource Teacher (IRT)
Based on enrollment and individual school needs (1 release period); all RTs/IRTs must teach 4 classes, in a 7 period schedule.
Based on enrollment and individual school needs (1 release period); all RTs/IRTs must teach 4 classes, in a 7 period schedule.
Resource Counselor Schools with four or more counselors are provided a resource counselor to coordinate programs.
Schools with four or more counselor FTEs are provided a resource counselor to coordinate programs.
AP
PEN
DIX
C – 3

K–12 Budget Staffing Guidelines for Professional Staff—FY 2018Position Elementary Guidelines Middle School Guidelines High School GuidelinesAlternative Teacher These positions are allocated based on
projected enrollment in the school, ineligibility, suspension, and poverty.
These positions are allocated based on projected enrollment in the school, ninth grade retention, ineligibility, suspension, drop-out rates, and poverty.
Career Support Teacher These positions are allocated based on size of school programs.
Career Preparation Teacher These positions are allocated based on size of the internship program.
Athletic Director 1.0 FTE per school is allocated (3 release periods).
AP
PEN
DIX
C – 4

K–12 Budget Staffing Guidelines for Supporting Services Staff—FY 2018Position Elementary Guidelines Middle School Guidelines High School GuidelinesAdministrative Secretary 1.0 FTE per school 1.0 FTE per school 1.0 FTE per school
Secretary I 1.0 FTE per school for all schools Schools with an ASA allocation receive an additional 1.0 FTE
1.0 FTE per school for all schools > 1,400 receive an additional 0.5 FTE700–1,399 receive an additional 0.25 FTE
Secretary positions (I and II) are allocated according to the following projected enrollments: > 2,550 = 7.0 FTE 2,250–2,549 = 6.0 FTE 1,950–2,249 = 5.0 FTE 1,650–1,949 = 4.0 FTE 1,350–1,649 = 3.0 FTE < 1,350 = 2.5 FTEThese guidelines provide the total number of positions to be divided between Secretary I and Secretary II positions.
Secretary II (10-month) These positions are allocated to the schools based on projected enrollment as follows: > 1,000 = 1.0 FTE 725–1,000 = 0.5 FTE 600–724 = 0.25 FTE
Secretary II (12-month) 1.0 FTE each for programs at Clemente, Eastern, and Takoma Park middle schools
Guidance Secretary 1.0 FTE per school 1.0 FTE per school
Registrar 1.0 FTE per school
College and Career Information Coordinator
1.0 FTE per school
Financial Specialist 1.0 FTE per school 1.0 FTE per school
Media Assistant Schools are allocated positions based on the following projected K–5 enrollments
>650 = 0.75 FTE ≤650 = 0.5 FTE
These positions are allocated to schools based on projected enrollment as follows: > 1,200 = 0.875 FTE 600–1,199 = 0.625 FTE 300–599 = 0.5 FTE
Allocations are made according to the following projected student enrollments: > 1,800 = 1.5 FTE 1,400–1,799 = 0.75 FTE < 1,400 = 0.625 FTE
Paraeducator, Regular Schools are allocated positions based on the following projected K–5 enrollments: > 850 = 2.0 FTE 800–849 = 1.875 FTE 750–799 = 1.75 FTE 700–749 = 1.625 FTE 650–699 = 1.5 FTE 600–649 = 1.375 FTE 550–599 = 1.25 FTE 500–549 = 1.125 FTE 450–499 = 1.0 FTE 400–449 = 0.875 FTE 350–399 = 0.75 FTE < 350 = 0.625 FTE
Schools are allocated positions based on the following guidelines: > 1,200 = 0.75 FTE 950–1,200 = 0.625 FTE 650–949 = 0.5 FTE < 650 = 0.375 FTE
Schools are allocated positions based on percent of projected school enrollment compared to total comprehensive high school enrollment.
AP
PEN
DIX
C – 5
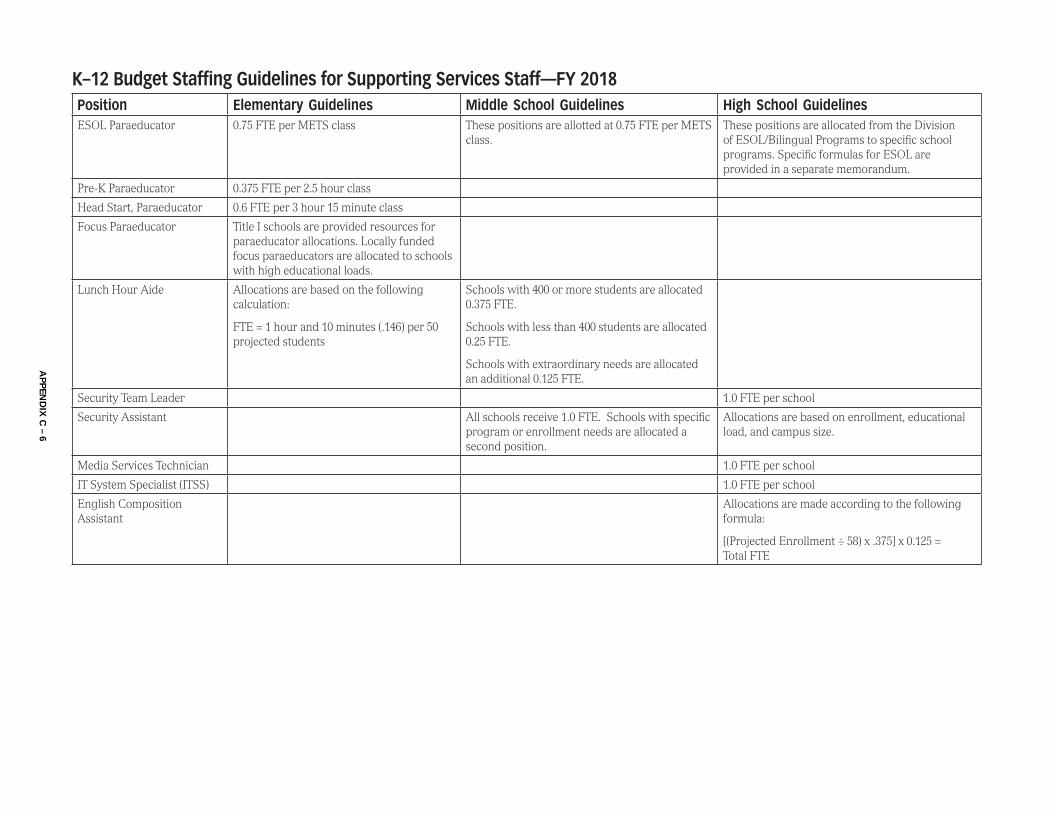
K–12 Budget Staffing Guidelines for Supporting Services Staff—FY 2018Position Elementary Guidelines Middle School Guidelines High School GuidelinesESOL Paraeducator 0.75 FTE per METS class These positions are allotted at 0.75 FTE per METS
class.These positions are allocated from the Division of ESOL/Bilingual Programs to specific school programs. Specific formulas for ESOL are provided in a separate memorandum.
Pre-K Paraeducator 0.375 FTE per 2.5 hour class
Head Start, Paraeducator 0.6 FTE per 3 hour 15 minute class
Focus Paraeducator Title I schools are provided resources for paraeducator allocations. Locally funded focus paraeducators are allocated to schools with high educational loads.
Lunch Hour Aide Allocations are based on the following calculation:
FTE = 1 hour and 10 minutes (.146) per 50 projected students
Schools with 400 or more students are allocated 0.375 FTE.
Schools with less than 400 students are allocated 0.25 FTE.
Schools with extraordinary needs are allocated an additional 0.125 FTE.
Security Team Leader 1.0 FTE per school
Security Assistant All schools receive 1.0 FTE. Schools with specific program or enrollment needs are allocated a second position.
Allocations are based on enrollment, educational load, and campus size.
Media Services Technician 1.0 FTE per school
IT System Specialist (ITSS) 1.0 FTE per school
English Composition Assistant
Allocations are made according to the following formula:
[(Projected Enrollment ÷ 58) x .375] x 0.125 = Total FTE
AP
PEN
DIX
C – 6

FISCAL YEAR 2018 SPECIAL EDUCATION STAFFING PLAN
Table of Contents
Pages Fiscal Year 2018 Special Education Staffing Plan Resolution D2
Fiscal Year 2018 Special Education Staffing Plan D3-13
Fiscal Year 2018 MCPS Special Education and Related Services Budget Guidelines
Attachment A
Fiscal Year 2018 Projected Special Education Enrollment, Services, and Positions
Attachment B
Fiscal Year 2016–2018 Special Education Improvement and Priorities Based on Staff and Community Member Input
Attachment C
Fiscal Year 2018 MCPS Special Education Staffing Plan and Operating Budget Timeline
Attachment D
Fiscal Year 2018 Special Education Staffing Plan Committee Attachment E
Fiscal Year 2018 Professional Development Plan—Teacher Sessions Attachment F
Fiscal Year 2018 Professional Development Plan—Paraeducator Sessions Attachment G
APPENDIX D – 1

The Code of Maryland Regulations (COMAR) requires each local school system to submit an annual special education staffing plan to the Maryland State Department of Education (MSDE). The plan must demonstrate public input and be approved by the local Board of Education prior to its submission to MSDE. The locally approved staffing plan is submitted to MSDE annually by July 1 with the local application for federal funds. MSDE reviews the staffing plan and advises the local agency if there is a need for additional information or revisions. If revisions are required, the local agency must submit the revised staffing plan by September 30. The required elements of the staffing plan include the following:
• Evidence of public input• Evidence of maintenance of effort within the meaning of 34 CFR §300.231,
Maintenance of Effort, and COMAR 13A.02.05, Maintenance of Effort• Staffing patterns of service providers of special education and related services• The number and type of service providers needed to provide a free, appropriate
public education (FAPE) for each student in the least restrictive environment(LRE)
• Local accountability and monitoring• Evaluation of the local staffing plan for effectiveness• Strategies to resolve concerns over staffing plans• Evaluation of the local staffing plan for effectiveness• Steps to secure public input in the development of the staffing plan• Information on how the public agency will use the staffing plan to monitor the
assignment of staff to ensure that personnel and other resources are available toprovide FAPE to each student with a disability in the LRE.
The following resolution is recommended for your consideration:
WHEREAS, The Maryland State Department of Education (MSDE) requires each local school system to submit an annual staffing plan; and
WHEREAS, The Special Education Staffing Committee composed of parents, teachers, principals, special education staff, and special education advocates held two meetings in June and December of 2016 and recommendations were submitted to the Department of Special Education; and
WHEREAS, The FY 2018 Recommended Operating Budget includes all of the staffing plan elements required by the Maryland State Department of Education; now therefore be it
Resolved, That the Board of Education approve the FY 2018 Special Education Staffing Plan as included in the FY 2018 Recommended Operating Budget; and be it further
Resolved, That upon final approval of the FY 2018 Operating Budget in June 2017, the Special Education Staffing Plan will be submitted to MSDE.
APPENDIX D – 2

Fiscal Year 2018 SPECIAL EDUCATION STAFFING PLAN Montgomery County Public Schools
December 2016
Overview
The responsibility of the Office of Special Education (OSE) is to provide a free appropriate public education (FAPE) to all students with disabilities in need of special education and related services—
• within a comprehensive, collaborative, and individualized support system that enablesaccess to the Montgomery County Public Schools (MCPS) curriculum;
• within the general education framework or the Alternate Learning Outcomes (ALO)aligned with Curriculum 2.0;
• based on articulated curriculum targets aligned with the Maryland College andCareer-Ready Standards (MCCRS) or ALO, as determined by the IndividualizedEducation Program (IEP) team; and
• in the student’s home school or home school cluster, to the maximum extent appropriate,in accordance with national, state, and local mandates.
Local school systems are required by the Code of Maryland Regulations (COMAR) 13A.05.02.13 D to develop a yearly Special Education Staffing Plan to ensure that sufficient staff members are available to meet the programming needs of students. The plan must be completed on or before July 1, with evidence of Montgomery County Board of Education (Board) approval. In addition, the plan is required to include the following:
• evidence of public input;• evidence of maintenance of effort within the meaning of 34 CFR §300.231, Maintenance
of Effort, and COMAR 13A.02.05, Maintenance of Effort;• staffing patterns of service providers for special education and related services;• consideration of time requirements beyond direct services;• the number and type of service providers needed to provide FAPE to each student with a
disability in the least restrictive environment (LRE);• local accountability and monitoring;• strategies to resolve concerns regarding staffing plans;• evaluation of the local staffing plan for effectiveness;• steps to secure public input in the development of the staffing plan; and• information on how the public agency will use the staffing plan to monitor the
assignment of staff members to ensure that personnel and other resources are available toprovide FAPE to each student with a disability in the LRE.
Introduction
As required by the Maryland State Department of Education (MSDE), the MCPS Fiscal Year (FY) 2018 Special Education Staffing Plan provides evidence of public input, professional
APPENDIX D – 3
development, special education service descriptions (Attachment A), special education enrollment, the number and types of direct service providers (Attachment B), and the process for reviewing and making adjustments to staffing and maintenance of effort. In addition, the plan recommends staffing priorities and recommendations for maintenance of initiatives for FY 2018 (Attachment C).
OSE recognizes and appreciates the Board’s support of special education through previous budget initiatives and the funding of required improvements. Because of ongoing fiscal limitations, the FY 2018 Staffing Plan Committee focused on critical areas of special education programming. Those items that were not included in the FY 2017 MCPS Program Budget were considered by the committee, special education program staff members, and the Department of Facilities Management (DFM), Budget and Planning staff members during the FY 2018 budget process that started in June 2016. See Attachment D for the FY 2018 Budget Timeline.
As stated in the MCPS Strategic Planning Framework, Building Our Future Together, MCPS is committed to narrowing the achievement gap for all service groups. This commitment was reinforced by two major pieces of federal legislation that drive the delivery of special education services: the Individuals with Disabilities Education Improvement Act (IDEA) and the Every Student Succeeds Act (ESSA). Board Policy IOB, Education of Students with Disabilities, further affirms the commitment of the school system to ensure the provision of a FAPE.
IDEA mandates that “to the maximum extent appropriate” students with disabilities shall be “educated with children who are not disabled.” Moreover, assignment to “special classes, separate schooling, or other removal of students with disabilities from the regular education environment” should occur “only when the nature or severity of the disability of a child is such that education in regular classes with the use of supplementary aids and services cannot be achieved satisfactorily.” In addition to this LRE mandate, IDEA regulations require school districts to ensure that a student with disabilities is “educated in the school he or she would attend if nondisabled” unless the IEP requires some other arrangement.
MCPS uses Results Driven Accountability (RDA) meetings to evaluate our system’s performance in alignment with the federal and state RDA measures. The outcome of this process drives our general supervision responsibilities for internal monitoring, targeted professional learning opportunities for schools, and ultimately our strategic plan, which drives student success.
ESSA holds schools accountable for improved educational outcomes for all students. ESSA specifically mandates testing and disaggregation of test results to show progress for students with disabilities and other identified student subgroups.
The Hours Based Staffing (HBS) model considers each school’s total number of students with IEPs, the total number of instructional IEP hours needed within the school, the number of grade levels being taught, the number of IEP hours a special educator is responsible for in a given week, and a minimum-base teacher allocation. This staffing model does not incorporate staffing for discrete program services such as Learning and Academic Disabilities (LAD), School Community Based (SCB), Learning for Independence (LFI), Autism, and Emotional Disabilities (ED). Since the implementation of the elementary Home School Model (HSM), the number of
APPENDIX D – 4

elementary schools providing this staffing model has increased. Prior to FY 2017, there were 68 elementary schools offering HSM services. In FY 2017, 20 more elementary schools were identified as HSM and provided with a series of professional learning activities designed to build the capacity of staff members to instruct students with more complex disabilities. This initiative will result in increased access for students to special education services within their neighborhood schools and to inclusion opportunities.
At the elementary level, from 2013 through 2014, professional learning continued to focus on Curriculum 2.0, which is aligned with the MCCRS and embeds Universal Design for Learning (UDL) practices. It is a digital curriculum that ensures all students, including students with disabilities, can access general education instruction. The focus in the 2015–2016 school year was on addressing evidence-based practices in reading and mathematics to ensure student access and success with Curriculum 2.0. Professional learning on UDL principals was provided in a variety of formats including webinars, workshops, Professional Learning Communities (PLCs), and continuing professional development courses for graduate credits. A variety of UDL teacher self-reflection tools and instructional “look-fors” provided school staff members a breakdown of practices to measure progress toward full UDL implementation in the classroom.
Middle school HBS is a staffing model that allocates special education teachers and paraeducators based on the total number of direct instructional service hours on student IEPs. HBS allows for more flexible programming options, including coteaching. In addition, this staffing model ensures that students with disabilities have access to a continuum of services, including consultation, resource support, cotaught classes, and self-contained classes in their home or consortia schools without having to be placed into more restrictive, centralized services. This staffing model is implemented in all MCPS middle schools.
Principal Advisory Committee meetings and PLC meetings are conducted throughout the school year as a forum for open dialogue and communication. Topics covered during these meetings include initial feedback on new initiatives, sharing of best practices, concerns, and staffing considerations. Any staffing concerns raised during these meetings are explored for potential solutions. A project team may be formed with key stakeholders. The project team’s mission is to research, investigate, and develop recommendations for review by executive leadership. These recommendations are used to drive budget discussions, which allows for staffing changes and enhancements.
During the 2015–2016 school year, staff members from the Department of Special Education Services (DSES) and the Division of Business, Fiscal and Information Systems (DBFIS) reviewed information from student IEPs using the Online Administrative Student Information System/Special Services (O/SS) data system, classroom observations, MSDE mandates, due process hearing decisions, and input from staff and community members to determine the effectiveness of the MCPS FY 2017 Special Education Staffing Plan and to make recommendations for FY 2018 staffing.
Professional learning activities also are aligned with other system initiatives that focus on the provision of special education services within home or consortia schools. During the 2015–2016 and continuing into the 2016–2017 school year, OSE, the Office of Curriculum and Instructional Programs (OCIP), and the Office of School Support and Improvement (OSSI) combined efforts
APPENDIX D – 5

to ensure that students with disabilities gain access to the general education curriculum at all school levels. General and special education teachers are participating in professional learning opportunities based on best practices associated with UDL, collaborative planning, differentiated instruction, and the use of technology. Furthermore, professional learning will be provided to support the instruction of students with autism spectrum disorders in the LRE and understanding language acquisition for students that are second language speakers of English. Staff members will have multiple opportunities to build their capacity in providing evidence-based mathematics and reading interventions, with a focus on building the skills students need to access the curriculum. As technology supports evolve for our students with vision, hearing, and communication challenges, training is being provided to staff members in order to enhance the support for this group of students. First year teacher training is offered annually and there are monthly secondary special education resource teacher meetings for ongoing opportunities for professional support, communication, and learning.
MCPS holds all staff members accountable for student outcomes. MCPS is committed to increasing collaboration among all offices, staff members, schools, and the community to ensure coordinated services meet the needs of all students in the most effective and efficient ways. The MCPS Special Education Staffing Plan is a vehicle to ensure that appropriate personnel are available to deliver the services required to implement student IEPs. It provides balance among student needs, teacher responsibilities, and the educational settings in which services will be provided.
MCPS Budget Review and Adoption Process
On December 13, 2016, the superintendent of schools presents his Recommended FY 2018 Operating Budget to the members of the Board and the community. The budget reflects input from a variety of public and private stakeholders, including input provided from the FY 2017 Special Education Staffing Plan Committee. Two public FY 2018 budget hearings will be held on January 5 and January 11, 2017. The Board operating budget work sessions will be held on January 17 and January 19, 2017, and the Board is scheduled to approve the Superintendent’s Recommended FY 2018 Operating Budget on February 14, 2017. The Board’s recommended budget will be sent to each principal, Parent Teacher Association president, and public library after March 1, 2017, which is when the law requires that it be submitted to the Montgomery County executive and the County Council.
The county executive will make his recommendations for the MCPS budget on March 15, 2017, and the County Council will hold public hearings on all local government budgets in April 2017. The County Council’s Education Committee will hold work sessions on the Board’s recommended budget in April 2017, and the full County Council will review the school system budget in May 2017. The Montgomery County Charter, as amended by voters in November 1992, requires that the County Council act on all budgets by May 31 of each year. This year, the County Council is scheduled to approve the county budget on May 19, 2017. After the County Council completes its appropriation action, the Board may adopt the final approved budget for FY 2018 on June 13, 2017. A timeline of budget actions can be found in Attachment D.
APPENDIX D – 6

Public Input
Mrs. Julie S. Hall, director, DBFIS, invited members of the community, DSES/DBFIS, the Special Education Advisory Committee, and other stakeholders to participate on the FY 2018 Special Education Staffing Plan Committee. The committee met on June 7, 2016, to review the FY 2017 Special Education Staffing Plan, receive information regarding the FY 2017 MCPS budget, receive public input, and make recommendations for priorities to be considered for inclusion in the FY 2018 budget (see Attachment E for a list of committee members).
During the meeting held on June 7, 2016, the committee received an overview of the elements of a staffing plan, considered how the process of developing a staffing plan aligned with the new MCPS budget process, and reviewed the FY 2017 Special Education Staffing Plan Committee recommendations and final FY 2017 special education budget allocations.
During the June 7, 2016, meeting the Special Education Staffing Plan committee was asked to participate as a focus group. The committee was asked to consider current resources, and the use of those resources to support students with special needs in order to provide them with the skills needed to be successful in college and career when responding to the following questions.
1. An achievement gap exists for students with disabilities. What is currently in place thatprovides for effective allocation and use of resources? What upgrades and/or changescan be developed to improve the allocation and use of the resources?
2. We are charged as a system to ensure all students have the academic, creative problemsolving, and the social emotional competencies that they will need to be successful inthe 21st century. What changes can be implemented in how resources are allocatedand in the organizational use of these resources to support the success of students withdisabilities?
3. System priorities, staff responsibility, and student needs and expectations are aligned tothe current expectations for our 21st century graduates. Should resources beconsidered for realignment? If so, which resources? Should resources be adjusted tomeet the priorities? If so, which resources?
The committee selected the following top priorities from the input of the group— 1. re-examine current prekindergarten (pre-K) staffing models to increase opportunities for
students with disabilities to receive services in regular early childhood program settings; 2. consider increasing High Incidence Assistive Technology staffing for technology support
to schools and to apply the principles of UDL; 3. make all elementary schools HSM using the hours-based staffing model; and4. change the LAD staffing ratio to the HBS model.
During the process of budget development, the committee’s recommendations are considered as strategic program enhancements and are incorporated into professional learning plans as priorities emerged based on student outcomes. How the recommendations are implemented is dependent on the types of priorities generated by the committee. Several initiatives were considered for the development of the FY 2018 budget, but due to the fiscal situation, initiatives were not able to be included. Funding to address professional learning goals is provided by using MSDE grant funds.
APPENDIX D – 7
On December 19, 2016, the committee will receive an update on the FY 2018 budget process and a review of the special education budget that is included in the Superintendent’s FY 2018 Recommended Operating Budget. The FY 2018 Special Education Staffing Plan will be available on the MCPS website. In December 2016, a written copy will be distributed with the Superintendent’s FY 2018 Recommended Operating Budget.
The special education staffing plan process is aligned closely with the MCPS operating budget process, with public input and community involvement ongoing throughout the process. Input received from the FY 2018 Special Education Staffing Plan Committee was considered during the ongoing budget planning process and the development of the FY 2018 Special Education Staffing Plan. In addition, oral and written testimonies received through the Board’s budget hearings will be considered as final changes are made to the Superintendent’s FY 2018 Recommended Operating Budget.
Professional Learning
The delivery of special education instruction is an integral part of the MCPS systemic school improvement planning process. Teams that make decisions about special education services are aware of their responsibility to consider each student’s needs, and the supports and services necessary to provide the student with access to, and participation in, the MCPS curriculum in the LRE.
A key element in the provision of FAPE for students with disabilities is the availability of skilled personnel to implement each student’s IEP. Through the collaborative efforts of DSES and OCIP, special education staff members who deliver the general education curriculum to students with disabilities participate in mandatory, voluntary, and school-specific professional learning activities including webinars that ensure the delivery of effective instructional best practices. Voluntary training modules provide professional learning opportunities for all school personnel responsible for IEP implementation including general educators, school counselors, psychologists, pupil personnel workers, administrators, and paraeducators.
Central services special education staff members work with OCIP to provide ongoing support, technical assistance, and consultation to special education service providers and programs for pre-K and school-age students as follows:
• DSES staff members work closely with the Division of Early Childhood Programs andServices and OCIP to provide professional learning on Maryland’s Early ChildhoodComprehensive Assessment System, including the Kindergarten Readiness Assessment,MCPS pre-K curriculum, collaboration, and coteaching strategies.
• DSES staff members provide extensive professional learning sessions and job-embeddedcoaching for staff members supporting students with autism spectrum disorders.
• DSES staff members provide professional learning on reading and mathematicsinterventions, as well as ongoing, job-embedded coaching and support of evidence-basedreading and mathematics methodologies in elementary/secondary LAD, Learning Center,ED cluster, LFI classrooms, and in HSM schools.
APPENDIX D – 8

• DSES staff members provide professional learning sessions to selected schools onmathematics instructional practices and strategies to ensure student access to Curriculum2.0 and increase the performance of students with disabilities on assessments in order tonarrow the achievement gap with their nondisabled peers.
The role of the itinerant resource teacher (IRT) is to facilitate the implementation of services for students with disabilities in the LRE. IRTs have a wide range of expertise in autism spectrum disorders, behavioral and emotional support strategies, elementary and secondary instruction, and mathematics and reading instruction. The team provides professional learning and job-embedded coaching to school staff members to improve students’ success in the LRE and improve the overall student outcomes of students with disabilities.
Special education students may be served by the general education teacher or a coteaching team (general education teacher and special education teacher) in the inclusive school environment. Both general education teacher and the special education teacher and related service providers are responsible for supporting all of their assigned students. The general education teacher, in collaboration with the special educator and related service providers, is responsible for implementing the IEP and ensuring that the students with special needs receive designated accommodations and are provided with the supports required to access instruction. In collaboration with the special educator, the general educator reports on progress, implements and discusses strategies, supports IEP development, and is a member of the IEP team. Teachers and service providers are provided with adequate planning time as specified by the teacher contact. Information also has been disseminated across the county to support administration in designing schedules that provide for common planning time, whenever possible, for coteaching teams.
The majority of students with IEPs are served along with their peers in the general education classroom. Students are served not only by general educators, but by school counselors, and administrators. In order to ensure the provision of FAPE for all students in FY 2017, 11,486.264 Full-time equivalents (FTEs) were budgeted for general education teachers, 488.000 FTEs were budgeted for counselors, and 197.600 FTEs were budgeted for administrators to ensure the support of all students. This provision of staffing will be maintained for FY 2018 and adjusted in accordance with changes in the student population.
Evaluation of Staffing Plan for Effectiveness
MSDE established LRE targets for local school systems that require students with disabilities to receive special education and related services in a general education setting or a combined general education and special education setting. The current MSDE targets are to increase LRE A (in general education greater than 80 percent of the day) and decrease LRE C (removed from general education greater than 60 percent of the day—i.e., self-contained classrooms). It is assumed that as the number of students in LRE C decreases, students will transition into more inclusive environments. The LRE targets, which are closely monitored by MSDE, will ensure that established standards are met and hold schools and local school systems accountable for student performance.
In FY 2016, 66.31 percent of students with disabilities were served in the general education environment, LRE A, and 13.38 percent of students with disabilities were served in LRE C.
APPENDIX D – 9

MCPS did not meet the increased MSDE target of 69.9 percent of students with disabilities served in LRE A, nor the decreased MSDE target for students with disabilities served in LRE C.
The MSDE monitoring priority area is to provide FAPE in the LRE. Measurable and rigorous targets are established. The MCPS LRE performance data and MSDE targets from October 2013 through 2015 are indicated in the chart below.
Percentage of MCPS Students with Disabilities by LRE
Inclusion Indicator 2013–2014 2014–2015 2015–2016
MCPS LRE A 67.35% 66.85% 66.31%
MSDE Target for LRE A 68.90% 69.40% 69.90%
MCPS LRE C 13.06% 12.85% 13.38%
MSDE Target for LRE C 6.44% 6.19% 5.94%
In order to increase opportunities for students with disabilities to be educated with their typical peers in the LRE, MCPS restructured the secondary resource service model during the 2015–2016 school year. Historically, the resource program exclusively served students with disabilities in a self-contained classroom. The resource program may now serve general education students, students with disabilities, and/or students with 504 plans. The newly defined composition of students will reclassify the environment from a self-contained special education class to a general education setting designed to provide small group instruction. The resource program will serve a diverse group of students, providing opportunities for improving organizational skills, previewing content, and reviewing lessons. Special and general education teachers have the opportunity to reteach and reassess in the core content areas.
Along with the monitoring and data collection on LRE targets, critical staffing data, and staffing program changes are used to evaluate the effectiveness of our staffing plan. Critical staffing allocated as additional paraeducators is used to support individual students, an inclusive program, or individualized LRE setting.
As more students with greater learning challenges access instruction in the LRE setting, the use of critical staffing paraeducators has increased. From FY 2012 to FY 2015, the number of assigned critical staffing hours increased by 32.6 percent. From FY 2015 to FY 2016, the assignment of critical staffing hours increased by less than 1 percent, indicating that this level of enhanced support is meeting the needs of our students.
We continued to maintain a high level of accuracy in FY 2016 staffing projections. Greater accuracy in the projection of staffing is the result of process improvements used to develop the special education budget. This includes accurate enrollment projections and increased transparency through the active participation of the special education supervisors in the budget development process. The data collected on staffing changes after the initial allocation has been steadily improving, and is reflected in an overall 15.8 percent decrease in the number of staffing changes between FY 2013 and FY 2015.
APPENDIX D – 10

OSE oversees the process of staffing allocations, changes, and budget. The staffing plan is reevaluated annually in June after receiving input from the Staffing Plan Committee and other key stakeholders; however, staffing is monitored throughout the school year. In the event that student enrollment does not justify the allocated staffing, the staff member is reassigned to an area of need. The reassignment is to a similar classroom whenever possible. It is not the practice of MCPS to move students to accommodate for staffing concerns. Students with disabilities may benefit from a higher ratio of teachers to students, depending on the level of need and learning style. We also identify a specific allocation of teachers and paraeducators to support students with disabilities in LRE.
In FY 2018, we will continue to monitor our staffing plan, LRE data, and critical paraeducator staffing data. We are consistently making upgrades to our monitoring methods to provide for the most accurate and timely data. This data will provide more documentation for the ongoing review of our staffing models to better understand the pattern of staffing needs in alignment with the needs of our students with disabilities.
Special Education Facilities and Staffing Patterns
According to the September 30, 2015, Maryland Special Education Census Data, 18,245 MCPS students, ages 3 to 21, received special education services. Of those students, 364 received services in a public, separate, special education day school and 533 students received services in a nonpublic special education day school.
Participation in the LRE requires access to general education classrooms. DSES, DBFIS, the Department of Transportation, DFM, and OSSI are engaged in long-range planning to provide increased options for students with disabilities to access the general education environment throughout the system. The distribution of cluster and countywide services is based on the assumption that all students will be educated in their home school or home school cluster, if possible. For example, programs for high incidence disabilities, such as learning disabilities, are available in every cluster at the elementary and secondary levels. In contrast, highly specialized programs for students who are Deaf/Hard-of-Hearing (D/HOH) are provided on a countywide basis in centralized locations. However, many D/HOH students are able to be served in their home school.
Trends related to the identification, evaluation, and placement of students with disabilities have contributed significantly to decisions regarding the location of a variety of programs and services. Increasing the percentage of students receiving special education services in their home school, cluster, or quadcluster is the goal of OSE. The following special education services are available in MCPS:
• Special education resource services are offered in all comprehensive schools,kindergarten–Grade 12. Eighty-eight elementary schools provide HSM services throughthe HBS model. A continuing goal is to provide equitable staffing in the schoolsimplementing this approach. The HBS model is provided in each middle school and isused to allocate sufficient staffing to support all students, including those who requireresources and LAD services. LAD services are offered in each high school and inselected elementary schools using a staffing enrollment model.
APPENDIX D – 11

• Autism Resource Services are based in selected comprehensive middle and high schoolbuildings. Students served by this model have a diagnosis of an autism spectrumdisorder. These students are accessing the general education curriculum withmodifications and accommodations; specifically, these students are approximately two tothree years below grade level. Students have documented social and emotional needs thatsignificantly interfere with their ability to participate in other educational environments,despite a variety of special and individualized supports. Students are included for allacademic classes in the general education environment with accommodations andmodifications.
• Instruction to students with autism at Jones Lane Elementary Learning Center continuesto be provided in alignment with evidence-based practices that have proved to be highlyeffective for students with autism.
• Special education services are quadcluster-based for students in need of an ElementaryLearning Center, LFI, or SCB class.
• Special education services are available regionally for students with disabilities throughthe Preschool Education Program, Prekindergarten Language classes, classes for studentswith autism spectrum disorders, the Extensions Program, cluster-based services forstudents with emotional disabilities in kindergarten–Grade 12, Gifted andTalented/Learning Disabled Services, and the Longview and Stephen Knolls schools.
• Countywide special education services models are available for students in the followingareas: D/HOH Program, pre-K Vision Services, Physical Disabilities classes, theAugmentative and Alternative Communication classes, the Carl Sandburg LearningCenter, the John L. Gildner Regional Institute for Children and Adolescents, and theRock Terrace School.
• At Magruder High School, a specially designed ED Cluster services model has beenexpanded to enroll students in Grades 9–11 in order to expand the continuum of servicesand address the instructional and mental health needs of students with emotionaldisabilities.
• Extensions services, previously only in middle and high school, expanded to anelementary school with additional locations added at the secondary level in FY 2016. InFY 2018, the program will expand to an additional elementary site. This will increase theservices provided for students with autism and complex emotional and behavioral needs.
Special education classes and program locations are identified in the MCPS Superintendent’s Recommended FY 2018 Capital Budget and The Amendments to the FY 2017–2022 Capital Improvements Program that is published annually in October. However, as enrollment projections and program needs are refined during the year, the location of some classes and programs may change.
Providing pre-K special education services in the LRE is challenging due to the limited number of general education pre-K programs and services available in MCPS. The Division of Prekindergarten, Special Programs, and Related Services (DPSPRS) and the Division of Title I Early Childhood Programs and Services continue to collaborate to provide services for students with disabilities in regular early childhood classrooms, and to colocate general and special education pre-K classes. The Division of Long-range Planning and OSSI also are involved in this process, as it has an impact on elementary facilities and requires careful coordination of long-range facilities and program planning. General and special educators use coteaching and
APPENDIX D – 12
collaborative planning strategies to provide instruction to pre-K students with and without disabilities. In FY 2017, this collaborative teaching model added a school and is now located in 21 MCPS elementary schools.
In an effort to improve kindergarten readiness and increase opportunities for young students with disabilities to be served with their nondisabled peers, MCPS extends invitations for community peers to participate in identified pre-K classrooms. DPSPRS is focused on increasing partnerships with community preschools and child-care centers. Pre-K staff members will provide services to young children with disabilities in their early childhood setting. As a result, students with disabilities are better prepared for general education kindergarten settings.
Ongoing Review and Adjustments to Staffing
The process of allocating staff for the following school year begins with reviews of student enrollment as reported in the O/SS data system from September through December of the preceding year. These reviews identify any unanticipated special education enrollment trends in schools that may require adjustments to current or future staffing. The January enrollment report is used to generate lists of pre-K, Grade 5, and Grade 8 students who will articulate to elementary, middle, and high schools the following year. This process enables special education supervisors to identify the school the student will most likely attend and add the student to that school’s projected enrollment. All of this information is used to develop initial staffing allocations for individual schools beginning in mid-January. Based on historical trends, the current state, and student articulation information, preliminary staffing allocations are made in conjunction with the OSSI associate superintendents in early spring.
Reports from O/SS are used to confirm what services are recommended for the coming year. Special education supervisors review the O/SS data system, visit schools, and consult with service providers, program supervisors, and OSSI associate superintendents to ensure that the information is accurate before any adjustments to preliminary staffing allocations are made.
When a school makes a request for additional staffing, the special education cluster supervisor consults with school staff members to ensure that current staff is being utilized effectively to address students’ services on IEPs. Requests for additional staffing are sent to central services special education leadership, as appropriate. When necessary, recommendations for staffing changes may be submitted and are reviewed by the directors of DSES/DBFIS with the associate superintendent for OSE.
Every effort is made to allocate staffing to meet anticipated needs for the upcoming school year. Invariably, some programs are over enrolled and others are under enrolled when the school year begins. In addition, staffing issues arise throughout the year due to many factors, including student mobility, changing needs, and individual class makeup. Another factor that could impact staffing is the result of a due process decision that requires additional support. There were no permanent building staffing changes resulting from due process in FY 2016. If concerns arise, staff and/or parents/guardians may make requests for additional staffing or for a staffing review. Principals submit requests for additional staffing through the defined process. The special education supervisor assigned to the program or cluster completes a staffing request form in collaboration with the school administrator. The special education staffing review team,
APPENDIX D – 13
composed of the directors of DSES/DBFIS and the associate superintendent of OSE, reviews all requests to determine the appropriate recommendations.
Despite efforts to ensure that all positions are filled, vacancies do occur due to an emergency, medical leave, child-care leave, or a lack of available, qualified personnel. In most cases, staff members have enough advance time to plan for coverage with substitute personnel, a contract provider, or redistribution of existing staff members. Parents/guardians are notified by letter if such a vacancy causes a temporary lapse in the delivery of special education services. If missed services cannot be made up, an IEP team considers whether compensatory services are required for individual students.
Maintenance of Effort
Each year, in order to receive Individuals with Disabilities Education Act (IDEA) funding, MCPS must submit forms to demonstrate Maintenance of Effort (MOE) eligibility. MOE eligibility is achieved when budgeted expenditures for the upcoming fiscal year (column E) equal or exceed the actual expenditures of the preceding fiscal year for which actual expenditures are available (column C). The MOE compliance is achieved when the actual total expenditures for the grant year (column C) equal or exceed the actual expenditures of the preceding year (column B).
The following table shows the MOE for special education from FY 2015 to FY 2018, including transportation and fixed charges.
*Local excludes expenditures for infants & toddlers
A B C D E Funding Source
FY 2015 Actual
FY 2016 Actual
FY 2017 Approved
Budget
FY 2018 Requested
Budget
State $ 52,899,267 $ 53,118,200 $ 54,890,319 $ 55,670,431
*Local $200,464,002 $211,618,856 $221,115,330 $235,670,611
Transportation $ 66,447,182 $ 65,474,998 $ 67,499,439 $ 67,850,301
Fixed Charges/ Benefits $ 71,253,290 $ 73,086,229 $ 73,068,169 $ 81,306,484
TOTAL $391,063,741 $403,298,283 $416,573,257 $440,497,827
APPENDIX D – 14

The number and type of staff members incorporated into the Montgomery County Public Schools (MCPS) special education budget meets the diverse needs of students with disabilities. The allocation of special education staffing begins with a projection of the number of students and services for the coming fiscal year. Each year, staff members from the Department of Facilities Management, the Department of Special Education Services, and the Division of Business, Fiscal and Information Systems prepare an estimate of the number of students needing services. The enrollment projections serve as a base to determine the number and type of staff members required to provide adequate staffing.
The location and distribution of the various special education services throughout the county affect the number and type of staff members needed to provide a free appropriate public education. Sometimes it is necessary to open a new special education classroom, or site, in a particular location in order to limit the time students spend being transported, thereby allowing them to attend school in their home cluster or quad/quint cluster. Consequently, the location of special education classrooms and services and models may require additional staffing.
Enrollment; class size guidelines; distribution of classes; nature of the disability; specific disability service models; time requirements for staff members to fulfill indirect service responsibilities such as planning, case management, participation in meetings, completing assessments, and legal considerations are reviewed and balanced in order to determine the number and type of staff members required. The FY 2018 Special Education Staffing Plan incorporates the Special Education Staffing Plan Committee’s input regarding special education staffing improvements and priorities. Below is information about the various special education instructional service models and the guidelines used for determining the number and type of specific staffing required.
* Teacher=Tchr Speech Pathologist=SP Occupational Therapist/Physical Therapist=OT/PT Teaching Station=TS
Service Description Services Instructional Models
Professional Staff Paraed Resource Services
Resource room services are available in all MCPS schools. Secondary resource services provide students with disabilities, general education students, and students with 504 Plans with the support they need to be academically successful in the general education environment. Resource teachers provide an array of services to students with disabilities including strategy-based instruction; direct instruction aligned with the Maryland College and Career-Ready Standards in reading/language arts, writing, mathematics, and organizational skills in preparation for the Partnership for Assessment of Readiness for College and Careers.
Elementary and middle schools staffed with an hours-based staffing model include the resource teacher in the special education staffing allocation.
Available in all schools Elementary Schools Based on school enrollment, schools with Learning and Academic Disabilities classes projected to have an enrollment of fewer than 600 students receive 1.0 resource room teachers. Schools projected to have an enrollment greater than 600 students but fewer than 750 students receive 1.5 resource room teachers. Schools projected to have an enrollment greater than 749 students receive 2.0 resource room teachers.
N/A
AP
PEN
DIX
D – 15

Service Description Services Instructional Models
Professional Staff Paraed Resource Services
Middle Schools Schools not staffed with hours-based staffing projected to have an enrollment of fewer than 800 students receive a 1.0 resource room teacher. Schools projected to have enrollment of 800 students but fewer than 1,000 students receive 1.5 resource room teachers. Schools projected to have an enrollment of 1,000 students or more receive 2.0 resource room teachers.
High Schools Schools projected to have an enrollment of fewer than 1,000 students receive 1.0 resource room teacher. Schools projected to have an enrollment of 1,000 or more students but fewer than 1,500 students receive 1.5 resource room teachers. Schools projected to have an enrollment of 1,500 students or more receive 2.0 resource room teachers.
N/A
Learning and Academic Disabilities (LAD)
Elementary LAD classes provide services to students with a disability that impacts their academic achievement. Students served by this model received considerable amounts of special education support in the general education environment, but require additional services in order to demonstrate progress toward Individualized Education Program (IEP) goals and objectives. Selected elementary schools provide this service within each quad cluster.
Secondary LAD services, available in all secondary schools in MCPS, provide services to students with a disability that impacts their academic achievement. Students served by this model received a considerable amount of special education support, but need additional services in order to demonstrate progress toward their IEP goals and objectives. These services are provided in a continuum of settings that may include components of self-contained classes, cotaught general education classes, and other opportunities for participation with nondisabled peers.
Elementary—Designated sites within each cluster
Available in all middle and high schools
1 Tchr:TS
1 Tchr:TS
0.875
0.875
AP
PEN
DIX
D – 16

Service Description Services Instructional Models
Professional Staff Paraed Learning for Independence (LFI)
LFI services are designed for students with complex learning and cognitive needs, including mild to moderate intellectual disabilities. Services support the implementation of Alternate Learning Outcomes (ALO) aligned with Curriculum 2.0. Students are provided with many opportunities for interaction with general education peers, including inclusion in general education classes as appropriate, peer tutoring, and extracurricular activities. They learn to apply academic concepts in the context of the general school environment and in community settings. Community-based instruction and vocational training are emphasized at the secondary level so that students are prepared for the transition to post-secondary opportunities upon graduating with a certificate from the school system.
Designated elementary, middle, and high schools in quad or quintclusters
1 Tchr:TS 0.875
Gifted and Talented Learning Disabled Services (GT/LD)
Twice exceptional students receiving GT/LD services demonstrate superior cognitive ability in at least one area and typically have production problems, particularly in the area of written expression. GT/LD services provide students with specialized instruction, adaptations, and accommodations that facilitate appropriate access to rigorous instruction in the least restrictive environment, which may include placement in Honors or Advanced Placement classes, and access to the acceleration and enrichment components in the MCPS instructional guidelines. Some students may receive services in specialized classrooms.
Regional designated elementary
Regional designated middle, and high schools
1 Tchr:TS
1 Tchr:TS
0.750
0.875
Elementary School-based Learning Center
Elementary School-based Learning Centers provide comprehensive special education and related services for students in Grades kindergarten–5. The program offers a continuum of services in self-contained classes, with opportunities to be included with nondisabled peers in the general education environment. These services address the goals and objectives in the student’s IEP while ensuring access to the general curriculum through strategies such as assistive technology, reduced class size, and differentiated instruction.
Designated elementary schools within each quadcluster
1 Tchr:TS 0.875
Home School Model
Elementary Home School Model supports students in Grades kindergarten–5 with a disability that impacts academic achievement in one or more content areas, organization, and/or behavior. Students served by this model are assigned to age appropriate heterogeneous classes in their neighborhood schools. Student access to the general education curriculum during the course of the day is based on individual student needs and encompasses a variety of instructional models that may include instruction in a general education environment and/or a self-contained setting.
Designated elementary schools
Hours-based Staffing
AP
PEN
DIX
D – 17

Service Description Services Instructional Models
Professional Staff Paraed Carl Sandburg Learning Center
Carl Sandburg Learning Center is a Grades kindergarten–5 special education school that serves students with multiple disabilities, including intellectual disabilities, autism spectrum disorders, language disabilities, and emotional and other learning disabilities. Services are designed for elementary students who need a highly-structured setting, small student-to-teacher ratio, and access to the MCPS general education curriculum or ALOs aligned with Curriculum 2.0. Modification of curriculum materials and instructional strategies, based on students’ needs, is the basis of all instruction. Emphasis is placed on the development of language, academic, and social skills provided through a trans-disciplinary model of service delivery in which all staff members implement the recommendations of related service providers. Special emphasis is placed on meeting the sensory and motor needs of students in their classroom setting. To address behavioral goals, services may include a behavior management system, psychological consultation, and crisis intervention.
Separate special education day school
1 Tchr:TS 1.250
School Community-based (SCB) Program
SCB program services are designed for students with severe or profound intellectual disabilities and/or multiple disabilities. Students typically have significant needs in the areas of communication, personal management, behavior management, and socialization. The program emphasizes individualized instruction, utilizing ALOs aligned with Curriculum 2.0 in comprehensive schools and related community and work environments. The SCB model includes the following components: age-appropriate classes, heterogeneous groupings, peer interactions, individualized instruction, community instruction, and transition. The program is available in all quad-clusters. The goal of the program is to prepare students to transition to post-secondary opportunities upon graduation with a certificate from the school system.
Designated elementary, middle, and high schools in quad or quintclusters
1 Tchr:TS 1.500
Rock Terrace School
Rock Terrace School is comprised of a middle school, a high school, and an upper school which implements school-to-work programs. The instructional focus of the middle school is the implementation of ALOs aligned with Curriculum 2.0 to prepare the students for transition to the high school program. The high school program emphasizes Alternate Academic Learning Outcomes aligned with Curriculum 2.0 and community-based instruction activities that enable students to demonstrate skills that lead to full participation in the school-to-work plan and vocational/community experiences. Authentic jobs help in reinforcing classroom learning. The upper school prepares students for post-secondary experiences and career and community readiness.
Separate special education day school
1 Tchr:TS 1.000
Stephen Knolls School
Stephen Knolls School provides services for students, ages 5–21, with severe to profound intellectual disabilities and multiple disabilities. ALOs aligned with Curriculum 2.0 are utilized to provide students with skills in the areas of communication, mobility, self-help, modified academics, and transition services.
Separate special education day school
1 Tchr:TS 1.750
AP
PEN
DIX
D – 18

Service Description Services Instructional Models
Professional Staff Paraed Longview School
Longview School provides services to students, ages 5–21, who have severe to profound intellectual disabilities and multiple disabilities. ALOs aligned with Curriculum 2.0 are utilized to provide students with skills in the areas of communication, mobility, self-help, modified academics, and transition services.
Separate special education day school colocated with Spark M. Matsunaga Elementary School
1 Tchr:TS 1.750
Extensions Program
The Extensions Program serves students of elementary, middle, and high school age with the most significant cognitive disabilities, multiple disabilities, and/or autism. These are students with a history of receiving systematic behavioral supports and services to reduce self-injurious and/or disruptive behaviors. The goal of the Extensions Program is to provide intensive educational programming to enable these students to acquire appropriate social and communicative skills in order to facilitate their access to Alternate Academic Learning Outcomes aligned with Curriculum 2.0, and post-secondary opportunities including readiness for career and community.
Designated middle and high schools
1 Tchr:TS 2.625
Emotional Disabilities (ED) Services
ED services are provided to students who demonstrate significant social emotional learning and/or behavioral difficulties that adversely impacts their success in school. These students access the MCPS general education curriculum, but emotional and behavioral challenges often interfere with their ability to achieve academic success and participate appropriately in an educational environment. These students are served in a continuum of settings including general education environments with opportunities for participation with nondisabled peers or separate classes, as appropriate.
Designated elementary, middle, and high schools in each quad or countywide
1 Tchr:TS 1.500
Bridge Program
Bridge Program serves students who demonstrate significant social emotional learning, and/or behavioral challenges that make it difficult to succeed in a large school environment. Many students require social and emotional supports in order to access their academic program. Comprehensive behavior management strategies include proactive teaching and rehearsal of social skills, as well as the use of structured and consistent reinforcement systems. Services are provided in a continuum of settings, which may include separate classes with opportunities for participation in general education environments with nondisabled peers, as appropriate.
Designated middle and high schools serve students countywide
1 Tchr:TS 1.250
AP
PEN
DIX
D – 19

Service Description Services Instructional Models
Professional Staff Paraed John L. Gildner Regional Institute for Children and Adolescents (RICA) - Rockville
RICA, in collaboration with the Maryland State Department of Health and Mental Hygiene, provides appropriate educational and treatment services to all students and their families through highly-structured, intensive special education services with therapy integrated in a day and residential treatment facility. An interdisciplinary treatment team, consisting of school, clinical, residential, and related service providers develops the student’s total educational plan and monitors progress. Consulting psychiatrists, a full time pediatrician, and a school community health nurse also are on staff.
RICA offers fully-accredited special education services which emphasize rigorous academic and vocational/occupational opportunities; day and residential treatment; and individual, group, and family therapy. The RICA program promotes acquisition of grade- and age-appropriate social and emotional skills and allows students to access the general education curriculum.
Separate special education day school
1 Tchr:TS 1.250
Services for Students with Autism Spectrum Disorders
The Comprehensive Autism Preschool Program provides highly intensive and individualized services for students ages 3–5. Students receive instruction in the general education curriculum to prepare them for kindergarten. Evidence-based practices are utilized to increase academic, language, social, and adaptive skills to ultimately provide access to a variety of school-age services and to maximize independence in all domains.
Autism services for students, elementary through age 21, provide access to Alternate Academic Learning Outcomes aligned with Curriculum 2.0. In order to improve learning and communication, students receive Applied Behavior Analysis intensive instruction in a highly-structured setting, which provides opportunities for participation with nondisabled peers. At the secondary level, students also receive vocational and community support.
Secondary Autism Resource Services, located in three middle and three high schools, are designed for students with autism spectrum disorders who are diploma bound and have difficulty mastering grade-level curriculum. These students require a modified pace and individual accommodations representative of the needs and characteristics of students with autism spectrum disorders. Students receive instruction in the general education curriculum with the supports indicated on their IEPs. Access to the general education curriculum with enrichment is reinforced.
Prekindergarten—Designated elementary schools serve prekindergarten students throughout the county
School Aged—Designated elementary, middle, and high schools located regionally throughout the county
Secondary School Autism Resource Services—three middle and three high schools located regionally
1 Tchr:TS
1 Tchr:TS
1 Tchr:TS
3.440
1.750
1.750
AP
PEN
DIX
D – 20

Service Description Services Instructional Models
Professional Staff Paraed Transition Services
Transition services are provided to students receiving special education, age 14 or older, to facilitate a smooth transition from school to college, career, and/or community. These activities include, but are not limited to, postsecondary education, workforce experiences, continuing and adult education, adult services, independent living, and/or community participation. Services are based on the individual student’s needs, considering the student’s strengths, preferences, and interests. Transition services are delivered through direct and/or indirect support coordinated by a transition support teacher.
Services available in secondary schools throughout the county
1.0 Tchr 0.875/TS
Services for Deaf/Hard of Hearing (D/HOH)
D/HOH services provide comprehensive educational supports to students who are deaf or have a significant hearing loss. These services, provided by itinerant teachers, enable students to develop effective language and communication skills necessary to access the general education environment in neighborhood schools. Students with more significant needs receive services in special centrally-located classes. Services are provided in three communication options—oral/aural, total communication, and cued speech. Assistive technology and consultation also are provided to students and school staff members.
Resource services available throughout the county
Auditory and speech training available throughout the county
Special classes: one prekindergarten, three elementary, one middle, and one high school serve students throughout the county
1 Tchr:17
1 Tchr:17
1 Tchr:TS
N/A
N/A
0.875
Services for Students with Physical Disabilities
Related services of occupational and physical therapy provide supports for students with physical and/or health-related disabilities to facilitate access to their school program. Services are provided as direct therapy to students and/or consultation to classroom staff members. Services are provided at elementary, middle, and high schools throughout MCPS.
Resource services available throughout the county
Special classes: two elementary schools.
34.6:1
1 Tchr:TS
N/A
1.250
AP
PEN
DIX
D – 21

Service Description Services Instructional Models
Professional Staff Paraed Services for the Visually Impaired
Vision services are provided to students with significant visual impairments or blindness. Services enable students to develop effective compensatory skills and provide them with access to the general education environment.
A prekindergarten class prepares students who are blind or have low vision for entry into kindergarten.
Itinerant vision services are provided to school-age students in their assigned school. Skills taught include visual utilization, vision efficiency, reading and writing using Braille, and the use of assistive technology. Students may receive orientation and mobility instruction to help them navigate their environment. Students over the age of 14 receive specialized transition support, as appropriate.
Resource services available throughout the county
Special class: one elementary school serves preschoolers throughout the county
Orientation and Mobility 45:1 Resource 35:1
1 Tchr:TS 0.875
Speech and Language Services
Speech and language services are provided to diagnose communication disorders and improve spoken language skills; facilitate compensatory skills; and enhance the development of language, vocabulary, and expressive communication skills to support student access to the general education curriculum. The type and frequency of services provided are determined by individual student needs. For students with less intensive needs, educational strategies are provided to the student’s general education teachers and parents/guardians for implementation within the classroom and home environments. Students may receive services in their classroom program, in small groups, or individually. Prekindergarten students requiring extensive services attend a specialized class, two or five days per week.
Resource services available throughout the county’s Preschool School-Age Private/Religious Schools
Special classes: designated elementary schools serve prekindergarten students throughout the county, two or five days per week
40:1.0 56.4:1.0 56.4:1.0
1 Tchr:TS
N/A N/A N/A
0.875
Augmentative and Alternative Communication(AAC) Classes
AAC classrooms provide intensive support for students who are not verbal or have limited speech with severe intelligibility issues. Students learn to use and expand their knowledge of augmentative communication devices and other forms of aided communication in order to access the general education curriculum. Emphasis is on the use of alternative communication systems to enhance language development, vocabulary development, and expressive communication skills. Services and supports are provided within the general education environment.
Special classes located in two elementary schools serve students throughout the county
1 Tchr:TS 1.750
Assistive Technology (InterACT) Services
Assistive technology services provide support for students from birth–21-year-olds. InterACT services support students who are severely limited in verbal expression or written communication skills, often due to physical disabilities. InterACT focuses on the use of Augmentative Communication and Assistive Technology devices to increase and expand students’ communication skills. InterACT also addresses the provision of adapted technology for students with physical disabilities to access curricular materials. Services are provided in the natural environment for students birth–three-year-olds, or in the
Services available throughout the county
SLP–1/75 Services Tchr–1/190 Services OT–1/223 Services
0.875/380 Services
AP
PEN
DIX
D – 22

Service Description Services Instructional Models
Professional Staff Paraed elementary, middle, or high school classroom setting for students prekindergarten through age 21.
Preschool Education Program (PEP)
PEP provides special education services for students with disabilities ages three–kindergarten, whose delays impact the student’s ability to learn. Services range from itinerant services for students in community-based child-care centers and preschools to separate special education classrooms, and home-based instruction for medically-fragile students. Early childhood settings and special education classrooms provide students a comprehensive approach to learning. PEP PILOT provides a two-day per week early childhood setting while PEP Collaboration classes offer inclusive opportunities for prekindergarten students using a coteaching model. PEP Classic and Intensive Needs classes serve students with developmental delays in a structured special education setting. PEP Comprehensive and Beginnings serve students with moderate to severe delays and/or multiple disabilities.
PEP 2.5 Hour: Classic, PILOT, and Collaboration classes (half-day)
Intensive Needs Speech/Language OT and PT
Medically Fragile Speech/Language OT and PT
PEP 5 hour Speech/Language OT and PT
1.0 Tchr/TS
1.0 Tchr/TS 0.3 SP/TS
0.3 OT/PT/TS
1.0 Tchr/TS 0.5 SP/TS
0.3 OT/PT/TS
1.0 Tchr/TS 0.2 SP/TS
0.5 OT/PT/TS
0.875/TS
1.75/TS
0.875/TS
1.50/TS
Infants and Toddlers
The Infants and Toddlers Program provides early intervention services to families of students with developmental delays from birth–3-year-olds, or until the start of the school year after the student’s fourth birthday under the Extended Individual Family Service Plan option. Services are provided in the natural environment and may include specialized instruction, auditory and vision instruction, physical and occupational therapy, and speech-language services. Services are provided using an adult/caregiver coaching model.
Home-based for individual students Infants and Toddlers Teacher
Speech/Language
OT PT
Vision
D/HOH
1.0 Tchr/70 services
1.0 SP/68 services
1.0 OT/68 services 1.0 PT/68 services
1.0 Tcher/68.0 services
1.0 Tchr/68.0 services
.724 Paraed/ each 6
Prof. Staff
AP
PEN
DIX
D – 23

Other Other Other OtherDepartment of Special Education Services Students Admin Teachers Prof PARAs Support Students Admin Teachers Prof PARAs Support
Learning Disabilities:Resource Only 2,193 58.5 23.000 2,120 - - Learning Centers, Elementary 596 71.0 6.0 60.375 709 75.5 6.5 64.750 LRE Support 12.0 18.938 6.7 7.813 Learning and Academic Disabilities 3,192 287.2 5.0 191.763 2,927 280.1 5.0 175.525 Hours Based Staffing 2,872 245.2 8.0 169.687 2,944 250.4 8.2 175.438 Home School Model 2,102 227.9 126.275 2,443 323.0 155.313 GT/LD 159 12.8 10.350 177 11.6 9.775 Secondary Intensive Reading 11.6 10.8
Intellectual Disabilities (ID):School/Community Based Programs 346 64.0 96.000 365 65.0 99.000 Extensions 47 14.0 4.5 28.875 58 1.0 16.5 4.5 34.125 Learning for Independence 675 71.0 62.125 740 72.0 63.000
LD/ID Program Support 7.0 4.0 6.0 3.000 7.0 4.0 6.0 2.000
Emotional Disabilities:Special Classes 577 85.2 15.7 113.500 3.000 618 91.2 15.7 122.625 3.000 Program Support 1.0 8.0 15.5 1.000 1.0 8.0 16.5 1.000
Autism:Special Classes 690 109.0 215.345 719 113.4 227.475 Program Support 1.0 4.2 8.3 1.000 1.0 4.2 8.3 1.000
Transition Services:School-Based Resource Services 6,550 25.8 12.750 6,223 25.8 11.250 Nonschool-Based Programs 47 11.5 7.500 49 11.5 7.500 Program Support 1.0 5.0 1.5 1.000 1.0 6.0 1.5 1.500 1.000
Special Schools:Longview 50 1.0 9.0 1.7 15.750 2.875 52 1.0 9.0 1.7 15.750 2.875 Stephen Knolls 45 1.0 8.0 3.0 13.750 3.125 46 1.0 8.0 3.0 14.000 2.875 Carl Sandburg 100 1.0 16.0 6.2 28.000 3.125 78 1.0 15.0 5.2 26.250 2.875 Rock Terrace 94 2.0 16.1 4.6 16.100 3.750 81 2.0 15.8 5.6 14.800 3.500 RICA 108 2.0 19.0 7.1 17.000 3.750 105 2.0 19.0 7.1 17.000 3.500 Model Learning Center 1.5 1.5
Itinerant Paraeducators 150.000 150.000
School-Based Services Administrative Support 1.0 1.0 1.000 1.0 16.6 1.0 1.000
Continued on next page
Attachment BFISCAL YEAR 2018 PROJECTED SPECIAL EDUCATION ENROLLMENT, SERVICES and POSITIONS
FY 2017 Budget FY 2018 Budget
December 2016
AP
PEN
DIX
D – 24
AP
PEN
DIX
D – 24

Continued from previous page
Other Other Other OtherPre-K, Special Programs & Related Svcs Students Admin Teachers Prof PARAs Support Students Admin Teachers Prof PARAs SupportDeaf And Hard of Hearing:
Resource Program Services 225 13.0 36.500 221 13.0 0.2 36.500 Special Classes 166 23.0 8.0 20.125 153 22.1 7.8 19.339 Program Support 1.0 3.5 1.000 1.0 3.5 1.000
Visual Impairments:Resource Program Services 300 11.5 0.500 2.000 300 11.5 0.500 2.000 Special Classes 17 3.0 0.2 3.500 15 3.0 0.2 3.500 Program Support 1.0 1.000 1.0 1.000
Physical Disabilities:Resource Program Services 3,190 92.2 0.750 3,290 92.2 0.750 Special Classes 44 6.9 9.125 37 6.9 9.125 Program Support 1.0 2.0 2.0 2.000 1.0 2.0 2.0 2.000
Speech and Language Disabilities:Resource Program Services 10,100 198.6 9,190 197.6 Special Classes 162 5.5 1.7 4.812 120 5.5 1.7 4.812 Program Support 1.0 6.0 2.000 1.0 6.0 2.000
InterACT:InterACT Services (PreK-12) 525 4.0 8.6 540 4.0 8.6 Augmentative Communication 12 2.0 0.4 3.500 12 2.0 0.4 3.500 Program Support 1.0 0.875 1.000 1.0 0.875 1.000
Child Find/DESC:Program Support 14.2 3.000 14.2 2.000 Administrative Support 1.0 1.000 1.0 2.000
Preschool Education Programs:Special Classes 1,384 116.9 63.2 114.938 1,437 112.0 68.0 121.000 Program Support 2.0 0.2 6.0 1.000 1.0 0.2 6.0 1.000
Arc of Montgomery County 1.0 1.6 1.500 1.0 0.8 1.500
Infants and Toddlers Services:Deaf and Hard of Hearing 200 3.0 200 3.0 Physical Therapy 2,000 30.4 2,150 31.6 Occupational Therapy 2,075 30.5 2,000 29.4 Special Instruction 4,910 72.2 42.100 4,800 68.6 42.180 Speech & Language 4,910 72.2 4,800 71.2 Vision 200 3.0 200 3.0
Program Support 5.0 5.0 5.000 5.0 5.0 5.000
Preschool/Related Services Administrative Support 1.0 2.0 1.000 1.0 1.0 1.000
Special Education Administrative Support 7.0 2.0 17.5 21.600 7.0 4.0 19.6 19.600
Summary:Total Special Classroom Services 13,485 7.0 1,450.3 136.9 1,348.8 19.6 13,885 8.0 1,548.5 141.4 1,392.9 18.6 Total Resource Services 23,083 - 311.4 159.3 36.3 39.3 21,884 - 251.9 101.0 11.8 39.3 Total Infants and Toddlers Services 14,295 - 78.2 133.1 42.1 - 14,150 - 74.6 132.2 42.2 - Total Program Support 20.0 29.4 64.0 150.9 22.0 19.0 30.4 65.0 152.4 20.0 Total Administrative Support 10.0 2.0 20.5 - 24.6 10.0 20.6 21.6 - 23.6
Total by Position Type 37.0 1,871.3 513.8 1,578.058 105.475 37.0 1,926.0 461.2 1,599.219 101.475 Grand Total
FISCAL YEAR 2018 PROJECTED SPECIAL EDUCATION ENROLLMENT, SERVICES and POSITIONSDecember 2016
FY 2017 Budget FY 2018 Budget
4,105.583 4,124.884
Attachment B
AP
PEN
DIX
D – 25
AP
PEN
DIX
D – 25

Attachment C
FY 2018 Recommendations for Maintenance *
Description in Priorty Order Description in Priorty Order Description in Priorty Order
Enhance professional learning for all staff members and incorporate information about the emotional aspect of autism.
Change Learning and Academic Disabilities (LAD) staffing ratio from current formula to an hours based staffing ratio.
Re-examine current prekindergarten (pre-K) staffing models to increase opportunities for students with disabilities to receive services in regular early childhood program settings.
Increase staff to increase the ability of staff members to provide consults (Emotional Disabilities (ED), Autism).
Provide resources for LAD students to address access to Career and Technology Education (CTE).
High Incidence Assistive Technology (HIAT) expansion: intechnology support to schools to apply the principals of universaldesign for learning (UDL) and HIAT staffing.
Revisit Home School Model (HSM) philosophy, reduce variability from school to school, and define expectations.
Provide professional learning for HSM teachers, paraeducators, administrators, and counselors by providing a definition of HSM, best instructional practices and strategies to support students with autism spectrum disorder.
Make all elementary schools HSM using the hours based staffing model.
Save seats in general education for special education students. Enhance mental health supports to provide wrap around services to students and families. Change the LAD staffing ratio to the hours based staffing model.
Reevaluate allocation of speech/language staff especially in schools with elementary learning centers and elementary LAD.
FY 2016 Recommendations for Maintenance * FY 2017 Recommendations for Maintenance *
* Due to the challenging economic situation, the discussions of the staffing plan committee focused on critical areas of specialeducation programming. The committee expressed a desire that the level of service in identified areas be maintained. This budget reflects the preservation and maintenance of those items.
Fiscal Year (FY) 2016-2018 Special Education Improvement and Priorities Based on Staff and Community Member Input
AP
PEN
DIX
D – 26

Attachment D
Fiscal Year (FY) 2018 MCPS Special Education Staffing Plan And Operating Budget Timeline
Associate Superintendent for Special Education and Student Services Requests Public Participation on FY 2018 Special Education Staffing Plan Committee
May 5, 2016
FY 2018 Special Education Staffing Plan Committee Meets to Develop Recommendations for Special Education Staffing Improvements and Priorities
June 7, 2016
FY 2018 Recommended Special Education Staffing Improvements and Priorities Considered During the Development of the FY 2018 Operating Budget
Fall 2016
Superintendent’s FY 2018 Budget Presentation December 13, 2016
Sign up begins for Board of Education (Board) Operating Budget Hearings December 16, 2016
through January 17, 2017
Board Operating Budget Hearings January 5, 2017 and January 11, 2017
Board Operating Budget Work Sessions January 17, 2017 and January 19, 2017
Board Operating Budget Action February 14, 2017
Board Budget Request Transmitted to County Executive and County Council
March 1, 2017
County Executive Recommendations Presented to County Council March 15, 2017
County Council Budget Hearings April 2017
County Council Budget Action May 19, 2017
Final Board Action on FY 2018 Operating Budget, Including FY 2018 Special Education Staffing Plan
June 13, 2017
APPENDIX D – 27

Name Title
Austin, Ms. Sabrina Staff Attorney, Maryland Coalition for Inclusive Education; [email protected]
Bernstein, Mr. Evan H. Principal, Forest Knolls Elementary School
Brown, Ms. Wanda Representative, Montgomery County Maryland Branch of NAACP
Catena, Ms. Mary Rose Instructional Specialist, Division of Prekindergarten, Special Programs, and Related Services
Cropp, Mrs. Amy S. Director, Division of Prekindergarten, Special Programs, and Related Services
Daddona, Ms. Staci President, Partnership for Extraordinary Minds
Davisson, Ms. Lisa J. Instructional Specialist, Department of Special Education Services
DeFosse, Ms. Pamela A. Supervisor, Speech and Language Services
Diamond, Ms. Nicola Chief Financial Officer, Office of the Superintendent of Schools
Doody, Mrs. Suzanne M. Fiscal Supervisor, Office of Special Education
Dorner, Mrs. Martha F. Fiscal Specialist, Division of Business, Fiscal and Information Systems
Friedlander, Mrs. Barbara A. Assistant to Associate Superintendent, Office of Special Education
Geness, Ms. Simone A. Supervisor, Transition Services Unit
Hall, Mrs. Julie S. Director, Division of Business, Fiscal and Information Systems
Handy, Dr. Christine C. Principal, Gaithersburg High School
AP
PEN
DIX
D – 28
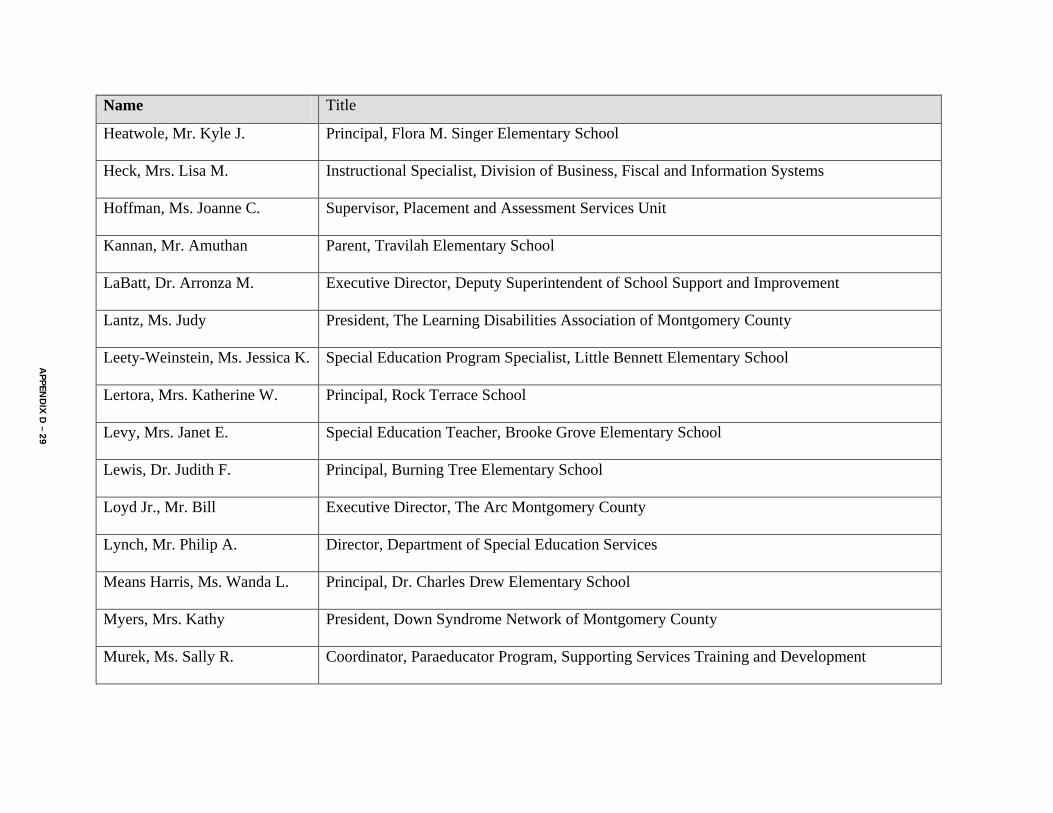
Name Title
Heatwole, Mr. Kyle J. Principal, Flora M. Singer Elementary School
Heck, Mrs. Lisa M. Instructional Specialist, Division of Business, Fiscal and Information Systems
Hoffman, Ms. Joanne C. Supervisor, Placement and Assessment Services Unit
Kannan, Mr. Amuthan Parent, Travilah Elementary School
LaBatt, Dr. Arronza M. Executive Director, Deputy Superintendent of School Support and Improvement
Lantz, Ms. Judy President, The Learning Disabilities Association of Montgomery County
Leety-Weinstein, Ms. Jessica K. Special Education Program Specialist, Little Bennett Elementary School
Lertora, Mrs. Katherine W. Principal, Rock Terrace School
Levy, Mrs. Janet E. Special Education Teacher, Brooke Grove Elementary School
Lewis, Dr. Judith F. Principal, Burning Tree Elementary School
Loyd Jr., Mr. Bill Executive Director, The Arc Montgomery County
Lynch, Mr. Philip A. Director, Department of Special Education Services
Means Harris, Ms. Wanda L. Principal, Dr. Charles Drew Elementary School
Myers, Mrs. Kathy President, Down Syndrome Network of Montgomery County
Murek, Ms. Sally R. Coordinator, Paraeducator Program, Supporting Services Training and Development
AP
PEN
DIX
D – 29

Name Title
Nardi, Mr. Christopher B. Principal, Thomas W. Pyle Middle School
Parrott, Mrs. Margaret A. Instructional Specialist, Transition Services Unit
Redgrave, Ms. Kim M. Coordinator, Stephen Knolls School
Reiley, Mrs. Julie Co-Chairperson, Special Education Advisory Committee
Richardson, Mrs. Chrisandra A. Associate Superintendent, Office of Special Education
Sachs, Ms. Heather Education Committee Chair, Down Syndrome Network of Montgomery County
Shawver, Mrs. Chrissy Director, Children and Youth Services, ARC of Montgomery County
Taylor, Mrs. Jeanne Chairperson, Special Education Subcommittee, Montgomery County Council of Parent-
Teacher Associations
Taylor, Mrs. Joan Chairperson, Special Education Subcommittee, Montgomery County Council of Parent-
Teacher Associations
Thomas, Miss Beth F. Assistant Principal, Hallie Wells Middle School
Todd, Mrs. Christine M. Management/Budget Specialist, Office of the Chief Financial Officer
Turner, Ms. Anne Co-Chairperson, Special Education Advisory Committee
Webb, Ms. Cynthia M. Supervisor, Department of Special Education Services
Whitfield, Mr. Donald Parent, Clearspring Elementary School
Committee Support: Miss Rachel M. Page, administrative secretary, Division of Business, Fiscal and Information Systems
Telephone: 301-279-3166 E-mail: [email protected]
AP
PEN
DIX
D – 30

Attachment F
Department of Special Education Services Division of Business, Fiscal and Information Systems
Professional Development Plan Fiscal Year 2018
Teacher Sessions
Academic Interventions: Above and Beyond with Digi-blocks Academic Interventions: Early Interventions in Reading Academic Interventions: Edmark Reading Academic Interventions: Fluency and Automaticity through Systematic Teaching and Technology (FASTT) Mathematics Elementary Academic Interventions: FASTT Mathematics Middle School Academic Interventions: Phonics for Reading Academic Interventions: Read Naturally Live! Academic Interventions: Ready Common Core Mathematics Academic Interventions: Ready Common Core Reading Academic Interventions: REWARDS Intermediate Reading and REWARDS Plus Social Studies Academic Interventions: REWARDS Secondary Reading and REWARDS Plus Science Academic Interventions: Number Worlds Augmentative and Alternative Communication: Strategies to Encourage Functional Communication Augmentative and Alternative Communication: Strategies and Operation of Specific devices Augmentative Communication and Assistive Technology: Strategies to Support Early Language Learners Autism 101: Serving Students with Autism Spectrum Disorders in the Least Restrictive Environment Autism Spectrum Disorders: Learning Adaptive Behaviors and Social Skills Autism Spectrum Disorders: Unstuck and On Target: Social Skills Development Curriculum 2.0 for new Elementary Teachers of Non-diploma Bound Students Curriculum 2.0 for new Elementary ESOL Teachers of Non-diploma Bound Students Curriculum 2.0 for new Elementary Speech-Language Pathologists of Non-diploma Bound Students Curriculum 2.0 for new Elementary Art Teachers of Non-diploma Bound Students Curriculum 2.0 for new Elementary Music Teachers of Non-diploma Bound Students Curriculum 2.0 for new Elementary Physical Education Teachers of Non-diploma Bound Students Curriculum 2.0 for new Secondary Teachers of Non-diploma Bound Students Curriculum 2.0 for new Secondary ESOL Teachers of Non-diploma Bound Students
AP
PEN
DIX
D – 31
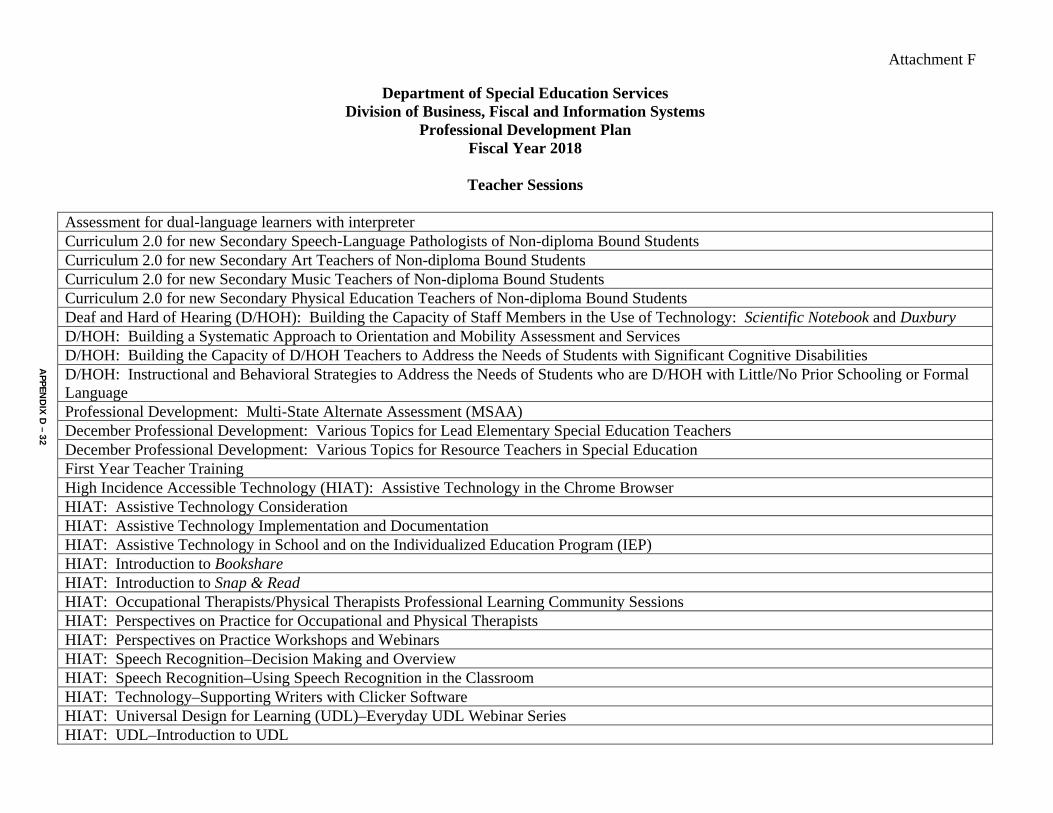
Attachment F
Department of Special Education Services Division of Business, Fiscal and Information Systems
Professional Development Plan Fiscal Year 2018
Teacher Sessions
Assessment for dual-language learners with interpreter Curriculum 2.0 for new Secondary Speech-Language Pathologists of Non-diploma Bound Students Curriculum 2.0 for new Secondary Art Teachers of Non-diploma Bound Students Curriculum 2.0 for new Secondary Music Teachers of Non-diploma Bound Students Curriculum 2.0 for new Secondary Physical Education Teachers of Non-diploma Bound Students Deaf and Hard of Hearing (D/HOH): Building the Capacity of Staff Members in the Use of Technology: Scientific Notebook and Duxbury D/HOH: Building a Systematic Approach to Orientation and Mobility Assessment and Services D/HOH: Building the Capacity of D/HOH Teachers to Address the Needs of Students with Significant Cognitive Disabilities D/HOH: Instructional and Behavioral Strategies to Address the Needs of Students who are D/HOH with Little/No Prior Schooling or Formal Language Professional Development: Multi-State Alternate Assessment (MSAA) December Professional Development: Various Topics for Lead Elementary Special Education Teachers December Professional Development: Various Topics for Resource Teachers in Special Education First Year Teacher Training High Incidence Accessible Technology (HIAT): Assistive Technology in the Chrome Browser HIAT: Assistive Technology Consideration HIAT: Assistive Technology Implementation and Documentation HIAT: Assistive Technology in School and on the Individualized Education Program (IEP) HIAT: Introduction to Bookshare HIAT: Introduction to Snap & Read HIAT: Occupational Therapists/Physical Therapists Professional Learning Community Sessions HIAT: Perspectives on Practice for Occupational and Physical Therapists HIAT: Perspectives on Practice Workshops and Webinars HIAT: Speech Recognition–Decision Making and Overview HIAT: Speech Recognition–Using Speech Recognition in the Classroom HIAT: Technology–Supporting Writers with Clicker Software HIAT: Universal Design for Learning (UDL)–Everyday UDL Webinar Series HIAT: UDL–Introduction to UDL
AP
PEN
DIX
D – 32

Attachment F
Department of Special Education Services Division of Business, Fiscal and Information Systems
Professional Development Plan Fiscal Year 2018
Teacher Sessions
Home School Model: Providing Standards Based Instruction and Implementing Evidence-based Strategies Lead Elementary Teachers: Address Evidence-based Practices in Reading and Mathematics and Other Topics Learning and Academic Disabilities Principals: Evidence-based Practices in Reading and Mathematics and Other Topics Medical Assistance: Certification Training New Teacher Orientation New Teacher Orientation for Elementary and Secondary Teachers on Curriculum 2.0 for Non-diploma Bound Students with Disabilities Nonviolent Crisis Intervention: Initial and Refresher Courses Prekindergarten: Building the Capacity of Teachers to Differentiate Instruction in Inclusive Settings Prekindergarten: Maryland’s Child Outcomes Summary Process Prekindergarten: Maryland’s Early Learning Assessment Prekindergarten: The Social and Emotional Foundations of Early Learning Preschool Education Program : Developing Standards-based, High-quality IEPs Speech and Language Services: Understanding and Implementing Standards-based Teaching and Learning as a Speech and Language Pathologist serving Students with Significant Cognitive Disabilities Speech and Language Services: Best Practices in Bilingual Assessments using Interpreters Speech and Language Services: Aligning Speech-Language Therapy Sessions with the Maryland College and Career-ready Standards Transition Services: Teaching Self-Advocacy Skills to Students in Grade 9 Transition Support Teachers: Improving Service Delivery to Promote Successful Postsecondary Outcomes Transition Support Teachers: Professional Learning Communities Twice Exceptional Students: Recognizing and Serving Elementary Students Twice Exceptional Students: Differentiating Elementary Instruction Twice Exceptional Students: Recognizing Characteristics and Differentiating Instruction for Secondary Students Vision Services: Tactile Graphics and Duxbury Vision Services: Understanding and Implementation of United English Braille Code
AP
PEN
DIX
D – 33

Attachment G Department of Special Education Services
Division of Business, Fiscal and Information Systems Professional Development Plan
Fiscal Year 2018
Paraeducator Sessions
November 2017 January 2018 Fading Supports and Building Independence: Elementary Paraeducators
Curriculum 2.0 for new paraeducators working with on-diploma bound elementary students in Learning for Independence, School Community-Based, Autism, and Extensions services; Carl Sandburg, Stephen Knolls, and Longview schools; and selected elementary schools with included non-diploma bound students with disabilities. Curriculum 2.0 for new paraeducators working with non-diploma bound secondary students in Learning for Independence, School Community-Based, Autism, and Extensions services; Rock Terrace, Stephen Knolls, and Longview schools; and selected elementary schools with included non-diploma bound students with disabilities. Resources and Materials to Support the Instruction of Elementary Non-diploma Bound Students Resources and Materials to Support the Instruction of Secondary Non-diploma Bound Students Role of the Paraeducator in the Asperger’s Program: Paraeducators Working in the Asperger’s Program Working with Students with Intellectual Disabilities Accommodations and Modification: Hands-on Applications: Elementary Paraeducators Accommodations and Modification: Hands-on Applications: Secondary Paraeducators
Fading Supports and Building Independence: Elementary Paraeducators
Curriculum 2.0 for new paraeducators working with non-diploma bound elementary students in Learning for Independence, School Community-Based, Autism, and Extensions services; Carl Sandburg, Stephen Knolls, and Longview schools; and selected elementary schools with included non-diploma bound students with disabilities. Curriculum 2.0 for new paraeducators working with non-diploma bound secondary students in Learning for Independence, School Community-Based, Autism, and Extensions services; Rock Terrace, Stephen Knolls, and Longview schools; and selected elementary schools with included non-diploma bound students with disabilities. Resources and Materials to Support the Instruction of Elementary Non-diploma Bound Students Resources and Materials to Support the Instruction of Secondary Non-diploma Bound Students Autism: Supporting ASD in the Special Education Classroom Accommodations and Modification: Hands-on Applications: Elementary Paraeducators Accommodations and Modification: Hands-on Applications Secondary Paraeducators Reading and Writing Technology Tools to Support Struggling Students Activinspire Beginner Activinspire Intermediate Activinspire Advanced
AP
PEN
DIX
D – 34

Attachment G Department of Special Education Services
Division of Business, Fiscal and Information Systems Professional Development Plan
Fiscal Year 2018
Paraeducator Sessions Reading and Writing Technology Tools to Support Struggling Students Activinspire Beginner Activinspire Intermediate Activinspire Advanced Strategies for Paraeducators Working Effectively with Students with Special Needs in Physical Education Language Development Strategies Prekindergarten: The Social and Emotional Foundations of Early Learning Prekindergarten: Maryland’s Early Learning Assessment and Data Collection in the Classroom Transition Services: Data Collection Nonviolent Crisis Intervention: Initial and Refresher Courses Secondary Research Tools Home School Model: Providing Instructional Support Twice Exceptional Students: Support in the General Education classroom
Strategies for Paraeducators Working Effectively with Students with Special Needs in Physical Education Language Development Strategies Nonviolent Crisis Intervention: Initial and Refresher Courses Secondary Research Tools Developing Positive Behavior Interventions for Students with Intellectual Disabilities Inclusive Practices for Students with Aspergers Disorder Home School Model: Providing Instructional Support Twice Exceptional Students: Support in the General Education classroom
AP
PEN
DIX
D – 35

FUNDING OFFICE/DEPARTMENT/DIVISION FY 2016 FY 2017 FY 2018 FY 2018SOURCE AND POSITION TITLES Actual Current Requested Change
Office of the Chief Operating Officer:
Trust Funds Department of Employee and Retiree ServicesChief Financial Officer (Q) 0.3 0.3 (0.3)Director of Employee and Retiree Services (Q) 0.3 0.3Director, Benefits Strategy/Vendor Rel.(P) 1.0 1.0 1.0Director, Employee Services Administration (P) 0.1 (0.1)ERSC Call Center Transactions Supervisor (K) 0.4 0.4 (0.4)Senior Specialist, Insurance and Retirement (J) 2.0 2.0 2.0Supervisor (G) 0.5 0.5Wellness Coordinator (26) 1.0 1.0 1.0Data Integration Specialist II (25) 1.0 1.0 1.0Risk Management Specialist (24) 1.0 1.0 1.0Data Integration Specialist (23) 1.0 1.0 1.0Communications Specialist (21) 1.0 1.0 1.0Specialist, Insurance and Retirement II (21) 1.0 1.0 1.0Specialist, Leave Admin/Wkrs Comp (19) 1.0 1.0 1.0Specialist, Insurance and Retirement (19) 5.0 5.0 5.0Administrative Secretary II (15) 1.0 1.0 1.0Transactions Assistant I (15) 8.5 8.5 4.0 (4.5) Total 25.2 25.3 20.8 (4.5)
Trust Funds Office of the Chief Financial OfficerChief Investment Officer (P) 1.0 1.0 1.0Investment Analyst (26) 0.8 0.8 1.8 1.0Specialist, Insurance and Retirement (19) 1.0 1.0 1.0Administrative Secretary III (16) 0.5 0.5 0.5 Total 3.3 3.3 4.3 1.0
Trust Funds Division of ControllerStaff Accountant (22) 1.0 1.0 1.0Benefits Assistant (15) 1.0 1.0 1.0 Total 2.0 2.0 2.0
Capital Budget Real Estate Management FundReal Estate Management Specialist (25) 1.0 1.0 1.0
Capital Budget Division of ConstructionAssistant to the Director (K) 1.0 1.0 1.0Facilities Team Leader (K) 3.0 3.0 4.0 1.0Senior Facilities Designer (27) 1.0 1.0 (1.0)LEED Program Manager (26) 1.0 1.0 1.0Construction Management Specialist (25) 1.0 1.0 1.0School Facilities Program Manager (25) 7.0 7.0 7.0Project Specialist (24) 1.0 1.0 1.0Commissioning Coordinator (23) 1.0 1.0 1.0Construction Inspector Supervisor (23) 1.0 1.0 1.0Site Development Coordinator (23) 1.0 1.0 1.0Electrical Construction Technician II (22) 2.0 2.0 2.0Fiscal Assistant V (22) 1.0 1.0 1.0Mechanical Construction Technician (22) 2.0 2.0 2.0Construction Technician (21) 6.0 6.0 6.0Mechanical Construction Specialist (21) 3.0 3.0 3.0Energy Management Specialist (20) 1.0 1.0 1.0Project Designer (20) 1.0 1.0 1.0Bldg. & Grounds Contracts Assistant (18) 1.0 1.0 1.0Fiscal Assistant IV (18) 1.0 1.0 1.0Administrative Secretary II (15) 1.0 1.0 1.0Fiscal Assistant I (13) 1.0 1.0 1.0Secretary (12) 1.0 1.0 1.0Office Assistant III (10) 1.0 1.0 1.0 Total 40.0 40.0 40.0
Capital Budget Department of Facilities ManagementFiscal Assistant V (22) 1.0 1.0 1.0
NON-OPERATING BUDGET POSITIONS
APPENDIX E – 1

FUNDING OFFICE/DEPARTMENT/DIVISION FY 2016 FY 2017 FY 2018 FY 2018SOURCE AND POSITION TITLES Actual Current Requested Change
NON-OPERATING BUDGET POSITIONS
Capital Budget Division of Long-range PlanningPlanner II (24) 2.0 2.0 2.0
Capital Budget Division of Maintenance Environmental Safety Specialist (23) 3.0 3.0 3.0Environmental Health Specialist (23) 1.0 1.0 1.0Roof Program Manager (24) 1.0 1.0PLAR Contracting Asst Supervisor (22) 1.0 1.0 1.0Resource Conservation Assistant (22) 0.5Energy Management Specialist (20) 1.0 1.5 1.5Projects Designer (20) 1.0 1.0 (1.0)Environmental Design Assistant (20) 1.0 1.0 1.0Environmental Abatement Supervisor (19) 1.0 1.0 1.0Roof Inspector (18) 1.0 1.0Bldg. & Grounds Contracts Assistant (18) 4.0 4.0 3.0 (1.0)Environmental Abatement Technician (16) 6.0 6.0 5.0 (1.0)Fiscal Assistant II (15) 1.0 2.0 2.0Facility Asset Technician (16) 1.0 1.0 1.0Administrative Secretary I (14) 1.0Data Systems Operator (13) 1.0 1.0 1.0Roof Maintenance Worker (11) 1.0 1.0 Subtotal 23.5 23.5 23.5
ICB Resource Conservation Assistant (22) 1.0Energy Management Assistant (19) 1.0 1.0 Total 24.5 24.5 24.5
ICB Division of School Plant Operations Building Service Area Supervisor (G) 1.0 2.0 2.0Customer Services Specialist (16) 1.0 1.0 1.0Building Service Worker (6) 18.0 18.0 18.0 Total 20.0 21.0 21.0
Office of Communications:
Capital Budget Department of Public Information IT Systems Engineer (27) 1.0 1.0 1.0IT Systems Specialist (18-25) 1.0 1.0 1.0 Total 2.0 2.0 2.0
Office of the Chief Technology Officer:
Capital Budget Department of Technology Integration and SupportIT Systems Engineer (27) 1.0 1.0 1.0IT Systems Specialist (18-25) 25.0 25.0 25.0Instructional Specialist 1.0 1.0 1.0Office Assistant III (10) 0.5 0.5 0.5 Total 27.5 27.5 27.5
Capital Budget Department of Infrastructure and OperationsIT Systems Engineer (27) 1.0 1.0 1.0IT Systems Specialist (18-25) 4.0 4.0 4.0 Total 5.0 5.0 5.0
Trust Funds Department of Business Information ServicesDevelopment Project Manager (27) 0.5 0.5 0.5
Capital Budget Department of Information and Application ServicesIT Systems Engineer (27) 1.0 1.0 1.0IT Systems Specialist (18-25) 1.0 1.0 1.0 Total 2.0 2.0 2.0
GRAND TOTAL 155.9 157.0 153.5 (3.5)Note: The positions funded by the Capital Budget or from Trust Funds appear on the organization charts for theunits as information only but are not shown on the resource or personnel complement pages in the budget chapters.
APPENDIX E – 2

RECONCILIATION AND EXPLANATION OF THE FY 2016 ACTUAL EXPENSESBETWEEN THE CAFR AND THE FY 2018 OPERATING BUDGET
(1). (2). (3). (4). (5). (6). (7).FY 2016 CAFR for Local Total FY 2016 Total FY 2016 Expenses
Financial Report and Grant Supported Less Encumbrances Enterprise Fund Total FY 2016 Budgetary Operating Budget by Operating BudgetCategories Funds by State Category Carried Forward Expenses Expenses Adjustments Category Conversions Categories
1. Administration $41,853,301 ($857,725) $0 40,995,576 60,232$ $41,055,8082. Mid-Level Administration 138,821,793 (66,838) 0 138,754,955 (79,649) $138,675,3063. Instructional Salaries and Wages 902,612,971 569,409 903,182,380 (49,197) (569,409) $902,563,7744. Instructional Textbooks and Supplies 21,172,632 (550,484) 5,085 20,627,233 22,167 (5,085) $20,644,3155. Other Instructional Supplies 10,645,143 (728,346) 544,768 10,461,565 49,197 (544,768) $9,965,9946. Special Education 313,863,309 (68,265) 0 313,795,044 $313,795,0447. Student Personnel Services 11,395,184 (2,860) 0 11,392,324 $11,392,3248. Health Services 836 0 836 $8369. Student Transportation 100,308,606 (9,095) 1,808,872 102,108,383 (1,808,872) $100,299,51110. Operation of Plant 127,340,431 (734,017) 4,096,110 130,702,524 (4,096,110) $126,606,41411. Maintenance of Plant 35,261,321 (598,044) 0 34,663,277 $34,663,27712. Fixed Charges 518,008,791 12,513,199 530,521,990 (12,513,199) $518,008,79113. Food Services 0 48,682,513 48,682,513 (5,235,207) (43,447,306) $014. Community Services 637,655 1,312,515 1,950,170 (2,750) (1,312,515) $634,90537. Instructional TV 1,654,339 $1,654,33951. Real Estate Management 3,240,952 $3,240,95261. Food Services 9,442 54,970,484 $54,979,92671. Field Trip Services 1,984,733 $1,984,73381. Entrepreneurial Funds (25,374) 2,446,756 $2,421,382Totals $2,221,921,973 ($3,615,674) $69,532,471 $2,287,838,770 ($5,251,139) $0 $2,282,587,631
(1). Data as reported in the FY 2016 Comprehensive Annual Financial Report (CAFR).(2). In order to compare actual expenditures in the CAFR to the operating budget, encumbrances must be removed to make a meaningful comparison to budgeted amounts.(3). Total amount of Enterprise Funds for inclusion in the FY 2016 expenses in the operating budget document. (4). Grand total of expenses to be included in the operating budget statements before adjustments.(5). Expenses are reduced for items not budgeted for in the operating budget such as depreciation, loss on disposal on fixed assets, escrow purchases, inventory adjustments, and compensated absences.(6). This column represents the mapping of the fund and category numbers used in the financial control system to the categories used by the operating budget system. Unlike the financial control system that uses fund number to capture enterprise expenditure data, the operating budget utilizes unique category numbers to budget and capture financial data for the five enterprise funds. (7). FY 2016 operating expenses by budget category as appears in the Superintendent's Recommended FY 2018 Operating Budget
AP
PEN
DIX
F – 1

G L O S S A R Y O F M C P S O P E R A T I N G B U D G E T T E R M S
Agency—One of the major organizational components of government in Montgomery County, such as Montgomery County Public Schools (MCPS); Montgomery County Government (executive departments, legislative offices and boards, the Circuit Court and judicial offices); Montgomery College (MC); Maryland National Capital Park and Planning Commission (MNCPPC); Washington Suburban Sanitary Commission (WSSC); Housing Opportunities Commission (HOC); and Montgomery County Revenue Authority.
Allocation—The process by which staffing and other resources are given to schools on the basis of factors such as enrollment, the types of programs to be implemented, and other school-specific needs.
Appropriation—Authority to spend money within a specified dollar limit for an approved work program during a fiscal year (FY). Unless explicitly renewed, appropriation authorizations expire at the end of the fiscal year.
Authorized Position—A position that has been approved for hiring in the approved budget or subsequently revised budget.
Bridge to Excellence Act (BTE)—Law requiring Maryland school districts to develop comprehensive five-year master plans that describe their plans for improving the achievement of all students. The BTE law is also known as the Thornton Act.
Budget Staffing Guidelines—Guidance approved by the Board of Education (BOE) that is used to budget and allocate personnel positions in regular and special education; for example, counselors are allocated to middle schools on the basis of projected enrollment.
Capital Improvements Program (CIP)—The comprehensive presentation of capital project expenditure estimates; funding requirements; capital budget requests; and program data for the construction and modernization of all schools and for other capital projects that address facility issues. The CIP, which covers a six-year period, is both a fiscal plan for proposed project expenditures as well as an annual capital budget for appropriations to fund project activity during the first fiscal year of the plan. The CIP is updated every two years.
Career Readiness Education Academy (CREA)—CREA is a career based readiness education program for older English Language Learners (ELLs) in MCPS who are not on track to meet the graduation requirements before turning 21 as a result of limited or interrupted formal education. Student who study in the CREA program are students who would otherwise drop out of school in order to work to support themselves and/or their families. This is an evening program that allows students to learn English language skills, basic work skills and industry certifications. The program also, familiarizes student with the components of the General Education Diploma (GED) subject areas and provides practice tests should they decide to take the GED test in the future.
Category—(Also known as State Category)—State law requires all county school districts to appropriate and record expenditures for education in accordance with standardized state budget categories. These categories are generally based on broad functional classifications, such as administration, instructional costs, special education, and student transportation. Current categories have been in use since FY 1998.
Code of Maryland Regulations (COMAR)—The official compilation of all administrative regulations issued by agencies of the state of Maryland.
Common Core State Standards (CCSS)—The Common Core State Standards Initiative is a state-led effort coordinated by the National Governors Association Center for Best Practices (NGA Center) and the Council of Chief State School Officers (CCSSO). Developed in collaboration with teachers, school administrators, and experts, the CCSS provide a clear and consistent framework to prepare students for college and the workforce.
Compensation—Payment made to employees in return for services performed. Total compensation includes salaries, wages, employee benefits (Social Security, employer-paid insurance premiums, disability coverage, and retirement contributions), and other forms of remuneration that have a stated value.
Consumer Price Index—Urban (CPI-U)—A commonly accepted indicator of inflation as it applies to consumer goods, including the supplies, materials, and services required by MCPS. That rate of inflation is computed using the average of the indices in one fiscal year compared to the average of the indices in the prior fiscal year. For budget purposes, inflation is measured on a fiscal year (FY) basis using the CPI-U for the Washington-Baltimore Metropolitan area. For purposes of Charter limitation of property tax, the November to November CPI-U of the preceding year is used.
Continuing Salary Costs—The incremental salary cost associated with the movement of current MCPS employees along the applicable salary schedule, including changes for longevity (years of service).
Continuous Improvement—An ongoing MCPS effort aimed at improving the organizational culture by improving teaching and management processes and creating ownership and shared responsibility among all employees and stakeholders.
Cost Per Student—A figure that is calculated using the total operating budget amount (excluding summer school, community services, tuition for students with disabilities in private placement, and revolving management accounts) divided by the number of students in Grades K–12.
Curriculum 2.0—MCPS elementary curriculum built around developing students’ critical- and creative-thinking skills, as well as essential academic-success skills, so that students are well prepared for a lifetime of learning. Designed for the elementary grades, Curriculum 2.0 engages students and teachers more and allows more time for the arts, information literacy, science, social studies, physical education, and other subjects.
APPENDIX G – 1

G L O S S A R Y O F M C P S O P E R A T I N G B U D G E T T E R M S
Depreciation—The expiration of the useful life of a fixed asset over a determined period of time attributable to wear and tear, deterioration, action of the physical elements, inadequacy, and obsolescence. Also, the portion of the cost of a fixed asset charged as an expense during a particular period.
Employee Benefits—For budgeting purposes, payments made by MCPS for the employer portion of Social Security taxes, retirement contributions, group health insurance, and life insurance.
Enrollment—The number of students in Grades K–12 attending MCPS. The official enrollment count is based upon the number of students recorded on September 30 of each year.
Enterprise Fund—A fund used to record the fiscal transactions of MCPS activities that are financed and operated in a manner similar to private enterprise, with the intent that the costs of providing goods and services, including financing, are wholly recovered through charges to consumers, users, or other non-tax revenue.
Expenditure—A decrease in the net financial resources of MCPS generally due to the purchase of goods and services or the payment of salaries and benefits.
Expenditure Restrictions—A limitation placed on spending budgeted funds that may occur in any given year as a result of a difficult fiscal climate. The specific restrictions and a process for implementation are specified in a memorandum from the chief operating officer. The restrictions may include a freeze on filling vacant positions and other expenditures.
Financial Management System (FMS)—An integrated web-enabled solution for tracking and managing MCPS financial business functions within one centralized system. FMS automates many previously paper-based processes and supports efficient operation of schools and offices through improved access to information consistent with the MCPS strategic plan.
Fiscal Year (FY)—The 12-month period to which the annual operating and capital budgets and their appropriations apply. The fiscal year for MCPS starts on July 1 and ends on June 30. The number of the fiscal year refers to the year in which the fiscal year ends; for example, Fiscal Year 2017 begins on July 1, 2016 and ends on June 30, 2017.
Fixed Charges—Charges of a generally recurrent nature that are not allocable to individual expenditure categories. Included are contributions to employee retirement and insurance, social security, interest on current loans, fidelity and personal liability insurance, and personnel tuition reimbursements.
Free and Reduced-Price Meals (FARMS) System—Students may qualify for FARMS services on the basis of their family's income or receipt of Food Supplement Program or Temporary Cash Assistance (TCA) benefits.
Full-Time Equivalent (FTE)— A way of describing a position according to the percentage of time the employee is authorized to work. In this system, a full-time permanent employee is a 1.0 FTE. The positions of employees who are authorized to work less than full-time are expressed as fractions of 1.0 FTE; for example, a .5 FTE is authorized to work for 20 hours per week in a job that full-time employees perform for 40 hours per week.
Fund—A sum of money or other resources that are used for a specific objective. MCPS uses the following funds—general, capital projects, supported projects, food services, instructional TV, real estate management, field trip, entrepreneurial, and warehouse.
General Wage Adjustment (GWA)—A change in wages made according to a formula that reflects changes in the cost of living.
Grade—An assigned level on a salary schedule that denotes the level of skills, education, and responsibility of a position.
Grant—Funding or resources given by an outside entity to achieve a specific objective or public purpose. MCPS receives grants from government programs, corporate charities, and private philanthropic organizations. Grants are awarded for well-defined purposes and must be spent only for those purposes. MCPS accounts for grant expenditures through supported projects.
High School Assessments (HSA)—Tests used to determine a Maryland public school student's mastery of Maryland Content Standards in algebra, English, government, and biology.
Individuals with Disabilities Education Act (IDEA)—A federal law regulating how states and public agencies provide early intervention, special education, and related services to children with disabilities. The law mandates a free and appropriate education for students with disabilities in the Least Restrictive Environment (LRE) that meets the student's needs.
Interagency Coordinating Board for Community Use of Public Facilities (ICB/CUPF)—The office within Montgomery County Government whose mission is to maximize the community’s use of schools and other public facilities and to identify and facilitate activities and programs that respond to the community’s needs without disrupting the instructional program of MCPS.
Lapse—The amount of unused budgeted salary that remains when an employee terminates service and is not immediately replaced.
Lease-Purchase Agreement—A contractual agreement that is a financing mechanism with payments made over time. The mechanism is typically used to acquire equipment.
APPENDIX G – 2

G L O S S A R Y O F M C P S O P E R A T I N G B U D G E T T E R M S
Least Restrictive Environment (LRE)—An educational setting that complies with the mandate of the IDEA to the maximum extent appropriate. Students with disabilities are educated with students who do not have disabilities and only removed from general education classrooms when the nature of their disability prevents their learning with the use of supplementary aids and services.
Level of Service—The existing or current services, programs, and facilities provided by MCPS to students. The level of service may increase, decrease, or remain the same depending upon needs, alternatives, and available resources.
Maintenance of Effort (MOE)—A Maryland state law that requires local governments to provide a definite level of local effort to fund public education from year to year. Local funding is to remain at least the same on a per-student basis. The law ensures that additional state aid will not supplant local revenues.
Master Plan—A MCPS multiyear plan that describes the goals, objectives, and strategies that will be used to improve student achievement and meet state and local performance standards for all students. The master plan also describes specifically how to improve student achievement for students in special education, with limited English proficiency, in prekindergarten and kindergarten, gifted and talented, and in career and technology courses. The master plan includes the MCPS strategic plan. By law, the master plan must be submitted to the state of Maryland every five years.
Maximum Class Size Guidelines—Guidelines that represent the standard to which MCPS strives in placing the number of children in one classroom.
MCAAP—The Montgomery County Association of Administrators and Principals (MCAAP) is the bargaining unit that represents principal trainees, administrative interns, and all administrative and supervisory positions on the M to Q salary schedule, including 11-month assistant school administrators.
MCBOA—The Montgomery County Business and Operations Administrators (MCBOA), represented by MCAAP, includes all noncertified supervisory employees who provide direction to other employees, exercise independent judgment, are responsible for the evaluation of at least two other employees, and do not report to members of the SEIU bargaining unit, except those excluded by the Board of Education as confidential employees and those who are represented by MCAAP.
MCEA—Montgomery County Education Association (MCEA), the employee organization representing teachers and other professional staff.
Mission—A statement that describes an organizational unit’s purpose, reason for existing, and relationship to the MCPS strategic plan.
Negotiated Agreement—A legal contract between the BOE and a certified representative of a recognized bargaining unit for specific terms and conditions of employment, e.g., hours, working conditions, salaries, or employee benefits.
Non-budgeted grants—Grants that MCPS receives for designated purposes that are not expected to be funded on an ongoing basis or at predictable levels. In many cases, MCPS must compete with other school districts and entities for these grants.
Non-Recommended Reductions—A list of expenditure reductions that address the difference between the County Council’s recommended affordability allocation and the BOE’s requested amount. The options cannot be recommended because the Board believes the cuts would harm the schools.
Object of Expenditure—A numeric indicator that identifies the form of an expenditure, such as salaries (01), contractual (02), supplies and materials (03), other (04), and equipment (05).
Operating Budget—A comprehensive plan by which the MCPS operating programs are funded for a single fiscal year. The operating budget includes descriptions of programs, appropriation authority, details of estimated expenditures and revenue sources, and personnel, as well as related program data information on the fiscal management of the school system.
Operating Budget Guide—A guide that is developed and published annually to explain the budgetary process for the upcoming budget development cycle and to promote a clear understanding of budget preparation and submission requirements.
Operating Budget Orientation—Meetings held by the Department of Management, Budget, and Planning to review the Operating Budget Guide and provide clarification to MCPS units regarding budget preparation.
Other Salaries—Remuneration for temporary work performed on other than full-time bases. Other salaries include payments to substitute teachers, stipends, extracurricular activities, summer teaching, and support during peak or seasonal periods.
Partnership for Assessment of Readiness for College and Careers (PARCC)—A consortium of 24 states, including Maryland, that developed a common set of K–12 assessments in English and mathematics, as well as literacy in other content areas, that will determine whether a student is college- and career-ready. Full implementation of the PARCC assessments began in FY 2015.
Per Student Allocations—The amount of funds budgeted for textbooks, instructional supplies, media center materials, and other school-based expenses divided by the number of students in schools.
Performance Measurement—The description of how key objectives will be measured to attain the goals of the MCPS strategic plan.
Personnel Complement—A chart published in the budget that displays budgeted positions by unit. The chart provides position titles, total number of FTEs, grade, and whether the position works year round or is school-calendar based.
APPENDIX G – 3

G L O S S A R Y O F M C P S O P E R A T I N G B U D G E T T E R M S
Personnel Costs—Expenditures for salaries, wages, and benefits payable to MCPS employees.
Positions—Identified permanent jobs into which persons may be hired on either a full-time or part-time basis.
Program—A primary service, function, or set of activities that addresses a specific responsibility or goal within a mission. A program encompasses all associated activities directed toward the attainment of established objectives. A program will have measurable outcomes and clearly defined attainable objectives that may be short-term or long-term in nature.
Program Budget—A published document that displays the allocation of budgeted expenditures by specific MCPS programs. The Program Budget is published twice annually and corresponds to the publication of the Superintendent’s Recommended Operating Budget and the Operating Budget Summary.
Ratio Positions—Positions established by applying each school’s student enrollment to Board-approved staffing standards.
Realignment—The process by which resources are moved from one part of the budget to another part to meet managerial and operational needs with no net change in the total budget.
Reorganization—A change in the organizational structure within or between MCPS units.
Resource Page—Charts published in the operating budget document that display the budget for a unit or group of units.
Revenue—All funds MCPS receives annually for the Operating Budget from federal, state, and county sources, enterprise funds, fees, and other sources.
Salaries and Wages—An object of expenditure for monetary compensation to employees in the form of annual or hourly rates of pay.
Salary Schedule—A listing of minimum and maximum salaries for each grade level in a classification plan for authorized positions.
SEIU—Service Employees International Union (SEIU), the employee organization that represents supporting services employees.
Special Education Staffing Plan—An annual plan required by the state of Maryland for each local district that describes the needs of special education students and how these needs will be met.
Spending Affordability Guideline (SAG)—An approach to budgeting that assigns expenditure ceilings for the forthcoming budget year on the basis of expected revenues and other factors. Under the County Charter (Section 305), the County Council is required to establish spending affordability guidelines for both the capital and operating budgets.
Staffing Ratios—Per-student standards used to budget for teachers, administrators, and other instructional and support staff at schools.
State Categories—State law requires all county school districts to appropriate and record expenditures for education in accordance with standardized state budget categories. These categories are generally based on broad functional classifications such as administration, instructional costs, special education, and student transportation. Current categories have been in use since 1998.
Step—A salary increment awarded annually to an employee for satisfactory performance until the employee reaches the top pay step of the pay grade to which the position is assigned.
Strategic Plan—A plan adopted by the Board of Education that focuses on the major academic priorities of the school system. It includes major goals, objectives, performance measures, and instructional strategies. The Operating Budget is aligned with the strategic plan.
Strategy—The principal ways in which MCPS staff direct their efforts in pursuit of the school system’s and unit’s mission and goals. Strategies are clear and uncomplicated methods for attaining goals and key results.
Supplemental Appropriation—An appropriation of funds above amounts originally designated, to authorize expenditures not anticipated in the adopted budget. A supplemental appropriation is required to enable expenditure of reserves or additional revenues received by MCPS through grants or other sources.
Tax Supported—A program supported in whole or part by tax revenues and included in spending affordability guidelines.
Turnover—The accumulation of unused budgeted funds that results from replacing former employees by lower-paid staff.
Zero-based Budgeting—A method of budgeting in which all line items are presumed to have $0 funds and any amount budgeted for them is based on justified need. This method is in contrast to incremental budgeting that either adds or subtracts amounts or increments from the amount budgeted in the current year.
APPENDIX G – 4

Index
Index

I N D E X
Accelerated and Enriched Instruction .................. 4-9Administration and Oversight ............................... 10-1Allocation of Staffing ............................................... vi-1Alternative Programs............................................... 2-5American Indian Education .................................... 4-14Applied Research Unit ............................................ 10-15Arc of Montgomery County ................................... 1-51Association Relations ............................................... 7-30Autism Programs ..................................................... 5-24Autism Programs, School-Based ........................... 1-47Bilingual Programs Unit.......................................... 4-9Board of Education .................................................. 10-2Bridge Program ........................................................ 5-24Bridge Program, School-Based.............................. 1-47Budget Unit ............................................................... 7-14Business, Fiscal, and Information Systems
(Special Education) .............................................. 5-9Business Information Services ............................... 8-2Career Readiness and Innovative Programs ........ 4-35Career Readiness Education Academy (CREA) ... 4-35Carl Sandburg Learning Center ............................ 1-54Central Placement Unit ........................................... 5-4Certification and Staffing ........................................ 9-3Chief Academic Officer ........................................... 3-1Chief Financial Officer ............................................. 7-14Chief Operating Officer ........................................... 7-3Chief of Staff ............................................................. 10-10Chief Technology Officer......................................... 8-3Child Find .................................................................. 5-29Communications ...................................................... 10-10Consortia Choice and Application
Program Services ................................................. 4-35Construction ............................................................. 7-42Continuing Education ............................................. 9-4Controller .................................................................. 7-18Cost per Student by Grade Span ........................... vii-1Curriculum and Instructional Programs ............... 4-1Database Administration ........................................ 8-12Data Center ............................................................... 8-12Deaf & Hard of Hearing Programs ....................... 5-24Deaf & Hard of Hearing, School-Based
Programs .............................................................. 1-47Early Childhood Programs and Services .............. 4-8Edison High School of Technology ....................... 1-30Editorial, Graphics, and Publishing Services ... ... 7-74Elementary Curriculum and
Districtwide Programs ........................................ 4-8Elementary Learning Centers ................................ 1-43Elementary Schools ................................................. 1-13Elementary School Support and Improvement ... 2-2Emotional Disabilities Programs ........................... 5-24Emotional Disabilities, School-Based Programs . 1-47Employee and Retiree Services .............................. 7-21Employee Assistance ............................................... 9-4Employee Benefits.................................................... 7-21Enterprise Systems Administration ...................... 8-13Entrepreneurial Activities Fund ............................. 7-8Equity Initiatives Unit .............................................. 3-3
ESOL, School-Based ................................................ 1-34ESOL/Bilingual Programs ....................................... 4-9Evaluation and Selection of
Instructional Materials ........................................ 4-32Extensions Program, School-Based ...................... 1-43Facilities Management ............................................ 7-33Field Trip Fund ......................................................... 7-65Food and Nutrition Services ................................... 7-80Foundations .............................................................. 4-38General Counsel ....................................................... 10-28Gifted and Talented/Learning
Disabled Programs, School-Based .................... 1-43Glossary............................................................. ........ G-1Head Start Programs and Services ........................ 1-16High Schools ............................................................. 1-27Home School Model ................................................ 5-16Home School Model, School-Based ...................... 1-43Hours Based Staffing ............................................... 1-43Human Capital Management ................................. 9-2Individuals with Disabilities Education Act ......... 1-59Infants and Toddlers Programs .............................. 5-18Information and Application Architecture ........... 8-27Infrastructure and Operations................................ 8-3Instructional Technology ......................................... 8-9Instructional Television Special Revenue Fund ... 10-22InterACT .................................................................... 5-18InterACT, School-Based .......................................... 1-51Interim Instructional Services ................................ 4-41Internal Audit Unit ................................................... 10-3International Admissions and Enrollment ........... 6-3Language Assistance Services ............................... 10-21Learning and Academic Disabilities Programs ... 1-43Learning for Independence .................................... 1-43Learning Management Systems ............................ 8-3Least Restrictive Environment Support ................ 1-43Long-range Planning ............................................... 7-45Longview School ...................................................... 1-54Maintenance ............................................................. 7-48Materials Management ........................................... 7-68MCPS Organization Chart ...................................... ix-1MCPS Television ....................................................... 10-21Medical Assistance Program .................................. 5-13Middle Schools ......................................................... 1-22National Institutes of Health Program .................. 4-37Neglected and Delinquent Youth, Title I, Part D ........................................................ 2-4Non-operating Budget Positions ........................... E-1Onboarding, Induction and Growth ..................... 9-3Operations ................................................................. 7-1Outdoor Environmental Education Program ...... 4-29 Partnerships .............................................................. 10-12Payroll ........................................................................ 7-21Performance Evaluation and Compliance ............ 9-3Perkins Career & Technology Education
Improvement Program, Grant... ........................ 4-37Perkins Career & Technology Education
Improvement Program, Grant School-Based... ..................................................... 1-29
Physically Disabled Programs ................................ 5-24
PAGE PAGE
INDEX – 1

Physically Disabled Programs, School-Based ...... 1-47Policy Unit ................................................................. 10-30Prekindergarten/Head Start ................................... 1-13Prekindergarten, Special Programs,
and Related Services ........................................... 1-47Prekindergarten, Special Programs,
and Related Services, School-Based ................. 5-24Preschool Education Programs (PEP) ................... 5-29Preschool Education Programs (PEP),
School-Based ........................................................ 1-51Procurement ............................................................. 7-77Professional Growth Systems................................. 9-3Professional Learning and Equity Initiatives ....... 3-2Program Evaluation Unit ........................................ 10-17Programs for Deaf and Hard of Hearing .............. 5-24Programs for Deaf and Hard of Hearing,
School-Based ........................................................ 1-47Programs for Emotional Disabilities ..................... 5-24Programs for Emotional Disabilities,
School-Based ........................................................ 1-47Programs for Physically Disabled .......................... 5-24Programs for Physically Disabled,
School-Based ........................................................ 1-47Programs for Speech and Language ..................... 5-24Programs for Speech and Language
School-Based ........................................................ 1-47Programs for Visually Impaired ............................. 5-24Programs for Visually Impaired, School-Based ... 1-47Psychological Services ............................................ 6-2Public Information and Web Services ................... 10-21Pupil Personnel and Attendance Services ............ 6-6Real Estate Management Fund .............................. 7-39Records and Reporting Unit ................................... 10-17Resolution and Compliance Unit ........................... 5-4Resource Only (Special Education)........................ 1-39Revenue Summary for Grant Programs ............... iv-1Revenue by Source .................................................. iii-1RICA (John L. Gildner Regional Institute for
Children and Adolescents) ................................. 1-54Rock Terrace School................................................. 1-54Salary Schedules Administrative and Supervisory........ ................. A-1 Business & Operations Administrators ............. A-2 Teacher and Other Professional ......................... A-3 Supporting Services Hourly Rate Schedule... .. A-4Schools ....................................................................... 1-1School and Financial Operations Team ................ 7-14School Administration and
Leadership Development .................................... 2-2School-Based Services (Special Education) ......... 5-16School/Community-Based Programs .................... 1-43School Counseling Services ................................... 6-3School Library Media. ............................................. 4-29School Plant Operations .......................................... 7-53School Safety and Security ..................................... 7-84School Support and Improvement ........................ 2-1
Secondary Curriculum and Districtwide Programs ........................................ 4-28
Secondary ESOL ...................................................... 4-29Secondary Intensive Reading Program ................ 1-43Secondary School Support and Improvement .... 2-2Shared Accountability ............................................. 10-15Skillful Teaching and Leading (Local) ................... 9-18Skillful Teaching and Leading Grant ..................... 9-20Special Education ..................................................... 5-1Special Education/Centers ...................................... 1-54Special Education Legal Services .......................... 10-29Special Education Services ..................................... 5-2Special Education Staffing Plan ............................. D-1Speech and Language Programs ........................... 5-24Speech and Language Programs, School-Based ........................................................ 1-47Staffing Guidelines, K-12 ......................................... C-1State Budget Categories .......................................... B-1Stephen Knolls School............................................. 1-54Student and Family Support and Engagement ... 6-2Student Enrollment .................................................. v-1Student Online Learning ......................................... 4-35Summary of Budget Changes ................................ ii-2Summary of Negotiations ....................................... viii-1Summary of Resources by
Object of Expenditure ......................................... ii-1Summary of Student Enrollment ...................... .... v-1Superintendent of Schools ...................................... 10-6Talent Acquisition ..................................................... 9-8Technology Integration and Support .................... 8-3Technology Modernization ..................................... 8-9Technology Support and Infrastructure ............... 8-2Telecommunications Systems ................................ 8-15Testing ........................................................................ 10-17Title I and Early Childhood Programs ................... 4-22Title I, Part D Neglected,
Delinquent or At-Risk Youth .............................. 2-4Title II, Part A Skillful Teaching and Leading ... ... 9-20 Title II, Part A Teacher Mentoring ......................... 9-21Title III, English Language Acquisition ................. 4-12Title VII, American Indian Education .................... 4-14Transition Services ................................................... 5-24Transition Services, School-Based ......................... 1-47Transportation .......................................................... 7-57Tuition Reimbursement ........................................... 9-4University Partnerships ........................................... 9-10Utilities ....................................................................... 7-35Visually Impaired Programs ................................... 5-24Visually Impaired Programs, School-Based ......... 1-47Web Services ............................................................. 10-21Where the Money Comes From............................. ii-4Where the Money Goes .......................................... ii-3
I N D E X
PAGE PAGE
INDEX – 2

montgomeryschoolsmd.orgCheck out the MCPS website for more detailed information about the FY 2018 Operating Budget.
VISIONWe inspire learning by providing the greatest public education to each and every student.
MISSIONEvery student will have the academic, creative problem solving, and social emotional skills to be successful in college and career.
CORE PURPOSEPrepare all students to thrive in their future.
CORE VALUESLearning Relationships Respect Excellence Equity
Board of Education
Ms. Jeanette E. Dixon
Dr. Judith R. Docca
Mr. Michael A. Durso
Mrs. Shebra L. Evans
Mrs. Patricia B. O’Neill
Ms. Jill Ortman-Fouse
Mrs. Rebecca Smondrowski
Mr. Eric GuerciStudent Member
School Administration
Jack R. Smith, Ph.D.Superintendent of Schools
Maria V. Navarro, Ed.D.Chief Academic Officer
Kimberly A. Statham, Ph.D.Deputy Superintendent of School Support and Improvement
Andrew M. Zuckerman, Ed.D.Chief Operating Officer
850 Hungerford Drive Rockville, Maryland 20850 www.montgomeryschoolsmd.org
FISCAL YEAR 2018 OPERATING BUDGET TIMELINE
Superintendent Presents Recommended FY 2018 Operating Budget to Board of Education December 13, 2016
Sign-up for Board of Education Public Hearings December 14, 2016 through January 10, 2017
Board of Education Public Hearings-Auditorium January 5 & 11, 2017
Board of Education Budget Work Sessions January 17 & 19, 2017
Board of Education Action February 14, 2017
Board of Education Budget Transmittal to County Executive/Council (Required by March 1, 2017) March 1, 2017
County Executive Submits Proposed FY 2018 Operating Budget to Council March 15, 2017
County Council Budget Public Hearings April 2017
County Council Work Sessions April – May, 2017
County Council Budget Action June 1, 2017
Final Board of Education Action to Approve FY 2018 Operating Budget June 13, 2017
OPERATING BUDGET DOCUMENTSThe documents listed below enable citizens to understand the MCPS budget and how resources are used.
Budget in Brief—Provides detailed summary information on the budget and changes proposed in the Superintendent’s Recommended Operating Budget.
Superintendent’s Recommended Operating Budget (often called the management budget)—Shows budget resources by office, department, and other units. It includes references to the units that carry out each program, describes in detail the work of each unit, shows all budget changes, and includes performance measures for each operating unit, a glossary of budget terms, an index of all items, and a section describing how to understand the budget.
The Operating Budget Adopted by the Board of Education—Shows summary budget information, including changes to the Superintendent’s Recommended Operating Budget made by the Board of Education.
The Operating Budget Summary—Includes information based on the final budget appropriated by the County Council and approved by the Board of Education.
The Program Budget—Includes summaries of more than 70 programs across MCPS departments and offices. The programs are categorized to show how the budget is aligned with the Montgomery County Public Schools Strategic Planning Framework, Building Our Future Together.
Personnel Complement—Provides a detailed listing of all positions requested in the budget. The Program Budget, the Superintendent’s Recommended Operating Budget, and the Operating Budget Summary include personnel complements organized by program and unit, respectively.
Budgeted Staffing Guidelines—The Superintendent’s Recommended Operating Budget includes budgeted staffing guidelines for regular education and special education. These guidelines govern the allocation of personnel resources by school and special education disability.
Schools at a Glance—Provides a variety of information for each school, including programs from the Program Budget that are implemented at each school and personnel expenditures budgeted for each school. A separate document, Special Education at a Glance, is published to show special education resources at each school.
All of these publications are available on the MCPS website at www.montgomeryschoolsmd.org/departments/budget/

Published by the Department of Materials Managementfor the Department of Strategic Planning and Resource Management0511.17 • Editorial, Graphics & Publishing Services • 12/16Copyright © 2016 Montgomery County Public Schools, Rockville, Maryland