superintendent’s fy14 proposed budget overvie · superintendent’s fy14 proposed budget ... the...
TRANSCRIPT

Superintendent’s FY14 Proposed Budget Overview
FY14 Proposed Budget
The Milwaukee Public Schools FY14 Superintendent’s Proposed Budget totals $1,170,867,945. This is
2.0% less than the FY13 Final Adopted Budget of $1,194,450,752.
The State of Wisconsin 2013 – 2015 Governor’s Proposed Budget was issued in February 2013 and has
not yet been adopted by the state legislative bodies. With the uncertainty of state funds, the following
assumptions were made in developing the MPS FY14 Superintendent’s Proposed Budget:
The proposed state budget does not allow for an increase in the per pupil rate that is used in the
calculation of the revenue limit; neither does the FY14 MPS Proposed Budget.
The MPS proposed budget maintains the current per pupil funding for Non-Instrumentality
Charter schools at $7,775. If approved, the proposed state budget will increase the per pupil
funding level for these schools; the MPS budget will need to be adjusted accordingly to cover
these increased costs.
The proposed state budget will create a Special Needs Scholarship Program. Any cost of this
program to MPS was not included in the Superintendent’s FY14 Proposed Budget since the
impact is unclear.
Sequestration at the Federal level has also resulted in uncertainty in the amounts of the FY14 Federal
grant awards. It is anticipated that MPS may lose $42.5 million in total grant funding in FY14, of which
$38.3 million is from Federal grants.
Eighty-seven cents of every dollar budgeted in the School Operations Fund has been allocated for staff
and supplies necessary to educate City of Milwaukee children. Education is provided through MPS
traditional and charter schools, open enrollment or with other MPS contracted schools. Eight cents of
every dollar budgeted has been allocated for non-school-based staff and services. The remaining five
cents of every dollar are for costs that are necessary to run schools such as utilities, insurance,
technology licenses and debt repayment.
There are 103.6 more full-time equivalent (FTE) budgeted positions in the FY14 Proposed Budget than
what is in the FY13 Final Adopted Budget. These increases occurred through benefit savings and lower
average salary. The FTEs for safety aides, school aides, classroom teachers, principals, assistant
principals, and other classified and techncial staff all increased. Some of the positions that are
eliminated are vacant and others will be reduced due to attrition.
For the Superintendent’s FY14 Proposed Budget, the students and their classrooms remain the number
one priority. This theme is evident throughout this document and is highlighted in the following points:
The FY14 Proposed Budget doubles the allocation of art, music and physical education teachers
for most K-5 and K-8 schools;
Centrally funded principals, secretaries and bookkeepers to “level the financial playing field” so
schools have the leadership and support necessary to increase student achievement;
Continued specialty funding for arts, International Baccalaureate, language immersion and
Montessori programming; and
Reorganized Central Services for better alignment to achieve improved service and greater
accountability.
Superintendent’s FY14 Proposed Budget Overview
FY14 Proposed Budget
Background Information
Reporting Entity
Milwaukee Public Schools (MPS) operates within the city of Milwaukee, Wisconsin. The purpose and
responsibility of the district is to provide an educational system that prepares children enrolled in public
schools for success in college and careers after graduation. In addition to the regular educational
programs, the district offers comprehensive programs in the areas of career and technical education,
special education, early childhood education and bilingual education. Through its specialty school
programs, the district offers advanced educational programs in such areas as language, fine arts,
computer science, health professions, career and technical education. The district also provides
community recreation and education services through its parks and centers for all Milwaukee residents.
Milwaukee is located 70 miles north of the city of Chicago on the western shores of Lake Michigan. The
city has a population of approximately 597,867 based on 2011 U. S. Census Bureau Data. The district
currently has over 78,000 students, employs over 8,900 educators, administrators and staff. The district
operates 139 school buildings and 31 support buildings, underutilized or recreational centers totaling
over 17.7 million square feet. The Superintendent, appointed by the Milwaukee Board of School
Directors, is the senior official representing MPS.
Milwaukee Public Schools was established on February 3, 1846, and is operated under Chapter 119 of
the Wisconsin Statutes. The district, governed by a nine-member Board, provides education services
through grade 12 to Milwaukee residents and its participating suburban transfer students.
MPS is the 33rd largest school district in the nation with students from diverse racial, ethnic and cultural
backgrounds. MPS’ reported enrollment for FY13, the 2012-13 school year, was 78,461. The
racial/ethnic composition was 55.8% Black, 24% Hispanic, 13.9% White, 5.5% Asian and 0.8% American
Indian. Approximately 20.6% students were identified with special education needs and 9.6% of
students had limited English proficiency. In addition, 82.7% of all students qualified for free or reduced-
price lunch, which is an indicator of the number of children living in poverty.
Local Economic Analysis
Milwaukee is the state's largest urban and economic center. The city has a diversified economy with
strong service and manufacturing sectors. Finance, insurance, entertainment, communication, health
care and other personal and business service activities account for over half of all employment. MPS is
the third-largest employer in the city.
The city continues to maintain high bond ratings from three of the major agencies. Ratings of AA from
Standard & Poor’s Corporation, AA+ from Fitch Ratings, and AA2 from Moody’s Investors Service, Inc.
were received on general obligation bonds in FY13.
Superintendent’s FY14 Proposed Budget Overview
FY14 Proposed Budget
Mission Statement
MPS educates all students for success in higher education, careers and responsible citizenship so that
MPS is the first choice for families.
Vision Statement
MPS will be among the highest-performing urban public school districts in the country, providing
rigorous, high-quality learning opportunities for students. Schools will enable lifelong learning among
students, families, educators and other staff focused on continuous improvement. Teaching will be
child-centered, based on research-proven methods, and aligned to high academic standards; it will meet
the learning needs of individual students. The district, its schools, and its employees will be accountable
for measurable gains in student achievement.
Schools will be safe centers of community activity that are welcoming, well maintained, and accessible.
Children will be provided maximum educational opportunities to become responsible citizens who make
positive contributions to their communities. The district and its schools will strengthen partnerships
with families and those in the community who influence and affect students and families.
Core Beliefs 1. Children come first.
2. The classroom is the most important place in the district.
3. Leadership and accountability are keys to success.
4. Central Services supports student achievement.
5. Families are valuable partners.
6. Community partnerships add value.
Strategic Goals
1. Students meet and exceed Wisconsin academic standards and graduate prepared for higher education, careers and citizenship.
2. School communities work together for improvement in academic achievement.
3. Leaders and staff demonstrate continuous improvement through focused professional development.
4. School staffs are accountable for high quality teaching and learning, measurable gains in student achievement and fiscal responsibility.
5. School staffs are supportive and responsive to students and families.
6. The district is accountable for measurable results.
7. The district’s central services offices support student learning.
8. The district builds partnerships to support student achievement.
Superintendent’s FY14 Proposed Budget Overview
FY14 Proposed Budget
District leadership has developed a theory of action that is built on the following goal areas: student
achievement; family, student and community engagement; and effective and efficient operations.
These broad goals are consistent with those of the MPS Strategic Plan. Contained within each goal area
are a series of themes aligned to achieve the overall district objective of preparing our students to
compete in a global economy that is ever-changing. Much of the work to accomplish this, which
includes the creation of the Offices of Innovation and Organizational Development, is well underway and
will support our continued efforts in innovation, replication of what works, stability and sustainability.
Innovations introduced in FY13 to better serve all MPS students will move forward in the FY14 Proposed
Budget. These include a major restructuring of the district’s Gifted and Talented program and increased
efforts in Response to Intervention (RtI) for students experiencing academic difficulties. The
restructuring of Bay View Middle and High School included extensive community engagement and
yielded plans to grow an academically challenging program featuring innovation and creativity. A similar
process helped create a successful merger and redesign of 81st Street School. In FY14, the
Administration will begin a redesign process akin to the Bay View experience at South Division High
School.
Additional FY13 accomplishments that we will build upon in the FY14 budget include continued growth
of college and career readiness programs to prepare students for the world after high school. Learning
Journeys, MPS’ exclusive beyond-the-classroom learning experiences will be expanded to more grade
levels.
Other programming innovations in the FY14 Proposed Budget include implementation, at five schools, of
SpringBoard, a College-Board pre-Advanced Placement program that prepares students for success. At
the elementary level, personalized learning instruction will be expanded to four more elementary
schools and there will be an additional arts-focused elementary school. Funding for arts/music/physical
education teachers was increased in FY13. Most elementary schools will receive twice as many of these
positions in the FY14 budget.
While not an FY14 budget item, we will join with our established partners from other governmental
agencies who are utilizing IDEAS (Integrated Data Evaluation and Action System) to best help our
children. IDEAS allow governmental agencies to share and evaluate data and make better informed
decisions in serving clients, many of which are MPS students and their families.
In a move toward replicating successful academic models and providing parents with quality enrollment
options, the Administration is exploring expansion of International Baccalaureate programs. Also, four
new charter schools will open in FY14, creating additional high-quality options for Milwaukee families.
To encourage new families to consider MPS, the Administration is collaborating with the MTEA and
other strategic partners to undertake an aggressive door-to-door campaign to augment the district’s
FY14 projected enrollment at schools with strong programs that have room to grow.
Some key budget actions and accomplishments preceding the FY14 Proposed Budget process
contributed greatly to stability and sustainability of resources, programs and services. These changes

Superintendent’s FY14 Proposed Budget Overview
FY14 Proposed Budget
will allow us to build upon our success to assure students and their classrooms remain the number one
district priority. These include changes in benefits for active employees and retirees and freezing the
second pension for teachers. Both will translate to an increase of direct services to schools.
Our recent budgets presented challenges, and the FY14 budget continues that trend. We hoped to
enhance our hard work around a standard of care for all students and further reduce class size.
However, the proposed state budget with no per pupil funding increase and a likely further reduction in
the reimbursement rate for students with disabilities will challenge our ability to achieve our goals at
the level we desire and our children deserve. We will continue to advocate on behalf of our children.
An overview of each goal area and the corresponding accomplishments as a result of the work
completed to date in the 2012-13 school year follows.
Student Achievement
District leadership is committed to building school and district capacity to effectively meet the needs of
all students. While leveraging resources and improving learning for individuals and the system as a
whole, the district strives to foster and sustain academic reforms district-wide that will increase student
achievement.
To accomplish this, implementation of the Common Core State Standards (CCSS) continues to provide
both students and teachers with a clear understanding of learning expectations at each grade level. The
Comprehensive Literacy Plan and the Comprehensive Mathematics and Science Plan support the CCSS.
Accomplishments in this area include stabilization of the Office of Academics; alignment of the
Comprehensive Literacy, Math/Science, and Response to Intervention plans; increase of on-time college
enrollment to 37.5%, an increase of 4.4% from 2004-05; and participation of 1,868 students from more
than 65 schools during first semester in MPS College Access Center services.
WKCE results from fall 2012 were recently released. The new cut scores are aligned to more rigorous
College and Career Readiness benchmarks that were used for the first time this year. All schools in
Wisconsin are seeing a drop in the percentage of students scoring proficient and advanced as a result of
these new cut scores. In MPS, proficiency rates show minimal change over the last four years when the
new cut scores are applied to past results. Reading proficiency rates are lower overall than mathematics,
but have shown more improvement. Middle and high school reading performance is the most
consistently positive trend in our data.
The new reading cut scores decreased the proficiency rates more dramatically than new math cut scores
did. As students get older, there is a decrease in proficiency rates, although the drop off is more
prominent in math than reading. Elementary math performance is trending downward. The difference
in reading and math proficiency trends for students eligible for free or reduced-price lunch (FRPL)
compared to ineligible students is significant. The ineligible students are improving in reading and math
consistently and at a faster rate over the last four years than their FRPL eligible peers.

Superintendent’s FY14 Proposed Budget Overview
FY14 Proposed Budget
MPS four-year graduation rates have remained stable over the past three years based on statistics just
released by the Wisconsin Department of Public Instruction. The new five-year rate shows that 70.8%
MPS students graduate within five years of starting high school, which indicates an additional 8% of that
cohort group graduated after an additional year of high school. The data also showed that 72.8% of
students graduated six years after entering high school. This indicates an additional 11.6% of that cohort
group graduated after six years. Although the district needs to continue to improve the four-year
graduation rate, a growing percentage of students who do not graduate in four years, are staying in
school, which is positive. In 2009-10, 18% of students that did not graduate continued in school the
following year. In 2011-12, 19.5% of students that did not graduate in four years chose to continue in
school.
Family, Student and Community Engagement
Providing meaningful parental involvement and community outreach opportunities continues to be
emphasized. Attendance at parent training opportunities remains steady, and has recently begun to
increase. Feedback forms indicate overall satisfaction with the types of training provided. MPS
responded to feedback by moving parent center services from central services to school locations: South
Division, Washington, Audubon, Morse-Marshall and most recently, North Division. We continue to
seek improvement opportunities.
Other highlights in the area of community engagement include the first Student Summit held at Bradley
Tech; enhanced volunteer services, successful efforts to restructure the educational program at Bay
View High School; and the work underway to develop an updated MPS Strategic Plan. Greater access
and convenience for families comes in the form of the online enrollment system and the mobile app of
the MPS website.
Effective and Efficient Operations
The MPS Lean Six Sigma initiative continued during 2012-13 with 17 new “green belt” trainees working
on six projects to improve operational efficiencies and enhance cost savings for MPS. Original projects
introduced in 2010-11 have either been completed or are in next generation phases and have achieved
$3 million in cost avoidance.
We continue to use our school buildings effectively and efficiently. The following schools were
successfully relocated or opened in FY13: Relocation of MacDowell to Juneau Campus and Wisconsin
Conservatory for Lifelong Learning (WCLL) to the former Sarah Scott building, re-opened Milwaukee
Education Center campus for Golda Meir program expansion and moved Garland to the former WCLL
site. For FY14, the Board approved requests for Ronald Reagan College Preparatory High School to
expand within its facility and to give I.D.E.A.L. charter school a building where it can grow and flourish.
The Board also made decisions to lease five school buildings to charter school operators for new non-
instrumentality charter schools that are opening in FY14. These include Banner School of Milwaukee,
Carmen Northwest High School of Science and Technology, Milwaukee Environmental Sciences School
and a two-campus school for Universal School of Milwaukee.

Superintendent’s FY14 Proposed Budget Overview
FY14 Proposed Budget
In June 2012, the Board approved the creation of the Limited-Term Employment positions. This action
gives MPS the ability to hire employees on a temporary basis to fill immediate short-term vacancies up
to a maximum of one year. This allows MPS a lower-cost solution compared to temporary agencies.
Staffing Changes
The cost savings resulting from benefit changes have made it possible to restore some school staff,
although persistent revenue challenges will create difficult staffing decisions at the school and district
levels.
Position Type FY13
Adopted FY14
Proposed
Changes for FY14 Schools
Changes for FY14
Departments Total
Changes
Certificated Administrators 222.7 224.2 1.5 0.0 1.5
Principals 123.1 126.0 3.0 0.0 3.0
Assistant Principals 99.0 110.6 12.6 (1.0) 11.6
Teachers 4,927.4 4,927.4 23.9 (24.0) (0.1)
Therapists 43.0 43.0 0.0 0.0 0.0
Social Workers 139.8 136.8 1.5 (4.4) (2.9)
Psychologists 137.7 138.3 1.0 (0.5) 0.5
School Nurses 66.0 67.0 1.0 0.0 1.0
Classified Technical & Administrative 267.5 281.0 11.0 2.5 13.5
Trades Workers & Foremen 162.5 161.5 0.0 (1.0) (1.0)
Clerical/Secretaries 404.8 409.5 7.5 (2.8) 4.8
School Bookkeepers Handicapped Child Associate/Nurse Associate 277.3 294.3 17.0 0.0 17.0
Educational Assistants 986.5 1,002.2 27.1 (11.3) 15.8
Safety Assistants 247.0 259.0 12.0 0.0 12.0
Social Worker Assistants 35.0 32.7 1.8 (4.0) (2.3)
Building Services Helpers 339.8 357.7 0.0 17.9 17.9
Engineers/Boiler Attendants 240.0 253.5 0.0 13.5 13.5
Food Service Manager /Trainee 102.0 87.2 0.0 (14.8) (14.8)
Food Service Assistant/Asst-in Charge 357.2 369.9 0.0 12.7 12.7
Totals 9,178.1 9,281.7 120.8 (17.2) 103.6
In FY13, there are 9,178.1 staff FTEs in MPS; in FY14, there are 9,281.7 FTEs budgeted. This equates to
103.6 FTE or a 1.0% increase in staff. Schools will increase by 120.8 FTEs, and departments will
decrease by 17.2 FTEs. In comparison, the FY12 Proposed Budget included the reduction of 400.8 FTE
positions.

Superintendent’s FY14 Proposed Budget Overview
FY14 Proposed Budget
If MPS is able to maintain this increase in classroom teachers and educational assistants, it will mean
significant improvement in resources for students. While the increases are modest, they come in the
context of an estimated 3% decline in traditional school enrollment. Other FTE changes of note include:
Teachers increase in schools but decrease in departments; the decrease is caused mainly by the
significant reduction of the Title I School Improvement Grant (SIG). The increase in schools is a
result of an increase in the amount of discretionary funds in school budgets this year;
Educational assistants increased in schools due to an increase in the amount of discretionary
funds in school budgets this year;
Clerical staff for schools increased due to centralization of the positions and as a result of more
discretionary funds in school budgets;
Bookkeepers increased due to the centralization of the position and a restructuring of the duties
and schools serviced by bookkeepers;
Assistant principals for schools increased by 12.6 FTEs, with half of these for K-8 schools. The
increase in schools is a result of an increase in the amount of discretionary funds in school
budgets this year; and
Building service helpers and school engineers increased 30.4 FTEs due to opening buildings
leased to non-instrumentality charter schools.
Budget Development
The development of the current MPS budget begins in the fall of the previous year. Although final
amounts for local, state and categorical funds are often not available until late in the process, the
budget development must allow district administration time to align anticipated resources with goals
and objectives.
For FY14, the Milwaukee Board of School Directors directed the Administration to develop a budget that
uses the district’s maximum revenue limit.
After the schools and departments completed their proposed budgets, the school community and
department staff present their budgets to district review panels. The review panel adjusted the budgets
to ensure that the priorities of the schools and District were addressed within budget limitations.
Summary of Funding Sources
It is important to bear in mind that the district has four funding sources with distinct budgets. These
funding sources in FY13 total $1,194,450,752. In FY14, the MPS Proposed Budget totals
$1,170,867,945. This represents a reduction of $23,582,807, or 2.0% from the FY13 budget.
SCHOOL OPERATIONS FUND FY14 TOTAL $948,345,675
The district’s school operations fund is used for general school and administrative functions and comprises the major portion of the district’s operating revenue and expenditures. $891,804,043
The school nutrition fund is used for the school breakfast and lunch programs, summer food program and child and adult care food programs. $42,824,536

Superintendent’s FY14 Proposed Budget Overview
FY14 Proposed Budget
The debt service fund is used for the payment of general long-term debt principal, interest and related costs. $13,717,096
CONSTRUCTION FUND FY14 $35,370,748 The district’s construction fund is used to fund the repair, remodeling and maintenance of 139 school buildings and 31 support buildings or recreational centers totaling over 17.7 million square feet.
EXTENSION FUND FY14 $22,173,937 The district’s extension fund is used to fund the operation and support of social centers, playgrounds, community recreation and adult education programs for the City of Milwaukee residents.
CATEGORICAL FUNDS FY14 $ 164,977,585 Fiscal resources funded through federal, state and other granting agencies and organizations that are targeted to specific purposes.
The School Operations Fund Budget
MPS receives school operations funds from state, federal and local sources. Since individual amounts
for state equalization aid will not be released by the state until July, the amount of property tax levy
cannot be calculated at this time. Deductions from state aid for the Milwaukee Parental Choice Program
(MPCP) and non-MPS charter schools (2r charters) will also not be known until July 2013.
School Operations Revenues
Description
FY13 Final Adopted Budget
FY14 Proposed
Budget Difference % Difference Property Tax Levy, Equalization and Integration Aids $876,893,622 $885,170,828 $8,277,206 0.9% Deduction for MPCP and 2r Charter Schools (62,547,917) (62,547,917) 0 0.00% Other State Aids 63,574,875 61,174,578 (2,400,297) (3.8%)
Federal Aids 53,912,941 55,293,650 1,380,709 2.6%
Local Non-property Tax Revenues 12,070,216 9,254,536 (2,815,680) (23.3%)
Total School Operations Fund Revenues
$943,903,737 $948,345,675 $4,441,938 0.5%
Superintendent’s FY14 Proposed Budget Overview
FY14 Proposed Budget
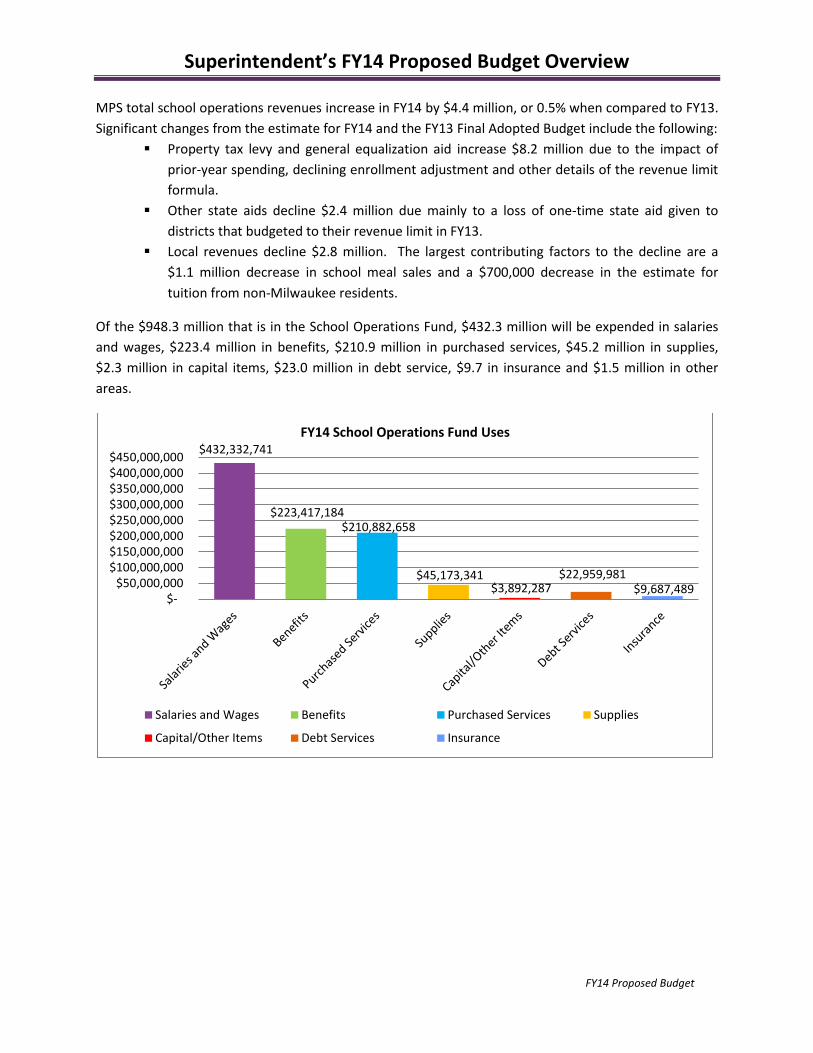
MPS total school operations revenues increase in FY14 by $4.4 million, or 0.5% when compared to FY13.
Significant changes from the estimate for FY14 and the FY13 Final Adopted Budget include the following:
Property tax levy and general equalization aid increase $8.2 million due to the impact of
prior-year spending, declining enrollment adjustment and other details of the revenue limit
formula.
Other state aids decline $2.4 million due mainly to a loss of one-time state aid given to
districts that budgeted to their revenue limit in FY13.
Local revenues decline $2.8 million. The largest contributing factors to the decline are a
$1.1 million decrease in school meal sales and a $700,000 decrease in the estimate for
tuition from non-Milwaukee residents.
Of the $948.3 million that is in the School Operations Fund, $432.3 million will be expended in salaries
and wages, $223.4 million in benefits, $210.9 million in purchased services, $45.2 million in supplies,
$2.3 million in capital items, $23.0 million in debt service, $9.7 in insurance and $1.5 million in other
areas.
$432,332,741
$223,417,184 $210,882,658
$45,173,341 $3,892,287
$22,959,981 $9,687,489
$- $50,000,000
$100,000,000 $150,000,000 $200,000,000 $250,000,000 $300,000,000 $350,000,000 $400,000,000 $450,000,000
FY14 School Operations Fund Uses
Salaries and Wages Benefits Purchased Services Supplies
Capital/Other Items Debt Services Insurance
Superintendent’s FY14 Proposed Budget Overview
FY14 Proposed Budget
School Budgets
School budget preparations begin with the forecast of future year enrollments and district-wide revenue
projections. Once district-wide revenue projections are determined, funds are set aside for the school
nutrition program, non-traditional school allocations, centralized school allocations and other
centralized accounts such as employee fringe benefits, textbooks, utilities and transportation. The
remaining funds are then apportioned to arrive at per pupil allocations for schools, with central
departments’ allocations determined at the end of this review.
School leaders working with their school governance councils then develop and submit budgets for their
schools. After the schools and departments complete their proposed budgets, the school community
and department staff present their budgets to district review panels. The review panels adjusted the
budgets if necessary, to ensure that the priorities of each school and district are addressed within
budget limitations.
School Revenues
Eighty-seven cents of every dollar, or $823 million, budgeted in the School Operations Fund is allocated
for schools and educational programs. Education is provided through MPS traditional and
instrumentality charter schools, open enrollment to other school districts or with other schools with
which MPS has contracted such as partnership or non-instrumentality schools.
MPS traditional and instrumentality charter schools receive 53 cents of every dollar or $505.8
million to educate children.
MPS traditional and instrumentality charter schools receive an additional 20 cents of every
dollar or $187.5 million to support schools and children from other sources. The additional
support includes school nutritional meals, interscholastic athletics, interscholastic academics,
adaptive athletics, school nurses, safety aides, building staff, transportation, educational
maintenance, instrumental music, common school fund, PBIS (Positive Behavioral Intervention
Support), school office support and armored car fees.
MPS also funds other instructional programs that funds 14 cents of every dollar or $129.7
million. These programs are non-instrumentality charter schools; summer sessions; open
enrollment; school-to-work program; allied health; home and hospital instruction; and
partnership, behavioral reassignment, and early childhood schools.
Eight cents of every dollar, or $81.3 million, budgeted has been allocated non-school-based staff and
services.
The remaining five cents of every dollar or $44.1 million are for costs that are necessary to run MPS such
as utilities, insurance, technology licenses or debt repayment.

Superintendent’s FY14 Proposed Budget Overview
FY14 Proposed Budget
Enrollment Changes
In consultation with school leaders and various Central Services departments, the administration uses
demographic data and enrollment trends to develop a system-wide forecast of pupil counts. The
projections were adjusted through the budget development process as a result of program
implementations, expansions and reductions. Enrollment projections for September 2013 (FY14) and
comparisons to actual enrollment for September 2012 (FY13) are below.
FY13 FY14 Projected Projected Projected
Actual Fall Enrollment Enrollment Percent
Schools Enrollment Budget Change Change
Elementary/K-8 48,011 47,205 (806) (1.9%)
Middle 5,198 4,703 (495) (9.5%)
High 18,960 18,006 (954) (5.0%)
SUBTOTAL 72,169 69,914 (2,255) (3.1%)
MPS Alternative Schools/
Partnership Schools/ K-8
Contracted Programs 1,719 1,869 150 8.7%
Non-instrumentality Charters 4,573 5,576 1,003 16.0%
SUBTOTAL 6,292 7,445 1,153 21.9%
Chapter 220 (in suburbs) 1,792 1,572 (220) (12.3%)
Open Enrollment (in suburbs) 6,696 7,179 483 7.2%
SUBTOTAL 8,488 8,751 263 3.1%
GRAND TOTAL 86,949 86,110 (839) (1.0%)
MPS is energized by the opportunity it has at this moment in time, with significant district progress seen
in teacher evaluation, comprehensive curriculum implementation, and refocused district capacity. MPS
is implementing district-wide instructional approaches in math and literacy that provide the necessary
structures for personalization. MPS is engaging more students in the classroom (as seen through
increased attendance and decreased suspensions) and is launching focused turnaround efforts this year
in the district’s lowest achieving schools. These efforts are designed to improve student outcomes and
reverse the enrollment decline.
Average Salary and Benefits
Schools budget their staff positions using the average salary for each type of position. For FY14, the
average teacher salary is projected to be $60,300, while in FY13 the average teacher salary is $62,800.
The school operations and categorical benefit rate is projected to be 58.4% for FY14, compared to the
FY13 benefit rate of 66.2%, and an FY12 rate of 69.9%.

Superintendent’s FY14 Proposed Budget Overview
FY14 Proposed Budget
Department Changes
Offices and departments within MPS serve, guide and provide resources to our parents, students,
teachers, school leaders, staff and the community. The district Central Services consists of offices which
contain departments performing supportive activities that are used district-wide. Duties preformed
include such things as: maintaining high academic standards, providing safety personnel in every school,
hiring teachers, providing snow removal, furnishing healthy student lunches and ensuring financial
integrity.
The FY14 department allocation in the School Operations Fund is $88.4 million. This is a reduction from
FY13 of $1.9 million. This decrease reflects the ongoing commitment to prioritize resources for our
schools and our classrooms. The FY14 Proposed Budget shows the continued focus on creating a
standard of care that ensures every child has all of the experiences that produce a great education.
Office
FY13 Final Adopted Budget
FY14 Proposed
Budget Difference Office of Board Governance $2,588,455 $2,512,573 ($75,882)
Accountability & Efficiency $1,386,217 $1,343,466 ($42,751)
Superintendent of Schools $9,943,891 $10,550,714 $606,823
Academics $19,465,506 $18,671,113 ($794,393)
School Administration $2,803,683 $2,179,253 ($624,430)
Innovation $819,455 $1,426,298 $606,843
Human Capital Services $5,494,048 $5,067,327 ($426,721)
Finance $5,386,648 $5,513,137 $126,489 Operations $42,500,511 $41,102,739 ($1,397,772)
Total $90,388,414 $88,366,620 ($2,021,794)
In FY14, departments will be reorganized to better align their functions with organizational reporting
and to increase efficiency and cost effectiveness. Major changes include:
Family and Student Services and Organizational Development are reported under the
Superintendent. Organizational Development, which launched in FY13, will support systems
change management and alignment of District initiatives. This will maximize the efficient
delivery of quality instruction to increase student achievement. In FY14 staff and resources
will come from various departments.
o Professional development resources and staff are moved from Academics to
Organizational Development.
o Teacher Evaluation and Mentoring (TEAM), induction support and educator
effectiveness initiatives are moved from Human Capital Services and School
Administration to Organizational Development.
Health and Wellness staff is transferred from Recreation to Academics supporting
curriculum alignment across all subject areas.

Superintendent’s FY14 Proposed Budget Overview
FY14 Proposed Budget
School Administration expands to include the District School Improvement supervisors
formerly reporting to the Superintendent, thereby improving alignment of school support
and accountability efforts.
Contracted School Services from School Administration and research staff from Academics
have been transferred to Innovation. New positions have been added in Innovation to
promote and foster innovative educational programs and practices designed to accelerate
student achievement.
Benefits and Insurance within the Human Capital Services has separated into two
departments in FY14. Benefits and Compensation Services remain in Human Capital
Services while Insurance and Risk Management will join Finance. An attorney position from
Operations is also transferred to Finance to support contract compliance.
Budget Services within Finance also gains Title I compliance staff from Family and Student
Services to improve coordination and accountability of Title I services.
School bookkeeping services will be coordinated by Finance to improve cash handling and
reporting in schools at the request of school leaders.
Other Changes
FY14 continues the process for traditional and instrumentality charter schools in moving some costs to a
more centralized control process, thereby allowing school leaders to spend more time on instructional
leadership. In the FY14 budget, the following additional costs will be centralized:
All school administrators’ and secretaries’ wages;
School bookkeeping costs; and
An additional 0.2 FTE to meet a new 0.4 FTE minimum of a music, art, physical education
teacher and/or librarian for every school.
Centralizing these areas reduces the per pupil allocation for each school and changes the school level
per pupil weighting factors. These changes decrease the likelihood that individual schools will incur
costs which are beyond their control and continue to build a standard of care for every school.
Superintendent’s FY14 Proposed Budget Overview
FY14 Proposed Budget
The Construction Fund Budget
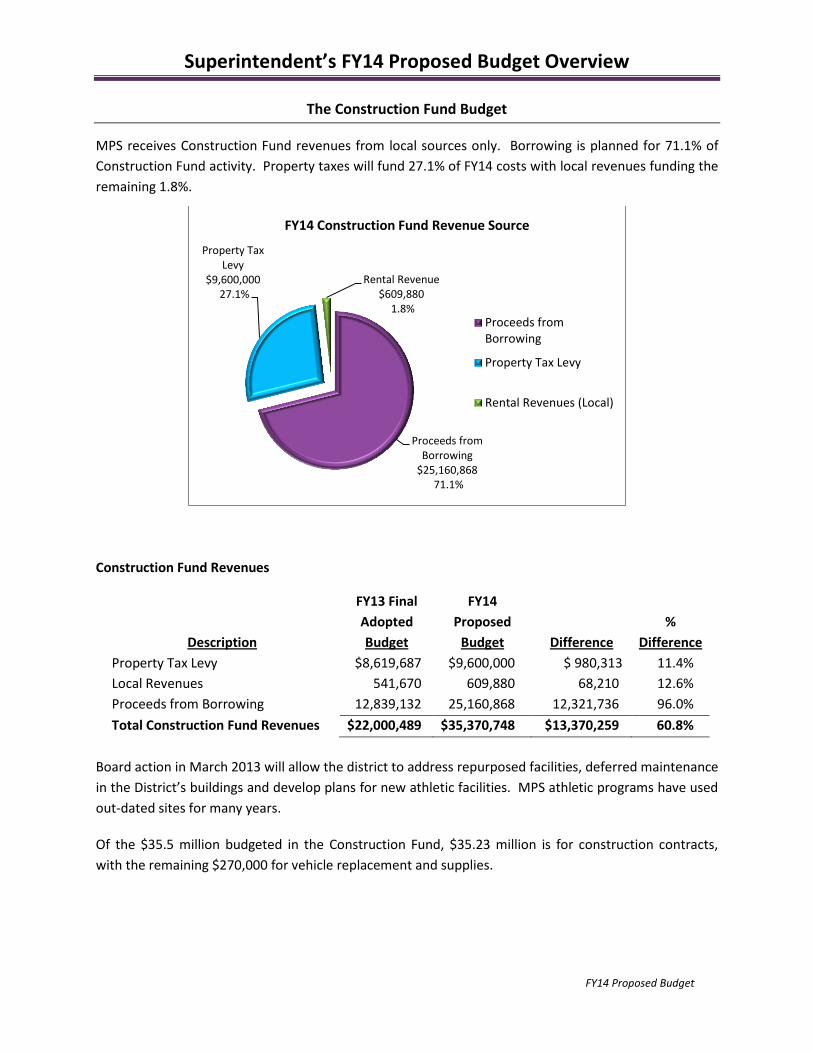
MPS receives Construction Fund revenues from local sources only. Borrowing is planned for 71.1% of
Construction Fund activity. Property taxes will fund 27.1% of FY14 costs with local revenues funding the
remaining 1.8%.
Construction Fund Revenues
Description
FY13 Final
Adopted
Budget
FY14
Proposed
Budget Difference
%
Difference
Property Tax Levy $8,619,687 $9,600,000 $ 980,313 11.4%
Local Revenues 541,670 609,880 68,210 12.6%
Proceeds from Borrowing 12,839,132 25,160,868 12,321,736 96.0%
Total Construction Fund Revenues $22,000,489 $35,370,748 $13,370,259 60.8%
Board action in March 2013 will allow the district to address repurposed facilities, deferred maintenance
in the District’s buildings and develop plans for new athletic facilities. MPS athletic programs have used
out-dated sites for many years.
Of the $35.5 million budgeted in the Construction Fund, $35.23 million is for construction contracts,
with the remaining $270,000 for vehicle replacement and supplies.
Proceeds from Borrowing
$25,160,868 71.1%
Property Tax Levy
$9,600,000 27.1%
Rental Revenue $609,880
1.8%
FY14 Construction Fund Revenue Source
Proceeds fromBorrowing
Property Tax Levy
Rental Revenues (Local)

Superintendent’s FY14 Proposed Budget Overview
FY14 Proposed Budget
The Extension Fund Budget
MPS receives Extension Fund revenues from property tax levy and local sources. Property taxes will
fund 77.1% of the extension fund; participation, miscellaneous fees and rent will fund 9.0%. The
remaining 13.9% of the funding will come from the District Extension Fund balance.
The Extension Fund revenues for FY14 will decrease by $1.8 million from FY13.
Extension Fund Revenues
Description
FY13 Final Adopted Budget
FY14 Proposed
Budget Difference Percent
Difference Property Tax Levy $17,065,871 $17,100,00 $34,129 0.2%
Local Revenues 2,000,000 2,003,937 3,937 0.2%
Applied Surplus (Fund Balance) 4,925,111 3,070,000 (1,855,111) (37.7%)
Total Extension Fund Revenues $23,990,982 $22,173,937 ($1,817,045) (7.6%)
Significant FY14 changes in the Extension Fund include:
transfer of safety costs to the School Operations Fund (decrease of $2.9 million);
funding the biennual Music Festival available to all City of Milwaukee children during even years
(increase of $0.2 million);
benefit cost increases (increase of $0.3 million); and
use of applied surplus (decrease of $1.9 million).
Property Tax Levy $17,100,000
77.1%
Applied Surplus $3,070,000
13.9%
Local Revenue $2,003,937
9.0%
FY14 Extension Fund Revenues
Property Tax Levy
Applied Surplus
Local Revenue

Superintendent’s FY14 Proposed Budget Overview
FY14 Proposed Budget
Of the $22.1 million budgeted in the Extension Fund, $9.6 million will be spent on salaries and wages,
$3.5 million on benefits, $8.1 million on purchased services, $0.6 million on supplies, $0.03 million on
capital items and $0.3 million on insurance.
The Categorical Budgets
MPS uses the term “categorical” funding to refer to grant resources. The term categorical and grants are
used interchangeably. Most grants the district receives are awarded for specific purposes. Continued
funding is frequently tied to the ability of the district to meet quantifiable outcomes defined by the
granting agency. MPS receives categorical funding from federal, state, and private grants. Federal
grants comprise 81.9% of categorical funds, state grants account for 14.9% and private grants account
for the remaining 3.2%.
$9,629,820
$3,561,470
$8,101,839
$567,291 $30,000 $283,517
$-
$2,000,000
$4,000,000
$6,000,000
$8,000,000
$10,000,000
$12,000,000
Salaries andWages
Benefits PurchasedServices
Supplies Capital Items Insurance
FY14 Extension Fund Uses
Salaries and Wages Benefits Purchased Services Supplies Capital Items Insurance
Federal Funding $135,154,039
81.9%
State Funding $24,660,009
14.9%
Private Funding $5,163,537
3.2%
FY 14 Categorical Fund Revenue Source*
Federal Funding
State Funding
Private Funding
*Excludes Indirect Revenues

Superintendent’s FY14 Proposed Budget Overview
FY14 Proposed Budget
A significant portion of the $42.4 million reduction in grant funding for FY14 results from of the loss of the Federal School Improvement Grant (SIG), reduction in Head Start funding and a cut in federal revenue due to anticipated sequestration.
Description
FY13 Final Adopted Budget
FY14 Proposed Budget Difference
Percent Difference
Federal Grants $179,841,282 $141,577,569 ($38,263,713) (21.3%) State Grants 26,673,718 24,680,893 (1,992,825) (7.4%) Private Grants 7,433,728 5,196,655 (2,237,073) (30.0%)
Total Categorical Funds $213,948,728
$171,455,117 ($42,493,611) (19.9%)
Less Indirect Costs* (9,393,184) (6,477,532) 2,915,652 (31.0%)
Revised Totals $204,555,544 $164,977,585 ($39,577,959) (19.3%)
*Indirect costs are a transfer to school operations
The following grants have decreases greater than $250,000 from FY13 to FY14:
Grants Ending
Federal Reductions Smaller Learning Communities $ 590,297 Fruits and Vegetables ` 494,650
Grant Allocation Change
Federal Reductions Title I including School Improvement $27,799,148 Title II 3,537,296 Title III 637,124 Safe and Support Schools 573,554 IDEA 1,710,877 Carl Perkins 418,101 Advanced Placement #2 457,795 21st Century Community Learning Centers 468,495 Child Care W-2 Funds 348,247 Head Start $624,471
State SAGE 1,977,475
Other GE Foundation-Developing Futures 2,500,000
Of the $171.4 million that is in the Categorical Fund in FY14, $74.8 million will be expended on salaries
and wages, $43.3 million on benefits, $39.7 million on purchased services, $6.9 million on supplies, $0.2
on capital expenses and $0.09 million on other expenses. $6.4 million will be transferred to the School
Operations Fund for indirect expenses related to grant activities.

Superintendent’s FY14 Proposed Budget Overview
FY14 Proposed Budget
Types of Schools and Programs at MPS
MPS offers various types of educational programs and delivery models within the District. Programs
include Montessori, bilingual, creative arts, language immersion, STEM (science, technology, engineering
and math), environmental studies, career and technical, at-risk, gifted and talented and International
Baccalaureate. Educational programs are delivered under the MPS umbrella by traditional schools;
charter schools; partnership and alternative schools; collaboration with the justice system; and in-home
or hospital services.
Centrally Allocated Funds $272,754,306 FY14 continues the process for traditional and instrumentality charter schools of moving some costs to
more centralized control. This will allow school leaders to spend more time on instructional leadership.
In the FY14 budget, the following costs and targeted support will be centralized:
Central Art, Music , Physical Education and Librarians -- $16,690,874
Central Guidance Positions -- $6,886,660
Central School Office Staff -- $32,459,977
Supplemental School Support -- $2,000,000
Educational Maintenance -- $2,554,219
Grant Transitional -- $3,581,821
School Nurses -- $2,539,695
School Office Support (Bookkeeping) -- $2,364,663
School Safety Operations -- $11,942,762
School Special Services -- $185,136,684
Substitute Costs -- $6,596,951
$74,816,562
$43,329,112
$39,686,853
$6,855,058
$200,000 $90,000 $-
$10,000,000
$20,000,000
$30,000,000
$40,000,000
$50,000,000
$60,000,000
$70,000,000
$80,000,000
Salaries andWages
Benefits PurchasedServices
Supplies CapitalExpenses
Other
FY14 Categorical Fund Source Uses
Salaries and Wages Benefits Purchased Services Supplies Capital Expenses Other
Traditional & Instrumentality Charter Schools $290,199,352
Superintendent’s FY14 Proposed Budget Overview
FY14 Proposed Budget
Non-Instrumentality Charter Schools $44,617,148 Non-instrumentality charter schools operate their own facilities or lease from MPS and do not employ
MPS staff. By Administrative policy, non-instrumentality charters receive the same per pupil funding
amount that the state determines for charters contracting through the University of Wisconsin-
Milwaukee (UWM), Milwaukee Area Technical College (MATC) and the City of Milwaukee. Funding
includes a per pupil amount equal to the per pupil amount allocated for other MPS schools with an
additional lump sum for non-instructional support. The total amount of instructional and non-
instructional support for FY14 is $7,775 per pupil. Other funding is contingent upon various contractual
provisions. MPS Administration expects to continue to make adjustments in per pupil funding for
individual schools based on actual fall enrollments and information from the state.
MPS Alternative Schools & Programs $11,226,531 Funding for MPS alternative programs varies by program. Alternative schools focus on students who are
at-risk, such as those who are behind in credits, display behavioral problems, are pregnant or parenting,
have learning disabilities, are homeless or have other learning obstacles. Given the variability of
enrollments in many of these programs throughout the year, allocations do not use a per pupil format.
Nevertheless, as seen in the school allocation worksheet (page N-37), an estimated enrollment is shown
for most programs. The allocations are:
Project STAY -- $1,500,000
Transition High School -- $2,150,000
Groppi -- $1,695,300
Milwaukee County Collaborative -- $1,043,804
Pregnant and Parenting Youth -- $833,557
Home and Hospital -- $929,304
School-to-Work Transition -- $3,074,566
Partnership Alternative Schools & Programs
$17,553,374 Partnership schools are operated by external agencies that contract with MPS under the provision of
Section 118.153, the Wisconsin Children At-Risk Act. These schools also receive special education staff
and services allocation of $6,453,232.
Partnership Schools -- $5,688,837
Behavioral Reassignment -- $6,324,436
Project Direct Graduation/GED02 -- $2,200,500
Special Education Programs -- $3,339,601
Contracted Kindergarten Programs
$161,050 Contract for this program is funded at the projected per pupil amount of $6,442, the same amount
funded through the Milwaukee Parental Choice Program. The program was established in 1988, when
the district did not have the capacity to serve all early childhood students seeking seats, a condition that
no longer exists. Only one program remains with 25 FTEs in FY14.

Superintendent’s FY14 Proposed Budget Overview
FY14 Proposed Budget
Other Centrally Allocated Funds $61,181,151 Other centrally allocated funds support a variety of programs and services that support schools and
students. The largest portion of the budget funds open enrollment payments of $46.96 million to other
districts.
Allied Health -- $5,508,459
Common School Fund Central Account -- $1,780,231
Positive Behavioral Intervention and Support (PBIS) -- $415,560
Open Enrollment -- $46,961,781
School Special Funds -- $1,699,633
Summer School -- $3,417,869
Career & Technical Education Support -- $1,397,618
Conclusion Our budget says a lot about what we value. Our most recent budgets focused on one key effort,
investing as many resources as possible to students and their classrooms. I am proud the FY14 budget
sharpens that focus as we continue to move forward together in a spirit of collaboration to create more
ways to improve student achievement.
Despite the continued budget challenges of the district, MPS continues to work hard in the areas of
increased student achievement; effective and efficient operations; and meaningful family, student and
community engagement.
We hoped to enhance our hard work around a standard of care for all students and further reduce class
size. However, the proposed state budget with no per pupil funding increase and a likely further
reduction in the reimbursement rate for students with disabilities will challenge our ability to achieve
our goals at the level we desire and our children deserve. We will continue to advocate on behalf of our
children and are committed to finding ways to reduce class size, as this is a key element in improving
student achievement.
Children, parents and taxpayers deserve publicly-funded schools that are willing to educate all and are
willing to face public accountability. This budget continues the MPS commitment to further its
accountability to students, parents and taxpayers.
Students and their classrooms remain the number one priority. Continuous implementation of rigorous
literacy, math/science and Response to Intervention plans will allow the district to stay the course and
build on efforts to improve learning. The district continues to implement strategies identified in the
Facilities Master Plan to increase efficiency of building use across the district and will plan and develop
two new athletic facilities in FY14. This plan, combined with the centralization of a number of functions
previously charged to the schools, will promote and support greater efficiencies in the coming years.