superintendent’s 2015-16 operating budget recommendation
TRANSCRIPT
April 14, 2015
Superintendent’s 2015-16 Operating Budget Recommendation
Board of Education

We also have a roadmap. Strategic Plan 2018: For a Better Tomorrow sets six strategic goals.
Charlotte-Mecklenburg Schools has a clear mission: to maximize academic achievement for every child in every school.
2

Goal 1 – our top priority
Maximize academic achievement in a personalized 21st-century learning environment for every child to graduate college- and career-ready.
3
The other five goals support Goal 1. Goal 2 Recruit, develop, retain and reward a premier workforce Goal 3 Cultivate partnerships with families, businesses, faith-based groups and community organizations Goal 4 Promote a system-wide culture of safety, high engagement, cultural competency and customer service Goal 5 Optimize district performance and accountability Goal 6 Inspire and nurture learning, creativity, innovation and entrepreneurship
4
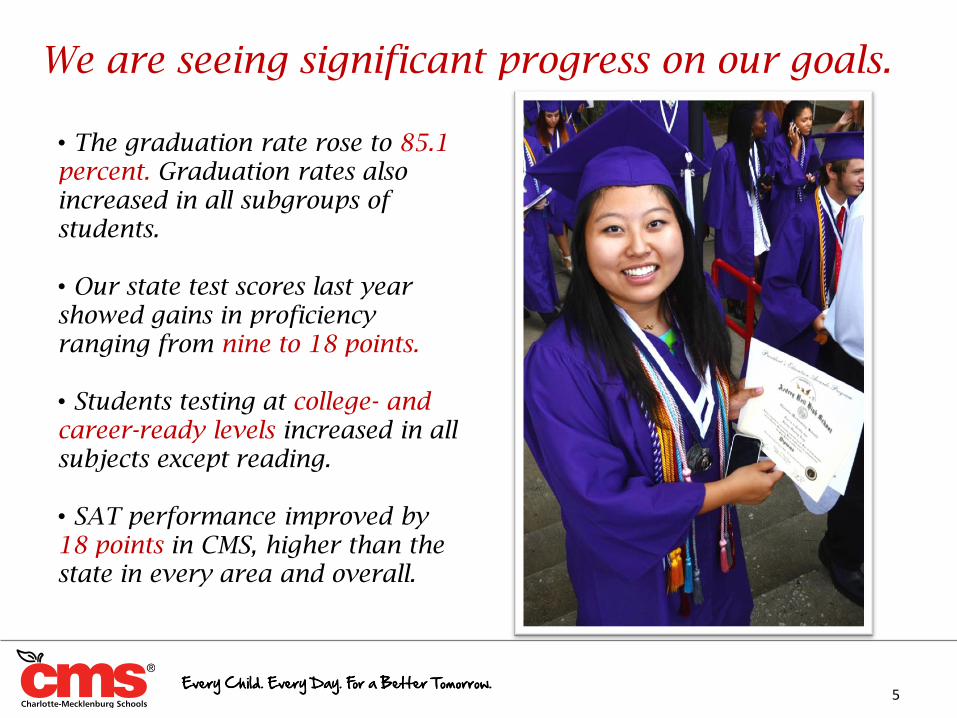
We are seeing significant progress on our goals.
• The graduation rate rose to 85.1 percent. Graduation rates also increased in all subgroups of students. • Our state test scores last year showed gains in proficiency ranging from nine to 18 points. • Students testing at college- and career-ready levels increased in all subjects except reading. • SAT performance improved by 18 points in CMS, higher than the state in every area and overall.
5

Our budget proposal is a statement of our priorities – what we believe will best help us increase student academic achievement next year.
6

How did we identify these priorities?
Our budget development process included input from various stakeholders.
• Community engagement sessions • Budget sessions with the Charlotte-
Mecklenburg Board of Education • Student engagement • Input from superintendent’s advisory
councils • Input from district senior leadership
7

1. Continue and expand literacy supports.
2. Recruit and retain top-quality employees with competitive salaries.
3. Continue and expand student support services.
Here’s why we think they are a wise investment that will benefit our students.
Three priorities for next year
8
1. Continue and expand literacy supports.
We will continue to work toward having every child reading on grade level by the end of third grade. But we must also address the needs of middle and high school students so that every student becomes a better reader every year.
9

Academic achievement is our top strategic goal. Our top priority is literacy.
10

Literacy components
Reading Writing
Speaking
Listening
11

Improving literacy means that every student becomes a better reader every year.
1. Continue and expand literacy supports
• Maintain existing teacher assistant positions
• Targeted professional development for secondary teachers
• Expand state-funded summer reading camp for rising 4th graders to rising 3rd graders
12

100
Percentage of
employees responsible for
helping students succeed
42
*National ranking of NC
average teacher salaries
0
Number of
neighboring states with
average teacher pay
lower than NC
13
2. Recruit and retain top-quality employees with more competitive salaries
In 2008, North Carolina was ranked 25th in average teacher salary.
*Source: National Education Association Research, 2014-15 Estimated Average Annual Salaries of Classroom Teachers
14
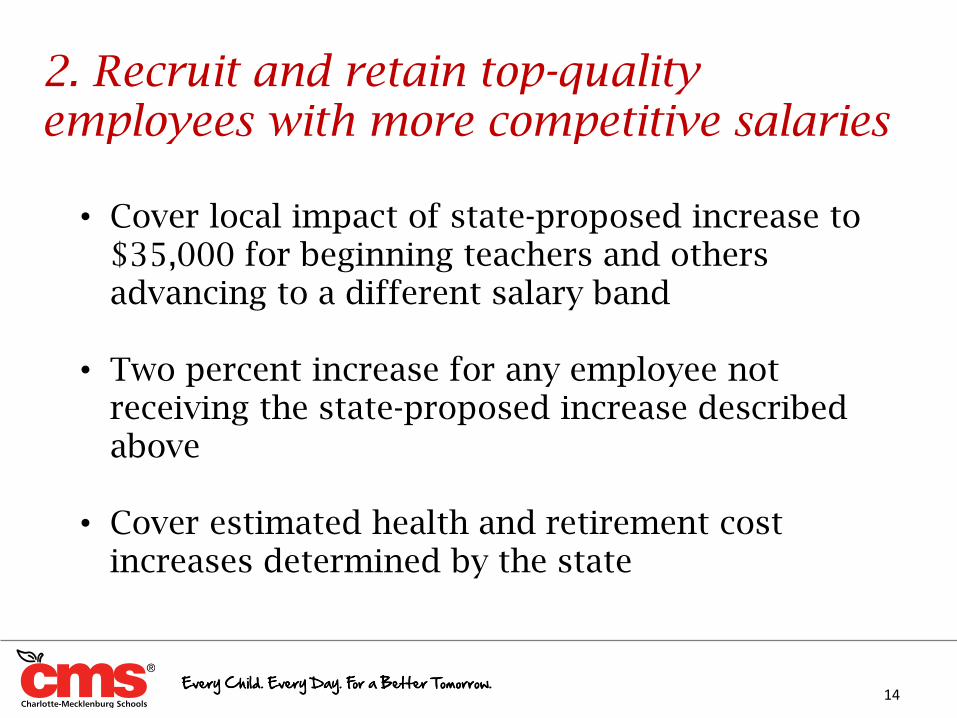
2. Recruit and retain top-quality employees with more competitive salaries
• Cover local impact of state-proposed increase to $35,000 for beginning teachers and others advancing to a different salary band
• Two percent increase for any employee not receiving the state-proposed increase described above
• Cover estimated health and retirement cost increases determined by the state

July 2008 Sample employee salary $ 35,000
July 2009 2009-10 Increase in health benefit cost* $ (523)
July 2010 2010-11 Increase in health benefit cost* $ (569)
July 2011 2011-12 Increase in health benefit cost* $ (628)
July 2012 2012-13 Salary increase – 3% state/local $ 1,050
2012-13 Increase in health benefit cost* $ (401)
January 2014 2013-14 Increase in health benefit cost* $ (765)
July 2014 2014-15 Salary Increase - state $ 500
Sample employee net salary $ 33,664
Net decrease in salary since 2008 $ (1,336)
% decrease in salary since 2008 (3.8%)
15
* Fixed amount per employee; not salary dependent; assumes family coverage
An example: How benefits costs have affected employee salaries since 2008
Not adjusted for inflation or increases in deductibles, coinsurance, housing, food, gas and other living expenses

3. Continue and expand support services
We launched a four-year plan in 2014-2015 to improve the social and emotional health of our students and the overall safety of our schools. The second year of this expansion would add 34 school counselors, three psychologists and three social workers.
16
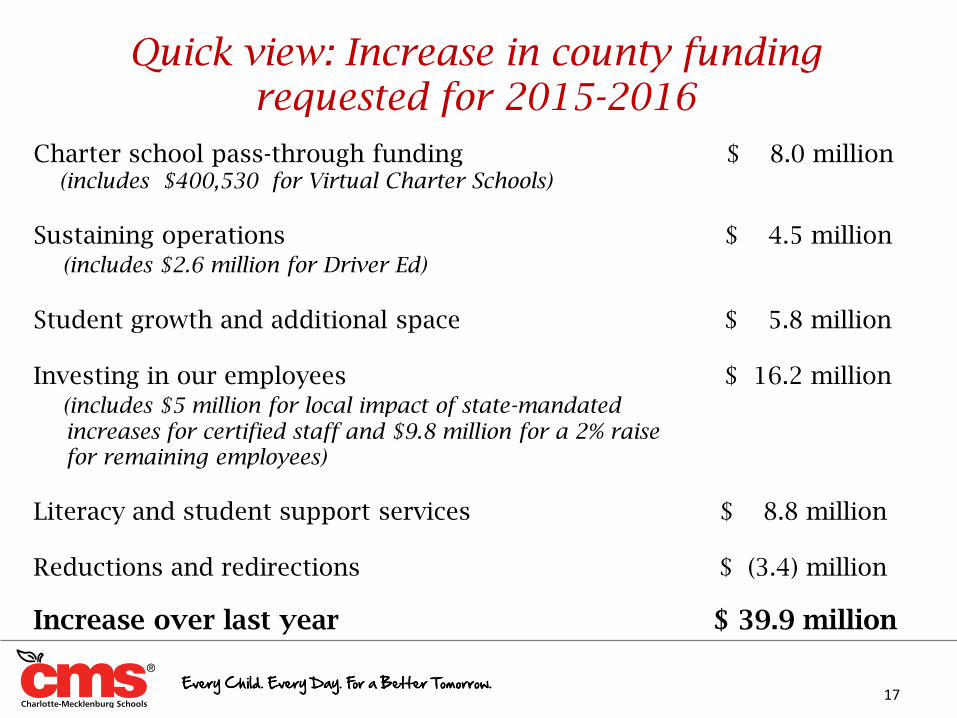
Quick view: Increase in county funding requested for 2015-2016
Charter school pass-through funding $ 8.0 million (includes $400,530 for Virtual Charter Schools)
Sustaining operations $ 4.5 million (includes $2.6 million for Driver Ed)
Student growth and additional space $ 5.8 million
Investing in our employees $ 16.2 million (includes $5 million for local impact of state-mandated
increases for certified staff and $9.8 million for a 2% raise for remaining employees)
Literacy and student support services $ 8.8 million
Reductions and redirections $ (3.4) million
Increase over last year $ 39.9 million
17

2015-2016 Total Operating Budget (all funding sources)
18
REVENUES
State of North Carolina
$773,040,553 $749,327,262 3.2%
Mecklenburg County $428,129,792 $388,236,594 10.3%
Federal and other grants $148,547,778 $153,673,260 (3.3)%
Other and special revenues
$19,397,730 $20,658,033 (6.1)%
TOTAL REVENUES
$1,369,115,853 $1,311,895,149 4.4%
2015-2016
proposed
budget
2014-2015
adopted
budget
Percentage
of change

Putting it all together: Some context for the budget
How does Charlotte-Mecklenburg Schools compare with others on per-pupil spending? How has the ratio of our funding changed in recent years? What are the trends in employee benefits costs and how does that affect the budget?
19

Per-pupil expenditure ranking North Carolina ranked 46th
State Rank Per pupil
State Rank Per pupil
Vermont 1 $23,149 Nevada 42 $8,956 New York 2 $21,366 Idaho 43 $8,928 New Jersey 3 $20,925 Alabama 44 $8,797 Alaska 4 $20,117 Mississippi 45 $8,779 Rhode Island 5 $19,676 North Carolina 46 $8,620 Connecticut 6 $17,759 North Dakota 47 $8,518 New Hampshire 7 $17,115 Indiana 48 $8,034 Massachusetts 8 $16,678 Oklahoma 49 $7,977 Wyoming 9 $16,127 Utah 50 $7,711 Delaware 10 $15,858 Arizona 51 $7,461 National average = $11,732 Source: National Education Association Research, Estimated Expenditures for Public Schools 2014-15
20

CMS spends less per pupil than many comparison districts (*ERS data adjusted for geographic differences and inflation)
Denver, Colorado $11,900
Duval County, Florida $10,100
Fulton County, Georgia $10,000
Austin, Texas $ 9,900
Knoxville, Tennessee $ 9,000
Lake County, Florida $ 8,800
CMS $ 8,400
Aldine, Texas $ 7,600
Notes: Dollars represent PK-12 operating budget/expenditure for year studied. Dollars adjusted for geography using the National Center for Education Statistics 2005 School District Comparative Wage Index. Dollars adjusted to 2013-14 (inflation adjusted) using the Bureau of Labor Statistics CPI calculator *Source: Education Resource Strategies’ FY 13-14 Merged Financial File; ERS comparison database
21
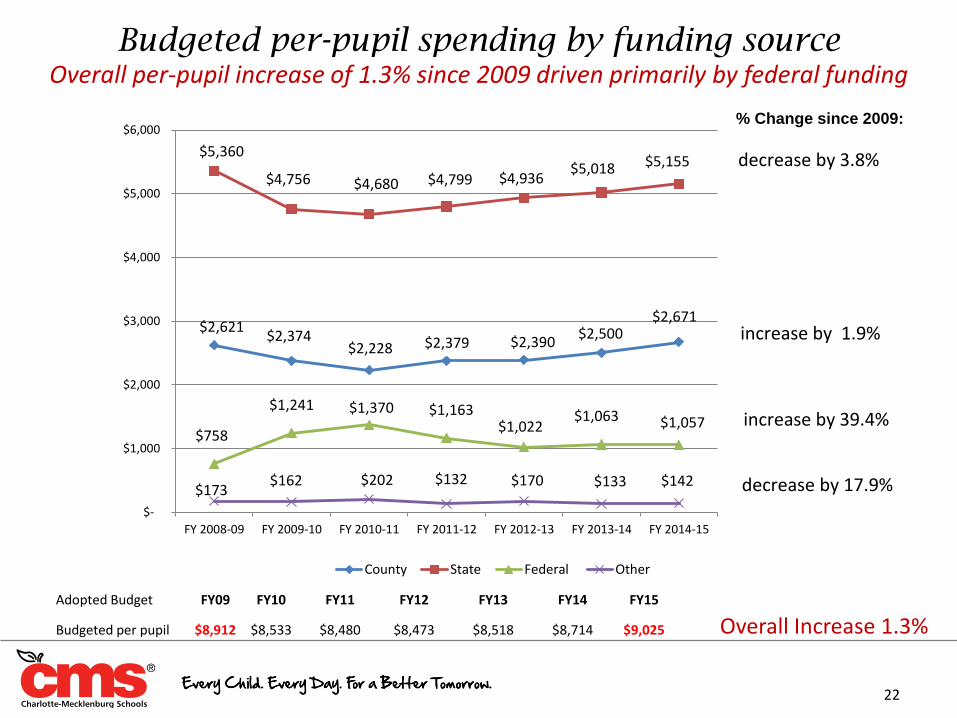
Budgeted per-pupil spending by funding source Overall per-pupil increase of 1.3% since 2009 driven primarily by federal funding
22
% Change since 2009:
Adopted Budget FY09 FY10 FY11 FY12 FY13 FY14 FY15
Budgeted per pupil $8,912 $8,533 $8,480 $8,473 $8,518 $8,714 $9,025
$2,621 $2,374
$2,228 $2,379 $2,390 $2,500
$2,671
$5,360
$4,756 $4,680 $4,799 $4,936 $5,018 $5,155
$758
$1,241 $1,370 $1,163 $1,022
$1,063 $1,057
$173 $162 $202 $132 $170 $133 $142
$-
$1,000
$2,000
$3,000
$4,000
$5,000
$6,000
FY 2008-09 FY 2009-10 FY 2010-11 FY 2011-12 FY 2012-13 FY 2013-14 FY 2014-15
County State Federal Other
decrease by 3.8%
increase by 1.9%
increase by 39.4%
decrease by 17.9%
Overall Increase 1.3%

CMS’ per-pupil funding from the county is effectively $57 lower now than in FY09
CMS does not retain all funding received from the County - $30 million goes to charter schools which reduces the funding to support CMS students
23
$2,621
$2,374
$2,228
$2,379 $2,390
$2,500
$2,671
$2,524
$2,277
$2,119
$2,256 $2,247
$2,339
$2,467
$2,000
$2,050
$2,100
$2,150
$2,200
$2,250
$2,300
$2,350
$2,400
$2,450
$2,500
$2,550
$2,600
$2,650
$2,700
$2,750
FY 2008-09 FY 2009-10 FY 2010-11 FY 2011-12 FY 2012-13 FY 2013-14 FY 2014-15
"Computed" County Per Pupil Funding (including charter pass-through funding)
"Real" County Per Pupil Funding for CMS Students (without charter pass-through funding)
CMS' per-pupil funding is reduced by the charter school pass-through
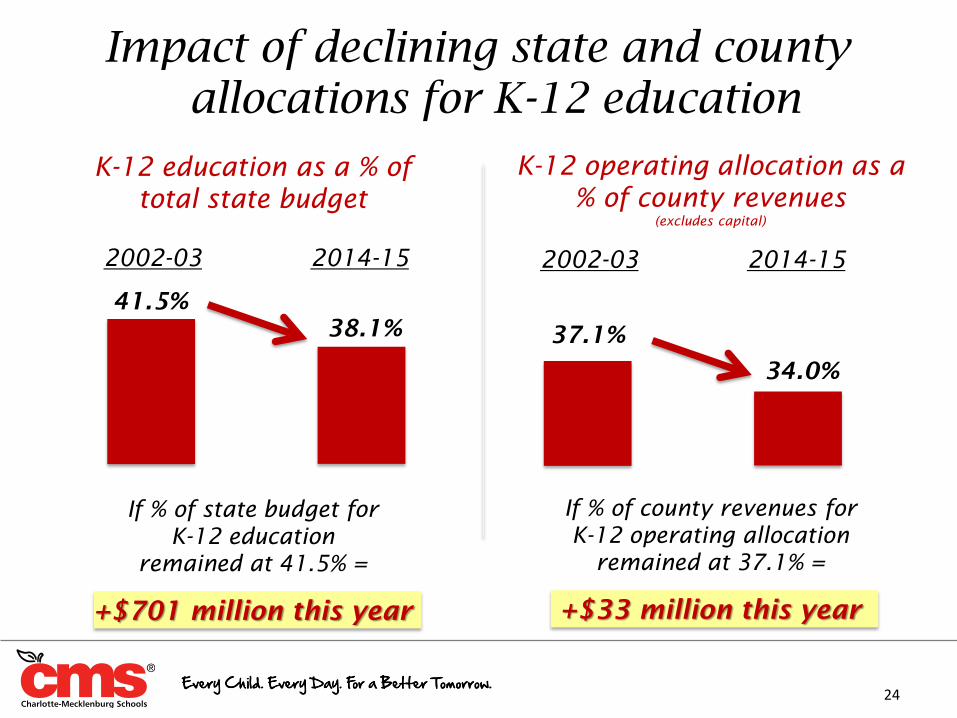
K-12 operating allocation as a
% of county revenues (excludes capital)
If % of county revenues for
K-12 operating allocation
remained at 37.1% =
+$33 million this year
K-12 education as a % of
total state budget
If % of state budget for
K-12 education
remained at 41.5% =
+$701 million this year
Impact of declining state and county allocations for K-12 education
24
2002-03 2014-15
41.5%
38.1%
2002-03 2014-15
37.1%
34.0%

Employer benefits costs have increased 55% since 2009
Health and retirement costs (+$74 million) account for more than 63% of the overall budget increase since 2009
25
135,652,614 140,460,070
155,738,931
176,238,488
191,642,561
196,365,838
209,690,715
120,000,000
140,000,000
160,000,000
180,000,000
200,000,000
220,000,000
08-09 09-10 10-11 11-12 12-13 13-14 14-15

2015-16 Total Proposed Budget
REVENUES
Proposed Budget % of Total
State of North Carolina 773,040,553$ 56.5%
Mecklenburg County 428,129,792 31.3%
Federal and Other Grants 148,547,778 10.8%
Other and Special Revenue 19,397,730 1.4%
TOTAL OPERATING BUDGET 1,369,115,853$ 100%
Capital Replacement 10,000,000
Child Nutrition Program 68,958,721
After School Enrichment Program 13,771,819
TOTAL PROPOSED BUDGET 1,461,846,393$
26

April 16 6:00-7:30 p.m.
Community meeting on Superintendent’s Budget Recommendation
Hopewell HS
April 27 & May 4 6:00-7:30 p.m.
Community meetings on Superintendent’s Budget Recommendation
Vance HS JM Robinson MS
April 28 6:00 p.m.
Public hearing on Superintendent’s Budget Recommendation BOE Meeting
May 5 3:30-5:30 p.m.
Board of Education budget work session
CMGC, Rooms 527/528
May 12 6:00 p.m.
Board of Education approval of 2015-16 Budget Request BOE meeting
May 15 Board of Education’s 2015-16 Budget Request submitted to the county
May 19 12:00 p.m.
Board of Education/Board of County Commissioners workshop on budget
CMGC, Room 267
May 28 11:30 a.m.
County Manager’s Recommended Operating and Capital Budgets presented to BOCC
CMGC Meeting Chamber
June 10 6:00 p.m.
Public hearing on county’s budget CMGC Meeting Chamber
June 16 6:00 p.m.
County adopts 2015-16 Operating Budget CMGC Meeting Chamber
July-Sept. 2015-16 Operating Budget finalized and approved by BOE BOE meeting
Date Activity Location
What’s Next - Key Dates
27
Superintendent’s Closing Comments
28

29