the sr-71 test bed aircraft: for high-speed flight research
TRANSCRIPT

The SR-71 Test Bed Aircraft:
A Facility for High-Speed Flight Research
Stephen Corda, Timothy R. Moes, Masashi Mizukami,
Neal E. Hass, Daniel Jones, Richard C. Monaghan,
Ronald J. Ray, Michele L. Jarvis, and Nathan Palumbo
NASA Dryden Flight Research Center
Edwards, California
June 2000

The NASA STI Program Office...in Profile
Since its founding, NASA has been dedicated
to the advancement of aeronautics and spacescience. The NASA Scientific and Technical
Information (STI) Program Office plays a key
part in helping NASA maintain this
important role.
The NASA STI Program Office is operated by
Langley Research Center, the lead center forNASA's scientific and technical information.
The NASA STI Program Office provides access
to the NASA STI Database, the largest collection
of aeronautical and space science STI in the
world. The Program Office is also NASA's
institutional mechanism for disseminating the
results of its research and development activities.
These results are published by NASA in the
NASA STI Report Series, which includes the
following report types:
TECHNICAL PUBLICATION. Reports of
completed research or a major significant
phase of research that present the results of
NASA programs and include extensive data
or theoretical analysis. Includes compilations
of significant scientific and technical data
and information deemed to be of continuing
reference value. NASA's counterpart of
peer-reviewed formal professional papers but
has less stringent limitations on manuscript
length and extent of graphic presentations.
TECHNICAL MEMORANDUM. Scientific
and technical findings that are preliminary or
of specialized interest, e.g., quick release
reports, working papers, and bibliographiesthat contain minimal annotation. Does not
contain extensive analysis.
CONTRACTOR REPORT. Scientific and
technical findings by NASA-sponsored
contractors and grantees.
CONFERENCE PUBLICATION.
Collected papers from scientific and
technical conferences, symposia, seminars,
or other meetings sponsored or cosponsored
by NASA.
SPECIAL PUBLICATION. Scientific,
technical, or historical information from
NASA programs, projects, and mission,
often concerned with subjects having
substantial public interest.
TECHNICAL TRANSLATION. English-
language translations of foreign scientific
and technical material pertinent toNASA's mission.
Specialized services that complement the STI
Program Office's diverse offerings include
creating custom thesauri, building customized
databases, organizing and publishing research
results...even providing videos.
For more information about the NASA STI
Program Office, see the following:
• Access the NASA STI Program Home Pageat http://www.sti.nasa.gov
• E-mail your question via the Internet to
help@ sti.nasa.gov
• Fax your question to the NASA Access HelpDesk at (301) 621-0134
• Telephone the NASA Access Help Desk at(301) 621-0390
Write to:
NASA Access Help Desk
NASA Center for AeroSpace Information7121 Standard Drive
Hanover, MD 21076-1320

NASA/TP-2000-209023
The SR-71 Test Bed Aircraft:
A Facility for High-Speed Flight Research
Stephen Corda, Timothy R. Moes, Masashi Mizukami,
Neal E. Hass, Daniel Jones, Richard C. Monaghan,Ronald J. Ray, Michele L. Jarvis, and Nathan Palumbo
NASA Dryden Flight Research Center
Edwards, California
National Aeronautics and
Space Administration
Dryden Flight Research CenterEdwards, California 93523-0273
June 2000

NOTICEUse of trade names or names of manufacturers in this document does not constitute an official endorsement
of such products or manufacturers, either expressed or implied, by the National Aeronautics and
Space Administration.
Available from the following:
NASA Center for AeroSpace Information (CASI)7121 Standard Drive
Hanover, MD 21076-1320
(301) 621-0390
National Technical Information Service (NTIS)
5285 Port Royal Road
Springfield, VA 22161-2171
(703) 487-4650

ABSTRACT
The SR-71 test bed aircraft is shown to be a unique platform to flight-test large experiments to
supersonic Mach numbers. The test bed hardware mounted on the SR-71 upper fuselage is described.
This test bed hardware is composed of a fairing structure called the "canoe" and a large "reflection plane"
flat plate for mounting experiments. Total experiment weights, including the canoe and reflection plane,
as heavy as 14,500 lb can be mounted on the aircraft and flight-tested to speeds as fast as Mach 3.2 and
altitudes as high as 80,000 ft. A brief description of the SR-71 aircraft is given, including details of the
structural modifications to the fuselage, modifications to the J58 engines to provide increased thrust, and
the addition of a research instrumentation system. Information is presented based on flight data that
describes the SR-71 test bed aerodynamics, stability and control, structural and thermal loads, the canoe
internal environment, and reflection plane flow quality. Guidelines for designing SR-71 test bed
experiments are also provided.
NOMENCLATURE
C D
C 1
CH't
C H'_ o_
Cm 8
e
Cm 0
C n
Cnf3
Cn_
l.
C r
Cy_
KEAS
LASRE
Pt rnax
Ptrain
Ptoo
ref
S
SAS
W
coefficient of drag
rolling moment coefficient
dihedral effect, OC 1 ,0[3, deg -1
pitching-moment coefficient
longitudinal static stability derivative, a C m ,0or, deg -1
elevon control effectiveness derivative, 0 C m ,05 e' deg-1
coefficient of pitching moment at zero lift
yawing moment coefficient
directional static stability, 0 C n ,0_3, deg -1
yawing moment caused by rudder derivative,a C n ,0fir' deg-1
side force coefficient
side force caused by sideslip derivative, cqCy ,0[3, deg -1
equivalent airspeed, knots
Linear Aerospike SR-71 Experiment
dynamic pressure, lbf/ft 2
maximum total pressure, lbf/ft 2
minimum total pressure, lbf/ft 2
free-stream total pressure, lbf/ft 2
aerodynamic moment derivatives corrected to 25-percent mean aerodynamic chord
SR-71 reference area, 1605 ft 2
stability augmentation system
weight, lb

8
8r
wing reference plane angle of attack, deg
angle of sideslip, deg
elevon deflection, 8
edge down)
rudder deflection, 8 r
= -(8 e (left inboard) + 8 e (right inboard)), deg (positive is trailing
= -(8 r (left) + 8 r (right)), deg (positive is trailing edge left)
INTRODUCTION
The SR-71 test bed aircraft (fig. 1) at the NASA Dryden Flight Research Center (Edwards,
California) provides a unique capability to conduct flight research from subsonic speeds to high
supersonic Mach numbers and high altitudes. Structural modifications to the SR-71 upper fuselage allow
for the carriage of a large external payload on top of the aircraft. The maximum external payload weight
that can be carried on the aircraft is 14,500 lb. The weight of the test bed structure currently on the
aircraft is approximately 9,200 lb.
A large fairing structure, the "canoe," is mounted on the SR-71 upper fuselage (fig. 2). The canoe
provides volume for the packaging of experiment equipment and systems. A large flat-plate structure, the
"reflection plane," is mounted on top of the canoe. Another structure, the "kayak," inclines the reflection
plane at approximately a-2 ° angle relative to the SR-71 upper fuselage. This inclination approximately
aligns the reflection plane with the local flow. The reflection plane provides a fiat surface for experiment
placement and can also serve as a flow symmetry plane.
EC99 45102 03
Figure 1. NASA SR-71A test bed aircraft.
2

(a)Canoeandreflectionplanemountedonthe SR-71aircraft.
............};....
C._r_a .... 'L
[
(b) Canoe and reflection plane geometry.
Figure 2. Canoe and reflection plane.
3

Thecanoe,kayak,andreflectionplanearestructuresusedin apreviousflight testprogram,theLinearAerospikeSR-71Experiment(LASRE).TheLASREwasa captive-carryflight testof a linearaerospikerocketenginemountedatopthe SR-71aircraft (ref. 1).The aerospikerocketenginewasintegratedin asemispanlifting-body shapecalled the "model." In the LASRE configuration, the canoe,kayak,reflectionplane,andmodelwere collectively identified asthe "pod." Themodel wasmountedon thereflectionplane.Themodelhousedtheliquid oxygentankandothersystemsfor therocketengine.Tanksfor gaseoushydrogenfuel andenginecoolingwaterwerelocatedin thecanoe.
A researchinstrumentationsystemwasinstalledfor theLASRE experimentthat is capableof bothonboardrecordingandtelemeteringresearchdata.Currently,the SR-71aircraft is in flyable storageatNASA Dryden.Theaircraftcanbe returnedto flyable statusin afew months.
This paperprovidestechnicalinformation for potential experimentersaboutthe capabilitiesof theNASA SR-71testbed aircraft.This informationsupplementsthetechnicalinformationaboutthebasicSR-71 aircraft provided in reference2. A descriptionis given of the basic SR-71aircraft, structuralmodifications, canoe and reflection plane structures, SR-71 propulsion system, and researchinstrumentationsystem.Informationconcerningthedesignof theSR-71testbedexperimentsis givenintheappendix.Flightdataarepresentedfrom thetestbedflights in theareasof aerodynamics,stabilityandcontrol, structuralloads, thermal loads,the canoeinternal environment,and the flow quality on thereflectionplane.Someguidelinesfor designingSR-71testbedflight experimentsarealsoprovided.
SR-71 TEST BED DESCRIPTION
The NASA SR-71 aircraft has been modified to be used as a high-speed test bed aircraft. The
following sections describe the SR-71 aircraft, aircraft structural modifications, canoe and reflection
plane, aircraft propulsion system and modifications, and flight research instrumentation and data
acquisition system.
Aircraft Description
NASA has an SR-71 aircraft at the NASA Dryden Flight Research Center that is operated as a flight
research aircraft. This SR-71 test bed flight research aircraft is a modified SR-71A aircraft and has been
assigned NASA aircraft tail number 844. The SR-71A aircraft, designed and manufactured by the
Lockheed Advanced Development Company (Pahndale, California), has a tandem, two-place cockpit
configuration with flight controls in the forward cockpit only. A flight test engineer occupies the aft
cockpit and typically controls the experiment and operates emergency systems, in addition to performing
normal radio and navigation duties. The SR-71 aircraft has a rather narrow flight envelope; maximum
cruise performance is approximately Mach 3.2 at altitudes higher than 80,000 ft (fig. 3). The aircraft has
titanium construction and is painted black to operate at the high temperatures associated with Mach-3
flight (hence its designation as the "Blackbird"). Table 1 shows general specifications of the SR-71A
aircraft.
4

Figure3. SR-71Atestbedflight envelope.
Table 1.SR-71Atestbedconfigurationspecifications.
Item Specification
Aircraft length 107.40ft
Aircraft wing span 55.60ft
Aircraft height 18.50ft
Wing referencechord(alsomeanaerodynamicchord) 37.70ft
Grosstakeoffweight 143,000lb
Basicaircraftzerofuel weight 59,000lb
Canoe,kayak,andreflectionplaneweight 9,200lb
Fuel JP-7
DesignMachnumber 3.2
Canoelength 41.20ft
Canoewidth 2.75ft
Canoeheight 1.86ft
Reflectionplanelength 17.30ft
Reflectionplanewidth 7.50ft
5

Installationof experimentson top of the SR-71aircraft limits performancebecauseof reducedfuelloadandincreasedaerodynamicdrag.A high-speedflight missionof thetestbedaircraftnormallywouldinclude a takeoff with approximately35,000lb of fuel followed shortly by in-flight refueling at analtitudeof 20,000ft. During the LASRE program,the SR-71internalfuel tank floatswere adjustedtolimit theusableinternalfuel capacityto approximately67,000lb. This adjustmentwasdoneto preventexceedingtheaircrafttotal weight limit whilecarryingthe approximately14,500lb LASREexperiment.Also, 5,000lb of fuel in themostforwardaircraft fuel tankwasconsideredunusableduring theLASREprogramasthat amountof fuel wasrequiredto offsetthe aft centerof gravity of theLASRE hardware.During the testbed programwith the LASRE model removed,only 1,200lb of fuel were consideredunusablefor center-of-gravityconsiderations.For future flight programs,the fuel tank floats canbeadjustedto increaseusable fuel tank capacity if total weight and center-of-gravityconstraintsaresatisfied.
Aircraft Structural Modifications
Modifications were made to the SR-71 structure to carry the experiment hardware for the LASRE.
The aircraft structural modifications included strengthening the aircraft fuselage and installing
attachment hardware to the upper fuselage. The structural attachment points consist of a forward, self-
aligning ball, and two vertical links and one lateral link on the aft upper fuselage. These attachment
locations do not affect the normal load paths or stiffness of the basic SR-71 aircraft. The concentrated
load points at the attachments required local reinforcement internal to the fuselage to distribute flight
loads into the SR-71 airframe. To eliminate the need for structural testing, all new structure and existing
modified structure used a factor of safety of 2.25, 50-percent greater than the normal SR-71 aircraft
design factor of safety of 1.50.
Canoe and Reflection Plane Description
Figure 2 shows the canoe and reflection plane structures. The canoe is 41.20 ft long, 2.75 ft wide,
1.86 ft tall, and 2.00 in. thick. The reflection plane is 17.3 ft long and 7.5 ft wide. Both structures are
constructed of common low-carbon steel. These structures were designed with a factor of safety of 2.25.
As previously mentioned, the canoe is mounted between the SR-71 twin vertical rudders at three hard
points on the SR-71 fuselage. The canoe and reflection plane are designed to remain attached to the
SR-71 aircraft and cannot be jettisoned or released in flight. Table 2 shows the weights for the LASRE
and test bed configurations.
A nitrogen purge system, supplied by fuselage-mounted Dewar flasks, has been installed in the canoe.
The canoe internal volume may be purged with inert, nitrogen gas for several reasons. The primary
purpose may be to minimize the presence of oxidizer if flammable stores are carried within the canoe
volume. Oxidizer sources can be either air that has infiltrated from the outside or leakage from any
onboard oxidizer feed systems. The secondary purpose of the inert purge may be to dilute any leaking
volatiles, carried for a particular experiment, to below flammability limits and to transport the mixture
from inside the canoe to the outside using vent ports. Ignition sources also can be reduced by nitrogen
purging of the electronics boxes, valves, and so forth. The onboard nitrogen purge system can be easily
modified to service other experiment requirements and configurations.
The gaseous nitrogen is supplied from two liquid nitrogen Dewar flasks onboard the SR-71 aircraft.
The liquid nitrogen is vaporized by electric heaters and dispersed into the canoe volume through
perforated "piccolo" tubes.
6

Table2. LASREandtestbedweightbreakdown.
LASRE Testbedweight, weight,
Component lba lb b
Model assembly 4,300 None
Canoe structure 4,100 4,100
Kayak structure 300 300
Reflection plane structure 2,000 2,000
Hydrogen tanks 700 700
Helium tanks 200 200
Water tanks 600 600
Water 800 None
Electrical 200 200
Plumbing 300 300
Paint and ablative 100 100
Skirts 100 100
Unaccounted for weight growth 600 600
TOTAL 14,300 9,200
a. Total LASRE weight measmed before installation on SR 71 ah'crafl.
b. Test bed total weight calculated from weight allocations in table.
The two Dewar flasks hold a total of 100 L (180 lb) of liquid nitrogen. The flow rate presently is
metered to 34 standard ft3/min. This setting provides an operational duration of approximately 90 min. At
these flow rates, the volume changeout rate is approximately 0.33 volume changeouts/min on the ground,
and 2.00 changeouts/min at an altitude of 65,000 ft.
For ground operations, an external nitrogen gas source may be used to conserve the onboard supply
and provide for a larger ground operations purge mass flow rate. During flight, the purge flow can be
controlled from the SR-71 rear cockpit, and the nitrogen gas source operating pressure is telemetered to
the ground to verify operation.
Approximately 20 gal of water are carried aboard the SR-71 aircraft for cooling of experiment
electronics and instrumentation. The recirculating coolant flow rate through the electronics and
instrumentation is approximately 3 gal/min. The water is chilled by cold air from the SR-71
environmental control system. The system has significant margin for cooling additional equipment
beyond the current instrumentation system usage.
7

Thermocouplesaredistributedwithin thecanoefor local fire detectionandto monitorcanoeinternaltemperatures.Certaincomponents,suchasthe composite-wrappedhydrogentanksthat wereemployedby LASRE, the electroniccontrol systems,and the instrumentationsignal-conditioningboxes, aretemperature-limitedandrequiresomemeansto monitortheir exposure.
Aircraft Propulsion System Description and Modifications
The SR-71 propulsion system has three primary components: variable geometry, axisymmetric, mixed-
compression inlets; two turbojet engines with afterburners; and airframe-mounted, convergent-divergent,
blow-in-door ejector nozzles (ref. 3). The SR-71 aircraft is powered by two 34,000-1bf-thrust class J58
afterburning turbojet engines (Pratt & Whitney, West Palm Beach, Florida). At speeds faster than
Mach 2.2, some of the airflow is bled from the fourth stage of the compressor and dumped into the
augmentor inlet using six bleed-bypass tubes, circumventing the core of the engine and transitioning the
propulsive cycle from a pure turbojet to a turbo-ramjet. The engine is hydromechanically controlled and
bums a special low-volatility jet fuel mixture known as JP-7.
Thrust Enhancement Concepts
Pratt & Whitney was asked to analytically evaluate several options for increasing the thrust of the
J58 engine (ref. 4) to provide enhanced vehicle performance for carrying external payloads. The
enhancements considered included increasing turbine exit total temperature, increasing compressor rotor
speed, modifying the compressor bleed and inlet guide vane schedules, and increasing the augmentor fuel
flow combined with oxidizer injection. Only the increased turbine exit temperature and increased rotor
speed enhancements have been implemented to date.
Engine Control Modifications
The NASA Dryden requirement is that the thrust enhancements do not decrease the engine life (time
between overhaul) to less than 50 hr. Pratt & Whitney estimated that a combination of a 150-r/min rotor
speed increase and a 75 °F turbine exit total temperature increase would satisfy this engine life
requirement. In fact, through flight evaluation of the thrust enhancement, the 50-hr overhaul requirement
has been relaxed to a 50-hr inspection. Both changes involved relatively simple in-the-field, mechanical
adjustments to the engine main fuel control. As figure 4 shows, the rotor speed and turbine temperature
increases resulted in a predicted net thrust increase of an average 5 percent throughout the Mach range.
To further assure the best performance available, the engine manufacturer was asked to select a set of
top-performing J58 engines for the SR-71 test bed aircraft. Several engines were evaluated on a static
ground test stand until two primary engines were identified to best meet the performance requirements. In
addition, a third engine was identified as a spare. These engines have been trimmed to their maximum
normal operating band with respect to airflow and exhaust gas temperature.
Although not currently implemented, the augmentor fuel control could also be mechanically adjusted
to increase the afterburner fuel flow by approximately 4 percent throughout the Mach range. This extra
fuel flow could take advantage of additional oxidizer available from other enhancements such as nitrous

N_ ¸_1_
_rcer_
m ¸,,%¸:;F _L_r_e _t
,_ N : 2 tC 2. x _.............................. 3
_l_h numbe_
Figure 4. Net thrust increase caused by thrust enhancement.
oxygen injection (as described in reference 5), providing additional thrust. These modifications are
predicted to provide an additional 5-percent thrust increase across the flight envelope.
Flight Research Instrumentation and Data Acquisition System
Figure 5 shows the SR-71 test bed instrumentation system layout. Three pulse code modulation
encoders on board the SR-71 test bed aircraft are configured as one master with two remotes. The
encoder model used is a modular microminiature signal conditioner and pulse code modulation encoder.
Each encoder can be configured to accommodate various sensors using the different types of modules
Figure 5. SR-71 test bed instrumentation system layout.
9

availablefrom the vendor.The masterencoderis locatedin the SR-71fuselagechinebayandthe tworemoteencodersarelocatedin thecanoe.
Currently, the systemhas 12-bit resolution and is configuredto run at 800 kbits/sec,giving amaximum samplerate of 400 samples/sec.This capability canbe increasedas requiredby a specificexperiment.Thedatacanbetransmittedfrom theaircraftto thegroundandalsocanbedigitally recordedonboardtheaircraft.
NASA-designedsignal-conditioningboardsareprovidedfor the front endof eachanalogchannel.Thesesignal-conditioningboardscontain instrumentationamplifierswith gain and offset control andfilters. Excitationfor straingage-typesensorsorresistancetemperaturedevicescanbeprovidedthroughthesesignal-conditioningboards.
Thecurrentmeasurementcapabilitieslocatedwithin theaircraft include 112analogsignals,8 serialdatastreams,and4 12-bit digital datawords or equivalentdiscretemeasurements.Signalconditioningcanbeprovidedfor most typesof transducersincluding straingage,pressure,resistance,temperature,position,andacceleration.Single-endedanddifferential driverscanbeprovidedfor theeight serialdatastreams.
Currentaircraftmeasurementsincludeaircraftairdata,control surfacepositions,linearaccelerations,angularrates,inertial attitudes,fuel systemdata,andJ58enginedata.Aircraft airdataarecomposedofangle of attack,angleof sideslip, total pressure,static pressure,Mach number, airspeed,and totaltemperature.Control surfacepositionsincludethe positionof theelevons,rudders,engineinlet spikes,engine bypassdoors, and throttles. Normal and longitudinal linear accelerationand pitch rate aremeasuredat fuselagestations234.5(nearthe cockpit) and683.0.Roll andyaw angularratesarealsomeasuredat fuselagestation683.Fuel systemdatainclude the six individual fuel tank quantitiesandcenterof gravity. Enginedataarecomposedof the nozzlearea,exhaustgastemperatures,and enginespeed.Thecooling-watertemperaturesfor theaircraft instrumentationsystemarealsomeasured.
Theinstrumentationsystemin thecanoeconsistsof 224 analogsignals,16serialdatastreams,and8 12-bitdigital datawordsor equivalentdiscretemeasurements.Signalconditioningcanbeprovidedformost types of transducersincluding strain gage, pressure,resistance,temperature,position, andacceleration.
Currentmeasurementcapabilitiesin thecanoeincludepressures,temperatures,and strains.Typicalpressuremeasurementsare for gas storagetanks, feed lines, and the internal canoeenvironment.Multiplexed,electronicscanningpressuresensorsarealsoavailablefor measurementssuchasflow-fieldsurveys,boundary-layerrakes,andlocal airdataprobes.Temperaturestypically measuredinclude gasstoragetank andinternal canoeenvironmenttemperatures.The reflectionplanehaslimited strain-gageinstrumentationinstalled.A nine-holehemisphericaltip probe,whichhasstatic-pressureports,is locatedon topof thecanoe,forwardof thereflectionplane.
Figure 6 showsan oxygensensorsysteminstalledin the canoe.Thepurposeof thesesensorsis todeterminepurgeinert effectiveness,detectinfiltration of outsideair, and indicatethe presenceof anyleakedoxidizer that may be carried.Eachsensorhasbeencalibratedand is temperature-controlledtoreducethermaldrift of thesensoroutput.Thesesensorsarepointmeasurementsthatwill notdetectair oroxygenthatmaybecometrappedin otherareas,but thenumberanddistributionof thesensorsarejudgedto be sufficient to characterizeoverall oxygenlevels in the canoe.Accuracyof the sensorat sealevel,
10

O _i_,_ +_,t__r ¸
•...................................................................• ..i_ ............<k_ J _=_,_ ....................... J
• • , •v +
Figure 6. Location of oxygen sensors, fire thermocouples, and purge sources in canoe.
according to the specification sheet, is 1 percent, but calibration and correction determined an uncertainty
that was much better than specified (ref. 6).
FLIGHT TEST DATA
Several SR-71 test bed flights were conducted to obtain baseline data for this configuration. Flight
test results are given in the areas of aerodynamics and stability and control, structural and thermal loads,
canoe internal environment, and reflection plane flow quality.
Aerodynamics and Stability and Control
Flight test analysis and results are presented for the SR-71 performance, transonic pitching moment,
longitudinal stability and control, and lateral-directional stability and control. Guidance is provided in the
area of stability and control for the design of new configurations for the SR-71 test bed.
SR-71 Performance
The added aerodynamic drag of an experiment is most critical in the transonic acceleration, where
excess thrust is at a minimum. Poor transonic acceleration can affect the maximum Mach number
attainable because less fuel is available for the acceleration. The maximum possible Mach number for the
LASRE configuration was never determined. The maximum Mach number flown in the LASRE
configuration was approximately Mach 1.8, which was achieved on a day with approximately a "standard
day" temperature profile. Analysis has shown that Mach 2.5 could have been reached on that day with the
available fuel. On "hot" days--that is, when the profile for temperature as a function of altitude is well
above the standard day profile--the J58 engine thrust is significantly reduced, thereby significantly
reducing the maximum Mach capability. The SR-71 test bed configuration (with no experiment mounted
on the reflection plane) successfully reached Mach 3.0 on a "hot" day.
11
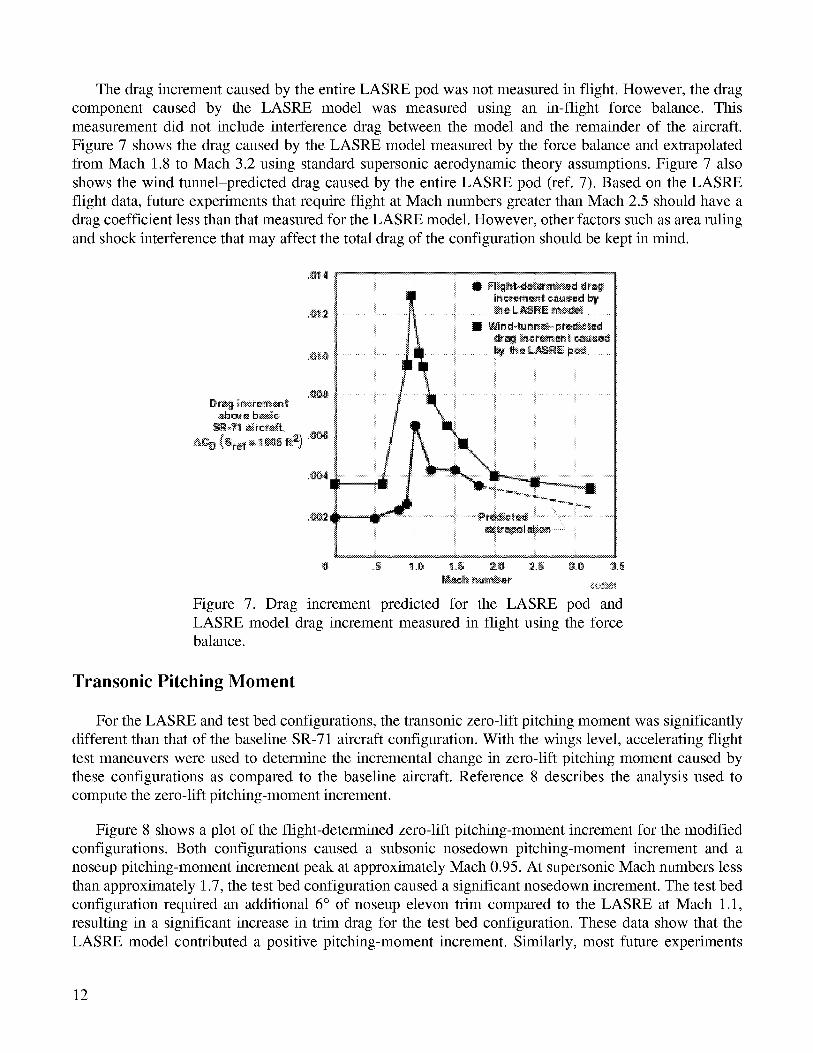
The drag increment caused by the entire LASRE pod was not measured in flight. However, the drag
component caused by the LASRE model was measured using an in-flight force balance. This
measurement did not include interference drag between the model and the remainder of the aircraft.
Figure 7 shows the drag caused by the LASRE model measured by the force balance and extrapolated
from Mach 1.8 to Mach 3.2 using standard supersonic aerodynamic theory assumptions. Figure 7 also
shows the wind tunnel-predicted drag caused by the entire LASRE pod (ref. 7). Based on the LASRE
flight data, future experiments that require flight at Mach numbers greater than Mach 2.5 should have a
drag coefficient less than that measured for the LASRE model. However, other factors such as area ruling
and shock interference that may affect the total drag of the configuration should be kept in mind.
Figure 7. Drag increment predicted for the LASRE pod and
LASRE model drag increment measured in flight using the forcebalance.
Transonic Pitching Moment
For the LASRE and test bed configurations, the transonic zero-lift pitching moment was significantly
different than that of the baseline SR-71 aircraft configuration. With the wings level, accelerating flight
test maneuvers were used to determine the incremental change in zero-lift pitching moment caused by
these configurations as compared to the baseline aircraft. Reference 8 describes the analysis used to
compute the zero-lift pitching-moment increment.
Figure 8 shows a plot of the flight-determined zero-lift pitching-moment increment for the modified
configurations. Both configurations caused a subsonic nosedown pitching-moment increment and a
noseup pitching-moment increment peak at approximately Mach 0.95. At supersonic Mach numbers less
than approximately 1.7, the test bed configuration caused a significant nosedown increment. The test bed
configuration required an additional 6 ° of noseup elevon trim compared to the LASRE at Mach 1.1,
resulting in a significant increase in trim drag for the test bed configuration. These data show that the
LASRE model contributed a positive pitching-moment increment. Similarly, most future experiments
12

_,_ r_':_:__._._
Figure 8. Zero-lift pitching-moment increments for the
LASRE and SR-71 test bed configurations.
mounted on the reflection plane probably will also contribute a positive pitching moment, which will
improve transonic performance by reducing trim drag caused by required noseup trim.
Stability and Control Analysis and Results
Extensive flight test has been completed to assess the changes in aircraft stability and control caused
by the addition of experiments on the SR-71 upper fuselage. Flight data have been obtained for the
baseline SR-71 aircraft to a maximum speed of Mach 2.9, for the LASRE configuration to a maximum of
Mach 1.75, and for the test bed configuration to a maximum of Mach 3.0. An output-error parameter
estimation program known as pEst was used to estimate the open-loop stability and control derivatives
from pilot-input doublet maneuvers (refs. 9-10). The aircraft stability augmentation systems (SASes)
were used in all axes during the pEst maneuvers to increase the closed-loop stability. Also, the engine
inlets and bypass doors were operated in automatic mode during all test maneuvers. Reference 8 provides
initial flight test results for the baseline SR-71 aircraft and the LASRE configuration. As is normally the
case, longitudinal and lateral-directional maneuvers were performed and analyzed separately.
Figure 9 shows the stability and control flight test points analyzed and presented in this report. As the
figure shows, the majority of the supersonic data were obtained at 450 knots equivalent airspeed (KEAS),
which was the maximum speed cleared for the LASRE and test bed flight tests.
Longitudinal Stability and Control
Pitch doublet maneuvers were flown at the test conditions shown in figure 9 to obtain the longitudinal
stability and control derivatives. Figures 10 and 11 show the longitudinal static stability derivative, Cm, _ ,
and the elevon control effectiveness derivative, Cm_ e , respectively, obtained from flight data. Flight
13

Figure 9. Flight conditions for stability and control test points.
Figure 10. Flight-determined longitudinal static stability.
data were obtained at center-of-gravity locations ranging from 17.3 to 25.5 percent of the mean
aerodynamic chord. However, all Cm_ and Cm_ results were corrected to a common moment reference
point at 25-percent mean aerodynamic )hord. Figure 10 shows that the LASRE and test bed hardware had
a negligible affect on the longitudinal static stability. Similarly, minimal effect existed on elevon control
effectiveness except during subsonic flight in the LASRE configuration in which the control effectiveness
was slightly reduced (fig. 11).
14

0
D
Figure 11. Flight-determined elevon control effectiveness.
Lateral-Directional Stability and Control
Yaw and roll doublet maneuvers were flown to obtain the lateral-directional stability and control
derivatives. Directional static stability, Cnp, and dihedral effect, Clp, were affected by the LASRE and test
bed hardware as shown in figures 12 and 13, respectively. Directional stability data were corrected to a
common 25-percent mean aerodynamic chord. Rudder effectiveness and aileron control effectiveness
were not significantly affected by the LASRE or test bed experiments.
The baseline SR-71 aircraft was designed to have minimum (but still positive) open-loop directional
static stability, C n , at Mach 3.2. In addition, a directional SAS was required to provide acceptableP
handling qualities and to prevent extreme sideslip transients caused by inlet "unstarts." The yaw SAS
uses yaw rate feedback for damping and lateral acceleration to augment stability. The effective closed-
loop directional static stability provided by the yaw SAS can be computed using the following equation:
77Sr_f
Cn_(Closed Loop) = Cnp(Open Loop)+Cn_ _ W Cy_
A roll SAS is also used, although it basically provides only roll damping through roll rate feedback.
The open-loop directional static stability, C n , showed reductions caused by the LASRE.
configuration and further reductions for the test bed configuration (fig. 12). Also plotted on figure 12 is
the calculated closed-loop static stability for the test bed data to demonstrate the effectiveness of the yaw
SAS. At approximately Mach 2.1, the test bed open-loop directional stability began decreasing rapidly
toward 0 and then leveled off near 0. This decrease was a significant concern during the envelope
expansion phase of the test bed flight program. Although less of a concern, the dihedral effect was also
reduced (fig. 13). With the SAS on, piloted simulations were flown to determine the effect of reduced
open-loop Cnp and Cla,_ on handling qualities and the aircraft responses caused by single engine failures
15

%
2_ ,_ _-er_-tr,ho:rdI
t
+
__o' • >%.°
,_l_h _umb_
Figure 12. Flight-determined directional static stability.
%
[]
[3
_._ .....
Figure 13. Flight-determined dihedral effect.
16
(for example, inlet "unstarts"). With reduced directional stability, an engine failure could result in
significant sideslip leading to aircraft structural failure. With the SAS on, simulations were flown to
determine the open-loop directional stability level that would result in exceeding the aircraft sideslip limit
for an "engine out" situation. For the test bed configuration, this sideslip limit is the same as the limit for
the baseline aircraft. The critical structural elements are the vertical tails for which a sideslip limit of 5.7 °
was used. The stability for Mach-3.2 flight was determined to be acceptable for the test bed
configuration; however, the aircraft center of gravity was required to be forward of 23-percent mean
aerodynamic chord for flight faster than Mach 2.5.
In the flight simulation, a lower limit for open-loop directional static stability of 4).0006 was
established, which would be acceptable in the event of an "unstart" with the SAS operating. However,
because of uncertainties in the simulation, a future program getting approved to fly with negative open-
loop directional static stability is doubtful.
New Configurations
Stability and control derivatives have been obtained for the baseline SR-71 aircraft, the LASRE
configuration, and the test bed configuration. For the LASRE program, extensive wind-tunnel tests were
completed to obtain the stability and control derivative increments caused by the LASRE experiment.
Based on the flight data obtained for the LASRE and test bed configurations, wind-tunnel data may not
be required for future configurations.
This flight data set can be used to bound the stability and control effects of a new configuration
mounted on the reflection plane. As figures 10 and 11 show, only slight changes in longitudinal stability
and control were evident. Directional static stability and dihedral effect are reduced for both the LASRE
and test bed configurations. The canoe is suspected to be the cause of this reduced C n and the LASRE
model to have had a positive effect on C n . Therefore, any experiment mounted on thee reflection plane13
would likely improve the directional stability over that of the test bed configuration. A stability and
control flight envelope expansion approach would be required for any new configuration. The amount of
envelope expansion required would likely increase with the physical size of the experiment.
Structural and Thermal Loads
Several SR-71 flights were flown in the LASRE and test bed configurations to investigate the
structural envelope relating to the canoe attachment loads into the SR-71 aircraft. The critical flight loads
were on the aft vertical links that attach the canoe to the SR-71 fuselage hard points (fig. 14). Data were
gathered for the LASRE configuration at a weight of 14,320 lb with the center of gravity at fuselage
station 1054.6, and for the test bed configuration at a weight of 9,151 lb with the center of gravity at
fuselage station 1038.0.
For the LASRE and test bed flights, the left aft vertical link of the canoe experienced slightly higher
loads than the right aft vertical link. Figure 14 shows measured loads on the left aft vertical link. The
LASRE loads flight data were generated by steady-state sideslip inputs of +2 ° at Mach 1.5. The data have
17

.................
Figure 14. Canoe attachment point loads caused by sideslip (left aft vertical link).
been normalized to an airspeed of 450 KEAS. These data were used with "engine out" and "unstart" data
from the SR-71 flight simulator to predict the LASRE load limits at high Mach numbers. Based on this
analysis, LASRE flights were cleared to proceed to a speed of Mach 2.0 to obtain additional steady-state
sideslip data; however, the program was terminated prior to reaching this cleared limit.
The test bed configuration resulted in significant reductions of load at the canoe attachment points as
compared to the LASRE configuration (fig. 14). Figure 15 shows a comparison of the LASRE and test
bed vertical surface area contributing to the side load. Aerodynamic side forces were assumed to be
uniform over these side surface areas. With the LASRE model removed, both the side force and rolling
moment about the reference axis were significantly reduced. The model weight removed was 4,300 lb,
and an additional 800 lb of LASRE engine cooling water was not carried on these flights. Figure 15
shows the predicted loads for the test bed flights. The only test bed data point shown is at 0 ° angle of
sideslip. The data point shown was in good agreement with the loads prediction.
18

Figure 15. Comparison of LASRE and test bed vertical surfaces contributing to side load.
Based on SR-71 airframe structural limits (ref. 11), the temperature on the fuselage upper surface,
underneath the canoe, is limited to 600 °F. Air temperature under the canoe was monitored at SR-71
fuselage stations 942 and 1135 during flights at speeds to a maximum of Mach 3. Projection of these data
to Mach 3.2 indicate that temperatures would peak at approximately 500 °F. The test bed configuration
was cleared to a maximum speed of Mach 3.2 without the need for further temperature monitoring.
Future test bed experiments will affect the loads at the mounting points to the SR-71 airplane and will
have to be reviewed on a case-by-case basis. In general, longitudinal loads are less critical than vertical and
side loads because the longitudinal design criteria is primarily based on an 8-g ultimate forward crash load
for a 14,500-1b experiment. The longitudinal crash condition loads are large compared to any normal flight
loads or thrust loads generated by probable experiments. Reference 11 should be used for general structural
operating limitations for the design of experiments to be carried on the SR-71 test bed aircraft. In general,
all experiment primary structure must be designed with a 2.25 factor of safety if the structural design is
verified by analysis only, and with a 1.5 factor of safety if proof testing is to be performed to ultimate loads.
If proof testing to other than ultimate loads is to be completed, a factor of safety between 1.5 and 2.25 may
be used, pending NASA agreement.
19

Canoe Internal Environment
Flight test results for the canoe internal environment are presented. Results for the nitrogen purge
effectiveness, fire detection, and canoe thermal environment are given.
Nitrogen Purge Effectiveness
Purge effectiveness has been evaluated in flight, primarily using data from the oxygen sensors.
Figure 16 (ref. 12) shows data from a LASRE flight demonstrating the purge effectiveness. The canoe
volume remains inert to less than 0.5-percent oxygen concentration from takeoff through subsonic cruise
flight at altitude. Figure 17 shows similar results during a supersonic acceleration and climb. During
descent, the altitude change is more rapid than during ascent. The purge system mass flow rate was not
able to compensate for the air intrusion mass flow rate during this more rapid, ambient pressure increase
during descent. Therefore, during descent, getting air intrusion caused by the ambient air pressure
increase on the outside of the canoe is possible. A procedure used for the LASRE flights to avoid
exceeding flammability limits during the descent phase was to dump propellants overboard and purge the
experiment gas storage tanks before commencing the descent phase.
.........................................i..........................................i..........................................i_.. ..........i:Y....N__xi::.;' ........... N : i::;_,_ _" "_ _ =:_
.....Z. _..'?_._. ........... ,--_e _.. ,.
NI:
Figure 16. Oxygen levels with purged canoe; takeoff and subsonic cruise flight.
7
20

,6
,7
,6
,6
,6
The purge also creates a pressurized environment, maintaining a positive pressure differential
between canoe interior and the external ambient atmosphere. This positive pressure differential is
maintained during ground operations, taxi, climb, acceleration, and steady cruise phases of flight.
Figure 18 shows data for this pressure differential for a flight that reached an altitude of approximately
70,000 ft. The minimum pressure inside the canoe was approximately 4 lbf/in 2 atmosphere with a
pressure differential of 3.3 lbf/in 2 at an altitude of 70,000 ft. The pressure differential can be regulated by
a cockpit-controlled vent valve located at the aft end of the canoe. Overpressure protection is also
provided by a large diameter relief valve that opens at 3 lbf/in 2 and is fully open at 5 lbf/in 2. The canoe
structural design limit loads result in a maximum allowable pressure differential of 5 lbf/in 2.
21

Figure18.Pressuredifferentialbetweencanoeinteriorandatmosphere.
22

The purgealso servesto slow the rateof overheatingof canoeinternal components,which canbeimportant for supersonicMach flight. The canoeinternal temperaturereductions,with the purge oninsteadof off, hasnotbeenquantifiedin flight.
Fire Detection and Canoe Thermal Environment
Figure 19 shows canoe interior temperature from the fire detection thermocouples for Mach flight to a
maximum of Mach 3.03. Only approximately 15 sec of flight data were obtained. The peak temperatures
lag the maximum Mach number by several minutes. Canoe internal temperatures as high as 160 °F are
estimated to be likely if dwell times are extended to 1 min or longer at Mach numbers greater than 3.0.
Localized temperatures may be even higher than 160 °F because of specific conduction paths through the
structure.
During the test bed flights, an attempt was made to quantify the maximum temperatures of internal
canoe structure and instrumentation pallet. Temperature indicator tabs were placed on the canoe steel
structure at various locations and on the aluminum instrumentation pallet. The tabs provided an
indication of the peak surface temperature attained on a given surface. The temperature tabs were
installed after the second flight and not recorded until after the fourth flight (table 3). Therefore, the
indicated peak temperature could have been reached in either the third or fourth flight.
Table 3. Canoe internal temperatures.
Maximum
temperature, Accuracy,
Area Material °F °F
Canoe skin
Canoe internal structure
Instrumentation pallet
Steel 375 +25
Steel 275 +25
Aluminum 155 +5
The canoe is cooled primarily by the thermal inertial mass of the internal and external steel structure.
Therefore, the maximum temperatures experienced by the structure during a flight will be a function of
Mach number and the duration of exposure to supersonic Mach numbers. The cooling capacity of the
purge is negligible when compared to this thermal inertial mass. Thus, the purge has little effect on the
temperature of the steel structure and skin. However, the cool purge does mitigate the convective transfer
of heat to instrumentation components.
23

8_
Figure 19. Canoe interior temperature data for supersonic flight.
Postflight temperature data were only obtained in the instrumentation pallet-main hydrogen valve
compartment. However, the conclusions derived from this information are likely valid for the rear of the
canoe. Table 3 shows the peak temperatures from the indicator tabs.
24
Thedifferencebetweenthe 375 °F canoeskinpeaktemperatureandthe 275 °F peaktemperatureofnearbyinternalstructureindicatesthattheroom-temperaturevulcanizingsealbetweenthecanoeskinandinternalstructureprovidedaneffectiveheatconductionbarrier.This sealwasonly intendedfor hermeticpurposesandneverintendedasaheatconductionbuffer.Futureexperimentsmaywishto incorporateanintentionalconductionbuffer to increaseinsulation.Themaximumcanoeinternal structuretemperaturewas observednearthe attachmentpoints to the canoeskin. However,severalother internal structuremeasurementsdid notreachthe250 °F lower indicatorlimit of thetemperaturetabs,perhapsindicatingthatthestructuredid notreachasteadystate.
Theinstrumentationpalletreachedapeaktemperatureof 155°F.Thispeaktemperaturewasneartheattachmentpointsto the internal structure.Severalotherpallet temperatureswere substantiallylower.Little heat can be concludedto be conductedto the instrumentationpallet through the attachmentstructure. Convectionfrom the surroundinggas probably was the main sourceof heating to theinstrumentationequipmentfor the test bed flights. Thus that the nitrogenpurge be operatedduringsupersonicMachflight is importantto mitigatethisconvectiveheatpath.A thermalbarrierbetweentheinstrumentationand structurealsomaybe requiredfor flights of longerdurationin which heatsoakingmaybeanissue.
Reflection Plane Flow Quality
For future air-breathing propulsion experiments carried on the SR-71 test bed, flow quality over the
reflection plane into the inlet is anticipated to be important. For this reason, flow-field surveys were
conducted at the location on the reflection plane where the inlet of an air-breathing engine might be
placed.
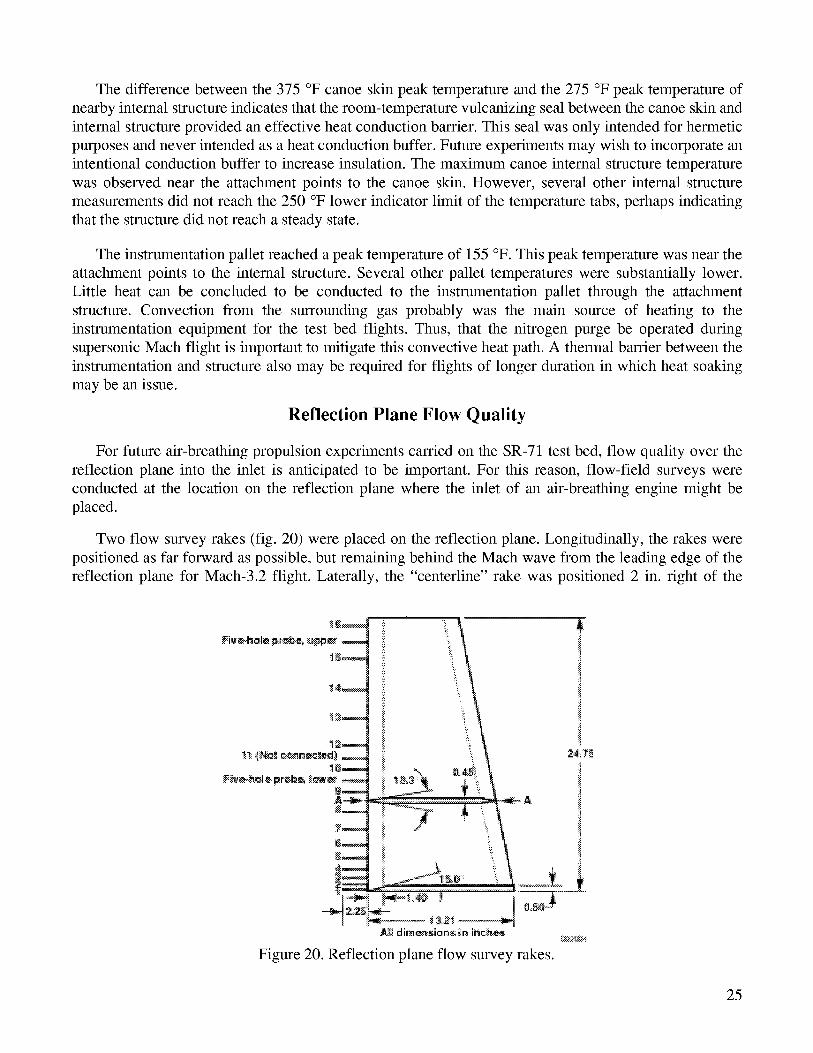
Two flow survey rakes (fig. 20) were placed on the reflection plane. Longitudinally, the rakes were
positioned as far forward as possible, but remaining behind the Mach wave from the leading edge of the
reflection plane for Mach-3.2 flight. Laterally, the "centerline" rake was positioned 2 in. right of the
Figure 20. Reflection plane flow survey rakes.
25

reflectionplanelongitudinalcenterline,andthe"offset" rakewaspositionedapproximately17in. left ofcenterline.
Each rake was 24.75 in. tall and had 16 total pressureprobes.Each rake was fitted with twohemispherical-tipfive-holeprobesfor flow anglemeasurements.Theseprobesalsoincorporatedstatictaps for instream static-pressuremeasurements.All pressureports were measuredwith 10 lbf/in2differential scanningpressuresensors.
Static-pressuremeasurementsweretakenonthe reflectionplaneat locationsshownon figure 21. Inthetime availablebeforeflight, installingconventionalflush static-pressuretapson thereflectionplanewasimpractical.Therefore,thin stainless-steeltubes,sealedat oneend,weregluedto thereflectionplanesurface,andahole wasdrilled at themeasurementlocation.Measurementsneartherakesprovidedlocalsurfacestatic pressuresfor the rakes. Upstreamstatic-pressureports provided some indication ofupstreamflow distortion.
Rakedatawereprocessedasfollows: For subsonicflow, total pressurewasequalto measuredpitotpressure.Otherflow parameterswerecalculatedusingcompressibleflow equationsandthenapplyingtheaveragestaticpressureat the baseof eachrakeuniformly over the entire rake,which is conventionalpracticefor boundary-layerrakes.Although this assumptionis not strictly valid in supersonicor free-streamflow, it wasstill found to be the bestapproachto obtainquantitativeresultsfrom the availabledata.Staticpressuresfrom the five-holeprobesappearedto experiencesubstantialtransoniceffectsandinterferencefrom neighboring probes, and therefore were not used. Only qualitative flow angleinformationwas obtainedfrom the five-hole probes;wind-tunnel calibration of the probeswould berequiredto obtainquantitativedata.
Figures22 to 25 showrepresentativeflow-field data.Total pressuresarepresentedratherthanMachnumberbecausefor subsonicflow, totalpressuresaredirectlymeasuredwithoutusinganyassumptions,andbecausefor low supersonicflow, the impactof assuminguniform staticpressureacrosstherake isreasonable.
Figure21.Locationof flow surveyrakesonreflectionplane.
26

Figures22(a)and22(b) showtotal-pressureprofiles at subsonicspeeds;theflow field appearsquiteuniform.Figures23(a)and23(b) showthe samefor supersonicspeeds;the flow is fairly uniform to amaximumof approximatelyMach 1.6, but distortionssubstantiallyincreaseat Mach numbersgreaterthanMach 1.6.Figure24 showsthe averageraketotal pressurein thetestregionoverarangeof Machnumbersandin sideslipmaneuvers.ThetotalpressuredecreasesasMachnumberincreasesandfor fightsideslip(noseright). Figure25 showsthemaximumminus minimumraketotal-pressuredistortionsforthesesametestpoints. The flow distortionssubstantiallyincreasefor supersonicspeedsgreaterthanMach1.8with no sideslipandfor fight sideslip.
i_o
(a) Centerline rake total-pressure profiles.
0 :._:
_,_:
Figure 22. Reflection plane flow data for subsonic flight.
27

_r_
_@ ...........................................•.........................................;:.........................................,! .................................i........................................
::,+ ×: ,_
+ ×_
........................................................................::_:.................................._N ..................
(a) Centerline rake total-pressure profiles.
,&l.,_4=t_0 _,_D _,6
+ &O
pl_ _t_ _
_:_ ............ :............................... ............... _.............. X _,4
A+X_!
A:+×
i̧
A X
zx_ o_}
.......................................× ................_ ............_ ..................
(b) Off-centerline rake total-pressure profiles.
Figure 23. Reflection plane flow data for supersonic flight.
28

0
Figure 24. Reflection plane flow average total pressure.
O N_
D Let_
! !
_.....................0 ......._: .........o ..............._._........... : ......... : ........... ......... :........... : ........ _.........
: : 0: llp
,I........._ooo...._..... .........I...........:a:_:::_ .................................................
F:_'_.,_,_%,_:_I_.,_ _:_ ....
Figure 25. Reflection plane flow total-pressure distortion.
_iF
29

The reflection plane flow field appears quite uniform to a maximum of approximately Mach 1.6 in
straight-and-level flight in the region surveyed. In sideslip, localized flow distortion exists in the potential
test region. The distortion may be caused by vortices or wakes shed off the aircraft forebody or off the
canoe forebody. Aircraft sideslip did not produce a uniform side wash over the test region. At speeds
faster than Mach 1.6, variable pressure distortions were observed in the test region. These distortions may
be caused by supersonic waves off the aircraft, possibly from the J58 engine inlets, cowl leading edge, or
bleed exit ports. The boundary-layer thickness was no more than 2.1 in. at the rakes. Additional instream
flow survey data may be required for specific experiments mounted on the reflection plane. Reference 12
provides further details of the data and analysis from the reflection plane flow survey flights.
SUMMARY
The SR-71 test bed aircraft configuration, composed of the canoe and reflection plane, has been
described. Details of aircraft modifications, including structure, propulsion, and instrumentation, were
given. Information concerning the design of SR-71 test bed experiments has been given in the appendix.
Requirements have been summarized in the areas of aerodynamic characteristics and structural design.
Additional standards have been provided for the design and carriage of pressure vessels and the
requirements for ground testing.
Flight data have been presented to document the characteristics of the SR-71 test bed aircraft in
support of using the facility for future test work. These areas include aerodynamics, stability and control,
structural and thermal loads of the aircraft, and flow quality on the reflection plane. Information about theinternal environment of the canoe has also been discussed.
Stability and control derivatives have been obtained from flight data for the Linear Aerospike SR-71
Experiment and test bed configurations. No longitudinal stability issues exist with either of these
configurations. Directional stability and dihedral effect are reduced, but are acceptable for the
configurations tested. Stability and control envelope expansion flights probably would be required for
new experiments, although new wind-tunnel testing may not be required.
The existing structural modifications to the SR-71 test bed aircraft permit the captive-carry flight of
external payloads of approximately 14,500 lb. Subtracting the 9,200-1b weight of the canoe and reflection
plane, experiment weights of approximately 5,300 lb can be carried. The specific loads transmitted to the
SR-71 fuselage will have to be analyzed for each experiment to guarantee the limit loads are not
exceeded. The amount of sideslip that can be achieved for a particular experiment will also have to be
determined for each experiment.
A nitrogen purge system has been demonstrated in flight to provide an inert atmosphere inside the
canoe. This system can be used to help mitigate the hazards of carrying gases and liquids that react with
oxygen.
The instream flow surveys of the flow over the reflection plane indicate that the flow is fairly uniform
at subsonic and supersonic Mach numbers less than approximately Mach 1.5. Flow distortion is present at
supersonic speeds greater than Mach 1.5 and in sideslip.
Dryden Flight Research Center
National Aeronautics and Space Administration
Edwards, California, April 5, 2000
30

REFERENCES
.
.
.
.
.
.
.
.
.
12.
Corda, Stephen, Bradford A. Neal, Timothy R. Moes, Timothy H. Cox, Richard C. Monaghan,
Leonard S. Voelker, Griffin P. Corpening, Richard R. Larson, and Bruce G. Powers, Flight Testing
the Linear Aerospike SR-71 Experiment (LASRE), NASA TM-1998-206567, 1998.
Lockheed Advanced Development Company, Lockheed SR-71 Supersonic�Hypersonic Research
Facility: Researcher's Handbook, Vol. H: Technical Description, 1990.
Burcham, Frank W., Jr., Earl J. Montoya, and Phillip J. Lutschg, Description of YF-12C Airplane,
Propulsion System, and Instrumentation for Propulsion Research Flight Tests, NASA TM-X-3099,
1974.
Pratt & Whitney, J58 Thrust Upgrade Study for Hypersonic Air Launch Option Concept: Final
Report, FR-22741-1, Mar. 1993.
Conners, Timothy R., Predicted Performance of a Thrust-Enhanced SR-71 Aircraft with an External
Payload, NASA TM-104330, 1997 (also published as ASME-95-GT-116, June 1995).
Mizukami, Masashi, et al., "Linear Aerospike SR-71 Experiment (LASRE): Aerospace Propulsion
Hazard Mitigation Systems," AIAA-98-3873, July 1998.
Moes, Timothy R., Brent R. Cobleigh, Timothy R. Conners, Timothy H. Cox, Stephen C. Smith, and
Norman Shirakata, "Wind Tunnel Development of an SR-71 Aerospike Rocket Flight Test
Configuration," AIAA-96-2409, June 1996.
Moes, Timothy R., Brent R. Cobleigh, Timothy H. Cox, Timothy R. Conners, Kenneth W. Iliff, and
Bruce G. Powers, "Flight Stability and Control and Performance Results From the Linear Aerospike
SR-71 Experiment (LASRE)," AIAA-98-4340, Aug. 1998 (also published as NASA
TM-1998-206565, 1998).
Maine, Richard E. and Kenneth W. Iliff, Application of Parameter Estimation to Aircraft Stability
and Control: The Output-Error Approach, NASA RP-1168, 1986.
Murray, James E. and Richard E. Maine, pEst Version 2.1 User's Manual, NASA TM-88280, 1987.
Lockheed Martin Skunk Works, LASRE Structural Criteria and Operating Limitations, SP-7551,
Rev. F, Nov. 1997.
Mizukami, Masashi and Daniel Jones, Flow-Field Survey in the Test Region of the SR-71 Aircraft
Test Bed Configuration to a Maximum of Mach 3.0, NASA TM-209025, 2000.
31

APPENDIX
DESIGNING SR-71 TEST BED EXPERIMENTS
INTRODUCTION
Based on experience gained in designing and flying the Linear Aerospike SR-71 Experiment
(LASRE) and test bed configurations, the following guidelines are being provided. Design philosophy,
aerodynamics, structural design, pressure vessels, and ground testing requirements are addressed.
Design Philosophy
Because the experiment is to be captive-carried on the SR-71 manned aircraft, the experiment
hardware and support systems must be designed to be single-fault tolerant (that is, no single failure may
be catastrophic to the carrier aircraft). All components must be designed for four times the number of
cycles required for completion of experimental testing (that is, ground and flight test).
Aerodynamics
As a minimum, any new experiment mounted on the SR-71 test bed will require stability and control
envelope expansion flights. The amount of envelope expansion required probably would increase with
the size of the new configuration. Wind-tunnel testing may not be required if the stability and control
effects of the new configuration are evaluated to be bounded by the flight data available from the LASRE
and test bed configurations.
Structural Design
All experiment primary structure must be designed with the following factor of safety, as appropriate:
• A 2.25 factor of safety, if structural design is verified by analysis only.
• A 1.5 factor of safety, if proof testing is to be performed to ultimate loads.
• If proof testing to other than ultimate loads is to be completed, a factor of safety between 1.5 and
2.25 may be used, if NASA concurs.
Pressure Vessels
All pressure vessels must be designed with the following factor of safety, as appropriate:
• The tank burst pressure must be 2.5 times the maximum operating pressure.
• The line proof pressure must be 1.5 times the maximum operating pressure.
• A leak test must be performed at the maximum attainable pressure.
• The maximum gaseous leak rate must not exceed lx 10 .5 standard cm3/sec.
32

Ground Testing Requirements
All emergency systems must be functionally checked on the ground, preferably with actual working
fluids. Other ground testing, including leak checks, ground vibration testing, environmental testing, and
so forth, will be determined after a detailed review of particular experiment hardware by NASA.
33

REPORT DOCUMENTATION PAGE FormApprovedOMB No. 0704-0188
Public reporting burden for this collection of information is estimated to average 1 hour per response, including the time for reviewing instructions, searching existing data sources, gathering andmaintaining the data needed, and completing and reviewing the collection of information. Send comments regarding this burden estimate or any other aspect of this collection of information,including suggestions for reducing this burden, to Washington Headquarters Services, Directorate for Information Operations and Reports, 1215 Jefferson Davis Highway, Suite 1204, Arlington,VA 22202-4302, and to the Office of Management and Budget, Paperwork Reduction Project (0704-0188), Washington, DC 20503.
1. AGENCY USE ONLY (Leave blank) 2. REPORT DATE
June 2000
4. TITLE AND SUBTITLE
The SR-71 Test Bed Aircraft:
A Facility for High-Speed Flight Research
6. AUTHOR(S)
Stephen Corda, Timothy R. Moes, Masashi Mizukami,
Neal E. Hass, Daniel Jones, Richard C. Monaghan,
Ronald J. Ray, Michele L. Jarvis, and Nathan Palumbo7. PERFORMING ORGANIZATION NAME(S) AND ADDRESS(ES)
NASA Dryden Flight Research CenterP.O. Box 273
Edwards, California 93523-0273
9. SPONSORING/MONITORING AGENCY NAME(S) AND ADDRESS(ES)
National Aeronautics and Space Administration
Washington, DC 20546-0001
3. REPORT TYPE AND DATES COVERED
Technical Publication
5. FUNDING NUMBERS
WU 529-70-14-00-12-00-PDE
8. PERFORMING ORGANIZATION
REPORT NUMBER
H-2405
10. SPONSORING/MONITORING
AGENCY REPORT NUMBER
NASA/TP-2000-209023
11. SUPPLEMENTARY NOTES
12a. DISTRIBUTION/AVAILABILITY STATEMENT
Unclassified--Unlimited
Subject Category 02, 05, 07, 08
This report is available at http://www.dfrc.nasa.gov/DTRS/
12b. DISTRIBUTION CODE
13. ABSTRACT (Maximum 200 words)
The SR-71 test bed aircraft is shown to be a unique platform to flight-test large experiments to supersonic
Mach numbers. The test bed hardware mounted on the SR-71 upper fuselage is described. This test bed
hardware is composed of a fairing structure called the "canoe" and a large "reflection plane" fiat plate for
mounting experiments. Total experiment weights, including the canoe and reflection plane, as heavy as
14,500 lb can be mounted on the aircraft and flight-tested to speeds as fast as Mach 3.2 and altitudes as high as
80,000 ft. A brief description of the SR-71 aircraft is given, including details of the structural modifications to
the fuselage, modifications to the J58 engines to provide increased thrust, and the addition of a research
instrumentation system. Information is presented based on flight data that describes the SR-71 test bed
aerodynamics, stability and control, structural and thermal loads, the canoe internal environment, and
reflection plane flow quality. Guidelines for designing SR-71 test bed experiments are also provided.
14. SUBJECT TERMS
Flight test, SR-71 aerodynamics, SR-71 aircraft,
SR-71 upper fuselage flow field, Test bed aircraft
17. SECURITY CLASSIFICATION 18. SECURITY CLASSIFICATION
OF REPORT OF THIS PAGE
Unclassified Unclassified
NSN 7540-01-280-5500
SR-71 stability and control,
19. SECURITY CLASSIFICATION
OF ABSTRACT
Unclassified
15. NUMBER OF PAGES
39
16. PRICE CODE
34
20. LIMITATION OF ABSTRACT
Unlimited
Standard Form 298 (Rev. 2-89)Prescribed by ANSI Std. Z39-18
298-102