the population of the world, 2013
DESCRIPTION
The Population of the World, 2013. Gilles Pison, INED. www.ined.frTRANSCRIPT

Gilles Pison*
Every other year, Population and Societies publishes a special issue called The population of the world, presenting an overall picture of the situation across the globe.** There are slightly more than 7 billion humans on the planet in 2013. The world population has risen seven-fold over the last two hundred years and is expected to reach 10 or 11 billion by the end of the twenty-first century.
The population of the world (2013)
The data shown in the central data sheet concern all geopolitical entities with a population of 150,000 or more, along with a few others. Sovereign states are listed along with non-sovereign territories, including France’s overseas départements. Countries and territorial entities are listed following the United Nations system of classif ication by region and continent.The demographic indicators are the same as those used in earlier editions: land area, mid-2013 population estimate, birth and death rates, infant mortality rate, total fertility rate, percentage of population under 15 and over 65, male and female life expectancy at birth, gross national income per capita adjusted for purchasing power parity (GNI PPP) in 2012, proportion of persons with HIV/AIDS in 2011 among the adult population aged 15-49 (these figures include persons with full-blown AIDS as well as those infected by the virus who are not yet ill). Note that the indicators are projections, but over a short period, as vital statistics and survey data are not yet available for the year 2013.Eighteen smaller tables classify countries or geopolitical entities according to different indicators, following a downward scale. In the first eight tables, a world total is given and a line separates the countries which together account for more than half of that total. For instance, the six most populated countries (China, India, United States, Indonesia, Brazil, Pakistan) represent a total population of 3.59 billion, or more than half of the world population, estimated at 7.14 billion. In the seventeenth and penultimate
* Institut national d’études démographiques.
** The data are drawn mainly from the World Population Data Sheet published by the Population Reference Bureau (PRB) [1]. Each year. this independent organization provides summary data sheets using figures issued by different sources – mainly the United Nations Population Division [2], the United States Census Bureau, the Council of Europe and INED – based on all demographic data published by national statistics agencies and international organizations.
small table, countries are classified according to the proportion of working-age persons aged 15-64 in the total population. This proportion is especially high in the small Persian Gulf states, which have large populations of immigrant workers living without their families, and in countries where fertility has fallen sharply to very low levels (Russia, Poland). Persons of working age also represent a large proportion of the total population in Southern countries where fertility has also declined rapidly in recent years (China, Iran, Vietnam). Their population pyramids have narrowed at the base, while their summit is still very small. Their shape will change, however, as the proportion of persons aged 15-64 decreases due to population ageing.
References
[1] Carl Haub and Toshiko Kaneda – 2013, World Population Data Sheet, Population Reference Bureau, 1875 Connecticut Ave. NW Suite 520, Washington DC 20009-5728, United States (www.prb.org).
[2] United Nations, Population Division – 2013, World Population Prospects: The 2012 Revision, New York (http://esa.un.org/unpd/wpp/)
Versionfrançaise
www.ined.fr
Population Societies&
Number 503 •September 2013 • Population & Societies • Monthly bulletin of the French National Institute for Demographic Studies
Number 503September 2013

COUNTRY or geopolitical entity
Area
(in
thou
sand
s of
sq. k
m)
Popu
latio
n m
id-2
013
(mill
ions
)
Birt
hs
(per
100
0 po
p.)
Deat
hs
(per
100
0 po
p.)
Proj
ecte
d po
pula
tion
(mill
ions
) 205
0
Infa
nt m
orta
lity r
ate
(per
100
0 bi
rths
)
Tota
l fer
tility
rate
(c
hild
ren
per w
oman
)
Pop.
age 0
-14
(%)
Pop.
age
65+
(%
)
Life
exp
ecta
ncy
at
birt
h, m
ale
(yea
rs)
Life
exp
ecta
ncy
at
birt
h, fe
mal
e (y
ears
)
GNI P
PP p
er ca
pita
in
2012
(USD
)
Perc
enta
ge o
f pop
. ag
ed 1
5-49
with
HIV
/AI
DS in
201
1
Indicator 1 2 3 4 5 6 7 8 9 10 11 12 13
WORLD 136,136 7,141 20 8 9,731 40 2.5 26 8 68 73 11,690 0.8
AFRICA 30,312 1,101 36 11 2,435 68 4.8 41 4 57 60 3,,010 3.7
NORTHERN AFRICA . . . . . . . . . . . . 7,880 208 26 6 316 31 3.2 32 5 69 72 6,260 0.1 Algeria . . . . . . . . . . . . . . . . . . . . . . . . . . . . . . . 2,382 38.3 26 5 55 23 3.0 28 6 76 77 7,550 0.05 Egypt . . . . . . . . . . . . . . . . . . . . . . . . . . . . . . . . 1,001 84.7 25 6 126 24 3.0 31 6 69 72 6,640 0.05 Libya . . . . . . . . . . . . . . . . . . . . . . . . . . . . . . . . . 1,760 6.5 22 4 9 15 2.5 29 5 73 77 17,560 0.02 Morocco . . . . . . . . . . . . . . . . . . . . . . . . . . . . . 447 33.0 22 6 43 28 2.7 30 6 69 72 5,040 0.2 Sudan . . . . . . . . . . . . . . . . . . . . . . . . . . . . . . . . 1,861 34.2 34 9 69 56 4.6 42 3 60 63 2,030 0.4 Tunisia . . . . . . . . . . . . . . . . . . . . . . . . . . . . . . . 164 10.9 19 6 13 16 2.2 23 7 73 77 9,360 0.05 Western Sahara . . . . . . . . . . . . . . . . . . . . . 266 0.6 22 6 0.9 39 2.5 27 2 65 69 - -WESTERN AFRICA . . . . . . . . . . . . . . 6,138 332 40 13 815 82 5.5 44 3 53 55 1,980 2.7 Benin . . . . . . . . . . . . . . . . . . . . . . . . . . . . . . . . . 113 9.6 39 10 23 70 5.2 43 3 58 60 1,570 1.2 Burkina Faso . . . . . . . . . . . . . . . . . . . . . . . . . 274 18.0 43 12 48 73 6.0 46 2 55 56 1,510 1.0 Cape Verde . . . . . . . . . . . . . . . . . . . . . . . . . . 4.0 0.5 21 5 0.7 18 2.4 31 6 70 78 4,340 1.0 Côte d'Ivoire . . . . . . . . . . . . . . . . . . . . . . . . 322 21.1 37 15 44 68 5.0 42 3 49 51 1,960 3.7 Gambia . . . . . . . . . . . . . . . . . . . . . . . . . . . . . . 11 1.9 43 10 5.0 81 5.8 46 2 57 60 1,860 1.5 Ghana . . . . . . . . . . . . . . . . . . . . . . . . . . . . . . . 239 26.1 33 9 46 53 4.2 39 4 60 62 1,940 1.5 Guinea . . . . . . . . . . . . . . . . . . . . . . . . . . . . . . . 246 11.8 38 12 25 67 5.1 43 3 55 56 980 1.4 Guinea-Bissau . . . . . . . . . . . . . . . . . . . . . . . 36 1.7 38 13 3.4 96 5.0 42 3 52 55 1,190 2.5 Liberia . . . . . . . . . . . . . . . . . . . . . . . . . . . . . . . 111 4.4 42 9 11 63 5.7 43 3 59 61 600 1.0 Mali . . . . . . . . . . . . . . . . . . . . . . . . . . . . . . . . . . 1,240 15.5 46 15 37 58 6.1 48 3 52 56 1,160 1.1 Mauritania . . . . . . . . . . . . . . . . . . . . . . . . . . 1,026 3.7 35 9 8 73 4.8 40 3 60 63 2,520 1.1 Niger . . . . . . . . . . . . . . . . . . . . . . . . . . . . . . . . . 1,267 16.9 50 12 66 51 7.6 50 3 57 58 650 0.8 Nigeria . . . . . . . . . . . . . . . . . . . . . . . . . . . . . . . 924 174.9 40 14 444 97 5.7 44 3 51 52 2,420 3.7 Senegal . . . . . . . . . . . . . . . . . . . . . . . . . . . . . . 197 13.5 38 8 31 51 5.0 44 3 62 65 1,920 0.7 Sierra Leone . . . . . . . . . . . . . . . . . . . . . . . . . 72 6.2 38 18 11 128 4.9 42 3 45 45 1,360 1.6 Togo . . . . . . . . . . . . . . . . . . . . . . . . . . . . . . . . . 57 6.2 37 11 13 69 4.7 42 3 55 57 920 3.4EASTERN AFRICA . . . . . . . . . . . . . . . 7,006 362 38 10 872 58 5.1 44 3 58 60 1,190 5.2 Burundi . . . . . . . . . . . . . . . . . . . . . . . . . . . . . . 28 10.9 45 13 29 89 6.2 44 2 51 55 560 1.4 Comoros . . . . . . . . . . . . . . . . . . . . . . . . . . . . . 2.2 0.8 32 9 1.6 69 4.3 42 3 59 62 1,230 0.05 Djibouti . . . . . . . . . . . . . . . . . . . . . . . . . . . . . . 23 0.9 29 9 1.5 58 3.7 34 4 59 62 - 1.4 Eritrea. . . . . . . . . . . . . . . . . . . . . . . . . . . . . . . . 118 5.8 38 7 13 46 4.9 43 2 59 64 560 0.6 Ethiopia . . . . . . . . . . . . . . . . . . . . . . . . . . . . . . 1,104 89.2 34 8 178 52 4.8 44 3 61 64 1,140 1.5 Kenya. . . . . . . . . . . . . . . . . . . . . . . . . . . . . . . . . 580 44.2 36 9 97 54 4.5 42 3 59 62 1,760 6.2 Madagascar. . . . . . . . . . . . . . . . . . . . . . . . . . 587 22.5 35 7 55 39 4.6 43 3 62 65 950 0.3 Malawi . . . . . . . . . . . . . . . . . . . . . . . . . . . . . . . 118 16.3 40 12 41 89 5.6 46 3 54 54 880 10.6 Mauritius . . . . . . . . . . . . . . . . . . . . . . . . . . . . 2.0 1.3 11 7 1.3 13 1.4 21 7 70 77 15,820 1.0 Mayotte. . . . . . . . . . . . . . . . . . . . . . . . . . . . . . 0.4 0.22 32 2 0.5 5 4.1 46 2 76 83 - - Mozambique . . . . . . . . . . . . . . . . . . . . . . . . 802 24.3 44 15 63 64 5.9 45 3 49 50 1,020 11.3 Reunion . . . . . . . . . . . . . . . . . . . . . . . . . . . . . . 2.5 0.8 17 5 1.2 7 2.4 25 9 77 83 - - Rwanda . . . . . . . . . . . . . . . . . . . . . . . . . . . . . . 26 11.1 36 8 24 51 4.7 45 2 61 65 1,250 3.0 Seychelles. . . . . . . . . . . . . . . . . . . . . . . . . . . . 0.5 0.09 19 8 0.10 10 2.4 20 7 68 78 25,760 - Somalia . . . . . . . . . . . . . . . . . . . . . . . . . . . . . . 638 10.4 45 13 27 83 6.8 48 3 53 56 - 0.7 South Sudan . . . . . . . . . . . . . . . . . . . . . . . . . 644 9.8 37 12 21 81 5.1 43 3 53 55 - 3.1 Tanzania. . . . . . . . . . . . . . . . . . . . . . . . . . . . . . 945 49.1 40 9 129 52 5.4 45 3 59 61 1,590 5.8 Uganda. . . . . . . . . . . . . . . . . . . . . . . . . . . . . . . 241 36.9 45 10 114 54 6.2 49 2 57 59 1,140 7.2 Zambia . . . . . . . . . . . . . . . . . . . . . . . . . . . . . . . 753 14.2 44 11 48 69 5.9 47 3 54 57 1,620 12.5 Zimbabwe. . . . . . . . . . . . . . . . . . . . . . . . . . . . 391 13.0 33 11 28 41 3.8 41 4 55 56 - 15.2MIDDLE AFRICA . . . . . . . . . . . . . . . 6,613 138 44 15 356 100 6.1 45 3 49 52 1,940 - Angola . . . . . . . . . . . . . . . . . . . . . . . . . . . . . . . 1247 21.6 47 15 61 98 6.3 48 2 50 53 5,490 2.1 Cameroon. . . . . . . . . . . . . . . . . . . . . . . . . . . . 475 21.5 39 12 53 62 5.1 43 3 53 55 2,320 4.3 Central African Republic . . . . . . . . . . . . 623 4.7 47 16 10 116 6.2 40 4 47 51 860 4.6 Chad. . . . . . . . . . . . . . . . . . . . . . . . . . . . . . . . . . 1,284 12.2 51 15 35 106 7.0 49 2 49 51 1,320 3.1 Congo . . . . . . . . . . . . . . . . . . . . . . . . . . . . . . . . 342 4.4 38 11 10 66 5.0 42 3 56 59 3,510 3.3 Congo. Dem. Rep. . . . . . . . . . . . . . . . . . . . 2,345 71.1 45 16 182 111 6.3 45 3 48 51 370 - Gabon. . . . . . . . . . . . . . . . . . . . . . . . . . . . . . . . 268 1.6 32 9 3.2 43 4.1 39 5 62 64 14,290 5.0 Equatorial Guinea . . . . . . . . . . . . . . . . . . . 28 0.8 37 14 1.6 65 5.1 39 3 51 54 18,880 4.7 Sao Tome and Principe. . . . . . . . . . . . . . 1.0 0.2 38 7 0.43 44 4.6 42 4 64 68 1,850 1.0SOUTHERN AFRICA . . . . . . . . . . . . . 2,675 61 22 12 75 46 2.5 31 5 56 59 10,750 16.5 Botswana . . . . . . . . . . . . . . . . . . . . . . . . . . . . 582 1.9 24 17 2.6 33 2.7 34 4 47 46 16,520 23.4 Lesotho . . . . . . . . . . . . . . . . . . . . . . . . . . . . . . 30 2.2 28 16 3.0 65 3.1 37 4 48 48 2,210 23.2 Namibia . . . . . . . . . . . . . . . . . . . . . . . . . . . . . . 824 2.4 27 8 3.9 36 3.2 37 3 61 66 7,470 13.4 South Africa . . . . . . . . . . . . . . . . . . . . . . . . . 1,221 53.0 22 11 64 45 2.4 30 5 56 60 11,190 15.9 Swaziland . . . . . . . . . . . . . . . . . . . . . . . . . . . . 17 1.2 31 14 1.8 68 3.5 38 3 49 48 4,840 26.0
2 www.ined.fr
The population of the word (2013)
Number 503 • September 2013 • Population & Societies •

3 www.ined.fr
COUNTRY or geopolitical entity
Area
(in
thou
sand
s of
sq. k
m)
Popu
latio
n m
id-2
013
(mill
ions
)
Birt
hs
(per
100
0 po
p.)
Deat
hs
(per
100
0 po
p.)
Proj
ecte
d po
pula
tion
(mill
ions
) 205
0
Infa
nt m
orta
lity r
ate
(per
100
0 bi
rths
)
Tota
l fer
tility
rate
(c
hild
ren
per w
oman
)
Pop.
age 0
-14
(%)
Pop.
age
65+
(%
)
Life
exp
ecta
ncy
at
birt
h, m
ale
(yea
rs)
Life
exp
ecta
ncy
at
birt
h, fe
mal
e (y
ears
)
GNI P
PP p
er ca
pita
in
2012
(USD
)
Perc
enta
ge o
f pop
. ag
ed 1
5-49
with
HIV
/AI
DS in
201
1
Indicator 1 2 3 4 5 6 7 8 9 10 11 12 13
AMERICAS . . . . . . . . . . . . . . . . . . . . 42,322 958 16 7 1,228 15 2.1 25 10 73 79 25,160 0.5
NORTHERN AMERICA . . . . . . . . . . . 21,776 352 12 8 448 6 1.9 19 14 77 81 49,800 0.6 Canada . . . . . . . . . . . . . . . . . . . . . . . . . . . . . . 9,971 35.3 11 7 48 5 1.6 16 15 79 83 42,690 0.3 United States . . . . . . . . . . . . . . . . . . . . . . . . 9,629 316.2 13 8 400 6 1.9 19 14 76 81 50,610 0.6CENTRAL AMERICA . . . . . . . . . . . . . 2,480 163 21 5 224 17 2.4 31 6 73 79 13,890 0.3 Belize . . . . . . . . . . . . . . . . . . . . . . . . . . . . . . . . 23 0.33 22 4 0.6 14 2.6 35 4 71 77 6,880 2.3 Costa Rica . . . . . . . . . . . . . . . . . . . . . . . . . . . 51 4.7 16 4 6 9 1.9 25 7 77 81 12,590 0.3 El Salvador . . . . . . . . . . . . . . . . . . . . . . . . . . 21 6.3 18 5 7 8 2.2 31 7 67 77 6,790 0.6 Guatemala . . . . . . . . . . . . . . . . . . . . . . . . . . 109 15.4 32 5 31 25 3.9 41 4 68 75 4,960 0.8 Honduras . . . . . . . . . . . . . . . . . . . . . . . . . . . . 112 8.6 26 5 15 24 2.9 38 4 71 76 3,890 0.7 Mexico . . . . . . . . . . . . . . . . . . . . . . . . . . . . . . 1,958 117.6 19 4 150 15 2.2 30 6 75 79 16,630 0.2 Nicaragua . . . . . . . . . . . . . . . . . . . . . . . . . . . 130 6.0 24 5 8 18 2.6 34 5 71 77 3,960 0.2 Panama . . . . . . . . . . . . . . . . . . . . . . . . . . . . . . 76 3.9 20 4 6 15 2.6 29 7 74 80 17,830 0.8CARIBBEAN . . . . . . . . . . . . . . . . . . . 234 42 18 8 50 33 2.4 26 9 70 75 - 0.9 Antigua and Barbuda . . . . . . . . . . . . . . . 0.4 0.09 14 5 0.11 16 2.1 26 7 74 80 19,260 - Aruba . . . . . . . . . . . . . . . . . . . . . . . . . . . . . . . . 0.2 0.10 11 8 0.10 15 1.7 20 11 73 78 - - Bahamas . . . . . . . . . . . . . . . . . . . . . . . . . . . . 14 0.35 13 6 0.46 16 1.7 26 6 72 78 29,740 2.8 Barbados . . . . . . . . . . . . . . . . . . . . . . . . . . . . 0.4 0.25 12 8 0.28 12 1.8 22 12 73 77 18,400 0.9 Cuba . . . . . . . . . . . . . . . . . . . . . . . . . . . . . . . . . 111 11.3 12 8 9 5 1.8 17 13 76 80 - 0.2 Curacao . . . . . . . . . . . . . . . . . . . . . . . . . . . . . 0.3 0.15 13 9 0.18 8 2.1 20 14 72 80 - - Dominican Republic . . . . . . . . . . . . . . . . 49 10.3 22 6 13 27 2.6 31 6 70 76 9,820 0.7 Dominica . . . . . . . . . . . . . . . . . . . . . . . . . . . . 0.8 0.07 13 8 0.06 15 2.0 22 11 71 77 12,190 - Grenada . . . . . . . . . . . . . . . . . . . . . . . . . . . . . 0.3 0.11 17 8 0.10 5 2.0 27 7 70 75 10,300 - Guadeloupe . . . . . . . . . . . . . . . . . . . . . . . . . 1.7 0.41 13 7 0.43 8 2.2 21 15 77 84 - - Haiti . . . . . . . . . . . . . . . . . . . . . . . . . . . . . . . . . 28 10.4 26 9 17 59 3.5 36 4 61 64 1,240 1.8 Jamaica . . . . . . . . . . . . . . . . . . . . . . . . . . . . . . 11 2.7 15 6 2.8 22 2.1 29 8 71 76 - 1.8 Martinique . . . . . . . . . . . . . . . . . . . . . . . . . . 1.1 0.38 11 7 0.38 9 1.9 19 16 79 85 - - Puerto Rico . . . . . . . . . . . . . . . . . . . . . . . . . . 9 3.6 11 8 3.6 8 1.6 19 15 76 83 - - Saint Lucia . . . . . . . . . . . . . . . . . . . . . . . . . . . 1 0.17 16 7 0.19 11 2.0 25 9 72 77 11,020 - St. Kitts-Nevis . . . . . . . . . . . . . . . . . . . . . . . 0.4 0.05 13 7 0.06 18 1.8 23 8 72 77 17,280 - St. Vincent and the Grenadines . . . . 0.5 0.11 19 8 0.13 17 2.2 26 7 70 74 10,810 - Trinidad and Tobago . . . . . . . . . . . . . . . . 5 1.3 15 9 1.2 25 1.8 21 9 71 78 22,400 1.5 U.S. Virgin Is. . . . . . . . . . . . . . . . . . . . . . . . . 0.3 0.11 16 7 0.10 10 2.5 21 14 77 83 - -SOUTH AMERICA. . . . . . . . . . . . . . . 17,832 401 18 6 507 19 2.1 27 7 71 78 10,380 0.4 Argentina . . . . . . . . . . . . . . . . . . . . . . . . . . . . 2,780 41.3 19 8 58 12 2.4 25 11 72 80 - 0.4 Bolivia . . . . . . . . . . . . . . . . . . . . . . . . . . . . . . . 1,099 11.0 26 7 17 40 3.2 35 5 65 69 4,960 0.3 Brazil . . . . . . . . . . . . . . . . . . . . . . . . . . . . . . . . . 8,515 195.5 15 6 227 21 1.8 25 7 71 78 11,720 0.3 Chile . . . . . . . . . . . . . . . . . . . . . . . . . . . . . . . . . 756 17.6 15 6 21 7 1.9 22 10 76 82 21,590 0.5 Colombia . . . . . . . . . . . . . . . . . . . . . . . . . . . . 1,139 48.0 19 6 63 17 2.3 28 6 70 77 10,110 0.5 Ecuador . . . . . . . . . . . . . . . . . . . . . . . . . . . . . 284 15.8 22 5 23 20 2.7 32 6 72 78 9,590 0.4 French Guiana . . . . . . . . . . . . . . . . . . . . . . 90 0.24 26 3 0.6 10 3.4 35 4 76 83 - - Guyana . . . . . . . . . . . . . . . . . . . . . . . . . . . . . . 215 0.8 21 7 0.8 29 2.6 37 3 63 69 3,400 1.1 Paraguay . . . . . . . . . . . . . . . . . . . . . . . . . . . . 407 6.8 24 6 10 31 2.9 33 5 70 74 5,610 0.3 Peru . . . . . . . . . . . . . . . . . . . . . . . . . . . . . . . . . 1,285 30.5 20 5 40 17 2.6 30 6 72 77 10,240 0.4 Suriname . . . . . . . . . . . . . . . . . . . . . . . . . . . . 164 0.6 18 7 0.6 19 2.3 28 7 67 74 8,500 1.0 Uruguay . . . . . . . . . . . . . . . . . . . . . . . . . . . . . 175 3.4 14 10 3.6 9 2.0 22 14 73 80 15,570 0.6 Venezuela . . . . . . . . . . . . . . . . . . . . . . . . . . . 912 29.7 21 5 41 12 2.4 29 6 72 78 13,120 0.5ASIA . . . . . . . . . . . . . . . . . . . . . . . . . 31,877 4,305 18 7 5,284 35 2.2 25 7 69 73 7,800 0.2
WESTERN ASIA . . . . . . . . . . . . . . . . 4,831 251 22 5 405 27 2.9 30 5 70 75 15,090 0.1 Armenia . . . . . . . . . . . . . . . . . . . . . . . . . . . . . 30 3.0 14 10 3.0 11 1.6 17 10 71 78 6,990 0.2 Azerbaijan . . . . . . . . . . . . . . . . . . . . . . . . . . . 87 9.4 19 6 11 11 2.3 22 6 71 77 9,410 0.1 Bahrain . . . . . . . . . . . . . . . . . . . . . . . . . . . . . . 0.7 1.1 14 2 1.6 7 1.9 21 2 75 78 21,420 0.2 Cyprus . . . . . . . . . . . . . . . . . . . . . . . . . . . . . . . 9 1.1 12 7 1.4 6 1.5 17 13 76 81 29,400 0.2 Georgia . . . . . . . . . . . . . . . . . . . . . . . . . . . . . . 70 4.5 13 11 3.4 13 1.7 17 14 70 79 5,860 0.2 Iraq . . . . . . . . . . . . . . . . . . . . . . . . . . . . . . . . . . 438 35.1 31 5 83 28 4.3 39 3 66 73 4,300 0.2 Israel . . . . . . . . . . . . . . . . . . . . . . . . . . . . . . . . . 22 8.1 22 5 14 4 3.0 28 10 80 84 28,070 0.2 Jordan . . . . . . . . . . . . . . . . . . . . . . . . . . . . . . . 89 7.3 27 4 13 17 3.5 37 3 72 74 6,130 0.2 Kuwait . . . . . . . . . . . . . . . . . . . . . . . . . . . . . . . 18 3.5 19 2 6 8 2.4 23 2 74 76 49,230 0.2 Lebanon . . . . . . . . . . . . . . . . . . . . . . . . . . . . . 10 4.8 14 4 5 9 1.5 23 9 77 82 14,400 0.1 Oman . . . . . . . . . . . . . . . . . . . . . . . . . . . . . . . . 310 4.0 21 2 6 9 2.9 26 3 74 78 25,580 0.1 Palestinian Territory . . . . . . . . . . . . . . . . 6 4.4 33 4 9 20 4.1 41 3 71 74 - - Qatar . . . . . . . . . . . . . . . . . . . . . . . . . . . . . . . . 11 2.2 12 2 3.0 7 2.2 12 1 77 79 84,670 0.2
Number 503 • September 2013 • Population & Societies •
The population of the word (2013)

4 www.ined.fr
The population of the word (2013)
Number 503 • September 2013 • Population & Societies •
COUNTRY or geopolitical entity
Area
(in
thou
sand
s of
sq. k
m)
Popu
latio
n m
id-2
013
(mill
ions
)
Birt
hs
(per
100
0 po
p.)
Deat
hs
(per
100
0 po
p.)
Proj
ecte
d po
pula
tion
(mill
ions
) 205
0
Infa
nt m
orta
lity r
ate
(per
100
0 bi
rths
)
Tota
l fer
tility
rate
(c
hild
ren
per w
oman
)
Pop.
age 0
-14
(%)
Pop.
age
65+
(%
)
Life
exp
ecta
ncy
at
birt
h, m
ale
(yea
rs)
Life
exp
ecta
ncy
at
birt
h, fe
mal
e (y
ears
)
GNI P
PP p
er ca
pita
in
2012
(USD
)
Perc
enta
ge o
f pop
. ag
ed 1
5-49
with
HIV
/AI
DS in
201
1
Indicator 1 2 3 4 5 6 7 8 9 10 11 12 13
Saudi Arabia . . . . . . . . . . . . . . . . . . . . . . . . . 2,150 30.1 21 3 47 16 2.9 30 3 73 75 25,010 0.2 Syria . . . . . . . . . . . . . . . . . . . . . . . . . . . . . . . . . . 185 21.9 25 4 37 17 3.1 35 4 72 78 5,200 0.2 Turkey . . . . . . . . . . . . . . . . . . . . . . . . . . . . . . . . 784 76.1 17 5 93 21 2.1 25 8 71 76 17,500 0.05 United Arab Emirates . . . . . . . . . . . . . . . 84 9.3 16 1 15 7 1.9 13 0 76 78 42,308 0.2 Yemen. . . . . . . . . . . . . . . . . . . . . . . . . . . . . . . . 528 25.2 34 6 52 72 4.9 42 3 61 63 2,310 0.2CENTRAL ASIA . . . . . . . . . . . . . . . . . . 4,003 66 23 6 98 - 2.6 29 5 64 72 6,010 - Kazakhstan. . . . . . . . . . . . . . . . . . . . . . . . . . . 2,725 17.0 23 8 24 28 2.6 25 7 64 74 11,950 0.2 Kyrgyzstan . . . . . . . . . . . . . . . . . . . . . . . . . . . 200 5.7 27 7 9 27 3.1 31 4 66 74 2,260 0.4 Tajikistan . . . . . . . . . . . . . . . . . . . . . . . . . . . . . 143 8.1 31 6 16 34 3.7 36 3 64 71 2,220 0.3 Turkmenistan . . . . . . . . . . . . . . . . . . . . . . . . 488 5.2 22 8 7 49 2.5 32 5 61 69 9,640 - Uzbekistan . . . . . . . . . . . . . . . . . . . . . . . . . . . 447 30.2 21 5 43 46 2.3 29 4 65 71 3,750 -SOUTH ASIA . . . . . . . . . . . . . . . . . . . . 6,788 1,779 23 7 2,432 47 2.6 31 5 65 68 3,830 0.4 Afghanistan . . . . . . . . . . . . . . . . . . . . . . . . . . 652 30.6 37 8 57 71 5.4 49 2 59 61 1,400 0.05 Bangladesh . . . . . . . . . . . . . . . . . . . . . . . . . . 144 156.6 21 6 202 35 2.3 31 5 69 71 2,070 0.05 Bhutan . . . . . . . . . . . . . . . . . . . . . . . . . . . . . . . 47 0.7 22 7 1.1 47 2.6 30 5 65 69 6,310 0.3 India. . . . . . . . . . . . . . . . . . . . . . . . . . . . . . . . . . 3,287 1,276.5 22 7 1,652 44 2.4 30 6 65 68 3,840 0.3 Iran . . . . . . . . . . . . . . . . . . . . . . . . . . . . . . . . . . . 1,648 76.5 19 5 99 19 1.9 25 5 72 75 10,320 0.2 Maldives . . . . . . . . . . . . . . . . . . . . . . . . . . . . . 0.3 0.36 22 4 0.5 9 2.3 27 5 73 75 7,690 0.05 Nepal. . . . . . . . . . . . . . . . . . . . . . . . . . . . . . . . . 147 26.8 24 7 35 46 2.6 35 5 66 69 1,500 0.3 Pakistan . . . . . . . . . . . . . . . . . . . . . . . . . . . . . . 796 190.7 30 7 363 74 3.8 37 4 65 67 3,030 0.1 Sri Lanka . . . . . . . . . . . . . . . . . . . . . . . . . . . . . 66 20.5 17 6 23 12 2.1 26 8 71 77 6,120 0.05SOUTHEAST ASIA. . . . . . . . . . . . . . . . 4,495 612 19 7 828 28 2.4 28 6 68 73 5,650 0.3 Brunei . . . . . . . . . . . . . . . . . . . . . . . . . . . . . . . . 6 0.41 17 3 0.5 7 1.6 25 4 77 79 49,370 - Cambodia . . . . . . . . . . . . . . . . . . . . . . . . . . . . 181 14.4 25 6 21 45 2.8 34 4 61 64 2,360 0.6 Indonesia . . . . . . . . . . . . . . . . . . . . . . . . . . . . 1,905 248.5 21 6 366 32 2.6 29 5 68 72 4,810 0.1 Laos . . . . . . . . . . . . . . . . . . . . . . . . . . . . . . . . . . 237 6.7 26 6 9 68 3.2 36 4 66 69 2,730 0.3 Malaysia . . . . . . . . . . . . . . . . . . . . . . . . . . . . . 330 29.8 18 5 41 7 2.1 26 5 72 77 16,530 0.4 Myanmar . . . . . . . . . . . . . . . . . . . . . . . . . . . . 677 53.3 18 9 59 52 2.0 28 5 63 67 - 0.6 Philippines . . . . . . . . . . . . . . . . . . . . . . . . . . . 300 96.2 21 5 152 22 3.0 33 4 66 72 4,400 0.05 Singapore . . . . . . . . . . . . . . . . . . . . . . . . . . . . 0.7 5.4 10 5 7 2 1.3 16 10 80 84 61,100 0.1 Thailand. . . . . . . . . . . . . . . . . . . . . . . . . . . . . . 513 66.2 12 8 61 11 1.6 19 10 71 78 9,430 1.2 Timor-Leste . . . . . . . . . . . . . . . . . . . . . . . . . . 15 1.1 33 7 1.8 45 5.7 41 5 65 68 6,410 - Vietnam. . . . . . . . . . . . . . . . . . . . . . . . . . . . . . 332 89.7 17 7 109 16 2.1 24 7 70 76 3,440 0.5EAST ASIA. . . . . . . . . . . . . . . . . . . . . . 11,760 1597 12 7 1,521 15 1.5 16 11 73 78 11,990 0.05 China . . . . . . . . . . . . . . . . . . . . . . . . . . . . . . . . . 9,561 1,360.7 12 7 1,314 16 1.5 16 9 73 77 9,210 0.05 China. Hong Kong SAR . . . . . . . . . . . . . . 1.1 7.2 13 6 9 1 1.3 11 14 81 86 53,050 - China. Macao SAR . . . . . . . . . . . . . . . . . . . 0.03 0.6 13 3 0.8 3 1.4 12 8 79 86 68,710 - Korea, North. . . . . . . . . . . . . . . . . . . . . . . . . 121 24.7 15 9 27 27 2.0 22 9 65 73 - - Korea, South . . . . . . . . . . . . . . . . . . . . . . . . . 100 50.2 10 5 48 3 1.3 16 11 78 84 30,890 0.05 Japan. . . . . . . . . . . . . . . . . . . . . . . . . . . . . . . . . 378 127.3 8 10 97 2 1.4 13 25 79 86 36,320 0.05 Mongolia. . . . . . . . . . . . . . . . . . . . . . . . . . . . . 1,564 2.8 27 6 4.2 36 2.8 27 4 65 72 5,100 0.05 Taiwan . . . . . . . . . . . . . . . . . . . . . . . . . . . . . . . 36 23.4 10 7 21 4 1.3 15 11 76 83 - - EUROPE. . . . . . . . . . . . . . . . . . . . . . . 23,061 740 11 11 726 5 1.6 16 16 74 81 28,870 0.4
NORTHERN EUROPE . . . . . . . . . . . . . 1,810 101 12 9 121 4 1.9 17 17 79 83 37,430 0.3 Denmark . . . . . . . . . . . . . . . . . . . . . . . . . . . . . 43 5.6 10 9 6 3 1.7 17 18 78 82 42,620 0.2 Estonia . . . . . . . . . . . . . . . . . . . . . . . . . . . . . . . 45 1.3 11 12 1.2 4 1.6 16 18 71 81 21,990 1.3 Finland . . . . . . . . . . . . . . . . . . . . . . . . . . . . . . . 338 5.4 11 10 6 2 1.8 16 19 78 83 38,210 0.1 Iceland . . . . . . . . . . . . . . . . . . . . . . . . . . . . . . . 103 0.32 14 6 0.42 2 2.0 21 13 81 84 33,550 0.3 Ireland . . . . . . . . . . . . . . . . . . . . . . . . . . . . . . . 70 4.6 16 6 6 4 2.0 22 12 78 83 35,110 0.3 Latvia. . . . . . . . . . . . . . . . . . . . . . . . . . . . . . . . . 65 2.0 10 14 1.6 6 1.4 14 19 69 79 21,020 0.7 Lithuania . . . . . . . . . . . . . . . . . . . . . . . . . . . . . 65 3.0 10 14 2.5 4 1.4 15 18 68 79 22,760 0.1 Norway. . . . . . . . . . . . . . . . . . . . . . . . . . . . . . . 385 5.1 12 8 7 2 1.8 18 16 79 83 64,030 0.1 Sweden . . . . . . . . . . . . . . . . . . . . . . . . . . . . . . 450 9.6 12 10 11 3 1.9 17 19 80 84 43,160 0.2 United Kingdom . . . . . . . . . . . . . . . . . . . . . 243 64.1 13 9 79 4 2.0 18 16 80 84 35,800 0.3WESTERN EUROPE 1,108 190 10 10 199 3 1.7 16 18 78 84 40,470 0.2 Austria . . . . . . . . . . . . . . . . . . . . . . . . . . . . . . . 84 8.5 9 9 9 3 1.4 14 18 78 83 43,220 0.4 Belgium . . . . . . . . . . . . . . . . . . . . . . . . . . . . . . 31 11.2 12 9 13 3 1.8 17 17 78 83 39,260 0.3 France (metropolitan). . . . . . . . . . . . . . . 552 63.9 13 9 72 3 2.0 19 17 79 85 36,460 0.4 Germany . . . . . . . . . . . . . . . . . . . . . . . . . . . . . 357 80.6 8 11 76 3 1.4 13 21 78 83 41,370 0.1 Liechtenstein . . . . . . . . . . . . . . . . . . . . . . . . 0.2 0.04 10 6 0.04 2 1.4 16 14 79 84 - - Luxembourg . . . . . . . . . . . . . . . . . . . . . . . . . 2.6 0.54 11 7 0.7 3 1.5 17 14 78 83 63,000 0.3 Monaco . . . . . . . . . . . . . . . . . . . . . . . . . . . . . . 0.001 0.04 6 6 0.05 - 13 24 - - - - Netherlands . . . . . . . . . . . . . . . . . . . . . . . . . 42 16.8 10 8 18 4 1.7 17 16 79 83 43,360 0.2 Switzerland . . . . . . . . . . . . . . . . . . . . . . . . . . 41 8.1 10 8 9 4 1.5 15 17 80 85 54,870 0.4

COUNTRY or geopolitical entity
Area
(in
thou
sand
s of
sq. k
m)
Popu
latio
n m
id-2
013
(mill
ions
)
Birt
hs
(per
100
0 po
p.)
Deat
hs
(per
100
0 po
p.)
Proj
ecte
d po
pula
tion
(mill
ions
) 205
0
Infa
nt m
orta
lity r
ate
(per
100
0 bi
rths
)
Tota
l fer
tility
rate
(c
hild
ren
per w
oman
)
Pop.
age 0
-14
(%)
Pop.
age
65+
(%
)
Life
exp
ecta
ncy
at
birt
h, m
ale
(yea
rs)
Life
exp
ecta
ncy
at
birt
h, fe
mal
e (y
ears
)
GNI P
PP p
er ca
pita
in
2012
(USD
)
Perc
enta
ge o
f pop
. Ag
ed. 1
5-49
with
HIV
/AI
DS in
201
1
Indicator 1 2 3 4 5 6 7 8 9 10 11 12 13
EASTERN EUROPE . . . . . . . . . . . . . . 18,826 295 12 13 260 7 1.5 15 14 67 77 18,990 0.7 Belarus . . . . . . . . . . . . . . . . . . . . . . . . . . . . . . 208 9.5 12 13 8 3 1.6 15 14 67 78 15,210 0.4 Bulgaria . . . . . . . . . . . . . . . . . . . . . . . . . . . . . 111 7.3 9 15 6 8 1.5 14 19 71 78 15,390 0.1 Czech Republic . . . . . . . . . . . . . . . . . . . . . 79 10.5 10 10 11 3 1.5 15 16 75 81 24,550 0.05 Hungary. . . . . . . . . . . . . . . . . . . . . . . . . . . . . 93 9.9 9 13 9 5 1.3 15 17 71 78 20,200 0.1 Moldova . . . . . . . . . . . . . . . . . . . . . . . . . . . . 34 4.1 11 11 2.9 10 1.3 16 10 67 75 3,690 0.5 Poland. . . . . . . . . . . . . . . . . . . . . . . . . . . . . . . 313 38.5 10 10 34 5 1.3 15 14 72 81 20,920 0.1 Romania . . . . . . . . . . . . . . . . . . . . . . . . . . . . 238 21.3 9 12 18 9 1.4 15 15 70 77 16,310 0.1 Russia . . . . . . . . . . . . . . . . . . . . . . . . . . . . . . . 17,098 143.5 13 13 132 7 1.7 16 13 64 76 22,760 1.1 Slovakia . . . . . . . . . . . . . . . . . . . . . . . . . . . . . 49 5.4 10 10 5.0 6 1.3 15 13 72 79 24,370 0.05 Ukraine . . . . . . . . . . . . . . . . . . . . . . . . . . . . . 604 45.5 11 15 34 9 1.5 14 15 66 76 7,290 0.8SOUTHERN EUROPE . . . . . . . . . . . . 1,317 153 9 10 146 4 1.4 15 19 78 83 27,890 0.3 Albania . . . . . . . . . . . . . . . . . . . . . . . . . . . . . . 29 2.8 13 7 2.7 14 1.8 20 12 74 80 9,390 - Andorra . . . . . . . . . . . . . . . . . . . . . . . . . . . . . 0.5 0.07 9 4 0.06 2 1.2 16 13 - - - - Bosnia-Herzegovina . . . . . . . . . . . . . . . . 51 3.8 8 9 3.3 5 1.2 17 15 73 78 9,380 - Croatia . . . . . . . . . . . . . . . . . . . . . . . . . . . . . . 57 4.3 10 12 3.6 5 1.5 15 18 74 80 19,760 0.05 Greece . . . . . . . . . . . . . . . . . . . . . . . . . . . . . . 132 11.1 9 10 10 3 1.4 14 19 79 83 24,790 0.2 Italy . . . . . . . . . . . . . . . . . . . . . . . . . . . . . . . . . 301 59.8 9 10 62 3 1.4 14 21 79 85 32,280 0.4 Kosovo . . . . . . . . . . . . . . . . . . . . . . . . . . . . . . 11 1.8 14 4 2.2 10 1.9 28 7 67 71 - - Macedonia. . . . . . . . . . . . . . . . . . . . . . . . . . 26 2.1 11 10 1.8 10 1.5 17 12 73 77 11,570 - Malta. . . . . . . . . . . . . . . . . . . . . . . . . . . . . . . . 0.3 0.45 10 8 0.49 6 1.5 15 16 79 83 26,990 0.1 Montenegro . . . . . . . . . . . . . . . . . . . . . . . . 14 0.6 12 10 0.8 6 1.7 19 13 72 77 13,930 - Portugal . . . . . . . . . . . . . . . . . . . . . . . . . . . . . 92 10.5 9 10 9 3 1.3 15 19 77 83 24,670 0.7 San Marino . . . . . . . . . . . . . . . . . . . . . . . . . 0.1 0.03 9 7 0.04 3 1.5 15 18 82 86 - - Serbia . . . . . . . . . . . . . . . . . . . . . . . . . . . . . . . 77 7.1 9 14 6 5 1.4 14 17 72 77 11,180 0.1 Slovenia . . . . . . . . . . . . . . . . . . . . . . . . . . . . . 20 2.1 11 9 2.1 2 1.5 14 17 76 83 26,470 0.1 Spain . . . . . . . . . . . . . . . . . . . . . . . . . . . . . . . . 506 46.6 10 8 42 3 1.3 15 18 79 85 31,780 0.2 OCEANIA . . . . . . . . . . . . . . . . . . . . . 8,564 38 18 7 58 20 2.4 24 11 75 79 30,590 0.3 Australia . . . . . . . . . . . . . . . . . . . . . . . . . . . . 7,741 23.1 13 6 34 3 1.9 19 14 80 84 43,170 0.2 Federated States of Micronesia . . . 0.7 0.11 24 5 0.11 36 3.5 35 4 67 68 4,090 - Fiji . . . . . . . . . . . . . . . . . . . . . . . . . . . . . . . . . . . 18 0.9 21 9 1.1 26 2.6 29 5 67 72 4,880 0.1 French Polynesia . . . . . . . . . . . . . . . . . . . 4.0 0.28 17 6 0.34 6 2.1 27 5 74 78 - - Guam. . . . . . . . . . . . . . . . . . . . . . . . . . . . . . . . 0.5 0.16 21 5 0.20 11 2.9 27 7 75 81 - - Kiribati . . . . . . . . . . . . . . . . . . . . . . . . . . . . . . 0.7 0.11 28 8 0.16 38 3.6 34 4 62 67 3,380 - Marshall Islands . . . . . . . . . . . . . . . . . . . . 0.2 0.06 31 6 0.06 21 3.9 41 2 70 74 - - New Caledonia . . . . . . . . . . . . . . . . . . . . . 19 0.26 17 5 0.35 5 2.2 26 7 74 81 - - New Zealand. . . . . . . . . . . . . . . . . . . . . . . . 271 4.5 14 7 6 4 2.0 20 14 79 83 29,960 0.1 Papua New Guinea . . . . . . . . . . . . . . . . . 463 7.2 31 10 13 45 4.0 38 3 61 66 2,780 0.7 Samoa. . . . . . . . . . . . . . . . . . . . . . . . . . . . . . . 2.8 0.19 28 5 0.22 21 4.5 38 5 72 74 4,270 - Solomon Islands . . . . . . . . . . . . . . . . . . . . 29 0.58 34 7 1.2 40 4.6 39 3 66 69 2,170 - Tonga. . . . . . . . . . . . . . . . . . . . . . . . . . . . . . . . 0.7 0.10 27 7 0.12 19 3.9 37 6 70 75 5,140 - Vanuatu . . . . . . . . . . . . . . . . . . . . . . . . . . . . . 12 0.27 31 5 0.48 21 4.0 37 4 70 73 4,500 -
• World and regional totals – Regional popu-lation totals are independently rounded and include small countries or areas not shown in the table. Regional and world rates and percentages are weighted averages of countries for which data are available; regio-nal averages are shown when data are available for at least three quarters of the region’s population.• The tables taken from the World Popula-tion Data Sheets should not be used as a time series. Fluctuations in values from year to year often reflect revisions based on new data or estimates rather than actual changes in levels. Additional information on likely trends and consistent time series can be obtained by consulting publications of the organizations listed above.• Area – This refers to the “land area” or “total area” of the country, excluding area
under inland water bodies, i.e. major rivers and lakes. Variations are due to updates and revised data provided by the countries and do not necessarily reflect an actual change in the country’s area. The PRB used the data provided by the last FAO Production Year-book.• Population mid-2013 – Estimates are based on a recent census, official national data, or UN and U.S. Census Bureau projec-tions. The effects of refugee movements, large numbers of foreign workers and popu-lation shifts due to contemporary political events are taken into account where pos-sible. Such events can lead to a high degree of uncertainty in the estimates.• GNI PPP – gross national income converted to US dollars using a purchasing power pari-ty (PPP) factor; this indicator is not available for all countries.
NotesTo find out more about the world
population. visit the INED website at www.ined.fr/en/
The “All about Population” and “Population in figures” pages give a wide array of information about the world population.
• Go to the “Population maps” and “Population in figures” pages to see the United Nations population statistics. You can navigate from one country to another, view demographic trends, classify and compare different countries.
• You can play interactive population games by using the “Population simulator” to look into the future, or go to "The population and me” to see where you stand in the world population.
Discover our animations, videos, fact sheets and publications.
5 www.ined.fr
The population of the word (2013)
Number 503 • September 2013 • Population & Societies •
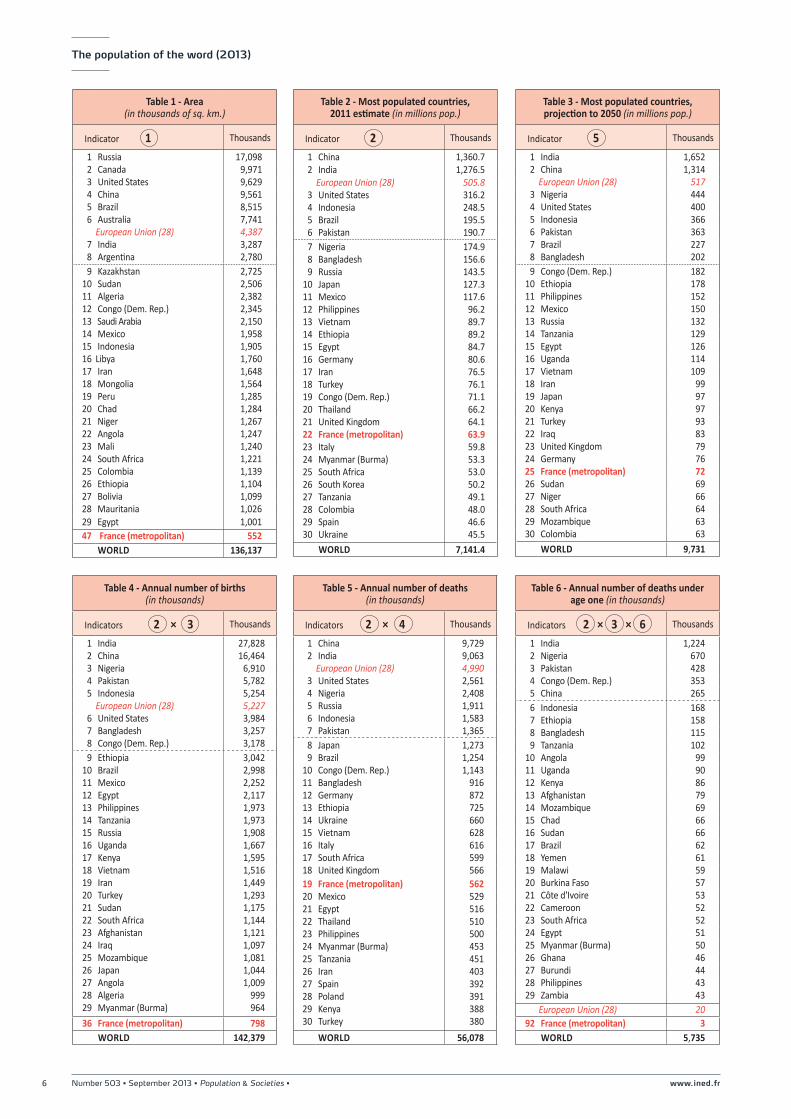
Table 1 - Area(in thousands of sq. km.)
Indicator 1 Thousands
1 Russia 17,0982 Canada 9,9713 United States 9,6294 China 9,5615 Brazil 8,5156 Australia 7,741
European Union (28) 4,3877 India 3,2878 Argentina 2,7809 Kazakhstan 2,725
10 Sudan 2,50611 Algeria 2,38212 Congo (Dem. Rep.) 2,34513 Saudi Arabia 2,15014 Mexico 1,95815 Indonesia 1,90516 Libya 1,76017 Iran 1,64818 Mongolia 1,56419 Peru 1,28520 Chad 1,28421 Niger 1,26722 Angola 1,24723 Mali 1,24024 South Africa 1,22125 Colombia 1,13926 Ethiopia 1,10427 Bolivia 1,09928 Mauritania 1,02629 Egypt 1,00147 France (metropolitan) 552
WORLD 136,137
Table 2 - Most populated countries, 2011 estimate (in millions pop.)
Indicator 2 Thousands
1 China 1,360.72 India 1,276.5
European Union (28) 505.83 United States 316.24 Indonesia 248.55 Brazil 195.56 Pakistan 190.77 Nigeria 174.98 Bangladesh 156.69 Russia 143.5
10 Japan 127.311 Mexico 117.612 Philippines 96.213 Vietnam 89.714 Ethiopia 89.215 Egypt 84.716 Germany 80.617 Iran 76.518 Turkey 76.119 Congo (Dem. Rep.) 71.120 Thailand 66.221 United Kingdom 64.122 France (metropolitan) 63.923 Italy 59.824 Myanmar (Burma) 53.325 South Africa 53.026 South Korea 50.227 Tanzania 49.128 Colombia 48.029 Spain 46.630 Ukraine 45.5
WORLD 7,141.4
Table 3 - Most populated countries, projection to 2050 (in millions pop.)
Indicator 5 Thousands
1 India 1,6522 China 1,314
European Union (28) 5173 Nigeria 4444 United States 4005 Indonesia 3666 Pakistan 3637 Brazil 2278 Bangladesh 2029 Congo (Dem. Rep.) 182
10 Ethiopia 17811 Philippines 15212 Mexico 15013 Russia 13214 Tanzania 12915 Egypt 12616 Uganda 11417 Vietnam 10918 Iran 9919 Japan 9720 Kenya 9721 Turkey 9322 Iraq 8323 United Kingdom 7924 Germany 7625 France (metropolitan) 7226 Sudan 6927 Niger 6628 South Africa 6429 Mozambique 6330 Colombia 63
WORLD 9,731
Table 4 - Annual number of births (in thousands)
Indicators 2 × 3 Thousands
1 India 27,8282 China 16,4643 Nigeria 6,9104 Pakistan 5,7825 Indonesia 5,254
European Union (28) 5,2276 United States 3,9847 Bangladesh 3,2578 Congo (Dem. Rep.) 3,1789 Ethiopia 3,042
10 Brazil 2,99811 Mexico 2,25212 Egypt 2,11713 Philippines 1,97314 Tanzania 1,97315 Russia 1,90816 Uganda 1,66717 Kenya 1,59518 Vietnam 1,51619 Iran 1,44920 Turkey 1,29321 Sudan 1,17522 South Africa 1,14423 Afghanistan 1,12124 Iraq 1,09725 Mozambique 1,08126 Japan 1,04427 Angola 1,00928 Algeria 99929 Myanmar (Burma) 964
36 France (metropolitan) 798 WORLD 142,379
Table 5 - Annual number of deaths(in thousands)
Indicators 2 × 4 Thousands
1 China 9,7292 India 9,063
European Union (28) 4,9903 United States 2,5614 Nigeria 2,4085 Russia 1,9116 Indonesia 1,5837 Pakistan 1,3658 Japan 1,2739 Brazil 1,254
10 Congo (Dem. Rep.) 1,14311 Bangladesh 91612 Germany 87213 Ethiopia 72514 Ukraine 66015 Vietnam 62816 Italy 61617 South Africa 59918 United Kingdom 56619 France (metropolitan) 56220 Mexico 52921 Egypt 51622 Thailand 51023 Philippines 50024 Myanmar (Burma) 45325 Tanzania 45126 Iran 40327 Spain 39228 Poland 39129 Kenya 38830 Turkey 380
WORLD 56,078
Table 6 - Annual number of deaths under age one (in thousands)
Indicators 2 × 3 × 6 Thousands
1 India 1,2242 Nigeria 6703 Pakistan 4284 Congo (Dem. Rep.) 3535 China 2656 Indonesia 1687 Ethiopia 1588 Bangladesh 1159 Tanzania 102
10 Angola 9911 Uganda 9012 Kenya 8613 Afghanistan 7914 Mozambique 6915 Chad 6616 Sudan 6617 Brazil 6218 Yemen 6119 Malawi 5920 Burkina Faso 5721 Côte d'Ivoire 5322 Cameroon 5223 South Africa 5224 Egypt 5125 Myanmar (Burma) 5026 Ghana 4627 Burundi 4428 Philippines 4329 Zambia 43
European Union (28) 2092 France (metropolitan) 3
WORLD 5,735
6 www.ined.fr
The population of the word (2013)
Number 503 • September 2013 • Population & Societies •
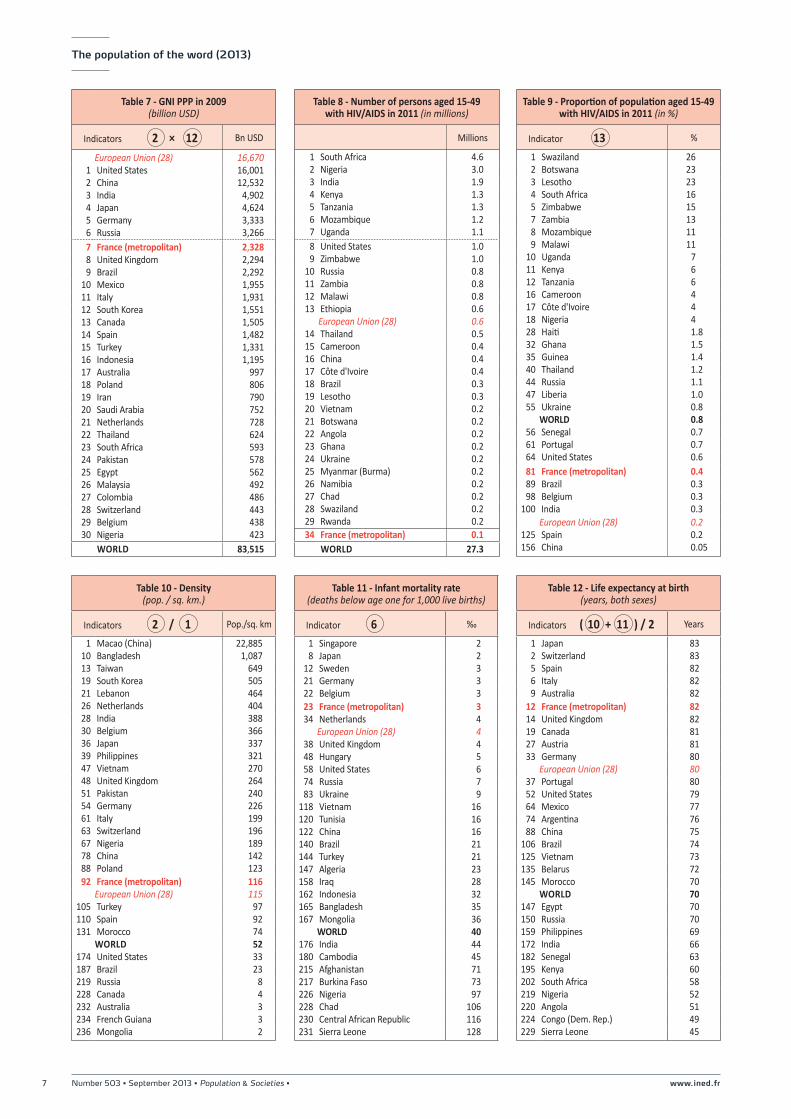
Table 7 - GNI PPP in 2009(billion USD)
Indicators 2 × 12 Bn USD
European Union (28) 16,6701 United States 16,0012 China 12,5323 India 4,9024 Japan 4,6245 Germany 3,3336 Russia 3,2667 France (metropolitan) 2,3288 United Kingdom 2,2949 Brazil 2,292
10 Mexico 1,95511 Italy 1,93112 South Korea 1,55113 Canada 1,50514 Spain 1,48215 Turkey 1,33116 Indonesia 1,19517 Australia 99718 Poland 80619 Iran 79020 Saudi Arabia 75221 Netherlands 72822 Thailand 62423 South Africa 59324 Pakistan 57825 Egypt 56226 Malaysia 49227 Colombia 48628 Switzerland 44329 Belgium 43830 Nigeria 423
WORLD 83,515
Table 8 - Number of persons aged 15-49 with HIV/AIDS in 2011 (in millions)
Millions
1 South Africa 4.62 Nigeria 3.03 India 1.94 Kenya 1.35 Tanzania 1.36 Mozambique 1.27 Uganda 1.18 United States 1.09 Zimbabwe 1.0
10 Russia 0.811 Zambia 0.812 Malawi 0.813 Ethiopia 0.6
European Union (28) 0.614 Thailand 0.515 Cameroon 0.416 China 0.417 Côte d'Ivoire 0.418 Brazil 0.319 Lesotho 0.320 Vietnam 0.221 Botswana 0.222 Angola 0.223 Ghana 0.224 Ukraine 0.225 Myanmar (Burma) 0.226 Namibia 0.227 Chad 0.228 Swaziland 0.229 Rwanda 0.234 France (metropolitan) 0.1
WORLD 27.3
Table 9 - Proportion of population aged 15-49 with HIV/AIDS in 2011 (in %)
Indicator 13 %
1 Swaziland 262 Botswana 233 Lesotho 234 South Africa 165 Zimbabwe 157 Zambia 138 Mozambique 119 Malawi 11
10 Uganda 711 Kenya 612 Tanzania 616 Cameroon 417 Côte d'Ivoire 418 Nigeria 428 Haiti 1.832 Ghana 1.535 Guinea 1.440 Thailand 1.244 Russia 1.147 Liberia 1.055 Ukraine 0.8
WORLD 0.856 Senegal 0.761 Portugal 0.764 United States 0.681 France (metropolitan) 0.489 Brazil 0.398 Belgium 0.3
100 India 0.3European Union (28) 0.2
125 Spain 0.2156 China 0.05
Table 10 - Density(pop. / sq. km.)
Indicators 2 / 1 Pop./sq. km
1 Macao (China) 22,88510 Bangladesh 1,08713 Taiwan 64919 South Korea 50521 Lebanon 46426 Netherlands 40428 India 38830 Belgium 36636 Japan 33739 Philippines 32147 Vietnam 27048 United Kingdom 26451 Pakistan 24054 Germany 22661 Italy 19963 Switzerland 19667 Nigeria 18978 China 14288 Poland 12392 France (metropolitan) 116
European Union (28) 115105 Turkey 97110 Spain 92131 Morocco 74
WORLD 52174 United States 33187 Brazil 23219 Russia 8228 Canada 4232 Australia 3234 French Guiana 3236 Mongolia 2
Table 11 - Infant mortality rate(deaths below age one for 1,000 live births)
Indicator 6 ‰
1 Singapore 28 Japan 2
12 Sweden 321 Germany 322 Belgium 323 France (metropolitan) 334 Netherlands 4
European Union (28) 438 United Kingdom 448 Hungary 558 United States 674 Russia 783 Ukraine 9
118 Vietnam 16120 Tunisia 16122 China 16140 Brazil 21144 Turkey 21147 Algeria 23158 Iraq 28162 Indonesia 32165 Bangladesh 35167 Mongolia 36
WORLD 40176 India 44180 Cambodia 45215 Afghanistan 71217 Burkina Faso 73226 Nigeria 97228 Chad 106230 Central African Republic 116231 Sierra Leone 128
Table 12 - Life expectancy at birth(years, both sexes)
Indicators ( 10 + 11 ) / 2 Years
1 Japan 832 Switzerland 835 Spain 826 Italy 829 Australia 82
12 France (metropolitan) 8214 United Kingdom 8219 Canada 8127 Austria 8133 Germany 80
European Union (28) 8037 Portugal 8052 United States 7964 Mexico 7774 Argentina 7688 China 75
106 Brazil 74125 Vietnam 73135 Belarus 72145 Morocco 70
WORLD 70147 Egypt 70150 Russia 70159 Philippines 69172 India 66182 Senegal 63195 Kenya 60202 South Africa 58219 Nigeria 52220 Angola 51224 Congo (Dem. Rep.) 49229 Sierra Leone 45
7 www.ined.fr
The population of the word (2013)
Number 503 • September 2013 • Population & Societies •

Table 13 - Rate of natural increase(annual, %)
Indicators 3 – 4 annual %
1 Niger 3.83 Uganda 3.59 Burundi 3.2
12 Burkina Faso 3.122 Congo (Dem. Rep.) 2.924 Afghanistan 2.834 Iraq 2.644 South Sudan 2.449 Pakistan 2.354 Côte d'Ivoire 2.263 Laos 2.069 Egypt 1.989 Morocco 1.6
101 Indonesia 1.5102 India 1.5103 Mexico 1.5109 Colombia 1.4121 Turkey 1.2
WORLD 1.2144 Brazil 0.9169 China 0.5172 United States 0.5182 United Kingdom 0.4187 France (metropolitan) 0.4198 Switzerland 0.2
European Union (28) 0.0213 Austria 0.0221 Russia 0.0229 Italy - 0.1233 Germany - 0.2238 Hungary - 0.4241 Bulgaria - 0.6
Table 14 - Total fertility rate (Children per woman)
Indicator 7 ch./wm.
1 Niger 7.63 Somalia 6.84 Congo (Dem. Rep.) 6.3
10 Burkina Faso 6.015 Nigeria 5.719 Tanzania 5.426 Senegal 5.033 Ethiopia 4.847 Palestinian Territory 4.153 Pakistan 3.858 Haiti 3.563 Bolivia 3.274 Egypt 3.081 Cambodia 2.8
WORLD 2.5102 India 2.4112 Colombia 2.3117 Bangladesh 2.3118 Mexico 2.2131 Turkey 2.1141 France (metropolitan) 2.0153 United States 1.9161 Brazil 1.8162 Belgium 1.8178 Russia 1.7
European Union (28) 1.6192 China 1.5200 Switzerland 1.5212 Germany 1.4219 Japan 1.4226 Poland 1.3231 Bosnia-Herzegovina 1.2
Table 15 - Proportion of pop. under age 15 (%)
Indicator 8 %
1 Niger 506 Angola 48
11 Burkina Faso 4613 Congo (Dem. Rep.) 4519 Ethiopia 4420 Senegal 4437 Côte d'Ivoire 4244 Central African Republic 4046 Iraq 3952 Honduras 3856 Jordan 3764 Haiti 3668 Syria 3583 Egypt 3192 India 30
WORLD 26131 Brazil 25141 Tunisia 23158 Iceland 21168 United States 19177 France (metropolitan) 19181 United Kingdom 18194 China 16198 Canada 16
European Union (28) 16205 Russia 16210 Spain 15212 Poland 15228 Italy 14230 Germany 13231 Japan 13234 Qatar 12
Table 16 - Proportion of pop. aged 65+(%)
Indicator 9 %
1 Japan 253 Germany 215 Greece 198 Sweden 19
European Union (28) 1820 Spain 1822 Belgium 1725 France (metropolitan) 1735 Netherlands 1649 Poland 1451 United States 1458 Cuba 1363 Russia 1365 Ireland 1267 Albania 1275 Israel 1082 China 9
WORLD 8101 Brazil 7102 Tunisia 7116 Mexico 6130 Egypt 6126 India 6140 Indonesia 5143 Iran 5163 Pakistan 4203 Palestinian Territory 3211 Nigeria 3214 Kenya 3231 Afghanistan 2236 United Arab Emirates 0.2
Table 17 - Working age population(percentage aged 15-64)
%
1 Qatar 872 United Arab Emirates 879 China 74
22 Russia 7229 Poland 7141 Iran 7047 Vietnam 6951 Canada 6970 Switzerland 6885 Netherlands 67
European Union (28) 6793 Algeria 6795 United States 67
106 Germany 66109 United Kingdom 66
WORLD 66121 Indonesia 65128 South Africa 65135 India 64136 France (metropolitan) 64151 Egypt 63155 Japan 62163 Nicaragua 61166 Syria 61179 Pakistan 59187 Ghana 58192 Mauritania 56201 Côte d'Ivoire 55217 Senegal 53230 Angola 50236 Niger 47
Table 18 - GNI PPP per capita in 2012(in US dollars)
Indicator 12 USD
1 Qatar 84,6703 Norway 64,0306 Switzerland 54,8708 United States 50,610
18 Germany 41,37021 France (metropolitan) 36,46022 Japan 36,32023 United Kingdom 35,800
European Union (28) 32,96029 South Korea 30,89041 Czech Republic 24,55044 Russia 22,76057 Libya 17,56061 Mexico 16,63072 Venezuela 13,12076 Brazil 11,720
WORLD 11,69078 South Africa 11,19084 Peru 10,24094 China 9,21099 Ukraine 7,290
103 Egypt 6,640108 Georgia 5,860119 Indonesia 4,810128 India 3,840132 Vietnam 3,440139 Nigeria 2,420152 Senegal 1,920157 Tanzania 1,590168 Mali 1,160181 Congo (Dem. Rep.) 370
www.ined.fr
This issue and all Population & Societies back issues are available online at www.ined.fr/en/resources_documentation/publications/pop_soc/No. 503 • September 2013 • Population & Societies • Monthly bulletin of the French National Institute for Demographic Studies Director of Publications: C. Cases – Editor-in-chief: G. Pison – Editorial assistant: M.-P. Reydet – Translator: C. Dutreuilh – Maquette : I. Milan – D.L. 3rd quarter 2013 • ISSN 0184 77 83Ined : 133, boulevard Davout - 75980 Paris, Cedex 20, France – Telephone : (33) (0)1 56 06 20 00 – Fax : (33) (0)1 56 06 21 99 Subscriptions: (33) (0)1 56 06 20 23 – [email protected] – Price per issue: €1.50 – One-year subscription – France: €12 • Abroad: €18
The population of the word (2013)