world population through history…. what was the world population at the time of jesus christ? 300...
TRANSCRIPT

WORLD WORLD POPULATION POPULATION THROUGH THROUGH HISTORY…HISTORY…
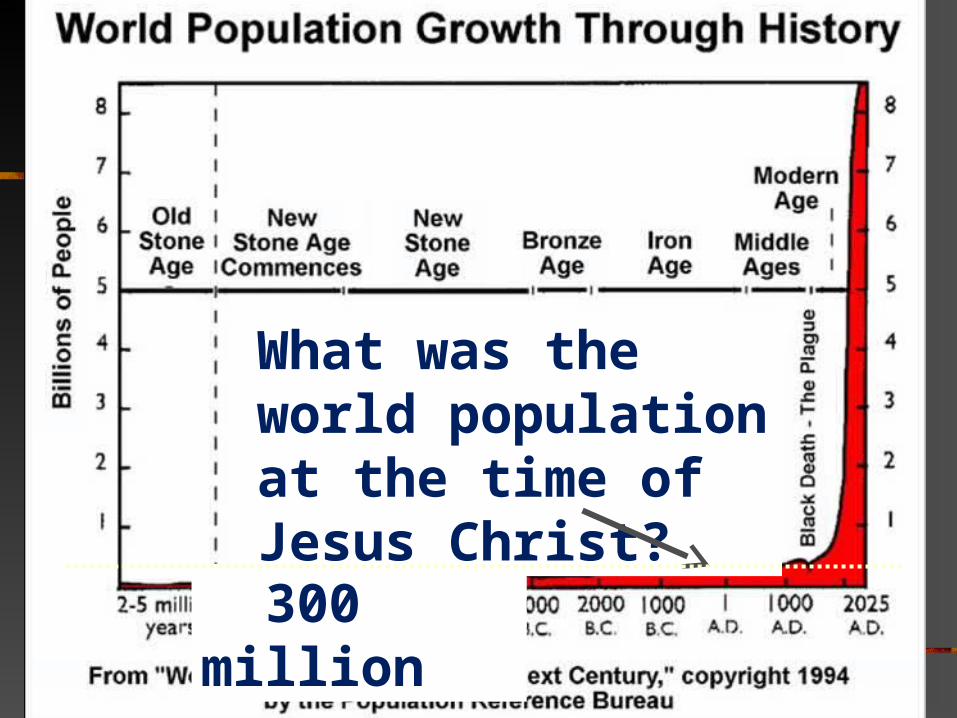
What was the world population at the time of Jesus Christ?
300 million

Why??
When did it shoot up?1850
engines Medicines Technologies

BUT BUT WHEREWHERE DO DO
THEY ALL LIVE…
THEY ALL LIVE…
(AND WHY (AND WHY THERETHERE!?)!?)

Imagine the year is 1885. The US Navy is sailing its ships through the Pacific Ocean and to their great surprise, they discover a whole new continent. It is no small island, but a continent almost as big as Australia. No one knows how it was never discovered before, by anyone. The continent is not inhabited so people from Europe and America move in. By the year 1900 it is expected that 250,000 people (1/4 million) will have relocated there permanently. Help the many governments of the new continent plan for future growth. On the map below make your prediction as to where people will settle. Directions: 1. On the map below place 25 dots with a marker to show where you think people will be living in the year 1900. Each dot = 10,000 people. You may place the dots where ever you see fit. The triangles in the middle represent mountains. 2. Any place that you have more than three or more dots close together (size of your pinky nail) you must give a short reason as to why you are putting them so close. Write your justification and draw an arrow to the dots you are referring to.

Tropic of Capricorn 22.5 S
Pacific Ocean
Pacific Ocean Directions: 1. On the map below place 25 dots with a marker to show where you think people will be living in the year 1900. Each dot you place represents 10,000 people. You may place the dots where ever you see fit. They may be bunched together, spaced apart or some combination of both. Use whatever you know about climate or people’s needs and preferences to help you place your dots. The triangles in the middle represent mountains. 2. Any place that you have more than three or more dots close together (size of your pinky nail) you must give a short reason as to why you are putting them so close. Write your justification and draw an arrow to the dots you are referring to.

If you had “first picks”, where would you want to buy land?
Pacific Ocean
1 . Near water (i.e. 2/3 <300 mi of oceans )For travel & food sources
2. Potable water sources3. Flatter land (for crops)
4. Fertile soil (deltas & volcanic ash, so…?)
5. Moderate temperature (mid latitudes)
6. Natural protection (bays)
7. Major “crossroads” points/travel routes (CHOKE POINTS)
…any land in the middle?
Where are there the most layers overlapping?
Click after point #4

Click to return to presentation
Nile River delta created by soils carried by the river & deposited in the Mediterranean Sea
Deltas “grow” the land out into the water but are VERY low & flood easily. Great soil though!
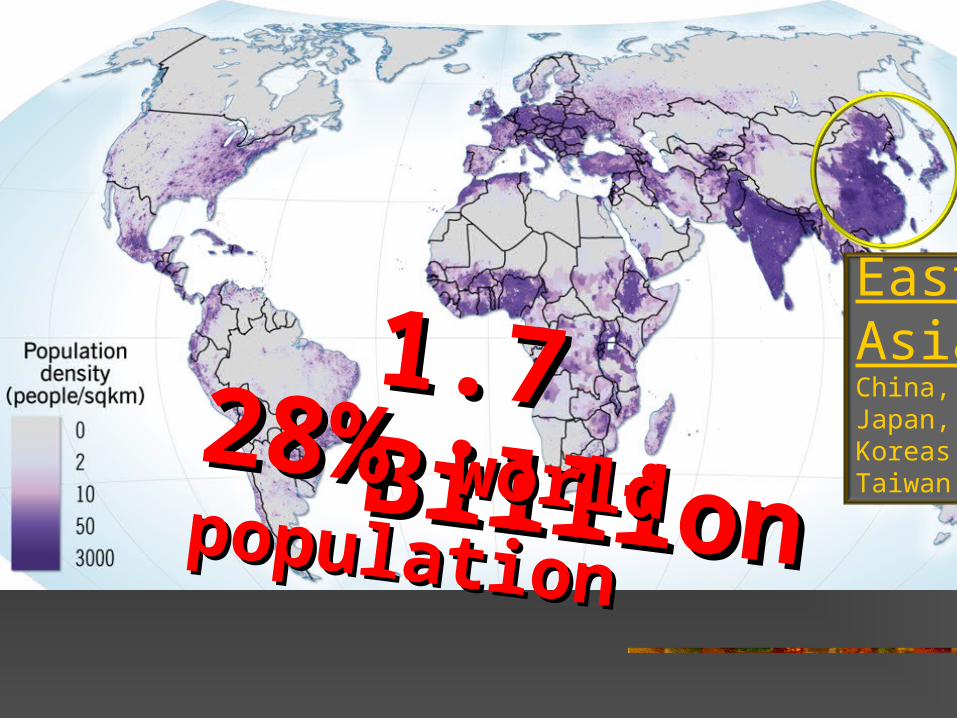
East AsiaChina, Japan, Koreas, Taiwan
1.7 Billion1.7 Billion28% 28% world populationworld population

South AsiaIndia, Pakistan, Bangladesh, and Sri Lanka
1.4 Billion1.4 Billion23% 23% world populationworld population
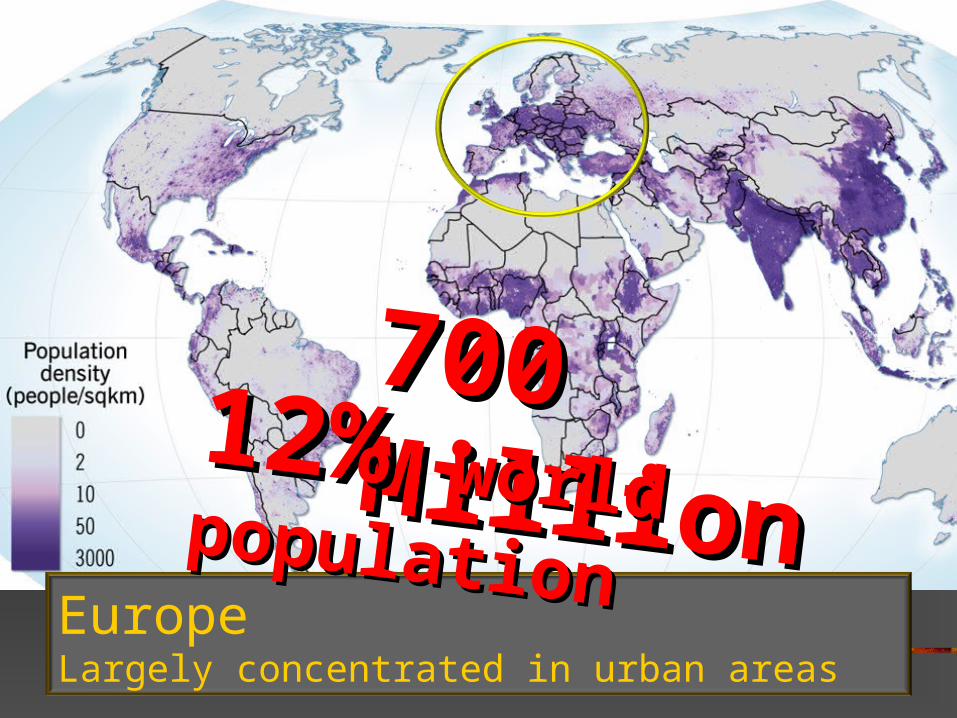
EuropeLargely concentrated in urban areas
700 700 MillionMillion
12% 12% world populationworld population
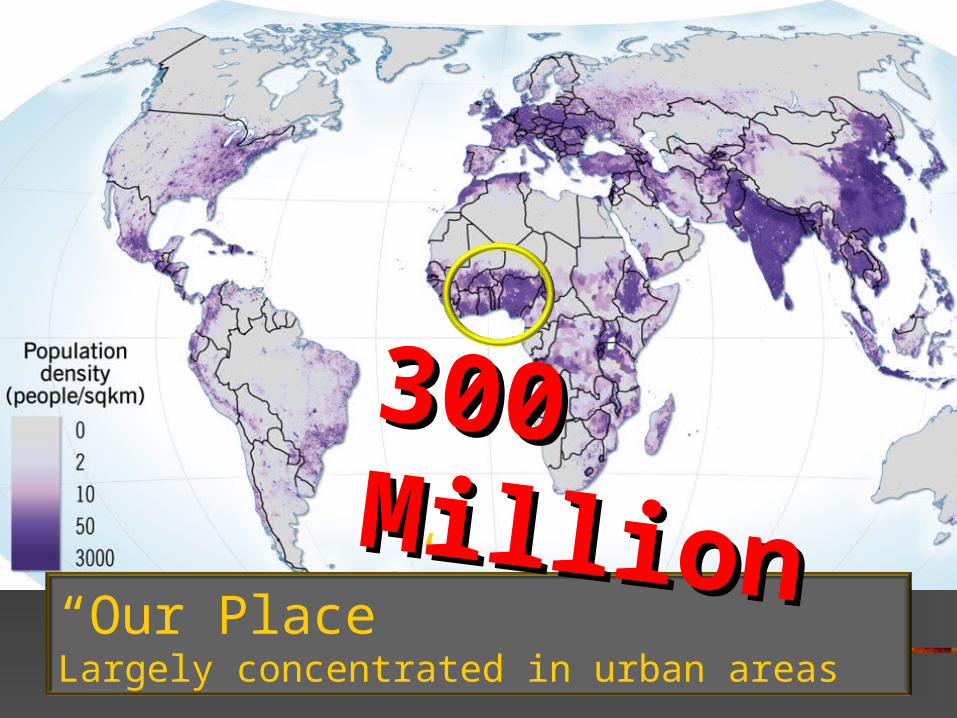
“Our Place”Largely concentrated in urban areas
300 Million300 Million

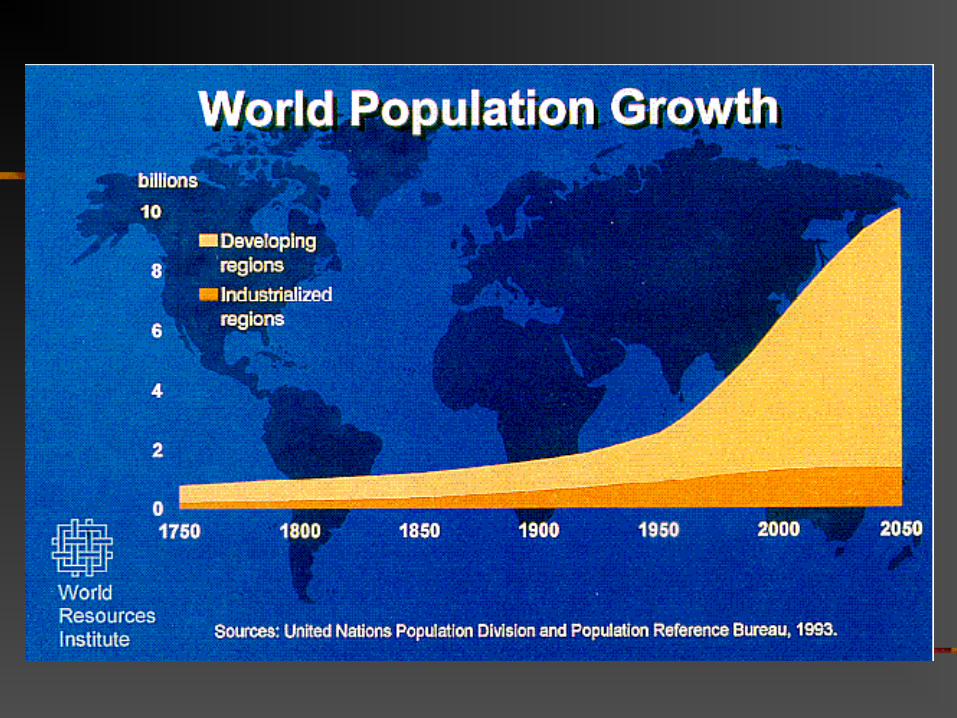
Is the WHOLE world’s
Is the WHOLE world’s
population growing…?
population growing…?

1950 1960 1970 1980 1990 2000 2010 2020
LOW
HIGH
Americans - Caucasians (whites)
Developed countries around the world
America - OVERALL: including minority groups and immigrants
Positive growth
Negative growth
Underdeveloped countries around the world

1950 1960 1970 1980 1990 2000 2010 2020
LOW
HIGH
Developed countries around the world
Underdeveloped countries around the world
ACTIVITY: What is happening to the size of the populations in each of the following?Germany
WHY? Write down 2 ideas why.
Norway
Nigeria
India
Bolivia

Reasons for Positive
Population Growth:
Reasons for Negative
Population Growth:Example countries:
poor economy
poor health care
1) want kids but high infant mortality
poor education
2) Little or no birth control or family planning
People CHOSE to not have many kids,
Is ‘negative’ bad?
Is ‘positiv
e’ good?
25 years ago:
What do people want INSTEAD• money•education•jobs•pets
birth controlWhat ‘technology’ allows them to chose?
Example countries:

Undeveloped Developed20th
Century
21st Century
Under-developed
Emerging
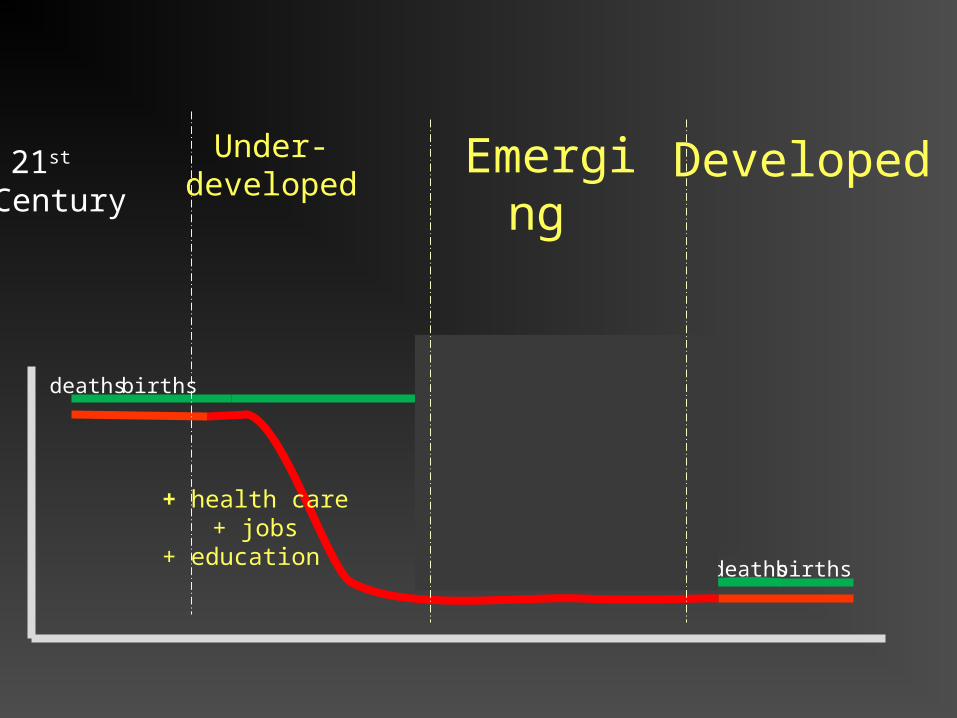
Developed21st Century
Under-developed
Emerging
deaths births
deaths births
+ health care+ jobs
+ education

Video:Ikea boxes explain population growth
http://www.gapminder.org/videos/population-growth-explained-with-ikea-boxes/

1950 1960 1970 1980 1990 2000 2010 2020
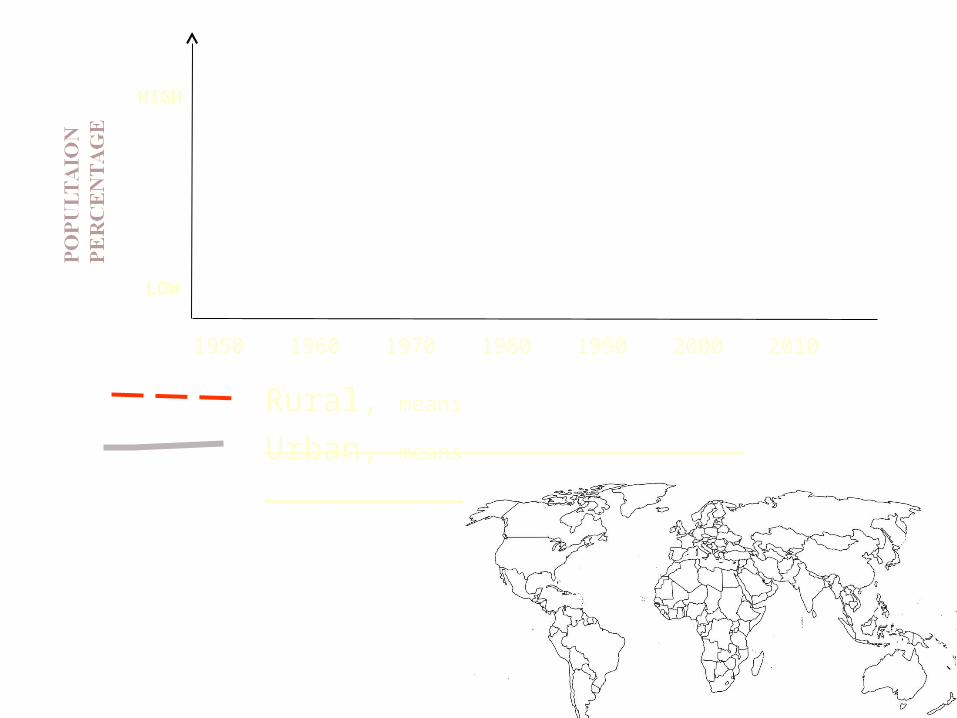
30 %
Rural, means _________________________
Urban, means _________________________
As a country ages, people relocate where they live. Where do people move from, and where do they move to?
Where do most people in the world live in 1950? Rural or Urban?
push/pull factors…?
70 %
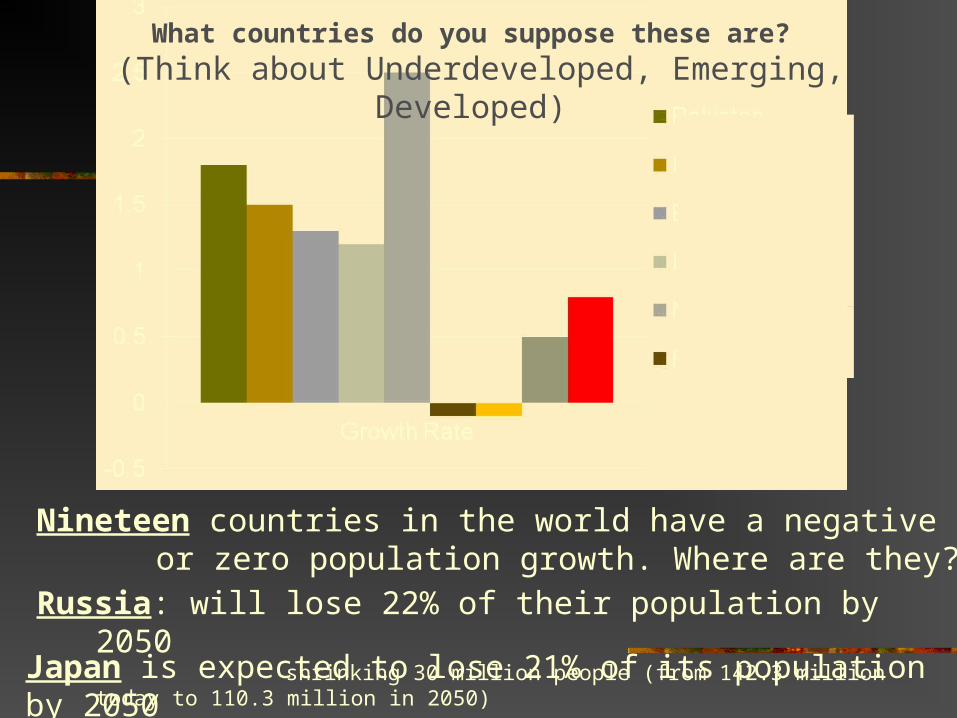
What countries do you suppose these are?
(Think about Underdeveloped, Emerging, Developed)
Nineteen countries in the world have a negative or zero population growth. Where are they?
Russia: will lose 22% of their population by 2050 shrinking 30 million people (from 142.3 million today to 110.3 million in 2050)
Japan is expected to lose 21% of its population by 2050 (shrinking from 127.8 million to a mere 100.6 million in 2050).

Video:200 Countries,
200 Years, 4 minutes
https://www.youtube.com/watch?v=jbkSRLYSojo
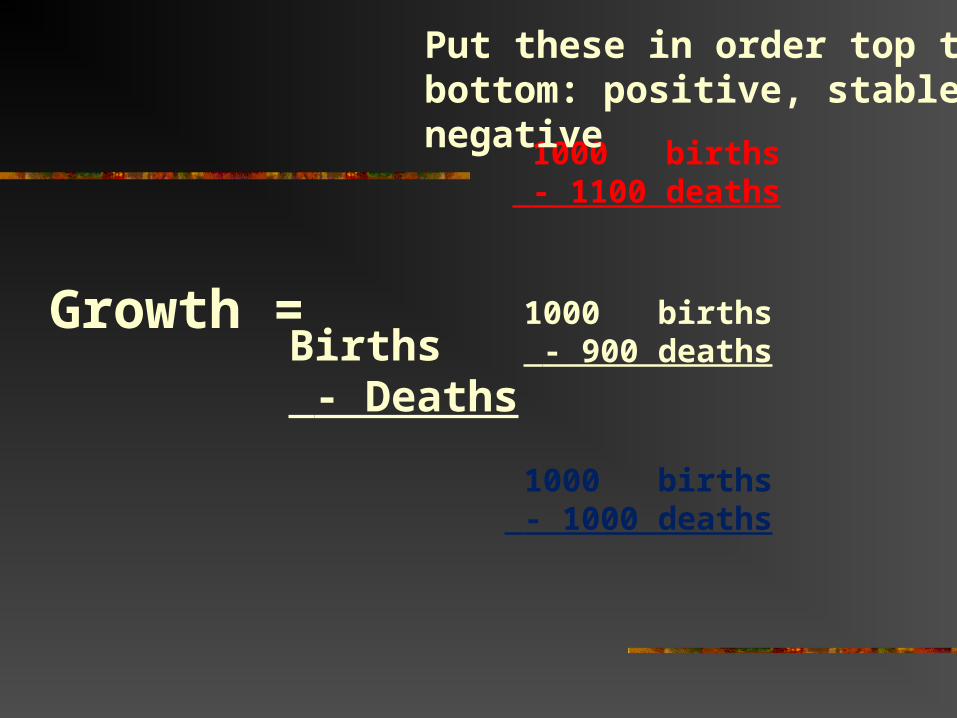
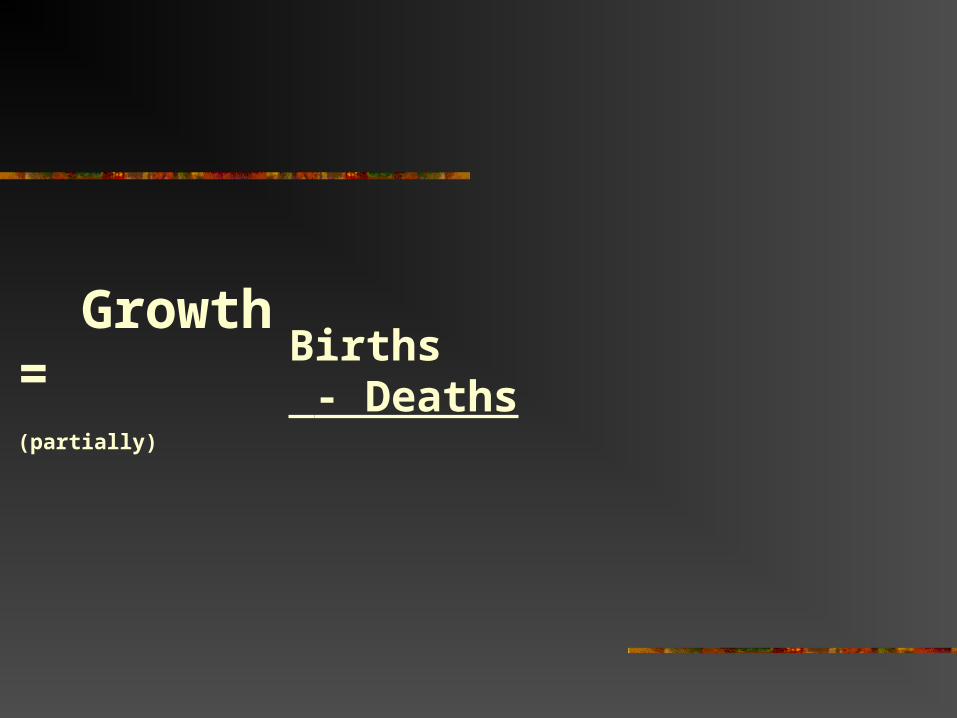
Births - Deaths
Growth =
1000 births - 1100 deaths
1000 births - 900 deaths
1000 births - 1000 deaths
Put these in order top to bottom: positive, stable, negative
Births - Deaths
Growth = (partially)
Births - Deaths
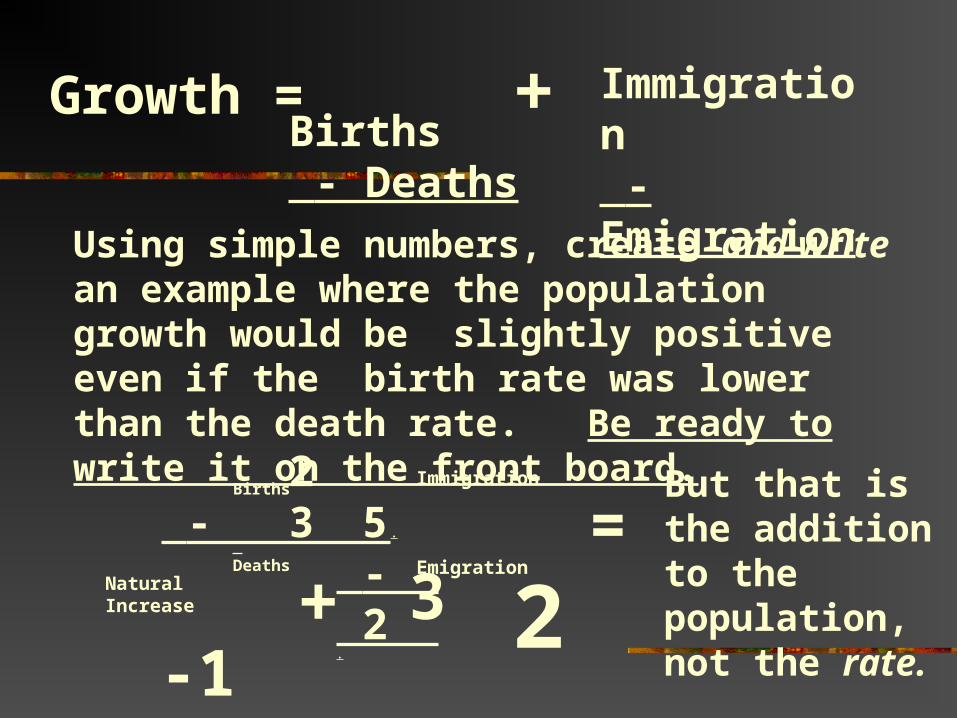
+Growth = Immigration - Emigration
Using simple numbers, create and write an example where the population growth would be slightly positive even if the birth rate was lower than the death rate. Be ready to write it on the front board.
2 - 3 .
5 - 2 .
-1 + 3 = 2
But that is the addition to the population, not the rate.
Births
Deaths
Immigration
Emigration
Natural Increase

Using simple numbers, create and write an example where the population growth would be slightly positive even if the birth rate was lower than the death rate. Be ready to write it on the front board.
2 - 3 .
5 - 2 .
-1 + 3= 2
But that is the addition to the population, not the rate.

Rate means change, so you need to know the PAST population .
Population 2010
2 people
Add in 2011:
2 people
What is growth rate as a %? 100%
New total in 2011:
4 people

How can we How can we SHOWSHOW
changes in population
changes in population
over time? over time?
(positive growth, negative growth,…)
(positive growth, negative growth,…)
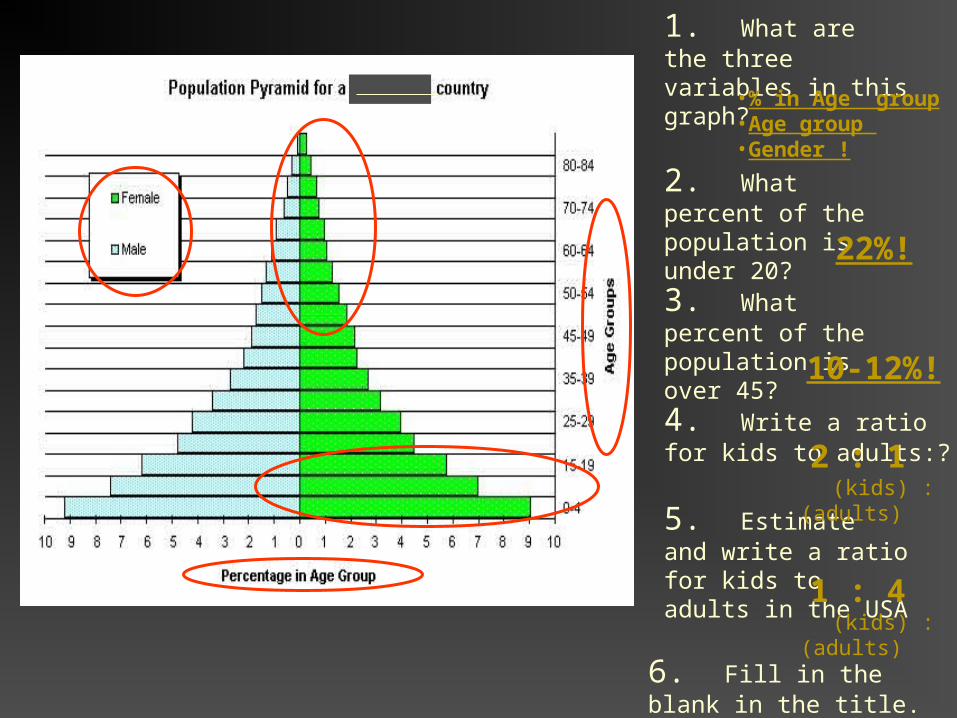
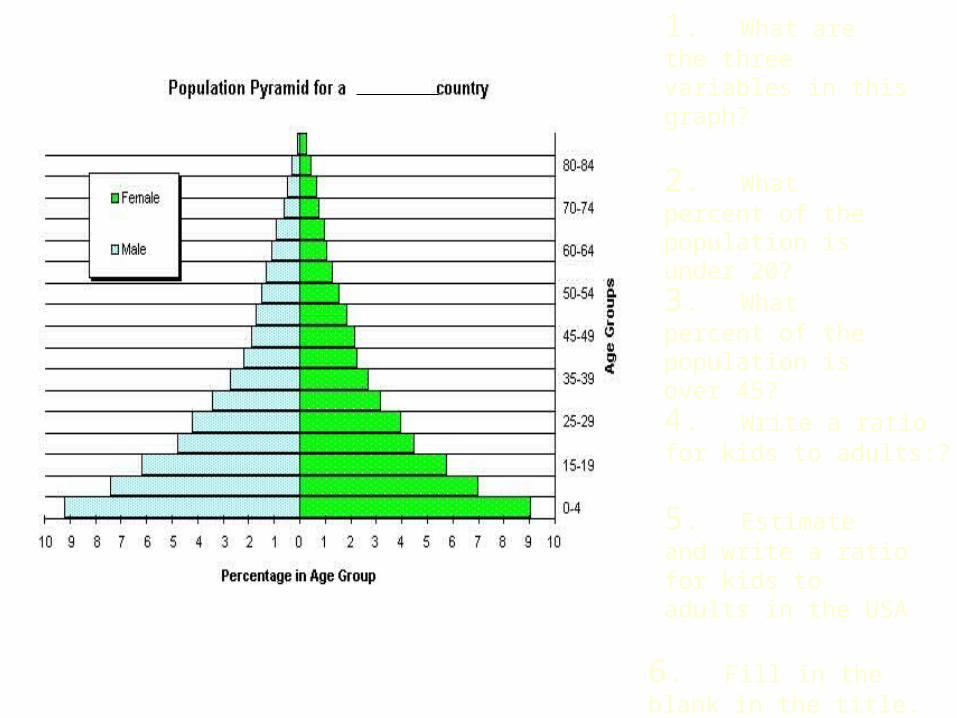
1. What are the three variables in this graph?
2. What percent of the population is under 20?
3. What percent of the population is over 45?
4. Write a ratio for kids to adults:?
5. Estimate and write a ratio for kids to adults in the USA
6. Fill in the blank in the title.
22%!
•% in Age group•Age group •Gender !
10-12%!
2 : 1 (kids) : (adults)
1 : 4 (kids) : (adults)

Population Pyramid
What do the top 2-3 rows tell you about gender?
Where are the “baby boomers” on this pyramid?

Which of these communities is a college town?
Which is a retirement community?
For the bottom left pyramid, explain why the two sides aren’t equal in overall size.
For the bottom right pyramid, what problems might this place have to deal with?

Complete the Population Growth
Activity Sheet

Underdeveloped
(Early stage)
economic stages of development: a Simplistic look
Emerging
(Middle stages)
Developed
(Later stages)
What are most people doing daily to survive?
Agr
icul
ture
(fa
rmin
g)
Agr
icul
ture
Man
ufac
turi
ng
Ag
Man
ufac
turi
ng
Ser
vice
s
White Collar
Blue Collar
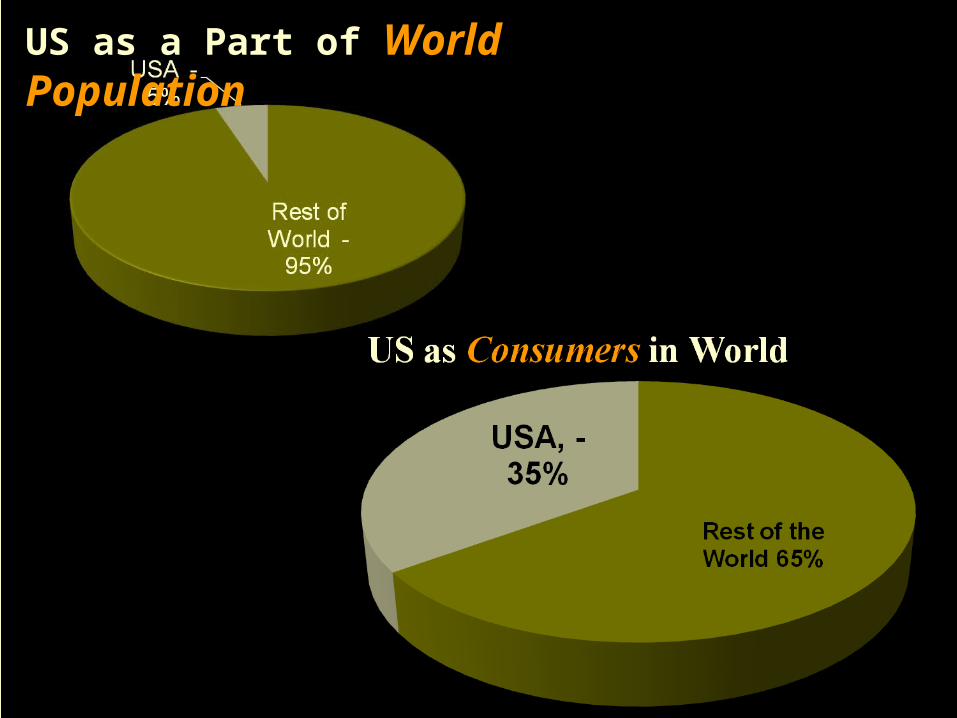
US as a Part of World Population

Developed “North”
Developing “South”Underdeveloped & Emerging

Video:200 Countries,
200 Years, 4 minutes

Do we all live where we
Do we all live where we
WANTWANT to live? to live?
VIDEO:A Life on Hold: The story
of a teenage refugee

Print the following slides for student handouts.

1950 1960 1970 1980 1990 2000 2010 2020
LOW
HIGH
__________________- ____________________
______________countries around the world
America - _________________: including ____________________________
Reasons population declines in developed countries __________________________________________________________________________________________________________________________________________________________________________Reasons population increases underdeveloped or emerging countries __________________________________________________________________________________________________________________________________________________________________________

Reasons for Positive
Population Growth:
Reasons for Negative
Population Growth:Example countries:
Example countries:

1950 1960 1970 1980 1990 2000 2010
LOW
HIGH
Rural, means _________________________
Urban, means _________________________
1. What are the three variables in this graph?
2. What percent of the population is under 20?
3. What percent of the population is over 45?
4. Write a ratio for kids to adults:?
5. Estimate and write a ratio for kids to adults in the USA
6. Fill in the blank in the title.

Which of these communities is a college town?
Which is a retirement community?
For the bottom left pyramid, explain why the two sides aren’t equal in overall size.
For the bottom right pyramid, what problems might this place have to deal with?