the paraventricular thalamus is a critical thalamic area ... · thalamus, show disturbances of...
TRANSCRIPT

REPORT◥
NEUROSCIENCE
The paraventricular thalamus is acritical thalamic area for wakefulnessShuancheng Ren1*, Yaling Wang1*, Faguo Yue1,2*, Xiaofang Cheng1, Ruozhi Dang1,Qicheng Qiao1, Xueqi Sun1, Xin Li1, Qian Jiang2, Jiwei Yao3, Han Qin3,Guanzhong Wang1, Xiang Liao3, Dong Gao2, Jianxia Xia1, Jun Zhang1, Bo Hu1,Junan Yan3, Yanjiang Wang4, Min Xu5, Yunyun Han6, Xiangdong Tang7,Xiaowei Chen3†, Chao He1†, Zhian Hu1†
Clinical observations indicate that the paramedian region of the thalamus is a critical nodefor controlling wakefulness. However, the specific nucleus and neural circuitry for thisfunction remain unknown. Using in vivo fiber photometry or multichannelelectrophysiological recordings in mice, we found that glutamatergic neurons of theparaventricular thalamus (PVT) exhibited high activities during wakefulness. Suppressionof PVT neuronal activity caused a reduction in wakefulness, whereas activation of PVTneurons induced a transition from sleep to wakefulness and an acceleration of emergencefrom general anesthesia. Moreover, our findings indicate that the PVT–nucleus accumbensprojections and hypocretin neurons in the lateral hypothalamus to PVT glutamatergicneurons’ projections are the effector pathways for wakefulness control. These resultsdemonstrate that the PVT is a key wakefulness-controlling nucleus in the thalamus.
Patients with occlusion of the paramedianthalamic artery, which results in localizedinjury to the paramedian region of thethalamus, show disturbances of conscious-ness ranging from hypersomnolence to
sleep-like coma when injuries are bilateral (1–4),a clinical feature not observed in other thalamicinjuries (2). The homologous area of the primateparamedian thalamus in rodents consists of alarge number of nuclei, including the paraven-tricular thalamus (PVT), nucleus reuniens, medio-dorsal nucleus, and interanteromedial thalamicnucleus (5, 6). These nuclei have distinct inputand output connections (6–8) and participate invarious brain functions (5, 9, 10). However, thespecific nucleus and circuitry controlling wake-fulness have not yet been identified.We began by visualizing an unbiased map of
c-fos expression in the paramedian thalamusafter a period of wakefulness or sleep in mice.
We observed a higher level of c-fos expressionin the PVT than in the other nuclei of the para-median thalamus at zeitgeber time 18 (ZT 18;24:00) and after extended wakefulness (fig. S1).To further examine the in vivo dynamics of PVTneurons during the sleep-wake cycle, we injectedadeno-associated virus (AAV) expressing the ge-netically encoded Ca2+ sensor GCaMP6f under thecontrol of the CaMKIIa promoter (PVT neuronsare primarily glutamatergic neurons) (11) intothe PVT (fig. S2, A and B). The population Ca2+
activity was significantly higher during wake-fulness than during sleep. The population Ca2+
activity of the PVT began to increase ahead ofsigns of behavioral arousal (fig. S2, C to H). Wenext performed in vivo multichannel electro-physiological recordings to monitor the spikefiring of individual PVT neurons in freely be-having mice (Fig. 1A). The vast majority (20/22)of PVT neurons exhibited a higher firing rateduring wakefulness than during sleep (Fig. 1, Band C). The PVT firing rate gradually decreasedbefore sleep onset and increased during transi-tions from sleep to wakefulness. At the onset ofbehavioral arousal from non–rapid eye move-ment (NREM) sleep, the mean firing rate reached7.1 Hz (Fig. 1, D to F). In a considerable fractionof neurons (25%), the firing rate exceeded 10 Hz(fig. S3). The increase of PVT neuronal firingoccurred briefly before both cortical activation(1.0 ± 0.3 s) and behavioral arousal (1.4 ± 0.3 s).We next determined the necessity of PVT ac-
tivity for wakefulness by inhibiting PVT gluta-matergic neurons chemogenetically with AAVencoding engineered Gi-coupled hM4D receptor(AAV-CaMKIIa-hM4D-mCherry) (Fig. 1G). Whole-cell recordings of PVT neurons from acute brain
slices confirmed that clozapine-N-oxide (CNO,5 mM) potently inhibited hM4D-expressing PVTneurons (fig. S4). At the beginning of the darkphase (ZT 12; 18:00), CNO injection induced asignificant reduction in wakefulness relative tothe mCherry and saline controls (Fig. 1, H andI, and fig. S6A), which was primarily due toshortened duration of wakefulness episodes andincreased sleep episodes (fig. S5). In addition,spectral analysis of electroencephalography (EEG)showed that CNO injection increased the highdelta power (2 to 4 Hz) of wakefulness at hour2 after CNO injection (figs. S6 and S7). Note thatinhibition of the PVT increased the number ofmicro-arousals (fig. S8, A and B), which mightresult from a fragmentation of wakefulness. Incontrast, CNO injection at the beginning of thelight phase (ZT 0; 6:00) did not further reducewakefulness (fig. S9, A, D, and G). The EEGpower spectrum for each state and the numberof micro-arousals during the light phase werenot affected by CNO injection (figs. S8C and S9).We next explored the role of the PVT in con-
trolling wakefulness by ablating PVT glutama-tergic neurons. We injected a mixture of AAVencoding diphtheria toxin A (AAV-DIO-DTA)and AAV-CaMKIIa-Cre-GFP into the PVT. PVTglutamatergic neurons were selectively ablatedafter 4 weeks of virus injection (fig. S10A). Ani-mals with chronic PVT lesion showed a decreaseof wakefulness during the dark phase, with areduction in duration of wakefulness episodesand an increase in NREM sleep episodes andmicro-arousals, whereas lesion of the PVT didnot affect wakefulness during the light phase(fig. S10, B to G). DTA lesion increased theEEG high delta power (2 to 4 Hz) of wakeful-ness during the dark phase. This lesion alsocaused an increase in the low theta power (4 to7 Hz) (fig. S10, H to L), which might reflect acompensatory mechanism during chronic abla-tion of neurons induced by DTA. In addition,we also injected ibotenic acid to rapidly ablatePVT neurons within several days (Fig. 1J andfig. S11A). Acute PVT lesion reduced wakefulnessduring the dark phase but did not affect wake-fulness during the light phase (Fig. 1K and fig.S11, B and C). Lesion of the PVT caused fragmen-tation of wakefulness, which was indicated byshortened duration of wakefulness episodes andby increased sleep bouts and micro-arousalsduring the dark phase. In contrast to chroniclesion, ibotenic acid lesion increased the EEGhigh delta power (2 to 4 Hz) but not the thetapower, indicating a more typical damage to thewakefulness state (Fig. 1L, fig. S11, D to J, andmovie S1).We then used optogenetics to examine the
causal role of the PVT in wakefulness control.We injected AAV expressing channelrhodopsin2 (AAV-CaMKIIa-ChR2-mCherry) into the PVT(Fig. 2A). Functional expression of ChR2 wasverified by in vitro electrophysiology (Fig. 2B).We applied optical stimulation (lasting 20 s)after the onset of stable NREM or REM sleepduring the light phase. Optical stimulation ofPVT glutamatergic neurons during NREM sleep
RESEARCH
Ren et al., Science 362, 429–434 (2018) 26 October 2018 1 of 6
1Department of Physiology, Collaborative Innovation Centerfor Brain Science, Third Military Medical University, Chongqing400038, China. 2Department of Sleep and Psychology,Daping Hospital, Third Military Medical University, Chongqing400042, China. 3Brain Research Center, Third Military MedicalUniversity, Chongqing 400038, China. 4Department ofNeurology, Daping Hospital, Third Military Medical University,Chongqing 400042, China. 5Institute of Neuroscience, StateKey Laboratory of Neuroscience, Shanghai Institutes forBiological Sciences, Chinese Academy of Sciences, Shanghai200031, China. 6Department of Neurobiology, School of BasicMedicine and Tongji Medical College, Huazhong University ofScience and Technology, Wuhan 430030, China. 7SleepMedicine Center, Laboratory of Anaesthesia and Critical CareMedicine, Translational Neuroscience Center, West ChinaHospital, Sichuan University, Chengdu 610041, China.*These authors contributed equally to this work.†Corresponding author. Email: [email protected] (X.C.);[email protected] (C.H.); [email protected] (Z.H.)
on January 16, 2020
http://science.sciencemag.org/
Dow
nloaded from

reliably induced transitions to wakefulness in afrequency-dependent manner (Fig. 2, C and D).Optical stimulation of the PVT at a shorterduration (lasting 5 s) was still sufficient to in-duce such transitions (fig. S12). Optical stim-
ulation also induced transitions to wakefulnessfrom REM sleep (fig. S13, A and B). Opticalstimulation significantly increased the probabilityof wakefulness, along with a complementarydecrease of both NREM and REM sleep pro-
bability, relative to the mCherry control (Fig. 2Eand fig. S13, C and D). We also delivered pro-longed optical stimulation to test the ability ofPVT neurons in maintaining wakefulness (fig.S14A). Such optical stimulation resulted in an
Ren et al., Science 362, 429–434 (2018) 26 October 2018 2 of 6
Fig. 1. PVTglutama-tergic neurons arerequired for the con-trol of wakefulness.(A) Schematicconfiguration of invivo multichannelelectrophysiologicalrecordings. Left inset:A brain slice from amouse with electrodesimplanted in thePVT. White arrow indi-cates the electrodetrack. Red circle indi-cates the recordingposition. Right inset:Waveforms from arecorded PVTneuron. (B) EEG,electromyography(EMG), and PVT unitrecording tracesduring wakefulness,NREM sleep, and REMsleep. (C) Averagefiring rate of PVT neu-rons in each state.(D to F) Firing rate ofPVT neurons duringstate transitions:wake-to-NREM (D),NREM-to-wake (E),and REM-to-wake (F).Top: Example raster-grams of a PVT neu-ron during five trials ofdifferent state transi-tions. Bottom left:Average firing rateduring the statetransition period.Bottom right: Averagefiring rate of 8 sbefore and after statetransitions. (G) Top:Schematic of virusinjection and EEG-EMG recordings.Bottom: Imageshowing the expres-sion of hM4D-mCherry in PVTneurons. (H) EEG-EMG traces andhypnograms during3 hours after saline or CNO (1 mg/kg) injection in an hM4D-mCherrymouse. (I) Percentage of time spent in each state during 3 hours afterinjection. (J) Image showing NeuN (neuron-specific nuclear protein)staining from a mouse with PVT lesion using ibotenic acid (Ibo). (K) Hourlypercentage of time spent in wakefulness across the 24-hour sleep-wake
cycle. L, light phase; D, dark phase. (L) Left: Raw EEG-EMG traces ofwakefulness. Right: Normalized EEG power density of wakefulness duringthe dark phase. Inset in (L) is a quantitative analysis of the power indifferent frequency bands. *P < 0.05, **P < 0.01, ***P < 0.001. Error barsdenote SEM. See table S1 for further details of statistical data analysis.
RESEARCH | REPORTon January 16, 2020
http://science.sciencemag.org/
Dow
nloaded from
Ren et al., Science 362, 429–434 (2018) 26 October 2018 3 of 6
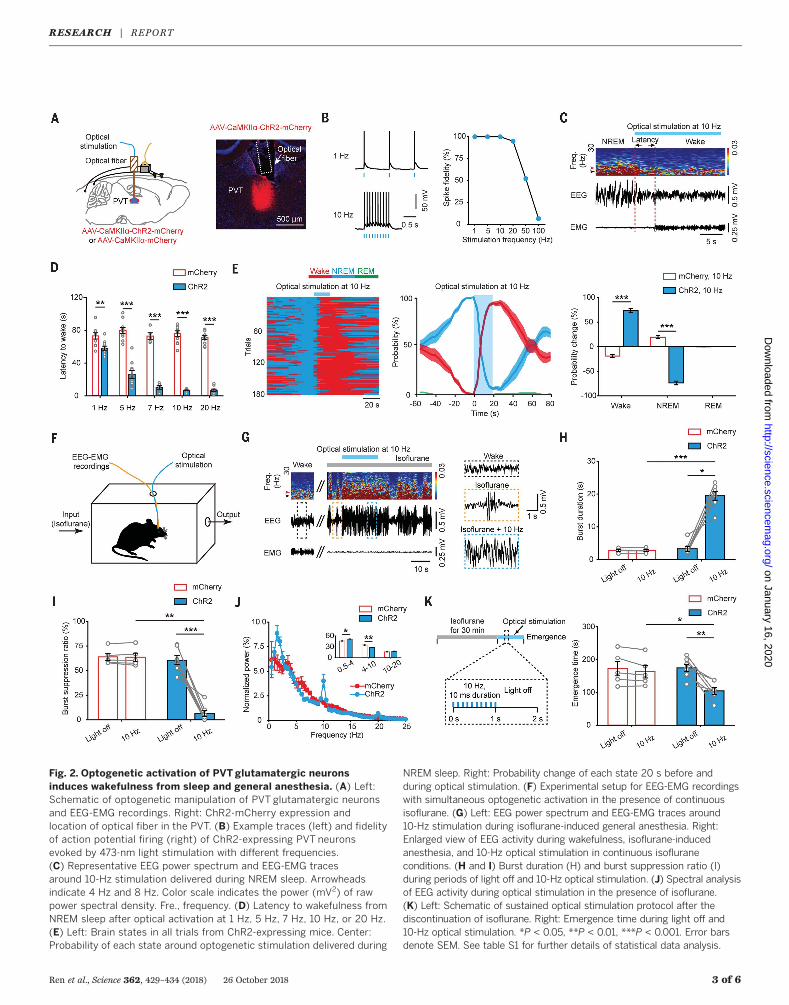
Fig. 2. Optogenetic activation of PVT glutamatergic neuronsinduces wakefulness from sleep and general anesthesia. (A) Left:Schematic of optogenetic manipulation of PVT glutamatergic neuronsand EEG-EMG recordings. Right: ChR2-mCherry expression andlocation of optical fiber in the PVT. (B) Example traces (left) and fidelityof action potential firing (right) of ChR2-expressing PVT neuronsevoked by 473-nm light stimulation with different frequencies.(C) Representative EEG power spectrum and EEG-EMG tracesaround 10-Hz stimulation delivered during NREM sleep. Arrowheadsindicate 4 Hz and 8 Hz. Color scale indicates the power (mV2) of rawpower spectral density. Fre., frequency. (D) Latency to wakefulness fromNREM sleep after optical activation at 1 Hz, 5 Hz, 7 Hz, 10 Hz, or 20 Hz.(E) Left: Brain states in all trials from ChR2-expressing mice. Center:Probability of each state around optogenetic stimulation delivered during
NREM sleep. Right: Probability change of each state 20 s before andduring optical stimulation. (F) Experimental setup for EEG-EMG recordingswith simultaneous optogenetic activation in the presence of continuousisoflurane. (G) Left: EEG power spectrum and EEG-EMG traces around10-Hz stimulation during isoflurane-induced general anesthesia. Right:Enlarged view of EEG activity during wakefulness, isoflurane-inducedanesthesia, and 10-Hz optical stimulation in continuous isofluraneconditions. (H and I) Burst duration (H) and burst suppression ratio (I)during periods of light off and 10-Hz optical stimulation. (J) Spectral analysisof EEG activity during optical stimulation in the presence of isoflurane.(K) Left: Schematic of sustained optical stimulation protocol after thediscontinuation of isoflurane. Right: Emergence time during light off and10-Hz optical stimulation. *P < 0.05, **P < 0.01, ***P < 0.001. Error barsdenote SEM. See table S1 for further details of statistical data analysis.
RESEARCH | REPORTon January 16, 2020
http://science.sciencemag.org/
Dow
nloaded from

overt increase in wakefulness with a decreaseof EEG delta power (fig. S14, B to F).To investigate whether activation of PVT neu-
rons is sufficient to induce wakefulness from anunconscious state—a typical feature of patientswith paramedian thalamic stroke (4)—we opti-cally activated PVT neurons in mice under gen-eral anesthesia induced by isoflurane (Fig. 2F).When a stable EEG burst-suppression mode (amarker of anesthetic depth) (12) was observed,10-Hz stimulation (lasting 20 s) caused an im-mediate increase in total EEG burst activity. Theincrease in burst activity was accompanied by aprolonged burst duration, a decreased burst sup-pression ratio, and an altered EEG spectrum
(Fig. 2, G to J). Interestingly, a peak at approx-imately 10 Hz appeared in the EEG spectrumwith optical stimulation (Fig. 2J), which mightreflect that optogenetic stimulation at 10 Hzcauses prominent 10-Hz oscillations in cortex.Additionally, sustained activation of PVT neu-rons significantly accelerated the emergence fromisoflurane-induced unconsciousness, which wasnot observed in mCherry mice (Fig. 2K).Recent studies have reported that thalamic
nuclei directly regulate the activities of corticalneurons (13, 14). The PVT also sends brainwideprojections, including direct projections tothe cortex (15). Thus, we next searched forthe PVT downstream pathways mediating the
wakefulness-maintaining effects. ChR2-mCherryexpression indicated that PVT glutamatergicneurons send projections to multiple corticalregions, including the medial prefrontal cortex(mPFC) and insular cortex (fig. S15, A to D). ThePVT sends dense projections to the nucleusaccumbens (NAc) (Fig. 3D), which participates inwakefulness control (16). Bilateral optical stimu-lation of PVT projections to different layers orsubregions of the prelimbic cortex of the mPFCfailed to induce rapid transitions from NREMsleep to wakefulness. Optical stimulation of PVTaxonal terminals in other cortical regions, in-cluding the cingulate cortex and infralimbic cor-tex of the mPFC or the anterior and posterior
Ren et al., Science 362, 429–434 (2018) 26 October 2018 4 of 6
Fig. 3. PVTglutamatergic neurons control wakefulness through thePVT-NAc pathway. (A) Schematic of optogenetic stimulation of ChR2-expressing PVTglutamatergic terminals together with EEG-EMG recordings.(B and C) Latency to wakefulness from NREM and REM sleep afterstimulation of PVT projections to the prelimbic cortex (PL) of the mPFC(B) and to the insular cortex (C) at 1 or 10 Hz. (D) Distribution ofChR2-expressing PVT glutamatergic terminals and location of optical fiberin the NAc. D, dorsal; M, medial; ac, anterior commissure. (E) Latencyto wakefulness from NREM and REM sleep after activation of the PVT-NAcpathway at 1 or 10 Hz. (F) Top left: Experimental paradigm for in vitro
characterization of functional connection of the PVT to NAc. Bottom left:Trace of the single optical stimulation–evoked excitatory postsynapticcurrents (EPSCs) in NAc neurons. Right: Amplitude and latency of opticalstimulation–evoked EPSCs. (G) Top: Experimental design of chemogeneticinhibition of the NAc-projecting PVT neurons. Bottom: Expression ofhM4D-mCherry in NAc-projecting PVT neurons. D3V, dorsal third ventricle.(H) Hypnograms of an hM4D-mCherry mouse during 3 hours aftersaline or CNO injection. (I) Percentage of time spent in each state during3 hours after injection. *P < 0.05, **P < 0.01, ***P < 0.001. Error barsdenote SEM. See table S1 for further details of statistical data analysis.
RESEARCH | REPORTon January 16, 2020
http://science.sciencemag.org/
Dow
nloaded from

part of the insular cortex, had no obvious effectson sleep-wake transition (Fig. 3, A to C, and fig.S15, E and F), although the paramedian thalamuscan excite these cortices via glutamatergic con-nections (17). Moreover, chemogenetic inhibitionof the mPFC-projecting PVT neurons also did notaffect the time spent in wakefulness (fig. S16).Together, our results do not sufficiently supporta crucial role of the PVT-cortex pathway incontrolling wakefulness. However, optical stim-ulation of the PVT-to-NAc projections reliablyelicited transitions to wakefulness from bothNREM and REM sleep (Fig. 3E). In vitro ChR2-assisted circuit mapping (18) confirmed thisfunctional monosynaptic connection (Fig. 3F),indicating that a direct PVT-NAc pathway maymediate the observed transitions. In addition,
chemogenetic inhibition of NAc-projecting PVTneurons significantly reduced wakefulness (Fig. 3,G to I). The importance of this pathway inwakefulness control was further confirmed by thecompromised wakefulness-inducing effects of thePVT after ablation of NAc neurons using ibotenicacid (fig. S17). Manipulation of the PVT-NAcpathway efficiently reproduced the wakefulness-controlling effects of the PVT (fig. S18).Because the PVT receives inputs from the
brainstem and lateral hypothalamus (LH) (19, 20),we next searched for the upstream pathway thatmodulates its wakefulness-maintaining function.We used Cre-dependent rabies virus–mediatedmonosynaptic retrograde tracing in vGlut2-Cremice and found that PVT glutamatergic neu-rons received direct inputs from LH hypocretin
(Hcrt) neurons (fig. S19), which are involved inwakefulness control (21). We specifically sup-pressed inputs from Hcrt neurons by expressingAAV-DIO-hM4D-mCherry in the LH of Hcrt-Cremice and locally applying CNO (5 mM) in the PVT(Fig. 4A). CNO infusion significantly decreasedwakefulness, accompanied by fragmentation ofwakefulness (Fig. 4, B and C, and fig. S20, A to D).Moreover, inhibition of this pathway shortenedNREM sleep latency and increased the numberof NREM sleep episodes (fig. S20, E and F).We then examined the sufficiency of these
inputs for wakefulness control. Optical stimu-lation (20 Hz) of Hcrt neurons’ terminals duringNREM sleep significantly increased the firingrate of PVT neurons (Fig. 4, D and E). At thebehavioral level, apparent transitions from sleep
Ren et al., Science 362, 429–434 (2018) 26 October 2018 5 of 6
Fig. 4. The wakefulness-controlling function of the PVT is regulatedby Hcrt neurons. (A) Left: Schematic of chemogenetic inhibition ofLHHcrt-PVT pathway and EEG-EMG recordings. Right: Selective expressionof hM4D-mCherry in Hcrt neurons in the LH. Arrowhead denotes neuronshown in close-up (inset). (B) Hypnograms of an hM4D-mCherry mouseduring 3 hours after saline or CNO (5 mM) local infusion. (C) Percentageof time spent in each state during 3 hours after injection. (D) Left:Schematic of optogenetic stimulation of LHHcrt-PVTpathway together withPVT unit and EEG-EMG recordings. Right: ChR2-mCherry expression inHcrt neurons in the LH. Arrowhead denotes neuron shown in close-up(inset). (E) Top: Rastergrams showing the firing activity of a PVT neuronbefore and during optical stimulation. Bottom: Optical stimulation of Hcrtneurons’ terminals significantly increased the average firing rate of PVT
neurons. (F) EEG-EMG traces and PVT unit firing around 20-Hz opticalstimulation in a freely moving mouse. (G) Latency to wakefulness fromNREM or REM sleep after optical stimulation at 1 or 20 Hz. (H) The Hcrtreceptor antagonist TCS-OX2-29 attenuated the wakefulness-inducingeffects of optical stimulation of Hcrt neuron’s terminals in the PVT.(I) Model of the PVT control of wakefulness. Left: Increased levels of Hcrtmay activate Hcrt inputs to the PVT, which could excite PVT neuronsprojecting to the NAc, thereby activating NAc neurons to controlwakefulness. Top right: Decreased activity of PVT neurons leads tosleep. Bottom right: The impairment of PVT neurons seen in neurologicaldiseases may be associated with disturbances of wakefulness. *P < 0.05,**P < 0.01, ***P < 0.001. Error bars denote SEM. See table S1 forfurther details of statistical data analysis.
RESEARCH | REPORTon January 16, 2020
http://science.sciencemag.org/
Dow
nloaded from
to wakefulness occurred after stimulation of theLHHcrt-PVT pathway (Fig. 4, F and G, and fig.S21). Optogenetic stimulation of Hcrt neurons’terminals in the PVT could still induce transi-tions from sleep to wakefulness after blockadeof the potential antidromic action potentialsby injection of muscimol into the LH (fig. S22).Such wakefulness-controlling effects were par-tially attenuated by the Hcrt receptor 2 antag-onist TCS-OX2-29 (Fig. 4H). To further confirmthe importance of the LHHcrt-PVT pathway incontrolling wakefulness, we injected viruses ex-pressing hM3D into the LH and hM4D into thePVT, respectively (fig. S23, A and B). Stimulationof Hcrt neurons increased the amount of wake-fulness, whether or not the PVT was chemoge-netically inhibited (fig. S23C). These unexpectedresults might be because the activity of the PVTwas not completely suppressed under the con-dition of activating Hcrt neurons’ terminals.Alternatively, after ablating PVT neurons usingcaspase-3, the latency to wakefulness with opto-genetic stimulation of Hcrt neurons increased,confirming an important role of the LHHcrt-PVTpathway in wakefulness control (fig. S23, D to G).Recently, the PVT in the paramedian thalamus
has been extensively studied because of its in-volvement in multiple behaviors, including fearconditioning (22, 23), drug addiction (24, 25),and feeding (26), all of which require elevatedwakefulness. Our results demonstrate that the
PVT is both necessary and sufficient for the con-trol of wakefulness, and further reveal the im-portant role of the LHHcrt-PVT-NAc pathway inthe control of wakefulness (Fig. 4I). These resultsprovide experimental evidence supporting the PVTas a critical thalamic node in the wakefulness-controlling neural network.
REFERENCES AND NOTES
1. G. Percheron, Z. Neurol. 205, 1–13 (1973).2. J. D. Schmahmann, Stroke 34, 2264–2278 (2003).3. A. Honig et al., J. Clin. Neurosci. 34, 81–85 (2016).4. D. M. Hermann et al., Stroke 39, 62–68 (2008).5. R. P. Vertes, S. B. Linley, W. B. Hoover, Neurosci. Biobehav. Rev.
54, 89–107 (2015).6. H. J. Groenewegen, H. W. Berendse, Trends Neurosci. 17,
52–57 (1994).7. H. Jasper, Electroencephalogr. Clin. Neurophysiol. 1, 405–419 (1949).8. K. E. Krout, R. E. Belzer, A. D. Loewy, J. Comp. Neurol. 448,
53–101 (2002).9. W. Xu, T. C. Südhof, Science 339, 1290–1295 (2013).10. Y. D. Van der Werf, M. P. Witter, H. J. Groenewegen, Brain Res.
Rev. 39, 107–140 (2002).11. C. Frassoni, R. Spreafico, M. Bentivoglio, Exp. Brain Res. 115,
95–104 (1997).12. P. C. Vijn, J. R. Sneyd, Br. J. Anaesth. 81, 415–421 (1998).13. S. Honjoh et al., Nat. Commun. 9, 2100 (2018).14. T. C. Gent, M. Bandarabadi, C. G. Herrera, A. R. Adamantidis,
Nat. Neurosci. 21, 974–984 (2018).15. R. P. Vertes, W. B. Hoover, J. Comp. Neurol. 508, 212–237 (2008).16. Y. J. Luo et al., Nat. Commun. 9, 1576 (2018).17. P. M. Fogerson, J. R. Huguenard, Neuron 92, 687–704 (2016).18. L. Petreanu, D. Huber, A. Sobczyk, K. Svoboda, Nat. Neurosci.
10, 663–668 (2007).19. S. Li, G. J. Kirouac, Brain Struct. Funct. 217, 257–273 (2012).20. G. J. Kirouac, M. P. Parsons, S. Li, Brain Res. 1059, 179–188
(2005).
21. J. Li, Z. Hu, L. de Lecea, Br. J. Pharmacol. 171, 332–350 (2014).22. M. A. Penzo et al., Nature 519, 455–459 (2015).23. F. H. Do-Monte, K. Quiñones-Laracuente, G. J. Quirk,
Nature 519, 460–463 (2015).24. Y. Zhu, C. F. Wienecke, G. Nachtrab, X. Chen, Nature 530,
219–222 (2016).25. G. J. Kirouac, Neurosci. Biobehav. Rev. 56, 315–329 (2015).26. X. Zhang, A. N. van den Pol, Science 356, 853–859 (2017).
ACKNOWLEDGMENTS
We thank L. de Lecea for providing the Hcrt-Cre mice, andM. M. Luo and Y. M. Lu for critical comments on the manuscript.Funding: Supported by the National Natural Science Foundationof China (31771192 to Z.H., 31500862 to C.H., and 81671106to X.W.C.) and “973 Program” (2015CB759500 to X.W.C.).Author contributions: S.R., C.H., and Z.H. designed the study;S.R., Y.L.W., F.Y., X.F.C., R.D., Q.Q., H.Q., J.W.Y., J.A.Y., G.W.,X. Li, Y.J.W., and C.H. executed the experiments and performedstatistical analysis; Q.J., X.S., X. Liao, D.G., J.X., J.Z., B.H., X.T.,and X.W.C. analyzed the data; S.R., C.H., and Z.H. wrote thepaper with the help of Y.J.W., M.X., Y.H., X.T., and X.W.C.;and all authors read and commented on the manuscript. Z.H.supervised all aspects of the project. Competing interests: Theauthors declare no competing interests. Data and materialsavailability: All data necessary to understand and assess theconclusions of this manuscript are available in the paper and thesupplementary materials.
SUPPLEMENTARY MATERIALS
www.sciencemag.org/content/362/6413/429/suppl/DC1Materials and MethodsFigs. S1 to S25Table S1References (27–40)Movie S1
8 March 2018; accepted 6 September 201810.1126/science.aat2512
Ren et al., Science 362, 429–434 (2018) 26 October 2018 6 of 6
RESEARCH | REPORTon January 16, 2020
http://science.sciencemag.org/
Dow
nloaded from

The paraventricular thalamus is a critical thalamic area for wakefulness
Min Xu, Yunyun Han, Xiangdong Tang, Xiaowei Chen, Chao He and Zhian HuJiwei Yao, Han Qin, Guanzhong Wang, Xiang Liao, Dong Gao, Jianxia Xia, Jun Zhang, Bo Hu, Junan Yan, Yanjiang Wang, Shuancheng Ren, Yaling Wang, Faguo Yue, Xiaofang Cheng, Ruozhi Dang, Qicheng Qiao, Xueqi Sun, Xin Li, Qian Jiang,
DOI: 10.1126/science.aat2512 (6413), 429-434.362Science
, this issue p. 423, p. 429Sciencecoupled with wakefulness.from neurons in the paraventricular thalamus and observed that both population and single-neuron activity were tightly
recordedet al.information and contributes to the sleep-wake cycle through its interactions with the cerebral cortex. Ren novelty, and surprise. The nucleus thus provides context-dependent salience encoding. The thalamus gates sensoryparaventricular thalamic neurons represent multiple salient features of sensory stimuli, including reward, aversiveness,
found thatet al.internal states with the limbic forebrain that performs associative functions in emotional contexts. Zhu The paraventricular thalamus is a relay station connecting brainstem and hypothalamic signals that represent
A close view of the paraventricular thalamus
ARTICLE TOOLS http://science.sciencemag.org/content/362/6413/429
MATERIALSSUPPLEMENTARY http://science.sciencemag.org/content/suppl/2018/10/24/362.6413.429.DC1
REFERENCES
http://science.sciencemag.org/content/362/6413/429#BIBLThis article cites 39 articles, 6 of which you can access for free
PERMISSIONS http://www.sciencemag.org/help/reprints-and-permissions
Terms of ServiceUse of this article is subject to the
is a registered trademark of AAAS.ScienceScience, 1200 New York Avenue NW, Washington, DC 20005. The title (print ISSN 0036-8075; online ISSN 1095-9203) is published by the American Association for the Advancement ofScience
Science. No claim to original U.S. Government WorksCopyright © 2018 The Authors, some rights reserved; exclusive licensee American Association for the Advancement of
on January 16, 2020
http://science.sciencemag.org/
Dow
nloaded from