the llanos low-level jet and its association with venezuelan convective precipitation...
TRANSCRIPT
The Llanos Low-Level Jet and its Association with Venezuelan Convective Precipitation
Rebekah J. LaBar National Weather Center Research Experiences for Undergraduates
Central Washington University, Ellensburg, WA
Mentors Michael Douglas, NOAA National Severe Storms Laboratory
Javier Murillo, Cooperative Institute for Mesoscale Meteorological Studies, University of Oklahoma
John Freddy Mejia, Cooperative Institute for Mesoscale Meteorological Studies, University of Oklahoma
National Weather Center Research Experiences for Undergraduates Final Project
10 August 2005 Corresponding author address:
Rebekah J. LaBar 5500 Tjossem Rd.
Ellensburg, WA 98926 (509) 968-3276

Abstract
Low-level jets play an important role in transporting moisture and heat from one
location to another. The NCEP North American Regional Reanalysis indicates the
existence of a nocturnal low-level jet over the central Venezuelan plains, known as the
Llanos, during the austral summer. Pilot balloon observations taken at San Fernando de
Apure, Venezuela are used to validate the reanalysis data and verify the time of year and
altitude at which upper-air Llanos wind speeds are greatest. Vertical profiles of pilot
balloon-observed and regional reanalysis-estimated wind speeds during the dry and wet
seasons of 2001 to 2004 show good agreement. Deep convection was expected to occur
near the exit region of the Llanos low-level jet, close to the average position of the
intertropical convergence zone during the austral winter. Cloud-top temperature
frequency composites of northern South America during strong and weak low-level jet
events in the dry and wet seasons are constructed to show that a strong Llanos jet is
associated with deep convection in the southern Llanos.
1. Introduction
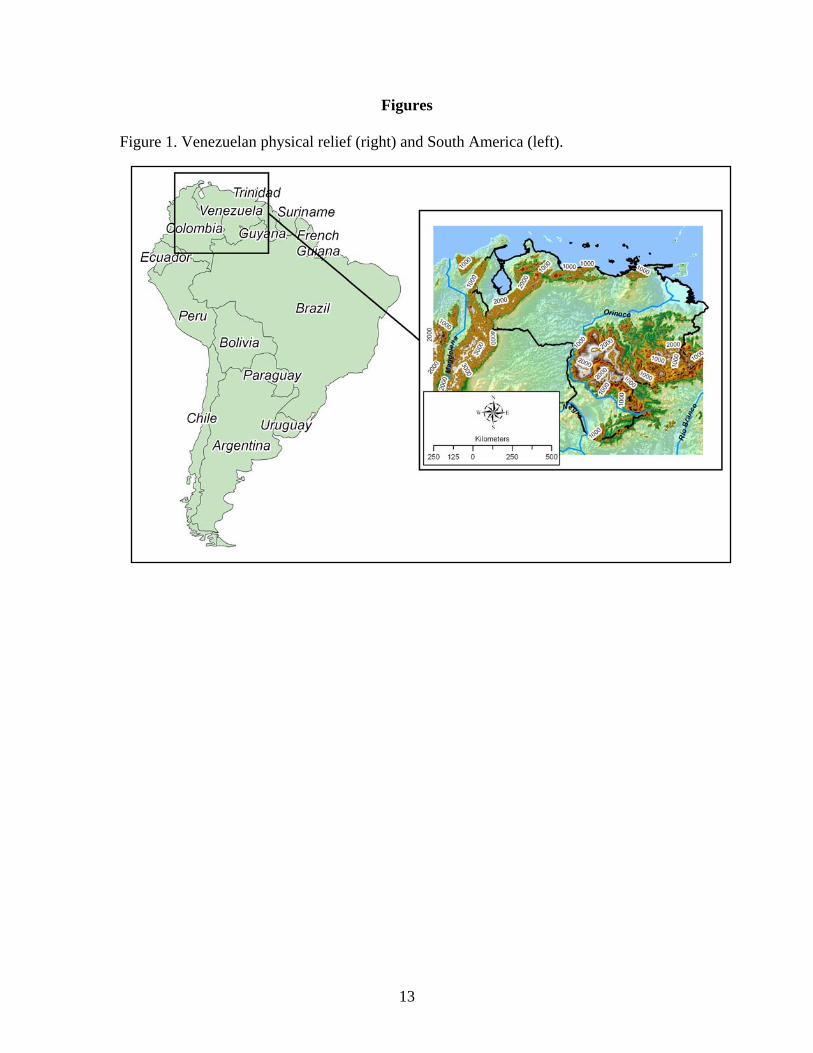
The South American Llanos, tropical savannah covering most of central
Venezuela and east central Colombia, lie approximately between 3oN to 9oN and 63oW to
73oW at an altitude of less than 300 meters above sea level. The Venezuelan Llanos, also
known as the Orinoco River Plains, are bordered by the coastal Cordillera de Mérida
(northeastern branch of the Andes Mountains) to the northwest, the Cordillera de la Costa
to the north, the Caribbean Sea to the northeast, the Guiana Highlands to the southeast,
and the Colombian Llanos and Amazon rainforest to the south (Figure 1). As the Llanos’
tropical wet and dry climate is warm throughout the year, it is classified by precipitation
2
rather than temperature. Venezuelan summer is considered to be the dry season of
November through April while Venezuelan winter is considered to be the wet season of
May through October (Figure 2).
During the dry season (austral summer), the region of maximum precipitation
commonly referred to as the intertropical convergence zone (ITCZ) migrates southward
and allows the northeast trade winds to gain strength over Venezuela. Responding to the
stronger pressure gradient between the subtropical high over the Atlantic and the low
pressure over Amazonia, the trade winds flow from the northeast to the southwest over
Venezuela. It is hypothesized that the northeast trades undergo topographic channeling
between the Cordillera de la Costa and the Guiana Highlands, and strengthen as a result
(Vernekar et al. 2003). Heating and cooling of the Llanos produces changes in the
vertical mixing of the air’s horizontal momentum, resulting in a thin layer of strong
winds known as a low-level jet (LLJ) in the early morning hours. This jet is strongest
near sunrise and weakens throughout the day, as daytime heating mixes the winds
vertically through a deep layer.
Vernekar et al. (2003) have studied various LLJs in South America and their
influence on the austral summer climate; they found areas experiencing a nocturnal LLJ
simultaneously experience nocturnal rainfall maxima. Low-level jets play an important
role in transporting moisture and heat from one location to another, and can promote deep
convection at the surface near the jet’s exit region (Stensrud 1996). Factors causing
summer precipitation in the Llanos are largely unstudied and as such unknown; however,
observations made in similar regions of South America (Marengo et al. 2004; Vernekar et
al. 2003) lead us to believe that the intersection of the nocturnal Llanos LLJ’s exit region
3
with the ITCZ during the wet season (austral winter, when the ITCZ migrates northward)
may be associated with convective precipitation over southwest Venezuela.
The National Centers for Environmental Prediction (NCEP) North American
Regional Reanalysis (NARR) indicates the development of this dry season LLJ in the
early morning is likely the result of the aforementioned topographical and climatological
factors. Pilot balloon observations taken since 2001 as part of the Pan-American Climate
Studies Sounding Network (PACS-SONET) and LlanoJet studies in the central
Venezuelan Llanos have verified the existence of the Llanos LLJ (Douglas et al. 2005).
Presented in this paper is an analysis of pilot balloon soundings, reanalysis data,
and satellite images to investigate how well the NARR simulates actual upper air winds
over the Llanos and to determine if the Llanos LLJ promotes or rather inhibits
Venezuelan convective precipitation, for the ultimate purpose of improving reanalysis
products for future climate research and forecasts. Section 2 will describe the background
and context of this research project within the larger PACS-SONET project. Section 3
will expand on the details of pilot balloon data collection and the reanalysis data and
satellite imagery used. Section 4 will explain the Interactive Data Language (IDL) data
processing methods. Section 5 will analyze the reanalysis and imagery results and section
6 will make some concluding remarks.
2. PACS-SONET Project
The Pan-American Climate Studies Sounding Network (PACS-SONET) is a
NOAA-funded research project that began in 1997 by establishing 12 pilot balloon
stations from Mexico to Peru. The goals of the project were to determine the upper-air
wind circulations associated with wet and dry spells in the rainy season of Central
4

America, to validate reanalysis products commonly used in tropical climate studies of
data-poor regions, and ultimately to arrive at a better understanding of global climate
processes (Douglas et al. 2004).
The PACS-SONET project has since expanded, with more pilot balloon stations
established across Latin America, including the San Fernando station in Venezuela in
2001. One of the smaller studies conducted within the PACS-SONET project was the
LlanoJet experiment (Douglas et al. 2005). One radiosonde and six pilot balloon stations
were set up for five days in March 2005 to augment the already existing San Fernando
station, in order to study the diurnal variation and horizontal and vertical structure of the
low-level jet that had been observed over San Fernando for the previous four years.
Furthermore, researchers sought to further validate the regional reanalysis products that
similarly showed a low-level jet over the Venezuelan Llanos.
3. Data
Pilot balloon soundings were taken at 1200 UTC (8am local standard time) at San
Fernando de Apure, Venezuela, from March 2001 to May 2005. Despite fairly good
temporal continuity at this station, a few months of data are missing, the largest gap being
from November 2002 to mid-March 2003. The pilot balloons used for this study are
relatively small, 30-gram red or white balloons typically filled with hydrogen. After their
release, the balloons are tracked visually with a theodolite while an observer records the
balloons’ elevation and azimuth angles in addition to the observation time. These three
variables plus the ascent rate of the balloon (which is assumed to be constant throughout
the observational period) are then used to calculate the upper-air wind speed and
direction at different heights. One of the disadvantages of good pilot balloons
5
observations when compared to radiosondes is their dependence on clear skies; if it is
cloudy, the pilot balloon is too easily lost in the clouds and cannot be visibly tracked to
high altitudes. Another disadvantage is the estimation of the pilot balloon ascent rate
based on the balloon’s size and the type of gas used to fill the balloon. The ascent rate is
assumed to be constant, which may not always be the case. Radiosonde ascent rates are
more easily and accurately determined. On the other hand, pilot balloons are more
portable and much less expensive than radiosondes; the cost of pilot balloon observations
is typically only 10% that of radiosonde observations.
As we did not have access to directly measured daily rain data for Venezuela, we
inferred the location and extent of convective precipitation from cloud-top temperature
frequency composites based on high-resolution infrared satellite images. Four satellite
sectors were available: Caribbean (GOES-12), Full Disk (GOES-8 and GOES-12), Brazil
(GOES-8 and GOES-12), and Peru (GOES-8 and GOES-12). There were tradeoffs to
consider in spatial and temporal resolution and coverage by using any one of these
sectors. The Caribbean sector, available from March 2004 to the present, has a good
temporal resolution of thirty minutes and a spatial resolution of four kilometers for
infrared images. However, the sector covers the Caribbean Sea, part of Central America,
and only the northern half of Venezuela. The “Full Disk” sector, available from April
2002 to April 2004 and including the entire western hemisphere centered on South
America, similarly has a spatial resolution of four kilometers for infrared images.
However, this sector has a much coarser temporal resolution of three hours. The Brazilian
and Peruvian sectors, both initially available for the longest period of April 2002 to the
present and covering most of northern South America, have a better temporal resolution
6

of thirty minutes. Nevertheless, shortly after we settled on the Brazilian sector as the best
choice and began to analyze these infrared images, a hard disk failure caused us to lose
all of the images from March 2004 to the present, leaving us with images from only 28
April 2002 to 18 February 2004.
We also worked with the NCEP NARR. The NARR has a spatial resolution of 32
kilometers and a temporal resolution of 3 hours. Although the entire country of
Venezuela is not within the NARR’s domain, the Venezuelan Llanos are just inside the
southern border of the reanalysis. Zonal and meridional wind fields are two of the
NARR’s 45 parameters available from 1979 to 2004. As the comparable pilot balloon
soundings ranged from 8 March 2001 to 31 May 2005 for 1200 UTC, we decided to
include the two wind component parameters at 1200 UTC from 1 January 2001 to 31
December 2004 in our study.
4. Methodology
We first used IDL and the pilot balloon observations to generate a plot of the
zonal wind speed’s annual cycle from the surface to 5000 meters above ground level
(Figure 3). This plot allowed us to more easily see what time of year and at what altitude
the winds above the Llanos are strongest. We additionally used IDL to plot the
interannual variation in pilot balloon-observed zonal wind speeds with height for both
wet (May through September) and dry (November through March) seasons. Similar zonal
wind speed plots were made from the 2001 to 2004 NARR data for comparison to the
pilot balloon data (Figures 4 and 5). In order to examine the horizontal structure of the
winds over the Llanos, NARR wind field maps were also produced with IDL for several
pressure heights within the troposphere (Figures 6 and 7).
7
Next we selected the 100 strongest and 100 weakest observed LLJ events out of
441 days from 28 April 2002 to 18 February 2004, coinciding with the time period of
available satellite images from the Brazilian sector of the GOES imagery from NASA’s
website. An IDL code was then written that used the infrared satellite images to construct
half hourly frequency composites of cloud tops colder than -38oC (235K) for strong LLJ
events during the dry season (42 satellite images matched these days), weak LLJ events
during the dry season (3 satellite images), strong LLJ events during the wet season (37
satellite images), and weak LLJ events during the wet season (70 satellite images). A
threshold of -38oC is often used in constructing such composites to estimate areas of deep
convection in the tropics (Janowiak et al., 1994; Machado and Laurent 2004).
Diurnal cycle loops and daily averages (Figure 8) were constructed for each of
these four cases, before subtracting the average strong LLJ composite from the average
weak LLJ composite for both the dry and wet seasons. These two final composites
represented the weak LLJ and strong LLJ convective anomalies during dry and wet
seasons (Figures 9 and 10).
5. Results and Discussion
Figure 3 shows the San Fernando zonal wind speed’s annual cycle, which
illustrates the wind speed peaks at just below 1000 meters from late January to March,
with a maximum of 15.5 meters per second from the east during the dry season, as
expected. Wind speeds from the surface to 1000 meters above ground level are weakest
in July and August during the wet season, also as expected.
The dry season pilot balloon zonal wind speed plot for San Fernando, seen in
Figure 4, again shows the wind speed peaks at 14 to 15 meters per second at about 650
8

meters above ground level. At a corresponding pressure height of 925mb, the dry season
NARR plot shows a similar wind speed maximum of 12 to 13 meters per second. The wet
season pilot balloon zonal wind speed plot, seen in Figure 5, shows that wind speeds are
much weaker during the wet season as compared to the dry season. Maximum zonal wind
speeds are about 8 meters per second. The wet season NARR plot again shows a similar
wind speed maximum of 7 to 8 meters per second. Apparent from these dry and wet
season plots is how well the NARR does at reproducing the observed zonal wind speed
profiles for at least the time period analyzed.
As the NARR shows the maximum wind speeds at San Fernando to be at 925mb,
we looked at the spatial extent of the winds at 925mb during the dry and wet seasons.
Figure 6 shows the horizontal structure of the wind field at 1200 UTC during the dry
season, based on the NARR. A northeasterly wind speed maximum exists over the Llanos
while weak winds exist over the northern Andes. Further evidence of a strong Llanos LLJ
in the dry season and a weak or nonexistent Llanos LLJ in the wet season is seen in
Figure 7, the NARR-based wind field at 1200 UTC during the wet season. The LLJ is
noticeably weaker over the Llanos but again still stronger than the calm winds over the
Andes.
Regardless of daily fluctuations in the strength of the Llanos LLJ, deep
convection in the dry season is for the most part restricted to south of the Venezuelan
border, as supported by the lack of cold cloud tops in the dry season frequency
composites shown in Figure 8. However, the wet season frequency composites show a
large patch of deep convection that migrates both north and south of the southern
Venezuelan border depending on the strength of the wet season Llanos LLJ. The dry
9

season convective anomaly composite (Figure 9) confirms there is no difference in
convection (as it is nonexistent) in most of Venezuela from strong to weak jet events. In
contrast, the wet season convective anomaly composite (Figure 10) shows there is deep
convection occurring in most of Venezuela (especially east central areas) when the LLJ is
weak and also occurring in the extreme southwest Venezuelan Llanos into the Colombian
Llanos when the LLJ is strong. This region of convection in the southern Llanos during
stronger LLJ events in the wet season is important to note. Referring back to the
horizontal structure of the jet in Figures 6 and 7, it is apparent that the convective region
in Figure 10 is near the LLJ’s exit region and the ITCZ, as originally hypothesized.
6. Conclusions
Our study consistently identified a low-level jet over the Venezuelan Llanos that
was strongest in the dry season at about 650 meters above ground level (or 925mb) and
weakest in the wet season. We also found that the NCEP North American Regional
Reanalysis was in good agreement with actual pilot balloon observations, and as such
was a good estimate of upper-level winds over northern South America for at least the
study period (2001 to 2004). Although our study showed that deep convection is
practically nonexistent in Venezuela during the dry season when the jet is typically
strongest, we did find that deep convection does indeed occur to the south, around the
exit region of the jet and the ITCZ during the wet season. This result is similar to
observations of other LLJs worldwide.
Acknowledgements
This work was funded by National Science Foundation Research Experiences for
Undergraduates grant NSF 0097651. Pilot balloon data were obtained from the National
10
Oceanic and Atmospheric Administration (NOAA)-funded Pan-American Climate
Studies Sounding Network (PACS-SONET) project. Reanalysis data were downloaded
from the website of the National Centers for Environmental Prediction (NCEP) North
American Regional Reanalysis (NARR):
http://wwwt.emc.ncep.noaa.gov/mmb/rreanl/index.html. Satellite images were obtained
from NOAA’s Geostationary Operational Environmental Satellite (GOES) 12.
References
Douglas, M. W., J. M. Galvez, J. F. Mejia, and J. Murillo, 2004: New directions in the
Pan American Climate Studies Sounding Network for Latin America. Preprints,
8th Symp. on Integrated Observing and Assimilation Systems for Atmosphere,
Oceans, and Land Surface, Seattle, WA, Amer. Meteor. Soc., 1-42.
——–, J. Murillo, and J. Mejia, 2005: Conducting short duration field programs to
evaluate sounding site representativeness and potential climate monitoring
biases—Examining the low-level jet over the Venezuelan Llanos during the 2005
dry season. Preprints, 15th Conf. on Applied Climatology, Savannah, GA, Amer.
Meteor. Soc., 1-18.
Janowiak, J. E., P. A. Arkin, and M. Morrissey, 1994: An examination of the diurnal
cycle in oceanic tropical rainfall using satellite and in situ data. Mon. Wea. Rev.,
122, 2296-2311.
Machado, L. A. T. and H. Laurent, 2004: The convective system area expansion over
Amazonia and its relationships with convective system life duration and high-
level wind divergence. Mon. Wea. Rev., 132, 714-725.
11

Marengo, J. A., W. R. Soares, C. Saulo, and M. Nicolini, 2004: Climatology of the low-
level jet east of the Andes as derived from the NCEP-NCAR reanalyses:
Characteristics and temporal variability. J. Climate, 17, 2261-2280.
Stensrud, D. J., 1996: Importance of low-level jets to climate: A review. J. Climate, 9,
1698-1711.
Vernekar, A. D., B. P. Kirtman, and M. J. Fennessy, 2003: Low-level jets and their
effects on the South American summer climate as simulated by the NCEP Eta
model. J. Climate, 16, 297-311.
12
Figures
Figure 1. Venezuelan physical relief (right) and South America (left).
13

Figure 2. Climograph for San Fernando de Apure, Venezuela. Bars are precipitation in
millimeters and curve is temperature in degrees Celsius.
Climograph of San Fernando de Apure, VenezuelaData Source: R-HydroNet (http://www.r-hydronet.sr.unh.edu/english/)
0
50
100
150
200
250
300
350
400
January
FebruaryMarch April
MayJu
neJu
ly
August
September
October
November
December
Month
Prec
ipita
tion
(mm
)
20
21
22
23
24
25
26
27
28
29
30
Tem
pera
ture
(°C
)
Precipitation Temperature
14
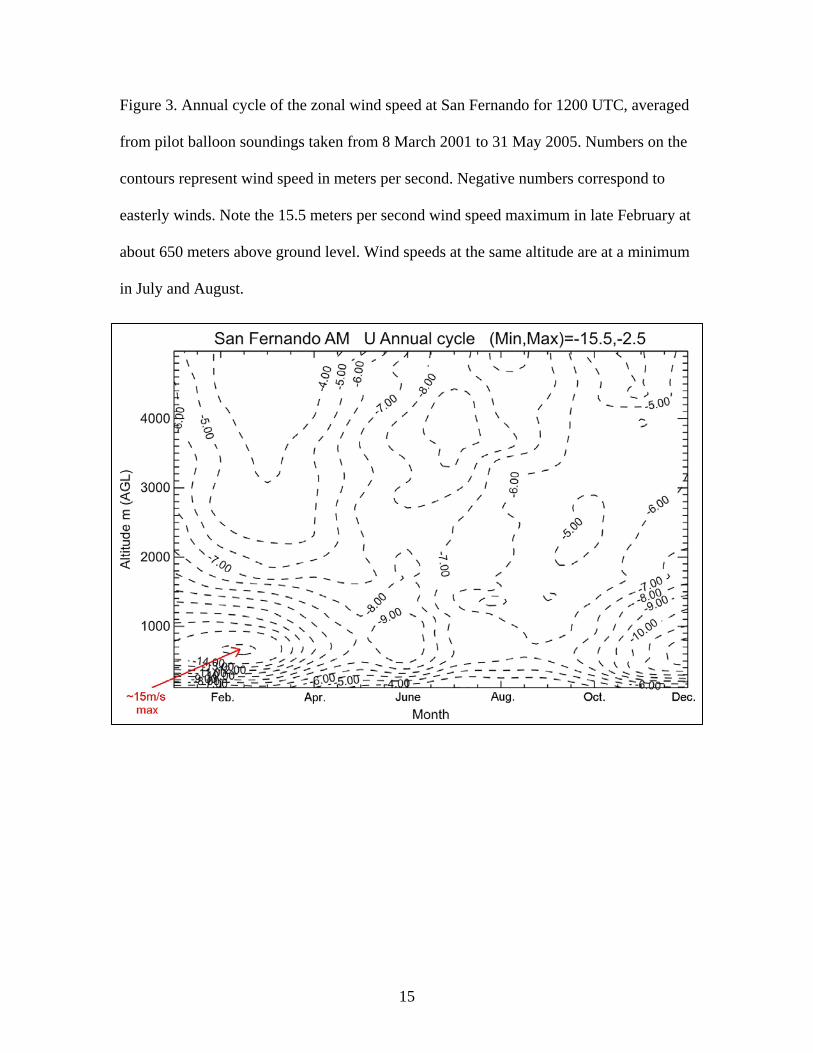
Figure 3. Annual cycle of the zonal wind speed at San Fernando for 1200 UTC, averaged
from pilot balloon soundings taken from 8 March 2001 to 31 May 2005. Numbers on the
contours represent wind speed in meters per second. Negative numbers correspond to
easterly winds. Note the 15.5 meters per second wind speed maximum in late February at
about 650 meters above ground level. Wind speeds at the same altitude are at a minimum
in July and August.
15

Figure 4. Dry season pilot balloon soundings (pibal, left) and reanalysis zonal wind
speeds for San Fernando. Note the numbers along the pilot balloon y-axis are in meters
while the numbers along the reanalysis y-axis are in millibars.
16
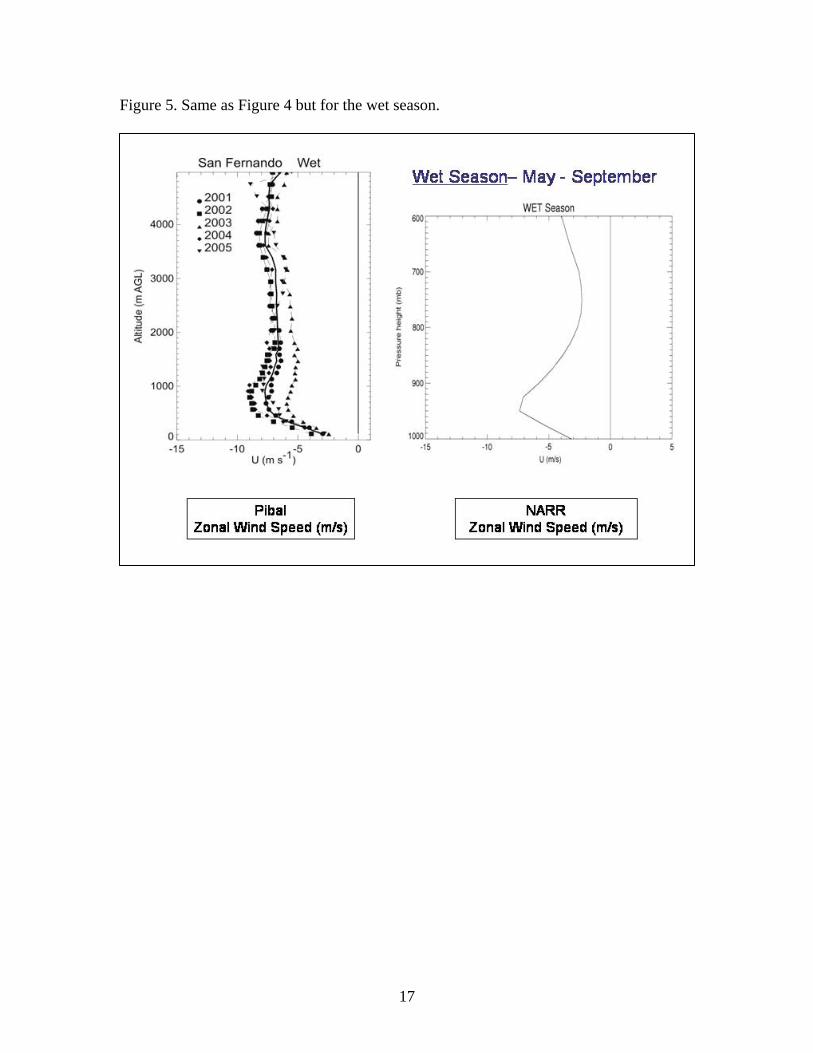
Figure 5. Same as Figure 4 but for the wet season.
17
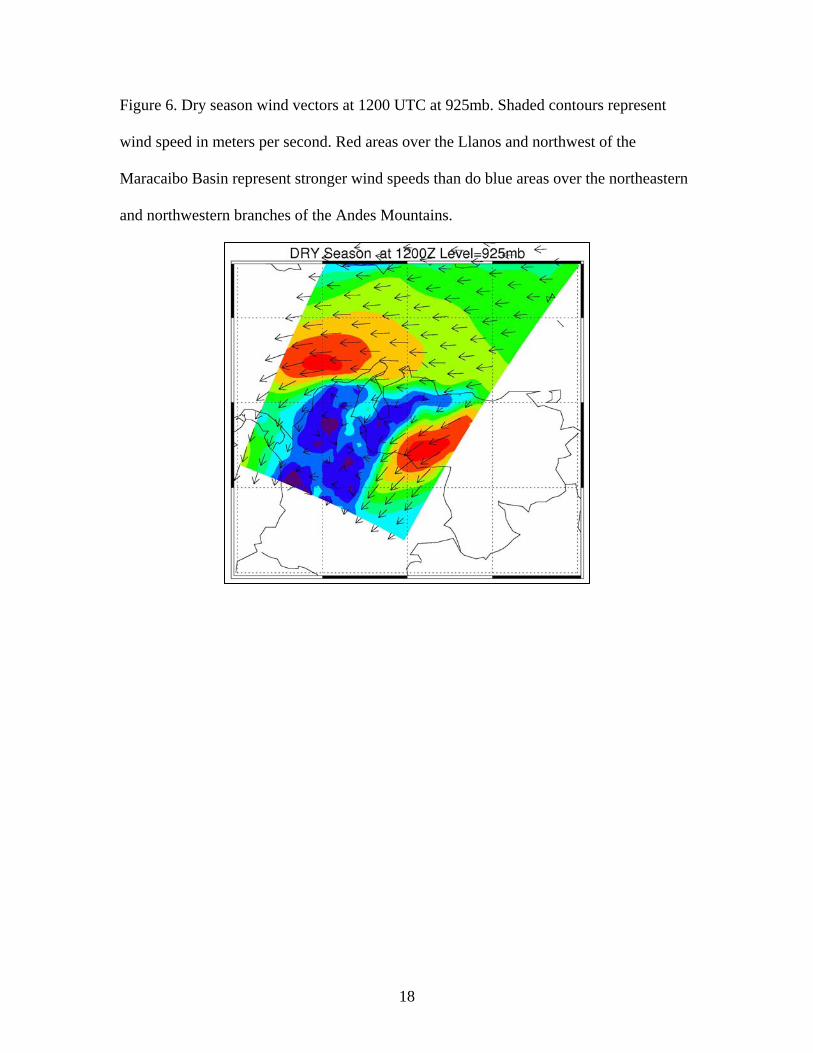
Figure 6. Dry season wind vectors at 1200 UTC at 925mb. Shaded contours represent
wind speed in meters per second. Red areas over the Llanos and northwest of the
Maracaibo Basin represent stronger wind speeds than do blue areas over the northeastern
and northwestern branches of the Andes Mountains.
18
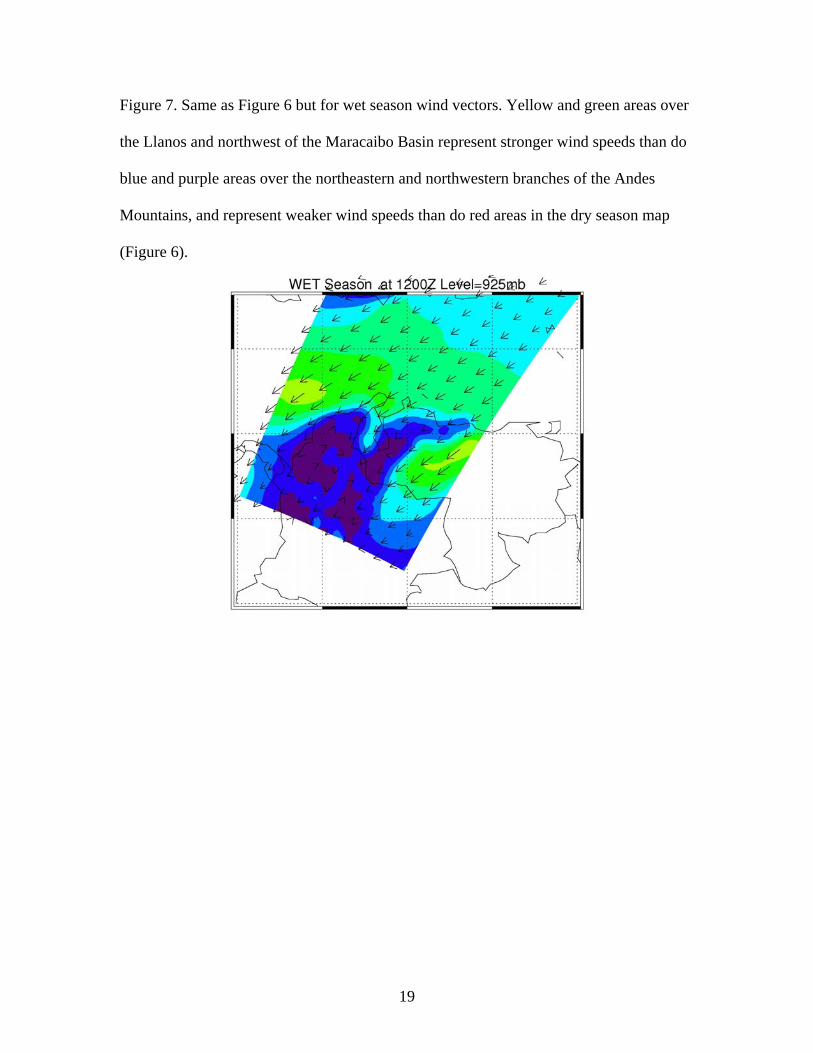
Figure 7. Same as Figure 6 but for wet season wind vectors. Yellow and green areas over
the Llanos and northwest of the Maracaibo Basin represent stronger wind speeds than do
blue and purple areas over the northeastern and northwestern branches of the Andes
Mountains, and represent weaker wind speeds than do red areas in the dry season map
(Figure 6).
19

Figure 8. Average frequency composites for strong and weak LLJ events during dry and
wet seasons from April 2002 to February 2004. The frequency represents the percentage
of cloud tops with temperatures colder than or equal to -38ºC.
Dry SeasonStrong LLJ
Dry SeasonWeak LLJ
Wet SeasonStrong LLJ
Wet SeasonWeak LLJ
Dry SeasonStrong LLJ
Dry SeasonWeak LLJ
Wet SeasonStrong LLJ
Wet SeasonWeak LLJ
20

Figure 9. Dry season (November through March) convective anomaly composite (weak
igure 10. Sa ber) convective
LLJ – strong LLJ). Blues represent positive areas that correspond to convection occurring
within a weak jet, while pinks represent negative areas that correspond to convection
occurring within a strong jet.
F me as Figure 9 but for a wet season (May through Septem
anomaly composite (weak LLJ – strong LLJ).
21