the influence of learning organization towards the
TRANSCRIPT
THE INFLUENCE OF LEARNING ORGANIZATION TOWARDS THE
PERFORMANCE: A STUDY ON SMALL AND MEDIUM ENTERPRISE (SME)
OF MANUFACTURING FIRMS IN JOHOR BAHRU, JOHOR
By
SAIFULHAFIZI HASSAN
Thesis submitted to
Othman Yeop Abdullah Graduate School of Business,
Universiti Utara Malaysia,
in Fulfillment of the Requirement for the Master of Science (Management)
brought to you by COREView metadata, citation and similar papers at core.ac.uk
provided by Universiti Utara Malaysia: UUM eTheses

i
DECLARATION
I declare that the thesis work described in this research paper is my own work (unless
otherwise acknowledged in the text) and that there is no previous work which has
been previously submitted for any academic Master’s program. All sources quoted
have been acknowledged by reference.
Signature : _____________________
Name : Saifulhafizi Hassan
Date :

ii
PERMISSION TO USE
In presenting this dissertation in partial fulfillment of the requirement for a Post
Graduate degree from the Universiti Utara Malaysia (UUM), I agree that the Library
of this university may make it freely available for inspection. I further agree that
permission for copying this dissertation in any manner, in whole or in part, for
scholarly purposes may be granted by my supervisor or in their absence, by the Dean
of Othman Yeop Abdullah Graduate School of Business where I did my dissertation.
It is understood that any copying or publication or use of this dissertation parts of it
for financial gain shall not be allowed without my written permission. It is also
understood that due recognition shall be given to me and to the UUM in any
scholarly use which may be made of any material in my dissertation.
Request for permission to copy or to make other use of materials in this dissertation
in whole or in part should be addressed to:
Dean of Othman Yeop Abdullah Graduate School of Business
Universiti Utara Malaysia
06010 UUM Sintok
Kedah Darul Aman
iii
ABSTRACT
The purpose of this study is to investigate the influence of learning organization
towards the performance of small medium-sized enterprises (SME). The study
focuses on manufacturing firms in Johor Bahru, Johor. Specifically, this study is to
examine the link between the dimensions occur in Systematic Learning Organization
Model (SLOM) namely dynamic learning, organizational transformation,
empowering people, knowledge management and technology application with the
performance of SMEs manufacturing firms. The performance of SMEs firms
includes overall performance of SMEs manufacturing firms and performance of
SMEs firm relative to their major competitor. 102 respondents were involved in this
study. The data was analyzed using ‘Statistical Package for Social Science’ SPSS
version 19. Collectively, the result shows that the learning organization is able to
influence the performance of SMEs manufacturing firms in Johor Bahru. The
Systematic Learning Organization Model (SLOM) is able to influence overall
performance of SMEs manufacturing firms and performance of SMEs manufacturing
firms relative to their major competitors. However, for individually, analysis using
multiple regression analysis indicates that only one of SLOM dimension; dynamic
learning is able to influence overall performance of SMEs manufacturing firms in
Johor Bahru. The dimension of dynamic learning and technology application of
SLOM demonstrates the significance influent on performance of SMEs
manufacturing firm relative to their major competitors. Therefore, the owner or
manager of SMEs manufacturing firm in Johor Bahru should focus on the dynamic
learning and technology application in order to enhance the performance of their
firms.
iv
ABSTRAK
Tujuan kajian ini dijalankan adalah untuk mengkaji pengaruh pembelajaran
organisasi terhadap prestasi Perusahaan Kecil dan Sederhana (PKS). Kajian ini akan
memfokus kepada firma pembuatan di Johor Bahru, Johor. Secara khususnya, kajian
ini juga dilaksanakan untuk mengkaji perkaitan antara dimensi di dalam Model
Pembelajaran Organisasi yang Sistematik (SLOM) yang diwakili oleh dinamik
pembelajaran, transformasi organisasi, memperkasakan manusia, pengurusan
pengetahuan, adan penggunaan teknologi dengan prestasi firma pembuatan IKS.
Pretasi firma pembuatan PKS termasuk keseluruhan prestasi dalam firma pembuatan
PKS dan prestsi firma pembuatan PKS berbanding dengan pesaing utama. Sebanyak
102 responden terlibat dalam kajian ini. Data dalam kajian ini dianalisis dengan
menggunakan ‘Statistical Package for Social Science’ SPSS versi 19. Secara
kolektif, keputusan kajian menunjukkan bahawa pembelajaran organisasi mampu
mempengaruhi prestasi firma pembuatan PKS di Johor Bahru. Model Pembelajaran
Organisasi yang Sistematik (SLOM) mempunyai pengaruh yang signifikan terhadap
keseluruhan prestasi dalam firma pembuatan PKS dan prestsi firma pembuatan PKS
berbanding dengan pesaing utama. Bagaimanapun, secara individu, analisis yang
menggunakan regresi berbilang menyatakan bahawa hanya satu daripada dimensi di
dalam SLOM iaitu dinamik pembelajaran yang mampu untuk mempengaruhi
keseluruhan prestasi dalam firma pembuatan PKS. Dimensi dinamik pembelajaran
dan penggunaan teknologi di dalam SLOM juga menunjukkan pengaruh yang
signifikan terhadap prestsi firma pembuatan PKS berbanding dengan pesaing utama.
Oleh itu, pemilik atau pengurus firma pembuatan IKS di Johor Bahru perlu
memfokuskan terhadap dinamik pembelajaran dan penggunaan teknologi untuk
meningkatkan prestasi firma mereka.
v
ACKNOWLEDGEMENT
In the Name of Allah, the Most Forgiving, Most Merciful
All praise and gratitude be given to Allah, Lord of the Lords, for giving me such a
great strength, patience, courage, and ability to complete this study. The completion
of this study would not have been possible without the contribution of a number of
people that help me to finish this research.
My deepest appreciation goes to Dr. Darwina bt. Hj. Ahmad Arshad who has
provided unlimited amount of encouragement and professional support. Thank you
Dr. Darwina bt. Hj. Ahmad Arshad, for your superb positive attitude and outlook,
you are incredible supervisor and an outstanding instructor.
An honest gratitude and special thanks for my family that always give support and
motivation to finish this study. A sincere appreciation and special thanks also goes to
friends and other lecturer in Universiti Utara Malaysia who always gave a great
support during this research. Without their endless attention, care, encouragement
and sacrifice, it would be hard for me to complete this study.
For the final word, for the intellect, this is the fundamental tool necessary for
academic work, the physical and emotional strength to withstand academics
problems and critique which are something cutting, and the ups and down seemingly
unhurried lifestyles, I owe entirely to the grace almighty God to whose glory this
research is dedicated. May Allah blessing be upon the readers for this research. I
hope this research will be of assistance of someone in the future.
vi
TABLE OF CONTENTS
Declaration.....................................................................................................................i
Permission to Use.........................................................................................................ii
Abstract........................................................................................................................iii
Abstrak.........................................................................................................................iv
Acknowledgment..........................................................................................................v
Table of Contents.........................................................................................................vi
List of Tables...............................................................................................................xi
List of Figures............................................................................................................xiii
List of Abbreviations.................................................................................................xiv

vii
TABLE OF CONTENTS
CHAPTER 1: INTRODUCTION
1.1 Background of the Study.......................................................................1
1.2 Problem Statement................................................................................6
1.3 Research Questions.............................................................................10
1.4 Research Objectives............................................................................11
1.5 Significance of the Study....................................................................12
1.6 Research Scope....................................................................................14
1.7 Limitations of the Study......................................................................14
1.8 Organization of the Study....................................................................15
CHAPTER 2: LITERATURE REVIEW
2.1 Introduction.........................................................................................17
2.2 Small Medium Enterprise (SME)........................................................18
2.2.1 Definitions of Small Medium Enterprises (SME)...................18
2.2.2 The Role of Small Medium Enterprise (SME) in Malaysia....20
2.2.3 Activities of Small Medium Enterprises (SME)
Manufacturing Firms in Malaysia...........................................22
2.2.4 The SMEs Performance in Malaysian
Manufacturing Sector..............................................................23
2.3 Organizational Performance................................................................25
2.3.1 Definitions of Organizational Performance............................26
2.3.2 Types of Organizational Performance ....................................27
2.3.3 The Measurement of Organizational Performance.................28
viii
2.4 Learning Organization.........................................................................31
2.4.1 Definitions of Learning Organization.....................................32
2.4.2 The Importance of Learning Organization..............................35
2.4.3 The Characteristic of Learning Organization..........................36
2.4.4 Systematic Learning Organization Model (SLOM) ...............39
2.4.4.1 Dynamic Learning.......................................................39
2.4.4.2 Organizational Transformation...................................40
2.4.4.3 Empowering People.....................................................41
2.4.4.4 Knowledge Management.............................................42
2.4.4.5 Technology Application..............................................43
2.5 Learning Organization and Organizational Performance....................44
2.5.1 Dynamic Learning and Organizational Performance..............44
2.5.2 Organizational Transformation and
Organizational Performance....................................................45
2.5.3 Empowering People and Organizational Performance...........46
2.5.4 Knowledge Management and Organizational Performance....47
2.5.5 Technology Application and Organizational Performance.....48
2.6 Resource-Based View (RBV) Theory.................................................49
2.7 Summary.............................................................................................52
CHAPTER 3: RESEARCH METHODOLOGY
3.1 Introduction.........................................................................................53
3.2 Theoretical Framework.......................................................................54
3.2.1 Dependent Variables...............................................................55
3.2.2 Independent Variables.............................................................55
3.3 Research Hypotheses...........................................................................55
ix
3.4 Operational Definitions.......................................................................57
3.5 Research Design..................................................................................60
3.6 Research Sample and Population .......................................................61
3.7 Instrumentation Method......................................................................63
3.8 Measurement of Variables...................................................................65
3.9 Data Collection Method and Procedure..............................................66
3.10 Pilot Test..............................................................................................67
3.11 Reliability Test....................................................................................68
3.12 Data Analysis Technique.....................................................................70
3.12.1 Descriptive Analysis...............................................................70
3.12.2 Validity and Reliability Test...................................................72
3.12.3 Normality Test.........................................................................73
3.12.4 Pearson’s Correlation Analysis...............................................74
3.12.5 Multiple Regression Analysis.................................................74
3.13 Summary.............................................................................................76
CHAPTER 4: RESULT AND DISCUSSION
4.1 Introduction.........................................................................................77
4.2 Descriptive Analysis............................................................................78
4.3 Validity and Reliability Analysis........................................................87
4.3.1 Validity Test for Dependent Variables....................................87
4.3.2 Reliability Test........................................................................88
4.4 Pearson’s Correlation Analysis...........................................................89
4.5 Multiple Regression Analysis.............................................................91
4.6 Hypotheses Summary..........................................................................96
4.7 The Discussion of Hypotheses Result.................................................98
x
4.8 Summary...........................................................................................107
CHAPTER 5: CONCLUSION AND RECOMMENDATION
5.1 Introduction.......................................................................................108
5.2 Research Implication.........................................................................109
5.2.1 Managerial and Practical Implication...................................109
5.2.2 Academic Implication...........................................................111
5.3 Recommendations from the Research...............................................111
5.3.1 Recommendation from the Researcher.................................111
5.3.2 Recommendation from the SMEs Entrepreneur / Owner /
Manager.................................................................................113
5.4 Limitation of the Research................................................................114
5.5 Suggestion for Future Research........................................................115
5.6 Conclusion.........................................................................................116
REFERENCES........................................................................................................117
APPENDICES

xi
LIST OF TABLES
ITEM
2.1 SME Definition Based on Number of Full-Time Employees.............20
2.2 SME Definition Based on Number of Annual Sales Turnover...........20
3.1 SME Definition Based on Number of Full-Time Employees.............57
3.2 SME Definition Based on Number of Annual Sales Turnover...........57
3.3 Summary of the Questionnaire............................................................64
3.4 Likert Scale..........................................................................................65
3.5 Coefficient of Cronbach’s Alpha........................................................68
3.6 Reliability Statistic for Pilot Test........................................................69
3.7 The Table of Marquardt’s Learning Organization Analysis...............71
3.8 The Coefficient Scale and Relationship Strength of Correlation........74
3.9 Summary of Data Analysis Technique................................................75
4.1 Composition of Respondents by Gender.............................................79
4.2 Composition of Respondents by Age..................................................79
4.3 Composition of Respondents by Race.................................................80
4.4 Composition of Respondents by Highest Level of Education............80
4.5 Composition of Respondents by Position of Respondents at Firm.....81
4.6 Composition of Respondents by the Total Working Experience........81
4.7 Composition of Company Establishment Years.................................82
4.8 Composition of Employees at Firm.....................................................82
4.9 Composition of Type of Firm’s Ownership........................................83
4.10 Composition of Types of Industry.......................................................83
xii
4.11 Summary of Descriptive Analysis.......................................................86
4.12 Reliability Statistic for the Data Gathered from Survey.....................89
4.13 Correlation Analysis............................................................................91
4.14 Multiple Regression Analysis for Hypothesis 1..................................93
4.15 Multiple Regression Analysis for Hypothesis 2..................................96
4.16 Summary of All Hypotheses...............................................................97
xiii
LIST OF FIGURES
ITEM
2.1 Resource-Based Theory Model...........................................................50
3.1 Theoretical Framework.......................................................................54
xiv
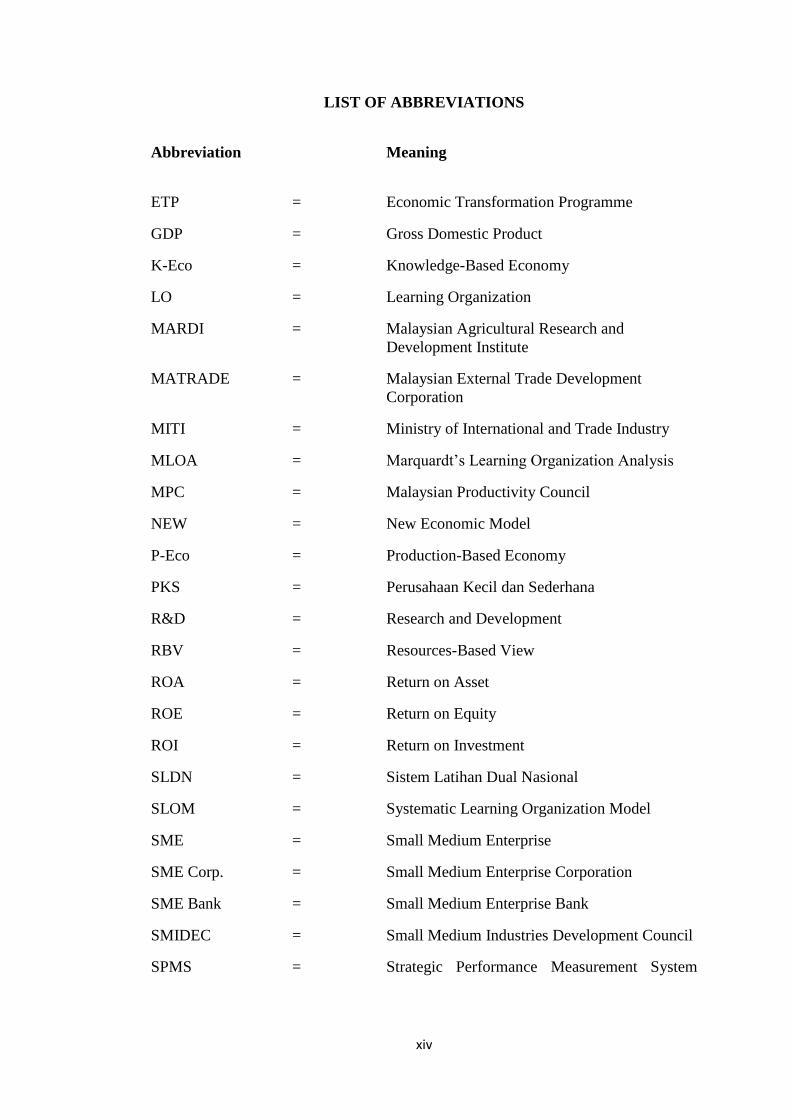
LIST OF ABBREVIATIONS
Abbreviation Meaning
ETP = Economic Transformation Programme
GDP = Gross Domestic Product
K-Eco = Knowledge-Based Economy
LO = Learning Organization
MARDI = Malaysian Agricultural Research and
Development Institute
MATRADE = Malaysian External Trade Development
Corporation
MITI = Ministry of International and Trade Industry
MLOA = Marquardt’s Learning Organization Analysis
MPC = Malaysian Productivity Council
NEW = New Economic Model
P-Eco = Production-Based Economy
PKS = Perusahaan Kecil dan Sederhana
R&D = Research and Development
RBV = Resources-Based View
ROA = Return on Asset
ROE = Return on Equity
ROI = Return on Investment
SLDN = Sistem Latihan Dual Nasional
SLOM = Systematic Learning Organization Model
SME = Small Medium Enterprise
SME Corp. = Small Medium Enterprise Corporation
SME Bank = Small Medium Enterprise Bank
SMIDEC = Small Medium Industries Development Council
SPMS = Strategic Performance Measurement System

1
CHAPTER 1
INTRODUCTION
1.1 Background of the Study
Over recent decades, the parties involving employees, organization, and country are
recommended to continue to work more vigorously to achieve success. The Era of
globalization and rapid development in Malaysia in organizational learning system
accompanied by the emergence of cluster users who increasingly intelligent, and
knowledgeable, and has a wide stance has led to competition among organization
became more intense and continuous. In this regard, a variety of methods and strategies
needed to be done in order to continue in creating a learning organization management
and the development of education process in order to increase competitiveness and
business domination in the region. This is because the productivity can be increased by
the effective and efficient management in the organization and it will assist the firm to
attain its target due to the systematic management (Hassan and Hakim, 2005).
Basically, the organization is like humans where learning and knowledge in an
organization is the key power for the organization in order to ensure the continuity of the
firm legacy. Therefore, organizations need to be sensitive with the changes in the
environment either external or internal. The organization should search for new findings
when the rate of changes has been increased in order to survive in the environment

The contents of
the thesis is for
internal user
only
117
REFERENCES
Abu Kasim, Aziah, N., Minai, Badriay, and Chun, L.S. (1989). Performance
Measures in Malaysia – The State of Art. Malaysia Management Review,
Vol. 24, pp. 3-9.
Agyris, C. and Schon, D.A. (1996). Organizational Learning II: Theory, method,
and practice. Reading, MA: Addison-Weley.
Ahadi, S. (2011). Relationship between Empowerment and Learning
Organization among Academics in Malaysian Research Universities,
Universiti Putra Malaysia, pp. 4.
Ahmad, N.H., Wilson, C. and Kummerow, L. (2011). Assessing the
Dimensionality of Business Success: The Perspective of Malaysian SME
Owner-Managers. Journal of Asia-Pacific Business, Vol. 12, pp. 207-224.
Akbal, A. M. and Afkari, M. (2012). Expansion Strategy of Primary and
Secondary Effort in facing the ACPTA Attacks, SME leads to Nation
Economic, pp.6 -7.
Amit, R. and Schoemaker, P.J. (1993). Strategic assets and organizational rent,
Strategic Management Journal, Vol. 14, No.1, pp. 33-55.
Anand, A. (2011). Understanding Knowledge Management: A Literature
Review, International Journal of Engineering Science and Technology,
Vol. 3, No. 2, pp. 932.
Annual Report of Malaysian Productivity Council (MPC), (2011).
Annual Report of SME Corporation, (2012).
Asri, A.G.M. and Darawi, A., (2012). Business Transformation and Performance
of Malay Entrepreneurs in Small Medium Enterprises (SME) in Johor
Bahru, pp. 697.
Awang, C.R., Abbas, N., Nizam, M.N.M., and Top, O.M. (2010). Strengthen the
Small Medium Enterprise’s (SMEs) Entrepreneur through the Testbed
System Service, Promotion and technology Development Centre,
MARDI.
Bandura, A. (2003). On the psychosocial impact and mechanisms of spiritual
modeling, The International Journal for the Psychology of Religion, Vol.
13, pp. 167-173.
Barney, J. B. (1991). Firm’s resources and Sustained Competitive Advantages.
Journal of Management, Vol. 17, pp. 99-120.
Barney, J. B. (2002). Gaining and sustaining competitive advantage (2nd Ed.).
Upper Saddle. River, NJ: Pearson Education, Inc.
118
Barry, R.T. (2008). Top Ten Qualities of a Project Manager, Inspires a shared
vision, Project Smart Journal, pp. 1.
Beeby, M. and Booth, C. (2000). Network and inter-organizational learning: A
critical review, The Learning Organization, Vol. 7, No. 2, pp. 75-88.
Bhojaraju, G. (2005). Knowledge Management: Why do we need it for
corporates, Malaysian Journal of Library & Information Science, Vol. 10,
No. 2, 37-50.
Bontis, N., Crossan, M., and Hulland, J. (2002). Managing an organizational
learning system by aligning stocks and flows. Journal of Management
Studies, Vol. 39, No.4, pp. 437-469.
Bullen, P.B. (2014). Select the pilot sample, How to Pretest and Pilot a Survey
Questionnaire, Retrieved on 29 March 2014,
http://www.tools4dev.org/resources/how-to-pretest-and-pilot-a-survey-
questionnaire/
Burke, W.W. and Litwin, G.H. (1989). A causal model of organization
performance. In: J.W. Pfeiffer (Ed.), The Annual Developing Human
Resources. University Associates, San Diego, CA.
Burtonshaw-Gunn, S. and Salameh, M. (2011). Change Management and
Organzational Performance. Journal of Management Review. pp. 1.
Button, S.B., Mathieu, J.E., and Zajac, D.M. (1996). Goal orientation in
organizational research: A conceptual and empirical foundation. Organ.
Behav. Hum. Decis. Proc. Vol. 67, pp. 26-48.
Calori, R.P.S. (1991). Corporate Culture & Economic Performance: A French
Study, Organization studies, Vol. 12, pp. 49-74.
Carter, R. and Auken, V.H. (2006). Small firm bankruptcy. Journal of Small
Business Management, Vol. 44, No. 4, pp. 493-512.
Carton, R.B. (2004). Measuring Organizational Performance: An Exploratory
Study, The concept of organizational performance, pp. 3.
Carton, R.B. and Hofer, C.W. (2006). Measuring Organizational Performance:
Metrics for Entrepreneurship and Strategic Management Research.
Northampton, Edward Elgar Publishing.
Cascio, W.F. (2006). Managing Human Resources: Productivity, Quality of Life,
Profits. McGraw-Hill Irwin.
Cavana, R.Y., Delahaye, B.D. and Sekaran, U. (2001). Applied Business
Research: Qualitative and Quantitative Methods, Melbourne: John Wiley
& Sons.
Chen, H.H. and Lee, P.Y. (2008). Drivers of Dynamic Learning Mechanism and
Dynamic Knowledge Articulation in Alliance Organization, The
Electronic Journal of Knowledge Management, Vol. 6, No. 1, pp. 33-40.

119
Chodak, M. (2001). The Call for Learning Organization. Retrieved on 28 March
2014, from
http://www.rec.org/REC/Programs/EMTC/Insight/vol12/learning.html.
Cooper, D.R. and Schindler, P.S. (2006). Business Research Methods, 9th
Ed.,
NY: McGraw-Hill.
Cummings, T.G. and Worley, C.G. (2001). Organizational Development and
Change, 7th
Ed., South-Western College Publishing: Cincinnati, OH.
Daintith, J. (2009). A Dictionary of Physics, Oxford University Press, Retrieved
on 15 February 2014.
Dale, M. (2003). Developing Management Skill (Translation), Jakarta: PT.
Gramedia.
Dalkir, K. (2005). Knowledge Management in Theory and Practices. Elsevier
Butterworth-Heinemann. pp. 2.
Das, T.K. and Teng, B. (2000). A Resource-Based Theory of Strategic Alliances.
Journal of Management. Vol. 7, pp. 1-2.
Department of Statistic Malaysia, (2011). Census reports on SMEs, Press
Release.
Dollinger, M.J. (2003). Entrepreneurship: Strategies and Resources. NJ:
Prentice Hall.
Drucker, P.F. (1981). Managing in Turbulent Times. London: Pan Business of
Management.
Drucker, P.F. (1985). Innovation and Entrepreneurship. New York: Harper and
Row.
Dixon, N. (2004). Towards a learning organization? Employee perceptions. The
Learning Organization, Vol. 13, No. 5, pp. 525-537.
Doyle, P. (1994). Setting Business Objectives and Measuring Performance.
European Management Journal, Vol. 12, No.2, pp. 123-132.
Economic Transformation Programme (ETP); A Roadmap for Malaysia (2010).
Performance Management and Delivery Unit (PEMANDU).
Ehrich, L.C. and Billett, S. (2004). Learning new practices in small business:
engagement and localized support. Education + Training, Vol. 87 (3), pp.
48-49.
Espejo, R., Schuhman, W., Schwaninger, M., and Bilello, U. (1996).
Organizational Transformation and Learning: A Cybernetic Approach to
Management.
Evans, P., Stalk, G., and Shulman, L.E. (1992). Competing on capabilities: The
new rules of corporate strategy, Harvard Business Review (HBR), Vol.
70, pp. 57-69.

120
Federation of Malaysian Manufacturer (FMM) (2013). FMM Directory of SMEs
Malaysian Industries in 2013. Press Release.
http://www.fmm.org.my/Press_Releases-@-
FMM_Directory_of_Malaysian Industries_2013_.aspx
Feldman, M. and Khademian, A. (2003). Strategic Empowerment. Presentation
at the National Public Management Research Conference, Georgetown
University, Washington DC. pp.3.
Fiol, C.M. and Lyles, M.A. (1985). Organizational Learning. Academy of
Management Review, Vol. 19, No. 4, pp. 803-813.
Francis, L. (2013). Dynamic Learning Networks Expand Knowledge Sharing and
Collaboration in Leading Companies,
http://www.triplecreekriver.com/about-triple-creek/press-
releases/item/234-dynamic-learning-networks-expand-knowledge-
sharing-and-collaboration-in-leading-companies
Frost, S. (2014). List of Non-Financial Objectives, Small Business.
http://smallbusiness.chron.com/list-nonfinancial-performance-objectives-
35524.html
Galerikami Media Network, (2012). Retrieve from Berita Harian,
http://www.majalah.com/?classified:khas-untuk-usahawan-pks-atau-sme-
di-malaysia-
Gardiner, P. and Whiting, P. (1997). Success factor in learning organization: An
empirical study. Industrial and Commercial Training, Vol. 29, No.2, pp.
41-48.
Garvin, D. A. (1993). Building a Learning Organization. Harvard Business
Review (HBR), Vol. 71, No. 4, pp. 78-91.
Gephart, M.A. (1996). Learning Organization Come Alive, Training and
Development; Vol. 51, No. 12, pp. 35-45.
Hair, J.F.J., Babin, B., Money, A.H., and Samouel, P. (2003). Essential of
Business Research Method. USA: John Wiley & Sons.
Hair, J.F.J., Money, A.H., Samouel, P., and Page, M. (2007). Research Method
for Business. England, West Sussex: John Wiley & Sons.
Hair, J.F.J., Babin, B., Anderson, R.E., and Tatham, R.L. (2007). Multivariate
Data Analysis. UpperSaddle River, NJ: Prentice Hall.
Hallinger, P. (1998). Increasing the Organization’s IQ: Public Sector Leadership
in Southeast Asia. Journal of Learning Organization, Vol. 2, No. 4, pp.
176-183.
Hasmiah, K. and Noraidah, S., (2009). E-Government Evaluation in Perspective
of Learning Organization: Case Study in Malaysia, Theory of Learning
Organization and Knowledge Management Evaluation, pp. 238.

121
Hassan, J. and Hakim, M.A., (2005). Knowledge Management, Journal in
Organization of Facility Management, Problem Statement, pp. 3.
Healey, J. (2005). Statistic – A tool for Social Research. (7th
Ed.) Thompson
Wadsworth, USA.
Hofstede, G. (1991). Cultures and Organizations: Software of Mind, McGraw-
Hill.
Howton, S.W., Ellinger, A.D., Ellinger, A.E., and Yang, B. (2002). The
relationship between the learning organization concept and firm’s
financial performance: An empirical assessment. Human Resource
Development Quarterly, Vol. 13, No. 1, pp. 5-21.
Inkeles, A. (1997). Continuity and change in popular values on the Pacific Rim,
in Montgomery, J. (Eds), Values and values diffusion in the Pacific
Basin, Pacific Basin Research Center.
Inkpen, A.C. and Crossan, M.M. (1995). Believing is seeing: joint ventures and
organizational learning, Journal of Management Studies, Vol. 32, No. 5,
pp. 595-618.
Isaac, S. and Micheal, W.B. (1990). Handbook in Research and Evaluation
(R&E), San Diego, California: Edits Publishers.
Jashapara, A. (1993). The competitive learning organization: A quest for the
Holy Grail. Management Decision, Vol. 31, No. 8, pp. 52-62.
Kamarudin, Z. (2009). The Relationship between Learning Organization Profile
with the Resistance to Change, Unpublished: Universiti Utara Malaysia,
pp. 84.
Kaplan, R. S., and Norton, D. P. (1992). The balanced scorecard–measures that
drive performance. Harvard Business Review (HBR), Vol. 70, No. 1, pp.
71-79.
Keegan, S. (2009). Workshop Review. Workshop on analyzing the language of
interviews. Held November 2009 at Birkbeck College, London.
Kerka, S. (1995). The Effectiveness of Learning Organization Practiced by the
Leader, Definition of Learning Organization.
Kerlinger, F. (1986). Foundations of Behavioral Research, 3rd
. Ed., New York:
Holt, Rinehart, and Winston.
Kieser, A., and Koch, l. (2008). Bounded rationality and organizational learning
based on rule changes. Management Learning, Vol. 39(3), pp. 329-347.
http://dx.doi.org/10.1177/1350507608090880
Kim, T.G., Lee, J.H., and Law, R. (2008). An empirical examination of the
acceptance behavior of hotel front office systems: An extended
technology acceptance model. Tourism Management. Vol. 29, pp. 500-
513.
122
Kothari, C.R. (1985). Research Methodology – Methods and Techniques, New
Delhi, Wiley Eastern Limited.
Koupahi, M., Fakhri, K.P. and Ghanimat, P. (2013). The Relationship between
Learning and Organizational Performance, Journal of Basic and Applied
Scientific Research, Vol. 3, No. 1, pp. 99-105.
Landrum, N. and Gardner, C. (2005). Using integral theory to effect strategic
change, Journal of Organizational Change Management, Vol. 18, No. 3,
pp. 247-258.
Lee, H. and Choi, B. (2003). Knowledge Management Enablers, Processes and
Organizational Performance: An Integrative View and Empirical
Examination. Journal of Management Information System, Vol. 20, No.
1, pp. 179-228.
Leowenthal, K.M. (1996). An introduction to psychological test and scales, pp.
141.
Lester, P. and Hannah S. (2009). A multilevel approach to building and leading
learning organizations, Leadership Quarterly, Vol. 20, pp. 34-48.
Majid, M. K. (1993). Research Methodology of Education, Dewan Bahasa dan
Pustaka, Kuala Lumpur.
Malaysian Budget, (2010). Retrieves from Berita Harian Online.
Malaysian Leadership and Strategies Foundation (YKSM), (2012). Challenges –
SME, Shift in Mindset, Retrived on 20 March 2014,
http://yksm.com.my/web/2012/02/24/cabaran-iks/
Malhotra, N.K. (2006). Chapter 5: Questionnaire design and scale development,
Likert Scale, pp. 186.
Malin, T. and Birch, A. (1997). Research Method and Statistics, Macmillan,
London.
Manmath, N.S. (2006). Organizational Transformation: A strategy for gaining
competitive advantages, Retrieve on 15 February 2014,
http://www.indianmba.com/Faculty_Column/FC274/fc274.html
Marcum, J.W. (2006). After the Information Age: A Dynamic Learning
Manifesto. Counterpoints: Studies in the Postmodern Theory of
Education. New York: Peter Lang.
Marquardt, M.J. (1996). Building the learning organization: A system approach
to quantum improvement and global success, New York: McGraw-Hill
Co.
Marquardt, M.J., and Reynolds, A. (1994). The Global Learning Organization:
Gaining Competitive Advantage through Continuous Learning. Burr
Ridge, Illinois: Irwin.
123
Martin, P. and Bateson, P. (1986). Measuring Behaviour: An Introductory Guide,
Cambridge, Cambridge University Press.
Matlay, H. (2004). Contemporary training initiatives in Britain: a small business
perspective. Journal of Small Business and Enterprise Development, Vol.
11, No. 4, pp. 504-513.
McCoy, T.J. (2006). Empowerment: Five steps that develop a high-involvement,
high performance workforce. McCoy T.J. & Associates, LLC, pp. 2
McGill, M.E., Slocum, J.W., and Lei, D. (1993). Management Practices in
learning organizations. Organizational Dynamics, Vol. 21, pp. 5-17.
Miller, N and Pazgal, A. (2002). Relative Performance as a Strategic
Commitment Mechanism. Managerial and Decision Economics, Vol. 23,
pp. 51-68.
Morgan, R.E., Katsikeas,, C.S., and Kwaku, A. (1998). Market orientation and
organizational learning capabilities. Journal of Marketing Management,
Vol. 14, pp. 353-381.
Munandar A. S., (2003). Learning Organization and its application in the
Business World Paper Colloquium Industry’s Seminar in Makassar
(unpublished).
Namasivayam, K. Enz, C. and Siguaw, J. (2000). Adaptation of information
technology is US Hotels: Strategically driven objectives, Journal of
Travel Research, Vol. 39, No. 2, pp. 192-201.
Nason, S. (1994). Organizational learning disabilities: an international
perspective. Los Angeles: PhD Thesis.
National Vocational Training Council (MLVK), (2005). National Dual Training
System (SLDN).
Newbert, S.L. (2008). Value, rareness, competitive advantages and performance.
Strategic Management Journal. Vol. 29, No. 7. pp. 745-768.
Oosterban, R.J. (1994). Frequency and Regression Analysis of Hydrologic Data,
pp. 3.
Pettigrew, A. (1979). On studying organizational cultures. Administrative
Science Quarterly, Vol. 24, No. 2, pp. 570-581.
Phang C. L., (2008). A Historical Account of Skills Training in Malaysia.
Polanyi, M. (1966). The Tacit Dimension. New York: Anchor Books.
Prahalad, C.K. and Hamel, G. (1990). The core competence of the corporation,
Harvard Business Review, Vol. 68, No. 3, pp. 79-91.
Prusk, L. (1997). Knowledge in Organizations. Butterworth-Heinemann: Bosto,
MA
124
Rajasekar, S., Philominathan, P., and Chinnathambi, V. (2013). Research
Methodology, Mode of Approach: Research design, pp. 22.
Ramayah, T., Sulaiman, M., Jantan, M., and Ching, N.G. (2009). Organizational
learning, proprietary technology, and manufacturing performance: a
glimpse from Malaysian Manufacturing Firms, pp. 2.
Richard, P.J., Devinney, T.M., Yip, G.S. and Johnson, G. (2009). Measuring
Organizational Performance as a Dependent Variable: Towards
Methodological Best Practices, Review of the Research Contexts of
Organizational Performance.
Royston, P. (1991). Estimating departure from normality. Statistic Med, Vol. 10,
No. 8, pp. 1283-93
Salkind, N. (2006). Exploring Research, (6th
Ed.) New Jersey: Pearson Prentice
Hall.
Schwandt, (2003). The Influence of Learning Organization for a Long Term
Strategy, Defining the Term of Learning Organization.
Sekaran, U. (2003). Research methods for business: A skill building approaches
(4th
Ed.). USA: John Wiley & Sons.
Senge, P. M., (1990). The fifth discipline: The art & practice of the learning
organizations. Sloan Management Review, Vol. 32, No. 1, pp. 7 – 23.
Simon, P.R.J., Germans, J., and Ruijters, M., (2003). Forum for learning
organization: Combining learning at work, LO and training in new ways.
Journal of European Industrial Training, Vol. 27, No. 1, pp. 41-48.
Smallbone, D., (2004). Institutions, Governance and SME Development in
Transition Economies, Economic Commission for Europe, Expert
Meeting on Good Governance for SMEs.
Small and Medium Enterprise Corporation (SME Corp.). SMEs in Malaysia .
Retrived on 20 March 2014, http://www.smecorp.gov.my/vn2/node/40
Small and Medium Enterprise Corporation (SME Corp.). National SME
Development Council Report (2005). Definitions for Small Medium
Enterprises in Malaysia. Approved SME Definitions, Issued by:
Secretariat to National SME Development Council, Bank Negara
Malaysia (BNM), pp. 3-5
Small and Medium Enterprise Corporation (SME Corp.). National SME
Development Council, (2014). Definitions for Small Medium Enterprises
in Malaysia. Approved SME Definitions, Issued by: Secretariat to
National SME Development Council, Bank Negara Malaysia (BNM),
http://www.smecorp.gov.my/vn2/node/586

125
Snyman, R. and Kruger, C.J. (2004). The interdependency between strategic
management & strategic management & strategic knowledge
management. Journal of Knowledge Management, Vol. 8, No.1, pp. 5-19.
Soon, T.T. and Zainol, F.A. (2011). Knowledge Management Enablers, Process
and Organizational Performance: Evidence from Malaysian Enterprises,
Journal of Asian Social Science, Vol.7, No.8, pp.187.
Stata, R. (1989). Organizational Learning: The key to management innovation.
Sloan Management Review, Vol. 30, No. 3, pp. 63-74.
Sujan, H., Wietz, B.A., and Kumar, N. (1994). Learning Orientation, working
smart and effective selling. J.Mark, pp. 5839-5852.
Sutton, R.I. and March, J.G. (1997). Organizational Performance as a Dependent
Variables, Journal of Organizational Science, Vol. 8, No. 6, pp. 698.
Tan, H.B., Wong, M.F. and Noor, Z.M. (2006). Education and Growth in
Malaysian Knowledge-based Economy. Journal of Economic and
Management. Vol. 1, No. 1, pp. 141-154.
Tucker, A.L., Edmondson, A.C., and Spear, S. (2002). When problem solving
prevents organizational learning, Journal of Organizational Change
Management, Vol. 15, No. 2, pp. 122-137.
Weiner, J. (2007). Measurement: Reliability and Validity Measure, John Hopkin
Bloomberg, Schools of Public Health.
Wernerfelt, B. (1984). A resource-based view of the firm. Strategic Management
Journal, Vol. 5, No. 2, pp. 171-180.
Yamane, T. (1967). Statistics: An Introductory Analysis, 2nd Ed., New York:
Harper and Row.
Yusuf, N.A., Younis, A.J.I., and Nikbin, D. (2010). A Review Paper on
Organizational Culture and Organizational Performance. International
Journal of Business and Social Science, Vol.1, No. 3, pp. 26.
Yusufhadi M. (2002). Importance of implementing learning organization, New
Trends in Educational Technology, Learning Resource.
Zhao, Y., Calantone, R.J. and Cavusgil, S.T. (2002). Learning Orientation: Firm
innovation capability and firm performance. Industrial Mark, Vol. 31, No.
4, pp. 515-524.
Zikmund, G.W. (200). Exploring marketing research, 7th
Ed, Dryden Press,
Forth Worth.

APPENDIX A
OTHMAN YEOP ABDULLAH (OYA) GRADUATE SCHOOL OF BUSINESS
UNIVERSITI UTARA MALAYSIA
QUESTIONNAIRE FORM
THE INFLUENCE OF LEARNING ORGANIZATION TOWARDS THE
PERFORMANCE: A STUDY ON SMALL MEDIUM ENTERPRISE (SME) OF
MANUFACTURING FIRMS IN JOHOR BAHRU, JOHOR

OYA GRADUATE SCHOOL OF BUSINESS
UNIVERSITI UTARA MALAYSIA
SURVEY
FOR ACADEMIC PURPOSE ONLY
Dear respected Owner / Manager,
A SURVEY ON THE INFLUENCE OF LEARNING ORGANIZATION
TOWARDS THE PERFORMANCE OF SMALL AND MEDIUM-SIZED
ENTERPRISES (SME) IN JOHOR BAHRU, JOHOR.
Recognizing that the future of SMEs in Malaysia relies heavily on the efforts of the
SME owners such as yourself, we are eager to learn about your own experiences in
managing your business. Particularly, we are looking for information and feedback
about the influence of learning organization towards organizational performance of
SMEs. We are convinced that your contribution serves as a guideline for realizing the
positive efforts in producing more successful SMEs in Malaysia.
Therefore, you can display your commitment to develop SMEs in Malaysia by
completing this survey. We are interested in your opinions, there are no right or wrong
answers. All the information provided will be treated as confidential and will only be
used for academic purposes of my dissertation (BPMZ69912). Your participation in
completing the questionnaire is very important and critical to ensure the success of this
research. Your honesty and sincerity is very important for my research in order to attain
more clear understanding about research findings data analysis. This survey should take
approximately 20 minutes to answer. It will be an honor if you could return the
completed questionnaire before or by 4 April 2014.
We would appreciate it if you could return the questionnaire at your earliest possible
convenience. Thank you in advance for your cooperation. If you have any inquiry,
you can contact me by phone numbered 014-9049832 or e-mail me at
Yours faithfully,
_________________________
SAIFULHAFIZI BIN HASSAN
Master of Science (Management)
OYA Graduate School of Business
UUM
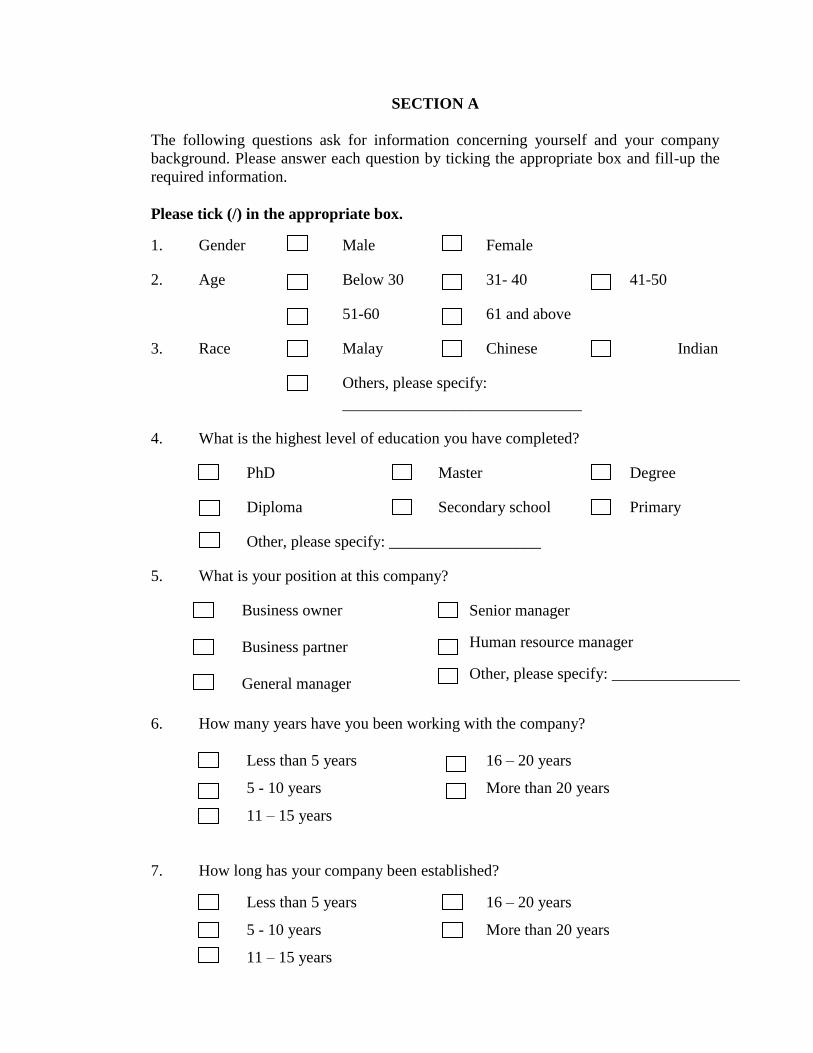
SECTION A
The following questions ask for information concerning yourself and your company
background. Please answer each question by ticking the appropriate box and fill-up the
required information.
Please tick (/) in the appropriate box.
1. Gender Male Female
2. Age Below 30 31- 40 41-50
51-60 61 and above
3. Race Malay Chinese Indian
Others, please specify:
______________________________
4. What is the highest level of education you have completed?
PhD Master Degree
Diploma Secondary school Primary
Other, please specify: ___________________
5. What is your position at this company?
Business owner
Business partner
General manager
Senior manager
Human resource manager
Other, please specify: ________________
6. How many years have you been working with the company?
Less than 5 years 16 – 20 years
5 - 10 years More than 20 years
11 – 15 years
7. How long has your company been established?
Less than 5 years 16 – 20 years
5 - 10 years More than 20 years
11 – 15 years
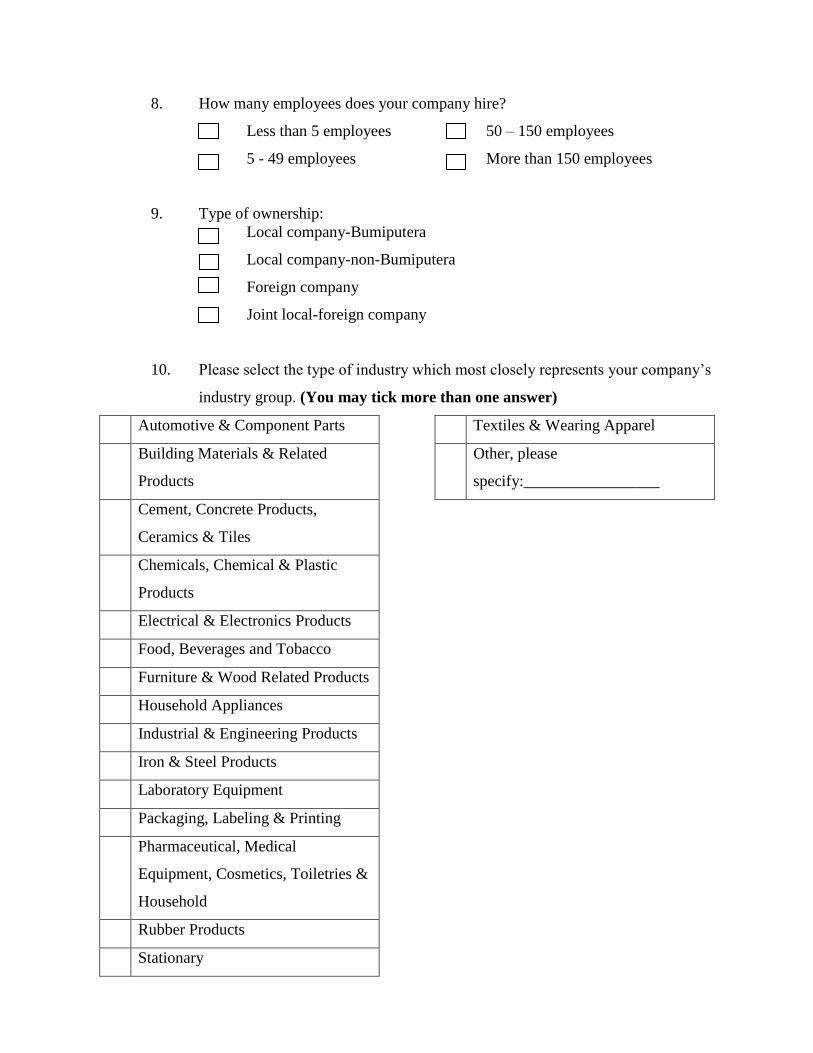
8. How many employees does your company hire?
Less than 5 employees 50 – 150 employees
5 - 49 employees More than 150 employees
9. Type of ownership:
Local company-Bumiputera
Local company-non-Bumiputera
Foreign company
Joint local-foreign company
10. Please select the type of industry which most closely represents your company’s
industry group. (You may tick more than one answer)
Automotive & Component Parts
Building Materials & Related
Products
Cement, Concrete Products,
Ceramics & Tiles
Chemicals, Chemical & Plastic
Products
Electrical & Electronics Products
Food, Beverages and Tobacco
Furniture & Wood Related Products
Household Appliances
Industrial & Engineering Products
Iron & Steel Products
Laboratory Equipment
Packaging, Labeling & Printing
Pharmaceutical, Medical
Equipment, Cosmetics, Toiletries &
Household
Rubber Products
Stationary
Textiles & Wearing Apparel
Other, please
specify:_________________
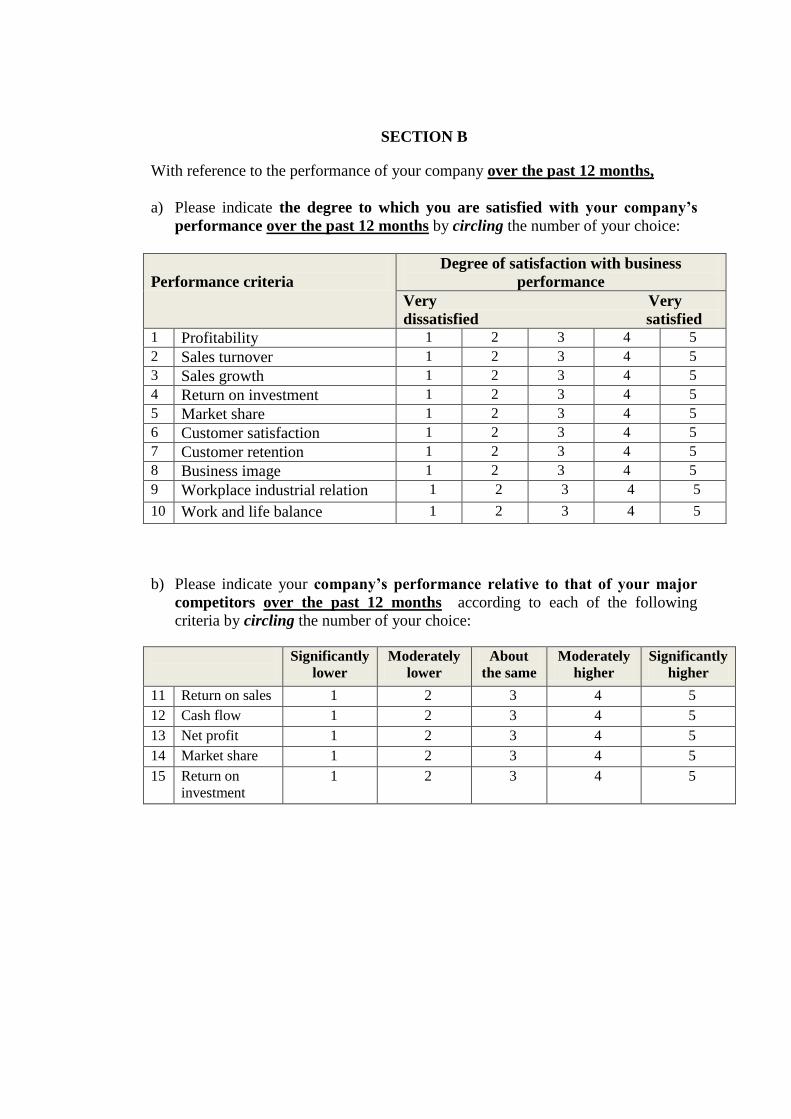
SECTION B
With reference to the performance of your company over the past 12 months,
a) Please indicate the degree to which you are satisfied with your company’s
performance over the past 12 months by circling the number of your choice:
Performance criteria
Degree of satisfaction with business
performance
Very Very
dissatisfied satisfied 1 Profitability 1 2 3 4 5
2 Sales turnover 1 2 3 4 5
3 Sales growth 1 2 3 4 5
4 Return on investment 1 2 3 4 5
5 Market share 1 2 3 4 5
6 Customer satisfaction 1 2 3 4 5
7 Customer retention 1 2 3 4 5
8 Business image 1 2 3 4 5
9 Workplace industrial relation 1 2 3 4 5
10 Work and life balance 1 2 3 4 5
b) Please indicate your company’s performance relative to that of your major
competitors over the past 12 months according to each of the following
criteria by circling the number of your choice:
Significantly
lower
Moderately
lower
About
the same
Moderately
higher
Significantly
higher
11 Return on sales 1 2 3 4 5
12 Cash flow 1 2 3 4 5
13 Net profit 1 2 3 4 5
14 Market share 1 2 3 4 5
15 Return on
investment
1 2 3 4 5
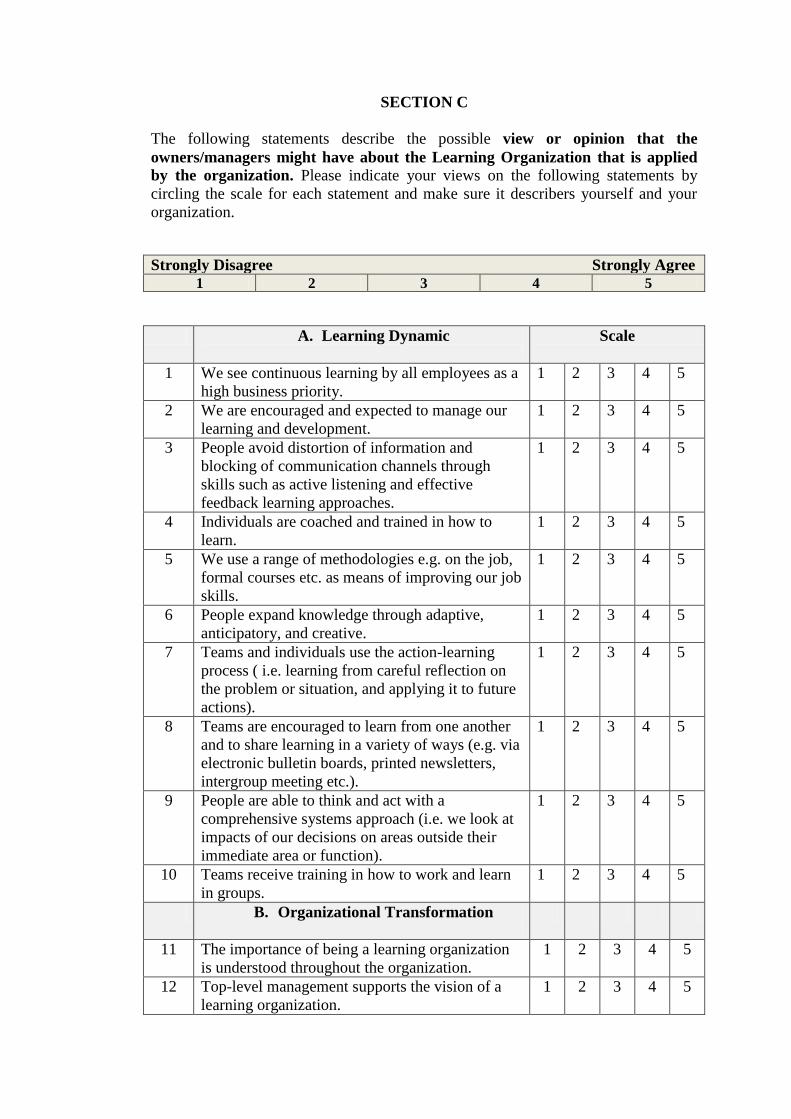
SECTION C
The following statements describe the possible view or opinion that the
owners/managers might have about the Learning Organization that is applied
by the organization. Please indicate your views on the following statements by
circling the scale for each statement and make sure it describers yourself and your
organization.
Strongly Disagree Strongly Agree
1 2 3 4 5
A. Learning Dynamic
Scale
1 We see continuous learning by all employees as a
high business priority.
1 2 3 4 5
2 We are encouraged and expected to manage our
learning and development.
1 2 3 4 5
3 People avoid distortion of information and
blocking of communication channels through
skills such as active listening and effective
feedback learning approaches.
1 2 3 4 5
4 Individuals are coached and trained in how to
learn.
1 2 3 4 5
5 We use a range of methodologies e.g. on the job,
formal courses etc. as means of improving our job
skills.
1 2 3 4 5
6 People expand knowledge through adaptive,
anticipatory, and creative.
1 2 3 4 5
7 Teams and individuals use the action-learning
process ( i.e. learning from careful reflection on
the problem or situation, and applying it to future
actions).
1 2 3 4 5
8 Teams are encouraged to learn from one another
and to share learning in a variety of ways (e.g. via
electronic bulletin boards, printed newsletters,
intergroup meeting etc.).
1 2 3 4 5
9 People are able to think and act with a
comprehensive systems approach (i.e. we look at
impacts of our decisions on areas outside their
immediate area or function).
1 2 3 4 5
10 Teams receive training in how to work and learn
in groups.
1 2 3 4 5
B. Organizational Transformation
11
The importance of being a learning organization
is understood throughout the organization.
1 2 3 4 5
12 Top-level management supports the vision of a
learning organization.
1 2 3 4 5

13 There is a climate that supports and recognizes
the importance of learning.
1 2 3 4 5
14 We are committed to continuous learning for
improvement.
1 2 3 4 5
15 We learn from our failures as well as our
successes (i.e. failures are tolerated as part of the
learning process).
1 2 3 4 5
16 We reward people and teams for learning and
helping others to learn.
1 2 3 4 5
17 Learning opportunities are incorporated into
operations and programs.
1 2 3 4 5
18 We design ways to share knowledge and enhance
learning throughout the organization (e.g.
systematic job rotation across teams, structured
on-the-job learning systems).
1 2 3 4 5
19 The organization is streamlined, with few levels
of management, to maximize communication and
learning across levels.
1 2 3 4 5
20 We coordinate on the basic of goals and learning
rather than maintaining separation in terms of
fixed departmental boundaries.
1 2 3 4 5
C. Empowering People
21 We strive to develop an empowered work force
that is able and committed to qualitative learning
and performance.
1 2 3 4 5
22 Authority is decentralized and delegated so as to
equal one’s responsibility and learning capability.
1 2 3 4 5
23 Top management and staffs work together in
partnership, to learn and solve problem together.
1 2 3 4 5
24 We take on the roles of coaching, mentoring, and
facilitating learning.
1 2 3 4 5
25 We generate and enhance learning opportunities
as well as encourage experimentation and
reflection on what was learned so that new
knowledge can be used.
1 2 3 4 5
26 We actively share information with our
customers, to obtain their ideas and inputs in
order to learn and improve services/products.
1 2 3 4 5
27 We give customers and suppliers opportunities to
participate in learning and training activities.
1 2 3 4 5
28 Learning from partners/subcontractors,
teammates, and suppliers is maximized through
up-front planning of resources and strategies
devoted to knowledge and skill acquisition.
1 2 3 4 5
29 We participate in joint learning events with
suppliers, community groups, professional
associations, and academic institutions
1 2 3 4 5
30 We actively seek learning partners amongst
customers, vendors and suppliers.
1 2 3 4 5
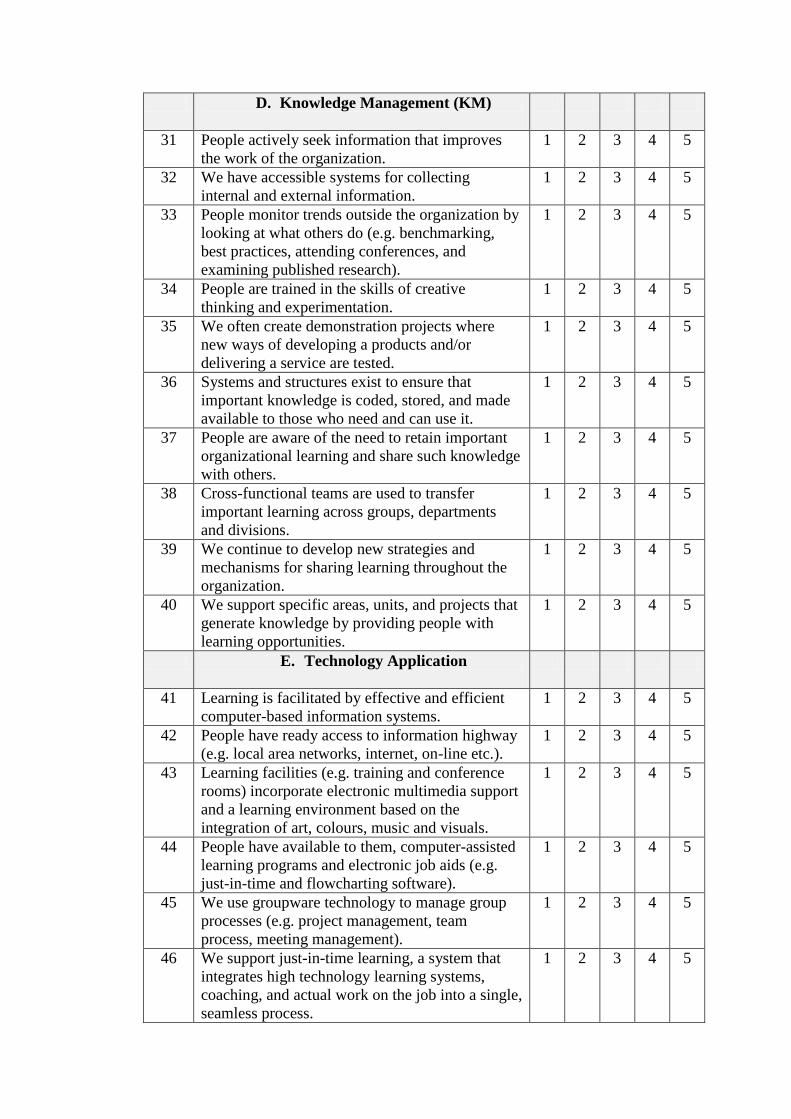
D. Knowledge Management (KM)
31 People actively seek information that improves
the work of the organization.
1 2 3 4 5
32 We have accessible systems for collecting
internal and external information.
1 2 3 4 5
33 People monitor trends outside the organization by
looking at what others do (e.g. benchmarking,
best practices, attending conferences, and
examining published research).
1 2 3 4 5
34 People are trained in the skills of creative
thinking and experimentation.
1 2 3 4 5
35 We often create demonstration projects where
new ways of developing a products and/or
delivering a service are tested.
1 2 3 4 5
36 Systems and structures exist to ensure that
important knowledge is coded, stored, and made
available to those who need and can use it.
1 2 3 4 5
37 People are aware of the need to retain important
organizational learning and share such knowledge
with others.
1 2 3 4 5
38 Cross-functional teams are used to transfer
important learning across groups, departments
and divisions.
1 2 3 4 5
39 We continue to develop new strategies and
mechanisms for sharing learning throughout the
organization.
1 2 3 4 5
40 We support specific areas, units, and projects that
generate knowledge by providing people with
learning opportunities.
1 2 3 4 5
E. Technology Application
41 Learning is facilitated by effective and efficient
computer-based information systems.
1 2 3 4 5
42 People have ready access to information highway
(e.g. local area networks, internet, on-line etc.).
1 2 3 4 5
43 Learning facilities (e.g. training and conference
rooms) incorporate electronic multimedia support
and a learning environment based on the
integration of art, colours, music and visuals.
1 2 3 4 5
44 People have available to them, computer-assisted
learning programs and electronic job aids (e.g.
just-in-time and flowcharting software).
1 2 3 4 5
45 We use groupware technology to manage group
processes (e.g. project management, team
process, meeting management).
1 2 3 4 5
46 We support just-in-time learning, a system that
integrates high technology learning systems,
coaching, and actual work on the job into a single,
seamless process.
1 2 3 4 5

47 Our electronic performance support systems
enable us to learn and to do our work better.
1 2 3 4 5
48 We design and tailor our electronic performance
support systems to meet our learning needs.
1 2 3 4 5
49 People have full access to the data they need to do
their jobs effectively.
1 2 3 4 5
50 We can adapt software systems to collect, code,
store, create, and transfer information in ways
best suited to meet our needs.
1 2 3 4 5
SECTION D
Please provide your own experiences and comments you wish to make:
Thank you for your cooperation

APPENDIX B
1. Reliability Test for Pilot Test
2. Normality Test
3. Descriptive Analysis
4. Validity Test
5. Reliability Test
6. Correlation Analysis
7. Multiple Regression Analysis
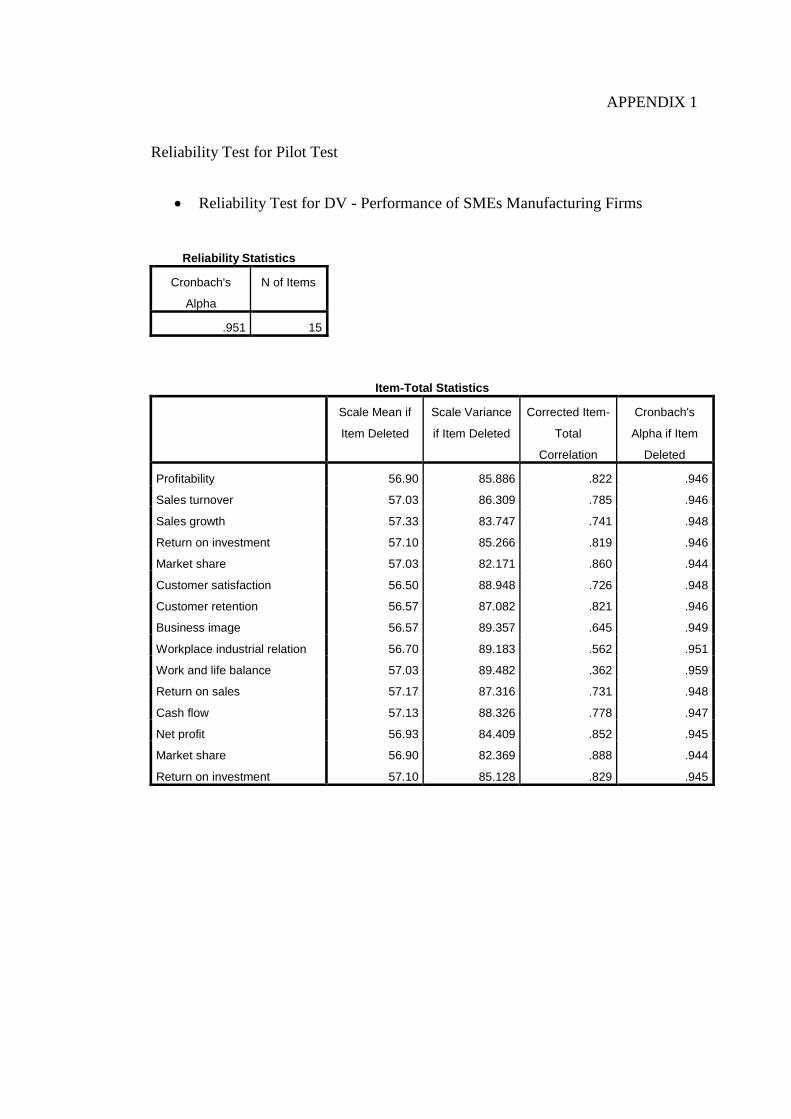
APPENDIX 1
Reliability Test for Pilot Test
Reliability Test for DV - Performance of SMEs Manufacturing Firms
Reliability Statistics
Cronbach's
Alpha
N of Items
.951 15
Item-Total Statistics
Scale Mean if
Item Deleted
Scale Variance
if Item Deleted
Corrected Item-
Total
Correlation
Cronbach's
Alpha if Item
Deleted
Profitability 56.90 85.886 .822 .946
Sales turnover 57.03 86.309 .785 .946
Sales growth 57.33 83.747 .741 .948
Return on investment 57.10 85.266 .819 .946
Market share 57.03 82.171 .860 .944
Customer satisfaction 56.50 88.948 .726 .948
Customer retention 56.57 87.082 .821 .946
Business image 56.57 89.357 .645 .949
Workplace industrial relation 56.70 89.183 .562 .951
Work and life balance 57.03 89.482 .362 .959
Return on sales 57.17 87.316 .731 .948
Cash flow 57.13 88.326 .778 .947
Net profit 56.93 84.409 .852 .945
Market share 56.90 82.369 .888 .944
Return on investment 57.10 85.128 .829 .945

Reliability Test for DV 1 - Overall Performance of SMEs Manufacturing
Firms
Reliability Statistics
Cronbach's
Alpha
N of Items
.912 10
Item-Total Statistics
Scale Mean if
Item Deleted
Scale Variance
if Item Deleted
Corrected Item-
Total
Correlation
Cronbach's
Alpha if Item
Deleted
Profitability 37.13 34.326 .818 .896
Sales turnover 37.27 34.685 .769 .898
Sales growth 37.57 33.495 .682 .904
Return on investment 37.33 34.644 .735 .900
Market share 37.27 32.685 .786 .896
Customer satisfaction 36.73 36.409 .704 .903
Customer retention 36.80 35.131 .812 .897
Business image 36.80 36.028 .699 .903
Workplace industrial relation 36.93 35.857 .610 .907
Work and life balance 37.27 35.720 .404 .927

Reliability Test for DV 2 - Performance of SMEs Manufacturing Firms
relative to their major competitors
Reliability Statistics
Cronbach's
Alpha
N of Items
.931 5
Item-Total Statistics
Scale Mean if
Item Deleted
Scale Variance
if Item Deleted
Corrected Item-
Total
Correlation
Cronbach's
Alpha if Item
Deleted
Return on sales 15.93 9.375 .749 .928
Cash flow 15.90 10.024 .729 .932
Net profit 15.70 8.493 .867 .905
Market share 15.67 7.885 .896 .901
Return on investment 15.87 8.602 .871 .905
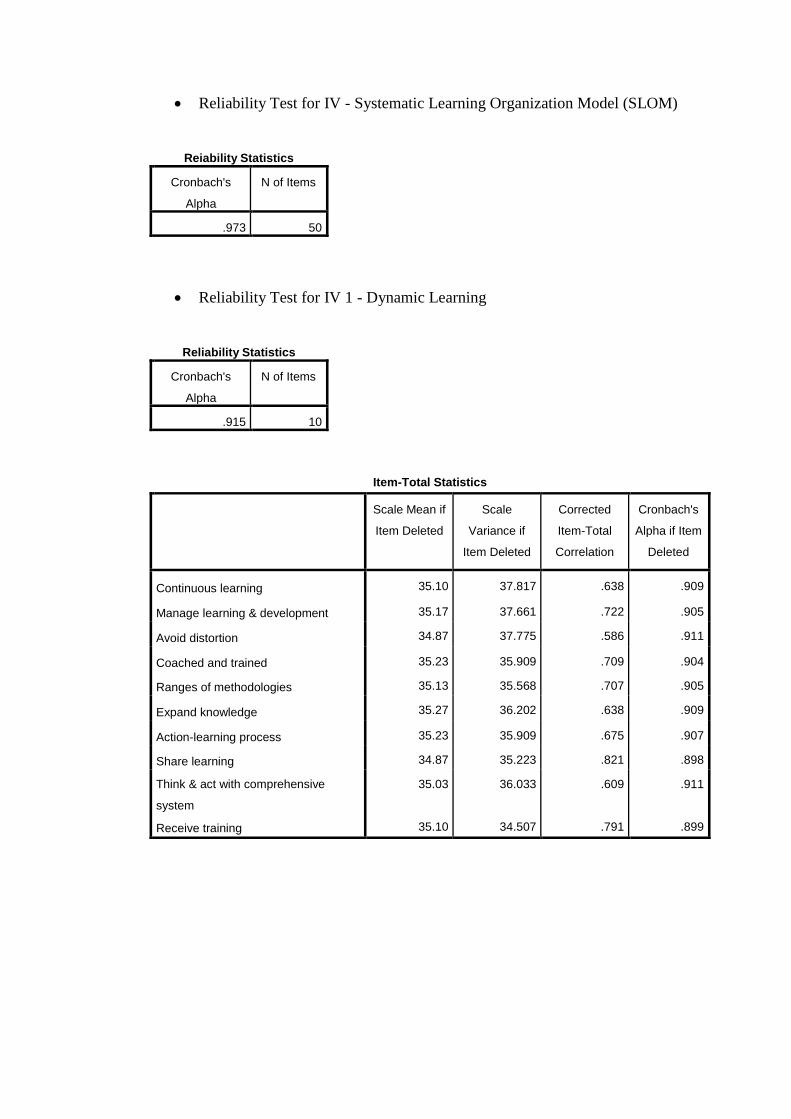
Reliability Test for IV - Systematic Learning Organization Model (SLOM)
Reiability Statistics
Cronbach's
Alpha
N of Items
.973 50
Reliability Test for IV 1 - Dynamic Learning
Reliability Statistics
Cronbach's
Alpha
N of Items
.915 10
Item-Total Statistics
Scale Mean if
Item Deleted
Scale
Variance if
Item Deleted
Corrected
Item-Total
Correlation
Cronbach's
Alpha if Item
Deleted
Continuous learning 35.10 37.817 .638 .909
Manage learning & development 35.17 37.661 .722 .905
Avoid distortion 34.87 37.775 .586 .911
Coached and trained 35.23 35.909 .709 .904
Ranges of methodologies 35.13 35.568 .707 .905
Expand knowledge 35.27 36.202 .638 .909
Action-learning process 35.23 35.909 .675 .907
Share learning 34.87 35.223 .821 .898
Think & act with comprehensive
system
35.03 36.033 .609 .911
Receive training 35.10 34.507 .791 .899
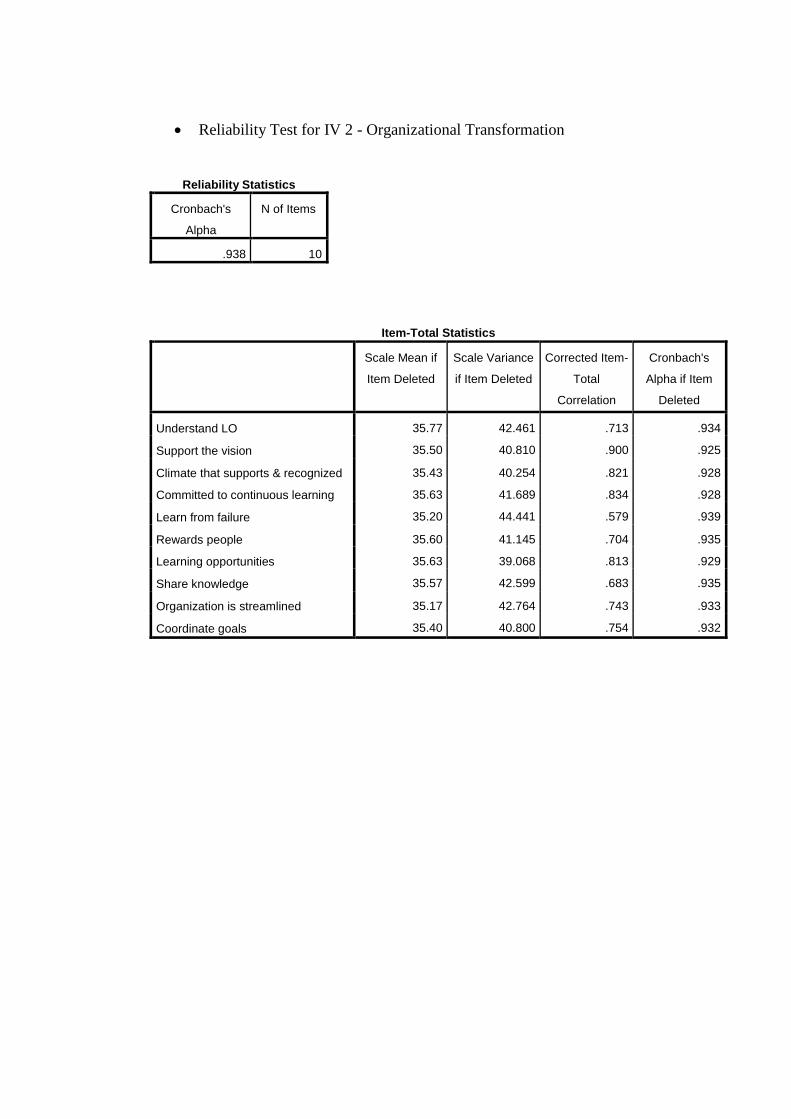
Reliability Test for IV 2 - Organizational Transformation
Reliability Statistics
Cronbach's
Alpha
N of Items
.938 10
Item-Total Statistics
Scale Mean if
Item Deleted
Scale Variance
if Item Deleted
Corrected Item-
Total
Correlation
Cronbach's
Alpha if Item
Deleted
Understand LO 35.77 42.461 .713 .934
Support the vision 35.50 40.810 .900 .925
Climate that supports & recognized 35.43 40.254 .821 .928
Committed to continuous learning 35.63 41.689 .834 .928
Learn from failure 35.20 44.441 .579 .939
Rewards people 35.60 41.145 .704 .935
Learning opportunities 35.63 39.068 .813 .929
Share knowledge 35.57 42.599 .683 .935
Organization is streamlined 35.17 42.764 .743 .933
Coordinate goals 35.40 40.800 .754 .932
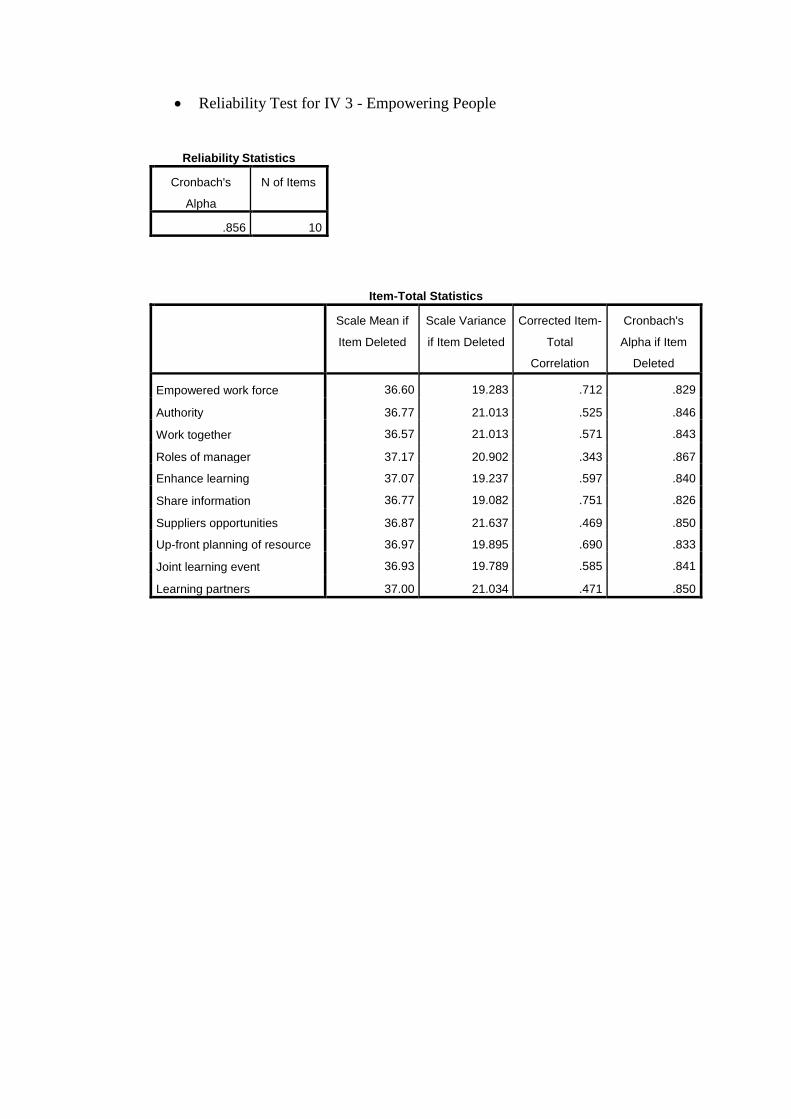
Reliability Test for IV 3 - Empowering People
Reliability Statistics
Cronbach's
Alpha
N of Items
.856 10
Item-Total Statistics
Scale Mean if
Item Deleted
Scale Variance
if Item Deleted
Corrected Item-
Total
Correlation
Cronbach's
Alpha if Item
Deleted
Empowered work force 36.60 19.283 .712 .829
Authority 36.77 21.013 .525 .846
Work together 36.57 21.013 .571 .843
Roles of manager 37.17 20.902 .343 .867
Enhance learning 37.07 19.237 .597 .840
Share information 36.77 19.082 .751 .826
Suppliers opportunities 36.87 21.637 .469 .850
Up-front planning of resource 36.97 19.895 .690 .833
Joint learning event 36.93 19.789 .585 .841
Learning partners 37.00 21.034 .471 .850

Reliability Test for IV 4 - Knowledge Management
Reliability Statistics
Cronbach's
Alpha
N of Items
.902 10
Item-Total Statistics
Scale Mean if
Item Deleted
Scale Variance
if Item Deleted
Corrected
Item-Total
Correlation
Cronbach's
Alpha if Item
Deleted
Information to improve 38.07 28.478 .229 .913
Internal & external info 38.13 26.671 .619 .896
Monitor trends 38.20 25.200 .654 .892
Creative thinking & experimentation 38.50 24.810 .628 .893
Demonstration projects 38.40 24.248 .782 .884
System & structure 38.53 23.568 .727 .887
Retain learning 38.77 22.185 .836 .878
Cross-functional teams 38.80 22.441 .784 .883
New strategies & mechanisms 38.43 24.668 .583 .897
Specific areas, units, & projects 38.47 24.602 .695 .889
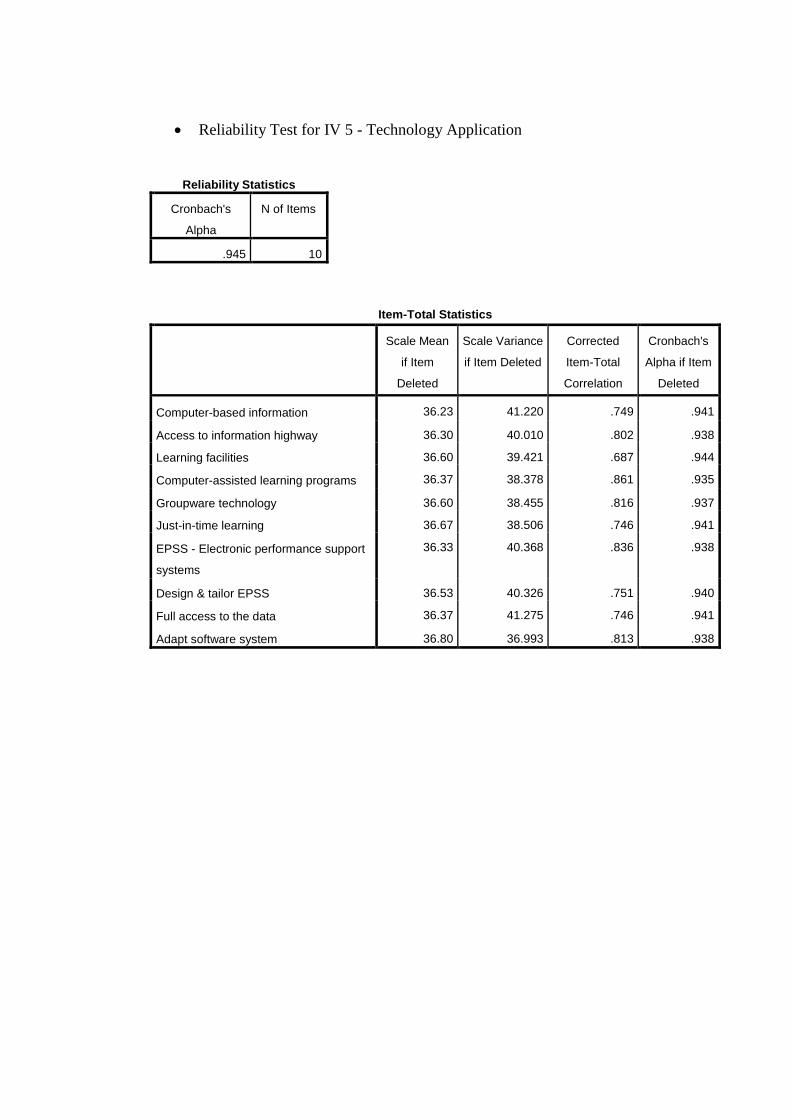
Reliability Test for IV 5 - Technology Application
Reliability Statistics
Cronbach's
Alpha
N of Items
.945 10
Item-Total Statistics
Scale Mean
if Item
Deleted
Scale Variance
if Item Deleted
Corrected
Item-Total
Correlation
Cronbach's
Alpha if Item
Deleted
Computer-based information 36.23 41.220 .749 .941
Access to information highway 36.30 40.010 .802 .938
Learning facilities 36.60 39.421 .687 .944
Computer-assisted learning programs 36.37 38.378 .861 .935
Groupware technology 36.60 38.455 .816 .937
Just-in-time learning 36.67 38.506 .746 .941
EPSS - Electronic performance support
systems
36.33 40.368 .836 .938
Design & tailor EPSS 36.53 40.326 .751 .940
Full access to the data 36.37 41.275 .746 .941
Adapt software system 36.80 36.993 .813 .938

APPENDIX 2
Normality Test
Normality Test for DV 1 - Overall Performance of SMEs Manufacturing
Firms
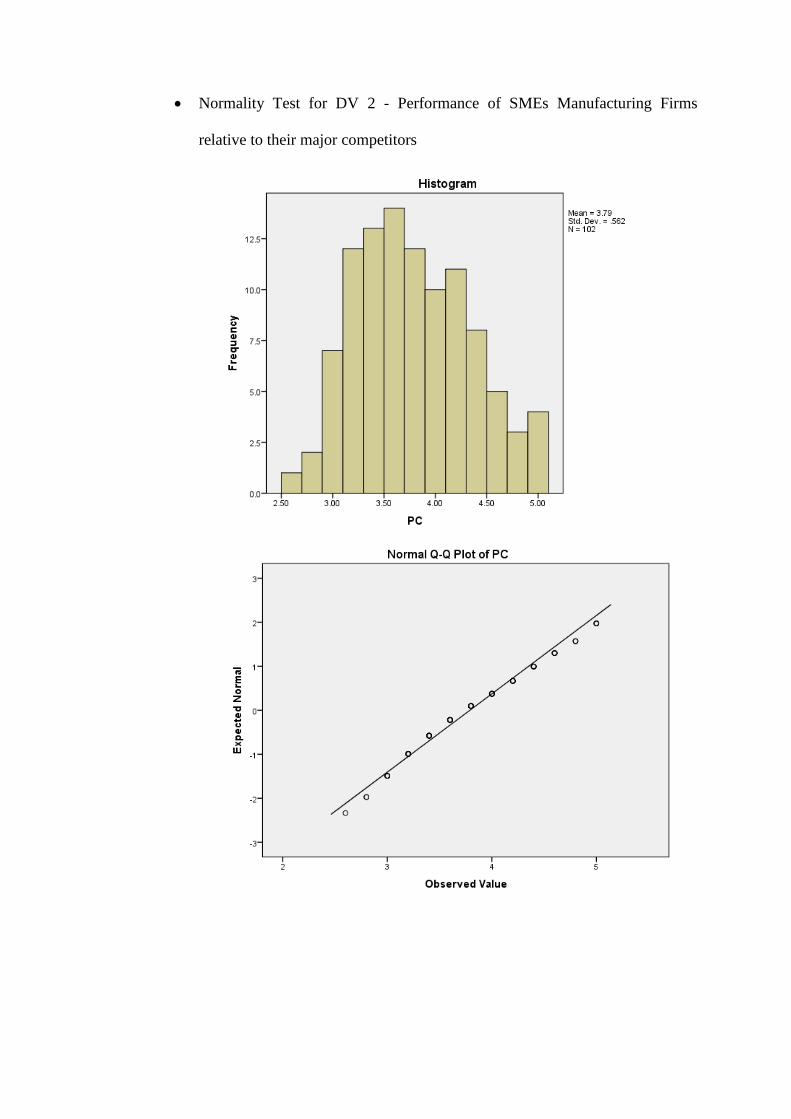
Normality Test for DV 2 - Performance of SMEs Manufacturing Firms
relative to their major competitors
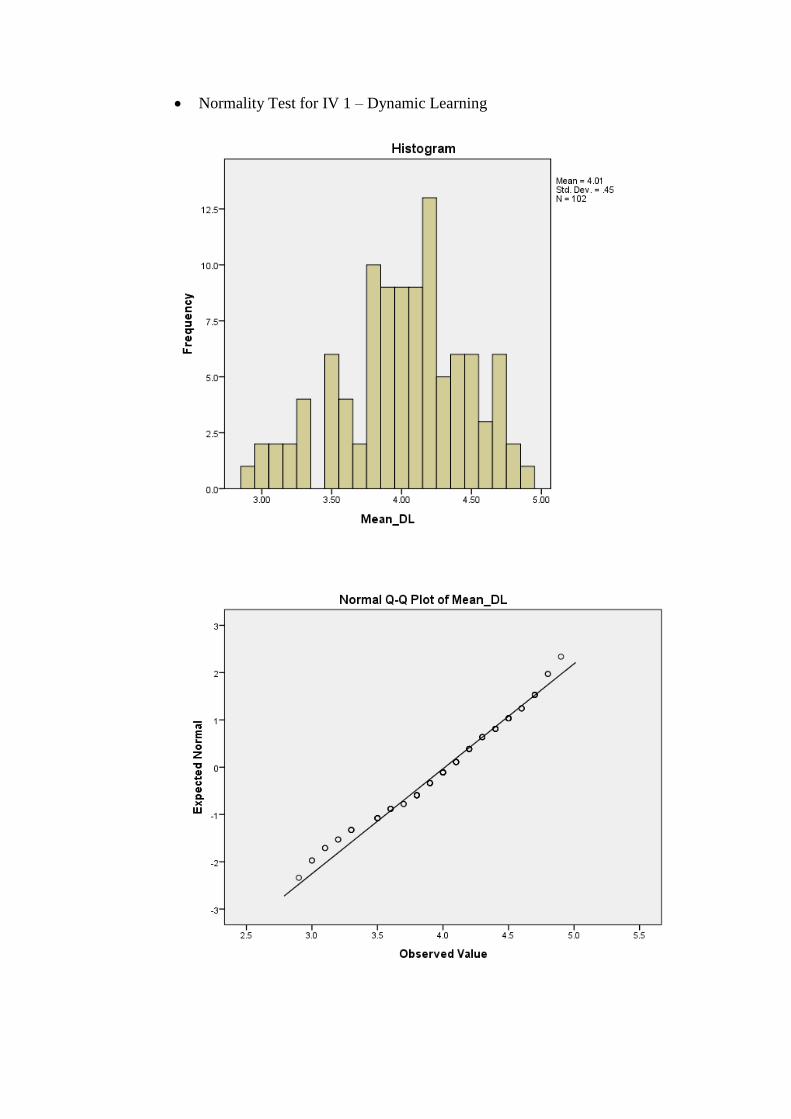
Normality Test for IV 1 – Dynamic Learning
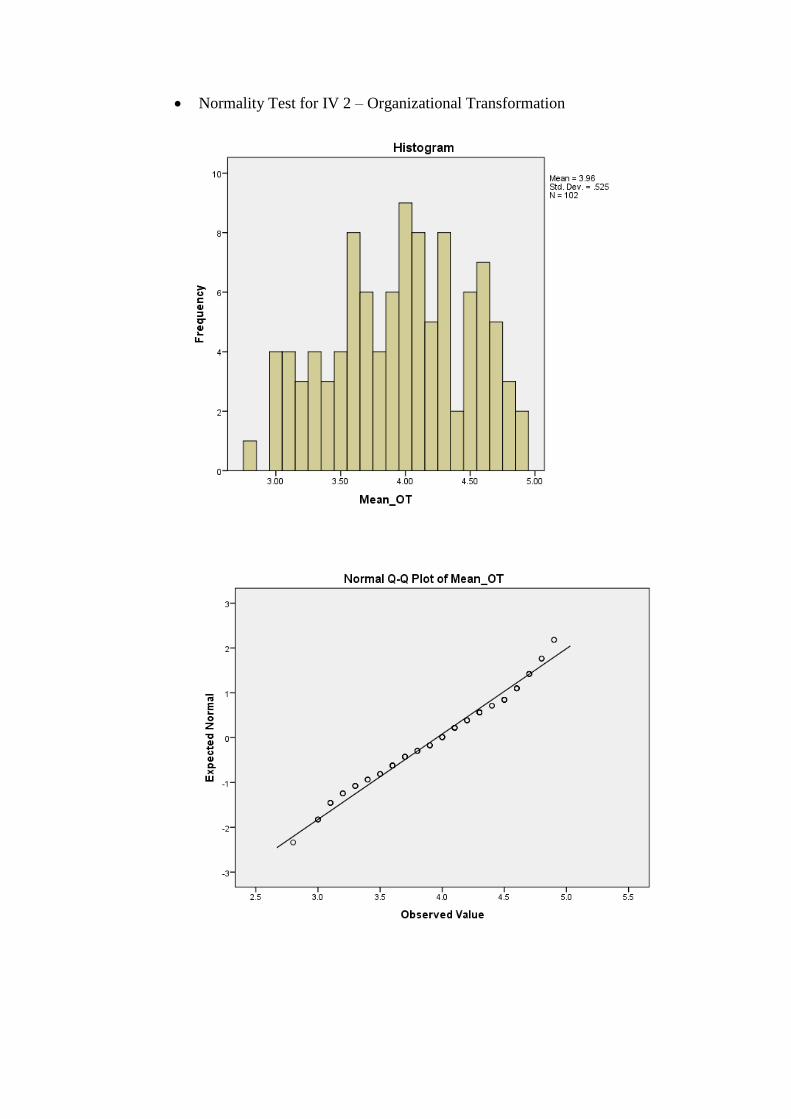
Normality Test for IV 2 – Organizational Transformation

Normality Test for IV 3 – Empowering People
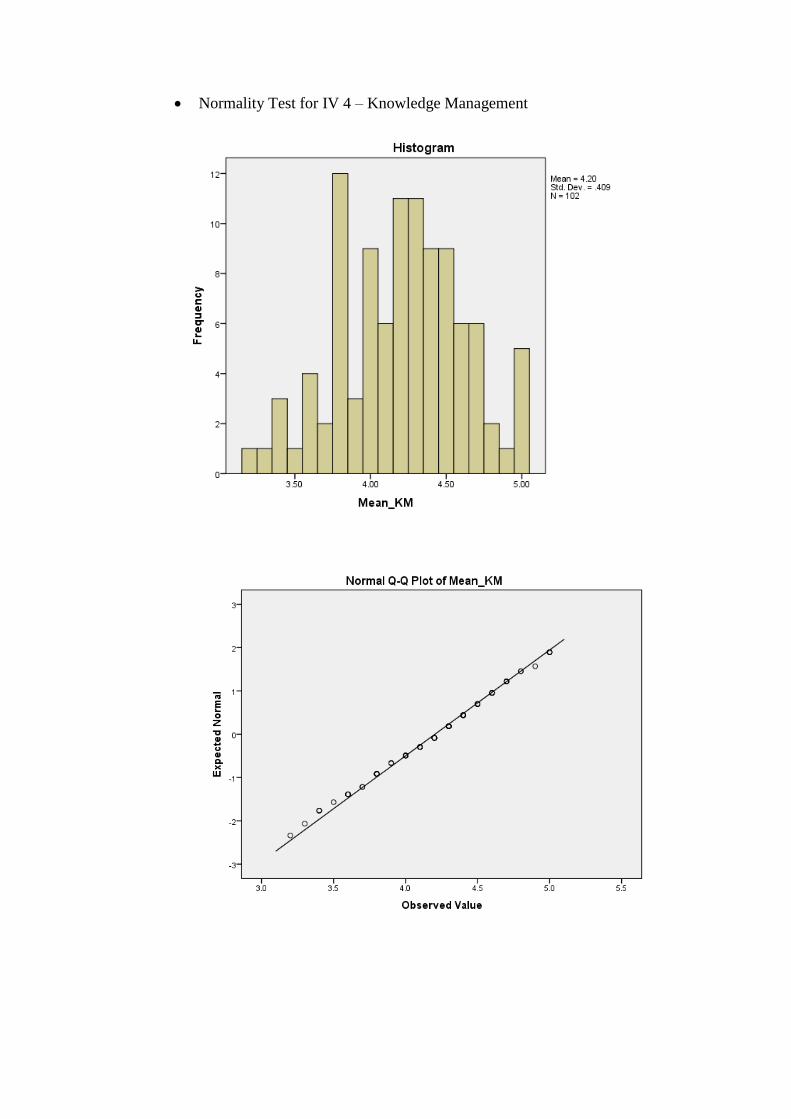
Normality Test for IV 4 – Knowledge Management
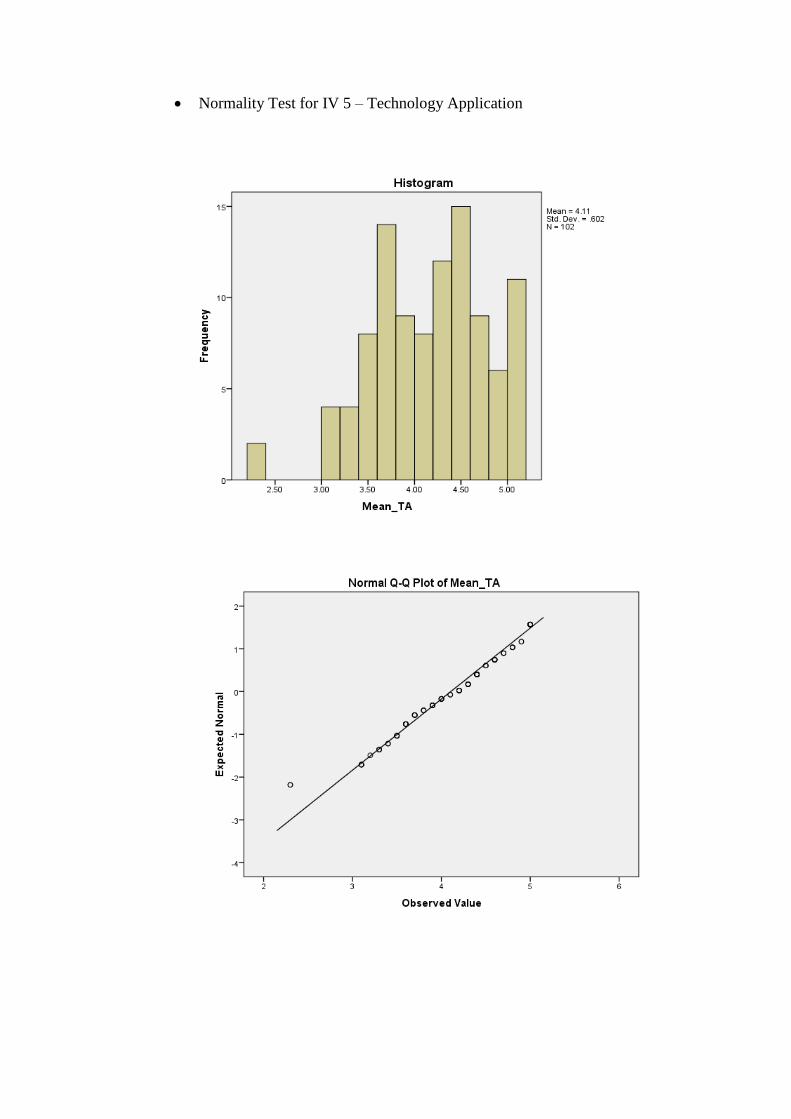
Normality Test for IV 5 – Technology Application
APPENDIX 3
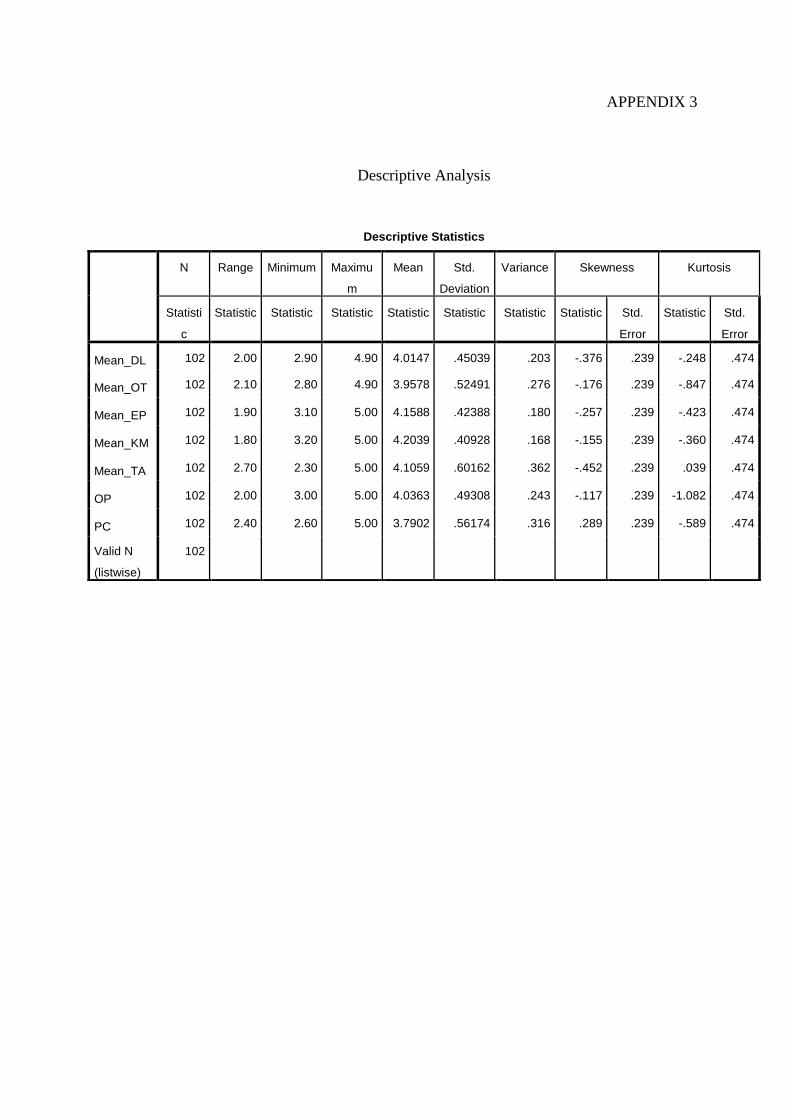
Descriptive Analysis
Descriptive Statistics
N Range Minimum Maximu
m
Mean Std.
Deviation
Variance Skewness Kurtosis
Statisti
c
Statistic Statistic Statistic Statistic Statistic Statistic Statistic Std.
Error
Statistic Std.
Error
Mean_DL 102 2.00 2.90 4.90 4.0147 .45039 .203 -.376 .239 -.248 .474
Mean_OT 102 2.10 2.80 4.90 3.9578 .52491 .276 -.176 .239 -.847 .474
Mean_EP 102 1.90 3.10 5.00 4.1588 .42388 .180 -.257 .239 -.423 .474
Mean_KM 102 1.80 3.20 5.00 4.2039 .40928 .168 -.155 .239 -.360 .474
Mean_TA 102 2.70 2.30 5.00 4.1059 .60162 .362 -.452 .239 .039 .474
OP 102 2.00 3.00 5.00 4.0363 .49308 .243 -.117 .239 -1.082 .474
PC 102 2.40 2.60 5.00 3.7902 .56174 .316 .289 .239 -.589 .474
Valid N
(listwise)
102
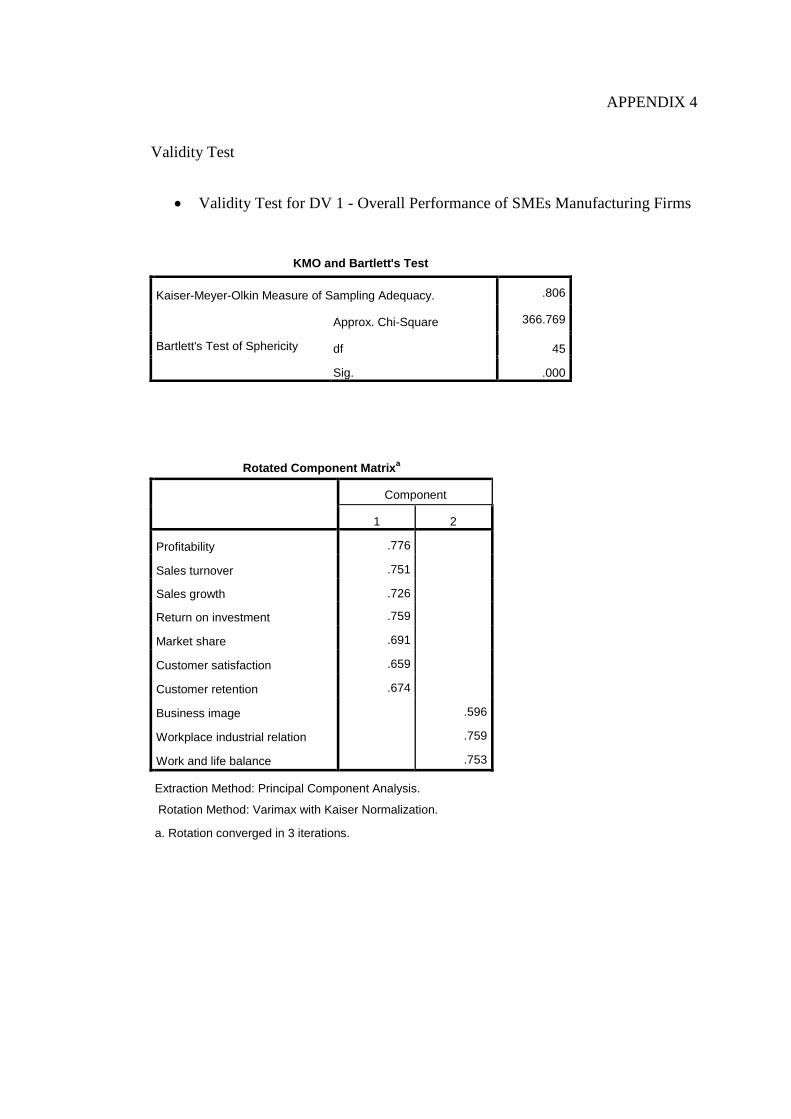
APPENDIX 4
Validity Test
Validity Test for DV 1 - Overall Performance of SMEs Manufacturing Firms
KMO and Bartlett's Test
Kaiser-Meyer-Olkin Measure of Sampling Adequacy. .806
Bartlett's Test of Sphericity
Approx. Chi-Square 366.769
df 45
Sig. .000
Rotated Component Matrixa
Component
1 2
Profitability .776
Sales turnover .751
Sales growth .726
Return on investment .759
Market share .691
Customer satisfaction .659
Customer retention .674
Business image .596
Workplace industrial relation .759
Work and life balance .753
Extraction Method: Principal Component Analysis.
Rotation Method: Varimax with Kaiser Normalization.
a. Rotation converged in 3 iterations.
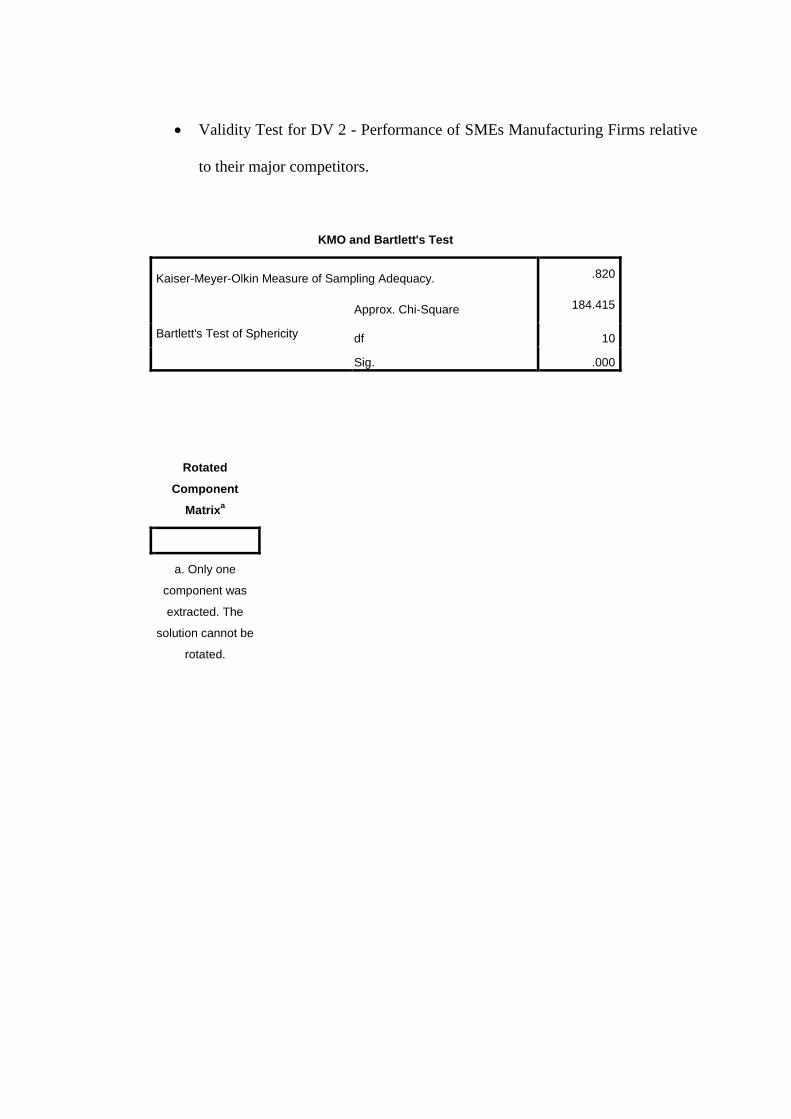
Validity Test for DV 2 - Performance of SMEs Manufacturing Firms relative
to their major competitors.
KMO and Bartlett's Test
Kaiser-Meyer-Olkin Measure of Sampling Adequacy. .820
Bartlett's Test of Sphericity
Approx. Chi-Square 184.415
df 10
Sig. .000
Rotated
Component
Matrixa
a. Only one
component was
extracted. The
solution cannot be
rotated.
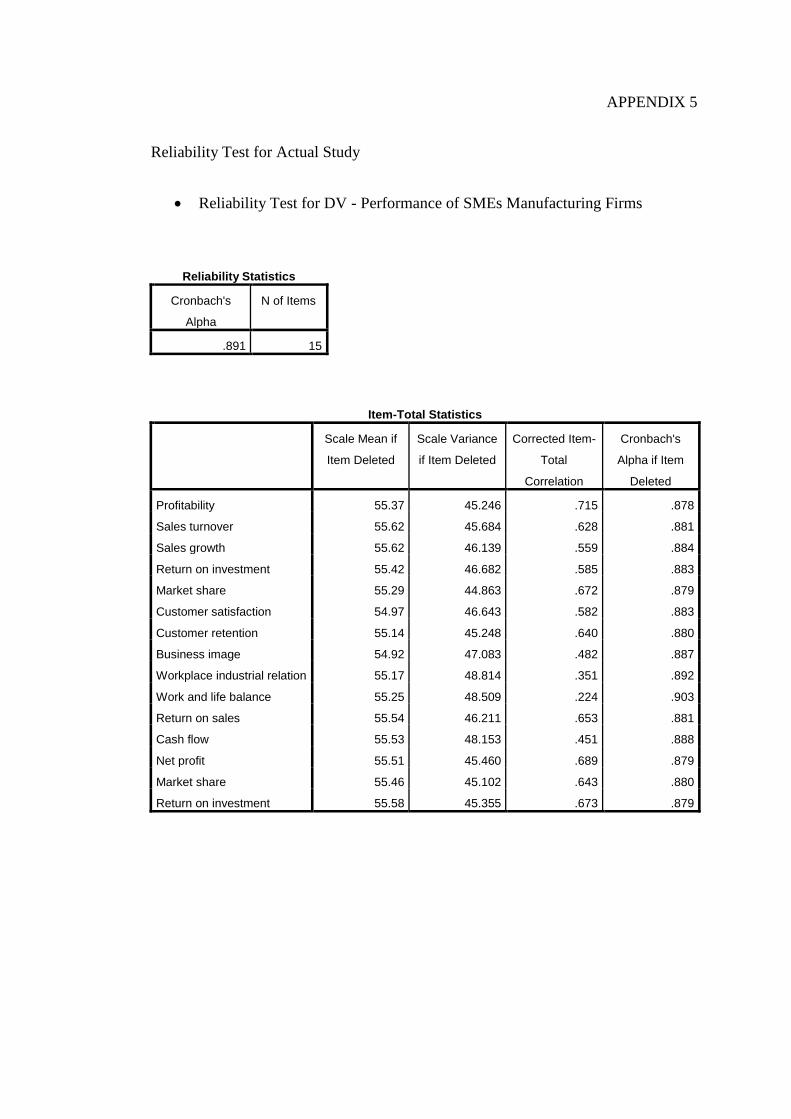
APPENDIX 5
Reliability Test for Actual Study
Reliability Test for DV - Performance of SMEs Manufacturing Firms
Reliability Statistics
Cronbach's
Alpha
N of Items
.891 15
Item-Total Statistics
Scale Mean if
Item Deleted
Scale Variance
if Item Deleted
Corrected Item-
Total
Correlation
Cronbach's
Alpha if Item
Deleted
Profitability 55.37 45.246 .715 .878
Sales turnover 55.62 45.684 .628 .881
Sales growth 55.62 46.139 .559 .884
Return on investment 55.42 46.682 .585 .883
Market share 55.29 44.863 .672 .879
Customer satisfaction 54.97 46.643 .582 .883
Customer retention 55.14 45.248 .640 .880
Business image 54.92 47.083 .482 .887
Workplace industrial relation 55.17 48.814 .351 .892
Work and life balance 55.25 48.509 .224 .903
Return on sales 55.54 46.211 .653 .881
Cash flow 55.53 48.153 .451 .888
Net profit 55.51 45.460 .689 .879
Market share 55.46 45.102 .643 .880
Return on investment 55.58 45.355 .673 .879
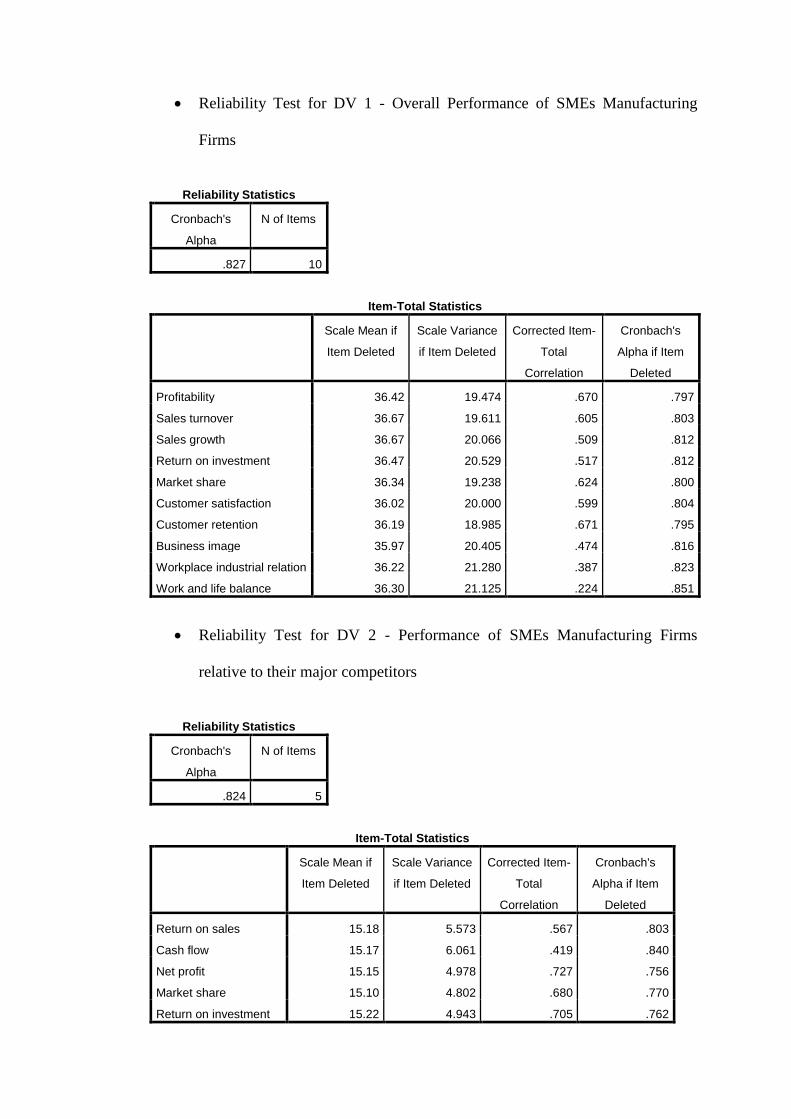
Reliability Test for DV 1 - Overall Performance of SMEs Manufacturing
Firms
Reliability Statistics
Cronbach's
Alpha
N of Items
.827 10
Item-Total Statistics
Scale Mean if
Item Deleted
Scale Variance
if Item Deleted
Corrected Item-
Total
Correlation
Cronbach's
Alpha if Item
Deleted
Profitability 36.42 19.474 .670 .797
Sales turnover 36.67 19.611 .605 .803
Sales growth 36.67 20.066 .509 .812
Return on investment 36.47 20.529 .517 .812
Market share 36.34 19.238 .624 .800
Customer satisfaction 36.02 20.000 .599 .804
Customer retention 36.19 18.985 .671 .795
Business image 35.97 20.405 .474 .816
Workplace industrial relation 36.22 21.280 .387 .823
Work and life balance 36.30 21.125 .224 .851
Reliability Test for DV 2 - Performance of SMEs Manufacturing Firms
relative to their major competitors
Reliability Statistics
Cronbach's
Alpha
N of Items
.824 5
Item-Total Statistics
Scale Mean if
Item Deleted
Scale Variance
if Item Deleted
Corrected Item-
Total
Correlation
Cronbach's
Alpha if Item
Deleted
Return on sales 15.18 5.573 .567 .803
Cash flow 15.17 6.061 .419 .840
Net profit 15.15 4.978 .727 .756
Market share 15.10 4.802 .680 .770
Return on investment 15.22 4.943 .705 .762
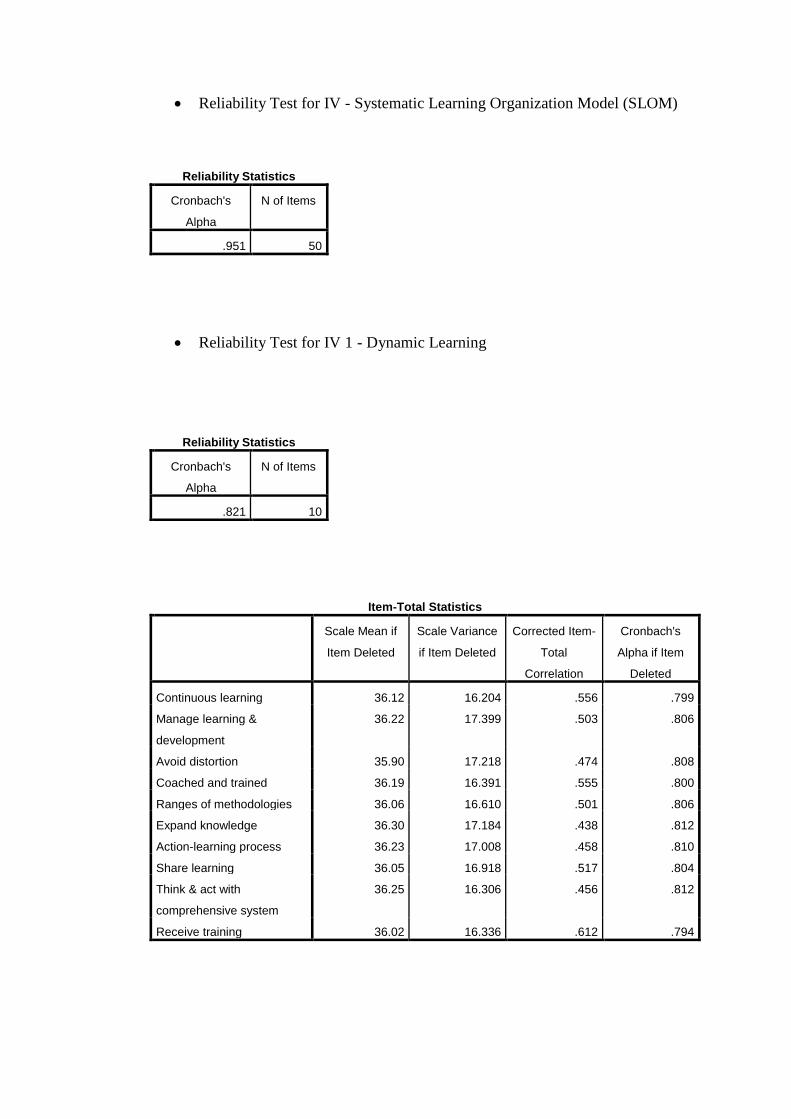
Reliability Test for IV - Systematic Learning Organization Model (SLOM)
Reliability Statistics
Cronbach's
Alpha
N of Items
.951 50
Reliability Test for IV 1 - Dynamic Learning
Reliability Statistics
Cronbach's
Alpha
N of Items
.821 10
Item-Total Statistics
Scale Mean if
Item Deleted
Scale Variance
if Item Deleted
Corrected Item-
Total
Correlation
Cronbach's
Alpha if Item
Deleted
Continuous learning 36.12 16.204 .556 .799
Manage learning &
development
36.22 17.399 .503 .806
Avoid distortion 35.90 17.218 .474 .808
Coached and trained 36.19 16.391 .555 .800
Ranges of methodologies 36.06 16.610 .501 .806
Expand knowledge 36.30 17.184 .438 .812
Action-learning process 36.23 17.008 .458 .810
Share learning 36.05 16.918 .517 .804
Think & act with
comprehensive system
36.25 16.306 .456 .812
Receive training 36.02 16.336 .612 .794
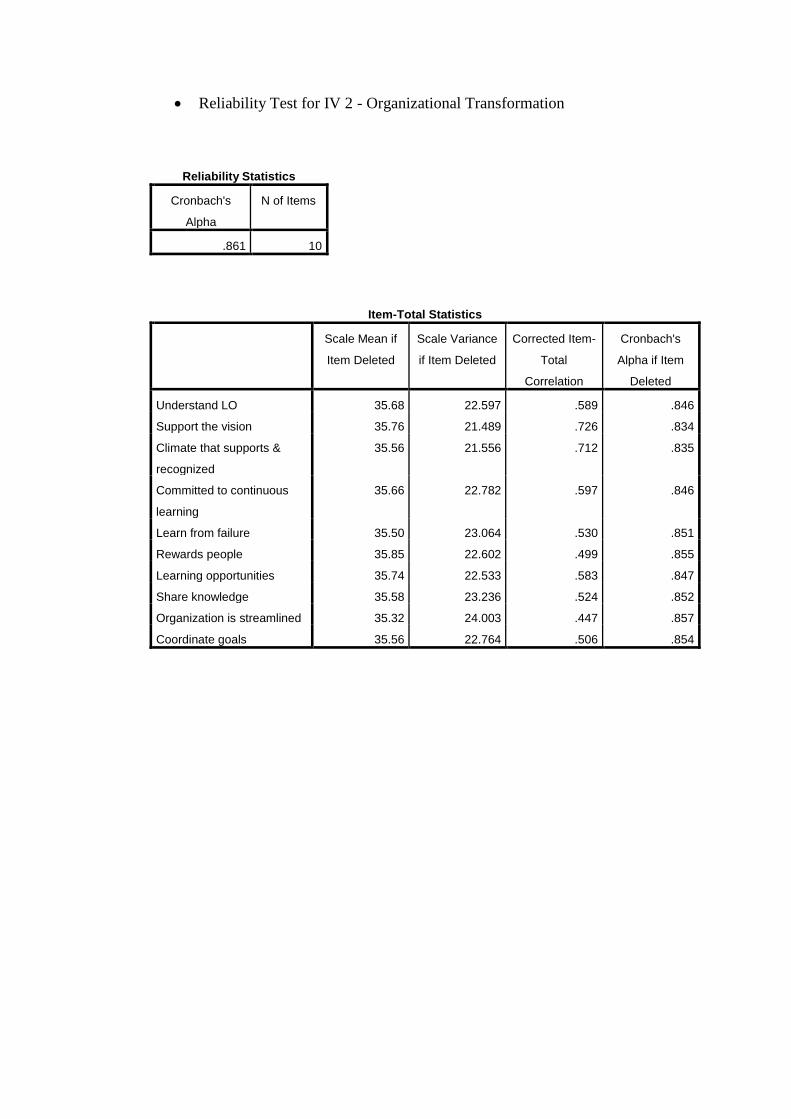
Reliability Test for IV 2 - Organizational Transformation
Reliability Statistics
Cronbach's
Alpha
N of Items
.861 10
Item-Total Statistics
Scale Mean if
Item Deleted
Scale Variance
if Item Deleted
Corrected Item-
Total
Correlation
Cronbach's
Alpha if Item
Deleted
Understand LO 35.68 22.597 .589 .846
Support the vision 35.76 21.489 .726 .834
Climate that supports &
recognized
35.56 21.556 .712 .835
Committed to continuous
learning
35.66 22.782 .597 .846
Learn from failure 35.50 23.064 .530 .851
Rewards people 35.85 22.602 .499 .855
Learning opportunities 35.74 22.533 .583 .847
Share knowledge 35.58 23.236 .524 .852
Organization is streamlined 35.32 24.003 .447 .857
Coordinate goals 35.56 22.764 .506 .854
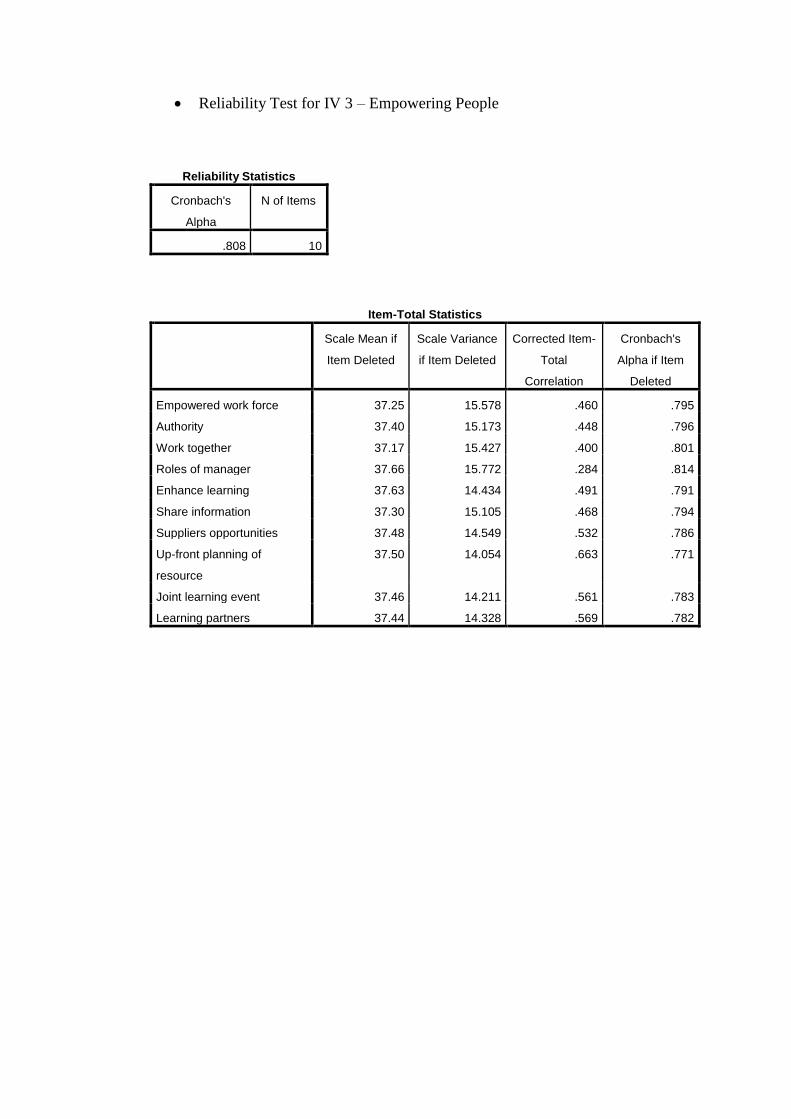
Reliability Test for IV 3 – Empowering People
Reliability Statistics
Cronbach's
Alpha
N of Items
.808 10
Item-Total Statistics
Scale Mean if
Item Deleted
Scale Variance
if Item Deleted
Corrected Item-
Total
Correlation
Cronbach's
Alpha if Item
Deleted
Empowered work force 37.25 15.578 .460 .795
Authority 37.40 15.173 .448 .796
Work together 37.17 15.427 .400 .801
Roles of manager 37.66 15.772 .284 .814
Enhance learning 37.63 14.434 .491 .791
Share information 37.30 15.105 .468 .794
Suppliers opportunities 37.48 14.549 .532 .786
Up-front planning of
resource
37.50 14.054 .663 .771
Joint learning event 37.46 14.211 .561 .783
Learning partners 37.44 14.328 .569 .782

Reliability Test for IV 4 – Knowledge Management
Reliability Statistics
Cronbach's
Alpha
N of Items
.807 10
Item-Total Statistics
Scale Mean if
Item Deleted
Scale Variance
if Item Deleted
Corrected Item-
Total
Correlation
Cronbach's
Alpha if Item
Deleted
Information to improve 37.49 15.044 .339 .803
Internal & external info 37.71 13.358 .645 .772
Monitor trends 37.75 14.009 .410 .798
Creative thinking &
experimentation
37.97 13.989 .427 .796
Demonstration projects 37.88 13.412 .588 .778
System & structure 37.76 14.499 .385 .800
Retain learning 37.95 13.948 .510 .787
Cross-functional teams 38.14 13.704 .458 .793
New strategies &
mechanisms
37.82 13.236 .551 .781
Specific areas, units, &
projects
37.87 13.399 .525 .785

Reliability Test for IV 5 – Technology Application
Reliability Statistics
Cronbach's
Alpha
N of Items
.919 10
Item-Total Statistics
Scale Mean if
Item Deleted
Scale Variance
if Item Deleted
Corrected Item-
Total
Correlation
Cronbach's
Alpha if Item
Deleted
Computer-based
information
36.65 31.300 .651 .913
Access to information
highway
36.85 29.513 .708 .910
Learning facilities 36.97 29.237 .720 .909
Computer-assisted learning
programs
36.92 29.103 .712 .909
Groupware technology 36.95 28.899 .739 .908
Just-in-time learning 37.03 29.811 .632 .914
EPSS - Electronic
performance support
systems
36.75 30.627 .685 .911
Design & tailor EPSS 36.99 29.356 .716 .909
Full access to the data 37.04 30.256 .658 .913
Adapt software system 37.38 27.724 .761 .907
APPENDIX 6
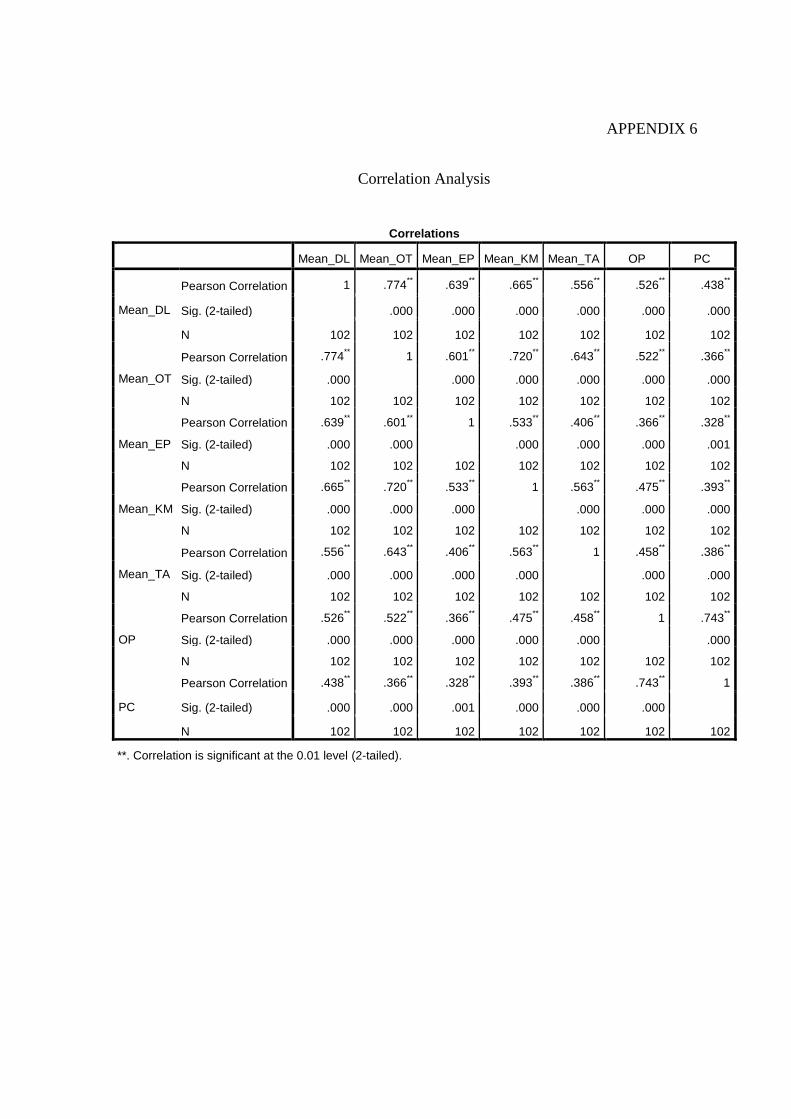
Correlation Analysis
Correlations
Mean_DL Mean_OT Mean_EP Mean_KM Mean_TA OP PC
Mean_DL
Pearson Correlation 1 .774** .639
** .665
** .556
** .526
** .438
**
Sig. (2-tailed) .000 .000 .000 .000 .000 .000
N 102 102 102 102 102 102 102
Mean_OT
Pearson Correlation .774** 1 .601
** .720
** .643
** .522
** .366
**
Sig. (2-tailed) .000 .000 .000 .000 .000 .000
N 102 102 102 102 102 102 102
Mean_EP
Pearson Correlation .639** .601
** 1 .533
** .406
** .366
** .328
**
Sig. (2-tailed) .000 .000 .000 .000 .000 .001
N 102 102 102 102 102 102 102
Mean_KM
Pearson Correlation .665** .720
** .533
** 1 .563
** .475
** .393
**
Sig. (2-tailed) .000 .000 .000 .000 .000 .000
N 102 102 102 102 102 102 102
Mean_TA
Pearson Correlation .556** .643
** .406
** .563
** 1 .458
** .386
**
Sig. (2-tailed) .000 .000 .000 .000 .000 .000
N 102 102 102 102 102 102 102
OP
Pearson Correlation .526** .522
** .366
** .475
** .458
** 1 .743
**
Sig. (2-tailed) .000 .000 .000 .000 .000 .000
N 102 102 102 102 102 102 102
PC
Pearson Correlation .438** .366
** .328
** .393
** .386
** .743
** 1
Sig. (2-tailed) .000 .000 .001 .000 .000 .000
N 102 102 102 102 102 102 102
**. Correlation is significant at the 0.01 level (2-tailed).
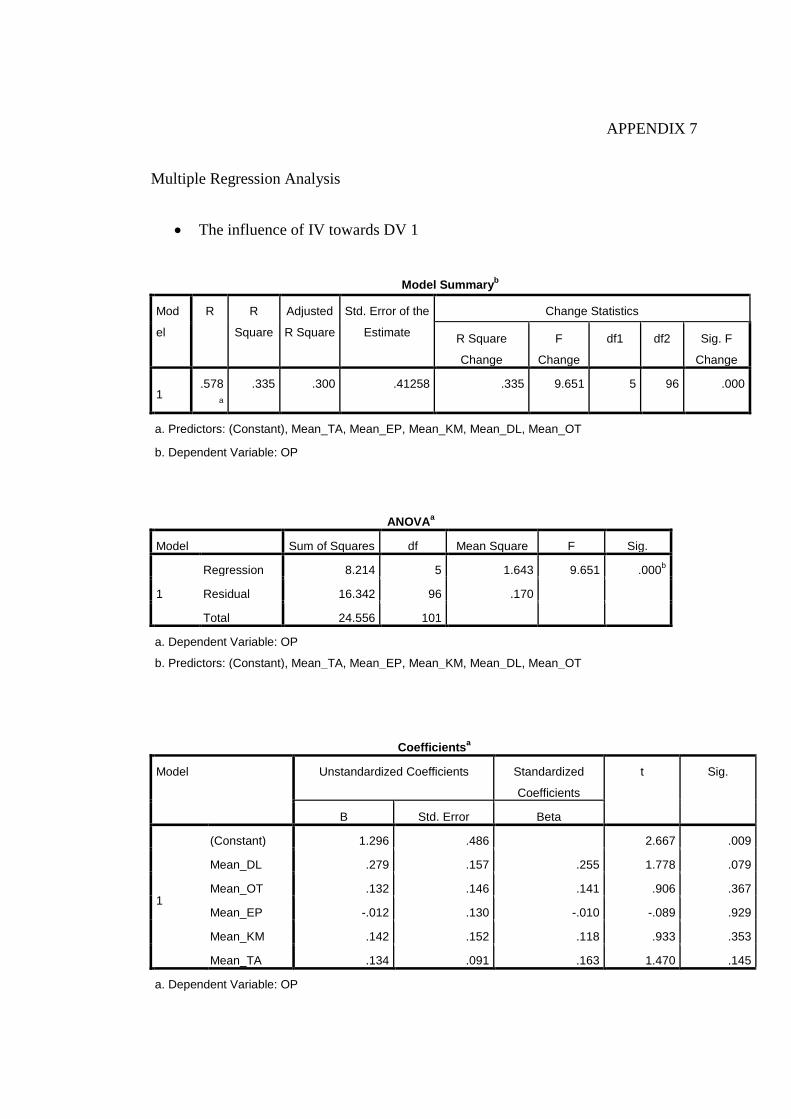
APPENDIX 7
Multiple Regression Analysis
The influence of IV towards DV 1
Model Summaryb
Mod
el
R R
Square
Adjusted
R Square
Std. Error of the
Estimate
Change Statistics
R Square
Change
F
Change
df1 df2 Sig. F
Change
1 .578
a
.335 .300 .41258 .335 9.651 5 96 .000
a. Predictors: (Constant), Mean_TA, Mean_EP, Mean_KM, Mean_DL, Mean_OT
b. Dependent Variable: OP
ANOVAa
Model Sum of Squares df Mean Square F Sig.
1
Regression 8.214 5 1.643 9.651 .000b
Residual 16.342 96 .170
Total 24.556 101
a. Dependent Variable: OP
b. Predictors: (Constant), Mean_TA, Mean_EP, Mean_KM, Mean_DL, Mean_OT
Coefficientsa
Model Unstandardized Coefficients Standardized
Coefficients
t Sig.
B Std. Error Beta
1
(Constant) 1.296 .486 2.667 .009
Mean_DL .279 .157 .255 1.778 .079
Mean_OT .132 .146 .141 .906 .367
Mean_EP -.012 .130 -.010 -.089 .929
Mean_KM .142 .152 .118 .933 .353
Mean_TA .134 .091 .163 1.470 .145
a. Dependent Variable: OP
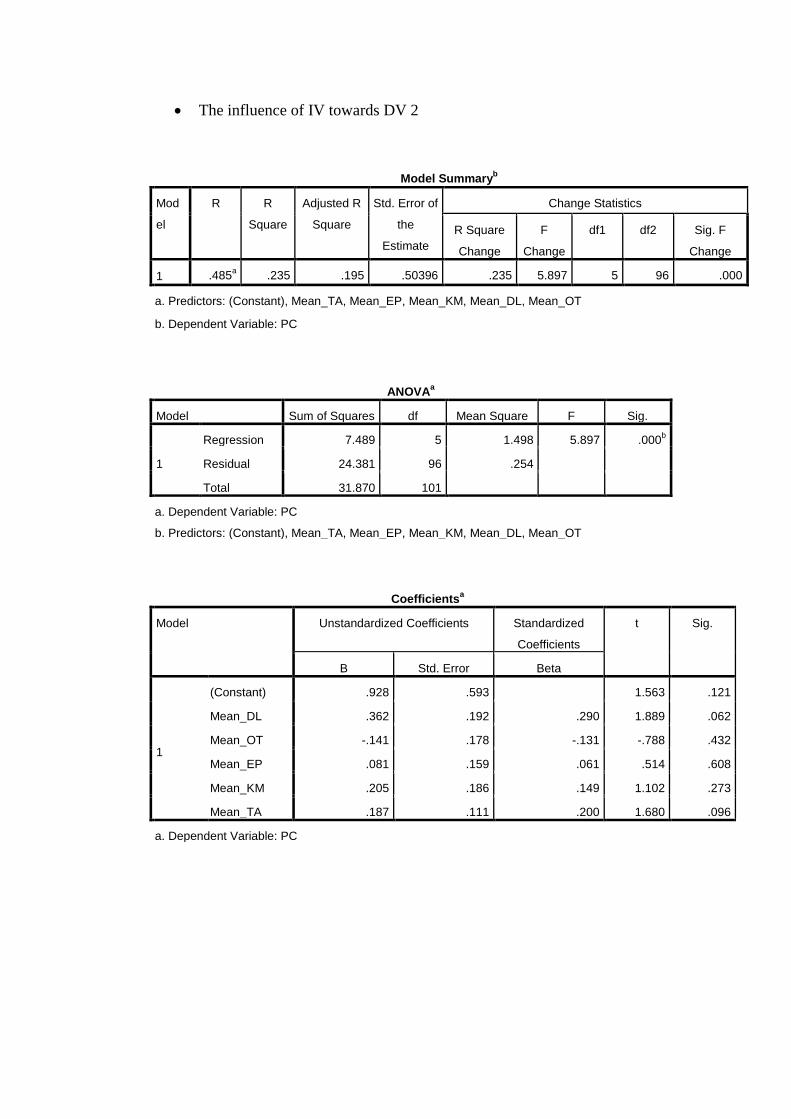
The influence of IV towards DV 2
Model Summaryb
Mod
el
R R
Square
Adjusted R
Square
Std. Error of
the
Estimate
Change Statistics
R Square
Change
F
Change
df1 df2 Sig. F
Change
1 .485a .235 .195 .50396 .235 5.897 5 96 .000
a. Predictors: (Constant), Mean_TA, Mean_EP, Mean_KM, Mean_DL, Mean_OT
b. Dependent Variable: PC
ANOVAa
Model Sum of Squares df Mean Square F Sig.
1
Regression 7.489 5 1.498 5.897 .000b
Residual 24.381 96 .254
Total 31.870 101
a. Dependent Variable: PC
b. Predictors: (Constant), Mean_TA, Mean_EP, Mean_KM, Mean_DL, Mean_OT
Coefficientsa
Model Unstandardized Coefficients Standardized
Coefficients
t Sig.
B Std. Error Beta
1
(Constant) .928 .593 1.563 .121
Mean_DL .362 .192 .290 1.889 .062
Mean_OT -.141 .178 -.131 -.788 .432
Mean_EP .081 .159 .061 .514 .608
Mean_KM .205 .186 .149 1.102 .273
Mean_TA .187 .111 .200 1.680 .096
a. Dependent Variable: PC