the influence of service quality towards
TRANSCRIPT
1/26/2017 Turnitin Originality Report
file:///C:/Users/Windows10/Desktop/Turnitin_Originality_Report_762497483.html 1/26
1
2
3
4
5
6
7
8
9
10
11
12
13
14
15
Turnitin Originality Report
THE INFLUENCE OF SERVICE QUALITY TOWARDS SUPPLIER SATISFACTION INONLINE MARKETPLACE (A CASE STUDY AT PT. DEKORUMA INOVASI LESTARI)by Ine Kristine
From Morning class (Skripsi 2016)
Processed on 25Jan2017 16:51 WIBID: 762497483Word Count: 13043
Similarity Index17%Similarity by Source
Internet Sources:11%
Publications:4%
Student Papers:11%
sources:
1% match (Internet from 04Mar2016)http://ccsenet.org/journal/index.php/ibr/article/download/36201/21232
< 1% match (Internet from 18Dec2013)http://www.statisticshowto.com/whatisthepearsoncorrelationcoefficient/
< 1% match (student papers from 04Jul2012)Submitted to Jumeirah English Speaking School on 20120704
< 1% match (Internet from 27Apr2015)http://digitalcommons.unl.edu/cgi/viewcontent.cgi?article=2947&context=libphilprac
< 1% match (Internet from 15Aug2016)http://chemistry.about.com/od/mathsciencefundamentals/ss/StandardDeviationEquations.htm?globeResourc=
< 1% match (student papers from 08Feb2014)Submitted to London School of Marketing on 20140208
< 1% match (Internet from 21Jan2015)http://epubl.ltu.se/14045508/2005/087/LTUSHUEX05087SE.pdf
< 1% match (Internet from 04Jun2016)http://tmimtjournal.org/Pdf/conferencepapers2015.pdf
< 1% match (publications)Harrison, Brent, and David L. Roberts. "Using sequential observations to model and predictplayer behavior", Proceedings of the 6th International Conference on Foundations of Digital
Games FDG 11 FDG 11, 2011.
< 1% match (student papers from 04Jun2014)Submitted to Universiti Sains Malaysia on 20140604
< 1% match (Internet from 11Nov2009)http://nsolaunion.sflu.com/stat1.html
< 1% match (student papers from 11Jan2015)Submitted to Universiti Teknologi MARA on 20150111
< 1% match (Internet from 13Mar2015)http://formulas.tutorvista.com/math/weightedmeanformula.html
< 1% match (Internet from 24Mar2015)http://www.ukessays.com/essays/psychology/themeasureofcorrelationpsychologyessay.php
< 1% match (student papers from 23Jul2013)Submitted to Universitas Pendidikan Indonesia on 20130723
THE INFLUENCE OF SERVICE QUALITY TOWARDS
SUPPLIER SATISFACTION IN ONLINE FURNITURE
MARKETPLACE
(A CASE STUDY AT DEKORUMA.COM)
By:
Ine Kristine Siahaan
ID No. 014201300079
A skripsi presented to the
Faculty of Business President University
In partial fulfillment of the requirements for
Bachelor Degree in Economics Major of Management
February 2017
PANEL OF EXAMINERS
APPROVAL SHEET
The Panel of Examiners declares that the skripsi entitled “The
Influence of Service Quality towards Supplier Satisfaction in
Marketplace: A Case Study of PT. Dekoruma Inovasi Lestari” that
was submitted by Ine Kristine Siahaan majoring in Management from
the Faculty of Economics was assessed and approved to have passed to
Oral Examinations on 3 February, 2017.
Ir. Erny E. Hutabarat, MBA
Chair – Panel of Examiners
Siska Purnama Manurung, S.Kom., MM
Examiner 1
Christina Liem, S. T., M. Comm.
Examiner 2

iii
DECLARATION OF
ORIGINALITY
I declare that this skripsi, entitled “The Influence of Service Quality
towards Supplier Satisfaction in Online Marketplace: A Case
Study of PT. Dekoruma Inovasi Lestari” is, to the best of my
knowledge and beliefs, an original piece of work that has not been
submitted, either in a whole or in a part, to another university to obtain
a degree.
Cikarang, 03 February 2017
INE KRISTINE SIAHAAN
iv
ACKNOWLEDGEMENT
Thank to God, for his mercy and guidance, I would be able to finish this research
as the requirement for Bachelor Degree. There are no words can explain and
described how grateful I am, as I accomplied three years at President University.
Through this opportunity, I would like to show my gratitude to the important people
in my life:
1. My beloved family, from My Father, My Mother, and My Brother. I’m so
lucky to have all of you in my life. Thank you for the unlimited support and
encouragement you guys gave to me during this final project. Thank you for
everuthing. I love you so much.
2. My thesis advisor, Mam Erny Hutabarat for the patience and knowledge you
have given to me. A Thank you for the support and direction to help me for
being able to finish this skripsi in time. To understand me well, thank you
so much for your guidance, attention, patience, and kindness. I’m grateful
to have you as my skripsi advisor.
3. A special thanks to Budep’s Family, Arthia Josephine, Rike Nindita, and
Hana Merissa for your support and encouragement that you’ve given to me.
4. A special thanks to Pembegal Hati’s Family, Sandra Dethiona, Inesa
Margaretta, and Dessi Lucas who always supporting me and praying for me.
I hope we can always keep in touch.
5. A special thanks for my MKS Family who always give me a support even
from far away.
6. A special thanks for my Komsel sister that always give support and
encouragement.
7. A special thanks for Kak Dimas, as the co-Founder and CEO of
Dekoruma.com whoa allow me to do the research about the company and
give me advice also correction.
8. A special thanks for my senior in PT. Dekoruma Inovasi Lestari who help
me and give me an encouragement.

v
9. A special thanks for Jessica and Florencia who always give me a help in
data collection and give me amny support.
10. To all my friends batch 2013, seniors, and all the lecturers also entire
employees in President University that cannot mention one by one, thank
and good luck for a great journey.
Cikarang, 03 February 2017
Ine Kristine Siahaan
vi
ABSTRACT
Online marketplace has been growing rapidly in the last decade and affect many
business sector. There are many online marketplace in various sector, but only a
few that sell home and living product. In online marketplace, not only customer
supplier position also has important role to build online marketplace as the product
seller. The online marketplace need long-relationship in build their business and
improve supplier performance. The purpose of this research is to see through
service quality that would affect the supplier satisfaction in online marketplace. The
theoretical framework focused on the Tangible (X1), Reliability (X2),
Responsiveness (X3), Empathy (X4), and Assurance (X5) as independent variables
and Supplier Satisfaction (Y) as the dependent variable. This research used
quantitative approach using primary data. The study have found that among 5
variables, only Assurance that has significance influence towards supplier
satisfaction while Tangible, Reliability, Responsiveness and Empathy don’t have
significant influence towards Supplier Satisfaction. Thus, in future Dekoruma.com
can be focus in build that four aspects with their supplier.
Key words: service quality, tangible, reliability, responsiveness, empathy,
assurance, supplier satisfaction and online marketplace.
vii
TABLE OF CONTENT
PANEL OF EXAMINERS APPROVAL SHEET ........................................................ ii
DECLARATION OF ORIGINALITY ......................................................................... iii
ACKNOWLEDGEMENT .............................................................................................. iv
ABSTRACT ..................................................................................................................... vi
TABLE OF CONTENT ................................................................................................ vii
TURNITIN RESULT ................................................................................................... viii
LIST OF TABLES .......................................................................................................... xi
LIST OF FIGURE ......................................................................................................... xii
LIST OF FORMULA ................................................................................................... xiii
CHAPTER 1 INTRODUCTION .................................................................................... 1
1.1 Research Background ................................................................................................... 1
1.2 Problem Identification .................................................................................................. 3
1.3 Problem Statement ....................................................................................................... 5
1.4 Research Objectives ..................................................................................................... 5
1.5 Research Limitations .................................................................................................... 6
1.6 Significance of the Study ............................................................................................. 7
1.7 Terms of Definition ...................................................................................................... 8
CHAPTER II LITERATURE REVIEW ....................................................................... 9
2.1 Service Quality ............................................................................................................. 9
2.1.1 Tangible .................................................................................................................. 10
2.1.2 Reliability ................................................................................................................ 10
2.1.3 Responsiveness ....................................................................................................... 10
2.1.4 Empathy .................................................................................................................. 11
2.1.5 Assurance ................................................................................................................ 11
2.2 Supplier ...................................................................................................................... 11
2.3 Satisfaction ................................ ................................................................................ 12
viii
2.4 Supplier Satisfaction .................................................................................................. 12
2.5 Service Quality to Supplier Satisfaction .................................................................... 12
2.6 Electronic Commerce ................................................................................................. 13
2.7 Previous Study ........................................................................................................... 14
2.8 Research Gap ............................................................................................................. 19
2.9 Theoritical Framework .............................................................................................. 19
2.10 Hypothesis ............................................................................................................... 20
CHAPTER II RESEARCH METHOD ....................................................................... 21
3.1 Introduction ................................................................................................................ 21
3.2 Research Framework .................................................................................................. 21
3.3 Research Instrument ................................................................................................... 23
3.3.1 Primary Data ........................................................................................................... 23
3.3.2 Sescondary Data ...................................................................................................... 24
3.4 Sampling .................................................................................................................... 24
3.4.1 Population ............................................................................................................... 24
3.4.2 Sample Size ............................................................................................................ 24
3.4.3 Sampling Technique ................................................................................................ 25
3.5 Statistical Treatment ................................................................................................... 26
3.5.1 Likert Scale ............................................................................................................. 27
3.5.2 Mean ....................................................................................................................... 27
3.5.3 Standard Deviation .................................................................................................. 27
3.6 Data Analysis ............................................................................................................. 28
3.7 Validity and Reliability .............................................................................................. 29
3.7.1 Validity Test ............................................................................................................ 29
3.7.2 Reability Test .......................................................................................................... 31
3.8 Classical Assumption Test ......................................................................................... 32
3.8.1 Normality Test ........................................................................................................ 33
3.8.2 Heterosdascity Test ................................................................................................. 33
3.8.3 Multicollinearity Test .............................................................................................. 33
ix
3.9 Multiple Regression Analysis .................................................................................... 34
3.9.1 T-Test ...................................................................................................................... 35
3.9.2 F-Test ...................................................................................................................... 35
3.9.3 Coefficient of Determination .................................................................................. 35
3.10 Operational Definition ............................................................................................. 36
CHAPTER 1V ANALYSIS AND INTERPRETATION ............................................ 42
4.1 Company Profile ........................................................................................................ 42
4.1.1 Vision and Mission ................................................................................................. 43
4.1.2 Company Product .................................................................................................... 43
4.2 Data Result Analysis .................................................................................................. 43
4.2.1 Validity Test ............................................................................................................ 44
4.2.2 Reliability Test ........................................................................................................ 47
4.3 Respondent Profile ..................................................................................................... 50
4.4 Questionnaire ............................................................................................................. 50
4.4.1 Tangible .................................................................................................................. 50
4.4.2 Reliability ............................................................................................................... 51
4.4.3 Responsiveness ....................................................................................................... 52
4.4.4 Empathy .................................................................................................................. 53
4.4.5 Assurance ............................................................................................................... 54
4.4.6 Supplier Satisfaction ............................................................................................... 55
4.5 Classical Assumption Test ......................................................................................... 55
4.5.1 Normality Test ........................................................................................................ 56
4.5.2 Multicollinearity Test .............................................................................................. 57
4.5.3 Heteroscedasticity Test ........................................................................................... 58
4.6 Multiple Linear Regression Test ................................................................................ 58
4.7 T-Test ......................................................................................................................... 60
4.8 F-Test ......................................................................................................................... 61
4.9 Coefficient of Determination Analysis ...................................................................... 62
4.10 Interpretation of Result ............................................................................................ 63
x
4.10.1 The Influence of Tangible towards Supplier Satisfaction ..................................... 63
4.10.2 The Influence of Reliability on Supplier Satisfaction ........................................... 62
4.10.3 The Influence of Responsiveness on Supplier Satisfaction .................................. 64
4.10.4 The Influence of Empathy on Supplier Satisfaction ............................................. 64
4.10.5 The Influence of Assurance on Supplier Satisfaction ........................................... 65
4.10.6 The Influence of Service Quality on Supplier Satisfaction ................................... 66
CHAPTER V CONCLUSION AND RECOMMENDATION ................................... 67
5.1 Conclusion .................................................................................................................. 67
5.2 Recommendation ........................................................................................................ 68
5.2.1 Recommendation for Future Research .................................................................... 68
5.2.2 Recommendation for PT. Dekoruma Inovasi Lestari ............................................. 68
REFERENCES ............................................................................................................... 69
APPENDIX A ................................................................................................................. 74
APPENDIX B ................................................................................................................. 80
xi
LIST OF TABLES
Table 2.1 Previous Research ............................................................................... 14
Table 3.1 Likert Scale Questionnaires ................................................................... 25
Table 3.2 Class for Analysis Desriptive .....................................................................27
Table 3.3 Cronbach Alpha ...........................................................................................31
Table 3.4 Operational Definition ................................................................................. 35
Table 4.1 Pearson Correlation of Web Fcilities ............................................................43
Table 4.2 Pearson Correlation of Reliability ............................................................... 44
Table 4.3 Pearson Correlation of Responsiveness ....................................................... 43
Table 4.4 Pearson Correlation of Empathy ........................... ....................................... 45
Table 4.5 Pearson Correlation of Assurance ................... ............................................ 45
Table 4.6 Pearson Correlation of Supplier Satisfaction ................................................45
Table 4.7 Cronbach Alpha of Web Facilities/Tangible ................................................46
Table 4.8 Cronbach Alpha of Reliability ......................................................................46
Table 4.9 Cronbach Alpha of Responsiveness .............................................................47
Table 4.10 Cronbach Alpha of Empathy ......................................................................47
Table 4.11 Cronbach Alpha of Assurance ....................................................................47
Table 4.12 Cronbach Alpha of Supplier Satisfaction ...................................................48
Table 4.13 Questionnaire Result on Tangible Variable ...............................................49
Table 4.14 Questionnaire Result on Reliability Variable .............................................49
Table 4.15 Questionnaire Result on Responsiveness Variable .................................... 51
Table 4.16 Questionnaire Result Empathy Variable .................................................. 52
Table 4.17 Questionnaire Result on Assurance Variable .............................................53
Table 4.18 Questionnaire Result on Supplier Satisfaction ...........................................53
Table 4.19 Multicollienarity Test ................................................................................ 56
Table 4.20 Multicollinearity Test .................................................................................57
Table 4.21 F Test ..........................................................................................................58
Table 4.23 Multiple Regression Analysis: Coefficient Determination ........................ 60
xii
LIST OF FIGURE
Figure 1.1 Growth of Merchant ......................................................................................... 3
Figure 2.1 Theoritical Framework ................................................................................... 19
Figure 3.1 Research Framework ...................................................................................... 21
Figure 3.2 Data Collection Method ................................................................................. 22
Figure 3.3 Interval Likert Scale ....................................................................................... 25
Figure 4.1 Supplier Category ........................................................................................... 49
Figure 4.2 Histogram ....................................................................................................... 55
Figure 4.3 Normal P-Plot ................................................................................................. 55
Figure 4.4 Heteroscdascity Test ....................................................................................... 57
xiii
LIST OF FORMULA
Formula 3.1 Mean ............................................................................................................ 26
Formula 3.2 Standard Deviation ...................................................................................... 26
Formula 3.3 Correlation Formula .................................................................................... 29
Formula 3.4 Cronbach Alpha ........................................................................................... 29
Formula 3.5 Variance Inflation Factor ............................................................................. 33
Formula 3.6 Multiple Regression Model ......................................................................... 33
Formula 3.7 Coefficient of Determination ....................................................................... 34
1
CHAPTER I
INTRODUCTION
1.1 Research Background
In Indonesia, there are around 26,2 million e-commerce company in Indonesia and
they increase 17% in the last 10 years (Deny, 2016). It help Indonesia to develop
the economic growth with number projection of e-commerce growth in 2020 reach
US$ 130 million (Rudiantara, 2015). In Indonesia, Lazada.com, Mataharimall.com,
and Tokopedia.com are the example for top 10 online marketplace with the most
number of visitors based on the research of Popular Brand Index in September 2015.
Dekoruma.com is also one of e-commerce company in Indonesia for home and
living product. Since established from September 2015, they show fast and raid
growth. Dekoruma.com grow their sales from 10 transactions in January 2016 and
reach around 100 transactions in a day on July 2016. The number of employee also
increase from 3 persons in September 2015 and reach around 50 persons include
the in September 2016 (Dekoruma, 2016). For e-commerce company, e-service
quality is important to drive company growth as a mediator for seller and buyer (Al-
Nasser, 2014) In online marketplace, online platform will be used as a mediator for
selling and buying process. In this case, sellers and buyers hold important role in
company growth. Without buyers and sellers, there are no product can be sold.
Suppliers tend to hold important role for product supply and product quality until it
reach customer side. Their role will get recognized for e-commerce who used
dropshipping system where the goods will kept on supplier side and e-commerce as
online platform will provide e-service to sell their product with calculated
commision that have been agreed by both parties.
In online marketplace with dropshipping system, the owner can stock zero product
in the policy when the vendors can focus on product development. The vendor can
keeping track of manufacturing and product shipping, while the marketplace owner
2
responsible for attracting customer and keeping track of money transaction (Laseter
& Rabinovich, 2016). For owner of online marketplace, they have to be careful in
building the relationship between marketplace and and supplier. In e-marketplace,
the company have to maintain the transparency between seller and buyer about
product and pricing (Turban, et al., 2008). As a seller, they maintain their product
performance and development with help of e-marketplace that give them online
platform to connect with buyers.
Dropshipping is one advantage of online marketplace that give ability to sell
product directly from the seller without keeping the product and in the warehouse
(Laseter & Rabinovich, 2016). This factors give seller more value to be looked.
Moreover, supplier performance also giving an impact for online marketplace
because the product has dependency on them. In supply chain management, jointt
effort of each variable aiming at reducing costand improving the service level
(Kanda, et al., 2008).
Dekoruma.com use intermediary-oriented e-marketplace model where business
buyers and sellers can meet by the online platform. In this case, supplier or seller
looking for e-marketplace that can provide e-service for their product in online
shopping. Dekoruma.com also has around 375 suppliers with 11000 products by
Desember 2016 while Livaza, it’s competitor in home and living e-commerce for
marketplace has 300 merchant with 7000 product (Livaza.com, 2016). Livaza has
established since 2014, one year earlier from Dekoruma.com, but has huge gap in
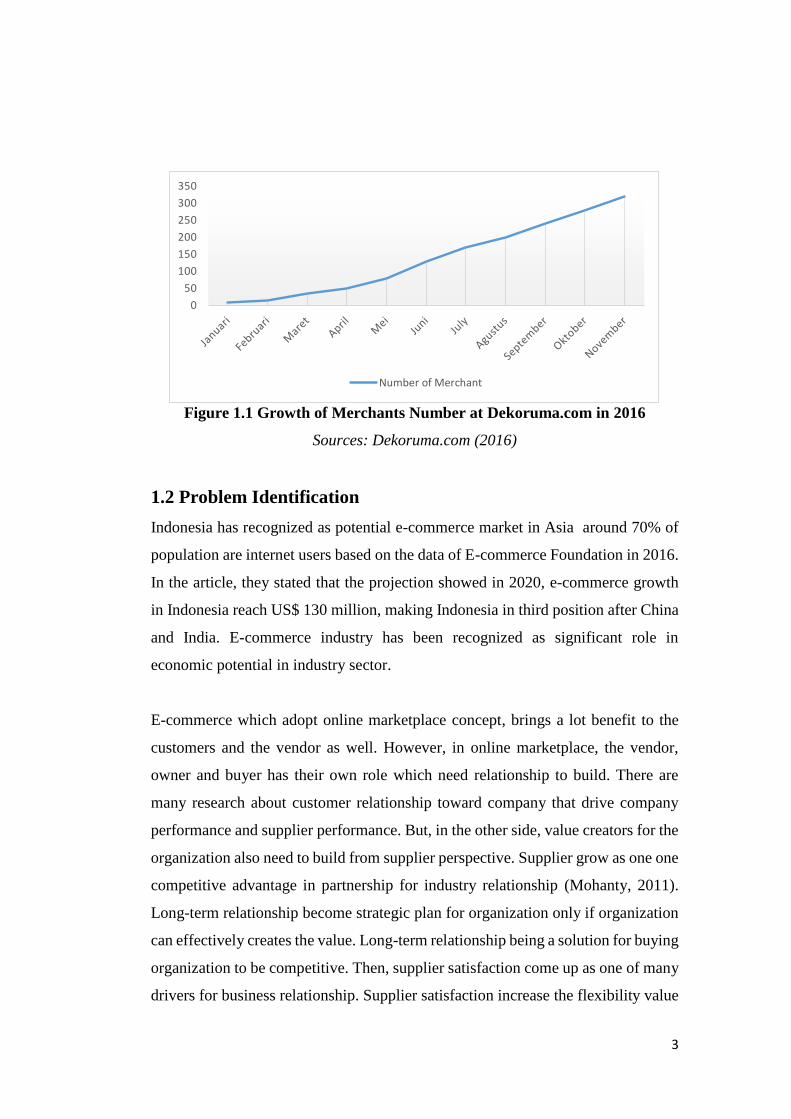
merchant’s number. The growth of merchant number at Dekoruma.com in 2016
can be seen in Figure 1.1.
3
Figure 1.1 Growth of Merchants Number at Dekoruma.com in 2016
Sources: Dekoruma.com (2016)
1.2 Problem Identification
Indonesia has recognized as potential e-commerce market in Asia around 70% of
population are internet users based on the data of E-commerce Foundation in 2016.
In the article, they stated that the projection showed in 2020, e-commerce growth
in Indonesia reach US$ 130 million, making Indonesia in third position after China
and India. E-commerce industry has been recognized as significant role in
economic potential in industry sector.
E-commerce which adopt online marketplace concept, brings a lot benefit to the
customers and the vendor as well. However, in online marketplace, the vendor,
owner and buyer has their own role which need relationship to build. There are
many research about customer relationship toward company that drive company
performance and supplier performance. But, in the other side, value creators for the
organization also need to build from supplier perspective. Supplier grow as one one
competitive advantage in partnership for industry relationship (Mohanty, 2011).
Long-term relationship become strategic plan for organization only if organization
can effectively creates the value. Long-term relationship being a solution for buying
organization to be competitive. Then, supplier satisfaction come up as one of many
drivers for business relationship. Supplier satisfaction increase the flexibility value
0
50
100
150
200
250
300
350
Number of Merchant
4
in manufacture, spend less expense, decrease life cycle compression and produce
new invention (Mohanty, 2011). In supply chain theory, supplier satisfaction are
enable to be linked with other component of management tool in supply chain
process.
Online marketplace give service as a tool management for buyer and seller. Besides
customer perception, they need supplier perception as a direct party for product. It’s
important for company to understand better about differentation industry sector and
context lead towards different relationship between tactical activities such as
service quality and overall performance outcomes (Kaplan, 2010). From e-service
quality on satisfaction, the dimensions will be come up as factor analysis of other
research.
Supplier in online marketplace using online system that given by e-commerce to
process the transaction and product aspect. Service that given by e-business are
essentially business tool for e-commerce (Yousif, 2015). For example,
Dekoruma.com’s merchant can see the invoice for their product in their own
account system that have been developed and coordinated by merchandising team
(Figure 1.2). Dekoruma's service are made to increase the efficiency rate in the
company. That is why any improvement in the quality of services develop through
classical service system will facilitate the understanding the nature of e-service
quality.
In Dekoruma.com, the number of supplier who are no longer an active suppliers
also hard to be detected because Dekoruma.com’s system only inform that the
product was sold out, but unable to delete the product from their website. This
condition make company hard to measure their supplier’s performance in company.
Dekoruma.com also can’t measured company’s performance towards supplier.
They also recieve comment from merchant about the service. Such Le Atelier as
one of the supplier said that they always find some misspelling in the product name
and product detail. They also said that from all product data that have been sent to
Dekoruma.com, there still a few of them that haven’t appeared in the website. From
5
other supplier such as Bali Craft, they are still not satisfied about the product photo
and how their product appeared in the website, because sometimes their product
only appeared in page 4 until page 7. Eventhough they may not have many product,
but they hope Dekoruma.com can placed their product in page 2 or 3 like other
merchants in the same category. Their suppliers comment represent that the
company’s service is hard to measured because the comments come only from
several merchants. The other problem is because they received around 40% of
supplier in Dekoruma.com show negative respons when it comes to product
delivery or product restock. If merchant didn’t restock their sold out product, then
the customer can’t buy the product.
1.3 Problem Statement
The problem that arise from the research background that stated above is impact of
employee satisfaction toward employee loyalty of PT. Dekoruma.com. In order to
find the solution about that problem, this research will answer these four question:
1. Does Tangible have significant influence towards Supplier Satisfaction?
2. Does Reliability have significant influence towards Supplier Satisfaction?
3. Does Responsiveness have significant influence towards Supplier Satisfaction?
4. Does Empathy have significant influence towards Supplier Satisfaction?
5. Does Assurance have significant influence towards Supplier Satisfaction?
6. Does Tangible, Reliability, Responsiveness, Empathy, Assurance have
simultaneous influence towards Supplier Satisfaction?
1.4 Research Objectives
The objective of this research is to know how employee satisfaction affect
employee loyalty in PT. Dekoruma.com. The research objectives can be detailed
into:
6
1. To find out the significant influence of Tangible towards Supplier Satisfaction.
2. To find out the significant influence of Reliability towards Supplier Satisfaction.
3. To find out the significant influence of Responsiveness towards Supplier
Satisfaction.
4. To find out the significant influence of Empathy towards Supplier Satisfaction.
5. To find out the significant influence of Assurance towards Supplier Satisfaction.
6. To find out the simultaneous influence of Tangible, Reliability, Responsiveness,
Empathy, Assurance towards Supplier Satisfaction.
1.5 Research Limitations
Dekoruma.com, as an online marketplace for home and living product give a
significant growth in the performance and in their partnership growth. Since they
established in September 2015 and sell their product in January 2016, they already
has around 375 merchants with 11000 products that consist of different kind sub-
product in home and living. Dekoruma.com sell around 1000 product in a day until
December 2016. Selecting them as the target research because they have big
potential in home and living online marketplace. The merchant in Dekoruma’s
online platform also consist of small, medium and big company who has their own
brand in the market.
Hence, this research is limited and conducted for only suppliers who sell their
product in Dekoruma.com online platform. No discriminative of demographic and
company type, except their status as Dekoruma.com merchant. The respondent will
be asked to fill the questionnaire based on their own perspective and scoring
standard.
7
1.6 Significance of the Study
The significance of this research is to give some contributions and benefits to
several parties, parties, such as:
For Readers
This research can be read by everyone with age, gender, occupation restrictions or
other restrictions. This research is intended to give readers further study about the
impact of e-service quality towards supplier satisfaction. Academic benefit of this
research is intended to give readers reference about the influence of service quality
towards supplier satisfaction.
For Online Marketplace
Online marketplace can get the references for their strategy in how to use e-service
quality towards supplier and get their satisfaction to build long-term relationship.
For Future Researcher
This research can be used by following researchers as a reference in doing the
similar research in the future with broader scope from supplier perspective.
For the Researcher
This research is made as a part of fulfilling the requirement of skripsi in President
University and completing Bachelor Degree in Management with International
Business concentration. Moreover, this research widen the knowledge and deeper
the understanding regarding the topic.
8
1.7 Terms of Definition
1. Service Quality: Important factor for given service product that will affect
volume of demand at organization (Grubor, 2009).
2. Tangible: Physical figure such as functional facilities, equipment and
corporate material that used for promoting activity and as a tool for a given
service (Asogwa, 2014).
3. Reliability: the consistency of performance and dependability that given to
the client’s
4. Responsiveness: the willingness to help and perform the service promptly
(Mauri, 2013)
5. Empathy: Sharing relationship form between the firms’s provider and it’s
users (Peprah, Atarah, 2014)
6. Assurance: How the company fulfill their responsibility of competences,
courtesy and knowledge of it’s employee in user’s trust building (Asogwa,
2014)
7. Supplier Satisfaction: Supplier perspective of how the relationship quality
are constructed between buyer and seller (Kumar, 2011)
8. Merchant: the one that involves transaction activity, having experience and
knowledge also familiar on how they deals with product (Thomson, 2010)
9
CHAPTER II
LITERATURE REVIEW
2.1 Service Quality
Service quality has a valuable impact on business successfulness as Akinci et al.
(2010) has said in their research that service quality being key indicator for
performance improvement and compete with others. In this case, service quality
can be a different factor between online marketplaces. Service Quality have been
approved by many experts and considered as one of important tool to gain long-
term sucess. (Udo et al., 2010). Business experts and managers realize that virtual
business environment coulde be improve by creates different strategic value as
competitive advantage. Teece (2009) stated that the service quality stages on e-
media that bring the effectiveness and shopping efficiency, purchasing and delivery
of real products. Company can confirm their quality level by interpretation of
quality and satisfaction
From supply market analysis, service is used as competitive advantage and
indicators for product and company. In online marketplace who has many sellers,
service is one competition feature to attract both side (customer and supplier). As
Akinci et al. (2010) said in their research that service quality has been explored in
the last decade. Wesbsite can facilitates the efficiency and effectiveness purchasing
and delivery as one kind of service quality (Stiakakis, Georgiadis, 2010). Culiberg
(2010) also stated in her statement that service quality has opened the way for others
to define more about service quality dimensions in different nature and sector.
The dimensions of service quality has been developed as the result of different
research and literature. Ahmed (2011) has reviews and summarized different
resources of literatue about service quality concept in different industries and use 4
dimensions of service quality such as, Tangible, Reliability, Responsiveness, and
Empathy. Then, Zeglat (2014) also discover five dimensions and construct of
service quality into Reliability, Responsiveness, Tangible, Empathy, Assurance.
10
2.1.1 Tangible
Hoffman and Bateson (2011) define tangibles dimensions that consist of a object
variations of physical instrument such as design, company, facilities, user system,
layout, lighting, or any appearance from corporate’s employee. Ananth et al. (2011)
also define modern equipment, physical facility and employee’s attributes that
appealed to outside organizations as tangibility’s tool. In online marketplace, the
website become tangible aspect for user’s as a media to sell their product and media
for visual appealing.
2.1.2 Reliability
Reliability refers to performances and service towards users at time convenient (Wu
et al., 2015). Wu (2015) also stated that reliability as important quality in service
quality. He also stated that reliability become factors which have highest value in
satisfaction and second strongest indicators of loyalty. Other context define
reliability as the “ability to perform the promised service dependably and
accurately” (Awoke, 2015). Reliability can also reflect to techical realiability such
as the proper functioning of the sites by users on how the web can be reliable for
user’s need.
2.1.3 Responsiveness
Responsiveness has relationship with organization’s system which relate to the final
outcome that have different design in such a way to make the organization or
institutions aware and respond promptly. Responsiveness also generally have
individual’s expectation in relationship approach (Ramseook et al., 2010). On the
other side, Tarrant et al. (2014) said that responsiveness define professional
relationship with customer or service users. How the system respond towards its
user are one example of service question that likely being important in the service
to generate the effectiveness.
11
2.1.4 Empathy
Emphaty is the ability on how one can understand or experience other’s position in
term of feeling as one’s based on Hoffman and Bateson (2011). It includes
communication, understanding and access (Abbas & Albarq, 2013). Saghier and
Nathan (2013) find in the research that empathy also referred to giving individual
study, convenient operating hours and giving personal attention. In the research of
Handrinos et al., (2015) find that empathy is number third as the most significance
influence in service quality. Empathy is used by many context that have ability of
other’s affection.
2.1.5 Assurance
Assurance dimensions address, the competence of the firm, the courtesy and the
security of operations (Hoffman & Bateson, 2011). Courtesy is how the firm’s
personnel interact which reflect politeness, friendliness, and considerations.
Security also important componet because it connnect with risk, danger, and doubt.
The competences of company staff to assure and convey trust from user’s hold
important key that frive the willingnes and need from users itself (Asogwa, 2014).
2.2 Supplier
Supplier as an important variable in supply chain management that provide raw
material or finished goods and also become company’s partner in doing business
(Dikmen, 2015). Company and their suppliers as partners must be working together
to improve supply performance. Supplier evaluation and selection is one way of a
process of finding the appropriate suppliers who can provide the best and quality
products and or services at the right time and at the right amount with an acceptable
price. In an environment dominated by global markets business success depends on
the success of the selection of suppliers. In organizations which are more dependent
on suppliers, the direct and indirect impacts of the ineffective decisions become
more critical. In a supply chain, collaboration between the company and the
supplier is the most important connection of the distribution channel.
12
2.3 Satisfaction
Satisfaction have been a broad research in business sector as one trigger that can
push performace in more than one parties relationship (Schiele, 2015). Satisfaction
itself can be define as a fulfillment of one’s wishes, expectation, or needs from one
individu or organization. In this case, satisfaction in cooperative relationship can be
big indicator in competitive relationship.
2.4 Supplier Satisfaction
Supplier satisfaction can be factor to build long-term and sustainable relationship
(Kumar, 2011). Satisfied supplier can represent supplier’s feeling of fairness within
business sector. Buyer-seller relationship as the main reason of supllier acttitude to
fulfill their duties as supplier (Schiele, 2015). Satisfied supplier can give more
advantage to manufacturing flexibility, production life cycle compression, cost
advantage and innovations. Satisfaction itself in general context can be defined as
“a positive affective state resulting from the appraisal of all aspect of a firm’s
working relationship with another company”.
Supplier satisfaction start from individual’s attitude towards supplier (Kumar,
2011). Manufacturer, supplier, and customers relate each other to the enterprise and
worked together to create product innoavtion and service to the marketplace that
customers desired and generate profitability (Schiele et. al., 2015). It can be
conclude that supplier satisfaction being major role in placing the right buyer’s in
the right marketplace.
2.5 Service Quality to Supplier Satisfaction
According to Stan (2012), satisfaction and loyalty can be a indicators for
profitability and support. Business value chain and ownership expense come up
together and support each other, including supplier supply chain. (Schiele et. al.,
2015) stated that business value chain process benefit supplier satisfaction element
such as money and time.
13
Service quality service is a support from marketplace that can develop satisfaction
to derived long-term relationship. Schiele et. al., (2006) study that supplier can
improves customer satisfaction and business company able to adopt it’s value in
gaining customer satisfaction. In order to get that value, company can start to
develop the –service for their supplier.
2.6 Electronic Commerce
According to Turban et al (2008), electronic commerce also called e-commerce is
the process that involves transactions between a company and its customers
through a digital platform on the Internet. The trade can include the sale of goods,
services and information. The online trade is independent of time and place
(Solomon et al, 2010). Turban et al (2008) indicates that e-commerce enables
businesses to no longer need a physical contact with their customers in order to
carry out a transaction.
The e-commerce businesses could increase the online purchase intention by
striving to improve the consumers trust (Hong & Cha, 2013). Research is also
needed about other related factors in order to gain a more rich understanding
about e-commerce and consumers online purchase intention (Hsu et al, 2014).
Waghmare (2012) has defined the following types of e-commerce:
1. B2B E-Commerce: Companies doing business with each other such as
manufacturers selling to distributors and wholesalers selling to retailers.
Pricing is based on quantity of order and is often negotiable.
2. B2C E-Commerce: Businesses selling to the general public typically
through cataloes utilizing shopping cart software. By dollar volume, B2B
takes the prize, however B2C is really what the average Joe has in mind
with regards to ecommerce as a whole. for example indiatimes.com.
3. C2C E-Commerce: There are many sites offering free classifieds, auctions,
and forums where individuals can buy and sell thanks to online payment
systems like PayPal where people can send and receive money online with
14
ease. eBay's auction service is a great example of where customer-to
customer transactions take place every day.
4. Others: G2G (Government-to-Government), G2E (Government-to-
Employee), G2B (Government-to-Business), B2G (Business-to-
Government).
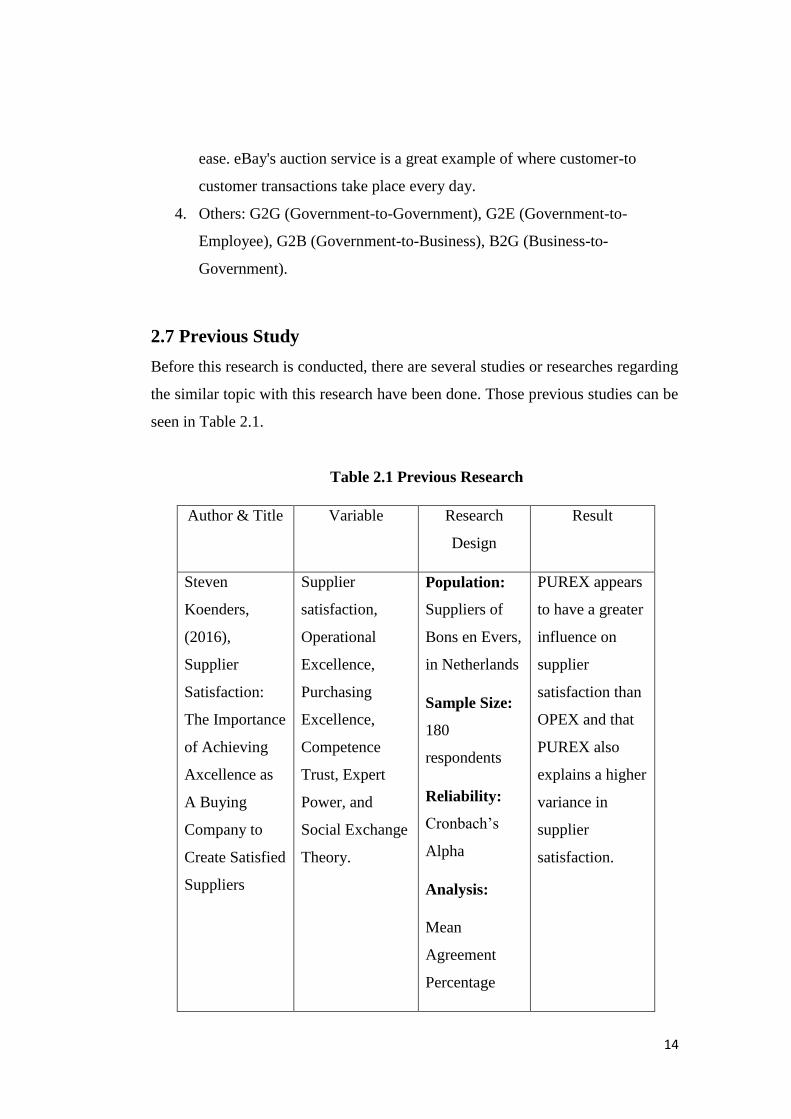
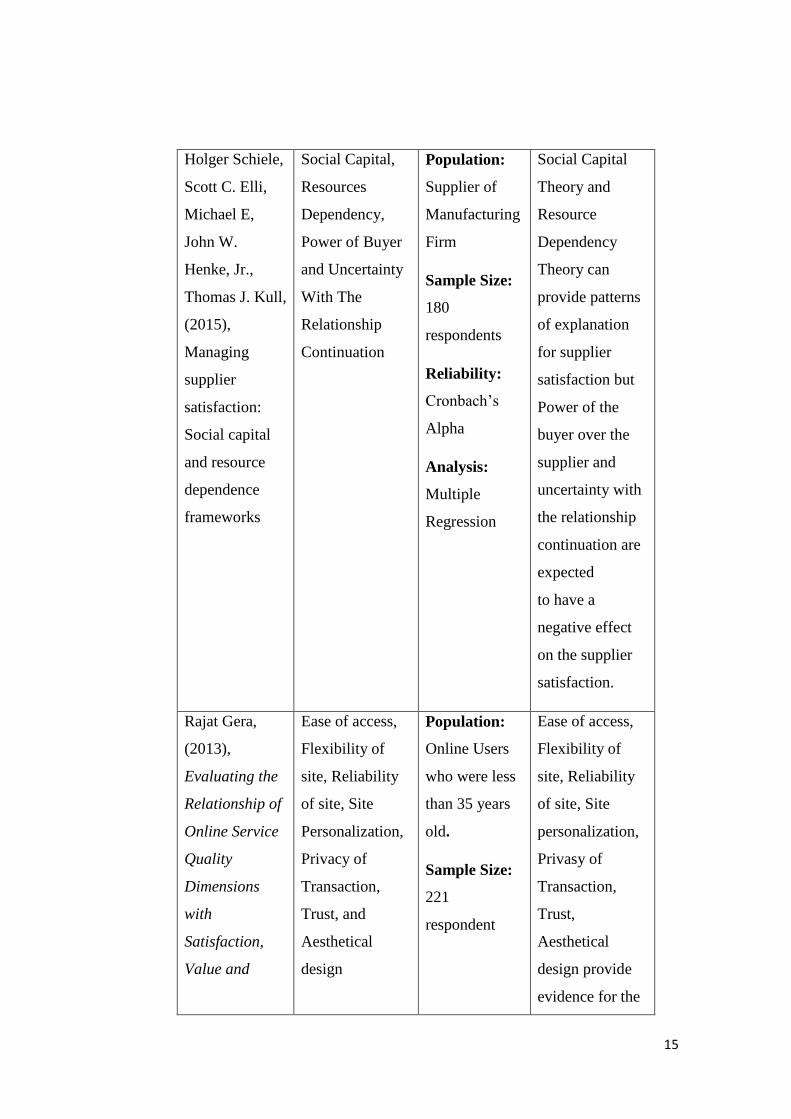
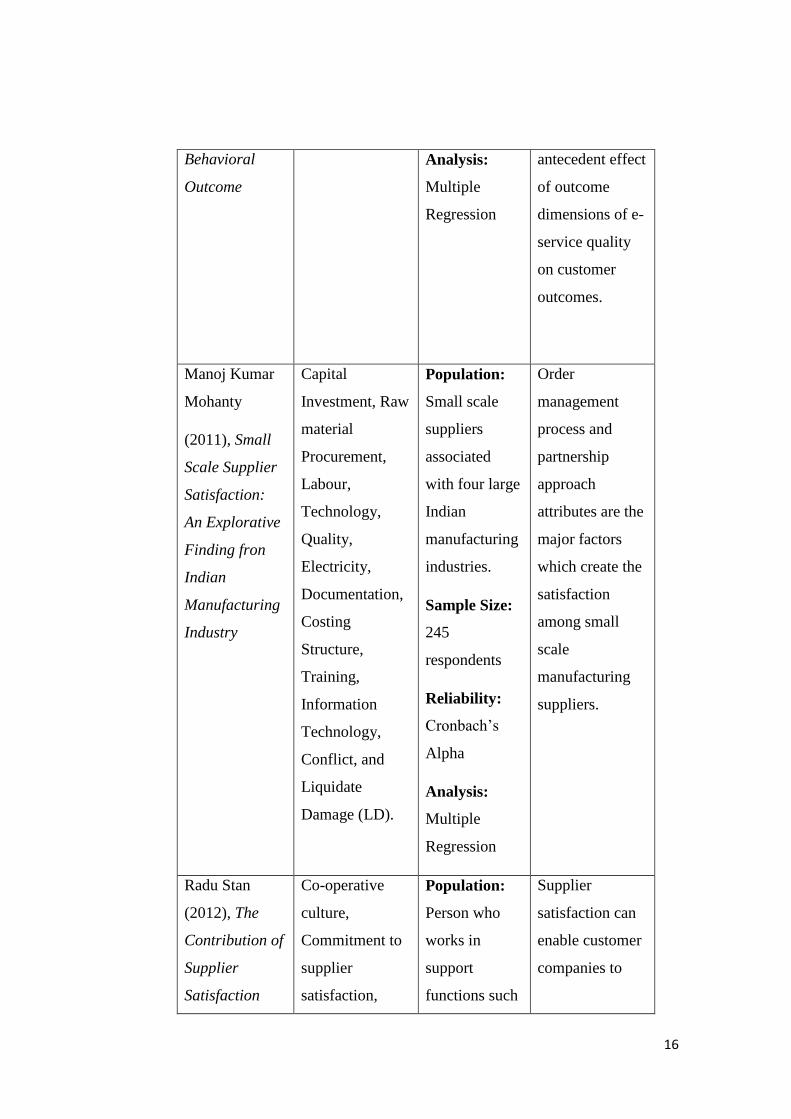
2.7 Previous Study
Before this research is conducted, there are several studies or researches regarding
the similar topic with this research have been done. Those previous studies can be
seen in Table 2.1.
Table 2.1 Previous Research
Author & Title Variable Research
Design
Result
Steven
Koenders,
(2016),
Supplier
Satisfaction:
The Importance
of Achieving
Axcellence as
A Buying
Company to
Create Satisfied
Suppliers
Supplier
satisfaction,
Operational
Excellence,
Purchasing
Excellence,
Competence
Trust, Expert
Power, and
Social Exchange
Theory.
Population:
Suppliers of
Bons en Evers,
in Netherlands
Sample Size:
180
respondents
Reliability:
Cronbach’s
Alpha
Analysis:
Mean
Agreement
Percentage
PUREX appears
to have a greater
influence on
supplier
satisfaction than
OPEX and that
PUREX also
explains a higher
variance in
supplier
satisfaction.
15
Holger Schiele,
Scott C. Elli,
Michael E,
John W.
Henke, Jr.,
Thomas J. Kull,
(2015),
Managing
supplier
satisfaction:
Social capital
and resource
dependence
frameworks
Social Capital,
Resources
Dependency,
Power of Buyer
and Uncertainty
With The
Relationship
Continuation
Population:
Supplier of
Manufacturing
Firm
Sample Size:
180
respondents
Reliability:
Cronbach’s
Alpha
Analysis:
Multiple
Regression
Social Capital
Theory and
Resource
Dependency
Theory can
provide patterns
of explanation
for supplier
satisfaction but
Power of the
buyer over the
supplier and
uncertainty with
the relationship
continuation are
expected
to have a
negative effect
on the supplier
satisfaction.
Rajat Gera,
(2013),
Evaluating the
Relationship of
Online Service
Quality
Dimensions
with
Satisfaction,
Value and
Ease of access,
Flexibility of
site, Reliability
of site, Site
Personalization,
Privacy of
Transaction,
Trust, and
Aesthetical
design
Population:
Online Users
who were less
than 35 years
old.
Sample Size:
221
respondent
Ease of access,
Flexibility of
site, Reliability
of site, Site
personalization,
Privasy of
Transaction,
Trust,
Aesthetical
design provide
evidence for the
16
Behavioral
Outcome
Analysis:
Multiple
Regression
antecedent effect
of outcome
dimensions of e-
service quality
on customer
outcomes.
Manoj Kumar
Mohanty
(2011), Small
Scale Supplier
Satisfaction:
An Explorative
Finding fron
Indian
Manufacturing
Industry
Capital
Investment, Raw
material
Procurement,
Labour,
Technology,
Quality,
Electricity,
Documentation,
Costing
Structure,
Training,
Information
Technology,
Conflict, and
Liquidate
Damage (LD).
Population:
Small scale
suppliers
associated
with four large
Indian
manufacturing
industries.
Sample Size:
245
respondents
Reliability:
Cronbach’s
Alpha
Analysis:
Multiple
Regression
Order
management
process and
partnership
approach
attributes are the
major factors
which create the
satisfaction
among small
scale
manufacturing
suppliers.
Radu Stan
(2012), The
Contribution of
Supplier
Satisfaction
Co-operative
culture,
Commitment to
supplier
satisfaction,
Population:
Person who
works in
support
functions such
Supplier
satisfaction can
enable customer
companies to
17
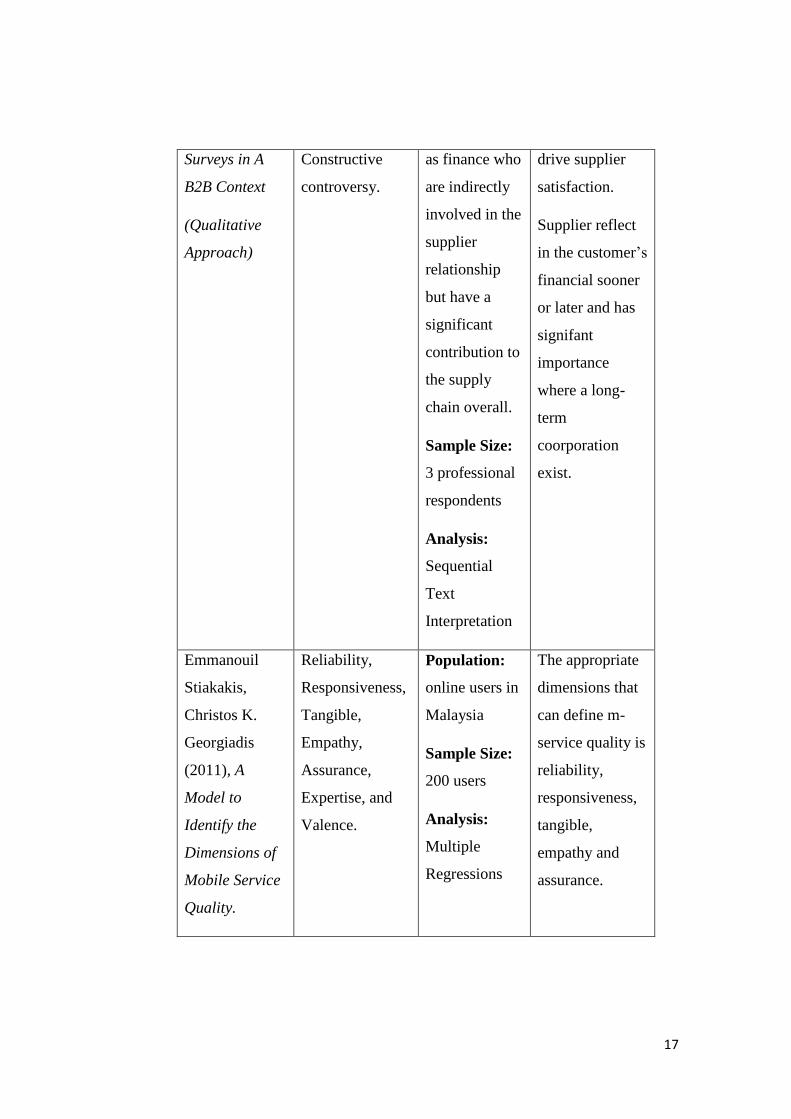
Surveys in A
B2B Context
(Qualitative
Approach)
Constructive
controversy.
as finance who
are indirectly
involved in the
supplier
relationship
but have a
significant
contribution to
the supply
chain overall.
Sample Size:
3 professional
respondents
Analysis:
Sequential
Text
Interpretation
drive supplier
satisfaction.
Supplier reflect
in the customer’s
financial sooner
or later and has
signifant
importance
where a long-
term
coorporation
exist.
Emmanouil
Stiakakis,
Christos K.
Georgiadis
(2011), A
Model to
Identify the
Dimensions of
Mobile Service
Quality.
Reliability,
Responsiveness,
Tangible,
Empathy,
Assurance,
Expertise, and
Valence.
Population:
online users in
Malaysia
Sample Size:
200 users
Analysis:
Multiple
Regressions
The appropriate
dimensions that
can define m-
service quality is
reliability,
responsiveness,
tangible,
empathy and
assurance.
18
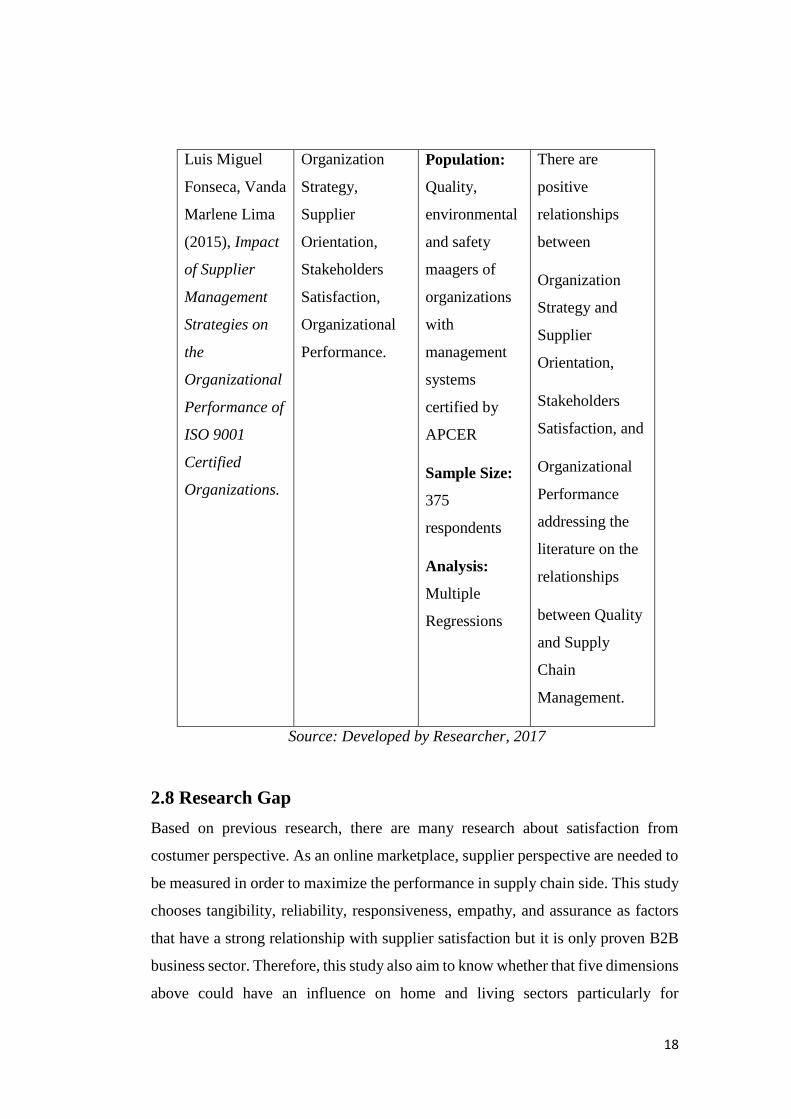
Luis Miguel
Fonseca, Vanda
Marlene Lima
(2015), Impact
of Supplier
Management
Strategies on
the
Organizational
Performance of
ISO 9001
Certified
Organizations.
Organization
Strategy,
Supplier
Orientation,
Stakeholders
Satisfaction,
Organizational
Performance.
Population:
Quality,
environmental
and safety
maagers of
organizations
with
management
systems
certified by
APCER
Sample Size:
375
respondents
Analysis:
Multiple
Regressions
There are
positive
relationships
between
Organization
Strategy and
Supplier
Orientation,
Stakeholders
Satisfaction, and
Organizational
Performance
addressing the
literature on the
relationships
between Quality
and Supply
Chain
Management.
Source: Developed by Researcher, 2017
2.8 Research Gap
Based on previous research, there are many research about satisfaction from
costumer perspective. As an online marketplace, supplier perspective are needed to
be measured in order to maximize the performance in supply chain side. This study
chooses tangibility, reliability, responsiveness, empathy, and assurance as factors
that have a strong relationship with supplier satisfaction but it is only proven B2B
business sector. Therefore, this study also aim to know whether that five dimensions
above could have an influence on home and living sectors particularly for
19
Dekoruma.com, so it will help the company to grow in the future since the case
study of the company is a startup company.
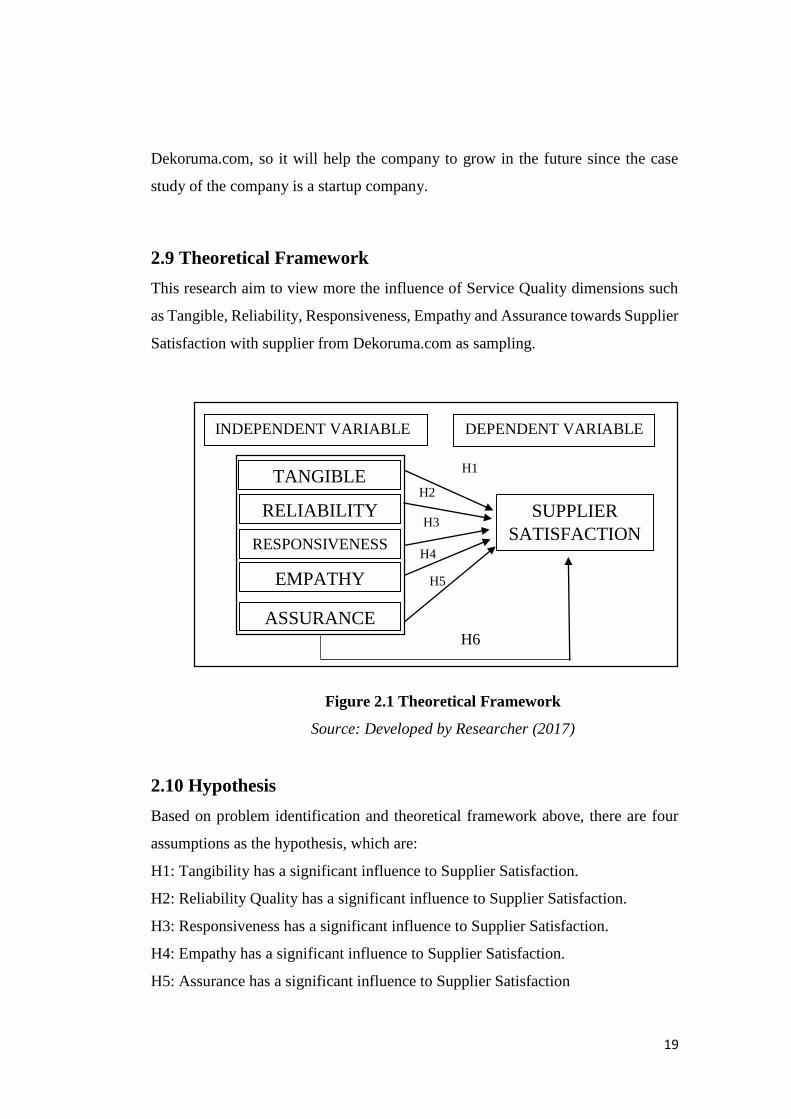
2.9 Theoretical Framework
This research aim to view more the influence of Service Quality dimensions such
as Tangible, Reliability, Responsiveness, Empathy and Assurance towards Supplier
Satisfaction with supplier from Dekoruma.com as sampling.
Figure 2.1 Theoretical Framework
Source: Developed by Researcher (2017)
2.10 Hypothesis
Based on problem identification and theoretical framework above, there are four
assumptions as the hypothesis, which are:
H1: Tangibility has a significant influence to Supplier Satisfaction.
H2: Reliability Quality has a significant influence to Supplier Satisfaction.
H3: Responsiveness has a significant influence to Supplier Satisfaction.
H4: Empathy has a significant influence to Supplier Satisfaction.
H5: Assurance has a significant influence to Supplier Satisfaction
INDEPENDENT VARIABLE
(X)
DEPENDENT VARIABLE
(Y)
TANGIBLE
RELIABILITY
RESPONSIVENESS
EMPATHY
ASSURANCE
SUPPLIER
SATISFACTION
H2
H3
H4
H5
H6
H1

20
H6: Tangible, Reliability, Responsiveness, Empathy, Assurance has a simultaneous
influence to Supplier Satisfaction.
21
CHAPTER III
RESEARCH METHOD
3.1 Introduction
Quantitative and Qualitative are two types of research that commonly used based
on Zikmund & Babin (2010). Another method is mixed method which are the
combination between Quantitative and Qualitative approach. Quantitative method
aim to understand more of social process and interrelations, while Qualitative
methods use the objectives to gain a lot of information and use the case studies as
its sources (Anderson, 2010). Qualitative research method are using open ended
interviewing the individuals and then acquired a depth information by discovering
their attitudes, opinions, feeling and behaviour.
In contrast, quantitative research is used to further analysis of the problem by
transform numerical or raw data into organized statistics model. This research can
be classified based on several aspects. In terms of the type of research, this study
can be categorized as a research hypothesis testing to prove researchers hypothesis.
In terms of the relationship between variables, quantitative is causal research that
studies conducted to explain the relationship between variables, both dependent and
independent (Zikmund et al., 2009). Quantitative research is exploratory study that
has large scope; case study, interview, and interview analysis and so on.
For this research study, the researcher has chosed to use quantitative research
method study rather than qualitative research method. The researcher spread the
questionnaires through an online forms that consists of statements that respondents
need to answer. All the responses will be collected and then processed into
tabulation data.
3.2 Research Framework
In chapter 2, there are the explanation of service quality dimensions, supplier
satisfaction and how they can be related each other. The main topic is the influence
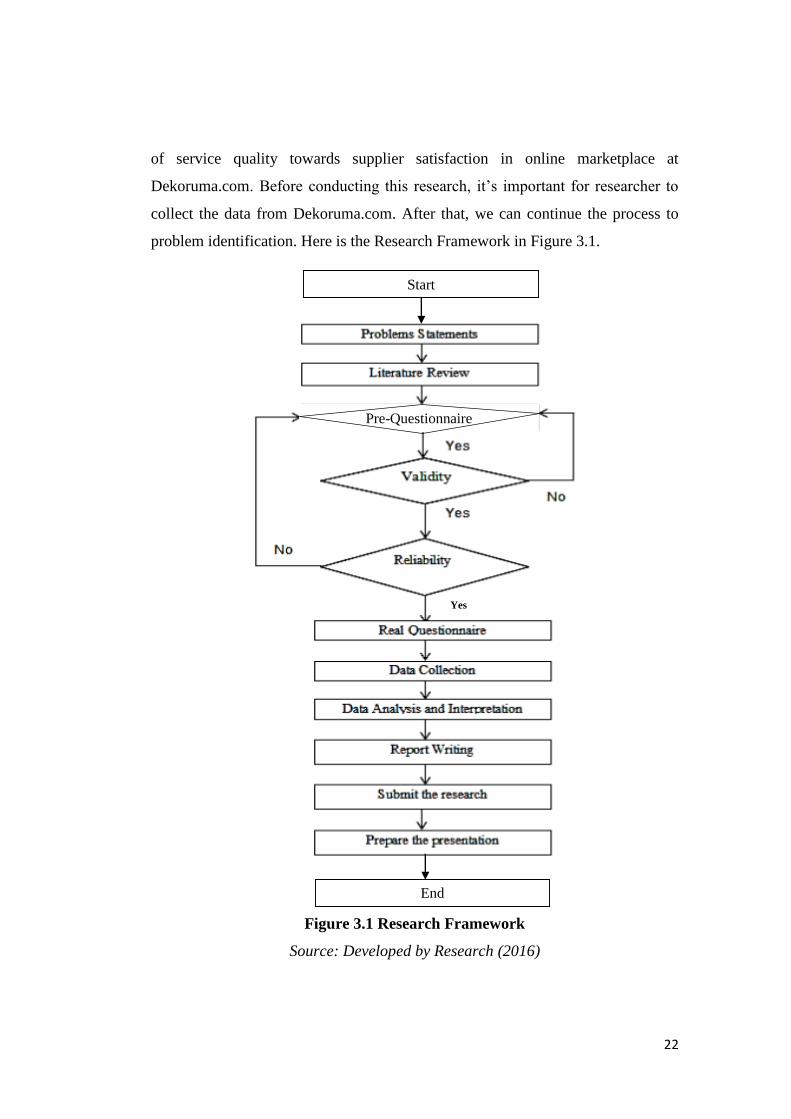
22
of service quality towards supplier satisfaction in online marketplace at
Dekoruma.com. Before conducting this research, it’s important for researcher to
collect the data from Dekoruma.com. After that, we can continue the process to
problem identification. Here is the Research Framework in Figure 3.1.
Figure 3.1 Research Framework
Source: Developed by Research (2016)
Yes
Start
End
Pre-Questionnaire
23
3.3 Research Instrument
Researcher needs instrument as a media to answer the research question that have
been construct in the previous chapter. The information that gathered by researcher
have to come from various sources. Researcher can collect the data from primary
or secondary data. Primary data are collected by the researcher based on variable
that have been determined for spesific purpose of study and secondary data are
made from sources that provide valid information that allready exist by the experts
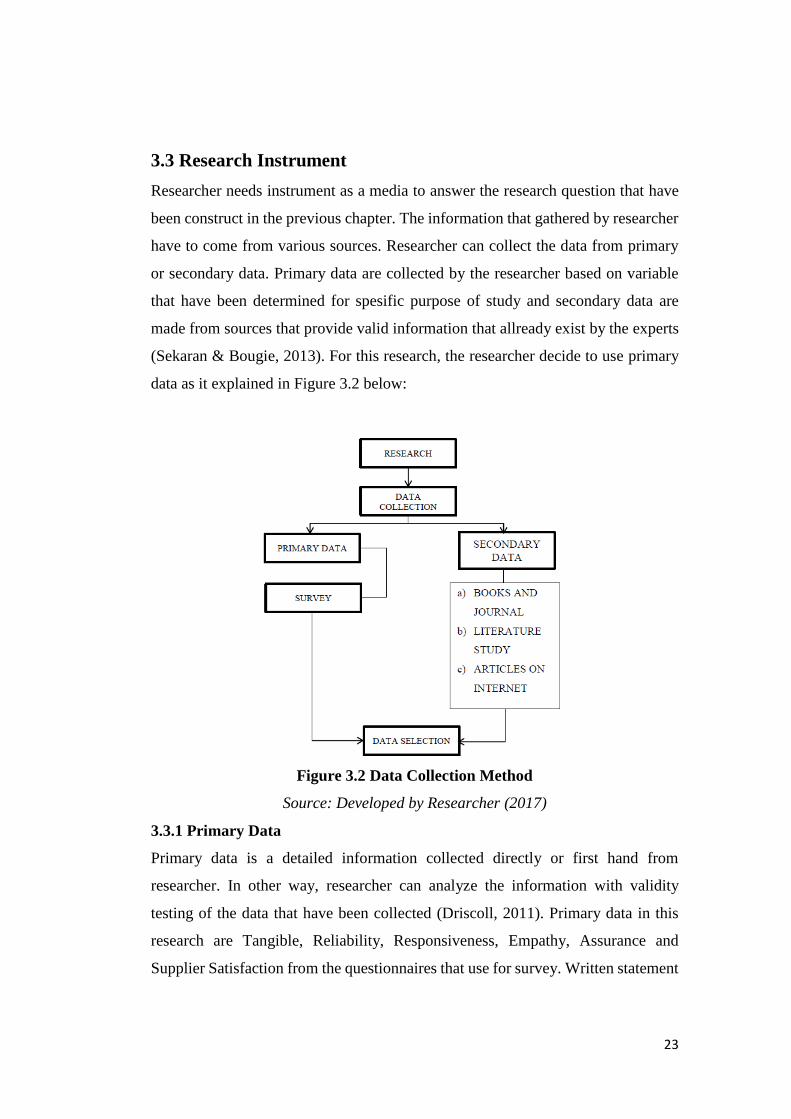
(Sekaran & Bougie, 2013). For this research, the researcher decide to use primary
data as it explained in Figure 3.2 below:
Figure 3.2 Data Collection Method
Source: Developed by Researcher (2017)
3.3.1 Primary Data
Primary data is a detailed information collected directly or first hand from
researcher. In other way, researcher can analyze the information with validity
testing of the data that have been collected (Driscoll, 2011). Primary data in this
research are Tangible, Reliability, Responsiveness, Empathy, Assurance and
Supplier Satisfaction from the questionnaires that use for survey. Written statement
24
such as questionnaire will be used and spread through the number of respondent
sample that consist of variable research.
3.3.2 Secondary Data
The purpose of secondary data is for completion of research projetc and gain initial
insight into the research problem (Johnston, 2014). Secondary data is the data that
allready available from other sources. Secondary data in thiis research comes from
literature studies. A literature studies is the data collection from books and journal
which has relation to the research disscussion.
3.4 Sampling
3.4.1 Population
Banerjee and Chaudhury (2010) said that population described a group of people that
form the subject of study in a conducted research and are similar in one or more
ways. Target population consist of spesific group or people to get the compilation
data in an observation to develop required data structure and information. The
population that is used for this research is the supplier from Dekoruma.com as an
online marketplace that sell home and living product. Although Dekoruma.com
approximately have 375 merchants, but the exact number of supplier that have been
active is unknown.
3.4.2 Sample Size
Sample size is the prediction of the whole part, from a sample to the total amount
of the population (Sufa, 2012). Sugiyono (2010) define sample size as a part
population number and has desired characteristic. According to Malhotra and Birks
(2007), the participant that contributed in the research is called in sample size. The
population of this research is the merchant who sell their product in Dekoruma.com.
Sample size is important issue when the type that researcher’s use is quantitative
analysis. Sekaran (2013) provide set of instruction of the number of sample is
among 30 to 500 elements. According to Sufa (2012), size of sample can be
25
determined by calculating with below formula if the researcher didn’t know the
exact population of the research :
N = 5 x Q
N = 5 x 19
N = 95
Where :
N = Number of Respondent
Q = Number of Question
By that minimum number, the total respondent in this research is 100 because there
are 19 question. Researcher decide to use 100 respondent than 95 respondent to
decrease the error degree of this research or avoid the questionnaire that lost or left
unfinished.
3.4.3 Sampling Technique
According to Bryman and Bell (2007) generally, in sampling technique there are
two methods that can be applied in the research study which is probability sampling
and non-probability sampling. In Probability sampling will be used if there is a non
zero equal chance for each population element to be selected. There are four types
of probability sampling; simple random sample, systematic sample, stratified
random sampling and multi stage cluster sampling. Whereas, there is non-
probability sampling which rely on research judgement.
As stated by Bryman and Bell (2007) there are three types of non-probability
sampling, those are convenience sampling, snowball sampling and quota sampling.
Convenience sample is one that is conveniently available to the researcher with its
goodness of accessibility.
In this research, researcher decided to distribute the questionnaire to supplier that
sell their product through Dekoruma.com in all category product. The researcher
distribute the questionnaire to the supplier with the help of Dekoruma.com’s staff
26
that in charge in merchandising department. Merchandising department are the one
who in charge and have direct communication with the supplier.
3.5 Statistical Treatment
3.5.1 Likert Scale
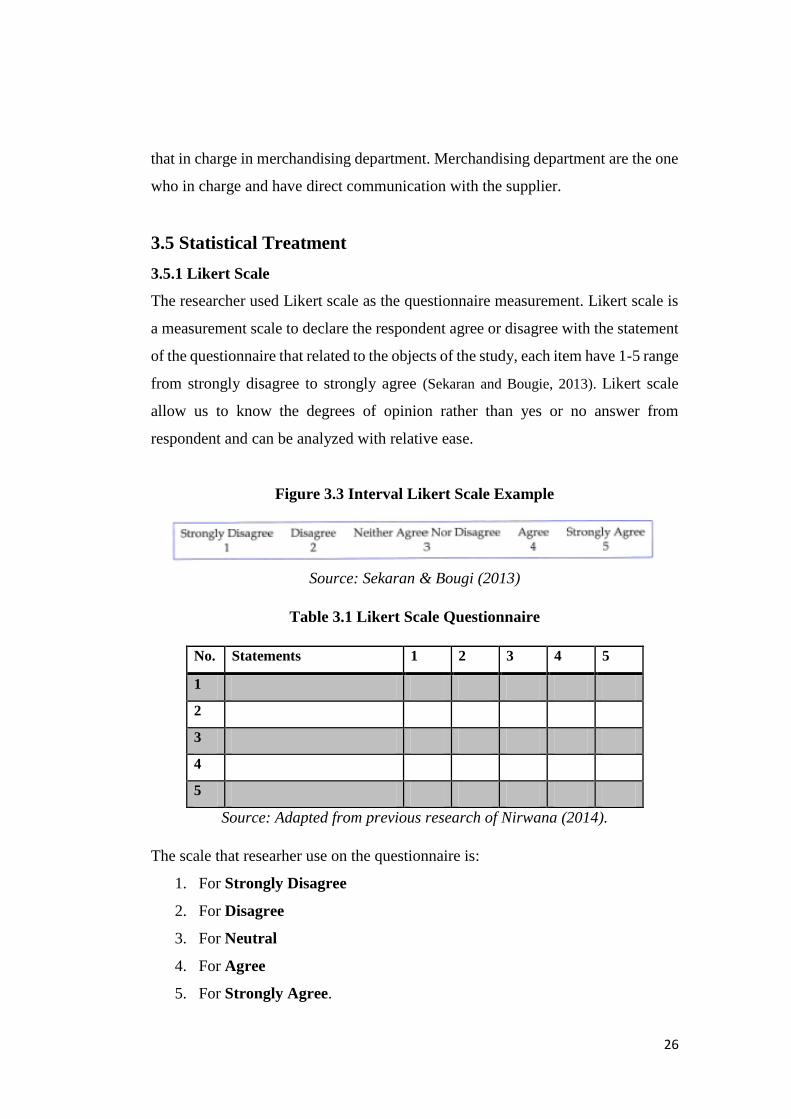
The researcher used Likert scale as the questionnaire measurement. Likert scale is
a measurement scale to declare the respondent agree or disagree with the statement
of the questionnaire that related to the objects of the study, each item have 1-5 range
from strongly disagree to strongly agree (Sekaran and Bougie, 2013). Likert scale
allow us to know the degrees of opinion rather than yes or no answer from
respondent and can be analyzed with relative ease.
Figure 3.3 Interval Likert Scale Example
Source: Sekaran & Bougi (2013)
Table 3.1 Likert Scale Questionnaire
Source: Adapted from previous research of Nirwana (2014).
The scale that researher use on the questionnaire is:
1. For Strongly Disagree
2. For Disagree
3. For Neutral
4. For Agree
5. For Strongly Agree.
No. Statements 1 2 3 4 5
1
2
3
4
5
27
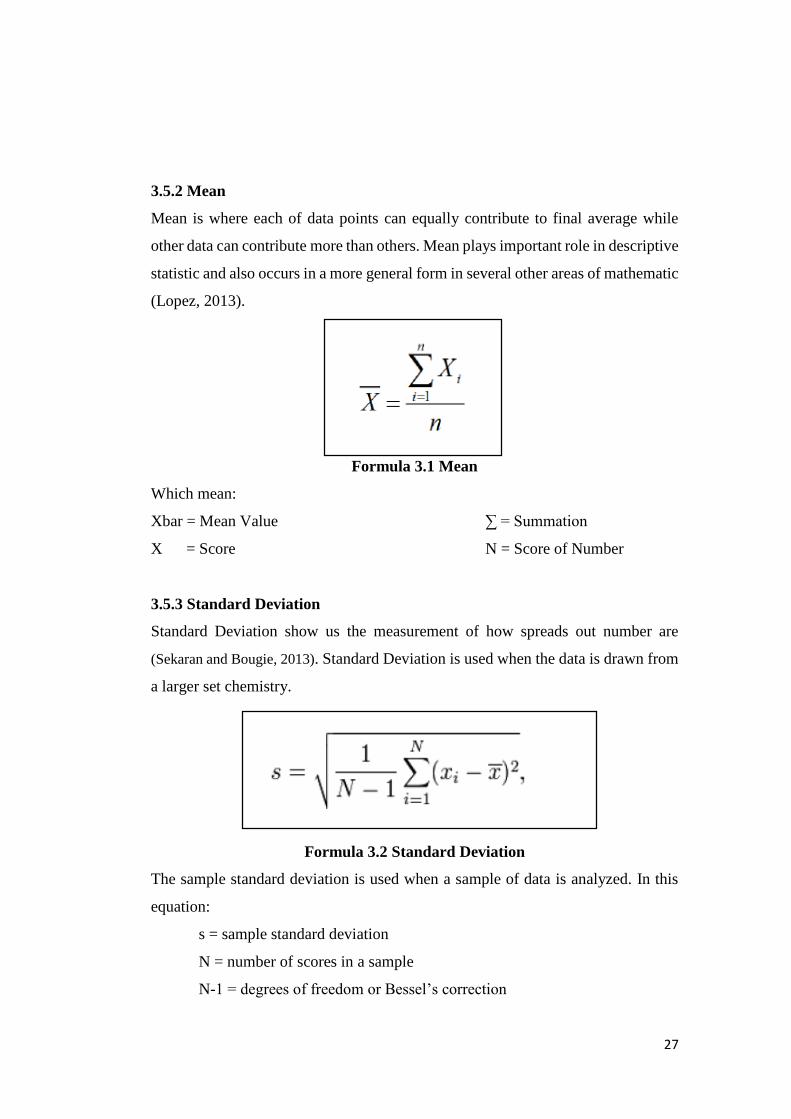
3.5.2 Mean
Mean is where each of data points can equally contribute to final average while
other data can contribute more than others. Mean plays important role in descriptive
statistic and also occurs in a more general form in several other areas of mathematic
(Lopez, 2013).
Formula 3.1 Mean
Which mean:
Xbar = Mean Value ∑ = Summation
X = Score N = Score of Number
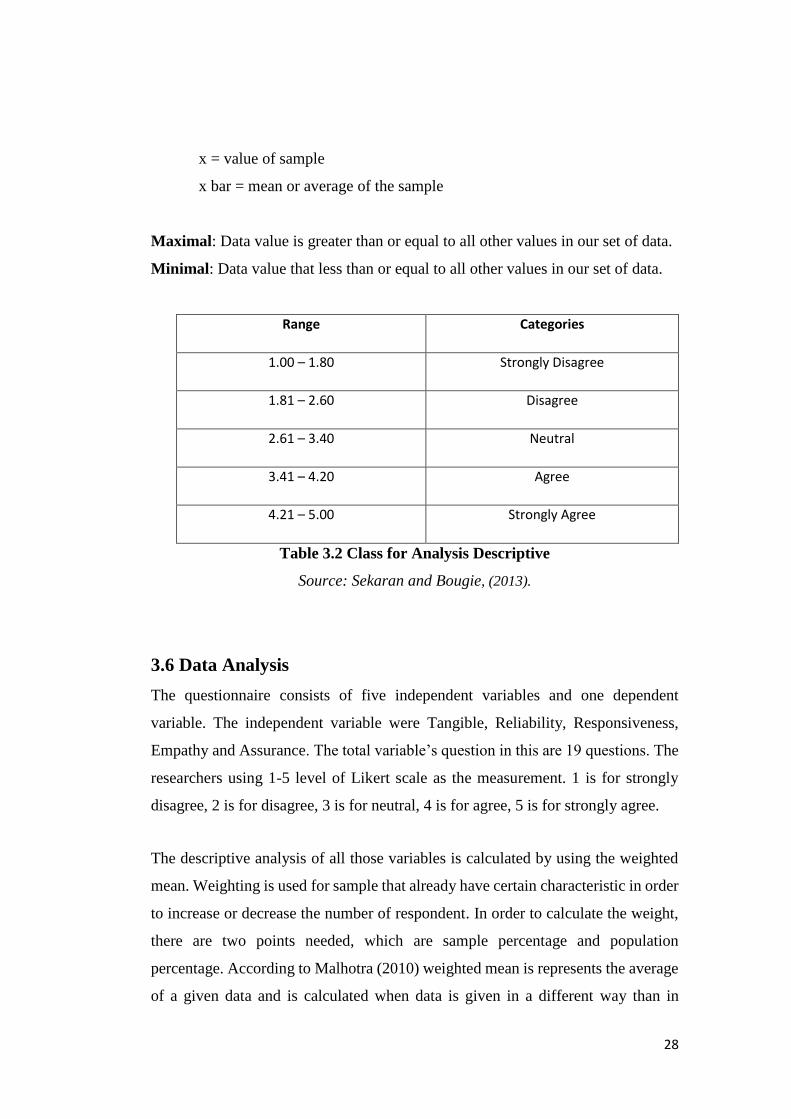
3.5.3 Standard Deviation
Standard Deviation show us the measurement of how spreads out number are
(Sekaran and Bougie, 2013). Standard Deviation is used when the data is drawn from
a larger set chemistry.
Formula 3.2 Standard Deviation
The sample standard deviation is used when a sample of data is analyzed. In this
equation:
s = sample standard deviation
N = number of scores in a sample
N-1 = degrees of freedom or Bessel’s correction
28
x = value of sample
x bar = mean or average of the sample
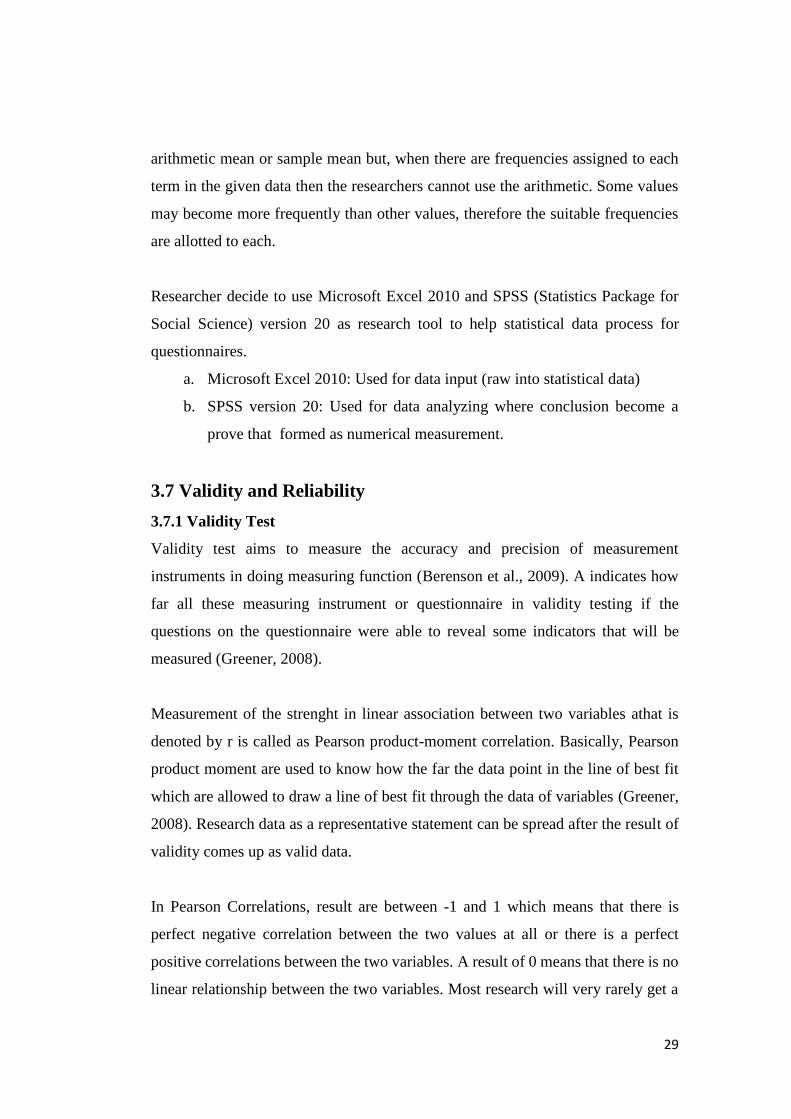
Maximal: Data value is greater than or equal to all other values in our set of data.
Minimal: Data value that less than or equal to all other values in our set of data.
Range Categories
1.00 – 1.80 Strongly Disagree
1.81 – 2.60 Disagree
2.61 – 3.40 Neutral
3.41 – 4.20 Agree
4.21 – 5.00 Strongly Agree
Table 3.2 Class for Analysis Descriptive
Source: Sekaran and Bougie, (2013).
3.6 Data Analysis
The questionnaire consists of five independent variables and one dependent
variable. The independent variable were Tangible, Reliability, Responsiveness,
Empathy and Assurance. The total variable’s question in this are 19 questions. The
researchers using 1-5 level of Likert scale as the measurement. 1 is for strongly
disagree, 2 is for disagree, 3 is for neutral, 4 is for agree, 5 is for strongly agree.
The descriptive analysis of all those variables is calculated by using the weighted
mean. Weighting is used for sample that already have certain characteristic in order
to increase or decrease the number of respondent. In order to calculate the weight,
there are two points needed, which are sample percentage and population
percentage. According to Malhotra (2010) weighted mean is represents the average
of a given data and is calculated when data is given in a different way than in
29
arithmetic mean or sample mean but, when there are frequencies assigned to each
term in the given data then the researchers cannot use the arithmetic. Some values
may become more frequently than other values, therefore the suitable frequencies
are allotted to each.
Researcher decide to use Microsoft Excel 2010 and SPSS (Statistics Package for
Social Science) version 20 as research tool to help statistical data process for
questionnaires.
a. Microsoft Excel 2010: Used for data input (raw into statistical data)
b. SPSS version 20: Used for data analyzing where conclusion become a
prove that formed as numerical measurement.
3.7 Validity and Reliability
3.7.1 Validity Test
Validity test aims to measure the accuracy and precision of measurement
instruments in doing measuring function (Berenson et al., 2009). A indicates how
far all these measuring instrument or questionnaire in validity testing if the
questions on the questionnaire were able to reveal some indicators that will be
measured (Greener, 2008).
Measurement of the strenght in linear association between two variables athat is
denoted by r is called as Pearson product-moment correlation. Basically, Pearson
product moment are used to know how the far the data point in the line of best fit
which are allowed to draw a line of best fit through the data of variables (Greener,
2008). Research data as a representative statement can be spread after the result of
validity comes up as valid data.
In Pearson Correlations, result are between -1 and 1 which means that there is
perfect negative correlation between the two values at all or there is a perfect
positive correlations between the two variables. A result of 0 means that there is no
linear relationship between the two variables. Most research will very rarely get a
30
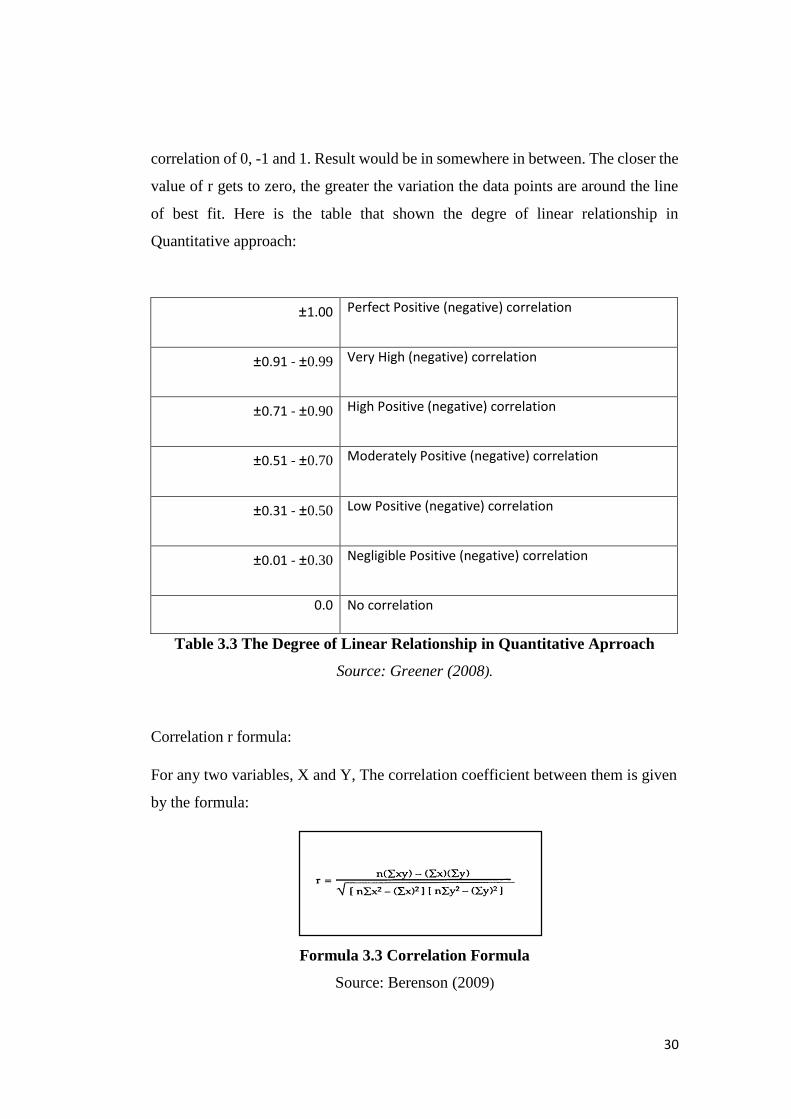
correlation of 0, -1 and 1. Result would be in somewhere in between. The closer the
value of r gets to zero, the greater the variation the data points are around the line
of best fit. Here is the table that shown the degre of linear relationship in
Quantitative approach:
±1.00 Perfect Positive (negative) correlation
±0.91 - ±0.99 Very High (negative) correlation
±0.71 - ±0.90 High Positive (negative) correlation
±0.51 - ±0.70 Moderately Positive (negative) correlation
±0.31 - ±0.50 Low Positive (negative) correlation
±0.01 - ±0.30 Negligible Positive (negative) correlation
0.0 No correlation
Table 3.3 The Degree of Linear Relationship in Quantitative Aprroach
Source: Greener (2008).
Correlation r formula:
For any two variables, X and Y, The correlation coefficient between them is given
by the formula:
Formula 3.3 Correlation Formula
Source: Berenson (2009)
31
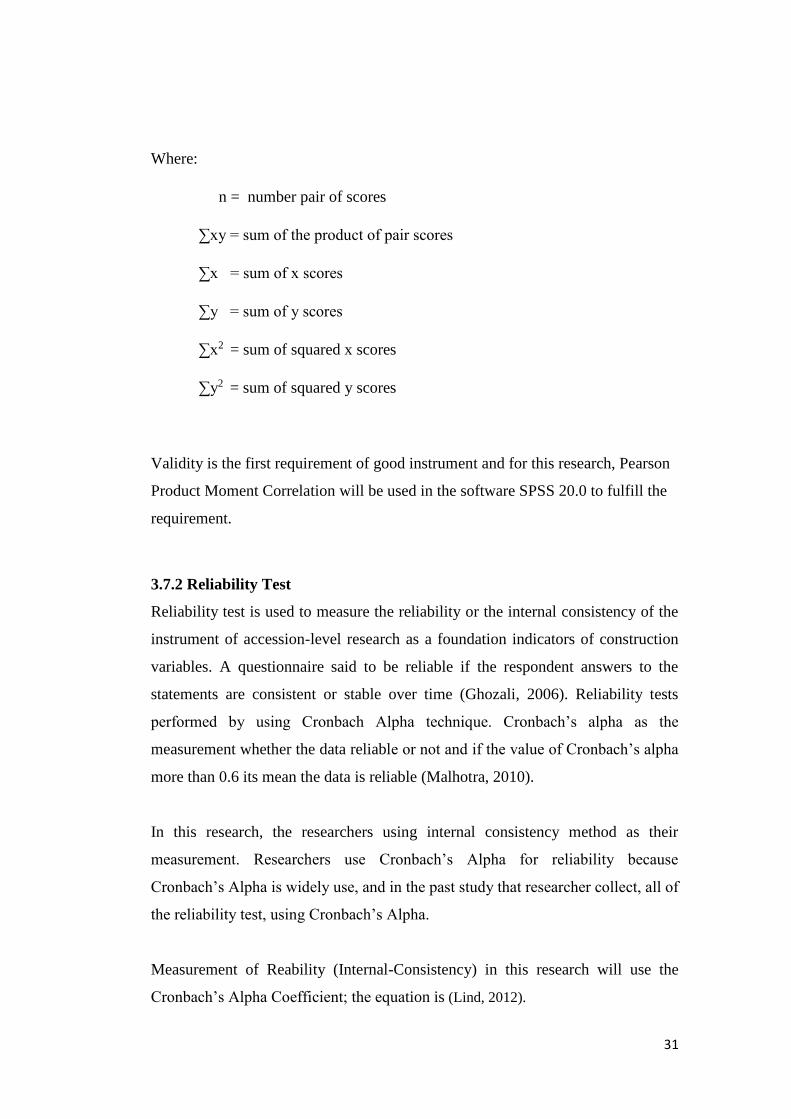
Where:
n = number pair of scores
∑xy = sum of the product of pair scores
∑x = sum of x scores
∑y = sum of y scores
∑x2 = sum of squared x scores
∑y2 = sum of squared y scores
Validity is the first requirement of good instrument and for this research, Pearson
Product Moment Correlation will be used in the software SPSS 20.0 to fulfill the
requirement.
3.7.2 Reliability Test
Reliability test is used to measure the reliability or the internal consistency of the
instrument of accession-level research as a foundation indicators of construction
variables. A questionnaire said to be reliable if the respondent answers to the
statements are consistent or stable over time (Ghozali, 2006). Reliability tests
performed by using Cronbach Alpha technique. Cronbach’s alpha as the
measurement whether the data reliable or not and if the value of Cronbach’s alpha
more than 0.6 its mean the data is reliable (Malhotra, 2010).
In this research, the researchers using internal consistency method as their
measurement. Researchers use Cronbach’s Alpha for reliability because
Cronbach’s Alpha is widely use, and in the past study that researcher collect, all of
the reliability test, using Cronbach’s Alpha.
Measurement of Reability (Internal-Consistency) in this research will use the
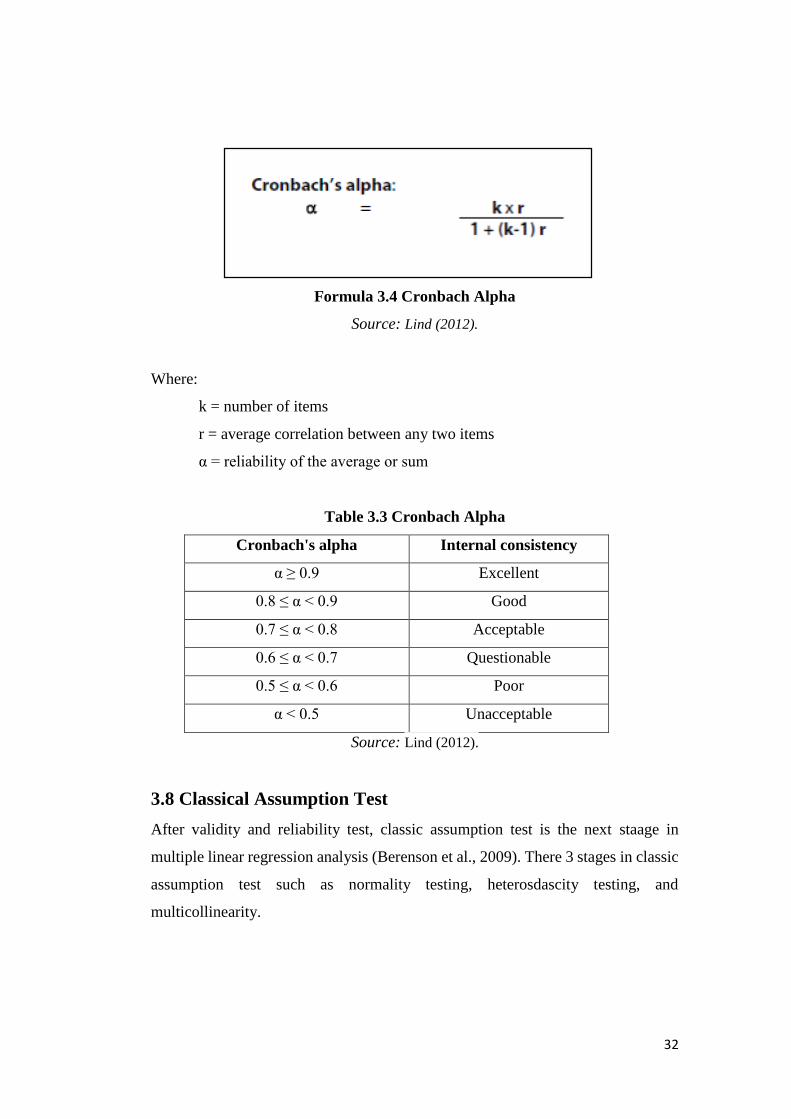
Cronbach’s Alpha Coefficient; the equation is (Lind, 2012).
32
Formula 3.4 Cronbach Alpha
Source: Lind (2012).
Where:
k = number of items
r = average correlation between any two items
α = reliability of the average or sum
Table 3.3 Cronbach Alpha
Cronbach's alpha Internal consistency
α ≥ 0.9 Excellent
0.8 ≤ α < 0.9 Good
0.7 ≤ α < 0.8 Acceptable
0.6 ≤ α < 0.7 Questionable
0.5 ≤ α < 0.6 Poor
α < 0.5 Unacceptable
Source: Lind (2012).
3.8 Classical Assumption Test
After validity and reliability test, classic assumption test is the next staage in
multiple linear regression analysis (Berenson et al., 2009). There 3 stages in classic
assumption test such as normality testing, heterosdascity testing, and
multicollinearity.
33
3.8.1 Normality Test
Normality test are used to test the independent variable (X) and dependent variable
(Y) on the resulting regression equation, whether normally distributed or not
normally distributed. Normality test will use Histogram chart and P-Plots to test the
regression model residuals (Sekaran, Bougie 2013).
3.8.2 Heteroscedasticity Test
Heteroscedasticity Test looking through chart pattern point spread (scatterplot).
Heteroscedasticity needed to be tested and become important step in the multiple
regression analysis equation, for the same or not the variance of the residuals of the
observations with other observations. If the residuals have the difference variance,
it’s called heteroscedasticity (Sekaran & Bougie, 2013). The ideal condition for
multiple linear regression is when there is no heteroscedasticity. Analysis of
heteroscedasticity assumption SPSS output come out through the scatterplot graph
between Z prediction (ZPRED) for the value of independent variable, for this
research is Suplier Satisfaction ( X axis = Y outcome prediction), and all residual
value (SRESID) that represent dependent variable, for this research is Tangible,
Reliability, Responsiveness, Empathy and Assurance (Y-axis = Y predicted – Y
rill). ZPRED and SRESID are the formula in the SPSS software that will process
the scatterplot.
3.8.3 Multicollinearity Test
Correlation between independent variables which makes difficulty in inteference
about individual regression coefficients and their individual effect on the dependent
variables. Avoiding the correlated independent variable is another reason that can
create the error in hypothesis result for the individual independent variables. In
practice, select the independent variables that are completely unrelated is quite
difficult. Multicollinearity problem arise when there is perfect relationship between
50 variables or all the variables in the research. Multicollinearity doesn’t affect
independent the multiple regression equation’s ability to predict the dependent
variable. However, according to Levine (2012), there are opporunity for unexpected
result on the relationship between indeendent variables. To discover the relationship
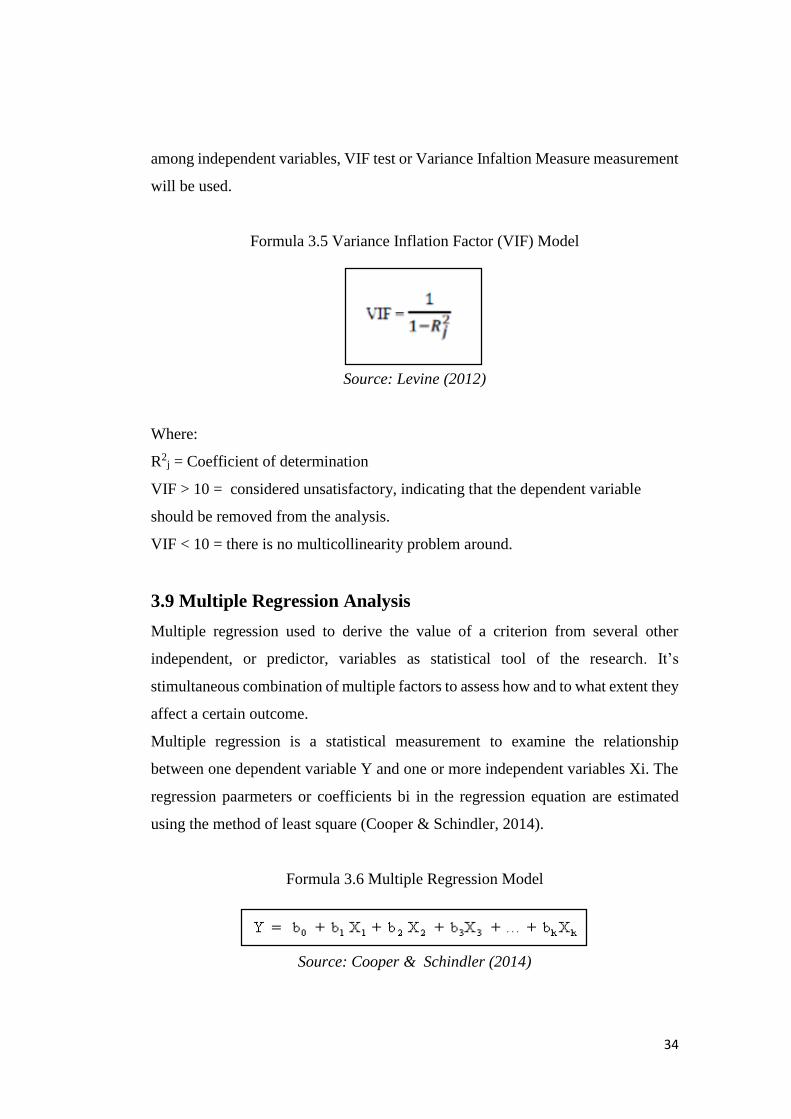
34
among independent variables, VIF test or Variance Infaltion Measure measurement
will be used.
Formula 3.5 Variance Inflation Factor (VIF) Model
Source: Levine (2012)
Where:
R2j = Coefficient of determination
VIF > 10 = considered unsatisfactory, indicating that the dependent variable
should be removed from the analysis.
VIF < 10 = there is no multicollinearity problem around.
3.9 Multiple Regression Analysis
Multiple regression used to derive the value of a criterion from several other
independent, or predictor, variables as statistical tool of the research. It’s
stimultaneous combination of multiple factors to assess how and to what extent they
affect a certain outcome.
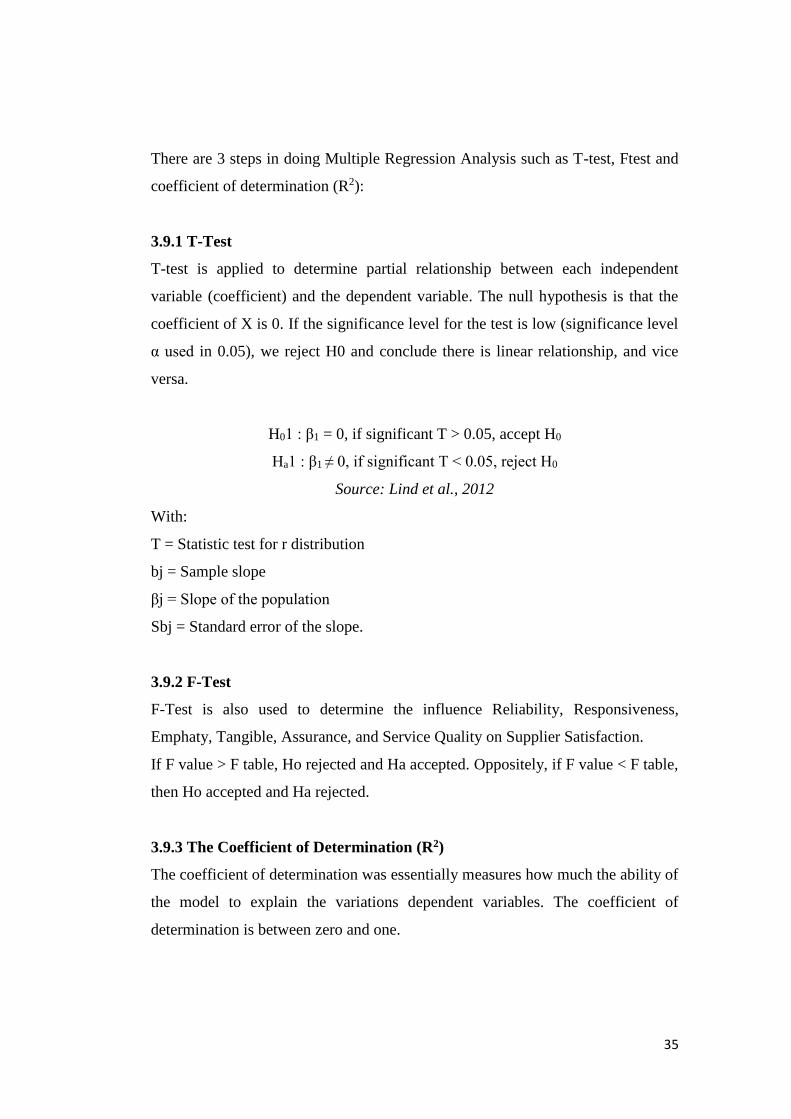
Multiple regression is a statistical measurement to examine the relationship
between one dependent variable Y and one or more independent variables Xi. The
regression paarmeters or coefficients bi in the regression equation are estimated
using the method of least square (Cooper & Schindler, 2014).
Formula 3.6 Multiple Regression Model
Source: Cooper & Schindler (2014)
35
There are 3 steps in doing Multiple Regression Analysis such as T-test, Ftest and
coefficient of determination (R2):
3.9.1 T-Test
T-test is applied to determine partial relationship between each independent
variable (coefficient) and the dependent variable. The null hypothesis is that the
coefficient of X is 0. If the significance level for the test is low (significance level
α used in 0.05), we reject H0 and conclude there is linear relationship, and vice
versa.
H01 : β1 = 0, if significant T > 0.05, accept H0
Ha1 : β1 ≠ 0, if significant T < 0.05, reject H0
Source: Lind et al., 2012
With:
T = Statistic test for r distribution
bj = Sample slope
βj = Slope of the population
Sbj = Standard error of the slope.
3.9.2 F-Test
F-Test is also used to determine the influence Reliability, Responsiveness,
Emphaty, Tangible, Assurance, and Service Quality on Supplier Satisfaction.
If F value > F table, Ho rejected and Ha accepted. Oppositely, if F value < F table,
then Ho accepted and Ha rejected.
3.9.3 The Coefficient of Determination (R2)
The coefficient of determination was essentially measures how much the ability of
the model to explain the variations dependent variables. The coefficient of
determination is between zero and one.
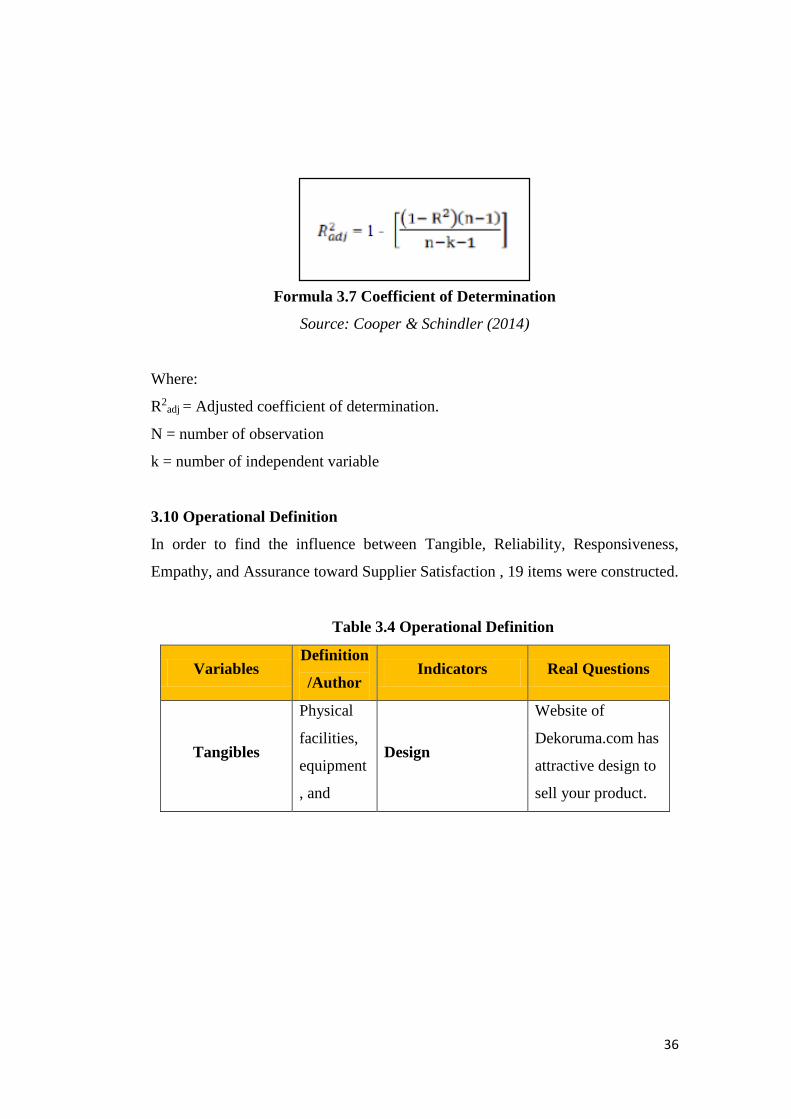
36
Formula 3.7 Coefficient of Determination
Source: Cooper & Schindler (2014)
Where:
R2adj = Adjusted coefficient of determination.
N = number of observation
k = number of independent variable
3.10 Operational Definition
In order to find the influence between Tangible, Reliability, Responsiveness,
Empathy, and Assurance toward Supplier Satisfaction , 19 items were constructed.
Table 3.4 Operational Definition
Variables Definition
/Author Indicators Real Questions
Tangibles
Physical
facilities,
equipment
, and
Design
Website of
Dekoruma.com has
attractive design to
sell your product.
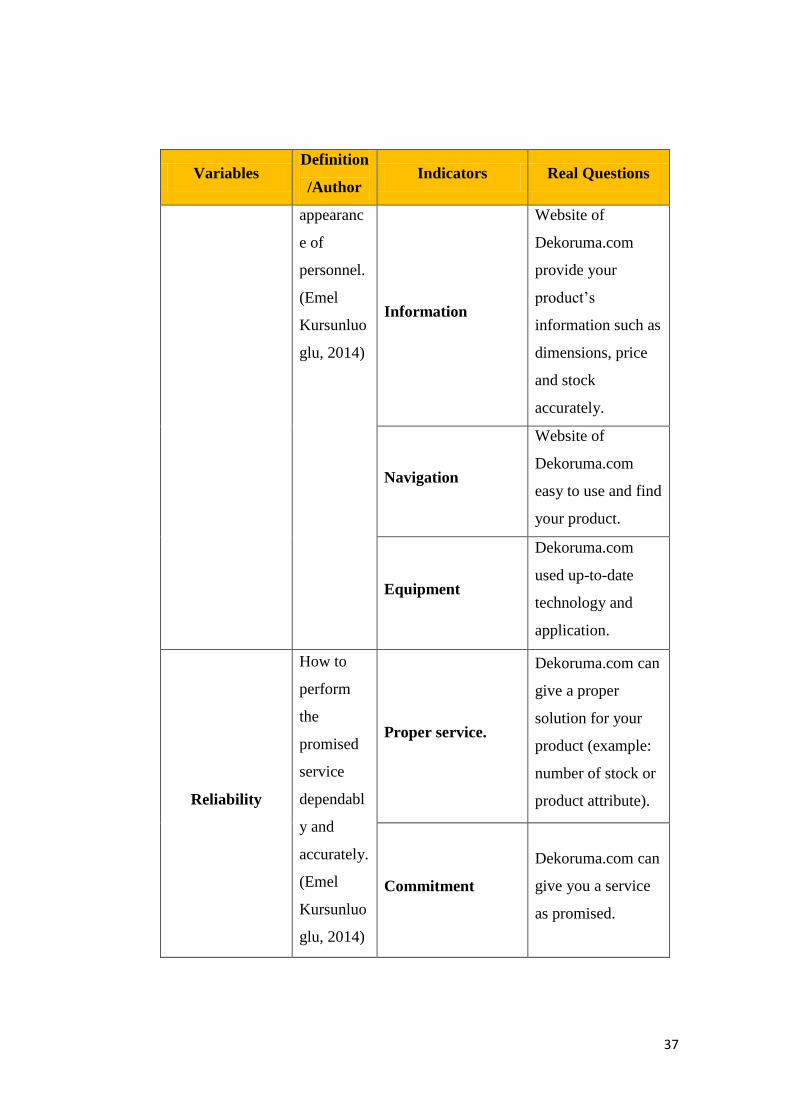
37
Variables Definition
/Author Indicators Real Questions
appearanc
e of
personnel.
(Emel
Kursunluo
glu, 2014)
Information
Website of
Dekoruma.com
provide your
product’s
information such as
dimensions, price
and stock
accurately.
Navigation
Website of
Dekoruma.com
easy to use and find
your product.
Equipment
Dekoruma.com
used up-to-date
technology and
application.
Reliability
How to
perform
the
promised
service
dependabl
y and
accurately.
(Emel
Kursunluo
glu, 2014)
Proper service.
Dekoruma.com can
give a proper
solution for your
product (example:
number of stock or
product attribute).
Commitment
Dekoruma.com can
give you a service
as promised.
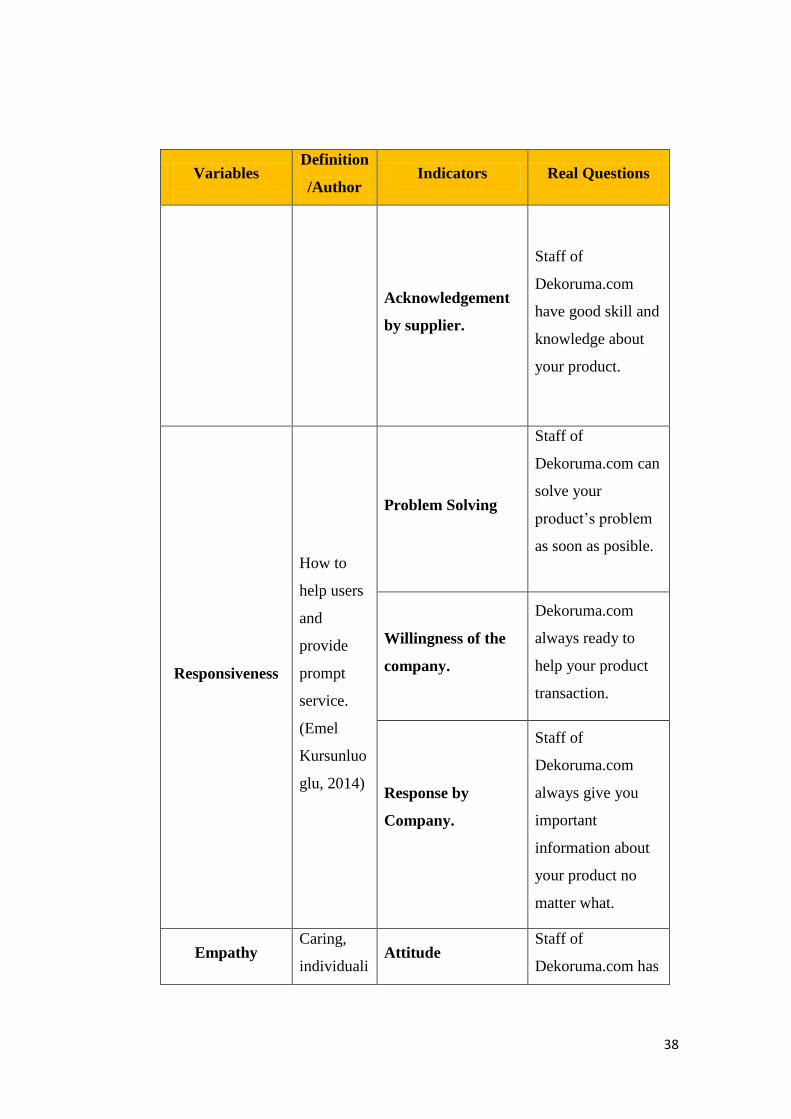
38
Variables Definition
/Author Indicators Real Questions
Acknowledgement
by supplier.
Staff of
Dekoruma.com
have good skill and
knowledge about
your product.
Responsiveness
How to
help users
and
provide
prompt
service.
(Emel
Kursunluo
glu, 2014)
Problem Solving
Staff of
Dekoruma.com can
solve your
product’s problem
as soon as posible.
Willingness of the
company.
Dekoruma.com
always ready to
help your product
transaction.
Response by
Company.
Staff of
Dekoruma.com
always give you
important
information about
your product no
matter what.
Empathy Caring,
individualiAttitude
Staff of
Dekoruma.com has
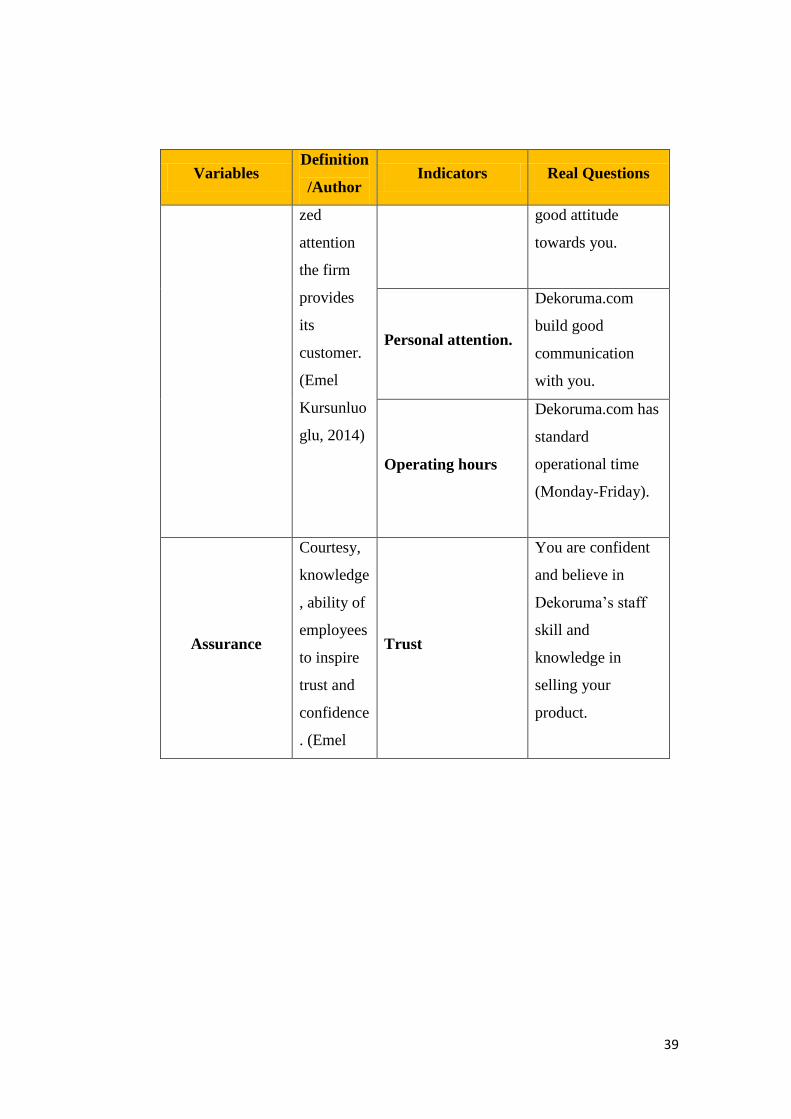
39
Variables Definition
/Author Indicators Real Questions
zed
attention
the firm
provides
its
customer.
(Emel
Kursunluo
glu, 2014)
good attitude
towards you.
Personal attention.
Dekoruma.com
build good
communication
with you.
Operating hours
Dekoruma.com has
standard
operational time
(Monday-Friday).
Assurance
Courtesy,
knowledge
, ability of
employees
to inspire
trust and
confidence
. (Emel
Trust
You are confident
and believe in
Dekoruma’s staff
skill and
knowledge in
selling your
product.
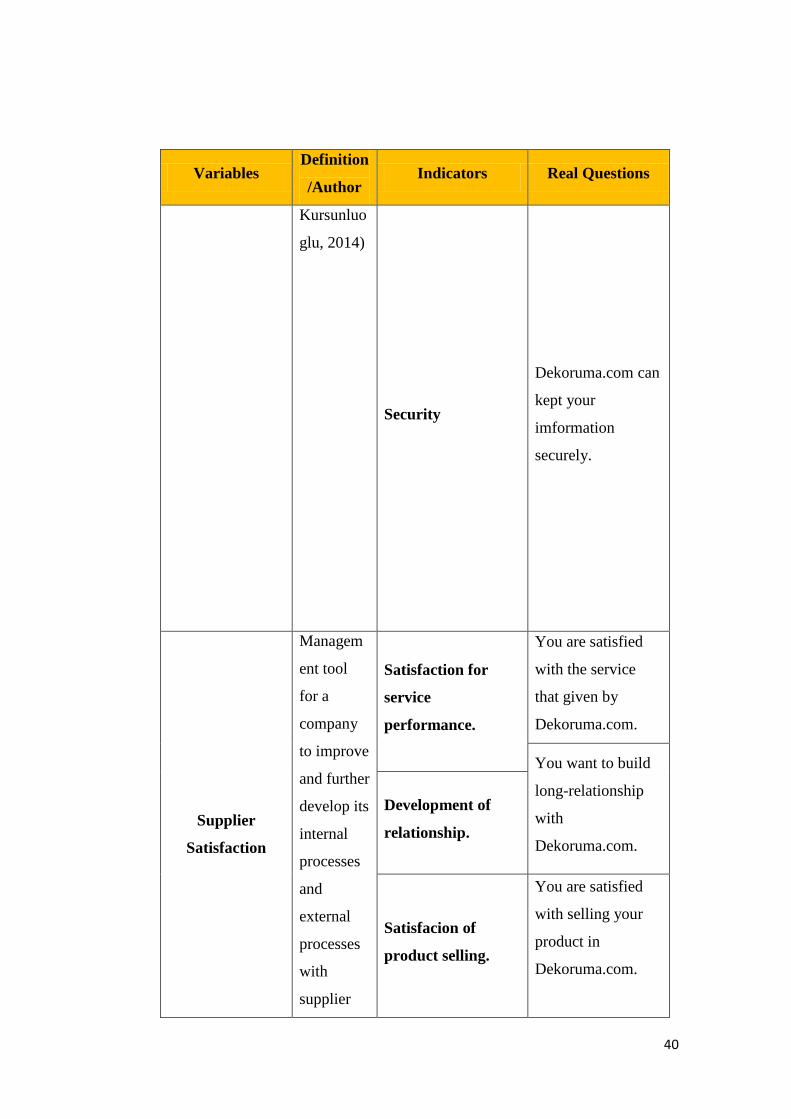
40
Variables Definition
/Author Indicators Real Questions
Kursunluo
glu, 2014)
Security
Dekoruma.com can
kept your
imformation
securely.
Supplier
Satisfaction
Managem
ent tool
for a
company
to improve
and further
develop its
internal
processes
and
external
processes
with
supplier
Satisfaction for
service
performance.
You are satisfied
with the service
that given by
Dekoruma.com.
You want to build
long-relationship
with
Dekoruma.com.
Development of
relationship.
Satisfacion of
product selling.
You are satisfied
with selling your
product in
Dekoruma.com.
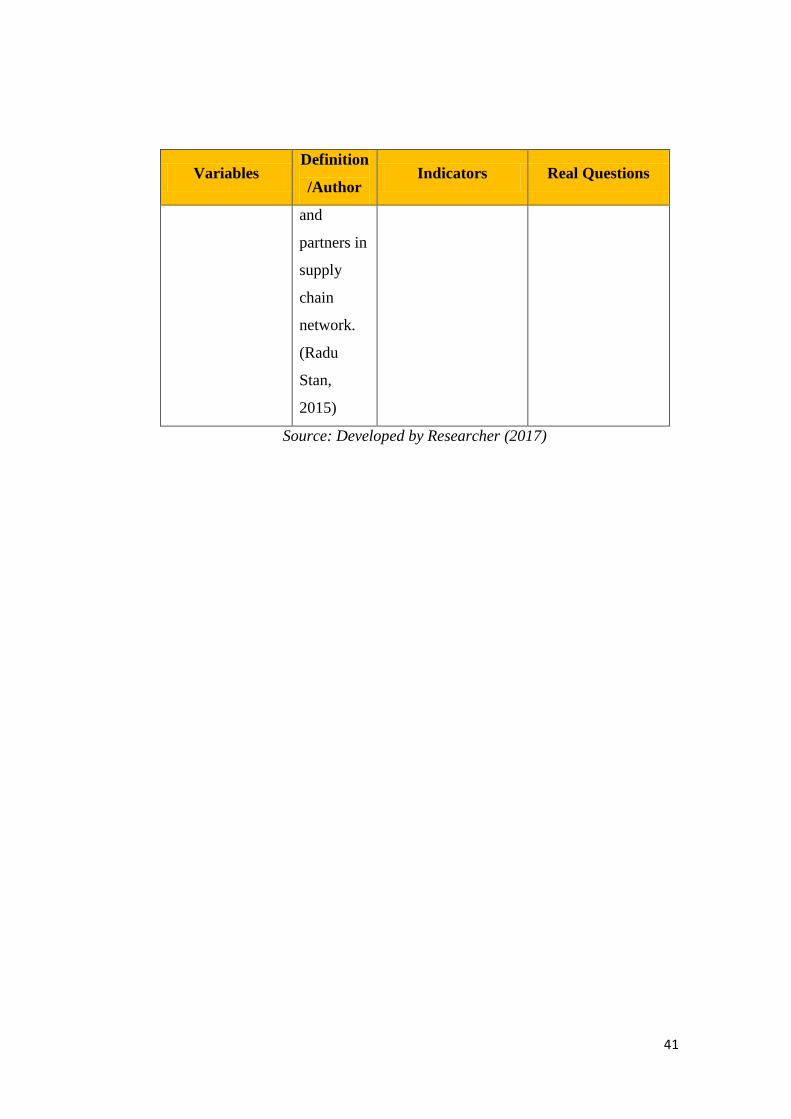
41
Variables Definition
/Author Indicators Real Questions
and
partners in
supply
chain
network.
(Radu
Stan,
2015)
Source: Developed by Researcher (2017)
42
CHAPTER IV
ANALYSIS AND INTERPRETATION
4.1 Company Profile
Dekoruma.com is a home and living e-commerce that adopt online marketplace
concept with an aim to provide an efficient home and living selling process. Their
goal is to make everyone has an easy access to buy great quality funiture and home
furnishing with affordable price. However, middleman and logistics become a
burden for furniture industry that create inefficiency which make it sold 10-15 times
more expensive than its production value, which can’t allow everyone to buy
furniture as they want (Yogan & Manohar, 2015). Dekoruma.com come up with
efficiency and effectiveness in selling furniture product by applying technology to
improve the supply-chain process. Dekoruma.com aims to cut the middlemen in
order to give the lowest possible price to end-customer and empowering traditional
forwarder with technology to improve the supply chain efficiency.
Aruna Harsa is the founder of Dekoruma.com that has established since September
1st, 2016 and lead engineering team at Vanitee also co-founded Dashell with Dimas
Harry Priawan who was previously worked at aCommerce as Head of Product
Development. Dekoruma.com located at Kebon Jeruk, West Jakarta.
Dekoruma.com’s team members hail from NTU, University of British Colombia
and Melbourne University graduates, with top company background, such as
Quora, Traveloka, Panasonic, Ruma.com, aCommerce and Informa.
Dekoruma.com provide services such as product photo and merchant central for
supplier. For product photo, Dekoruma.com has their own creative team that
handle product photo and their make different photo theme for each month. They
also provide product photo from different angle without additional charge to
supplier. Dekoruma.com also use direct product from supplier in the catalog. For
merchant central, it developed by technology department to make the transaction
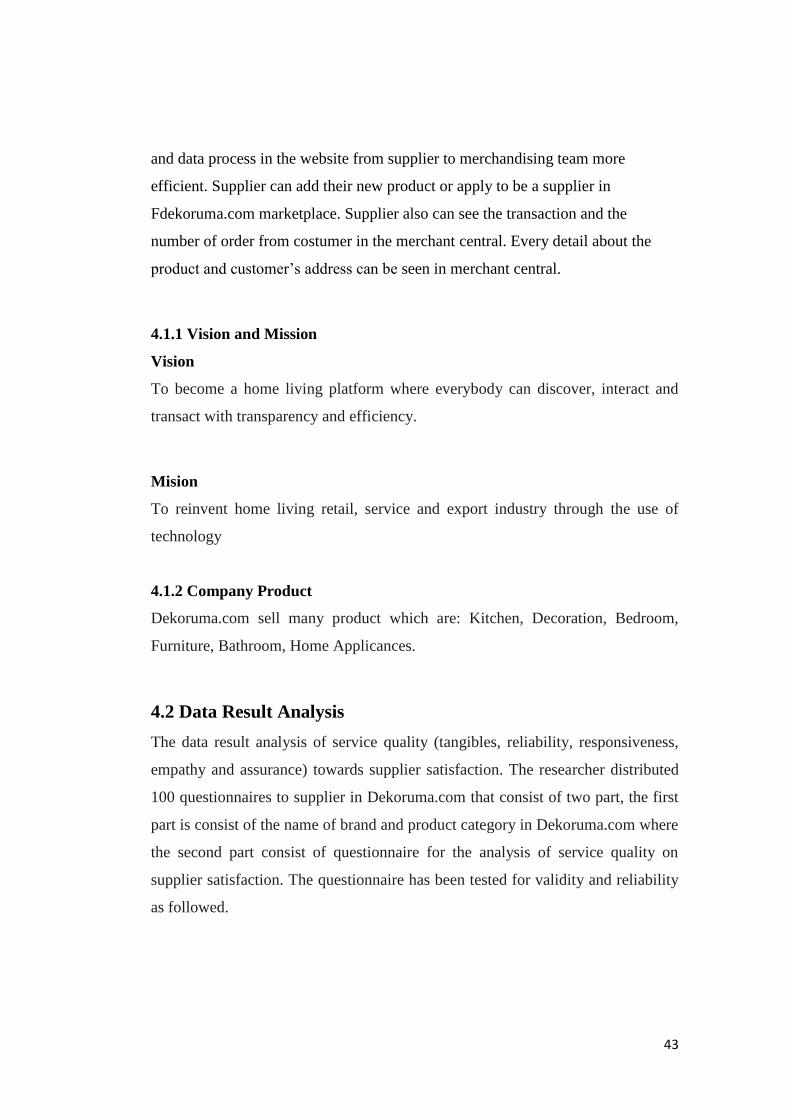
43
and data process in the website from supplier to merchandising team more
efficient. Supplier can add their new product or apply to be a supplier in
Fdekoruma.com marketplace. Supplier also can see the transaction and the
number of order from costumer in the merchant central. Every detail about the
product and customer’s address can be seen in merchant central.
4.1.1 Vision and Mission
Vision
To become a home living platform where everybody can discover, interact and
transact with transparency and efficiency.
Mision
To reinvent home living retail, service and export industry through the use of
technology
4.1.2 Company Product
Dekoruma.com sell many product which are: Kitchen, Decoration, Bedroom,
Furniture, Bathroom, Home Applicances.
4.2 Data Result Analysis
The data result analysis of service quality (tangibles, reliability, responsiveness,
empathy and assurance) towards supplier satisfaction. The researcher distributed
100 questionnaires to supplier in Dekoruma.com that consist of two part, the first
part is consist of the name of brand and product category in Dekoruma.com where
the second part consist of questionnaire for the analysis of service quality on
supplier satisfaction. The questionnaire has been tested for validity and reliability
as followed.
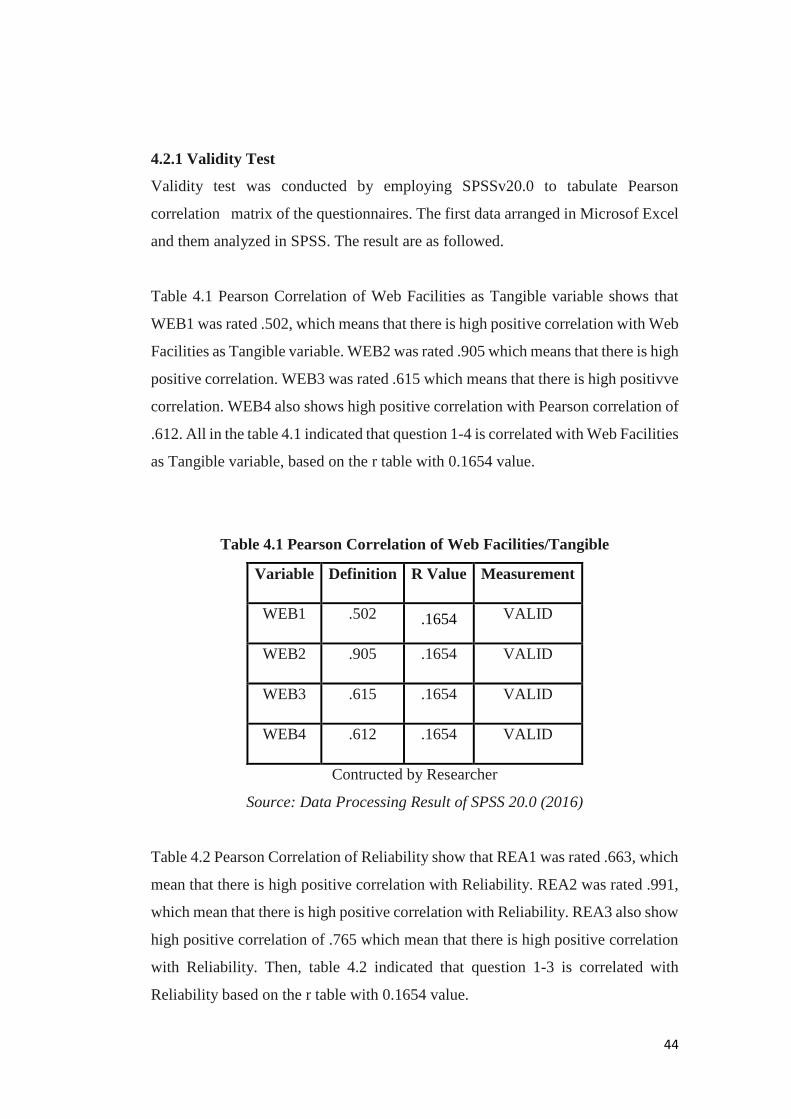
44
4.2.1 Validity Test
Validity test was conducted by employing SPSSv20.0 to tabulate Pearson
correlation matrix of the questionnaires. The first data arranged in Microsof Excel
and them analyzed in SPSS. The result are as followed.
Table 4.1 Pearson Correlation of Web Facilities as Tangible variable shows that
WEB1 was rated .502, which means that there is high positive correlation with Web
Facilities as Tangible variable. WEB2 was rated .905 which means that there is high
positive correlation. WEB3 was rated .615 which means that there is high positivve
correlation. WEB4 also shows high positive correlation with Pearson correlation of
.612. All in the table 4.1 indicated that question 1-4 is correlated with Web Facilities
as Tangible variable, based on the r table with 0.1654 value.
Table 4.1 Pearson Correlation of Web Facilities/Tangible
Variable Definition R Value Measurement
WEB1 .502 .1654 VALID
WEB2 .905 .1654 VALID
WEB3 .615 .1654 VALID
WEB4 .612 .1654 VALID
Contructed by Researcher
Source: Data Processing Result of SPSS 20.0 (2016)
Table 4.2 Pearson Correlation of Reliability show that REA1 was rated .663, which
mean that there is high positive correlation with Reliability. REA2 was rated .991,
which mean that there is high positive correlation with Reliability. REA3 also show
high positive correlation of .765 which mean that there is high positive correlation
with Reliability. Then, table 4.2 indicated that question 1-3 is correlated with
Reliability based on the r table with 0.1654 value.
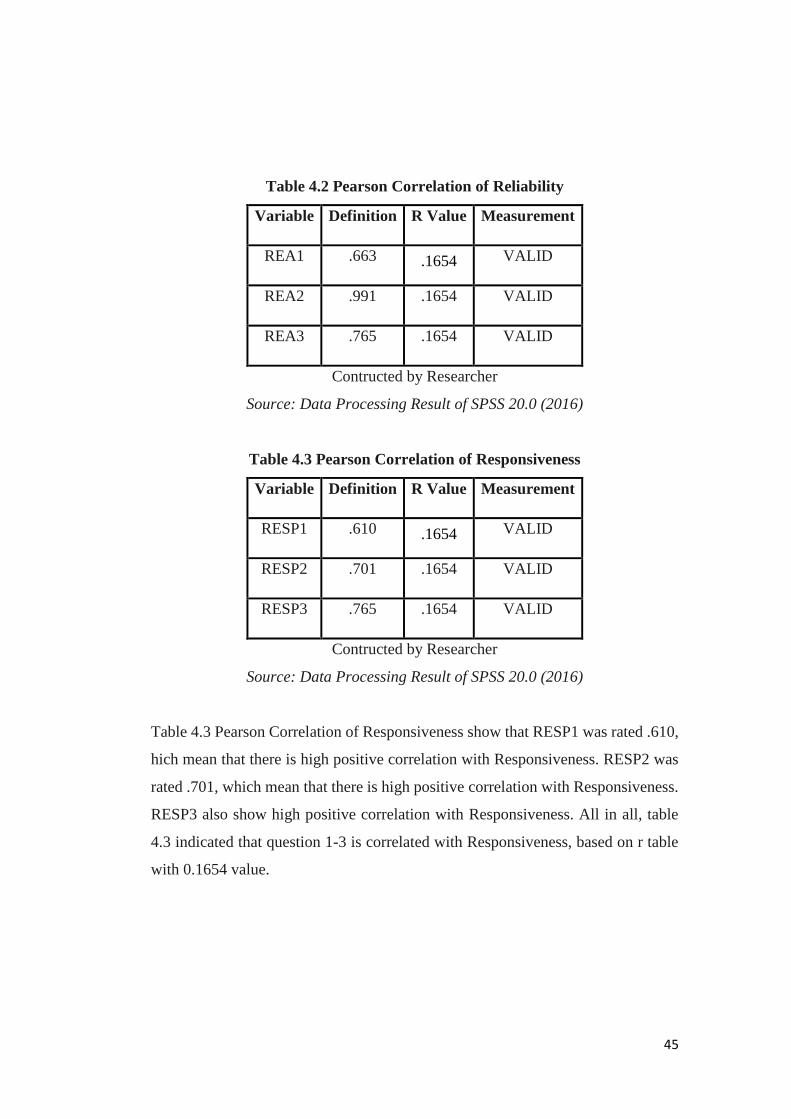
45
Table 4.2 Pearson Correlation of Reliability
Variable Definition R Value Measurement
REA1 .663 .1654 VALID
REA2 .991 .1654 VALID
REA3 .765 .1654 VALID
Contructed by Researcher
Source: Data Processing Result of SPSS 20.0 (2016)
Table 4.3 Pearson Correlation of Responsiveness
Variable Definition R Value Measurement
RESP1 .610 .1654 VALID
RESP2 .701 .1654 VALID
RESP3 .765 .1654 VALID
Contructed by Researcher
Source: Data Processing Result of SPSS 20.0 (2016)
Table 4.3 Pearson Correlation of Responsiveness show that RESP1 was rated .610,
hich mean that there is high positive correlation with Responsiveness. RESP2 was
rated .701, which mean that there is high positive correlation with Responsiveness.
RESP3 also show high positive correlation with Responsiveness. All in all, table
4.3 indicated that question 1-3 is correlated with Responsiveness, based on r table
with 0.1654 value.
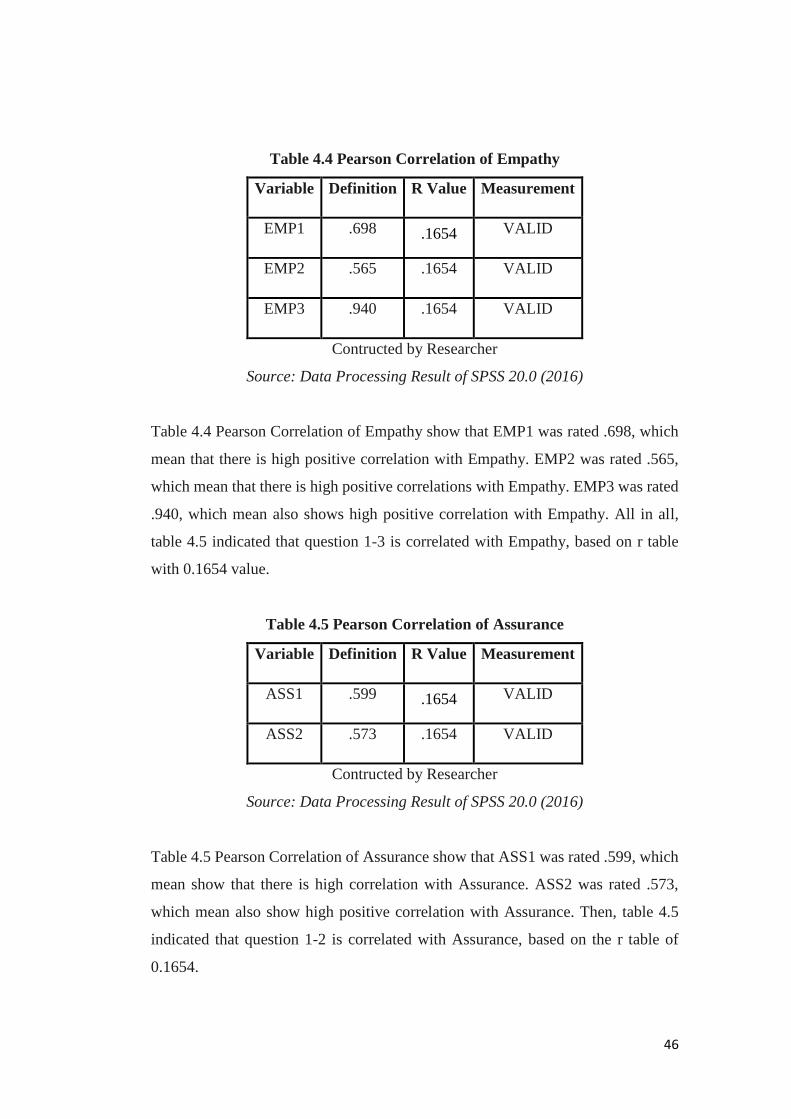
46
Table 4.4 Pearson Correlation of Empathy
Variable Definition R Value Measurement
EMP1 .698 .1654 VALID
EMP2 .565 .1654 VALID
EMP3 .940 .1654 VALID
Contructed by Researcher
Source: Data Processing Result of SPSS 20.0 (2016)
Table 4.4 Pearson Correlation of Empathy show that EMP1 was rated .698, which
mean that there is high positive correlation with Empathy. EMP2 was rated .565,
which mean that there is high positive correlations with Empathy. EMP3 was rated
.940, which mean also shows high positive correlation with Empathy. All in all,
table 4.5 indicated that question 1-3 is correlated with Empathy, based on r table
with 0.1654 value.
Table 4.5 Pearson Correlation of Assurance
Variable Definition R Value Measurement
ASS1 .599 .1654 VALID
ASS2 .573 .1654 VALID
Contructed by Researcher
Source: Data Processing Result of SPSS 20.0 (2016)
Table 4.5 Pearson Correlation of Assurance show that ASS1 was rated .599, which
mean show that there is high correlation with Assurance. ASS2 was rated .573,
which mean also show high positive correlation with Assurance. Then, table 4.5
indicated that question 1-2 is correlated with Assurance, based on the r table of
0.1654.
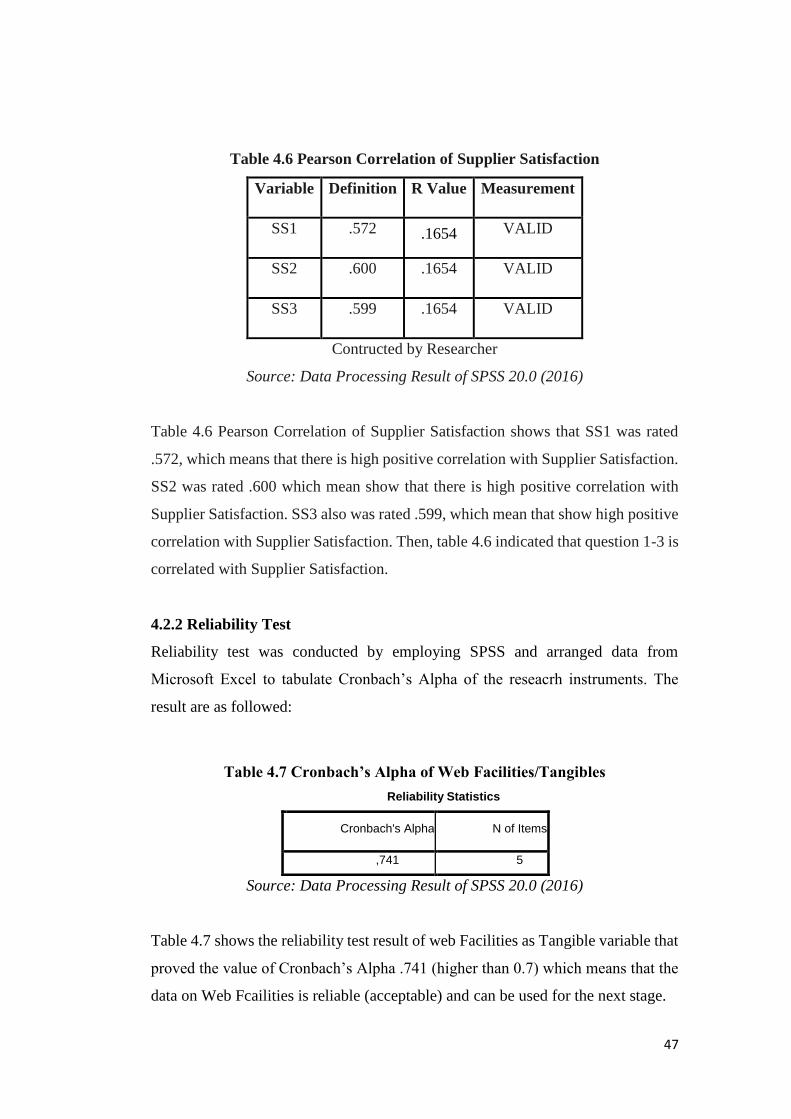
47
Table 4.6 Pearson Correlation of Supplier Satisfaction
Variable Definition R Value Measurement
SS1 .572 .1654 VALID
SS2 .600 .1654 VALID
SS3 .599 .1654 VALID
Contructed by Researcher
Source: Data Processing Result of SPSS 20.0 (2016)
Table 4.6 Pearson Correlation of Supplier Satisfaction shows that SS1 was rated
.572, which means that there is high positive correlation with Supplier Satisfaction.
SS2 was rated .600 which mean show that there is high positive correlation with
Supplier Satisfaction. SS3 also was rated .599, which mean that show high positive
correlation with Supplier Satisfaction. Then, table 4.6 indicated that question 1-3 is
correlated with Supplier Satisfaction.
4.2.2 Reliability Test
Reliability test was conducted by employing SPSS and arranged data from
Microsoft Excel to tabulate Cronbach’s Alpha of the reseacrh instruments. The
result are as followed:
Table 4.7 Cronbach’s Alpha of Web Facilities/Tangibles
Reliability Statistics
Cronbach's Alpha N of Items
,741 5
Source: Data Processing Result of SPSS 20.0 (2016)
Table 4.7 shows the reliability test result of web Facilities as Tangible variable that
proved the value of Cronbach’s Alpha .741 (higher than 0.7) which means that the
data on Web Fcailities is reliable (acceptable) and can be used for the next stage.
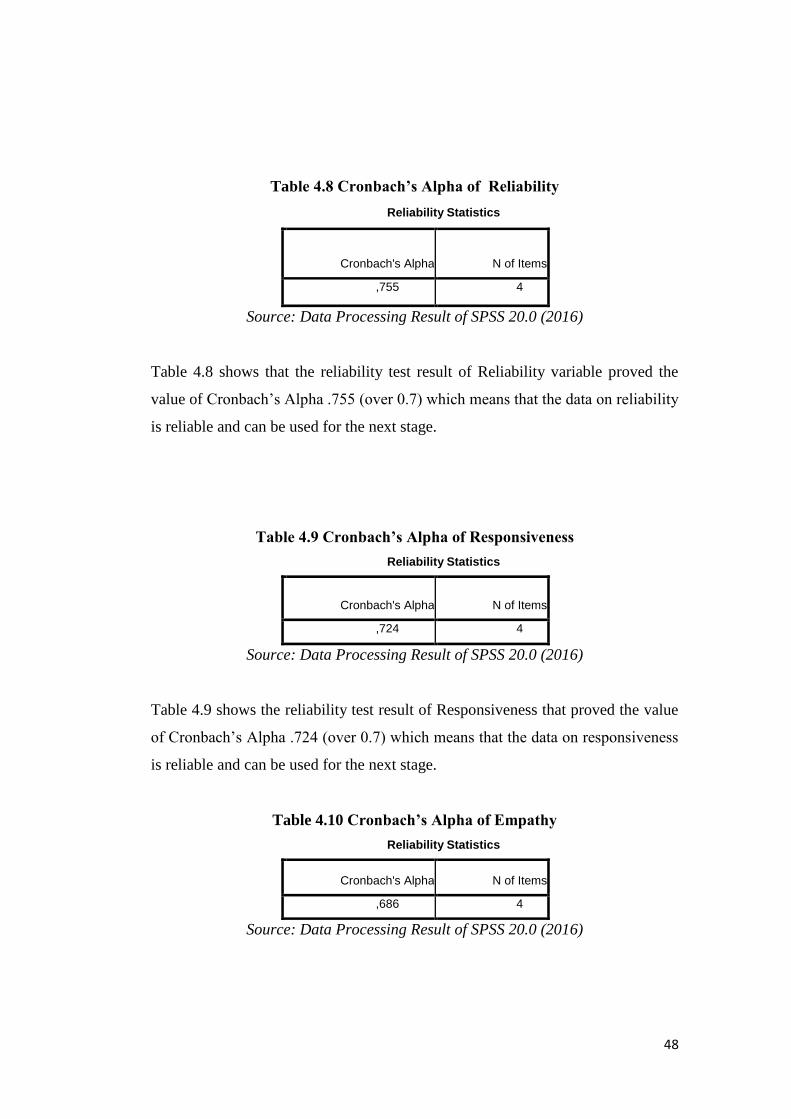
48
Table 4.8 Cronbach’s Alpha of Reliability
Reliability Statistics
Cronbach's Alpha N of Items
,755 4
Source: Data Processing Result of SPSS 20.0 (2016)
Table 4.8 shows that the reliability test result of Reliability variable proved the
value of Cronbach’s Alpha .755 (over 0.7) which means that the data on reliability
is reliable and can be used for the next stage.
Table 4.9 Cronbach’s Alpha of Responsiveness
Reliability Statistics
Cronbach's Alpha N of Items
,724 4
Source: Data Processing Result of SPSS 20.0 (2016)
Table 4.9 shows the reliability test result of Responsiveness that proved the value
of Cronbach’s Alpha .724 (over 0.7) which means that the data on responsiveness
is reliable and can be used for the next stage.
Table 4.10 Cronbach’s Alpha of Empathy
Reliability Statistics
Cronbach's Alpha N of Items
,686 4
Source: Data Processing Result of SPSS 20.0 (2016)
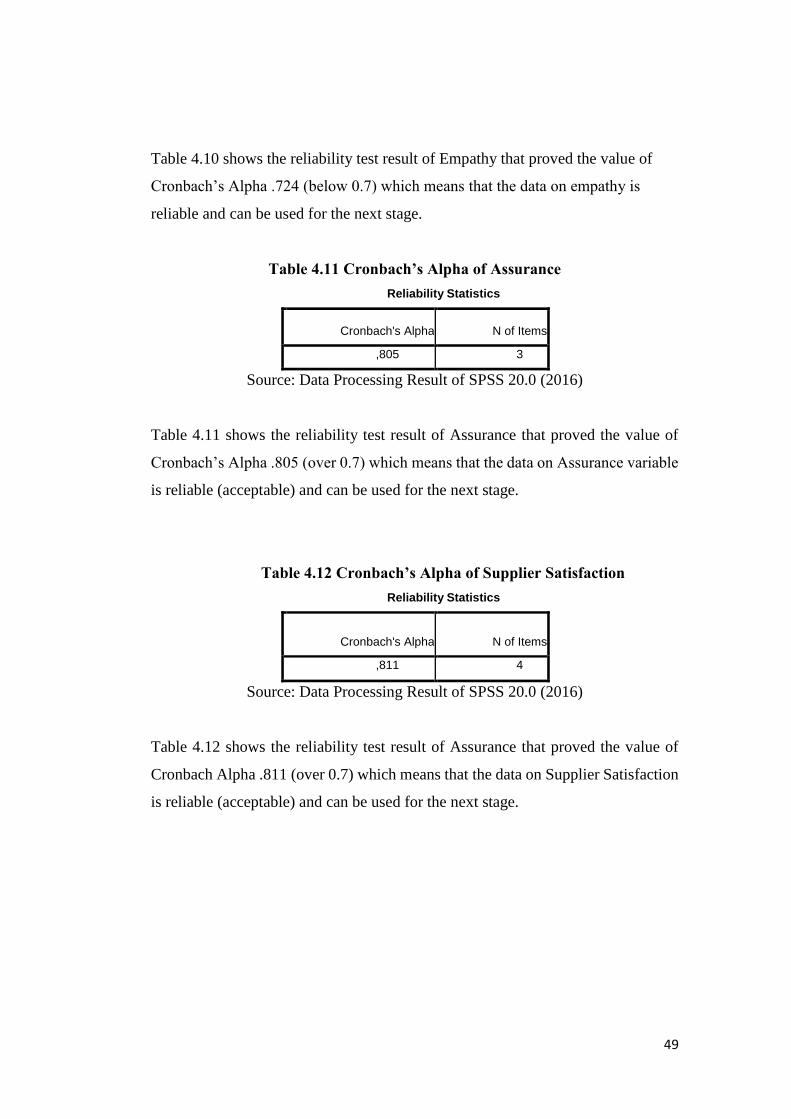
49
Table 4.10 shows the reliability test result of Empathy that proved the value of
Cronbach’s Alpha .724 (below 0.7) which means that the data on empathy is
reliable and can be used for the next stage.
Table 4.11 Cronbach’s Alpha of Assurance
Reliability Statistics
Cronbach's Alpha N of Items
,805 3
Source: Data Processing Result of SPSS 20.0 (2016)
Table 4.11 shows the reliability test result of Assurance that proved the value of
Cronbach’s Alpha .805 (over 0.7) which means that the data on Assurance variable
is reliable (acceptable) and can be used for the next stage.
Table 4.12 Cronbach’s Alpha of Supplier Satisfaction
Reliability Statistics
Cronbach's Alpha N of Items
,811 4
Source: Data Processing Result of SPSS 20.0 (2016)
Table 4.12 shows the reliability test result of Assurance that proved the value of
Cronbach Alpha .811 (over 0.7) which means that the data on Supplier Satisfaction
is reliable (acceptable) and can be used for the next stage.
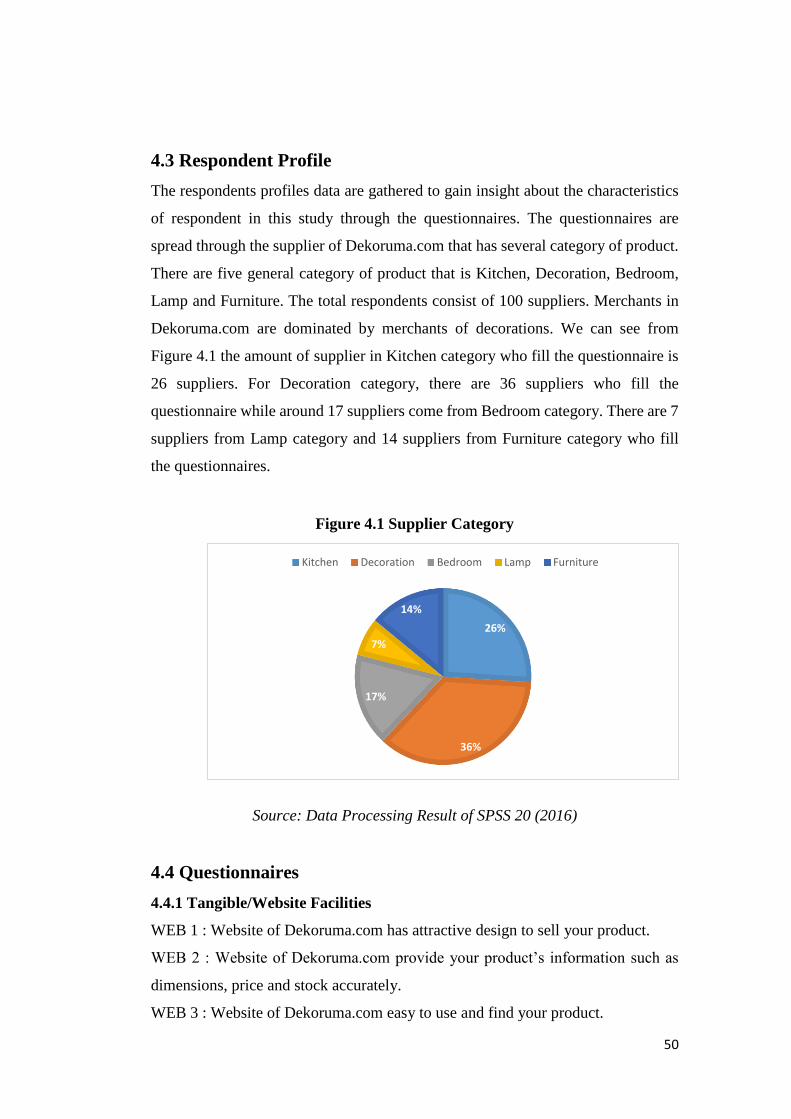
50
4.3 Respondent Profile
The respondents profiles data are gathered to gain insight about the characteristics
of respondent in this study through the questionnaires. The questionnaires are
spread through the supplier of Dekoruma.com that has several category of product.
There are five general category of product that is Kitchen, Decoration, Bedroom,
Lamp and Furniture. The total respondents consist of 100 suppliers. Merchants in
Dekoruma.com are dominated by merchants of decorations. We can see from
Figure 4.1 the amount of supplier in Kitchen category who fill the questionnaire is
26 suppliers. For Decoration category, there are 36 suppliers who fill the
questionnaire while around 17 suppliers come from Bedroom category. There are 7
suppliers from Lamp category and 14 suppliers from Furniture category who fill
the questionnaires.
Figure 4.1 Supplier Category
Source: Data Processing Result of SPSS 20 (2016)
4.4 Questionnaires
4.4.1 Tangible/Website Facilities
WEB 1 : Website of Dekoruma.com has attractive design to sell your product.
WEB 2 : Website of Dekoruma.com provide your product’s information such as
dimensions, price and stock accurately.
WEB 3 : Website of Dekoruma.com easy to use and find your product.
26%
36%
17%
7%
14%
Kitchen Decoration Bedroom Lamp Furniture
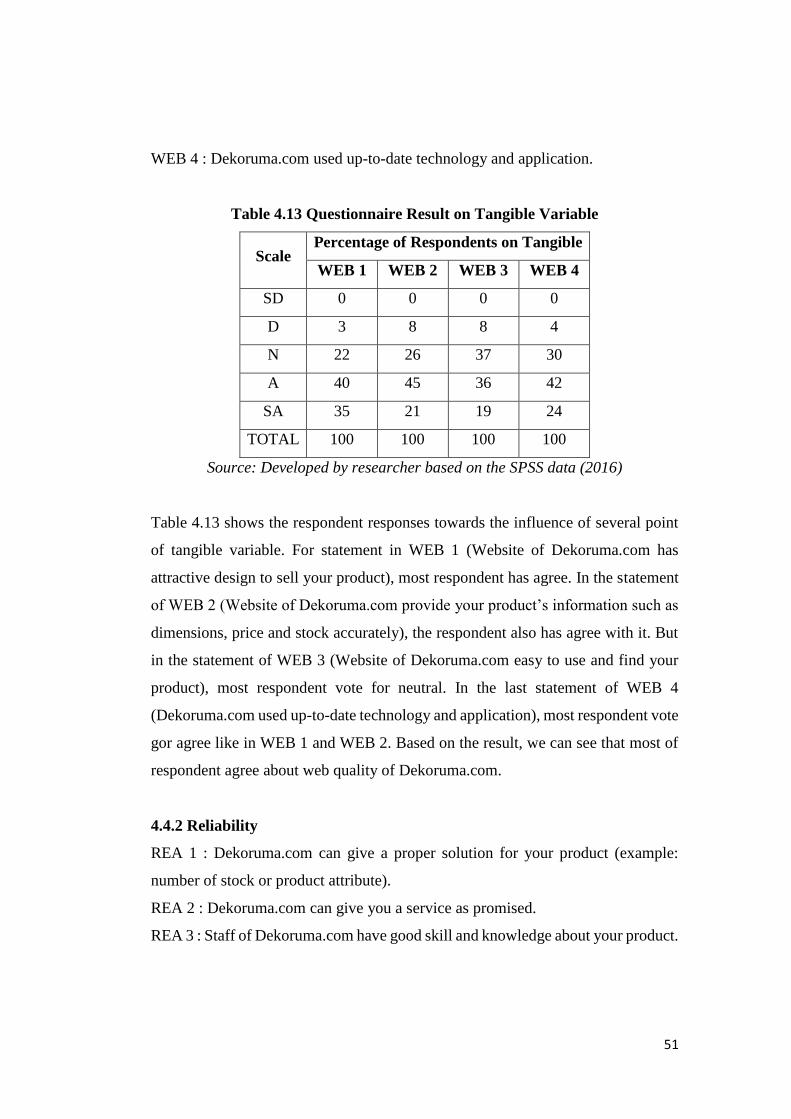
51
WEB 4 : Dekoruma.com used up-to-date technology and application.
Table 4.13 Questionnaire Result on Tangible Variable
Scale Percentage of Respondents on Tangible
WEB 1 WEB 2 WEB 3 WEB 4
SD 0 0 0 0
D 3 8 8 4
N 22 26 37 30
A 40 45 36 42
SA 35 21 19 24
TOTAL 100 100 100 100
Source: Developed by researcher based on the SPSS data (2016)
Table 4.13 shows the respondent responses towards the influence of several point
of tangible variable. For statement in WEB 1 (Website of Dekoruma.com has
attractive design to sell your product), most respondent has agree. In the statement
of WEB 2 (Website of Dekoruma.com provide your product’s information such as
dimensions, price and stock accurately), the respondent also has agree with it. But
in the statement of WEB 3 (Website of Dekoruma.com easy to use and find your
product), most respondent vote for neutral. In the last statement of WEB 4
(Dekoruma.com used up-to-date technology and application), most respondent vote
gor agree like in WEB 1 and WEB 2. Based on the result, we can see that most of
respondent agree about web quality of Dekoruma.com.
4.4.2 Reliability
REA 1 : Dekoruma.com can give a proper solution for your product (example:
number of stock or product attribute).
REA 2 : Dekoruma.com can give you a service as promised.
REA 3 : Staff of Dekoruma.com have good skill and knowledge about your product.
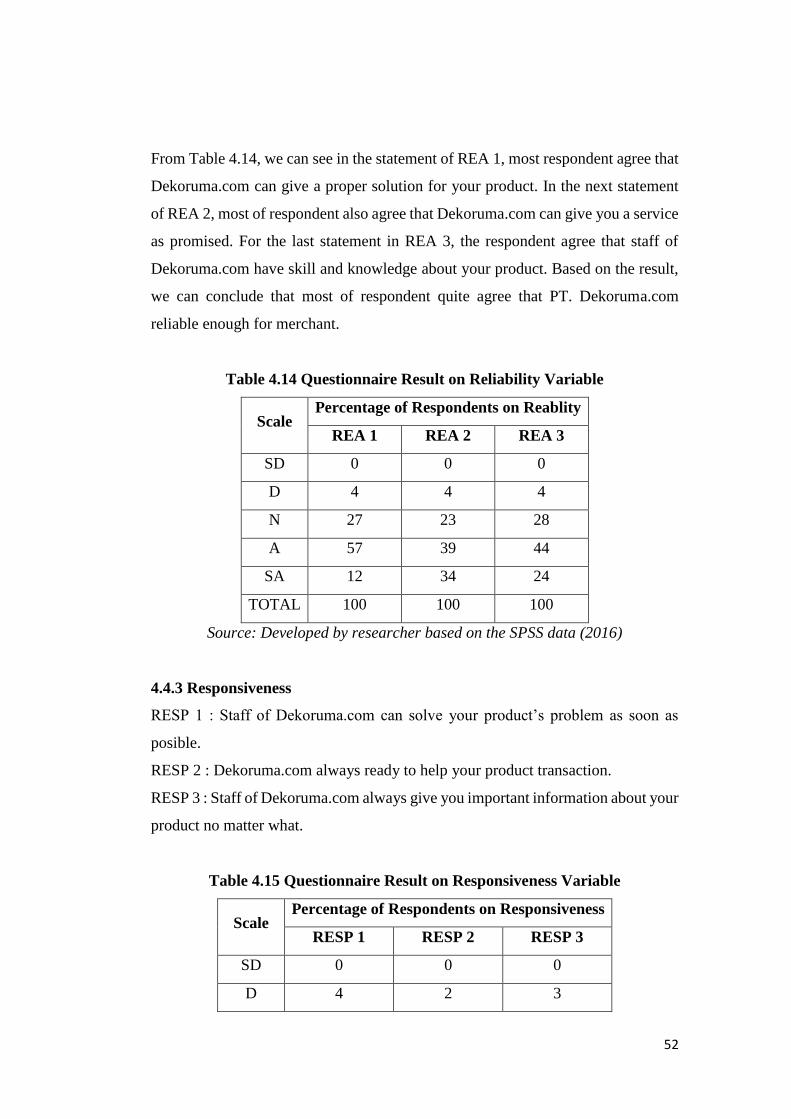
52
From Table 4.14, we can see in the statement of REA 1, most respondent agree that
Dekoruma.com can give a proper solution for your product. In the next statement
of REA 2, most of respondent also agree that Dekoruma.com can give you a service
as promised. For the last statement in REA 3, the respondent agree that staff of
Dekoruma.com have skill and knowledge about your product. Based on the result,
we can conclude that most of respondent quite agree that PT. Dekoruma.com
reliable enough for merchant.
Table 4.14 Questionnaire Result on Reliability Variable
Scale Percentage of Respondents on Reablity
REA 1 REA 2 REA 3
SD 0 0 0
D 4 4 4
N 27 23 28
A 57 39 44
SA 12 34 24
TOTAL 100 100 100
Source: Developed by researcher based on the SPSS data (2016)
4.4.3 Responsiveness
RESP 1 : Staff of Dekoruma.com can solve your product’s problem as soon as
posible.
RESP 2 : Dekoruma.com always ready to help your product transaction.
RESP 3 : Staff of Dekoruma.com always give you important information about your
product no matter what.
Table 4.15 Questionnaire Result on Responsiveness Variable
Scale Percentage of Respondents on Responsiveness
RESP 1 RESP 2 RESP 3
SD 0 0 0
D 4 2 3
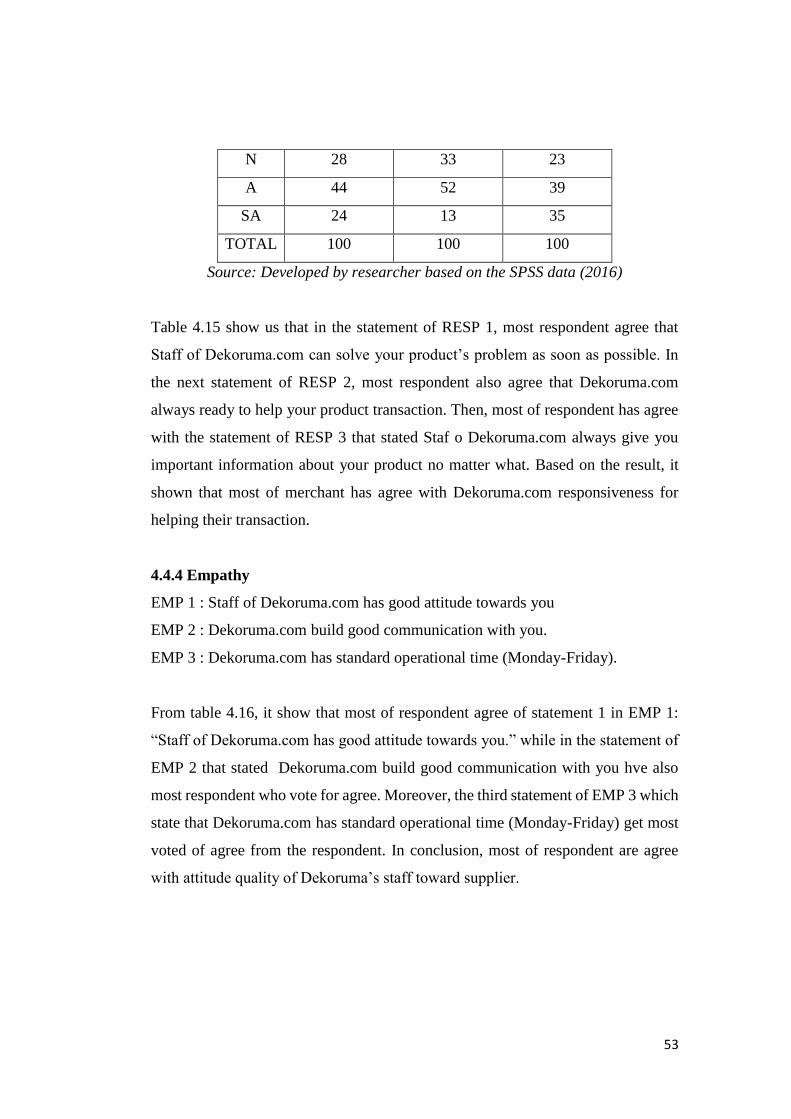
53
N 28 33 23
A 44 52 39
SA 24 13 35
TOTAL 100 100 100
Source: Developed by researcher based on the SPSS data (2016)
Table 4.15 show us that in the statement of RESP 1, most respondent agree that
Staff of Dekoruma.com can solve your product’s problem as soon as possible. In
the next statement of RESP 2, most respondent also agree that Dekoruma.com
always ready to help your product transaction. Then, most of respondent has agree
with the statement of RESP 3 that stated Staf o Dekoruma.com always give you
important information about your product no matter what. Based on the result, it
shown that most of merchant has agree with Dekoruma.com responsiveness for
helping their transaction.
4.4.4 Empathy
EMP 1 : Staff of Dekoruma.com has good attitude towards you
EMP 2 : Dekoruma.com build good communication with you.
EMP 3 : Dekoruma.com has standard operational time (Monday-Friday).
From table 4.16, it show that most of respondent agree of statement 1 in EMP 1:
“Staff of Dekoruma.com has good attitude towards you.” while in the statement of
EMP 2 that stated Dekoruma.com build good communication with you hve also
most respondent who vote for agree. Moreover, the third statement of EMP 3 which
state that Dekoruma.com has standard operational time (Monday-Friday) get most
voted of agree from the respondent. In conclusion, most of respondent are agree
with attitude quality of Dekoruma’s staff toward supplier.
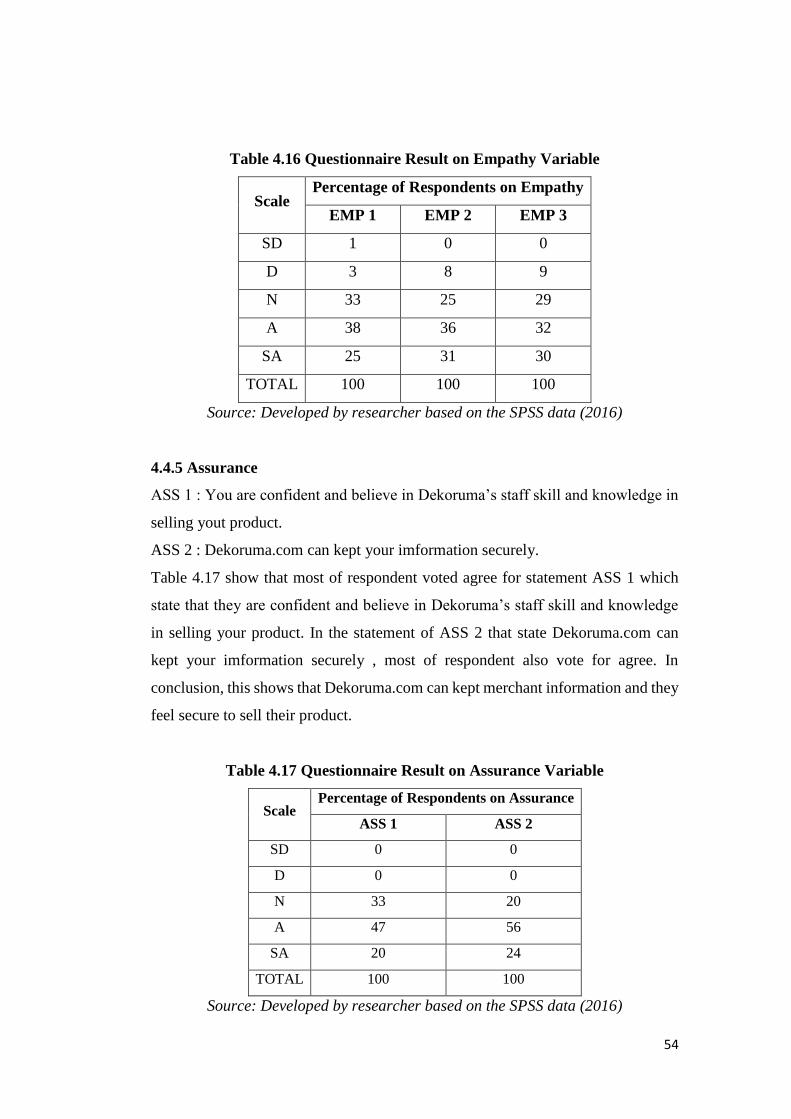
54
Table 4.16 Questionnaire Result on Empathy Variable
Scale Percentage of Respondents on Empathy
EMP 1 EMP 2 EMP 3
SD 1 0 0
D 3 8 9
N 33 25 29
A 38 36 32
SA 25 31 30
TOTAL 100 100 100
Source: Developed by researcher based on the SPSS data (2016)
4.4.5 Assurance
ASS 1 : You are confident and believe in Dekoruma’s staff skill and knowledge in
selling yout product.
ASS 2 : Dekoruma.com can kept your imformation securely.
Table 4.17 show that most of respondent voted agree for statement ASS 1 which
state that they are confident and believe in Dekoruma’s staff skill and knowledge
in selling your product. In the statement of ASS 2 that state Dekoruma.com can
kept your imformation securely , most of respondent also vote for agree. In
conclusion, this shows that Dekoruma.com can kept merchant information and they
feel secure to sell their product.
Table 4.17 Questionnaire Result on Assurance Variable
Scale Percentage of Respondents on Assurance
ASS 1 ASS 2
SD 0 0
D 0 0
N 33 20
A 47 56
SA 20 24
TOTAL 100 100
Source: Developed by researcher based on the SPSS data (2016)
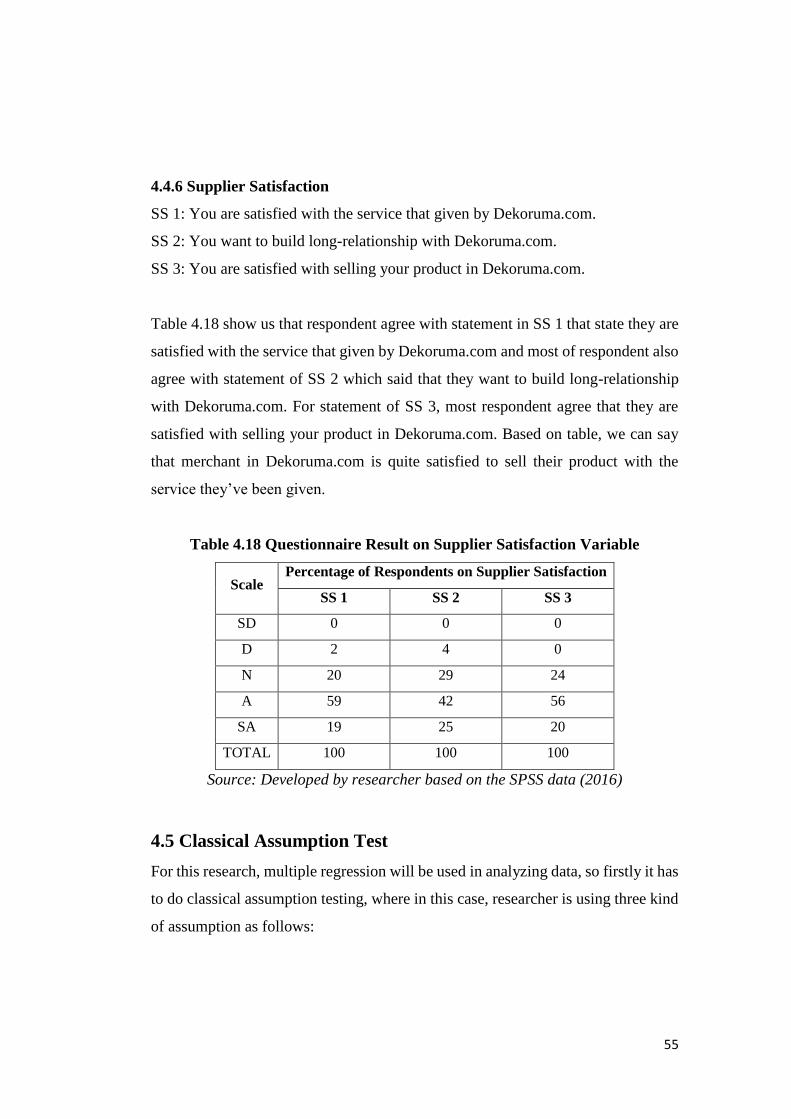
55
4.4.6 Supplier Satisfaction
SS 1: You are satisfied with the service that given by Dekoruma.com.
SS 2: You want to build long-relationship with Dekoruma.com.
SS 3: You are satisfied with selling your product in Dekoruma.com.
Table 4.18 show us that respondent agree with statement in SS 1 that state they are
satisfied with the service that given by Dekoruma.com and most of respondent also
agree with statement of SS 2 which said that they want to build long-relationship
with Dekoruma.com. For statement of SS 3, most respondent agree that they are
satisfied with selling your product in Dekoruma.com. Based on table, we can say
that merchant in Dekoruma.com is quite satisfied to sell their product with the
service they’ve been given.
Table 4.18 Questionnaire Result on Supplier Satisfaction Variable
Scale Percentage of Respondents on Supplier Satisfaction
SS 1 SS 2 SS 3
SD 0 0 0
D 2 4 0
N 20 29 24
A 59 42 56
SA 19 25 20
TOTAL 100 100 100
Source: Developed by researcher based on the SPSS data (2016)
4.5 Classical Assumption Test
For this research, multiple regression will be used in analyzing data, so firstly it has
to do classical assumption testing, where in this case, researcher is using three kind
of assumption as follows:
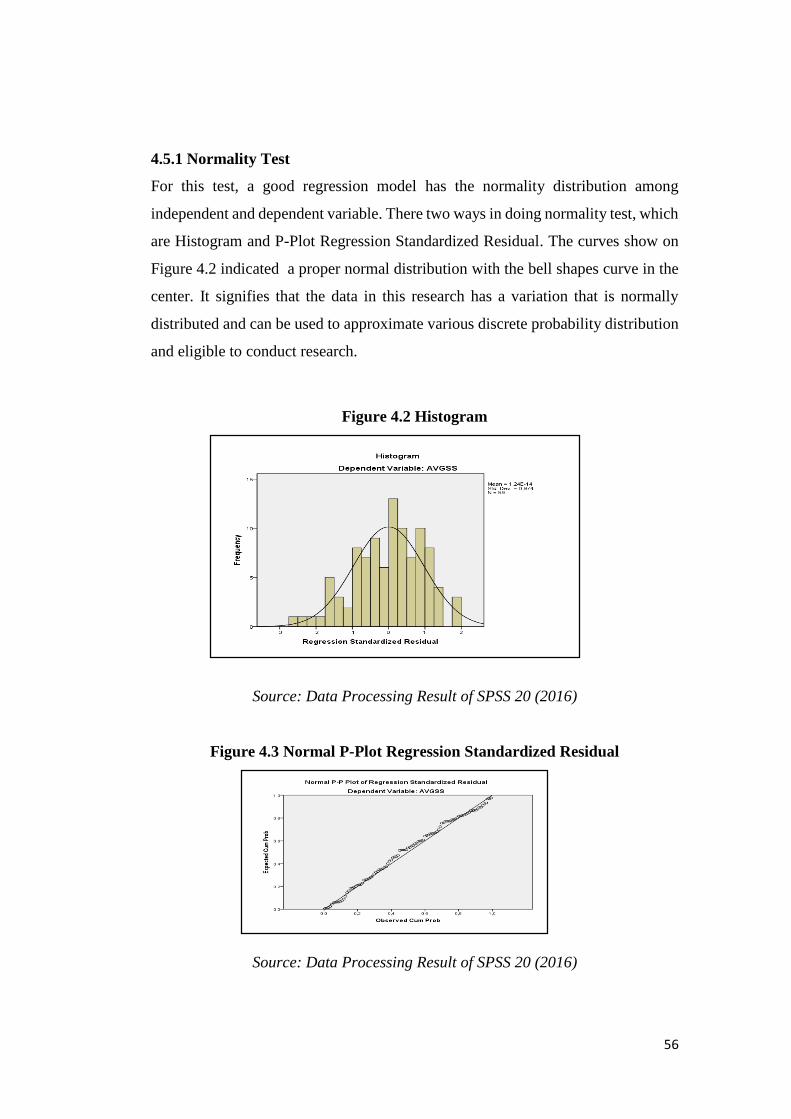
56
4.5.1 Normality Test
For this test, a good regression model has the normality distribution among
independent and dependent variable. There two ways in doing normality test, which
are Histogram and P-Plot Regression Standardized Residual. The curves show on
Figure 4.2 indicated a proper normal distribution with the bell shapes curve in the
center. It signifies that the data in this research has a variation that is normally
distributed and can be used to approximate various discrete probability distribution
and eligible to conduct research.
Figure 4.2 Histogram
Source: Data Processing Result of SPSS 20 (2016)
Figure 4.3 Normal P-Plot Regression Standardized Residual
Source: Data Processing Result of SPSS 20 (2016)
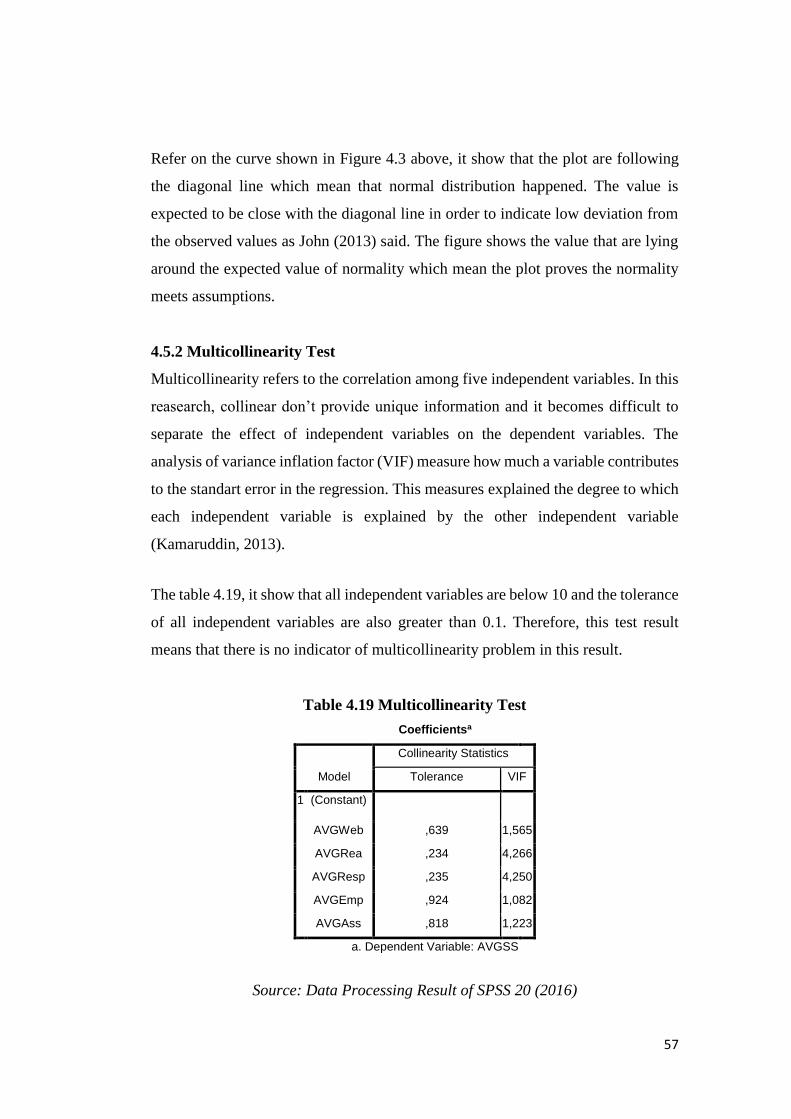
57
Refer on the curve shown in Figure 4.3 above, it show that the plot are following
the diagonal line which mean that normal distribution happened. The value is
expected to be close with the diagonal line in order to indicate low deviation from
the observed values as John (2013) said. The figure shows the value that are lying
around the expected value of normality which mean the plot proves the normality
meets assumptions.
4.5.2 Multicollinearity Test
Multicollinearity refers to the correlation among five independent variables. In this
reasearch, collinear don’t provide unique information and it becomes difficult to
separate the effect of independent variables on the dependent variables. The
analysis of variance inflation factor (VIF) measure how much a variable contributes
to the standart error in the regression. This measures explained the degree to which
each independent variable is explained by the other independent variable
(Kamaruddin, 2013).
The table 4.19, it show that all independent variables are below 10 and the tolerance
of all independent variables are also greater than 0.1. Therefore, this test result
means that there is no indicator of multicollinearity problem in this result.
Table 4.19 Multicollinearity Test
Coefficientsa
Model
Collinearity Statistics
Tolerance VIF
1 (Constant)
AVGWeb ,639 1,565
AVGRea ,234 4,266
AVGResp ,235 4,250
AVGEmp ,924 1,082
AVGAss ,818 1,223
a. Dependent Variable: AVGSS
Source: Data Processing Result of SPSS 20 (2016)
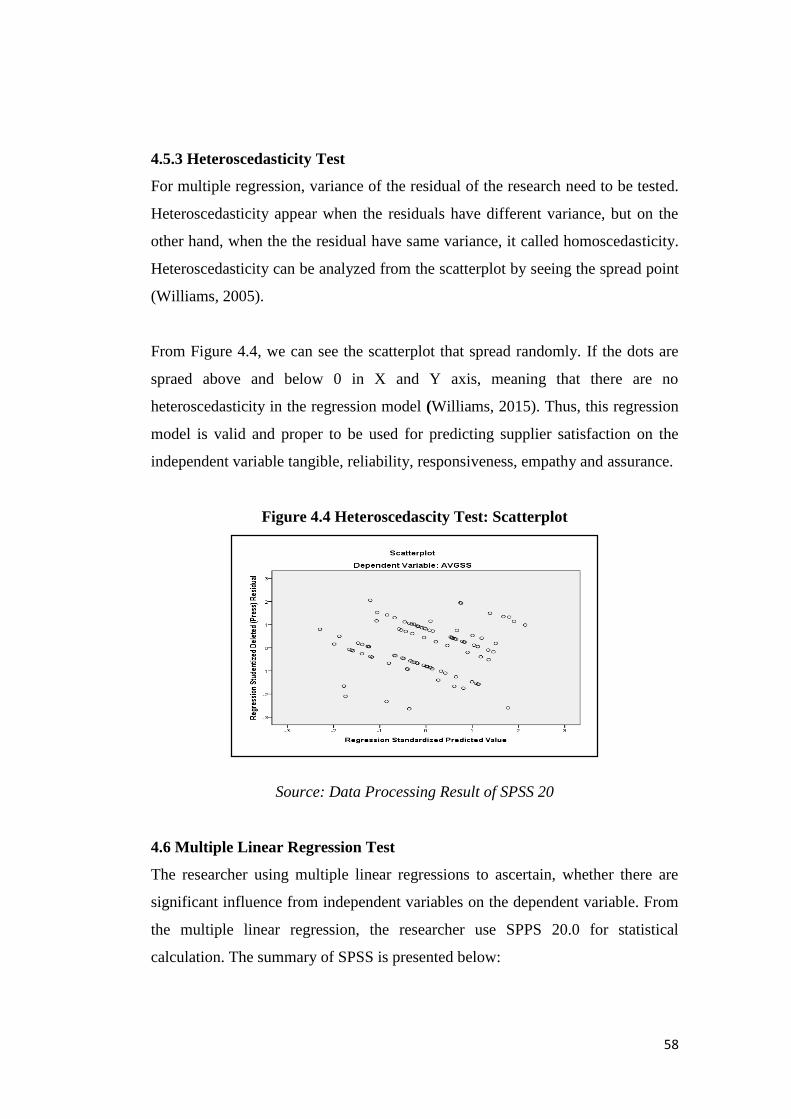
58
4.5.3 Heteroscedasticity Test
For multiple regression, variance of the residual of the research need to be tested.
Heteroscedasticity appear when the residuals have different variance, but on the
other hand, when the the residual have same variance, it called homoscedasticity.
Heteroscedasticity can be analyzed from the scatterplot by seeing the spread point
(Williams, 2005).
From Figure 4.4, we can see the scatterplot that spread randomly. If the dots are
spraed above and below 0 in X and Y axis, meaning that there are no
heteroscedasticity in the regression model (Williams, 2015). Thus, this regression
model is valid and proper to be used for predicting supplier satisfaction on the
independent variable tangible, reliability, responsiveness, empathy and assurance.
Figure 4.4 Heteroscedascity Test: Scatterplot
Source: Data Processing Result of SPSS 20
4.6 Multiple Linear Regression Test
The researcher using multiple linear regressions to ascertain, whether there are
significant influence from independent variables on the dependent variable. From
the multiple linear regression, the researcher use SPPS 20.0 for statistical
calculation. The summary of SPSS is presented below:
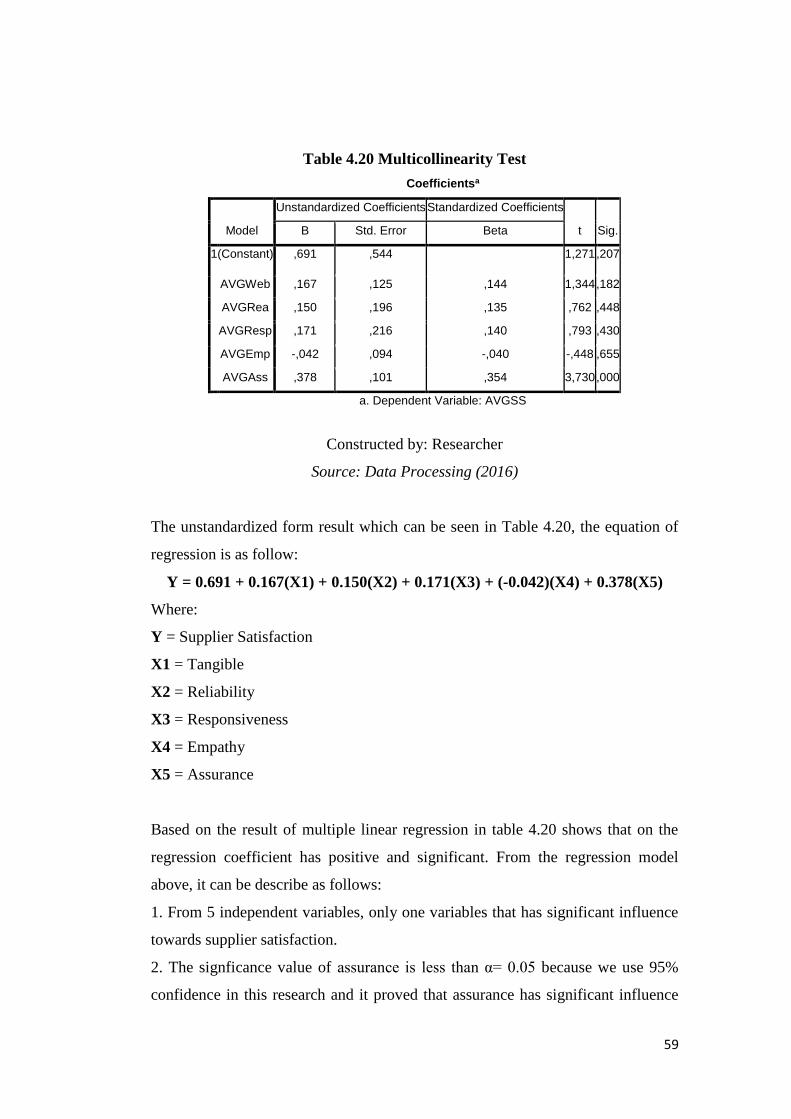
59
Table 4.20 Multicollinearity Test
Coefficientsa
Model
Unstandardized Coefficients Standardized Coefficients
t Sig. B Std. Error Beta
1 (Constant) ,691 ,544 1,271 ,207
AVGWeb ,167 ,125 ,144 1,344 ,182
AVGRea ,150 ,196 ,135 ,762 ,448
AVGResp ,171 ,216 ,140 ,793 ,430
AVGEmp -,042 ,094 -,040 -,448 ,655
AVGAss ,378 ,101 ,354 3,730 ,000
a. Dependent Variable: AVGSS
Constructed by: Researcher
Source: Data Processing (2016)
The unstandardized form result which can be seen in Table 4.20, the equation of
regression is as follow:
Y = 0.691 + 0.167(X1) + 0.150(X2) + 0.171(X3) + (-0.042)(X4) + 0.378(X5)
Where:
Y = Supplier Satisfaction
X1 = Tangible
X2 = Reliability
X3 = Responsiveness
X4 = Empathy
X5 = Assurance
Based on the result of multiple linear regression in table 4.20 shows that on the
regression coefficient has positive and significant. From the regression model
above, it can be describe as follows:
1. From 5 independent variables, only one variables that has significant influence
towards supplier satisfaction.
2. The signficance value of assurance is less than α= 0.05 because we use 95%
confidence in this research and it proved that assurance has significant influence
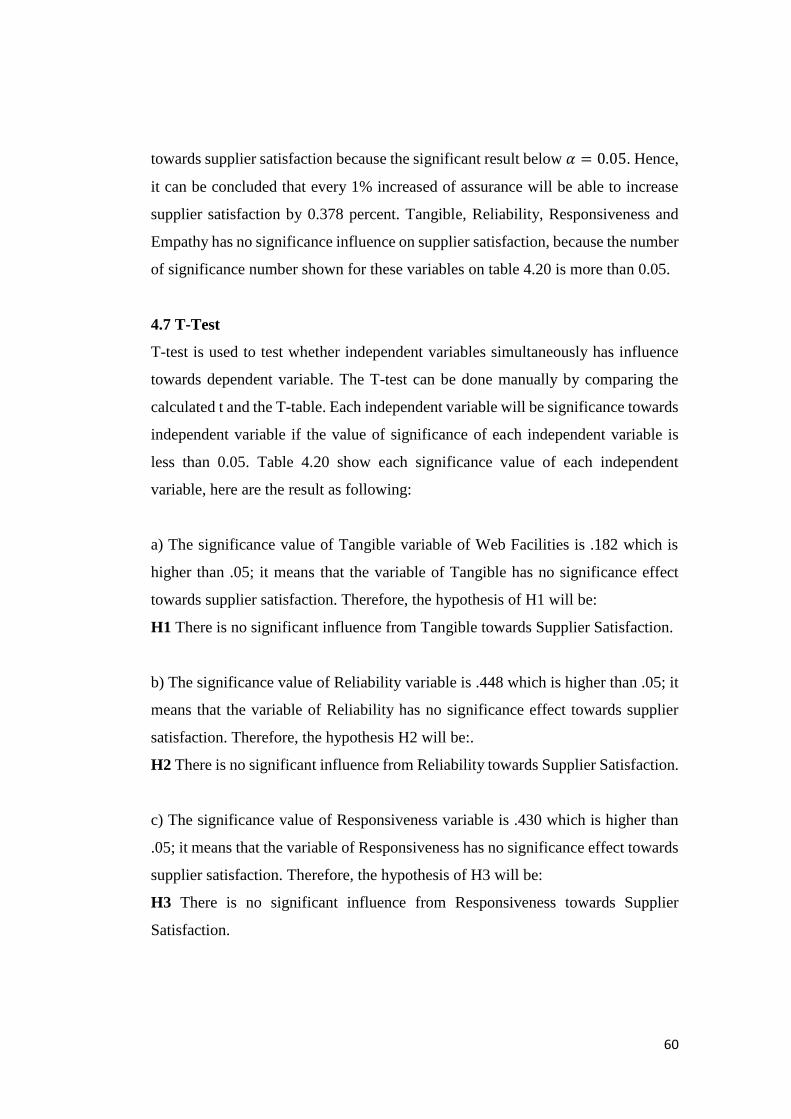
60
towards supplier satisfaction because the significant result below 𝛼 = 0.05. Hence,
it can be concluded that every 1% increased of assurance will be able to increase
supplier satisfaction by 0.378 percent. Tangible, Reliability, Responsiveness and
Empathy has no significance influence on supplier satisfaction, because the number
of significance number shown for these variables on table 4.20 is more than 0.05.
4.7 T-Test
T-test is used to test whether independent variables simultaneously has influence
towards dependent variable. The T-test can be done manually by comparing the
calculated t and the T-table. Each independent variable will be significance towards
independent variable if the value of significance of each independent variable is
less than 0.05. Table 4.20 show each significance value of each independent
variable, here are the result as following:
a) The significance value of Tangible variable of Web Facilities is .182 which is
higher than .05; it means that the variable of Tangible has no significance effect
towards supplier satisfaction. Therefore, the hypothesis of H1 will be:
H1 There is no significant influence from Tangible towards Supplier Satisfaction.
b) The significance value of Reliability variable is .448 which is higher than .05; it
means that the variable of Reliability has no significance effect towards supplier
satisfaction. Therefore, the hypothesis H2 will be:.
H2 There is no significant influence from Reliability towards Supplier Satisfaction.
c) The significance value of Responsiveness variable is .430 which is higher than
.05; it means that the variable of Responsiveness has no significance effect towards
supplier satisfaction. Therefore, the hypothesis of H3 will be:
H3 There is no significant influence from Responsiveness towards Supplier
Satisfaction.
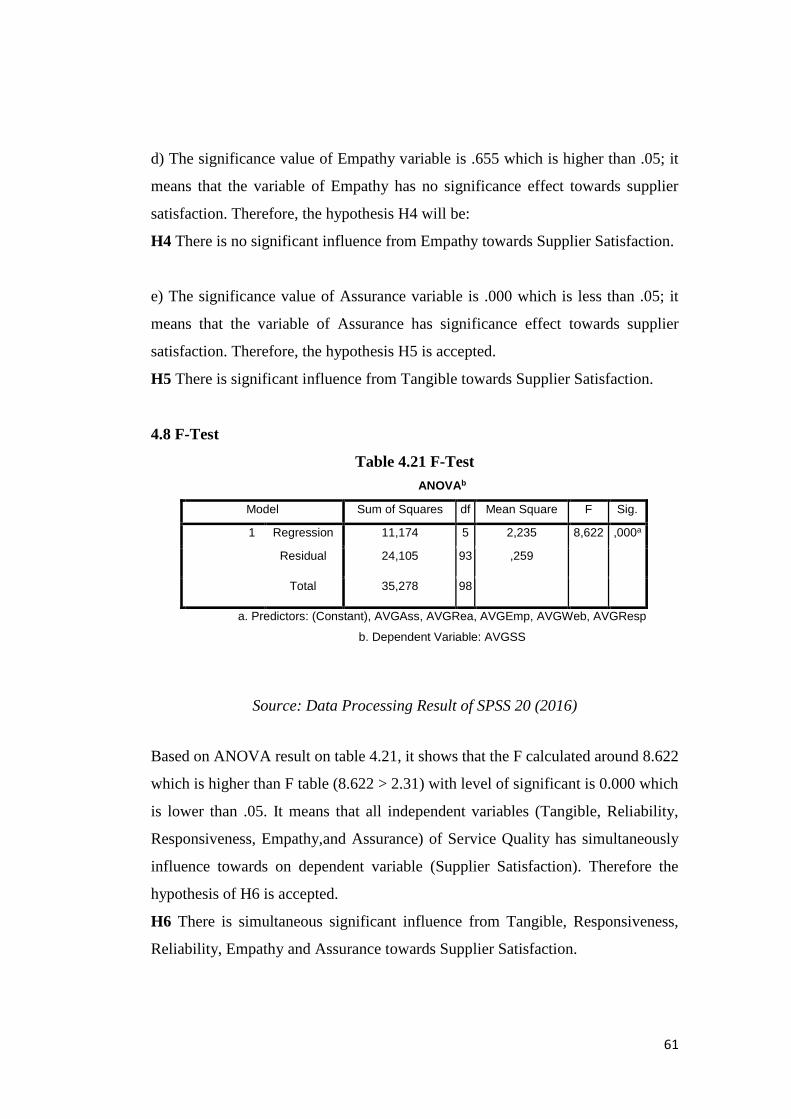
61
d) The significance value of Empathy variable is .655 which is higher than .05; it
means that the variable of Empathy has no significance effect towards supplier
satisfaction. Therefore, the hypothesis H4 will be:
H4 There is no significant influence from Empathy towards Supplier Satisfaction.
e) The significance value of Assurance variable is .000 which is less than .05; it
means that the variable of Assurance has significance effect towards supplier
satisfaction. Therefore, the hypothesis H5 is accepted.
H5 There is significant influence from Tangible towards Supplier Satisfaction.
4.8 F-Test
Table 4.21 F-Test
Source: Data Processing Result of SPSS 20 (2016)
Based on ANOVA result on table 4.21, it shows that the F calculated around 8.622
which is higher than F table (8.622 > 2.31) with level of significant is 0.000 which
is lower than .05. It means that all independent variables (Tangible, Reliability,
Responsiveness, Empathy,and Assurance) of Service Quality has simultaneously
influence towards on dependent variable (Supplier Satisfaction). Therefore the
hypothesis of H6 is accepted.
H6 There is simultaneous significant influence from Tangible, Responsiveness,
Reliability, Empathy and Assurance towards Supplier Satisfaction.
ANOVAb
Model Sum of Squares df Mean Square F Sig.
1 Regression 11,174 5 2,235 8,622 ,000a
Residual 24,105 93 ,259
Total 35,278 98
a. Predictors: (Constant), AVGAss, AVGRea, AVGEmp, AVGWeb, AVGResp
b. Dependent Variable: AVGSS
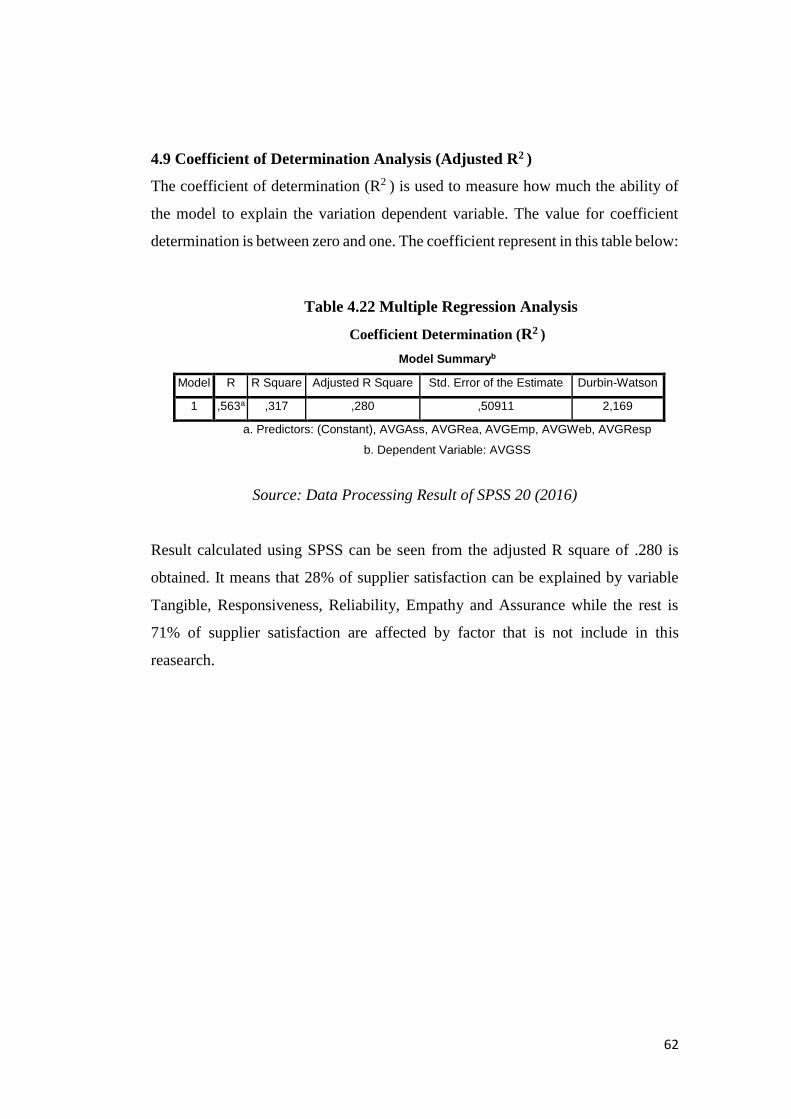
62
4.9 Coefficient of Determination Analysis (Adjusted R2 )
The coefficient of determination (R2 ) is used to measure how much the ability of
the model to explain the variation dependent variable. The value for coefficient
determination is between zero and one. The coefficient represent in this table below:
Table 4.22 Multiple Regression Analysis
Coefficient Determination (R2 )
Model Summaryb
Model R R Square Adjusted R Square Std. Error of the Estimate Durbin-Watson
1 ,563a ,317 ,280 ,50911 2,169
a. Predictors: (Constant), AVGAss, AVGRea, AVGEmp, AVGWeb, AVGResp
b. Dependent Variable: AVGSS
Source: Data Processing Result of SPSS 20 (2016)
Result calculated using SPSS can be seen from the adjusted R square of .280 is
obtained. It means that 28% of supplier satisfaction can be explained by variable
Tangible, Responsiveness, Reliability, Empathy and Assurance while the rest is
71% of supplier satisfaction are affected by factor that is not include in this
reasearch.
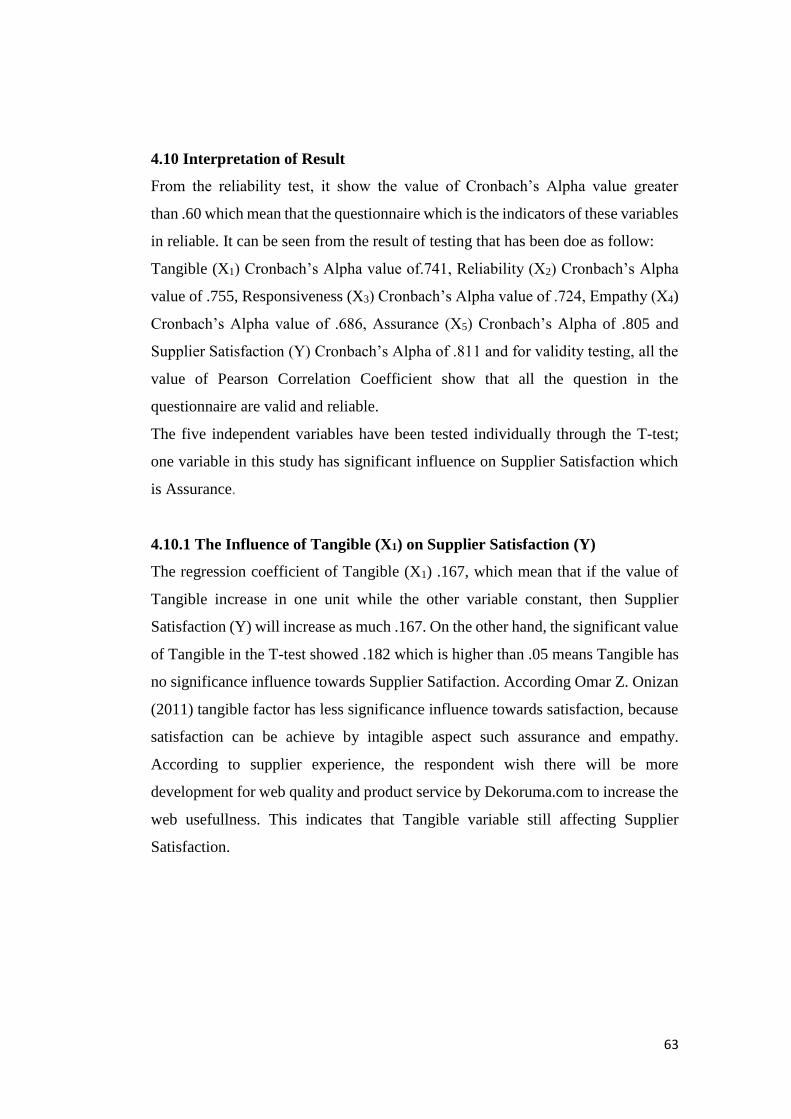
63
4.10 Interpretation of Result
From the reliability test, it show the value of Cronbach’s Alpha value greater
than .60 which mean that the questionnaire which is the indicators of these variables
in reliable. It can be seen from the result of testing that has been doe as follow:
Tangible (X1) Cronbach’s Alpha value of.741, Reliability (X2) Cronbach’s Alpha
value of .755, Responsiveness (X3) Cronbach’s Alpha value of .724, Empathy (X4)
Cronbach’s Alpha value of .686, Assurance (X5) Cronbach’s Alpha of .805 and
Supplier Satisfaction (Y) Cronbach’s Alpha of .811 and for validity testing, all the
value of Pearson Correlation Coefficient show that all the question in the
questionnaire are valid and reliable.
The five independent variables have been tested individually through the T-test;
one variable in this study has significant influence on Supplier Satisfaction which
is Assurance.
4.10.1 The Influence of Tangible (X1) on Supplier Satisfaction (Y)
The regression coefficient of Tangible (X1) .167, which mean that if the value of
Tangible increase in one unit while the other variable constant, then Supplier
Satisfaction (Y) will increase as much .167. On the other hand, the significant value
of Tangible in the T-test showed .182 which is higher than .05 means Tangible has
no significance influence towards Supplier Satifaction. According Omar Z. Onizan
(2011) tangible factor has less significance influence towards satisfaction, because
satisfaction can be achieve by intagible aspect such assurance and empathy.
According to supplier experience, the respondent wish there will be more
development for web quality and product service by Dekoruma.com to increase the
web usefullness. This indicates that Tangible variable still affecting Supplier
Satisfaction.
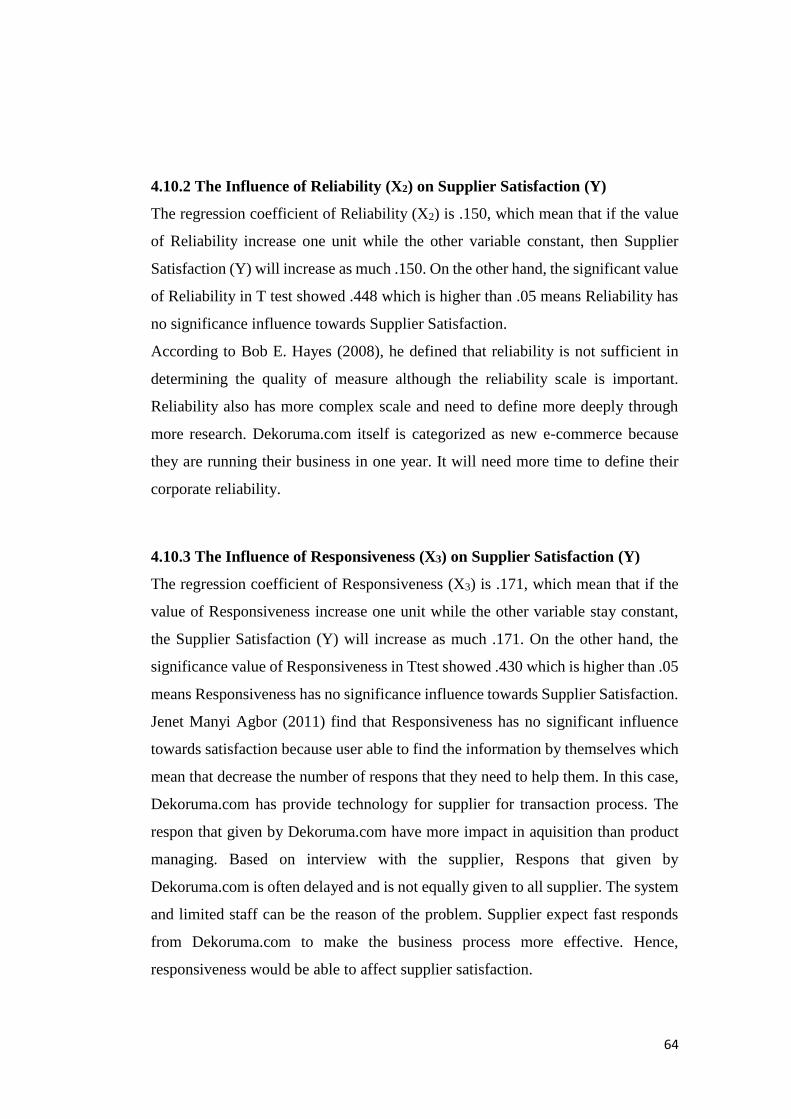
64
4.10.2 The Influence of Reliability (X2) on Supplier Satisfaction (Y)
The regression coefficient of Reliability (X2) is .150, which mean that if the value
of Reliability increase one unit while the other variable constant, then Supplier
Satisfaction (Y) will increase as much .150. On the other hand, the significant value
of Reliability in T test showed .448 which is higher than .05 means Reliability has
no significance influence towards Supplier Satisfaction.
According to Bob E. Hayes (2008), he defined that reliability is not sufficient in
determining the quality of measure although the reliability scale is important.
Reliability also has more complex scale and need to define more deeply through
more research. Dekoruma.com itself is categorized as new e-commerce because
they are running their business in one year. It will need more time to define their
corporate reliability.
4.10.3 The Influence of Responsiveness (X3) on Supplier Satisfaction (Y)
The regression coefficient of Responsiveness (X3) is .171, which mean that if the
value of Responsiveness increase one unit while the other variable stay constant,
the Supplier Satisfaction (Y) will increase as much .171. On the other hand, the
significance value of Responsiveness in Ttest showed .430 which is higher than .05
means Responsiveness has no significance influence towards Supplier Satisfaction.
Jenet Manyi Agbor (2011) find that Responsiveness has no significant influence
towards satisfaction because user able to find the information by themselves which
mean that decrease the number of respons that they need to help them. In this case,
Dekoruma.com has provide technology for supplier for transaction process. The
respon that given by Dekoruma.com have more impact in aquisition than product
managing. Based on interview with the supplier, Respons that given by
Dekoruma.com is often delayed and is not equally given to all supplier. The system
and limited staff can be the reason of the problem. Supplier expect fast responds
from Dekoruma.com to make the business process more effective. Hence,
responsiveness would be able to affect supplier satisfaction.
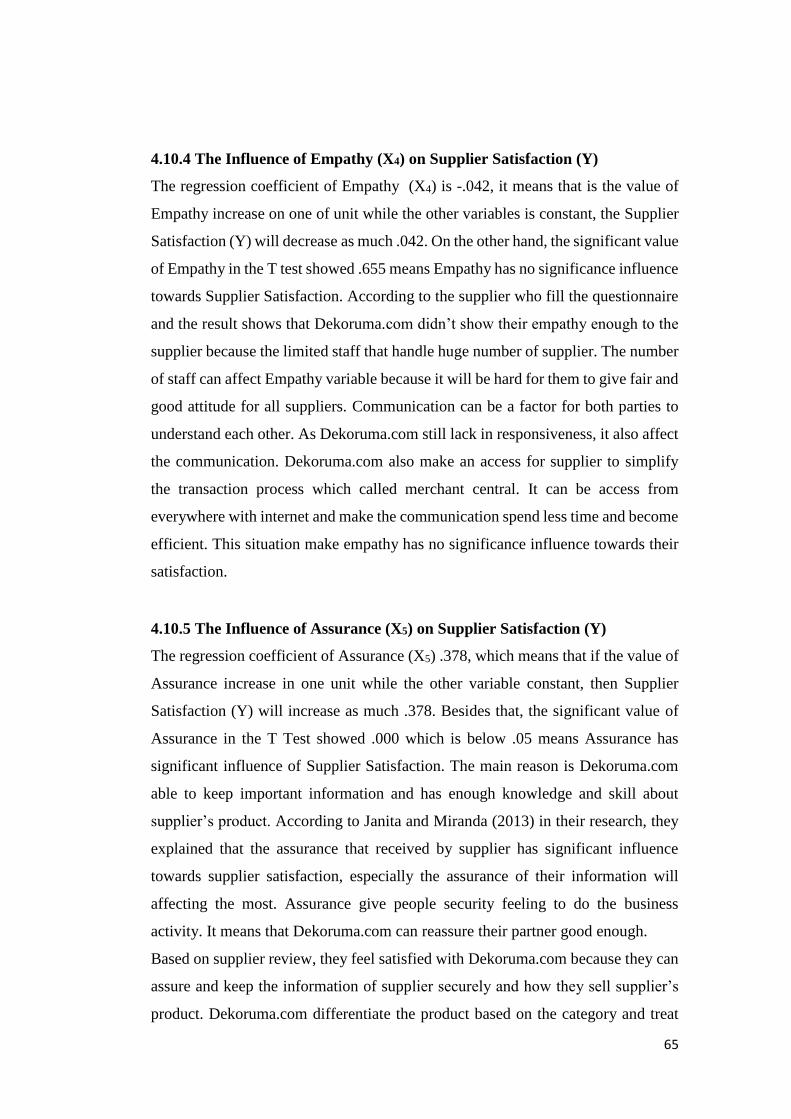
65
4.10.4 The Influence of Empathy (X4) on Supplier Satisfaction (Y)
The regression coefficient of Empathy (X4) is -.042, it means that is the value of
Empathy increase on one of unit while the other variables is constant, the Supplier
Satisfaction (Y) will decrease as much .042. On the other hand, the significant value
of Empathy in the T test showed .655 means Empathy has no significance influence
towards Supplier Satisfaction. According to the supplier who fill the questionnaire
and the result shows that Dekoruma.com didn’t show their empathy enough to the
supplier because the limited staff that handle huge number of supplier. The number
of staff can affect Empathy variable because it will be hard for them to give fair and
good attitude for all suppliers. Communication can be a factor for both parties to
understand each other. As Dekoruma.com still lack in responsiveness, it also affect
the communication. Dekoruma.com also make an access for supplier to simplify
the transaction process which called merchant central. It can be access from
everywhere with internet and make the communication spend less time and become
efficient. This situation make empathy has no significance influence towards their
satisfaction.
4.10.5 The Influence of Assurance (X5) on Supplier Satisfaction (Y)
The regression coefficient of Assurance (X5) .378, which means that if the value of
Assurance increase in one unit while the other variable constant, then Supplier
Satisfaction (Y) will increase as much .378. Besides that, the significant value of
Assurance in the T Test showed .000 which is below .05 means Assurance has
significant influence of Supplier Satisfaction. The main reason is Dekoruma.com
able to keep important information and has enough knowledge and skill about
supplier’s product. According to Janita and Miranda (2013) in their research, they
explained that the assurance that received by supplier has significant influence
towards supplier satisfaction, especially the assurance of their information will
affecting the most. Assurance give people security feeling to do the business
activity. It means that Dekoruma.com can reassure their partner good enough.
Based on supplier review, they feel satisfied with Dekoruma.com because they can
assure and keep the information of supplier securely and how they sell supplier’s
product. Dekoruma.com differentiate the product based on the category and treat
66
them separately based on the need and charateristics. It affect the number of
profitability for company and supplier side. Therefore, there is an influence of
Assurance towards Supplier Satisfaction.
4.10.6 The Influence of Service Quality (X6) on Supplier Satisfaction (Y)
Based on F-Test in Table 4.22, F calculated around 8.622 which is higher than F
table (8.622 > 2.31) with level of significant is 0.00 which is lower than 0.05.
Calculated F determine whether the independent variables has positive influence
towards dependent variables. If calculated F higher than F table, then the
independent variable has positive influence towards dependent variable. In this
case, service quality has positive impact towards supplier satisfaction. Then the
significant in Table 4.22 determine whether the independent variables has
simultaneous influence towards dependent variable. Then, Tangible,
Responsiveness. Reliability, Empathy, and Assurance have simultaneous ifluence
towards supplier satisfaction. According to Zeglat and Temori (2014), Tangible,
Responsiveness. Reliability, Empathy, and Assurance can derive positive influence
towards supplier satisfaction in organization. The article stated that supplier
satisfaction also improve the relationship between organization and partner.
67
CHAPTER V
CONCLUSION AND RECOMMENDATION
5.1 Conclusions
The purpose of this research is to identify whether there is a correlation between
five independent variables (Tangible, Reliability, Responsiveness, Empathy and
Assurance) towards one dependent variable (Supplier Satisfaction). Regarding
from the result and discussion on chapter IV, the conclusion will be drawn as
follow:
1. There is no significance influence of Tangible variable toward Supplier
Satisfaction at PT.Dekoruma Inovasi Lestari. The regression coefficient of Tangible
variable is .167 with significant value of Tangible in the T-test showed .182 which
is higher than .05 means Tangible has no significance influence towards Supplier
Satifaction.
2. There is no signficance influence of Reliability toward Supplier Satisfaction at
Dekoruma.com. The regression coefficient of Reliability is .150 with significant
value of Reliability in T test showed .448 which is higher than .05 means Reliability
has no significance influence towards Supplier Satisfaction.
3. There is no significance influence of Responsiveness toward Supplier
Satisfaction at Dekoruma.com. The regression coefficient of Responsiveness (X3)
is .171 with significance value of Responsiveness in T-test showed .430 which is
higher than .05 means Responsiveness has no significance influence towards
Supplier Satisfaction.
4. There is no significance influence of Empathy (X4) towards Supplier Satisfaction
at Dekoruma.com. The regression coefficient of Empathy (X4) is -.042 with
significant value of Empathy in the T test showed .655 means Empathy has no
significance influence towards Supplier Satisfaction.
68
5. There is significance influence of Assurance toward Supplier Satisfaction at
PT.Dekoruma Inovasi Lestari. The regression coefficient of Assurance (X5) .378
with the significant value of Assurance in the T Test showed .000 which is below
.05 means Assurance has significant influence of Supplier Satisfaction.
6. There is simultaneous significant influence of Tangible, Reliability,
Responsiveness, Empathy and Assurance towards Supplier Satisfaction at
Dekoruma.com. Based on F-Test in Table 4.22, F calculated around 8.622 which is
higher than F table (8.622 > 2.31) with level of significant is 0.000 which is lower
than 0.05.
5.2 Recommendations
5.2.1 Recommendations for Future Researcher
The future reasearch should be able to do further reasecrh on other factors beside
service quality towards supplier satisfaction at Dekoruma.com. The future research
can take the same research topic of other online marketplace to complement this
research.
5.2.2 Recommendations for Dekoruma.com
According to the research result, there are only one variable that has significance
influence on dependent variable and the other four variable has no significant
influence towards supplier satisfaction. In this case, PT. Dekoruma.com should
improve their communication way towards supplier in order to build long-
relationship between both parties. As time goes by, PT.Dekoruma Inovasi Lestari
should understand more about supplier’s need and how to manage them. Supplier
need more efficient and effective way in solving their product problems because
the problem that occured will affect the transaction process of furniture’s supplier
and it will affect their satisfaction in using Dekoruma.com as their online furniture
marketplace. For tangible variables, the company can improve web quality and
merchant system with internal parties. For reliability and responsiveness, training
the staff can be another solution to improve the relationship between
Dekoruma.com and their suppliers.
69
LIST OF REFERENCES
Books:
K. Douglas Hoffman, John E.G. Bateson (2010). Service Marketing: Concepts,
Strategies & Cases 4e
Easton, S., Hales, M.D., Schuh, C., Strohmer, M.F., Triplat, A., Kearney, A
(2014). Supplier Relationship Management: How to maximize Vendor Value and
Opportunity.
Boris Wertz, Angela Tran Kingyens (2015). A Guide to Marketplace
Beri, G. C. (2013). Marketing Research. New Delhi: McGraw Hill Education
Private Limited.
Cooper, D. R., and Schindler, P. S. (2014). Business Research Methods. New York:
McGraw-Hill/Irwin.
Creswell, J. W. (2013). Research Design: Qualitative, Quantitative, and Mixed
Methods Approaches, 4th Edition. SAGE Publications, Inc.
Fraenkel, J. R. & Wallen, N. E. (2011). How to Design Evaluate Research in
Education. New York: McGraw- Hill Companies, 8th edition.
Gupta, B. C., & Guttman, I. (2013). Statistics and Probability with Applications for
Engineers and Scientists. New Jersey: John Wiley & Sons, Inc.
Hair, J. Wolfinbarger, M. Money, A. (2011). Essentials of Business Research
Methods. 2nd edition. New York: M.E. Sharpe. P34-56.
Lind, D., Marchal, W., & Warthen, S. (2012). Basic Statistic for Business and Economics.
USA: Mc-Graw Hill Education.
Dr. Peter Mauch, CQE, COA (2011). Service Quality Management: Theory and
Application.
Graeme Knowles, (2011). Quality Management
70
Levy, M. & Weitz, B. (2012). Retailing Management. New York: McGraw-Hill.
Render, B., Stair, R. M., and Hanna, M. E. (2006). Quantitative Analysis for Management.
Pearson Prentice Hall.
Saunders, M., Lewi, P., & Thornhill, A. (2009). Research Methods for Business
Students. Financial Times Prentice Hall.
Sekaran, U., & Bougie, R., (2013). Research Methods for Business, 6th Edition. West
Sussex: John Wiley & Sons Ltd.
Stevens, Loudon, Ruddic, Wrenn, and Sherwood. (2008). The Marketing Research
Guide, Second Edition. New York: Best Business Book.
Turban, E. F., King, D., Mckay J., Marshall P., Lee J., & Viehland D. (2008).
Electronic Commerce 2008, a Managerial Perspective. Upper Saddle
River, NJ: Prentice Hall, 2008.
Wisner J.D., Tan K.C., & Leong G.K., 2012. Principles of Supply Chain
Management: A Balanced Approach. Cengage South-Western, Ohio.
Zikmund, W. G., Babin, B. J., Carr, J. C., and Griffin, M. Business Research
Methods (8th edition). USA: South-Western College Publishing, 2009
Website:
Furniturecore (2016, July 18). The Rise of E-commerce in The Furniture Industry.
Retrieved from: www.furniturecore.com:
http://furniturecore.com/HFBusiness/CurrentIssue/CurrentIssueModule/ArticleId/14526/t
he-rise-of-e-commerce-in-the-furniture-industry.aspx
Gbgindonesia (2013). Indonesia’s Furniture and Homeware Sector. Retrieved from:
www.gbgindonesia.com:
http://www.gbgindonesia.com/en/manufacturing/article/2012/indonesia_s_furniture_and_
homeware_sector.php
71
Redwing-asia (2013, November 18). E-tailing in Indonesia is Moving Trough the Gears.
Retrieved from: www.redwing-asia.com: http://redwing-asia.com/e-commerce/e-tailing-
indonesia-moving-gears/
Techinasia, (2015, June 4). 3 Indonesian Furniture Estores Where Investores Can Get
Cozy. Retrieved from www.techinasia.com: https://www.techinasia.com/indonesia-
furniture-ecommerce-livaza-fabelio-belifurniture
The Nielsen Company. (2008). Over 875 Million Consumers have Shopped Online - the
Number of Internet Shoppers up 40% in Two Years. Retrieved from: www.nz.nielsen.com:
http://nz.nielsen.com/news/OnlineShopping.shtml
Thoughshift (2015, May 6). Ecommerce Furniture Industry Trends: is Furniture Behind
the Rest of Retail?. Retrieved from: www.thoughshift.co.uk:
http://www.thoughtshift.co.uk/ecommerce-furniture-industry-trends-is-furniture-behind-
the-rest-of-retail/
Journal:
Akbariyeh, H. A Study of Factors Affecting on Customers Purchase Intention.
Journal of Multidisciplinary Engineering Science and Technology, Vol. 2,
Issue1, January-2015.
Ahmed, M. & Hendry, L., t.thn. Supplier Development Literature Review and
Key Future Research Areas. Journal of Engineering and Technology
Innovation, p. 2012.
Al-Nasser, M., 2014. Relationship Among E-Service Quality, Culture, Attitude,
Trust, Risk of Online Shopping. Journal of Social Sciences, p. 142.
Brendan E. Asogwa, boniface U. Asadu. Use of SERVQUAL in the Evaluation of
Service Quality of Academic Libraries in Developing Countries. Library
Philosophy and Practice, 2014
BAI Pengfei, CUI Yanhong, YE Lvbo. Research of the Relationship of E-Service
Quality, Costumer Satisfaction and Costumer Loyalty in C2C Online
Shopping. EasternAcademic Forum, 2009.
Dia Zeglat and Sara Tedmon. Assesing the Importance of E-SQ Dimensions and
72
Attributes: Perspective of Facebook’s Users. International Business Research,
Vol.7, No.7, 2014.
Dr. Abdel Fattah Mahmoud Al-Azzam. The Impact of Service Quality Dimensions
on Costumer Satisfaction. Journal of Business and Management, 2015.
Dr. Deepak Singh and Prof. K S Thakur. Impact of Service Quality Dimensions
Towards Customer Satisfaction in Indian Call Centers. 2013
James J. Jiang, Gary Klein, Neeraj Parolia and Yuzhu Li. An Analysis of Three
SERVQUAL Variations in Measuring Information System Service Quality.
The Electronic Journal Information Systems Evaluation, Vol 15, 2012.
M. Soledad Janita and F. Javier Miranda. Exploring Service Quality Dimensions
in B2B eMarketplaces. Journal of Electronic Commerce Research, VOL 14,
NO.4 , 2013.
Manoj Kumar Mohanty. Small Scale Supplier Satisfaction: An Explorative
Finding from Indian Manufacturing Industry. 2011.
Radu Stan. The Contribution of Supplier Satisfaction Surveys in a B2B Context.
International Business Management, 2015.
Michael C. Handrinos, Dimitrios Folinas, Konstantinos Rotsios. Using the
SERVQUAL Model to Evaluate the Quality of Services for a Farm School
Store. Journal of Marketing and Consumer Behaviour, 2015.
Wan Jin Leu. The Relationship between Web-Based Service Quality and
Costumer Loyalty. Business Administration, 2009.
Inda Sukati and Hendrikus Kadang. A Study of Service Quality: An Empirical
Investigation of Indonesia Airlines Services. 2012.
Kristal M., Huang X., & Roth A. The effect of an ambidextrous supply chain
strategy on combinative competitive capabilities and business performance.
Journal of Operations Management, 28(5), 415-29, 2010.
Khalid, K., Hilman, H., and Kumar, D. Get Along With Quantitative Research
Process. International Journal of Research in Management; Vol. 2, Issue2,
March-2012.
73
Pavlou, P. A., & Fygenson, M. Understanding and predicting electronic commerce
adoption: An extension of the theory of planned Behavior. MIS Quarterly,
30(1), 115-143, 2006.
Prateek Kalia. E-SERVQUAL and Electronic Retailing. Conference Paper, 2013
\
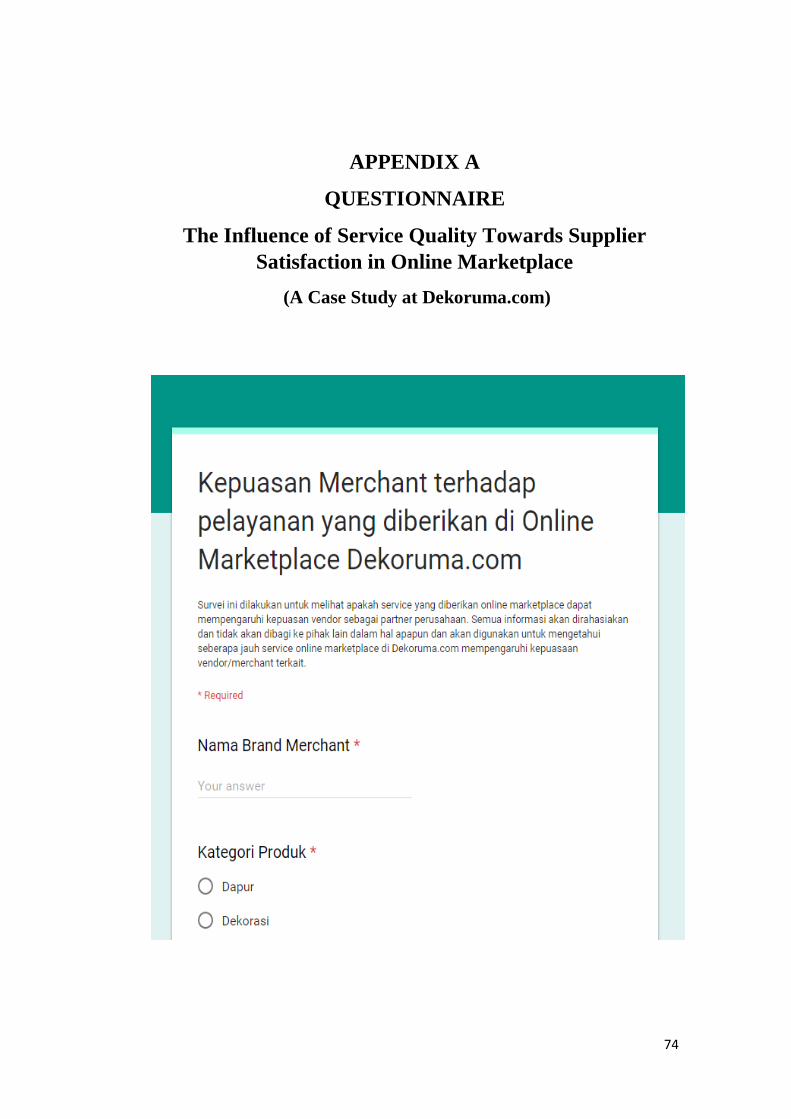
74
APPENDIX A
QUESTIONNAIRE
The Influence of Service Quality Towards Supplier
Satisfaction in Online Marketplace
(A Case Study at Dekoruma.com)
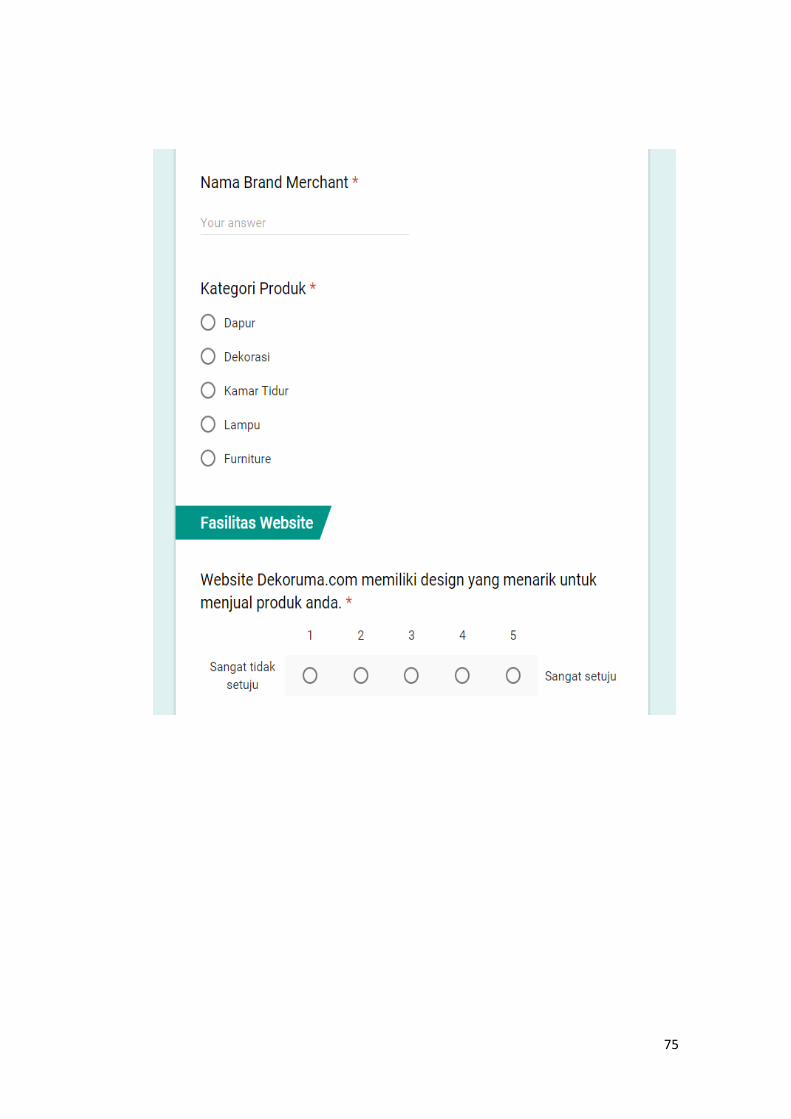
75
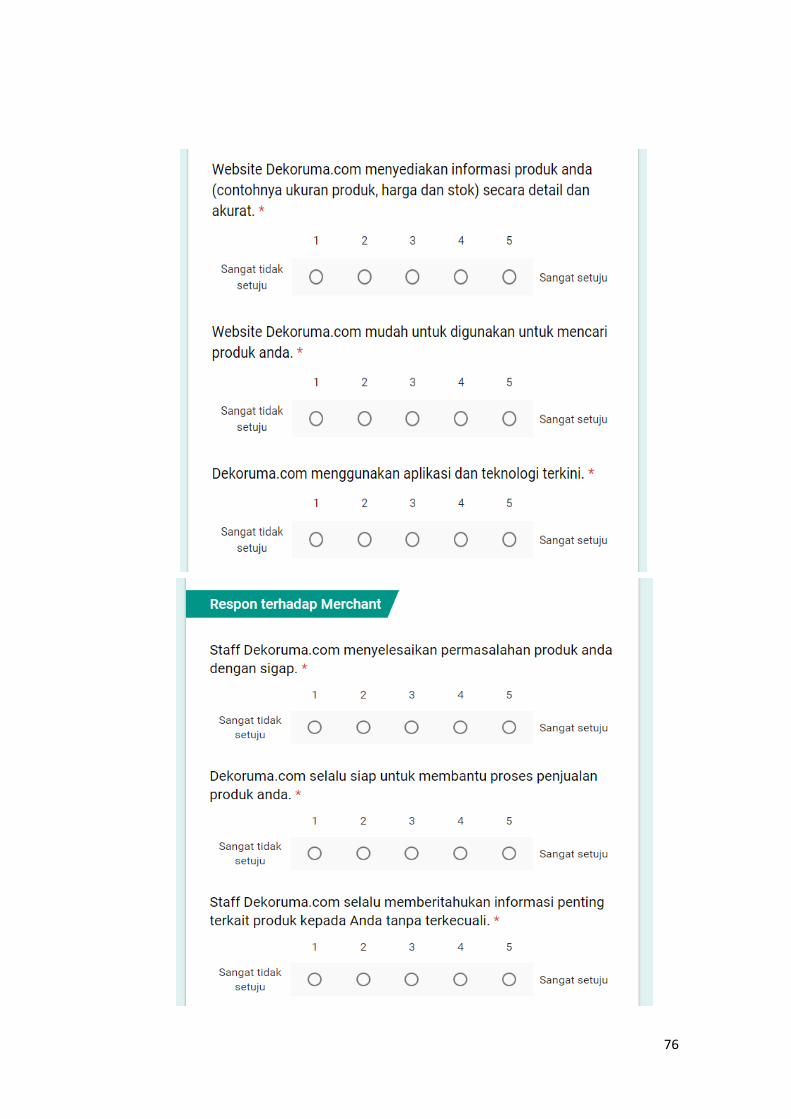
76
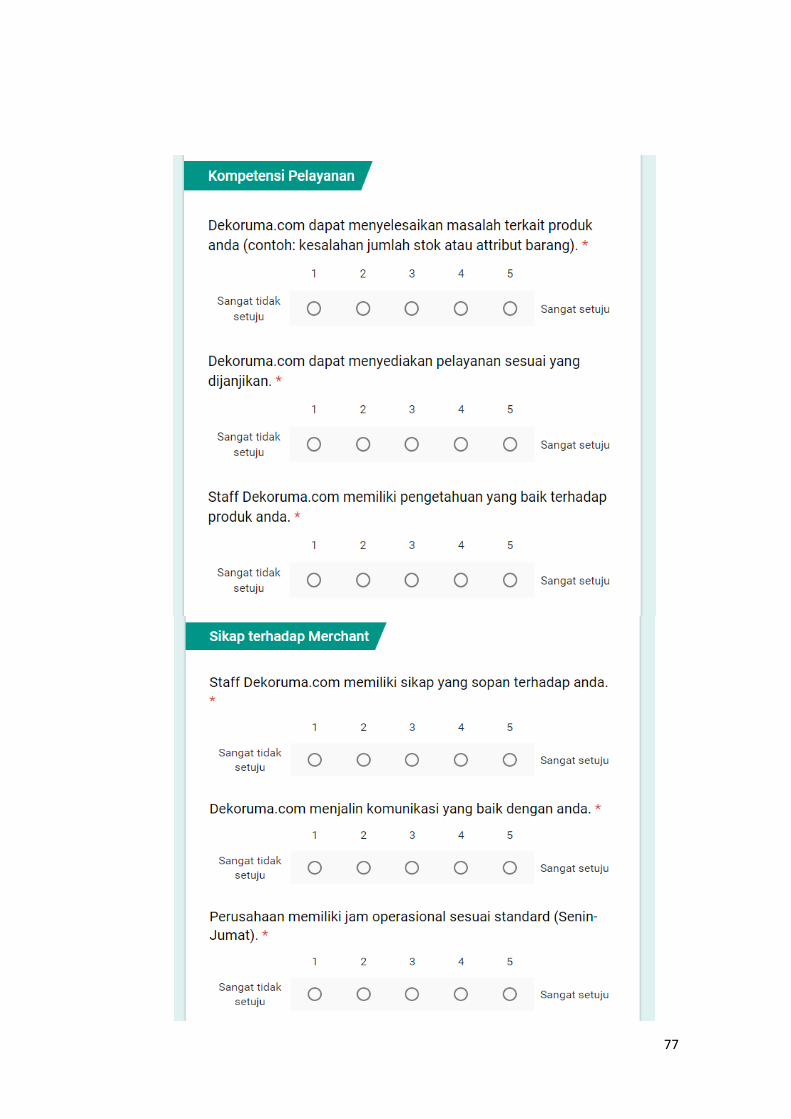
77
78
79
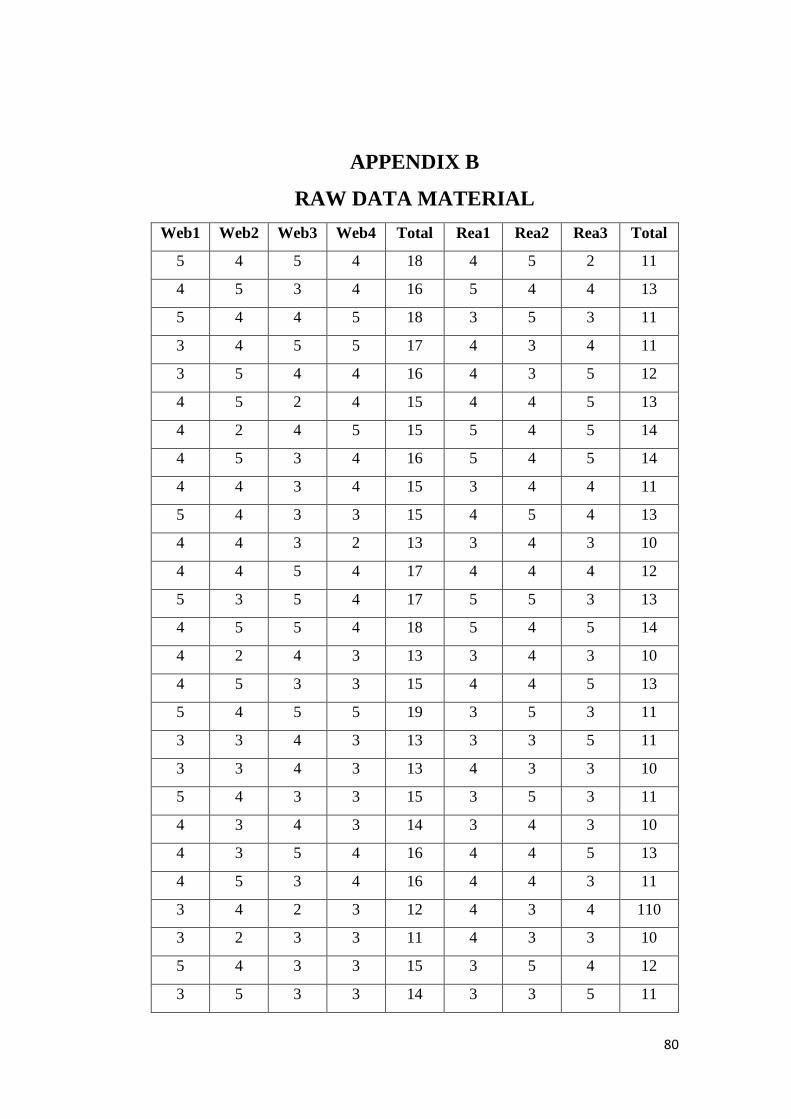
80
APPENDIX B
RAW DATA MATERIAL
Web1 Web2 Web3 Web4 Total Rea1 Rea2 Rea3 Total
5 4 5 4 18 4 5 2 11
4 5 3 4 16 5 4 4 13
5 4 4 5 18 3 5 3 11
3 4 5 5 17 4 3 4 11
3 5 4 4 16 4 3 5 12
4 5 2 4 15 4 4 5 13
4 2 4 5 15 5 4 5 14
4 5 3 4 16 5 4 5 14
4 4 3 4 15 3 4 4 11
5 4 3 3 15 4 5 4 13
4 4 3 2 13 3 4 3 10
4 4 5 4 17 4 4 4 12
5 3 5 4 17 5 5 3 13
4 5 5 4 18 5 4 5 14
4 2 4 3 13 3 4 3 10
4 5 3 3 15 4 4 5 13
5 4 5 5 19 3 5 3 11
3 3 4 3 13 3 3 5 11
3 3 4 3 13 4 3 3 10
5 4 3 3 15 3 5 3 11
4 3 4 3 14 3 4 3 10
4 3 5 4 16 4 4 5 13
4 5 3 4 16 4 4 3 11
3 4 2 3 12 4 3 4 110
3 2 3 3 11 4 3 3 10
5 4 3 3 15 3 5 4 12
3 5 3 3 14 3 3 5 11
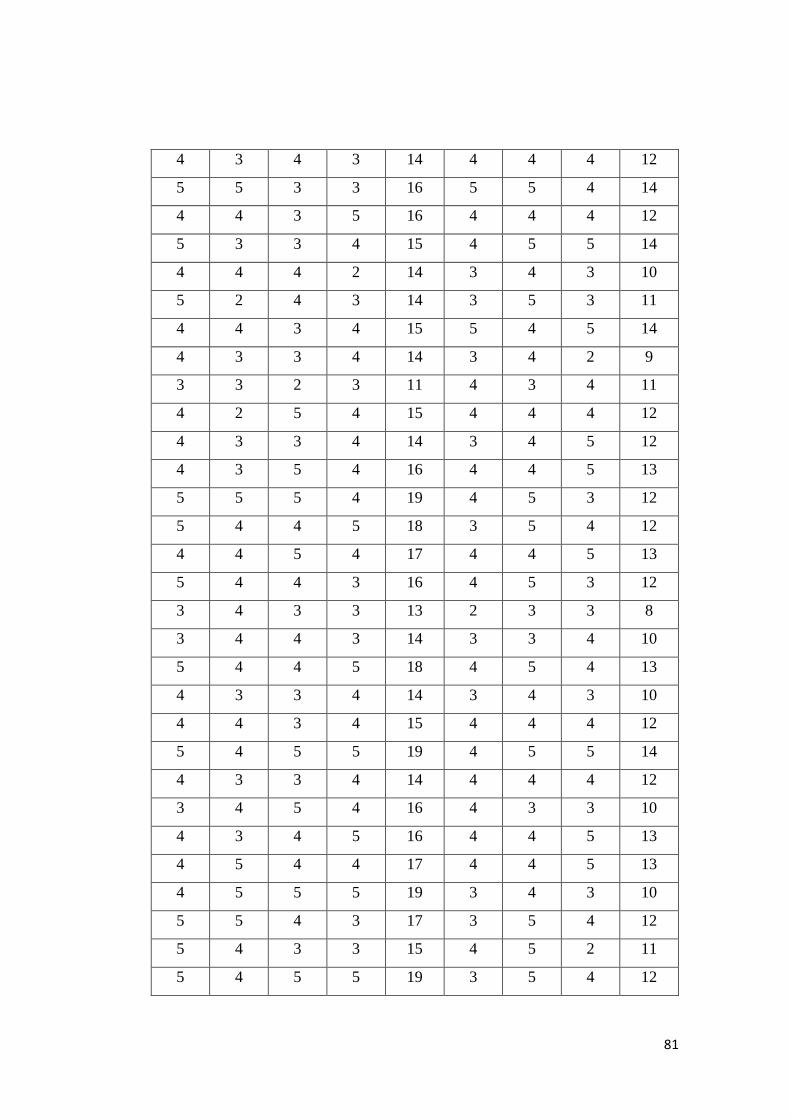
81
4 3 4 3 14 4 4 4 12
5 5 3 3 16 5 5 4 14
4 4 3 5 16 4 4 4 12
5 3 3 4 15 4 5 5 14
4 4 4 2 14 3 4 3 10
5 2 4 3 14 3 5 3 11
4 4 3 4 15 5 4 5 14
4 3 3 4 14 3 4 2 9
3 3 2 3 11 4 3 4 11
4 2 5 4 15 4 4 4 12
4 3 3 4 14 3 4 5 12
4 3 5 4 16 4 4 5 13
5 5 5 4 19 4 5 3 12
5 4 4 5 18 3 5 4 12
4 4 5 4 17 4 4 5 13
5 4 4 3 16 4 5 3 12
3 4 3 3 13 2 3 3 8
3 4 4 3 14 3 3 4 10
5 4 4 5 18 4 5 4 13
4 3 3 4 14 3 4 3 10
4 4 3 4 15 4 4 4 12
5 4 5 5 19 4 5 5 14
4 3 3 4 14 4 4 4 12
3 4 5 4 16 4 3 3 10
4 3 4 5 16 4 4 5 13
4 5 4 4 17 4 4 5 13
4 5 5 5 19 3 4 3 10
5 5 4 3 17 3 5 4 12
5 4 3 3 15 4 5 2 11
5 4 5 5 19 3 5 4 12
82
3 2 4 4 13 4 3 4 11
5 4 3 5 17 4 5 4 13
2 3 3 4 12 3 2 4 9
5 5 4 5 19 4 5 3 12
3 3 3 4 13 4 3 4 11
5 4 4 3 16 5 5 4 14
3 4 4 3 14 3 3 4 10
4 5 3 3 15 3 4 3 10
3 4 4 2 13 4 3 3 10
2 3 3 4 12 5 2 4 11
5 4 4 5 18 4 5 5 14
2 3 3 4 12 3 2 2 7
5 4 3 3 15 2 5 3 10
3 4 3 3 13 2 3 3 8
5 4 4 5 18 5 5 5 15
4 4 5 5 18 4 4 4 12
5 3 3 4 15 4 5 4 13
4 3 4 2 13 4 4 5 13
5 4 4 5 18 4 5 5 14
5 3 4 5 17 4 5 4 13
4 5 4 4 17 4 4 5 13
4 4 3 4 15 3 4 3 10
5 4 4 4 17 4 5 4 13
4 3 2 4 13 3 4 4 11
5 5 5 4 19 3 5 3 11
4 3 3 3 13 4 4 4 12
3 5 3 4 15 4 3 4 11
5 4 5 4 18 5 5 4 14
4 3 4 4 15 4 4 4 12
3 4 2 3 12 4 3 4 11
83
3 4 3 3 13 2 3 3 8
3 2 4 5 14 4 3 4 11
4 3 2 3 12 4 4 3 11
5 2 3 4 14 4 5 4 13
4 4 3 5 16 4 4 5 13
5 4 4 5 18 4 5 4 13
3 3 2 4 12 4 3 3 10
3 4 4 4 15 4 3 4 11
4 4 5 5 18 4 4 4 12
5 5 4 4 18 4 5 4 13
5 4 4 5 18 4 5 4 13
5 5 4 5 19 4 5 4 13
Resp1 Resp2 Resp3 Total Emp1 Emp2 Emp3 Total
4 4 5 13 4 5 5 14
4 4 4 12 3 2 5 10
3 5 5 13 3 4 5 12
4 4 3 11 4 3 5 12
5 4 3 12 5 4 3 12
5 4 4 13 3 4 5 12
5 5 4 14 4 5 5 14
5 5 4 14 5 4 2 11
4 3 4 11 4 3 4 11
4 3 5 12 3 4 4 11
3 4 4 11 3 2 2 7
4 4 4 12 4 5 4 13
5 5 5 15 1 3 3 7
5 5 4 14 5 4 5 14
3 4 4 11 4 3 3 10
84
5 4 4 13 3 5 4 12
3 4 5 12 2 3 4 9
5 3 3 11 5 3 4 12
3 5 3 11 3 4 5 12
3 3 5 11 4 5 3 12
3 3 4 10 5 5 4 14
5 3 4 12 4 5 5 14
3 4 4 11 3 4 3 10
4 4 3 11 3 2 4 9
3 4 3 10 3 4 5 12
4 3 5 12 2 3 4 9
5 4 3 12 4 4 3 11
4 4 4 12 3 3 5 11
4 4 5 13 3 5 4 12
4 3 4 11 4 5 3 12
5 4 5 14 5 3 5 13
3 3 4 10 3 5 4 12
3 4 5 12 5 4 3 12
5 4 4 13 4 2 3 9
2 3 4 9 3 2 4 9
4 3 3 10 5 3 3 11
4 5 4 13 4 5 2 11
5 4 4 13 3 3 2 8
5 3 4 12 5 4 3 12
3 4 5 12 5 4 5 14
4 3 5 12 3 3 5 11
5 4 4 13 5 4 5 14
3 4 5 12 4 3 3 10
3 3 3 9 3 4 4 11
4 3 3 10 3 5 3 11
85
4 3 5 12 4 2 5 11
3 4 4 11 5 4 4 13
4 3 4 11 4 5 5 14
5 4 5 14 5 4 5 14
4 5 4 13 4 5 3 12
3 4 3 10 4 3 5 12
5 4 4 13 5 4 2 11
5 4 4 13 4 5 5 14
3 4 4 11 4 5 3 12
4 3 5 12 5 5 4 14
2 3 5 10 2 3 4 9
4 4 5 13 5 4 2 11
4 3 3 10 3 4 4 11
4 4 5 13 5 5 4 14
4 3 2 9 4 5 3 12
3 4 5 12 5 3 4 12
4 4 3 11 3 5 3 11
4 4 5 13 5 5 4 14
4 3 3 10 4 3 3 10
3 2 4 9 3 3 5 11
3 4 3 10 4 3 3 10
4 4 2 10 3 4 5 12
5 4 5 14 5 5 4 14
2 3 2 7 4 3 2 9
3 3 5 11 4 5 4 13
3 4 3 10 3 4 3 10
5 4 5 14 4 5 4 13
4 4 4 12 4 4 5 13
4 4 5 13 3 4 4 11
5 4 4 13 3 5 5 13
86
5 4 5 14 4 4 3 11
4 4 5 13 4 5 4 13
5 4 4 13 5 4 5 14
3 3 4 10 4 2 3 9
4 3 5 12 5 3 4 12
4 3 4 11 3 4 5 12
3 2 5 10 3 4 4 11
4 4 4 12 4 5 4 13
4 5 3 12 5 3 3 11
4 4 5 13 3 4 5 12
4 4 4 12 3 4 2 9
4 4 3 11 4 5 4 13
3 3 3 9 5 5 3 13
4 5 3 12 4 2 3 9
3 4 4 11 3 3 5 11
4 3 5 12 3 4 4 11
5 4 4 13 4 5 4 13
4 3 5 12 4 4 3 11
3 4 3 10 3 5 4 12
4 5 3 12 5 5 4 14
4 3 4 11 4 4 3 11
4 3 5 12 3 5 4 12
4 5 5 14 4 5 3 12
4 5 5 14 4 3 5 12
Ass1 Ass2 AssTotal SS1 SS2 SS3 SSTotal
5 5 10 4 5 5 14
4 4 8 5 5 5 15
5 5 10 5 5 5 15
87
4 4 8 4 4 5 13
4 4 8 4 5 4 13
5 4 9 4 5 4 13
4 4 8 4 4 5 13
5 5 10 5 5 5 15
4 4 8 4 3 4 11
3 5 8 4 3 5 12
3 4 7 4 4 4 12
3 4 7 4 5 4 13
4 5 9 5 5 5 15
4 5 9 5 5 5 15
4 4 8 3 4 3 10
4 3 7 5 3 4 12
5 5 10 3 4 3 10
4 3 7 5 5 4 14
5 5 10 3 4 3 10
4 3 7 5 4 4 13
4 4 8 4 4 4 12
3 4 7 5 4 4 13
3 4 7 3 4 4 11
5 4 9 4 4 5 13
4 3 7 2 2 3 7
4 3 7 3 2 3 8
4 4 8 4 4 3 11
3 4 7 4 4 3 11
4 5 9 4 4 4 12
3 3 6 2 3 3 8
4 4 8 4 5 4 13
4 4 8 4 4 4 12
4 4 8 4 4 4 12
88
5 4 9 4 4 5 13
4 3 7 3 3 4 10
3 4 7 3 4 3 10
4 3 7 5 4 4 13
4 3 7 5 4 4 13
4 5 9 4 3 4 11
4 4 8 5 5 5 15
4 3 7 4 3 4 11
5 5 10 5 5 5 15
4 4 8 5 5 4 14
4 3 7 3 2 3 8
5 3 8 4 5 4 13
3 4 7 5 4 5 14
3 4 7 4 3 4 11
3 4 7 4 4 5 13
5 4 9 4 5 4 13
4 4 8 3 4 4 11
5 4 9 4 5 4 13
4 4 8 4 4 5 13
4 4 8 5 4 4 13
4 4 8 4 3 4 11
3 4 7 4 4 5 13
4 4 8 3 4 4 11
4 5 9 4 3 5 12
3 4 7 3 4 4 11
4 5 9 4 4 5 13
3 4 7 4 3 3 10
4 5 9 4 4 3 11
5 4 9 4 5 4 13
5 4 9 4 4 3 11
89
4 4 8 5 3 4 12
3 3 6 4 3 3 10
4 4 8 4 4 3 11
3 4 7 4 4 3 11
4 3 7 3 3 4 10
3 4 7 3 4 4 11
3 4 7 4 3 3 10
3 3 6 4 3 3 10
3 4 7 4 4 5 13
4 5 9 4 5 5 14
5 4 9 4 4 4 12
4 5 9 4 3 4 11
4 5 9 4 5 5 14
4 4 8 4 3 3 10
5 4 9 4 5 4 13
4 4 8 4 3 4 11
4 4 8 3 4 4 11
4 5 9 4 5 4 13
5 4 9 4 4 5 13
3 4 7 3 4 4 11
3 4 7 4 5 4 13
3 4 7 4 3 5 12
4 3 7 4 5 4 13
4 5 9 4 3 4 11
3 4 7 4 3 4 11
4 5 9 4 3 4 11
4 3 7 3 3 4 10
3 4 7 4 3 3 10
3 4 7 4 3 4 11
3 4 7 3 4 4 11
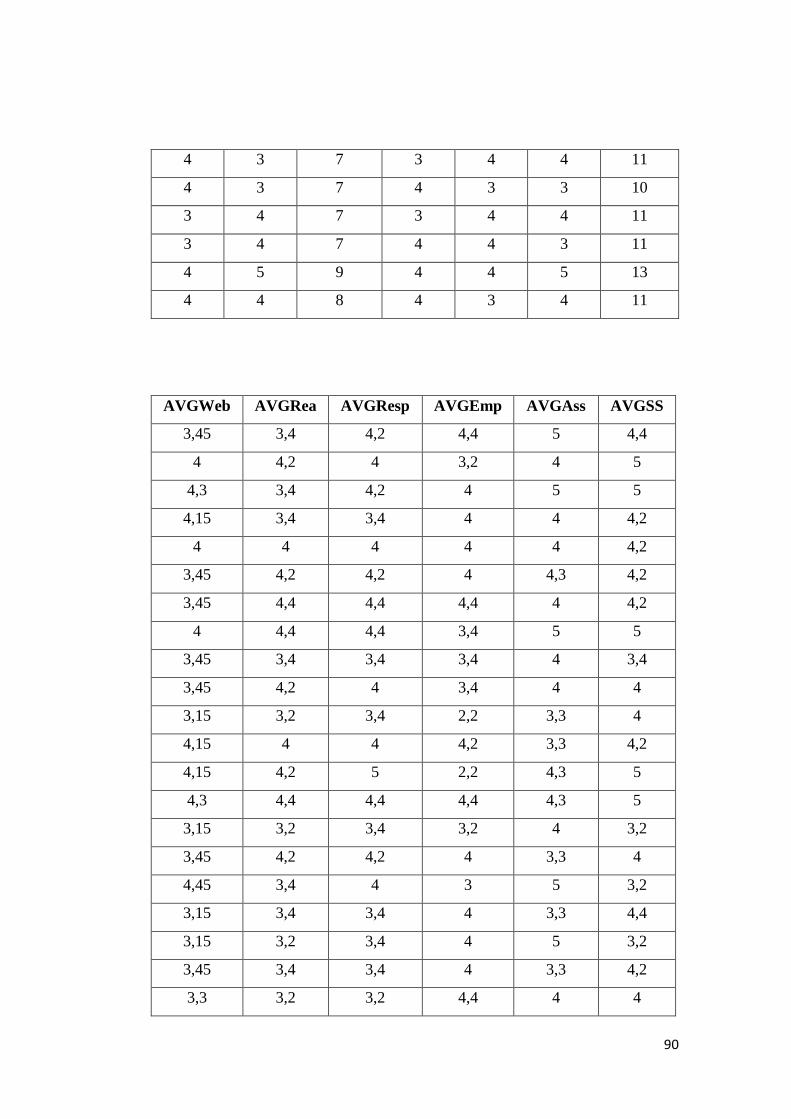
90
4 3 7 3 4 4 11
4 3 7 4 3 3 10
3 4 7 3 4 4 11
3 4 7 4 4 3 11
4 5 9 4 4 5 13
4 4 8 4 3 4 11
AVGWeb AVGRea AVGResp AVGEmp AVGAss AVGSS
3,45 3,4 4,2 4,4 5 4,4
4 4,2 4 3,2 4 5
4,3 3,4 4,2 4 5 5
4,15 3,4 3,4 4 4 4,2
4 4 4 4 4 4,2
3,45 4,2 4,2 4 4,3 4,2
3,45 4,4 4,4 4,4 4 4,2
4 4,4 4,4 3,4 5 5
3,45 3,4 3,4 3,4 4 3,4
3,45 4,2 4 3,4 4 4
3,15 3,2 3,4 2,2 3,3 4
4,15 4 4 4,2 3,3 4,2
4,15 4,2 5 2,2 4,3 5
4,3 4,4 4,4 4,4 4,3 5
3,15 3,2 3,4 3,2 4 3,2
3,45 4,2 4,2 4 3,3 4
4,45 3,4 4 3 5 3,2
3,15 3,4 3,4 4 3,3 4,4
3,15 3,2 3,4 4 5 3,2
3,45 3,4 3,4 4 3,3 4,2
3,3 3,2 3,2 4,4 4 4
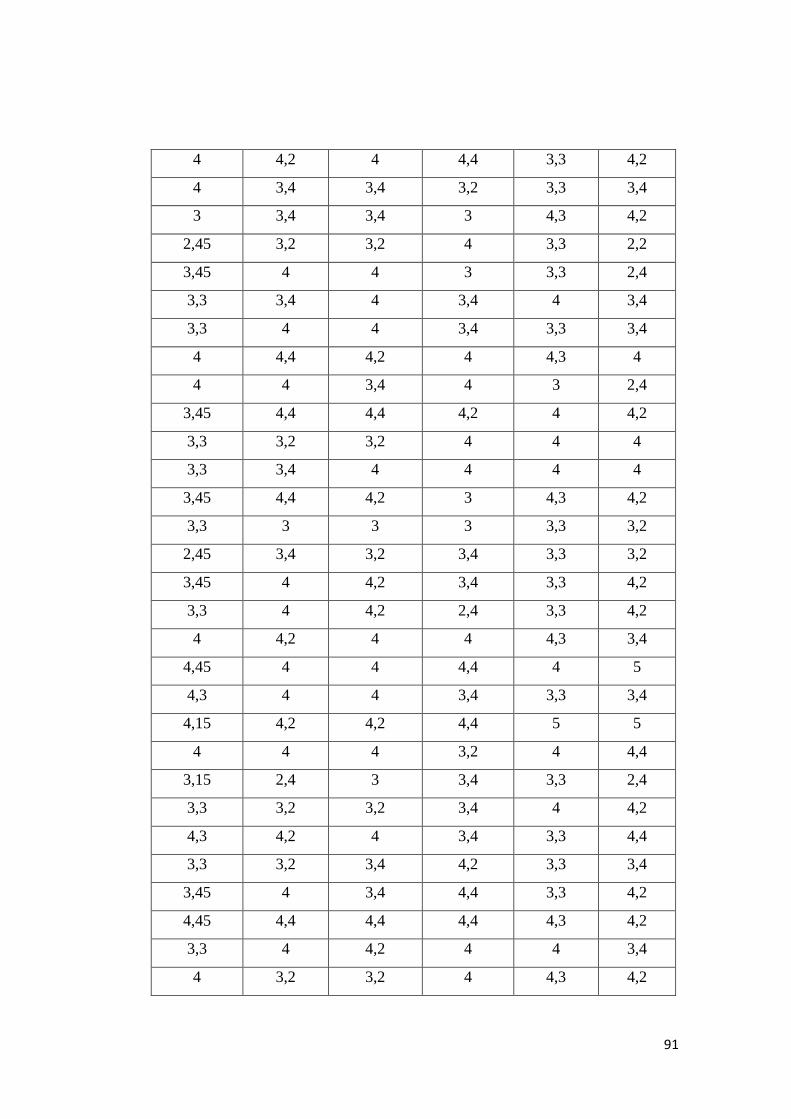
91
4 4,2 4 4,4 3,3 4,2
4 3,4 3,4 3,2 3,3 3,4
3 3,4 3,4 3 4,3 4,2
2,45 3,2 3,2 4 3,3 2,2
3,45 4 4 3 3,3 2,4
3,3 3,4 4 3,4 4 3,4
3,3 4 4 3,4 3,3 3,4
4 4,4 4,2 4 4,3 4
4 4 3,4 4 3 2,4
3,45 4,4 4,4 4,2 4 4,2
3,3 3,2 3,2 4 4 4
3,3 3,4 4 4 4 4
3,45 4,4 4,2 3 4,3 4,2
3,3 3 3 3 3,3 3,2
2,45 3,4 3,2 3,4 3,3 3,2
3,45 4 4,2 3,4 3,3 4,2
3,3 4 4,2 2,4 3,3 4,2
4 4,2 4 4 4,3 3,4
4,45 4 4 4,4 4 5
4,3 4 4 3,4 3,3 3,4
4,15 4,2 4,2 4,4 5 5
4 4 4 3,2 4 4,4
3,15 2,4 3 3,4 3,3 2,4
3,3 3,2 3,2 3,4 4 4,2
4,3 4,2 4 3,4 3,3 4,4
3,3 3,2 3,4 4,2 3,3 3,4
3,45 4 3,4 4,4 3,3 4,2
4,45 4,4 4,4 4,4 4,3 4,2
3,3 4 4,2 4 4 3,4
4 3,2 3,2 4 4,3 4,2
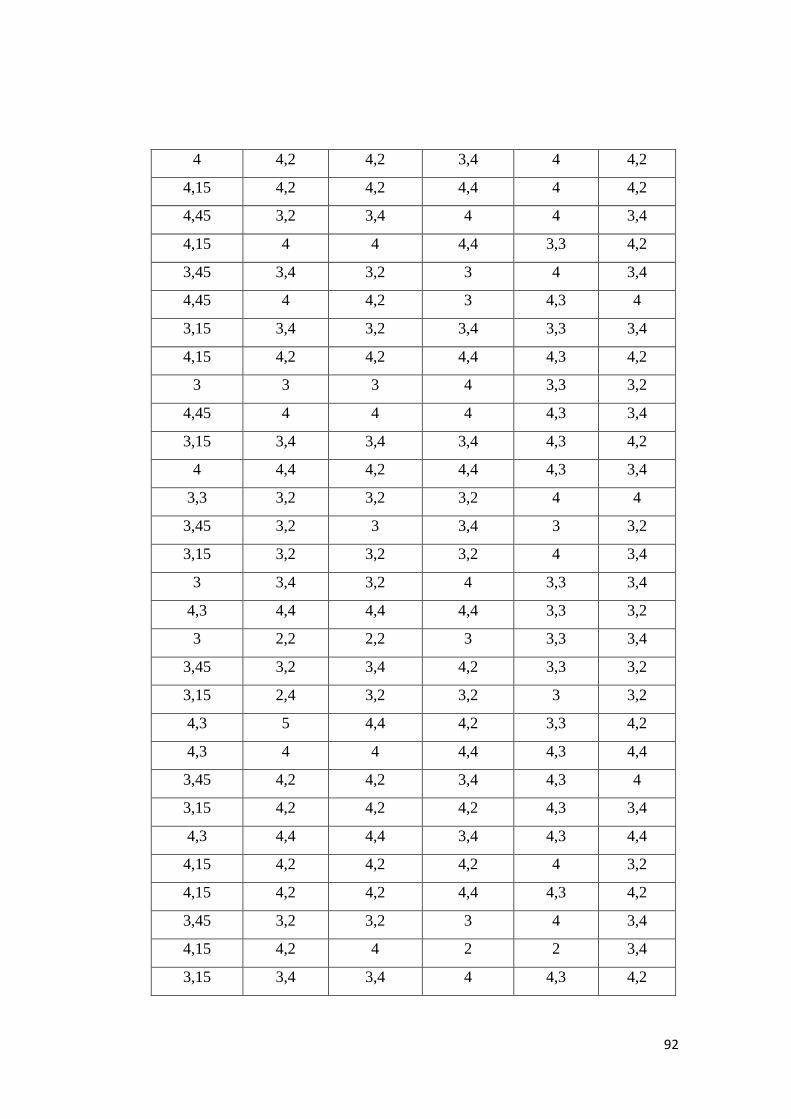
92
4 4,2 4,2 3,4 4 4,2
4,15 4,2 4,2 4,4 4 4,2
4,45 3,2 3,4 4 4 3,4
4,15 4 4 4,4 3,3 4,2
3,45 3,4 3,2 3 4 3,4
4,45 4 4,2 3 4,3 4
3,15 3,4 3,2 3,4 3,3 3,4
4,15 4,2 4,2 4,4 4,3 4,2
3 3 3 4 3,3 3,2
4,45 4 4 4 4,3 3,4
3,15 3,4 3,4 3,4 4,3 4,2
4 4,4 4,2 4,4 4,3 3,4
3,3 3,2 3,2 3,2 4 4
3,45 3,2 3 3,4 3 3,2
3,15 3,2 3,2 3,2 4 3,4
3 3,4 3,2 4 3,3 3,4
4,3 4,4 4,4 4,4 3,3 3,2
3 2,2 2,2 3 3,3 3,4
3,45 3,2 3,4 4,2 3,3 3,2
3,15 2,4 3,2 3,2 3 3,2
4,3 5 4,4 4,2 3,3 4,2
4,3 4 4 4,4 4,3 4,4
3,45 4,2 4,2 3,4 4,3 4
3,15 4,2 4,2 4,2 4,3 3,4
4,3 4,4 4,4 3,4 4,3 4,4
4,15 4,2 4,2 4,2 4 3,2
4,15 4,2 4,2 4,4 4,3 4,2
3,45 3,2 3,2 3 4 3,4
4,15 4,2 4 2 2 3,4
3,15 3,4 3,4 4 4,3 4,2
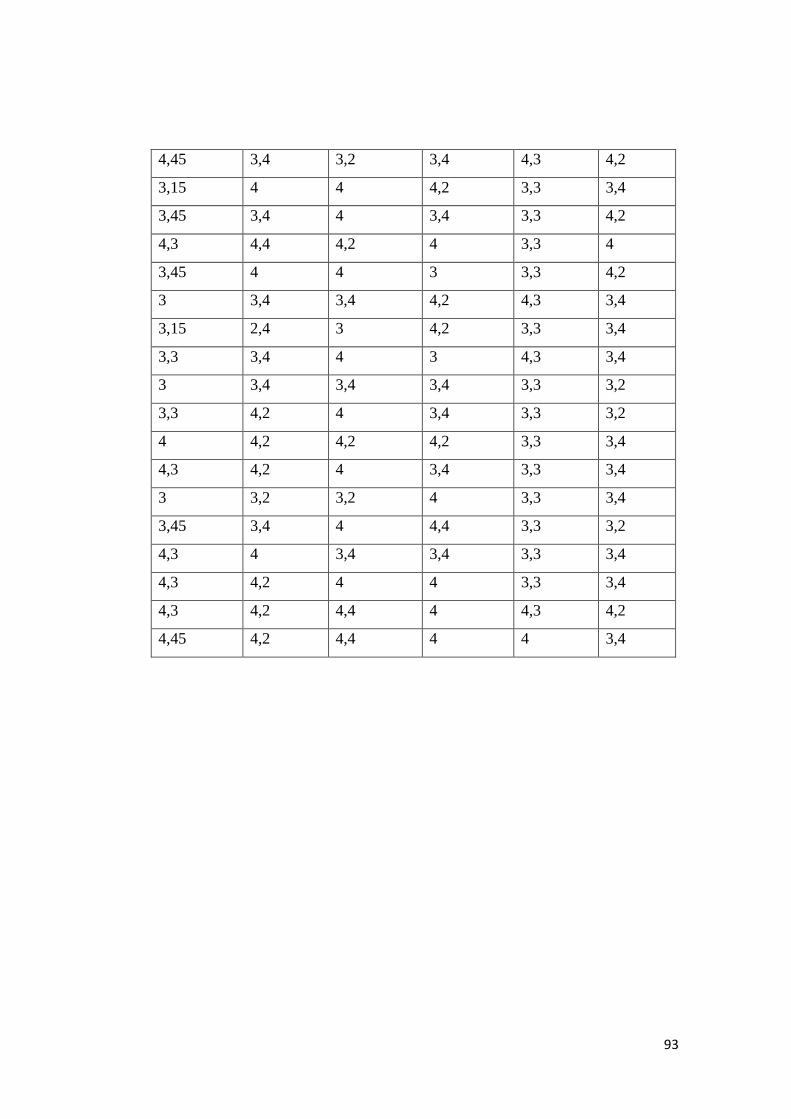
93
4,45 3,4 3,2 3,4 4,3 4,2
3,15 4 4 4,2 3,3 3,4
3,45 3,4 4 3,4 3,3 4,2
4,3 4,4 4,2 4 3,3 4
3,45 4 4 3 3,3 4,2
3 3,4 3,4 4,2 4,3 3,4
3,15 2,4 3 4,2 3,3 3,4
3,3 3,4 4 3 4,3 3,4
3 3,4 3,4 3,4 3,3 3,2
3,3 4,2 4 3,4 3,3 3,2
4 4,2 4,2 4,2 3,3 3,4
4,3 4,2 4 3,4 3,3 3,4
3 3,2 3,2 4 3,3 3,4
3,45 3,4 4 4,4 3,3 3,2
4,3 4 3,4 3,4 3,3 3,4
4,3 4,2 4 4 3,3 3,4
4,3 4,2 4,4 4 4,3 4,2
4,45 4,2 4,4 4 4 3,4

94