the global carbon cycle - rutgers universityebme.marine.rutgers.edu/historyearthsystems/hist... ·...
TRANSCRIPT

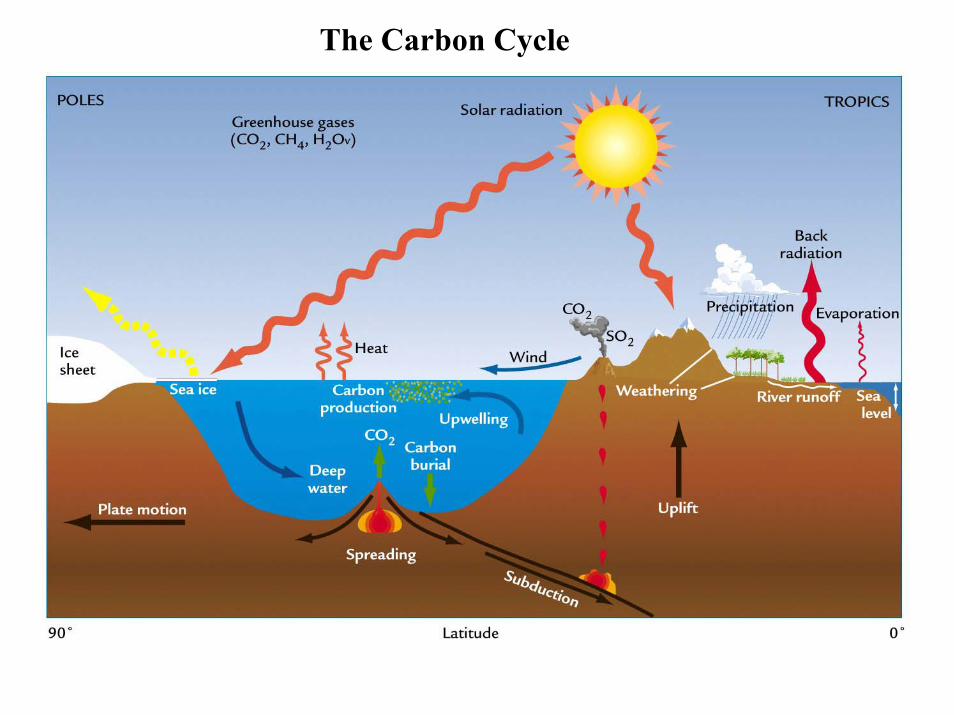
The Carbon Cycle
- Look at past climatic change; as controlled by the carbon cycle.
- Interpret the influence of human changes(Anthropogenic Perturbations)
- Economic and Trade Policies

EarthVenus

States of water in the solar-system

The Faint Young Sun Paradox

The greenhouse effect
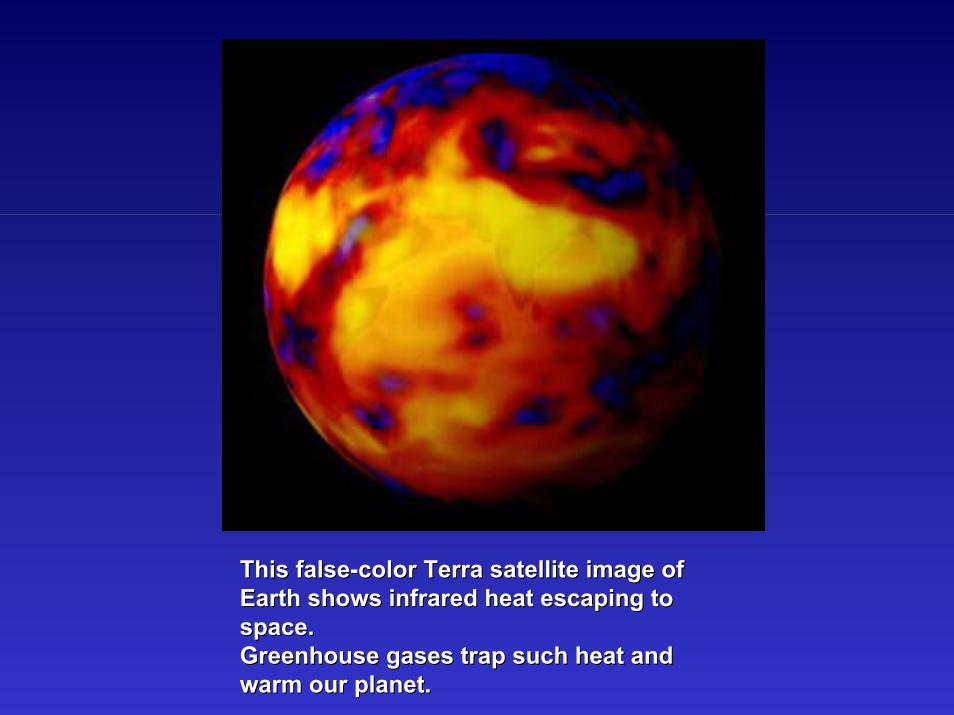
This falseThis false--color Terra satellite image of color Terra satellite image of Earth shows infrared heat escaping to Earth shows infrared heat escaping to space.space.Greenhouse gases trap such heat and Greenhouse gases trap such heat and warm our planet. warm our planet.

Relative percentage composition of greenhouse gases in the Earth’s atmosphere
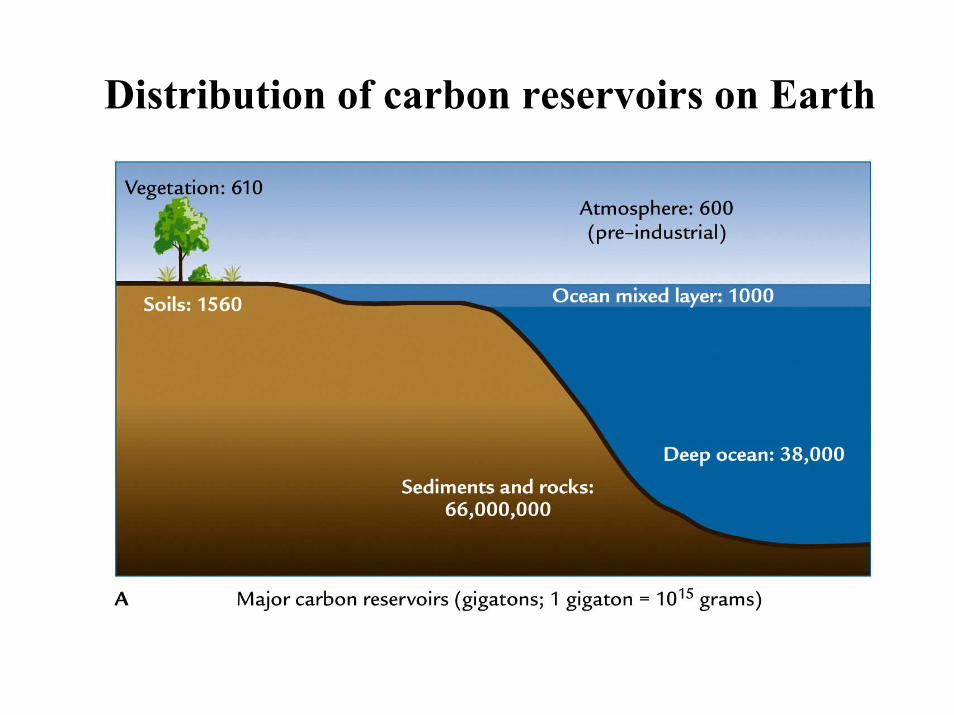
Distribution of carbon reservoirs on Earth
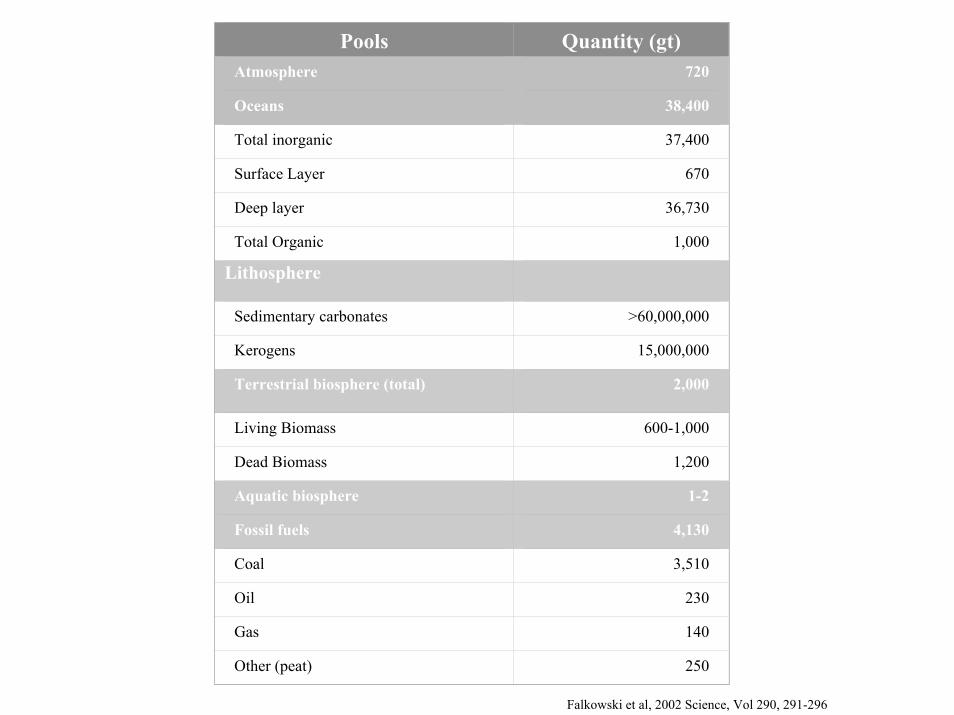
Pools Quantity (gt)Atmosphere 720
Oceans 38,400
Total inorganic 37,400
Surface Layer 670
Deep layer 36,730
Total Organic 1,000
Lithosphere
Sedimentary carbonates >60,000,000
Kerogens 15,000,000
Terrestrial biosphere (total) 2,000
Living Biomass 600-1,000
Dead Biomass 1,200
Aquatic biosphere 1-2
Fossil fuels 4,130
Coal 3,510
Oil 230
Gas 140
Other (peat) 250
Falkowski et al, 2002 Science, Vol 290, 291-296
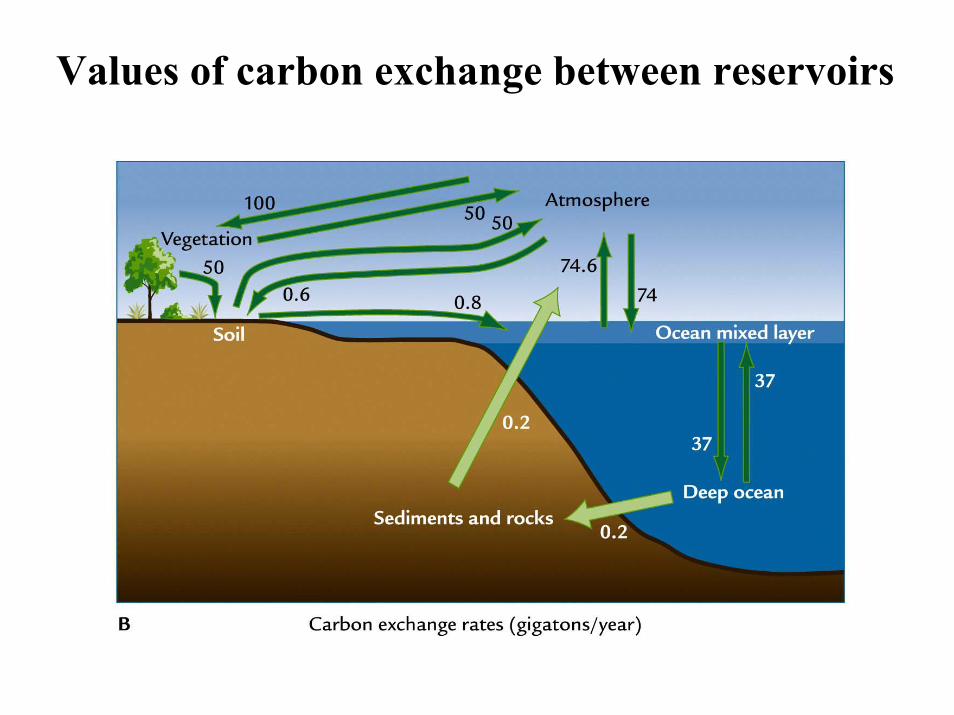
Values of carbon exchange between reservoirs


Carbon Degassing
MÖrner and Etiope, Global and Planetary Change 33 (2002) 185-203

Methane Hydrates
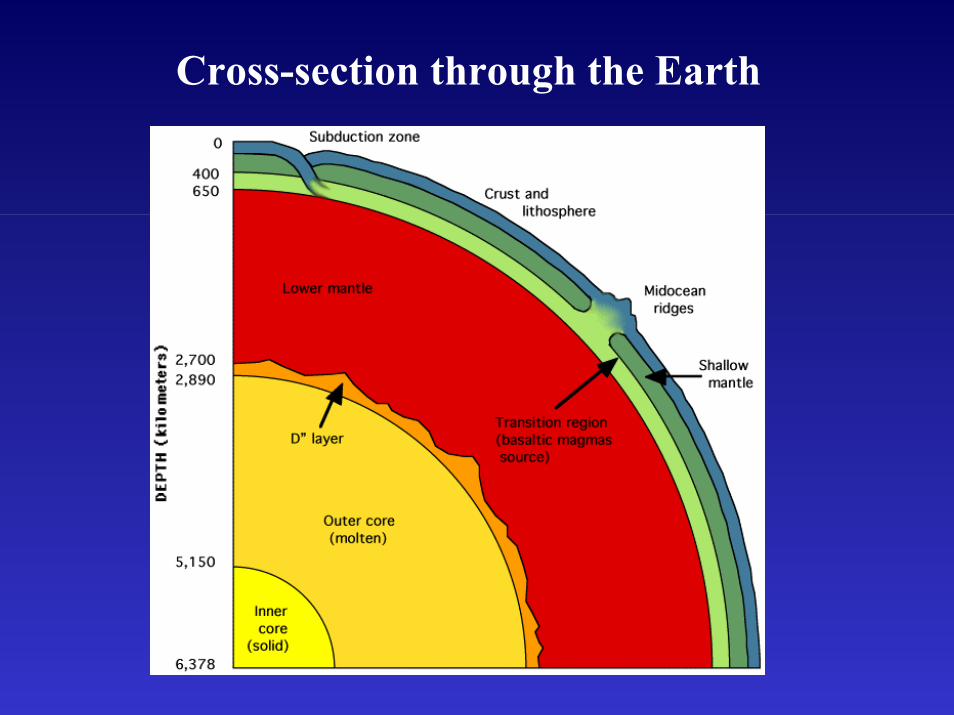
Cross-section through the Earth
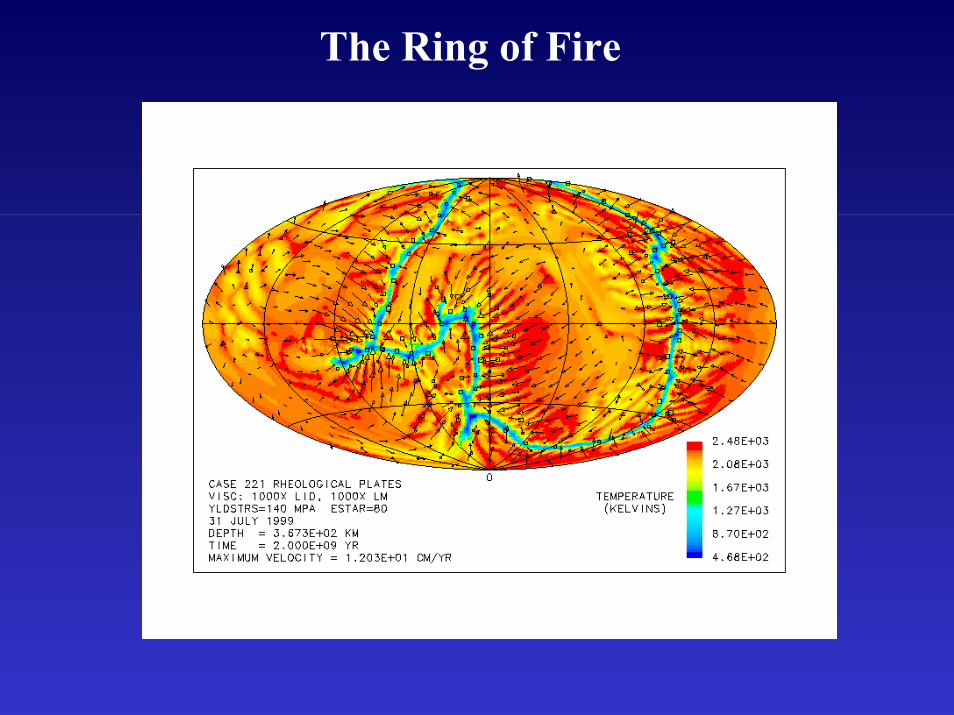
The Ring of Fire
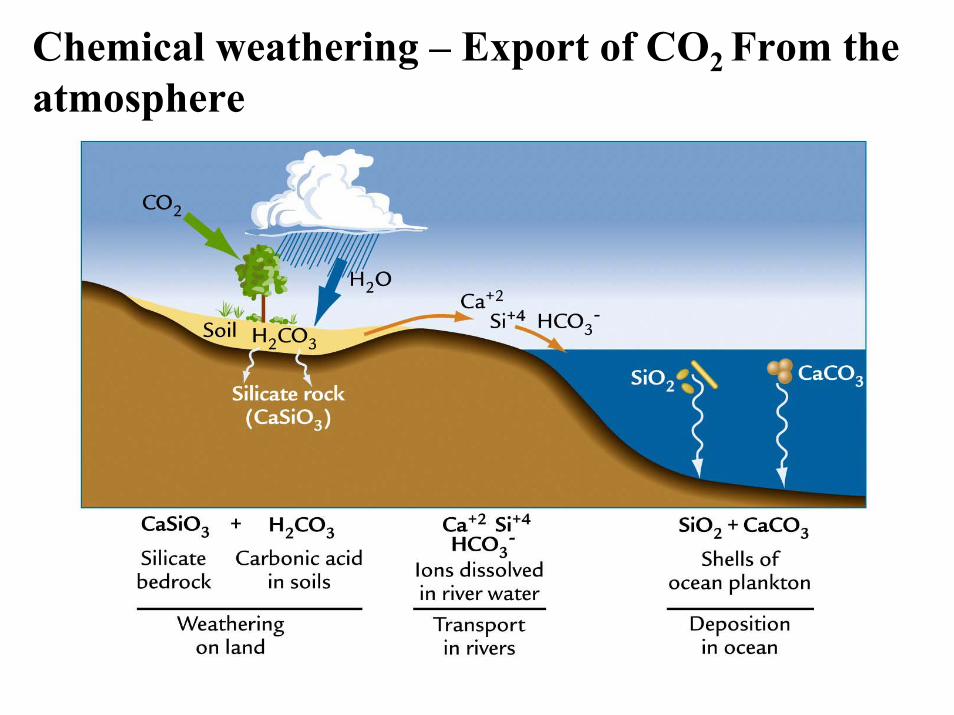
Chemical weathering – Export of CO2 From the atmosphere

The hydrological cycle

Chemical Weathering
Calcite (Carbonate) compensation depth (CCD) -- The depth in the ocean below which material composed of calcium carbonate is dissolved and does not accumulate on the sea floor
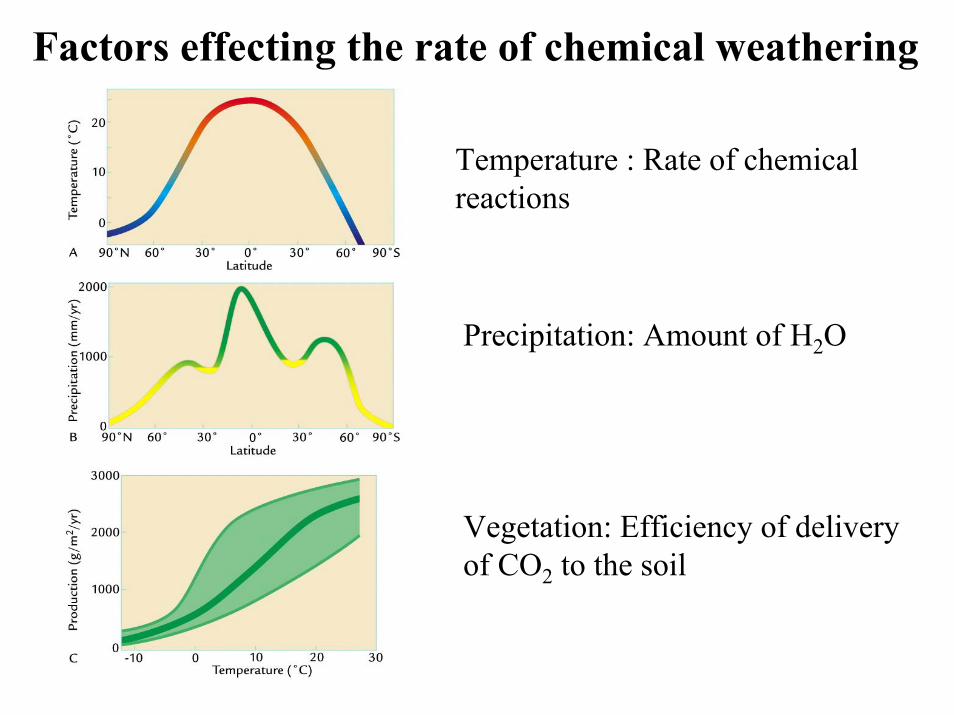
Factors effecting the rate of chemical weathering
Temperature : Rate of chemicalreactions
Precipitation: Amount of H2O
Vegetation: Efficiency of delivery of CO2 to the soil

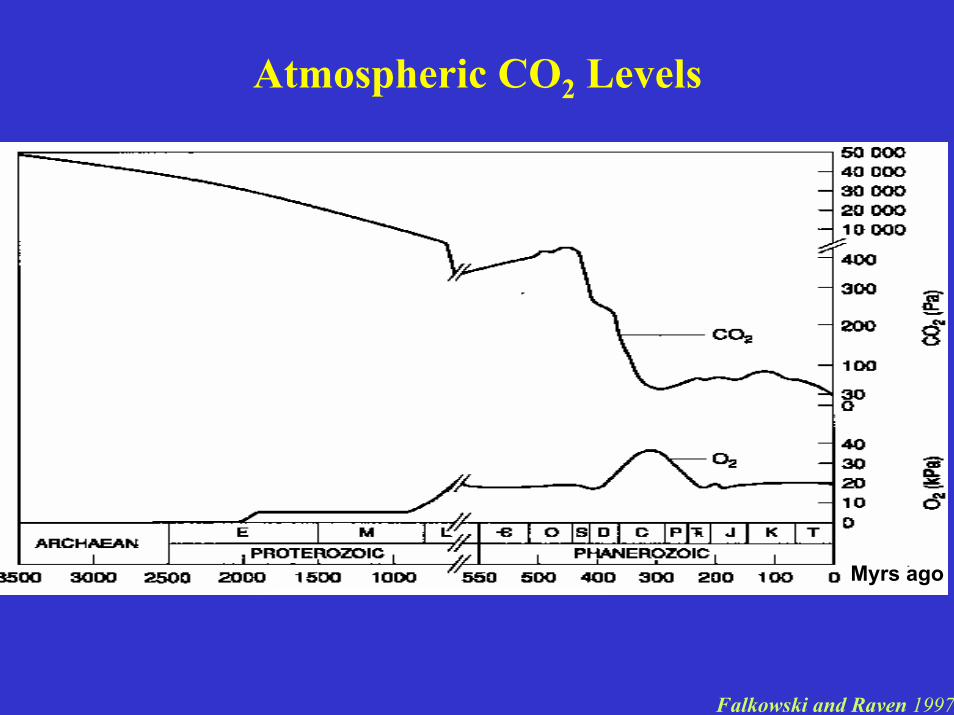
Atmospheric CO2 Levels
Myrs ago
Falkowski and Raven 1997
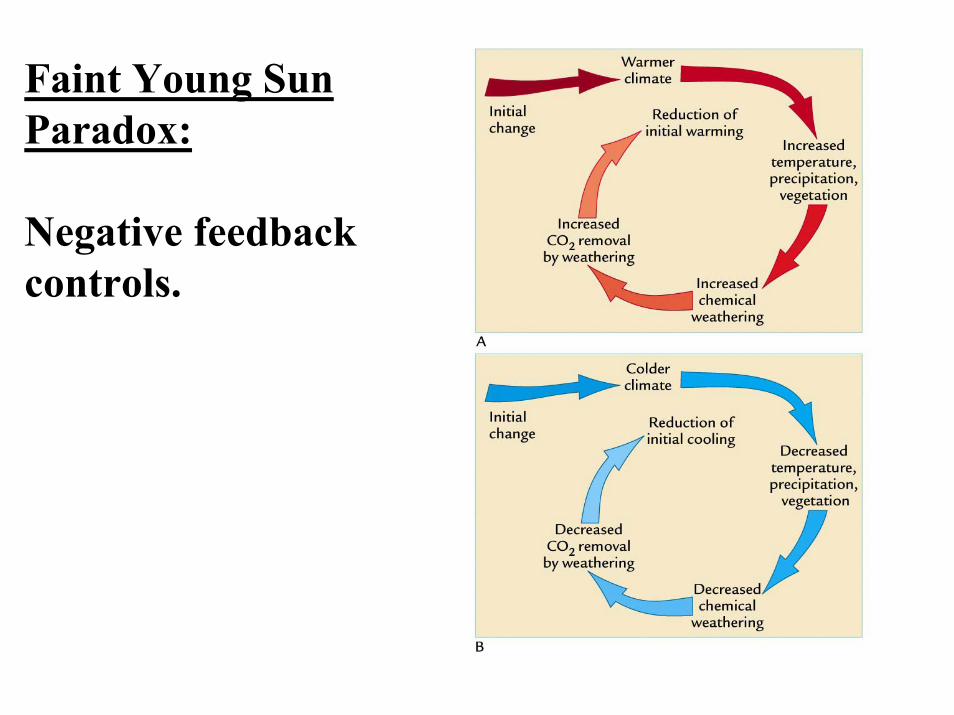
Faint Young Sun Paradox:
Negative feedback controls.

Faint Young Sun paradox: Controlled by the Carbon cycle
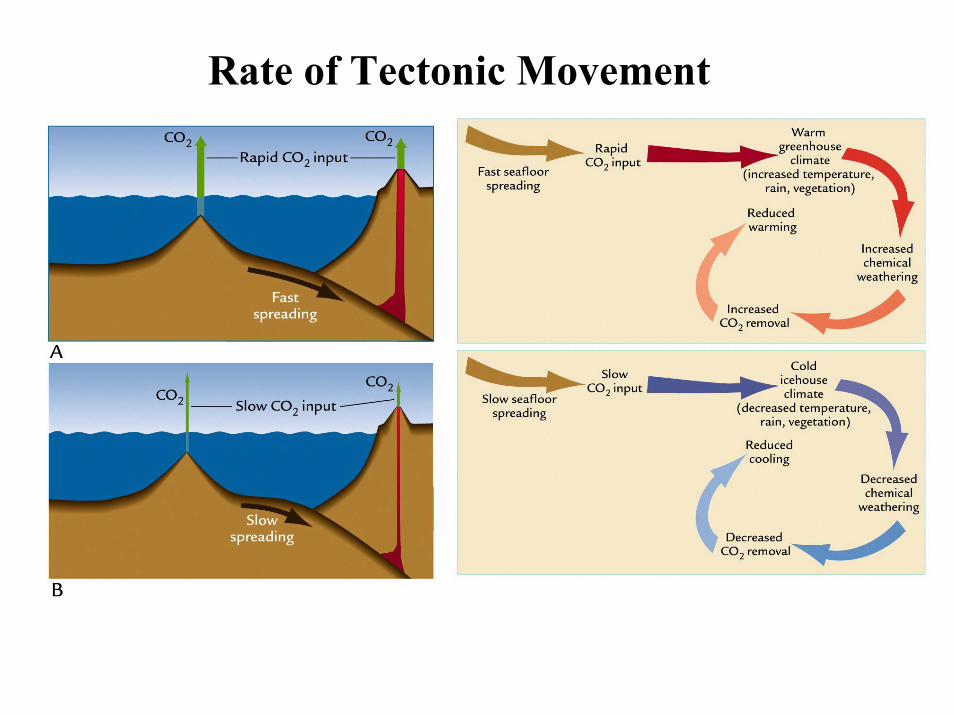
Rate of Tectonic Movement

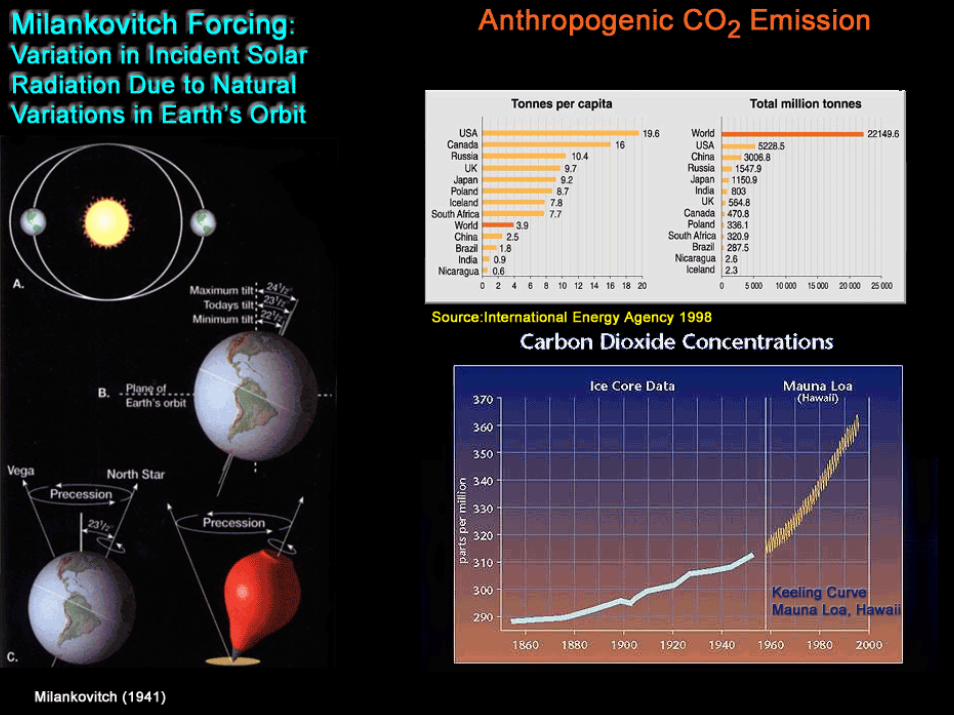
The Earth’s Orbit
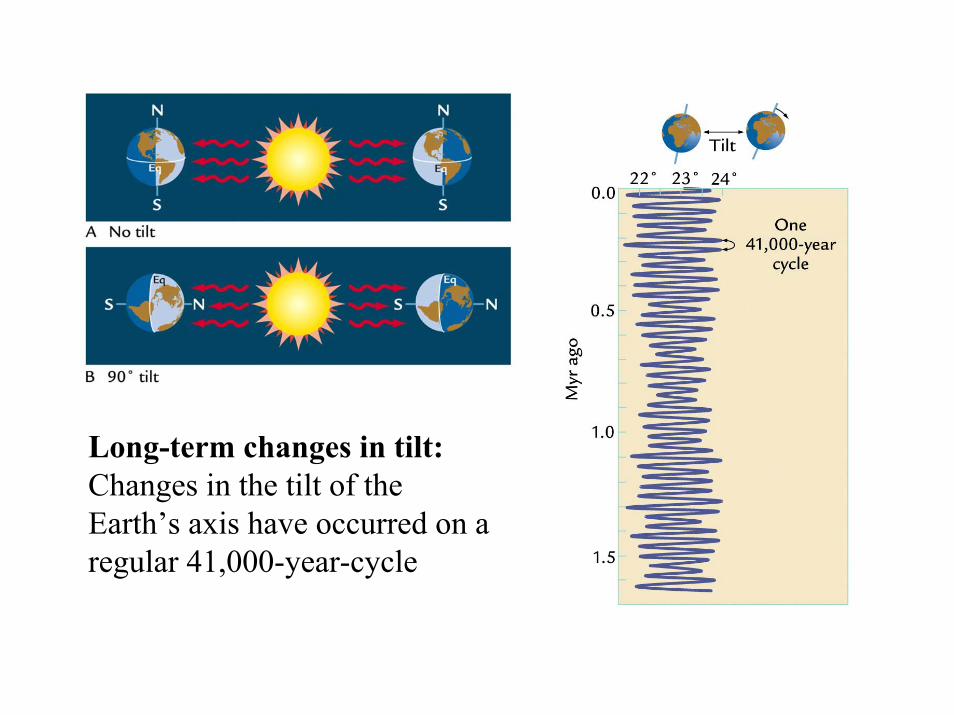
Long-term changes in tilt:Changes in the tilt of the Earth’s axis have occurred on a regular 41,000-year-cycle

Long-term changes in eccentricity:The eccentricity of the Earth’s orbit varies at periods of 100,000 and 413,000 years.
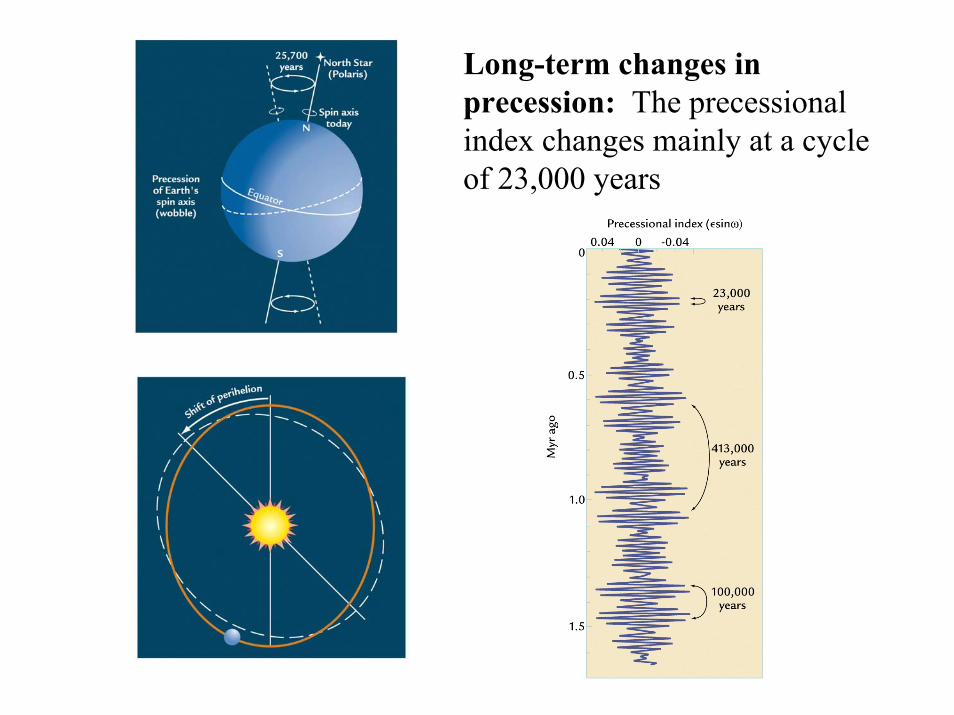
Long-term changes in precession: The precessional index changes mainly at a cycle of 23,000 years


Review of Lecture 1
Aim:Cover the long-term processes of the carbon cycle.
- CO2 release into the atmosphere.- Removal of CO2 from the atmosphere via chemical weathering.
These processes have existed in a dynamic equilibrium that has kept the Earth’s climate relatively constant.

The Faint Young Sun Paradox
Atmospheric CO2 Levels
Myrs ago
Falkowski and Raven 1997


The Carbon Balance each year...
• 6.3 Gt from fossil emissions• 1.6 Gt emitted from land-clearing
• Leaving a net 7.9 Gt in the atmosphere (estimated)

The Balance each year...
• 6.3 Gt from fossil emissions• ca. 1.6 Gt emitted from land-clearing• 1.7 Gt net uptake into ocean systems • 3.0 Gt into terrestrial systems• Leaving a net 3.2 Gt in the atmosphere

The evolution and global effect of photosynthetic organisms
Myrsago

The Organic Carbon Cycle
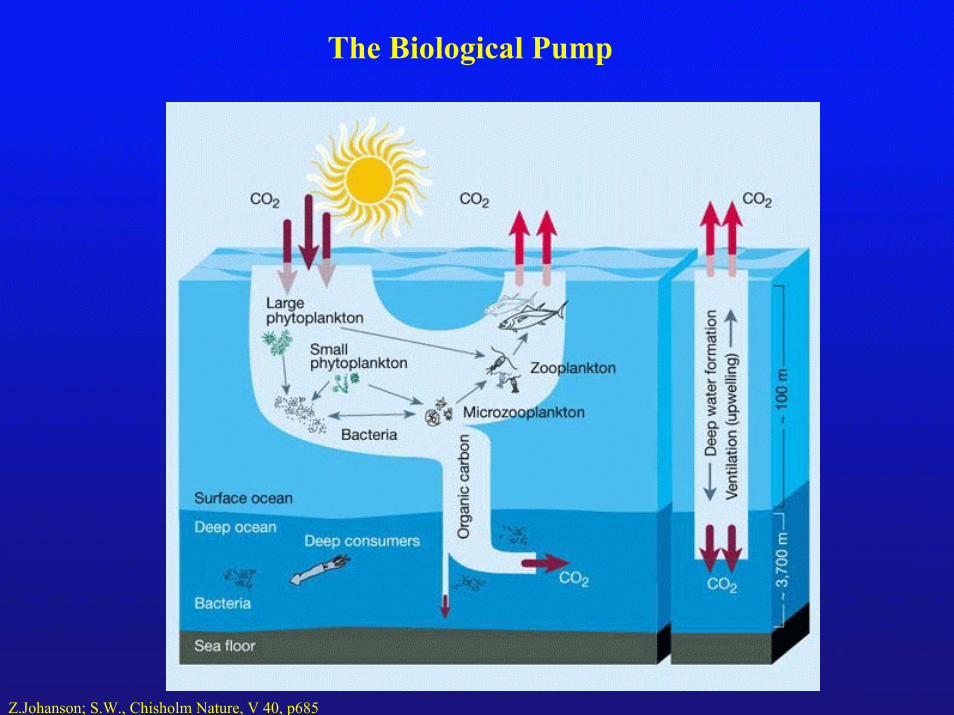
The Biological Pump
Z.Johanson; S.W., Chisholm Nature, V 40, p685

Diatom
Coccolithophore
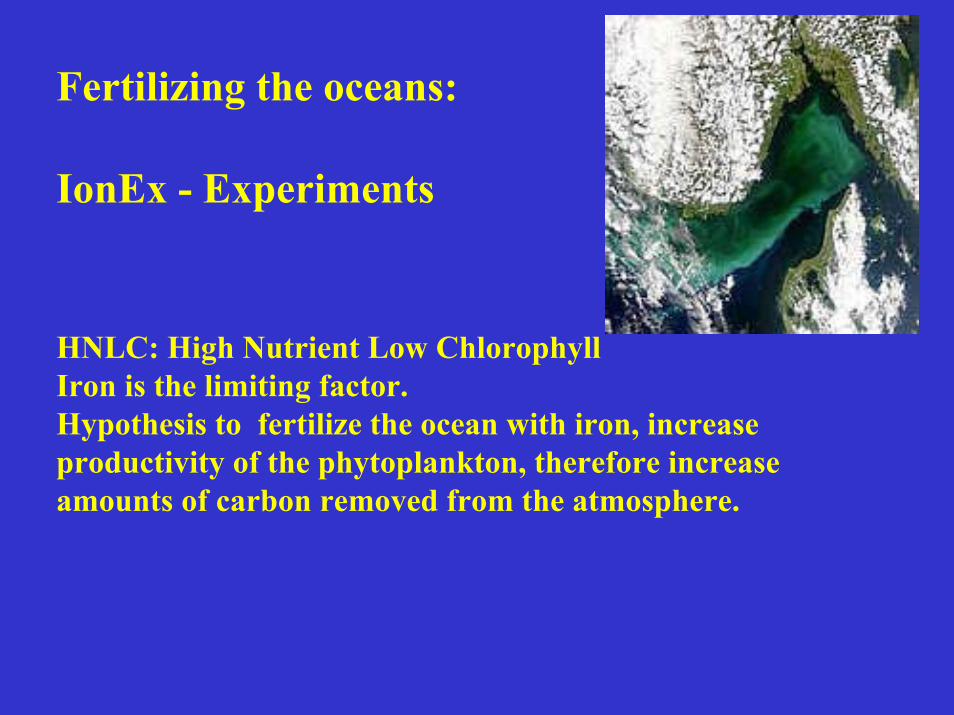
Fertilizing the oceans:
IonEx - Experiments
HNLC: High Nutrient Low ChlorophyllIron is the limiting factor. Hypothesis to fertilize the ocean with iron, increase productivity of the phytoplankton, therefore increase amounts of carbon removed from the atmosphere.
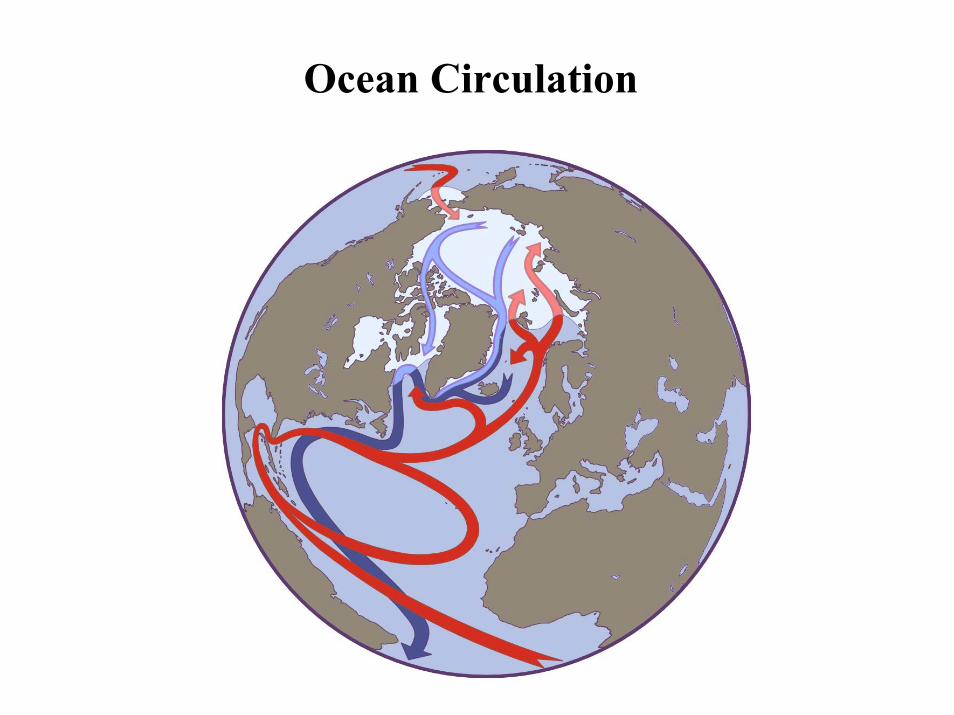
Ocean Circulation
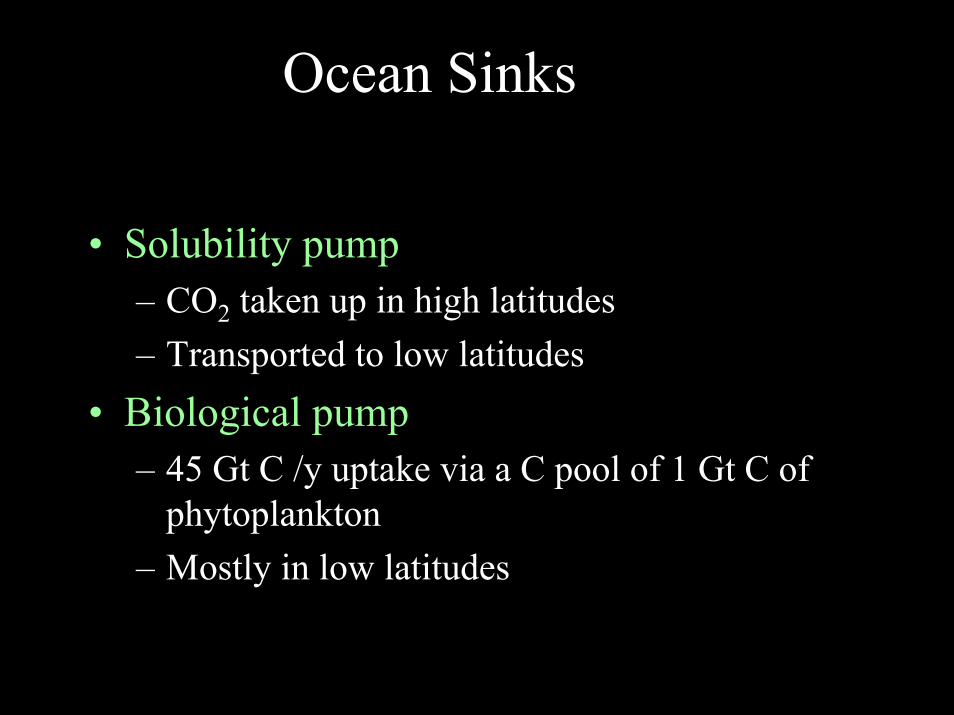
Ocean Sinks
• What are the ocean mechanisms?• Solubility pump
– CO2 taken up in high latitudes– Transported to low latitudes
• Biological pump– 45 Gt C /y uptake via a C pool of 1 Gt C of
phytoplankton– Mostly in low latitudes

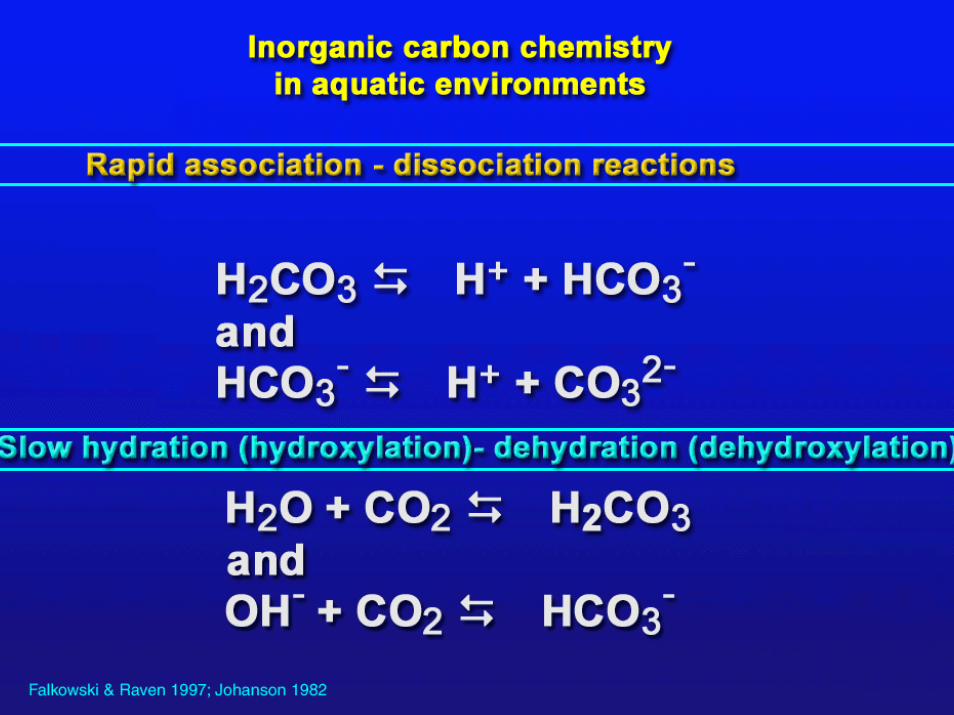
The Carbonate System


Deffeyes Curve

Foraminifera Coccolithophore

Oxygen Fractionation
δ18O = (18O/16O)sample – (18O/16O)standard x1000(18O/16O)standard
2 stable (nonradioactive) isotopes of Oxygen:16O – 99.8%; 18O the rest.
Samples with large amounts of 18O have more positive δ18O values and are 18O-enriched
Samples with small amounts of 18O have more negative δ18O values and are 18O-depleted

Oxygen fractionation (physical)
- 16O is more easily evaporated than 18O
- Leaving water vapor enriched in 16O
- If this vapor falls as precipitation and becomes locked up in ice-sheets (a cold climate) then surface waters become relatively 18O enriched
- δ18O values and are 18O-enriched

Carbon Fractionation
δ13C = (13C/12C)sample – (13C/12C)standard x1000(13C/12C)standard
2 stable (nonradioactive) isotopes of Carbon:12C – 99%; 13C the rest.
Samples with large amounts of 13C have more positive δ13C values and are 13C-enriched
Samples with small amounts of 13C have more negative δ13C values and are 13C-depleted
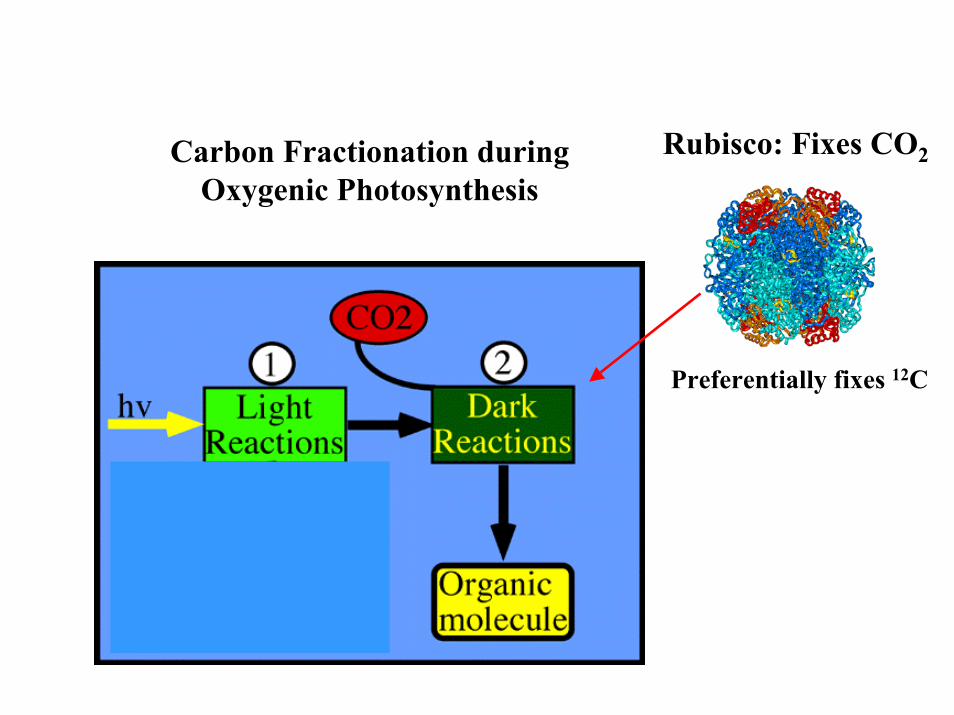
Rubisco: Fixes CO2
Preferentially fixes 12C
Carbon Fractionation during Oxygenic Photosynthesis
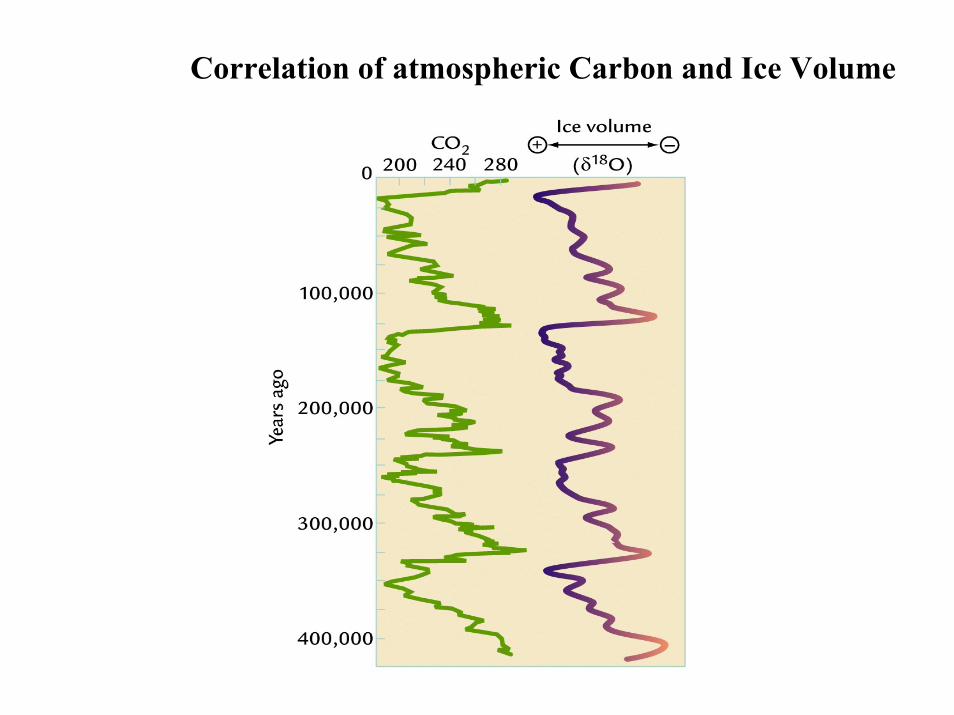
Correlation of atmospheric Carbon and Ice Volume

Falkowski et. al. The Global Carbon Cycle: A Test of our knowledge of Earth as a System. Science; 2000 vol. 290 pp. 291-296
Hoffman et. al. A Neoproterozoic Snowball Earth. Science; 1998 vol.. 281 pp 1342-1346
Berner. Examination of hyphotheses for the Permo-Triassic boundary extinction by carbon modelling. PNAS; 2002 vol. 99 pp. 4172-4177
Norris and Rohl. Carbon cycling and chronology of climate warming during the Palaeocene/Eocene transition. Nature; 1999 vol. 401 pp. 775-778