the case for thermoelectrics in the dc
DESCRIPTION
The Case for Thermoelectrics in the Data Center. How integrating Thermoelectrics into IT systems assists in reducing data center energy consumption.TRANSCRIPT

The Case for Thermoelectrics in the
Data Center A new approach and use of an old science
by
Jeffrey J. Sicuranza
Applied Methodologies, Inc.
AMILABS Research
October, 2009
The Case for Thermoelectrics in the Data Center October 2009
2 © 2009 Applied Methodologies, Inc.
Table of Contents Executive Summary ....................................................................................................................................... 3
1.0 Introduction ............................................................................................................................................ 4
2.0 Energy Issues Relating to the Data Center .............................................................................................. 6
3.0 The General Idea ................................................................................................................................... 10
4.0 Introduction to Thermoelectrics ........................................................................................................... 10
4.1 What is Thermoelectrics? ................................................................................................................. 10
4.2 Thermoelectrics - A Brief History ...................................................................................................... 10
4.3 Thermoelectrics - A Closer Look ....................................................................................................... 12
4.4 Thermoelectric Cooling and Heating ................................................................................................ 13
4.5 Thermoelectric Power Generation ................................................................................................... 13
4.6 But How Efficient Is It? ...................................................................................................................... 14
4.7 Benefits of Thermoelectrics .............................................................................................................. 15
4.8 Thermoelectric related links: ............................................................................................................ 15
5.0 IT and Thermoelectrics ......................................................................................................................... 16
6.0 Our Enterprise Energy Vision ............................................................................................................... 17
7.0 How Does It Work? ............................................................................................................................... 18
7.1 TGS(Thermoelectric Generation Systems) ........................................................................................ 18
8.0 The Economic Impact of Thermoelectrics in the Data Center .............................................................. 21
8.1 TOE(TGS Offset Effect) ..................................................................................................................... 24
8.2 TOE Models – TOE harvesting ratio based on current TEG technologies: ....................................... 26
9.0 SCALING with TGSx ................................................................................................................................ 28
10.0 The Monetary Value Our System Provides ......................................................................................... 33
11.0 Our Contribution ................................................................................................................................. 39
11.1 Thin/Virtualized Clients ................................................................................................................... 40
11.2 Intelligent Networking Devices ....................................................................................................... 41
11.3 What about a TGS based enterprise? ............................................................................................. 41
11.4 Power Management Systems ......................................................................................................... 42
11.5 Other Benefits ................................................................................................................................. 42
12.0 Summary ............................................................................................................................................. 44
About Applied Methodologies, Inc. (AMI) .................................................................................................. 45
Appendix ..................................................................................................................................................... 45

The Case for Thermoelectrics in the Data Center October 2009
3 © 2009 Applied Methodologies, Inc.
Executive Summary Over the past several years corporate enterprises and the Information Technology (IT) industry in general have increased their awareness relating to the “greening” of the data center or the “greening of IT” for the main purpose of reducing energy consumption and costs. Many standards, technologies and best practices have been developed and put forward from the corporate community, government and IT industry for corporations to utilize in monitoring and reducing energy consumption in their data centers. The cost of energy continues to fluctuate with the almost certain possibility of higher prices encountered in the future. Plus, with a dubious global economic climate upon us, the CEO/CIO are challenged more than ever in finding ways to reduce every dollar of operational cost for the enterprise and remain competitive. There is a fluid gap between what practices, initiatives and technologies are considered hype and what are truly green. This gap provides a pitfall for the enterprise, for selecting a green initiative that may in principal appear sound to solve an environmental requirement may be detrimental in terms of cost to integrate. Worse yet, selecting a green product or solution that is not even green nor has any tangible ROI or measurable metric could impact the enterprise negatively. It is increasingly difficult for a CEO to steer an organization towards becoming environmentally aware and stay competitive on the global theater while keeping operating costs contained. Applied Methodologies, Inc.(AMI) recognized these issues in 2006 and identified an area of science and technology (Thermoelectrics) that we believe its time has come for consideration in the IT industry. We developed an approach and system of utilizing this technology to illustrate that it can have a positive impact on the IT industry from a functional and economic basis. We do not consider our system and vision a “green” related solution in the traditional sense but a pragmatic approach of utilizing a technology to help solve a problem. Prototypes were developed to provide the performance and ROI values cited in this paper. Our Thermoelectric Generation Systems(TGS) is an IT system such as a server, router or switch of any platform configuration employing Thermoelectric technology. Simply put, our systems utilize Thermoelectrics to convert waste heat or any form of temperature gradient within the IT device to usable energy. With Thermoelectrics integrated in our systems these devices now have another dimension to their respective IT role, energy generation. The energy generated from the work these systems would normally conduct in the data center has a value and can be used for many purposes. For example, one important purpose is to offset the cost of energy consumption in the same data center. This white paper outlines the current trends and issues relating to IT energy consumption and “green” related activities in the enterprise data center to provide the context of the need for our approach and enterprise energy vision in the IT industry today. We shall delve into the subject on how utilizing our approach and system to redressing some of those issues applies. A brief discussion on the technology behind our approach is included. We then shall cover the value our approach provides not only from a functional and environmental perspective but also from an economic one. Our enterprise energy vision will be discussed and how our resulting products or products developed from others in the IT industry using our system can assist and complement the many valid energy efficiency based products, initiatives and standards utilized today to reduce the energy consumption concerns of the corporate enterprise.

The Case for Thermoelectrics in the Data Center October 2009
4 © 2009 Applied Methodologies, Inc.
1.0 Introduction
Energy consumption has become one of the major issues relating to a corporation’s financial health over the last several years. As of this writing, the U.S., its global partners and competitors are experiencing one of the most challenging economic periods in history. A business in this present climate must be extremely efficient and nimble in its operations to remain sustainable let alone thrive. As dramatic as the last statement sounds, it is an unequivocal certainty. A corporation utilizes the efficiencies gained from Information Technology (IT) to assist in its quest of maintaining a competitive advantage and reducing operating costs.
In today’s IT environment, IT now has to integrate itself within the corporate business practices to further advance the corporation’s competitive advantage and bottom line via technology, yet no longer function solely as an expense based support organization. IT is becoming an ever more critical component of a corporate enterprise and not just a support based expense. However, as this functional component increases in value to the enterprise its operating cost are increasing as well. One such major cost is that of the cost of energy and the power consumed by IT systems to drive an enterprise and help it remain competitive, especially in such a difficult economic climate. The data center is the ground zero of a corporation’s intelligence and capability. All of a corporation’s idea, process and rules it follows are created by its most important asset, its employees, but subsequently implemented in many forms in the data center via information technology. As companies strive to become more efficient, competitive and profitable, their reliance upon their data center assets grows. From this growth the business encountered an unexpected increase in the cost of their energy bill compared to years past.
Data centers around the globe are consuming power and requiring energy at a faster rate than expected. The same fact applies to just the sheer number of personal computers in use globally. The advent and ongoing evolution of the internet, multimedia, mobile and broadband technologies will just continue to contribute to this power consumption trend. How much power will be required to run data centers in the future and how much energy is available to support this development is a major question that has been presented to CEOs, CIOs, IT managers, consumers, environmentalists, and political representatives. Another source of concern is how to retrofit existing data centers with fixed footprints and power capacity constraints which are not easy to remediate. There has been a tremendous amount of activity towards making the data center energy efficient since 2006. There are countless articles, whitepapers, seminars, webinars, reports from IT trade pundits, major manufactures, green and environmental groups, and various consortiums that have covered the topic of energy and environmental concerns in the data center. Since 2006 there has been a tremendous amount of “green IT”, “Eco enterprise”, “green speak” and “sustainability talk” in the IT industry almost to the point where terms such as “Greenwashing” or “Greensheen” are now part of the lexicon. Any product with the word green in it meant it was efficient or provided some form of ROI over a non green product. With the gluttony of energy efficient and green products, programs, services, statistics and standards it is very difficult to determine what products and services are valid and what are just hype. According to one Gartner report IT users are confused about what “Green IT” means. Green, functionally and conceptually, may mean different things to different organizations. The green benefits must be valued against the anticipated cost, thus putting business value first and environmental benefits second.

The Case for Thermoelectrics in the Data Center October 2009
5 © 2009 Applied Methodologies, Inc.
G to G index measures a green technologies' cost to implement against the value it provides. Some examples: Virtualization - its G to G index is a 5 for every server virtualized produces x in savings annually.
Video conferencing - its G to G index is a 1 for it cost more to implement and manage then its ROI benefits.
There is a growing green gap between green hype or green washing and the valid IT issues relating to the rising costs of power, cooling, and environmental compliance. To narrow the gap requires the IT industry to regulate itself to remove the rhetoric and clarify the reality when it comes to what is actually required in terms of products, services, standards and ROI in the name of energy efficiency and sustainable IT. There is solace in that the effects of a free market will weed out the hype products over the real products that produce an ROI, but that outcome shall require time. Then there is the confusion of whether any green technology of any significance costs quite a bit more than conventional alternatives. Another issue is, does any solution deemed “green” relate to a higher cost to implement than a non-green based technology? That is why the ROI is so important. For example, will that “green” power strip offer any functional benefits beyond a traditional power strip other than the green plastic it is encased in? Did corporations fall into that green gap and pay for a “green” power strip based on perception and not functionality and ROI? Most likely the answer would be yes. Now we shall take a stab at a little green hype with the following proposal. What about the concept of a Green to Green index? Where a higher G to G is positive, something similar to DCiE but for a green product or services ROI level. DCiE is covered in section 8.0
However, a rating such as the G to G index produces just another confusing metric to consider when it comes to the definition of cost and value. Especially value, what type of value are we to derive, a concrete fiscal savings ROI value or an environmental Btu/carbon footprint type value? As mentioned earlier there has been a tremendous
amount of activity since 2006 regarding energy efficiency in the data center and sustainable IT that is becoming difficult for the IT or data center manager to determine how to choose between the selection of the best green practices, products and services. In the next section we provided a list of the issues, programs, standards, products, practices and approaches that have originated from the corporate enterprise, government, IT and energy industry over the last several years to provide a framework on where our approach fits into the overall picture of addressing energy efficiency in the data center. You may recognize these items from another report, slide, trade rag, blog, website, baseline study, whitepaper, position paper, or design guide, for they were covered repeatedly over the last several years. Some of the major IT industry players such as Intel, IBM, HP, Cisco, APC, et al., plus research and reporting organizations such as Gartner, InformationWeek, Baseline, Fortune, eWeek, Networkworld and many of the green, energy, and environmental related web sites like the GreenGrid, EPA and yes even Treehugger.com, all at some point over the last three years covered the issue of data center energy consumption and efficiency from different perspectives in the form of reports, products and programs. We have consolidated some of the recurring issues in this paper to provide a backdrop on the time and need for the work AMI is conducting relating to our approach on addressing some of the very same issues outlined in the next section.

The Case for Thermoelectrics in the Data Center October 2009
6 © 2009 Applied Methodologies, Inc.
2.0 Energy Issues Relating to the Data Center TABLE 2-1 VARIOUS DATA CENTER ENERGY EFFICIENCY INITIATIVES, STANDARDS AND PRACTICES
Environmental adherence from many different standards and regulation bodies.
Plethora of metrics and specifications to use and compare - PUE, DCiE, EPEAT, DOE DCPro, PPW, SI-POM, EnergyStar, RoHS, 80Plus, LEED, SPECpower, various other Power Multiplier effects, et al.
Data center “Green” initiatives and offerings from major vendors such as APC, IBM, Intel, AMD, HP, Cisco, Dell, Oracle, Microsoft, VMware and Citrix.
Best practices and recommendations from EPA and DOE.
Data center consolidation and conservation approaches .
Organizations promoting best practices and standards such as the Green Grid.
TABLE 2-2 ENERGY ISSUES RELATING TO CONSUMPTION AND COST
Magnitude of reports providing consistent and conflicting data over the last several years on the consumption rate and cost of energy to power data centers.
Rising overall power consumption of the data center – various IT/Energy industry projections.
Data centers built 5-15 years ago reaching power and space issues.
Cooling per square foot costs.
Kwh per square foot costs.
Alternative energy sources such as geothermal, water and solar to produce energy to offset the supplied energy consumed from the grid.
Energy economics calculations such as Net Energy Gain(NEG) and Energy Returned on Energy Invested(EROEI).
OPEX analysis gap between IT and Facilities from continuing fluctuations in consumption and energy cost.
TABLE 2-3 COOLING RELATED ISSUES AND APPROACHES
Individual OEM computing device cooling issues and solutions.
“For every watt of work another watt to cool” axiom.
Cooling using rain water and storing it underground – water related methods.
Cooling using ambient outside temperature – region dependant.
Self installing internal to server liquid cooling units.
Water cooling techniques - such as those from IBM and its Chip Stacking approach.
State of the art from EPA - aggressive consolidation of servers and storage - direct liquid cooling.
Multitude of data center cooling issues, solutions and best practices present.
Moving data centers to cooler regions of country or globe to utilize cooler ambient outside temperatures for longer periods of the year.
Increasing data center temperatures to reduce energy costs.
Improve air flow management, venting issues, rack placement issues, side and bottom venting approaches.
Modular HVAC.
Hot/Cold aisle methods.
Under floor hot/cold flow arrangements.
Various air, water, other liquid, room, rack, device, space and geography methods to cool a data center.

The Case for Thermoelectrics in the Data Center October 2009
7 © 2009 Applied Methodologies, Inc.
TABLE 2-4 POWER RELATED ISSUES AND APPROACHES
Moving data centers to lower cost Kwh areas and using wind and/or solar. (may not be practical for most companies to move).
DC based systems – distribution systems and DC based servers, routers and switches.
Providing DC to the office floor closet if applicable.
DC based Power Distribution Unit - 415 Volt.
Next generation equipment requiring 208v power.
DC power to the rack - DC power supplies are more powerful, efficient and have fewer parts, making them less failure prone.
DC power in the data center or to the rack economics.
DC based device economics - do DC servers cost more than AC based counterparts?
Confusion around Real, Reactive and Apparent power and how to optimize in the data center.
Power Factor Correction and need for a correcting unit.
TABLE 2-4 GENERAL ENERGY REDUCTION METHODS
Environmental standards and regulation bodies’ adherence, rules, tips and best practices.
Decommissioning of servers.
Turning off idle servers.
Known low hanging fruit efficiency/savings methods.
Server/Device consolidation.
General data center site power distribution system and unit efficiencies transporting power from the building’s grid demarcation across the entire internal power distribution system to the actual device.
All of the items outlined in this section applicable to redundancy systems as well.
TABLE 2-5 SERVER HARDWARE AND SYSTEMS RELATED
Server sprawl and "throw another server at the problem" syndrome.
Rising power requirement needs of chips such as CPUs, Chipsets, ASICs, networking controllers, video controllers, DSPs, voltage regulators, memory and storage.
Joule heating junction temperature point limitations for current generation of chips.
Performance Per Watt and Thermal Design Points.
Contemporary CPU and general microchip technologies, smaller dies, lower voltage CPUs and intelligent thermal monitor and control subsystems of a CPU or other chips.
CPU power throttling to optimize Flop to watt ratio.
Virtualization as a means to reduce required power consumption and carbon footprint.
Application coding efficiencies to use less power (example - data query methods to save a watt of energy at the expense of a slower transaction completion time by a nanosecond or two).
Paravirtualization and Virtual Machine sprawl.
80-90% efficiency type power supplies in servers.
Replacing older servers with newer efficient units, but older units are still sitting in center using energy and need to be cooled.
Increase use of blade and other condensing server technology - the power consumption and density the current generation of servers are much higher than previous generations. All major manufacturers have similar products with power consumption levels ranging from 8kw to 20kw per rack, with 30kw+ products on the drawing board from some manufactures.
The Case for Thermoelectrics in the Data Center October 2009
8 © 2009 Applied Methodologies, Inc.
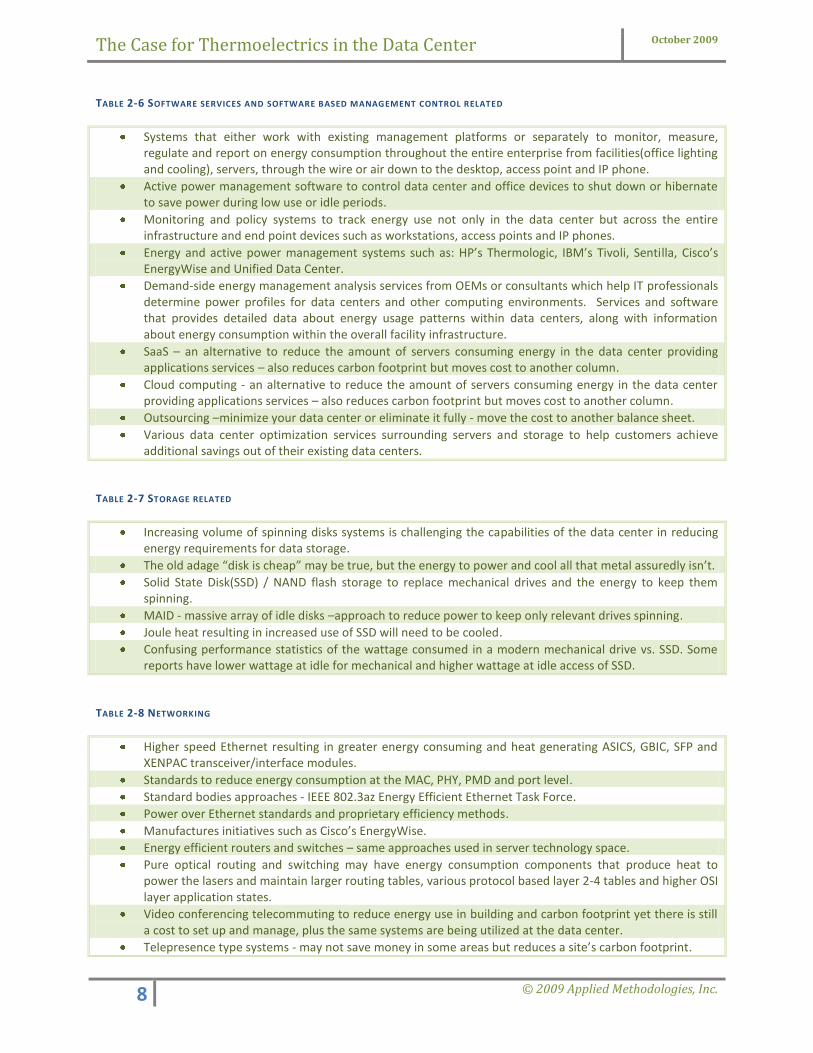
TABLE 2-6 SOFTWARE SERVICES AND SOFTWARE BASED MANAGEMENT CONTROL RELATED
Systems that either work with existing management platforms or separately to monitor, measure, regulate and report on energy consumption throughout the entire enterprise from facilities(office lighting and cooling), servers, through the wire or air down to the desktop, access point and IP phone.
Active power management software to control data center and office devices to shut down or hibernate to save power during low use or idle periods.
Monitoring and policy systems to track energy use not only in the data center but across the entire infrastructure and end point devices such as workstations, access points and IP phones.
Energy and active power management systems such as: HP’s Thermologic, IBM’s Tivoli, Sentilla, Cisco’s EnergyWise and Unified Data Center.
Demand-side energy management analysis services from OEMs or consultants which help IT professionals determine power profiles for data centers and other computing environments. Services and software that provides detailed data about energy usage patterns within data centers, along with information about energy consumption within the overall facility infrastructure.
SaaS – an alternative to reduce the amount of servers consuming energy in the data center providing applications services – also reduces carbon footprint but moves cost to another column.
Cloud computing - an alternative to reduce the amount of servers consuming energy in the data center providing applications services – also reduces carbon footprint but moves cost to another column.
Outsourcing –minimize your data center or eliminate it fully - move the cost to another balance sheet.
Various data center optimization services surrounding servers and storage to help customers achieve additional savings out of their existing data centers.
TABLE 2-7 STORAGE RELATED
Increasing volume of spinning disks systems is challenging the capabilities of the data center in reducing energy requirements for data storage.
The old adage “disk is cheap” may be true, but the energy to power and cool all that metal assuredly isn’t. Solid State Disk(SSD) / NAND flash storage to replace mechanical drives and the energy to keep them
spinning.
MAID - massive array of idle disks –approach to reduce power to keep only relevant drives spinning.
Joule heat resulting in increased use of SSD will need to be cooled.
Confusing performance statistics of the wattage consumed in a modern mechanical drive vs. SSD. Some reports have lower wattage at idle for mechanical and higher wattage at idle access of SSD.
TABLE 2-8 NETWORKING
Higher speed Ethernet resulting in greater energy consuming and heat generating ASICS, GBIC, SFP and XENPAC transceiver/interface modules.
Standards to reduce energy consumption at the MAC, PHY, PMD and port level.
Standard bodies approaches - IEEE 802.3az Energy Efficient Ethernet Task Force.
Power over Ethernet standards and proprietary efficiency methods.
Manufactures initiatives such as Cisco’s EnergyWise.
Energy efficient routers and switches – same approaches used in server technology space.
Pure optical routing and switching may have energy consumption components that produce heat to power the lasers and maintain larger routing tables, various protocol based layer 2-4 tables and higher OSI layer application states.
Video conferencing telecommuting to reduce energy use in building and carbon footprint yet there is still a cost to set up and manage, plus the same systems are being utilized at the data center.
Telepresence type systems - may not save money in some areas but reduces a site’s carbon footprint.

The Case for Thermoelectrics in the Data Center October 2009
9 © 2009 Applied Methodologies, Inc.
TABLE 2-9 OTHER GENERALITIES
Melt down of Morre and Amdahl’s Laws illustrating a gap between computing and energy efficiency that create additional waste at a cost to the enterprise.
Several reports depicting server computing performance increasing by some factor(report dependant) every x number of years. However, energy efficiency is only doubling in the same period resulting in data center energy costs increasing significantly year over year.
Ratio of embedded watts per dollar amount of hardware is increasing.
In certain geographies utilities are telling companies that they simply cannot supply any additional power. Data centers are forced to better manage what they already have or plan to move.
Trying to define the computational cost per watt – Finding that the “performance per watt” measurement is as much art as science.
Various statistics and reports about carbon footprints, emissions and recycling of old hardware.
Cost of electricity overtaking the cost of a data center device far sooner than the functional lifespan of the device.
Other harvesting technologies to co-generate energy such as Solar, Geothermal and Wind.
An industry adage states “that in most data centers for each Kwh of energy consumed by a server roughly another Kwh is used to cool it. Similar statements are “for every watt of power consumed 1 or 2 watts are used for cooling.” This may sound similar to a PUE result. PUE is covered in section 8. Another adage is “One watt of actual processing requires 27 watts of consumption from supporting systems.” According to one major manufacture, every watt of power an application uses on a server is backed by 27 watts of power associated with supporting that application in the data center for backing it up, storing it, cooling and so forth. If applications become more efficient, their processing impact on the hardware is reduced, even without the need for virtualization in some cases.
While the enterprise customer, the IT and energy industry plus the government continue to address the issues outlined in this section with their own unique methods, AMI has identified a niche area of science and technology that we believe its time has come to be utilized within the IT industry to assist in the goal of furthering the energy efficiency of the data center. The efficiencies would be gained via a harvesting and recycling process that lead to additional energy that has a value and contributes to the organization’s energy savings and ROI.
One known constant is that heat will always be present – First Law of Thermodynamics: Every watt of power consumed is converted to heat or mechanical work.
Perusing Intel’s (www.intel.com) CPU data sheets during the past few years illustrates the problem. A now-ancient 75MHz Pentium
didn’t use much more power than a night light, a mere 8W. A state-of-the-art, quad-core Core 2 Q6600 runs a blistering 105W,
while many high-end Athlon X2’s top that at 125W. Compounding the problem is dense 1U or blade server packaging, often with
two CPUs per server, putting more processors in each rack. The net result is that it’s not uncommon for server racks full of high-
density systems to consume more than 15kW, with projections upwards of 24 to 48kW per rack—translating to more than 4kW per
square foot—by 2010. Getting this amount of heat away from sensitive components before they incinerate is a significant
challenge. – Processor.com

The Case for Thermoelectrics in the Data Center October 2009
10 © 2009 Applied Methodologies, Inc.
3.0 The General Idea What if it was possible to reprocess or harvest the byproduct thermal energy (joule heat power in watts) generated from servers, routers, switches and any or all other data center power and computing devices and put it to work before it gets cooled by generating usable energy? Plus, at the same time not adversely affect the current cooling and thermal environment of the device. This harvested energy can now be used to power other devices in the data center or offset the power consumed from the grid. Now, this approach has been discussed and tested in the past from industry and academia and there are varying technologies, patents and papers outlining different methods to accomplish this but only on a micro and incomplete scale. The research AMI conducted resulted in the creation of an approach and system to crystallize this idea and that was to integrate Thermoelectric technology into all such systems in our own unique method then scale within and externally from the system. AMI has developed a system that harvests the waste energy in one form to produce energy in another form to help offset the cost of energy the data center consumes. However, before we can discuss what our prototypes, pre-production units, enterprise energy vision and future products can accomplish to assist in mitigating the “green” issues a data center faces a brief discussion on the topic of Thermoelectrics is warranted. If the reader is familiar with thermoelectric science and technology he/she can skip this section.
4.0 Introduction to Thermoelectrics
4.1 What is Thermoelectrics? To avoid confusion with our own verbiage about the topic of Thermoelectrics we shall provide a few paraphrased excerpts from our friends at Wikipedia, Tellurex, Nextreme and various others sources cited in the appendix, plus provide a few links for those interested in the technology. The discussion of Thermoelectric science and technology is exciting but, depending upon interest, can become tedious and time consuming so we shall try to keep things brief. More information about Thermoelectrics and our technology can also be found at www.amilabs.com/tgs.
4.2 Thermoelectrics - A Brief History Early 19th century scientists, Thomas Seebeck and Jean Peltier, first discovered the phenomena that are the basis for today's thermoelectric industry. Seebeck found that if you placed a temperature gradient across the junctions of two dissimilar conductors, electrical current would flow. Peltier, on the other hand learned that passing current through two dissimilar electrical conductors caused heat to be either emitted or absorbed at the junction of the materials. It was only after mid-20th Century advancements in semiconductor technology however that practical applications for thermoelectric devices became feasible. With modern techniques we can now produce thermoelectric modules that deliver efficient solid state heat-pumping for both cooling and heating; many of these units can also be used to generate DC power in special circumstances (e.g., conversion of waste heat). New and often elegant uses for Thermoelectrics continue to be developed each day.

The Case for Thermoelectrics in the Data Center October 2009
11 © 2009 Applied Methodologies, Inc.
A Thermoelectric effect is the direct conversion of temperature differences to electric voltage and vice versa. A thermoelectric module creates a voltage when there is a temperature difference on either side of the module. Conversely and, thermodynamically speaking, reversibly when a voltage is applied to it, it creates a temperature difference. At atomic scale (specifically charge carriers) an applied temperature gradient causes charged carriers in the material, whether they are electrons or holes, to diffuse from the hot side to the cold side, similar to a classical gas that expands when heated; hence, the thermally-induced current. This effect can be used to generate electricity, to measure temperature, to cool objects, or for heating or cooking.
Thermoelectricity (thermo-electricity, abbreviated as TE) refers to a class of phenomena in which a temperature difference creates an electric potential or an electric potential creates a temperature difference. In modern technical usage, the term almost always refers collectively to the Seebeck effect, Peltier effect, and the Thomson effect. Employing the effect which Seebeck observed, thermoelectric power generators convert heat energy to electricity. When a temperature gradient is created across the thermoelectric device such as a thermoelectric generator(TEG), a DC voltage develops across the terminals. When a load is properly connected, electrical current flows.
The work AMI is conducting has focused on exploiting the Seebeck effect to harvest energy from the temperature gradient between all the components in a data center device to generate electricity. Utilizing commercial and future state of the art Thermoelectric Generator Modules (TEGs) within a data center’s computing and power systems to harvest the waste heat that is present from the continual work these systems conduct, provides a source of energy for many uses as outlined in upcoming sections.
Solid-state thermoelectric devices have long been sought after as a solution for challenging thermal management and energy harvesting problems. The core component of a thermoelectric module is a thermocouple. A thermocouple consists of two dissimilar semiconductors (referred to as p-type and n-type to describe dissimilar electrical conduction mechanisms in the two materials) connected together by a metal plate. Electrical connections at the top complete an electric circuit. Thermoelectric cooling (TEC) occurs when current passes through this thermocouple, in which case the thermocouple cools on one side and heats on the other as per the Peltier effect. Conversely thermoelectric generation (TEG) occurs when the couple is put in a thermal gradient (i.e., the top is hotter than the bottom), in which case the device generates a current, thereby converting heat into electrical power as per the Seebeck effect. Schematic representations of these effects are shown in Figure 4-1.
Figure (4-1). Schematic representations of a PN-couple used as TEC (left) based on the Peltier effect or
TEG (right) based on the Seebeck effect.

The Case for Thermoelectrics in the Data Center October 2009
12 © 2009 Applied Methodologies, Inc.
4.3 Thermoelectrics - A Closer Look A typical thermoelectric module consists of an array of Bismuth Telluride semiconductor pellets that have are “doped” so that one type of charge carrier– either positive or negative– carries the majority of current. The pairs of P/N pellets are configured so that they are connected electrically in series, but thermally in parallel. Metalized ceramic substrates provide the platform for the pellets and the small conductive tabs that connect them. The pellets, tabs and substrates thus form a layered configuration. Module size varies and can be customized. Thermoelectric modules can function singularly or in groups with either series, parallel, or series/parallel electrical connections. Figure 4-2 below illustrates a basic two pellet/ingot module whilst figure 4-3 illustrates a multi pellet/ingot module to increase the generating capacity of the module. Figures 4-4 through 6 below provides illustrations of several different types of commercial Thermoelectric Generators(TEGs).
Figure (4-2). Figure(4-3).
Figure(4-4). Typical Seebeck based TEG. A thermoelectric module is made up of a number (n) of thermocouples
connected together electrically in series and thermally in parallel.
Figure(4-5). Examples of commercial bulk material TEGs of various sizes from Melcore and Tellurex.
Figure(4-6). State of the art nanotechnology and superlattice thin film based Thermoelectronics from companies
on the leading edge of nano scaled based technology. In order of left to right are the eTEG from Nextreme, the Thermionic/Avto Effect™ based power chip from Power Chips Plc and another Thin Film based TEG from Micropelt the MPG Thermogenerator.
The Case for Thermoelectrics in the Data Center October 2009
13 © 2009 Applied Methodologies, Inc.
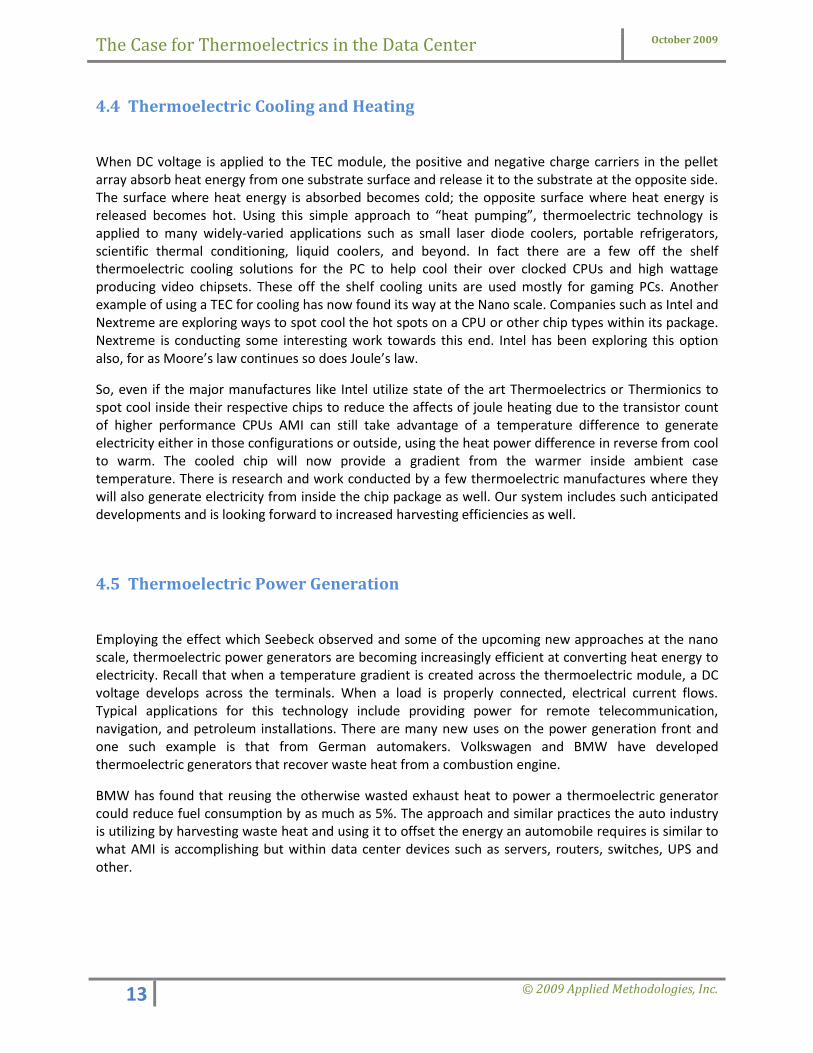
4.4 Thermoelectric Cooling and Heating
When DC voltage is applied to the TEC module, the positive and negative charge carriers in the pellet array absorb heat energy from one substrate surface and release it to the substrate at the opposite side. The surface where heat energy is absorbed becomes cold; the opposite surface where heat energy is released becomes hot. Using this simple approach to “heat pumping”, thermoelectric technology is applied to many widely-varied applications such as small laser diode coolers, portable refrigerators, scientific thermal conditioning, liquid coolers, and beyond. In fact there are a few off the shelf thermoelectric cooling solutions for the PC to help cool their over clocked CPUs and high wattage producing video chipsets. These off the shelf cooling units are used mostly for gaming PCs. Another example of using a TEC for cooling has now found its way at the Nano scale. Companies such as Intel and Nextreme are exploring ways to spot cool the hot spots on a CPU or other chip types within its package. Nextreme is conducting some interesting work towards this end. Intel has been exploring this option also, for as Moore’s law continues so does Joule’s law.
So, even if the major manufactures like Intel utilize state of the art Thermoelectrics or Thermionics to spot cool inside their respective chips to reduce the affects of joule heating due to the transistor count of higher performance CPUs AMI can still take advantage of a temperature difference to generate electricity either in those configurations or outside, using the heat power difference in reverse from cool to warm. The cooled chip will now provide a gradient from the warmer inside ambient case temperature. There is research and work conducted by a few thermoelectric manufactures where they will also generate electricity from inside the chip package as well. Our system includes such anticipated developments and is looking forward to increased harvesting efficiencies as well.
4.5 Thermoelectric Power Generation
Employing the effect which Seebeck observed and some of the upcoming new approaches at the nano scale, thermoelectric power generators are becoming increasingly efficient at converting heat energy to electricity. Recall that when a temperature gradient is created across the thermoelectric module, a DC voltage develops across the terminals. When a load is properly connected, electrical current flows. Typical applications for this technology include providing power for remote telecommunication, navigation, and petroleum installations. There are many new uses on the power generation front and one such example is that from German automakers. Volkswagen and BMW have developed thermoelectric generators that recover waste heat from a combustion engine.
BMW has found that reusing the otherwise wasted exhaust heat to power a thermoelectric generator could reduce fuel consumption by as much as 5%. The approach and similar practices the auto industry is utilizing by harvesting waste heat and using it to offset the energy an automobile requires is similar to what AMI is accomplishing but within data center devices such as servers, routers, switches, UPS and other.

The Case for Thermoelectrics in the Data Center October 2009
14 © 2009 Applied Methodologies, Inc.
New Samsung material uses wasted heat June, 2009
Samsung Electronics Co., the Korean electronics giant, said yesterday it had developed a new material that can transform waste heat into electricity.
The metallic compound in its crystalline form generates a thermoelectric phenomenon, allowing a temperature difference to create electricity, the company said. It added that the material is easy to produce and improves thermoelectromotive force by 80 percent.
The discovery, published in the latest issue of Nature magazine, is a breakthrough in high-performance thermoelectric materials, Samsung said. In the past decade, there have been renewed efforts to discover such materials, motivated by increasing demand for renewable energy.
If applied correctly, the material could utilize heat generated from mobile devices, automobile engines or factories, Samsung said.
“It is generally thought that by 2014 thermoelectricity will start to be commercialized in the automobile sector,” said Lee Sang-mock, a staff member in Samsung’s research division.
4.6 But How Efficient Is It?
Thermoelectrics however have traditionally resided in the lower scale of efficiency compared to other methods of waste heat harvesting. Thermoelectrics efficiencies are generally considered to be similar to that of solar photovoltics, in the 3-10% range. However, even with this current efficiency range substantial amounts of energy can be harvested from scaling approaches. Also, depending on our fuel source, energy can be generated for the lifetime of the source. One example is of photovoltics(solar) relying on atmospheric conditions and requiring an analysis that shows average amounts of sun light available in a region to estimate the amount of possibly harvested energy. Unless you are Google or own a massive amount of land in the desert for a solar farm you cannot fully exploit the sun as a harvesting source.
However, in AMI’s approach our fuel is the joule heat from all the heat sources inside a data center device(server, router, switch, et al.). Since these devices run 24/7/365 our approach ensures energy is harvested for the operational life of a system. Now remember that energy is consumed to run these systems in the first place but now we can gain some of that energy back and recycle it for other uses in the data center. The work has to be done anyway, otherwise there would be no enterprise data center, plus the heat has to be removed or cooled so why not put it to work before it gets removed or cooled and assist in generating energy to offset the required energy consumed.
The worldwide concern of energy consumption and the recognition that thermoelectric technology offers an environmentally friendly method of converting waste heat into electrical power has resulted in the commercially availability of modules designed for generation.
One recent news article from Samsung is an example of the importance of Thermoelectrics. Material science continues to make advances where materials and unique approaches in physics provides advances at the nano scale that also provide improved energy conversion efficiencies(in some studies and papers from TEG manufactures these efficiencies can run from 50 to 80%). If you wish to dig deeper into the study of Thermoelectrics you will encounter such terms as Figure of Merit(Zt), Carnot efficiencies and Seebeck coefficient(thermoelectric power or thermoelectric EMF). Today’s TEGs are efficient enough to produce usable energy when scaled and integrated properly. Also, with continual advancements and recognition from academia, industry and government agencies Thermoelectrics are a stable and valid technology to be utilized in the enterprise data center.

The Case for Thermoelectrics in the Data Center October 2009
15 © 2009 Applied Methodologies, Inc.
4.7 Benefits of Thermoelectrics
No moving parts higher MTTF
Long operating lifetime of unit, 100,000+ hours
System still operates even if TEG fails. Though some thermal resistance may be present this will be factored in design.
Low cost – the cost of commercial or future TEGs purchased at the OEM level for future products are well within the line of ROI and for NEG type economics
Easy to integrate into OEM designs for bulk material based TEGs
Scalable – depending on the device’s heat sources available to harvest from.
Customizable at the OEM level for enhanced efficiencies and design consideration.
4.8 Thermoelectric related links:
Some short and demonstrable video of Thermoelectrics in operation from two of many Thermoelectric manufactures. http://www.nextremethermal.com/pages/learning_center/videos/candle.shtml http://www.tellurex.com/videos/video_2.html
http://www.tellurex.com/videos/video_1.html
A fun video of kids using Thermoelectrics to solve the world’s energy problems http://www.youtube.com/watch?v=J_A-Av6zBAo&feature=related
General Thermoelectrics references http://www.tellurex.com/pdf/new/Intro%20to%20Thermoelectrics.pdf http://www.tellurex.com/pdf/new/Thermo%20Power%20Gen%20FAQ.pdf http://www.nextreme.com/pages/power_gen/power_gen.shtml http://en.wikipedia.org/wiki/Thermoelectric_effect http://en.wikipedia.org/wiki/Thermoelectricity http://www.dself.dsl.pipex.com/MUSEUM/POWER/thermoelectric/thermoelectric.htm
Thermoelectric Groups
International Thermoelectric Society: http://www.its.org/
Thermoelectric News: http://www.zts.com/
Note: Additional Thermoelectric related sources used for this paper are located in the appendix and at our website
www.amilabs.com/tgs

The Case for Thermoelectrics in the Data Center October 2009
16 © 2009 Applied Methodologies, Inc.
5.0 IT and Thermoelectrics The time is now for the IT industry to not overlook Thermoelectrics for its
untapped hidden benefits.
We believe that the time has come for the IT industry to recognize, utilize and integrate Thermoelectrics to capitalize on the increase demand of computing resources and waste heat generated for power generation in most of its devices. Devices that exhibit high amounts of joule heat range from standalone servers, densely populated blade and rack based systems, High Performance Computing(HPC) and supercomputing platforms, appliances, routers, switches and firewalls. Also, not excluding UPS systems, within a system’s power supply, power distribution and any form of heat or temperature gradient(hot or cold) generated due to computing or power distribution/transforming related work can also be utilized as a source of harvesting. And, let’s not forget all those redundant systems for the high availability critical applications either in the same data center or at a disaster recovery site providing fuel for harvesting. Just as the industry is going “green” by integrating energy efficient 80plus type power supplies, low voltage components, RoHS, recyclable components and executing the myriad of initiatives outlined in section two the same consideration towards thermoelectric integration should apply.
AMI has started on this course by developing a system to utilize Thermoelectrics to help address some of the data center power consumption issues outlined in section two. Our approach and system of utilizing thermoelectric technology helps us maximize and scale the Seebeck coefficient which leads to improved consumption to production efficiencies. AMI has developed data center devices(servers, routers and switches) that utilize the thermoelectric effect from commercial TEGs and developing state of the art in Thermoelectrics(Nano/Thin Film/MEMS) TEGs to generate electricity from the waste joule heat components. The energy generated has a monetary value to it and can be used to thus offset the amount and cost of energy required to conduct similar work in the data center.

The Case for Thermoelectrics in the Data Center October 2009
17 © 2009 Applied Methodologies, Inc.
6.0 Our Enterprise Energy Vision
AMI can envision a future where the data center not only runs efficiently by utilizing some or all of the methods and technologies discussed in section two but also generates energy to offset the cost of the energy it consumes. If every device(router, switch, server, mainframe or appliance) in the data center utilized Thermoelectrics as part of their system design and manufacturing standard, the data center is transformed into an energy generating power plant. These systems can, for their operational life, generate energy that would be included into a larger pool of capacity.
As a small conceptual example of our vision imagine a 1u server with Thermoelectric Generators(TEGs) integrated that generates 10 volts and 5 amps at current TEG efficiency levels. Now, this may not sound significant, however this one system is generating energy during its entire operational life which could be years. Using capacitance and other technologies to store this energy for other purposes at higher potential levels is one option of many for the applicable uses of this technology. Another is its recursive use. AMI is currently prototyping the approach to use some of the energy generated recursively. This individual server can re-use the energy it generates to reduce its own draw of power supplied from the local utility by a percentage. Equally this server can distribute the energy generated onto a power distribution network to scale the energy generated as a whole for other uses. These percentages in reduced power draw have a value to them and add up to realized savings which we shall demonstrate in section ten of this paper.
Now to go further, let us imagine hundreds to thousands of these 1u units all generating energy while they continue their work in a data center or multiple data centers. We can see the impact of scaling in terms of the amount of energy generated. This harvested energy has a value to it and can be applied to a form of ROI or savings. These same systems coupled with other “green” methods applied to them would still require some amount of power to operate and cool them. Plus, the same amount of joule heating byproduct would still be present, but now we can gain more value from that server than before in terms of energy savings. A further expansion of this vision is to have additional enterprise assets such as PCs and printers all generating energy, even if it was a small amount, during work hours and supplying this power to a distribution system in the building to apply it to other uses.
Of course a data center will not exclusively utilize 1u based systems but the many different platform form factors available. For example, one chassis of a blade server system may comprise more integrated Thermoelectrics than an entire rack of 1u servers due to the amount of densely packed components and heat sources in one chassis, so different platform form factors will have unique opportunities to exploit Thermoelectrics to its fullest.
While data center assets continue to work in their respective manner they are also co-generating energy with no impact to their operating condition. The energy generated from a data center’s devices can be used to offset data center power consumption costs and contribute to redressing some of the energy consumption issues listed in section two.

The Case for Thermoelectrics in the Data Center October 2009
18 © 2009 Applied Methodologies, Inc.
7.0 How Does It Work?
With the discussion so far about the issues regarding data center energy consumption, Themroelectrics and our idea and enterprise energy vision we would like to share how our work and vision applies by developing a solution that complements the many current practices employed today in data centers to reduce energy consumption costs.
AMI developed several data center prototypes to exhibit our point about the time and need for Thermoelectrics and how our system works. We created a prototype in 2007 dubbed the ThermoGreen Server™ and yes we used the word “green” back then as well. In fact we were mentioned in eWeek in 2007 touting our “green” product so we too are guilty of a little green sheen. Nonetheless, our prototype is a server that can not only comply with current energy efficient green standards but also generates energy in the process. We also developed a switch version and dubbed that the ThermoGreen Switch™ and a router version is currently in the process of being developed. Our prototypes were built using commercial TEGs from several TEG manufactures and various classes of servers from IBM, HP, Intel and other server OEMs. Our prototypes exhibited the approach of integrating TEGs into an existing OEM deployed system. The energy generated is DC based, meaning the TEGs operate as a DC source and can be directly applied to other DC based systems thus offering additional efficiencies.
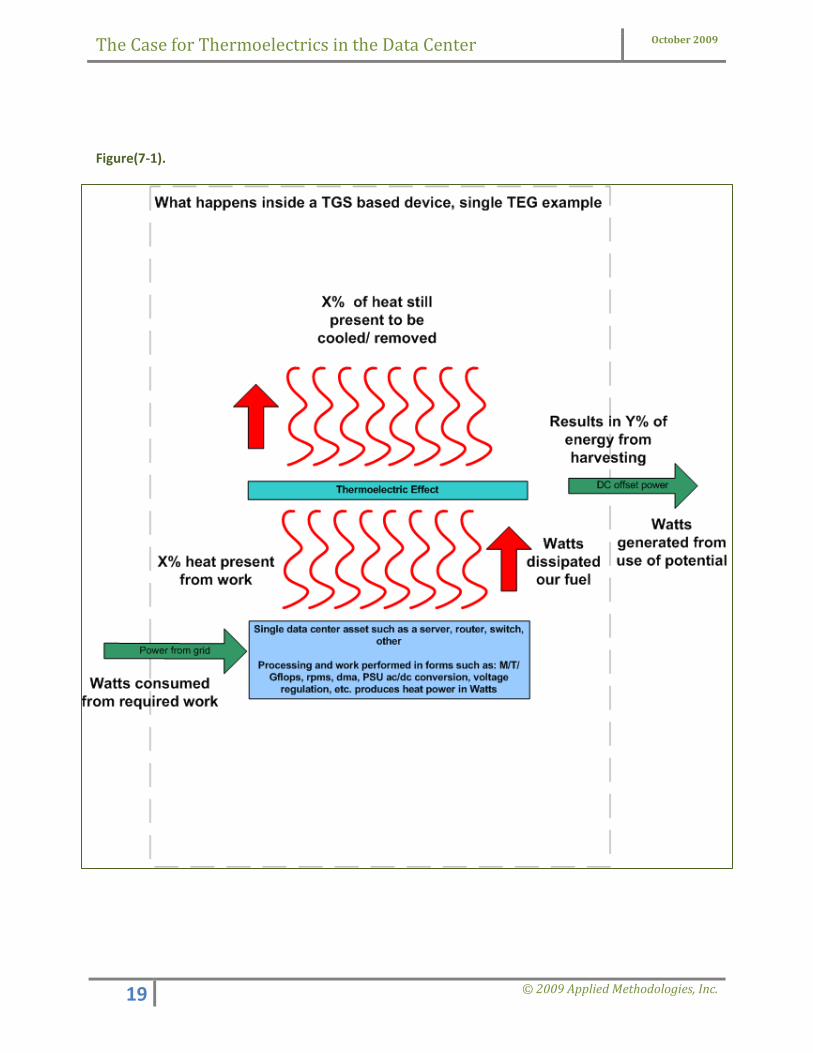
7.1 TGS(Thermoelectric Generation Systems) The systems we initially developed integrating Thermoelectrics are not optimized or engineered at the manufacturing facility level for greater harvesting efficiencies, yet even with the numbers presented in this paper from our raw prototype versions they are extremely promising. We are also working towards developing additional Nano/Thin Film based prototypes. From this point on we shall refer to any of our systems utilizing Thermoelectrics as a TGS. TGS stands for Thermoelectric Generation Systems(any data center device employing Thermoelectrics in its normal operation). Some examples of our nomenclature are “TGS server” or “TGS router” or “TGS based device”. The next few figures shall illustrate our vision and then we can delve into the value, ROI and how our approach and future systems contribute to help make the data center energy efficient by addressing some of the issues listed earlier in section two. Figure 7-1 on the following page illustrates a basic example of the mechanics and flow of a TGS based system. Additional details and videos will soon be available at our website www.amilabs.com/tgs. In this example Thermoelectronics are applied to a heat source in a data center server. The waste heat energy is used to generate DC energy on its path before being cooled. The energy generated exits the system for other uses. This approach can be scaled within a system to further increase generation capacity.
The Case for Thermoelectrics in the Data Center October 2009
19 © 2009 Applied Methodologies, Inc.
Figure(7-1).

The Case for Thermoelectrics in the Data Center October 2009
20 © 2009 Applied Methodologies, Inc.
Figure 7-2 illustrates our scaled vision of a thermoelectric based data center incorporating TGS based systems. In this example the data center assets were equipped with Thermoelectrics using our system from the OEM, thus creating a data center that generates energy to help offset the energy it consumes. Figure(7-2).
Our system is also pertinent to the densely packed blade server sub supercomputer or high performance computer(HPC) class type systems. For example, a startup company called SiCortex, has developed a smaller scale supercomputer for the enterprise. They even have their own benchmark dubbed “The Green Computing Performance Index”, which measures performance per kilowatt and gives SiCortex a score of about 70% thus surpassing IBM’s BlueGene/P, one of the most advanced supercomputer in the world.

The Case for Thermoelectrics in the Data Center October 2009
21 © 2009 Applied Methodologies, Inc.
Energy Returned on Energy Invested(EROEI)
EROEI = Usable Acquired energy / Energy Expended and its full definition and use can be found at: http://en.wikipedia.org/wiki/EROEI
Net Energy Gain(NEG) NEG = EnergyConsumable − EnergyExpended and its full definition and use can be found at: http://en.wikipedia.org/wiki/Net_energy_gain
Performance Per Watt(PPW) http://en.wikipedia.org/wiki/Performance_per_watt SPECpower http://en.wikipedia.org/wiki/SPECpower
SiCortex for example has three different types of machines, a desktop with 72 processors, a mid-range system with 1,458 processors and their largest unit with 5,832 processors. In one system one of the slide-out motherboards holds 162 processors. Can you imagine if a system such as this utilized our system and approach for integrating Thermoelectrics and the amount of energy that would be available? Or, even consider the IBM BladeCenter QS22 Cluster that was recently listed as the #1 “green” Supercomputer according to the Green500 with integrated Thermoelectrics? The potential to harvest the byproduct waste heat is always present. Also, our system can be applied to computing devices outside the data center such as those employed in a casino for example. Consider the rows upon rows of slot and virtual poker type machines operating 24/7/365 that can benefit from producing energy which will assist the casino in reducing its energy consumption costs. If you ever walked past the end of a row of such machines you can feel a high amount of heat emitted from them. These devices represent another untapped source of energy to be harvested and another market for TGS.
8.0 The Economic Impact of Thermoelectrics in the Data Center To fully understand the impact of utilizing Thermoelectrics in the data center is to understand its untapped hidden benefit in terms of ROI. There are several models and metrics used across several industries to help in determining some form of economic gain in relation to energy consumption, efficiencies applied and monetary savings. We list some of them here for you to review online to only provide a context as to where our system can or cannot tie into these models or metrics. There are several energy industry economic based ROI models to reference, such as Net Energy Gain(NEG) or Energy Returned on Energy Invested(EROEI) to name two.
Plus, there are several from the computer industry’s standpoint, Performance Per Watt and SPECpower.
The Green500 is a twice-yearly ranking of the most energy-
efficient HPCs around the globe. The list, which measures
megaflops (the number of computing operations per second)
per watt used, parallels the Top500, a list of the most
powerful HPCs regardless of energy use.

The Case for Thermoelectrics in the Data Center October 2009
22 © 2009 Applied Methodologies, Inc.
Power Usage Effectiveness(PUE) PUE = Total Facility Power/IT Equipment Power and its reciprocal, DCiE is defined as: DCiE = 1/PUE = IT Equipment Power/Total Facility Power x 100% The Green Grid’s metrics document can be located at:
http://www.thegreengrid.com/~/media/WhitePapers/White_Paper_6_
-_PUE_and_DCiE_Eff_Metrics_30_December_2008.ashx?lang=en
Concerning data center energy consumption as a whole, the widely adopted industry metrics from the Green Grid - Power Usage Effectiveness (PUE) and its reciprocal the Data Center infrastructure Efficiency (DCiE) are referenced to help corporations in determining the energy efficiency of a data center.
You may be considering how does our approach and system show some form of ROI or benefit resulting from the energy generated over an already purchased and used amount of energy consumed? Since additional energy is required to cool the byproduct energy released from the work a system is normally conducts and even with all of the efficiencies, approaches and products outlined in section two applied, it is a known fact of life that joule heat will always be present from work conducted in a system and we can further exploit this result to achieve some gain through harvesting.
Even with the many metrics and formulas surrounding energy efficiency it can become confusing as to what to use to determine efficiency or monetary savings gains. For example, you may be considering from what has been presented thus far, “how does our approach contribute to a Net Energy Gain, SepcPower, PPW or the Green Grid’s PUE.” For perspective we provided an example for NEG and the Green Grid on the following pages.
The economics of energy has become a major consideration for IT. Our contribution is this, if we can
reduce the consumption from the grid by utilizing a harvesting technology (Thermoelectrics in our case)
then we can contribute in a our own unique way to addressing some of the energy issues outlined earlier
in section two of this paper.

The Case for Thermoelectrics in the Data Center October 2009
23 © 2009 Applied Methodologies, Inc.
From Wikipedia: Net Energy Gain (NEG) is a concept used in energy economics that refers to the difference between the energy expended to harvest an energy source and the amount of energy gained from that harvest. The net energy gain, which can be expressed in joules, differs from the net financial gain that may result from the energy harvesting process, in that various sources of energy (e.g. natural gas, coal, etc.) can be priced differently for the same amount of energy.
A net energy gain is achieved by expending less energy acquiring a source of energy than is contained in
the source to be consumed. That is, NEG = EnergyConsumable − EnergyExpended
Factors to consider when calculating NEG is the type of energy, the way energy is used and acquired, and the methods used to store or transport the energy. It is also possible to overcomplicate the equation by an infinite number of externalities and inefficiencies that may be present during the energy harvesting process, which may be our case.
We can define the Energy consumable as a unit of power that can be consumed for work, a watt for example. The Energy Expended side of the equation can use different sources. Either the total power into the power supply (in watts) resulting from the work performed exiting from the heat source or the power present in watts that actually exited the heat source for us to harvest. The consumable is harvested by a byproduct of other work and not from work performed exclusively to harvest the consumable in the first place(TEGs are passive in operation as opposed to oil drilling).
In retrospect one can look at this in several ways:
NEG can be deemed positive with a system such as ours since we are harvesting energy in a passive state, thus requiring virtually little to no energy to be expended to obtain the harvested consumable. Our system will always produce a positive NEG for the energy expended was already allocated for other work(Mflops, RPMs, etc).
However, if we use the overall power required for the entire system or the power required to power each component that provides the TEGs their fuel(watts) internally and include those sources as the Energy Expended component of the formula then it could be construed that our system does not contribute to an overall NEG. But that point too can be up for scrutiny. Yet, if we apply the recursive application of our system(submitting some or all of the harvested energy to assist in the initial work that produces our fuel in the first place we can improve upon our NEG. Also, if you really want to be a purist for the equation, include the economic factors to extract and manufacture the materials to produce a TEG and the energy to integrate it into a system and include the same process to get that power from the oil field to the grid and from the grid to the system’s power supply and the numbers can become even more confusing.
From a PUE perspective if we were to take the entire amount of energy produced from a thermoelectric based data center and factor that amount into the PUE would that help reduce the PUE rating? Theoretically yes, no different than other data centers utilizing Solar based sources to help in their PUE rating. But how do you classify and value the energy our system produces to factor it into something like the PUE as well? Or, how do we classify the energy generated and apply some form of value to it so the benefits of Thermoelectrics can be realized in the data center from a business model standpoint? We will answers these questions in the following sections.

The Case for Thermoelectrics in the Data Center October 2009
24 © 2009 Applied Methodologies, Inc.
How, do we quantify our gains? As a unit of power and assign a value to it to and then run numbers through several ROI models or do we quantify it via some efficiency metric in terms of the unit of our gain thus improving the metric’s rating for the data center? We will answer this question shortly with our own classification.
8.1 TOE(TGS Offset Effect) We decided to draft our own classification and model, we call it the Thermoelectric Generation System Offset Effect or TOE. We did this to define the qualitative(the what) over the quantitative(the how much) effect our approach and system may have to assist in reducing data center energy consumption. The Thermoelectric Generation System Offset Effect(TOE) is the culmination of the offset energy generated from a system with Thermoelectrics integrated into it. Our earliest lab work had TOE defined as the TEG Offset Effect but that was based on a single TEG and it basically mirrors a TEG’s figure of merit. Since our approach employs many different TEGs each operating against different heat sources, various figure of merit are needed to track their efficiency. So, we needed to classify the effect of our system as a composite of all the TEGs merits in the system. The TOE can be summed up as the consumption to generation ratio of a TGS device(server, router or switch). Based on system design, the number of TEGs integrated, type of TEGs and the type of circuit employed will result in a different TOE per TGS device.
Figure of Merit or Zt
A figure of merit is a quantity used to characterize the performance of a device, system or method, relative to its alternatives. In engineering, figures of merit are often defined for particular materials or devices in order to determine their relative utility for an application. In commerce, such figures are often used as a marketing tool to convince consumers to choose a particular brand.
Thermoelectric Generation System Offset Effect (TOE) Definition: T - O - E Pronounced as spelled “toe” as in the toes on your feet. (Thermoelectric Generation System or TGS) Offset Effect - noun 1. TGS – an Information Technology device, such as a server, router or switch that generates electricity from waste heat. - noun 2. Any computer system, UPS, power supply, power distribution system or any data center device that harvests power in one form and converts it into another. Offset - noun 1. Something that counterbalances, counteracts, or compensates for something else; compensating equivalent. One thing set off or developed from something else. Energy set off from work. Effect - noun 1. Something that is produced by an agency or cause; result; consequence Any result of another action or circumstance

The Case for Thermoelectrics in the Data Center October 2009
25 © 2009 Applied Methodologies, Inc.
Considering that the typical data center IT asset is a dual consumer of power per device, that is for a watt consumed for the IT asset to conduct the work in various forms such as CPU calculations, hard disk seeks/reads/writes, memory, chipset activity et al., another watt or more of power is required (depending on the PUE) to remove the joule heat resulting from the work conducted by that initial watt. There is a cost associated to each watt consumed for its relative purposes (work and cooling). A TOE based system can offset this cost from either side of the consumption rates. This offset is not an exact consumption to generation ratio but when scaled within and outside a system it can still provide a significant savings which we shall demonstrate in the following section. The TOE is the energy produced from work performed inside a system where the TGS consequently produces usable energy. This energy can be used to offset the grid supplied energy required for the system to conduct its work or for other uses in the data center such as supplement some of the energy required for cooling or powering other IT devices. The TOE can be scaled by combining the TOE from each TGS based device to achieve higher levels of energy production to offset increasing data center power consumption over time. We therefore classify the qualitative as the TGS device and the quantitative as the TOE output. Remember the TOE energy produced is DC based, for data centers considering DC based devices this bolds well for additional efficiencies. Yet, even with the loss due to rectification to AC there is still a gain in available off grid energy that was not present for use before. Figure 8-1 below (which is somewhat similar to Figure 7-1. on pg. 19) depicts the basic TOE from the perspective of an input to output process. Figure(8-1).

The Case for Thermoelectrics in the Data Center October 2009
26 © 2009 Applied Methodologies, Inc.
Function/functional states: These states were derived from our lab prototype models, enterprise production models may operate in one or both of the states depending on requirements. System usage models: Oscillated generation state: In this state the TOE is variable based on the amount of work a system performs. The busier or “hotter” a system runs, the greater the TOE. If the system oscillates in its daily duty cycle the TOE will oscillate as well. Constant generation state: In this state the TOE is regulated regardless of the system’s workload for a consistent TOE. A system at 30% or 80% utilization will generate the same amount of energy. Various data center power efficiency approaches can affect the two states to either increase or decrease the TOE. For example: Power monitoring and throttling systems that monitor a system’s components power usage to reduce the amount of energy required or shutting them down altogether during idle periods.
8.2 TOE Models – TOE harvesting ratio based on current TEG
technologies: Current TOE n:n - for every watt consumed by the entire system or produced as joule heat as our fuel a percentage TOE watt is generated. As you will see in some examples the left portion of the ratio can increase as well for this is our power supply unit(PSU) consumption or post work joule byproduct watt. Depending on the system’s configuration a higher TOE percentage to match the consumption to generation ratio can be achieved. For example, with a TOE ratio of 3:1 – for every 3 watts consumed or produced in joule heat 1 TOE watt is produced. The percentage can be realized when we don’t exactly match the input consumption watt. For example a TOE ratio of 2:50% or 2:0.5 - for every 2 watts consumed half a watt is produced. Ideal TOE 1:1 - for every watt consumed by the entire system or produced as joule heat as our fuel a TOE watt is generated. As advances in thermoelectric science, materials and products improves so does the possibility of getting close to this ratio.
However, there is no such thing as a perfect engine so some inefficiency will always be present. Nonetheless, improvements in thermoelectric efficiencies will help us get close to an ideal TOE.

The Case for Thermoelectrics in the Data Center October 2009
27 © 2009 Applied Methodologies, Inc.
Variations of the TOE concept will be present based on system design, its function, plus the number and type of TEGs utilized. For example, take two TGS based systems equally configured in terms of power supply, memory, processor(s) and running the exact applications but, one has 6 TEGs integrated and another has only 3 TEGs integrated. These two systems will generate different amounts of TOE energy. However, now consider the same two TGS systems again configured identically and this time utilizing the same number of TEGs integrated but one system is using commercial bulk material TEGs and another is using advanced Nano/Thin Film scale type TEGs. These systems too shall produce different amounts of TOE energy. One other example would be from our recursive approach. A single system uses (draws) 500 watts from the power grid. The TOE generates 100 watts of additional energy thus resulting in a TOE ratio of 5:1 or 500:100. Next, the 100 watts is fed back into the same system to assist in satisfying the required consumption of 500 watts the system needs. The 100 watts is supplied in time with the same 500 watts but at an earlier point in the PSU and the feedback circuitry reduces the draw from the grid so less than 500 watts is drawn from the grid. All things being equal for a simple correlation we shall assume that with the presence of the 100 watts generated the draw supplied will now be reduced by 100 watts thus resulting in an overall draw(from the grid) of 400 watts for this single system. This reduction in draw results in a measurable savings. This is a simplistic view of the intricacies involved in our recursive approach that deals with numerous aspects of switching mode power supply designs. Further details about our recursive approach and its gains will be covered in another paper. Further improvements in Thermoelectric materials science will provide increased Figure of Merit per TEG and improvements upon Carnot efficiencies which shall lead to additional products that provide higher TOE gains that result in an increased ROI for our type of systems used in commercial data centers.
You may have read about a trend or come across an analysis report outlining the fact that the power to operate a server will exceed the server's CAPEX cost especially as the cost of energy rises. The cost to power the server exceeds the actual CAPEX cost of the server in a shorter time period before the life expectancy of the server ends. The presence of TOE energy helps slows this process. As an example take a 1u 500 watt server, at a national average of 11.5 cents per kWh with 1 kW costing $1,000 per year, over a three-year period, this 1u 500 W server can cost $3,000 or more just in energy consumption. Plus, since many of these small servers cost less than $3,000 it is understandable that it will cost more to power the device over its lifetime than its CAPEX to own or worse lease it. The same principal applies to blade and other highly dense server platforms. The TOE is apparent as long as the TGS based system is conducting work or even when it is in an idle state. A system in the form of a router, switch or any platform type of server can run indefinitely until it needs any required maintenance (swapping drives, interfaces, memory, etc.). During its mean time TOE is present.

The Case for Thermoelectrics in the Data Center October 2009
28 © 2009 Applied Methodologies, Inc.
9.0 SCALING with TGSx What has been discussed thus far regarding a TGS device has centered on how a single TGS device produces TOE energy and its qualitative properties. With this basic understanding of how a TGS device in the data center can produce energy which can be applied to other uses to offset the need for increased amounts of grid based energy for those similar other uses, we can now delve into the scaling and quantitative aspect of our system and approach. You can also think of each TGS device as a power source, just like batteries, or a generator and scale in many different configurations (parallel, serial, other advanced power source circuit types) that offer the most power production and distribution efficiency. This basically is what a TGS device operationally resembles, a generator or heat pump. Unlike a battery whose chemical composition only provides a certain amount of finite potential power for a certain amount of time, a TGS based system will continue to harvest and generate energy for its operational life. How do we quantify the power generated from multiple TGS devices? Well, we developed our own
scaling exponent dubbed TGSx to help us quantify TOE scaling from multiple TGS devices. The following
pages provide a definition and examples of TGSx

The Case for Thermoelectrics in the Data Center October 2009
29 © 2009 Applied Methodologies, Inc.
Thermoelectric Generation System Scaling Exponent (TGSx) Definition: The multiplicative scaling of systems producing TOE in a data center. This definition can be interpreted and applied individually or simultaneously in one of two manners below:
1. “The number of TGS based servers required to be operational to generate usable or surplus TOE power to power another TGS or non TGS device completely off grid.”
Since our system can be applied in various types of platforms and form factors the above definition may also be applicable to a series of like configured TGS devices in a data center or unlike configured TGS devices.
2. “The number of TGS servers required to be operational to generate usable or surplus TOE power to achieve a measurable ROI.”
These figures will vary depending upon the cost of energy and consumption levels for each data center. These values are subjective to the environment the TGS devices are employed, their usage levels, TOE model level and the definition of ROI for the company. Definitive numbers can be reared once our products are available with TOE ratings. IT management can then utilize the scaling exponent to determine their ROI level achieved. For a basic example we outlined our scale using TGS servers which can be site dependant.
TGSx
TGS5 ROI achieved after 5 TGS servers are deployed is:
TGS10
ROI achieved after 10 TGS servers are deployed is:
TGS20
ROI achieved after 20 TGS servers are deployed is:
TGS30
ROI achieved after 30 TGS servers are deployed is:
TGSx ROI achieved after x TGS servers are deployed is:
Function/functional states: Oscillating or constant generation type TOE based systems can mutually scale.
The TGSx
scaling approach can be utilized in one or two manners depending on the TGS product used and
amount of planning involved for deployment. There is the “Strict Scaling Conformity” approach defined as: “for every pre-defined number of TGS devices a defined number of other devices can operate or a defined ROI is achievable.” Then there is the “Loose Scaling Conformity” approach defined as: “where any undefined number of TGS devices provides the opportunity for an undefined number of other devices to operate or an undefined level of ROI is achieved.
It should also be noted that the numbers stated in this paper regarding ROI and our generation levels are from our raw prototype units that are not optimized to take advantage of the thermoelectric effect fully, for this can only be done at the manufacturing level. Also, recall that all of our numbers for volts, amps and watts are based on DC power. Our initial testing and prototype scaling work utilized a basic series source circuit to scale our voltage levels. The graphs and ROI numbers in the following section are based on this type of configuration.

The Case for Thermoelectrics in the Data Center October 2009
30 © 2009 Applied Methodologies, Inc.
The scaling levels achieved will have distinctive valuations based on the defined ROI and amount of TOE energy generated by platform. The following table outlines some examples to give you an idea of its applicability.
TGSX Scaling Examples
TGS5 = an ROI is achieved after 5 TGS servers are deployed and now a sixth TGS server is supplied off
grid TOE power from the 5 TGS servers employed.
TGS10 = an ROI is achieved after 10 TGS servers are deployed and now an 11th and 12th TGS server is supplied off grid TOE power from the 10 TGS servers employed.
TGS10 = an ROI is achieved after 10 TGS servers are deployed and now an 11th TGS server is supplied off
grid TOE power from the 10 TGS servers employed. Of course this ROI is not as positive as the previous example given from TGS10.
TGS20 = an ROI is achieved after 20 TGS servers are deployed and now three Cisco DC routers are
supplied off grid TOE power.
TGS50 = an ROI is achieved after 50 TGS servers are deployed and now provide half the energy previously required from the grid to charge a UPS system that supports the enterprise mail servers.
TGS100 = an ROI is achieved after 100 TGS servers are deployed and now provide the wattage to help power the data center’s cooling system which reduces the draw from the facilities feed into the data center.

The Case for Thermoelectrics in the Data Center October 2009
31 © 2009 Applied Methodologies, Inc.
Figure 9-1 below illustrates the concept of TGSx scaling.
Figure(9-1).

The Case for Thermoelectrics in the Data Center October 2009
32 © 2009 Applied Methodologies, Inc.
The following graphs depict some scaling estimates from our lab’s prototype TGS servers. The first graph(1) depicts our scaling base of 1 TGS server providing 10v then scaling by every 5 servers to reach 500. In this example all of the TGS servers are connected electrically in a series configuration to provide their sum of TOE potential continuously during their operation. TGS servers can also be connected in various parallel or series parallel configurations for optimal voltage and current needs.
The second graph(2)shows the same TGS series source scaling reflecting Ohm’s law for power - (P = E 2 / R) E=Volts and R is our
resistance at .5 Ohms. Our TGSx is base 5 and our output voltage per TGS is 10v.
The higher the number of TGS type devices employed in the data center results in higher amounts of TOE energy present for a multitude of purposes and helps in reducing the amount of required energy consumption from the grid. The ROI is achieved by employing TGS based devices to produce the TOE energy. The energy the TGS device produces has a value and that value can be represented as a savings. The TOE is always present in our type of system for its production life. TGS based devices can assist in keeping power usage levels below the power consumption baseline defined by the data center’s manager or outside standard by reapplying the TOE energy. The TOE energy generated can be applied directly to DC based systems to achieve further efficiencies in the data center. And it is possible to have a DC based data center generating TOE DC to help offset its own power consumption costs. Our system would also work with the supercomputer class systems such as IBM’s Roadrunner and BlueGene systems or the Pleiades, the world’s fourth fastest supercomputer. NASA’s Pleiades supercomputer has 51,200 processor-cores and is capable of 609 trillion floating point calculations per second. NASA uses it for projects such as ocean and atmosphere climate change modeling, space vehicle simulations and models of dark matter as some examples. Can you imagine our system applied to such a supercomputer(that would be one quite large TGS) and the amount of TOE energy produced?
GRAPH 1
GRAPH 2

The Case for Thermoelectrics in the Data Center October 2009
33 © 2009 Applied Methodologies, Inc.
10.0 The Monetary Value Our System Provides
Up until this point we have presented our case for Thermoelectrics in the data center by outlining the energy related issues present in the data center, our vision, technology used, approach and a brief overview on how our system of producing energy in the data center to offset the cost of energy from the grid can help an enterprise data center reduce its energy consumption. You have read how a TGS based system/device can produce the TOE energy and then how the TOE energy can be increased by scaling the amount of TGS type systems employed in the data center. We shall now discuss the TOE economics and the value of the TOE energy produced and how it pertains to a corporation’s ROI in the form of hard savings. Since we determined how to quantify all of the energy generated by our TGS devices via scaling we must also determine the value of this energy so we can forecast a ROI. By applying a monetary value to the energy generated we can calculate the value of same energy and that value can be applied to various ROI or TCO models. We used the cost of electricity and the price per kWh of .11¢ as our baseline. The U.S. national average retail price changes and usually ranges between 11-12.5¢ according to the DOE. Prices vary depending upon the region of the country. For example, as of this writing, the average price of electricity according to the DOE for New York is 15.22¢. You can find the current national average cost of electric power per kwH at: http://www.eia.doe.gov/fuelelectric.html Links to energy calculators are available in the Appendix or at www.amilabs.com/tgs for your use to plug in our TOE values to determine the value of the TOE energy in your region. The following set of tables outline the different monetary levels of value from the TOE energy generated. We illustrate how our scaling approach can achieve significant savings by providing two tables per TGS model. The first table shows the value of our system by scaling TGS based systems linearly with all TGS systems connected to one power distribution network to combine all of the individual TGS system’s generated energy. The second table per TGS model just shows the value per the individual TGS or per individual TGS group of servers for a non scaled perspective. The first table in each model class shows you how scaling can achieve significant savings. Our first pair of tables will exhibit the results from our worst case lab prototypes. What we mean by “worst case” is these systems are not optimized to harvest and generate the amount of energy up to the TEGs potential so our TOE is low. However, one can see that even with worst case numbers attained it is evident that scaling can realize a significant savings. Our lab prototype platform is a 1u rack based server and our scaling numbers are based on this platform type.

The Case for Thermoelectrics in the Data Center October 2009
34 © 2009 Applied Methodologies, Inc.
In table 10-1 we are referring to our worst case lab prototype 5 volt model. The table below represents the amount of TOE energy generated per system and then scaled. The amount of TOE energy increases proportionally as the amount of TGS based servers come online. For example, when 100 TGS based servers are online they generate 50,000 TOE watts and 50 kWh with a value of $132.00 a day at the DOE price of .11¢ a kWh. After a year of use these same 100 servers could generate enough TOE energy valued at $48,180.00. That is $48k of energy that can be put to work in the data center that is not consumed from the grid and a monetary expenditure to the enterprise.
Table 10-2 on the following page uses the same 5 volt worst case model and TGS server model as in table 10-1. However, our groupings are individual based. Meaning these numbers reflect a scaling per individual server and not a linear progression of TGS servers coming online as in table 10-1. For example, one individual TGS server of this model type generates only enough TOE power valued at $4.82 a year (at the same .11¢ kWh DOE rate). Following our previous example of 100 servers from table 10-1, 100 TGS servers individually generating their TOE at $4.82 a year would only provide a total TOE valued of $481.80. We provided this table to give you a perspective on how each individual TGS server contributes to the overall ROI when scaled properly as shown in table 10-1. Each server can achieve savings individually as outlined in table 10-2, but since each TGS server isn’t providing their TOE energy to a greater energy pool the monetary value of the individual sums of TOE energy is lower. We also provided a forecast of the TOE energy based on the operational lifespan of a typical server in table 10-2. So, for example, by the 4th year of production life, that same worst case individual TGS server only generated enough TOE energy valued at under $20.00 when not combined. This of course is nothing to get excited about, and, even with 100 such servers, the individual value of the TOE energy is under $2k after four years of production life. Yet in these economic times $2k is $2k. As you can observe the true value is in the scaling approach. However, we can do better.
TABLE 10-1

The Case for Thermoelectrics in the Data Center October 2009
35 © 2009 Applied Methodologies, Inc.
TABLE 10-2
Better In table 10-3 we show the results from our low end pre production models. The amount of TOE generated energy is greater due to lower internal resistance of our system thus providing more power. Using the same example from Table 10-1, when 100 TGS based servers are online they generate 125k of TOE watts and 125 kWh with a value of $330.00 a day at the DOE price of .11¢ a kWh. After a year of use these same 100 servers could generate enough TOE energy valued at $120,450.00. As you can see, the value of the TOE energy also increases proportionally with the improved generation capability.
TABLE 10-3
Table 10-4 on the following page represents the individual TGS grouping version of Table 10-3, as compared to table 10-2’s individual ROI numbers. Following our previous example of 100 servers from table 10-3, 100 TGS servers all individually generating their TOE valued at $12.05 a year would provide a total TOE value of $1,204.50 in one year of production when not combined. We can do much better.

The Case for Thermoelectrics in the Data Center October 2009
36 © 2009 Applied Methodologies, Inc.
TABLE 10-4
Much better Table 10-5 represents the further optimized version of our servers. The High End 10 volt model server would be fully optimized at the manufacturing level to achieve a higher overall Figure of Merit which relates to an increased amount of TOE energy generated. To stay with our 100 server example from previous tables, when 100 TGS based servers are online they generate 500k of TOE watts and 500 kWh with a value of $1,320.00 a day at the DOE price of .11¢ a kWh. After a year of use these same 100 servers could generate enough TOE energy valued at $481,800.00. Again, the value of the TOE energy also increases proportionally with the improved generation capability.
Table 10-6 on the following page shows the individual grouping results of the 10 volt model as compared to the previous individual groupings table of TGS servers (Tables 10-2 &10-4). One hundred individual 10 volt model’s TOE valued at $48.18 would provide a total TOE value of $4,818.00 when not combined in one year of production. We can do much, much better.
TABLE 10-5

The Case for Thermoelectrics in the Data Center October 2009
37 © 2009 Applied Methodologies, Inc.
TABLE 10-6
Much… much better Table 10-7 represents the future potential ROI from our type of system based on advances in Thermoelectrics. With advances in material sciences the Figure of Merit and Carnot efficiencies of Thermoelectric components improves thus providing us greater energy consumption savings. Here we outline a 20 volt model that when scaled can generate significant TOE energy levels and higher ROI values. Using our 100 TGS server example at this model level, when 100 TGS based servers are online they generate 2 million TOE watts and 2000 kWh with a value of $5,280.00 a day at the DOE price of .11¢ a kWh. After a year of use these same 100 servers could generate enough TOE energy valued at $1,927,200.00. The future of Thermoelectrics provides the potential TOE values to increase resulting in increased ROI savings.
TABLE 10-7

The Case for Thermoelectrics in the Data Center October 2009
38 © 2009 Applied Methodologies, Inc.
Table 10-8 depicts the individual grouping results of the future 20 volt model, as previously compared to the previous individual grouping tables, 100 TGS servers all individually generating their TOE valued at $192.72 a year would provide a total TOE valued of $19,272.00. TABLE 10-8
You must also remember that these numbers represent just one class and model of TGS devices, 1u platform type servers. Other TGS devices, which will achieve different TOE generation results, will also be present in the data center. Consider your data center’s routers, switches, firewall, UPS systems and various function specific appliances all generating energy alongside your servers to help offset the cost of energy to power or cool those same devices in the first place. Our systems contribute to a data center’s ROI over the life of the system assuming the average life of a server is 4-5 years. Recall that during the MTBF or MT of TGS based system TOE energy generated would equal a cost savings of the energy required to be spent someplace else in the data center. (Of course the fluctuating cost of energy during the same time period would provide different results). The value of the TOE energy can help reduce the total cost of system ownership. The benefits from the presence of harvested energy and its value outweigh any additional initial per device or whole rack system installation cost and the use of a rack based power distribution system to connect TGS device TOE leads into the power distribution system. When it comes to purchasing requirements, the top ranked “green” feature was power consumption; the lowest was carbon emissions from manufacturing. Does this mean that our approach and system should be considered as a “green” feature? The tables in this section showcase the tremendous potential Thermoelectrics has to assist in reducing data center energy consumption costs. What we do not illustrate in this paper are the details and examples of our recursive based systems. Information about our recursive systems will be forthcoming soon in another paper and/or on our web site.

The Case for Thermoelectrics in the Data Center October 2009
39 © 2009 Applied Methodologies, Inc.
11.0 Our Contribution Recall from section two the many energy consumption issues relating to the data center plus the approaches the government, IT and energy industry were undertaking to address them. Such issues were outlined to provide you a viewpoint on the magnitude of problems corporate enterprises’ face when dealing with energy consumption. We shall revisit them here to illustrate some examples of our contribution to addressing such issues by applying our approach and system of integrating Thermoelectrics into the data center. We outline in table 11-1 what our system and approach’s potential capabilities are to assist in solving data center energy consumption issues. TABLE 11-1
Our systems meet energy efficiency compliance standards such as EnergyStar, RoHS, 80plus et al. while also producing TOE energy.
Complements enterprises IT energy conservation and environmental efforts.
Complements the many best practices in the industry from the DOE, EPA and Green Grid.
Complements data center energy efficiency initiatives by producing TOE energy to reduce consumption.
Assists in providing positive efficiency metrics results by producing TOE energy to be reused.
Reduces overall data center energy consumption and cost if TOE energy is reapplied. Savings can help reduce the cost of fuel or fuel delivery surcharges commonly applied to utility bills.
Reduces cooling costs by applying TOE energy to assist in powering cooling systems.
Works with all cooling methods and approaches, hot/cold aisle or liquid to generate TOE energy.
Reduces power consumption to charge UPS systems by applying TOE.
Works with other alternative energy sources such as Solar and Wind, TOE can be supplied in line with DC from Solar and Wind.
Provides migration path to DC based data center and use of DC based devices.
By moving to an all DC based data center, reduces issues surrounding real/reactive/apparent power, PFC, and PSU efficiencies and mean time.
Complements low hanging fruit efficiency methods. Newer TGS based systems can provide enough TOE power to offset cost of keeping older, not directly ready for de-commissioning units running, until IT staff can remove data and applications.
Provides improved computing power per watt due to TOE economics.
Mitigates costs resulting from server sprawl, especially if unavoidable. Energy costs attached to sprawled servers are now reduced from available TOE energy.
Works with blade and consolidated platform form factors.
Can be integrated into mainframe systems.
Can be integrated into HPC and supercomputer class systems.
Complements savings from virtualization methods.
Works with SSD and NAND flash storage systems to harvest energy.
Complements MAID subsystems to harvest energy.
Complements router, switch and networking device energy efficiency efforts.
Works with high speed networking components to harvest energy from XENPACS, GBICs and ASICs.
TOE power can be used to assist in providing Power over Ethernet (POE) IEEE 802.3af/at.
Complements or eliminates the need for the integration of IEEE 802.3az - Energy Efficient Ethernet.
Offsets power consumption costs from higher power drawing CPUs, ASICS and other chipsets.
Mitigates or complements the need for complex power throttling solutions.

The Case for Thermoelectrics in the Data Center October 2009
40 © 2009 Applied Methodologies, Inc.
Works with all data center power systems and future systems utilizing 208/415v.
Can be rectified to AC power if required though efficiency will be reduced, increased scaling can compensate.
Works with advanced cooling technologies within a device at the chip level.
Works with low voltage components.
Mitigates need to sacrifice application performance from coding practices to save a watt over transaction speed. Keeps the efficiency in hardware - no software coding patch required.
Increases period of time for the cost of energy to overtake the cost of the device it powers in the data center.
Helps with the issue of whether a data center should move to a location that provides lower energy costs or more energy to meet demand.
Helps increase the meltdown gap between computing and energy consumption as per Moore and Amdahl’s law.
Complements efforts to eliminate the typical AC to DC power supply in blade servers. Instead of the traditional +5v, +12v and -12v DC rails and other low voltage DC sources converted from grid AC sources, TOE DC can be supplied. Plus complements the utilization of a 380 to 400V DC power bus.
Can integrate and work with data center and enterprise power managements systems such as Cisco’s Energy Wise, HP’s Thermal Logic, and IBM’s Tivoli or AEM.
The approach to utilizing Thermoelectrics in the enterprise does not require the various cut backs as is applied to other green initiatives.
Flexible TGS server deployment options - from tactical to strategic upgrade paths to the TGS system so savings can be realized.
Our approach and system helps IT departments contribute to a corporation’s bottom line by acting as a producer and not only a consumer of energy.
To gain a further perspective on our vision and approach we provided some additional examples of the potential impact TGS based systems can have not only in the data center but also throughout the enterprise from the closet and office floor level to outside the data center.
11.1 Thin/Virtualized Clients
With the fiscal need to conserve power to reduce costs some enterprises are utilizing thin clients. Thin client technology has been around the technology landscape for well over a decade and what was once considered a remote branch office technology to simplify the management and control of IT assets and applications is now being reconsidered as an energy efficiency method. If an enterprise were to “virtualize” the desktop to thin clients to save energy at the office floor front end, the servers on the back end would have to pick up the once distributed processing load that desktop PCs were handling. These servers will now require additional power and further generate joule heat to be cooled. On one hand this green approach may fit an enterprise energy efficiency ROI strategy, for the energy saved by moving from PCs to thin clients still outweigh the energy cost of the more powerful servers required in the data center. Or, those powerful servers, to pick up the distributed processing load from the removed PCs, now draw more energy than the PCs on the office floors were originally drawing. Either way, if those back end servers were TGS servers the energy generated would provided an additional cost savings via TOE economics.

The Case for Thermoelectrics in the Data Center October 2009
41 © 2009 Applied Methodologies, Inc.
11.2 Intelligent Networking Devices
Our system and approach also provides another benefit from the trend or push from Cisco. The Networking field is evolving to the point that the largest vendor, Cisco, has touted the capability of adding additional services (intelligence) into the networking device itself. You may have read about this in the past year or two in several trade publications. In this scenario the networking device will contain the hardware and software capability to conduct more work on behalf of what was once performed by isolated servers or appliances at another point in the network. That router or switch will now operate beyond the OSI layer 2 or 3 function but provide services up to layer 7. The IOS will integrate many application layer functions to enhance existing applications or even provide/serve them directly from the network. This is an intriguing concept with many benefits to an enterprise. Nonetheless, those intelligent routers and switches will require increased power to run the processing and storage needs of a device that now runs from layer 1-7. Our system and approach is applicable in this space as well. A TGS based router, switch, wireless controller, firewall et al. can contribute to reducing the energy consumption costs of these intelligent networking devices. A small example is a TGS based switch which generates TOE energy that can be supplied to offset the power required for the IP phones that connect to it.
11.3 What about a TGS based enterprise?
Consider the following consumption example from the Analytics-Green Information Week issue:
Bear in mind that if each of these 1000 systems generated a quarter or even an eighth of a watt continuously that is a positive amount of surplus power which was not previously available and at no additional cost to the enterprise.
Since we covered our vision from the enterprises data center standpoint in section six now imagine including all the enterprise IT assets such as desktops, printers and appliances in closets as TOE energy generators. If all of these assets were TGS based, greater levels of TOE energy can be supplied to a greater pool to offset the consumption needs from the grid. For example, if a PC were left running overnight or a specialized CAD or modeling workstation was executing a large compute intensive process it would generate energy as well from the work it had to conduct in the first place. Another example is all those devices still running in IT labs throughout the enterprise. Even if these systems were designed to be state of the art in “green” or energy efficient, TOE energy is still generated and contributing to the enterprises’ overall pool of offset energy to use. The wiring in most buildings is in place in some cases for the distribution of this energy to be supplied back to the data center.
Take a popular 19-inch LCD monitors. An NEC MultiSync LCD1990SX uses a paltry .08 watts when powered off, 31.7 watts when active. Contrast that with a Dell E198FP, which consumes up to 1 watt when powered off and 33 watts when active. As for workstations, a Lenovo ThinkCentre A61 will draw 2.67 watts when off and 4.18 watts when in sleep mode. Compare that with most of Dell’s OptiPlex 755 devices, which draw only .56 watts off and 2.47 watts in sleep mode. Small differences? Not when you’ve got 1,000-plus of these power hogs running overnight.

The Case for Thermoelectrics in the Data Center October 2009
42 © 2009 Applied Methodologies, Inc.
11.4 Power Management Systems
One compelling thought regarding power management systems and Thermoelectrics is with a system such as ours in place it may mitigate the need for complex automated power management at the device or enterprise level due to offset economics. Especially if the main purpose for a power management system is to save watts. For example, the cost and complexity to integrate power monitoring into a system (at the ASIC level) and the energy required to execute the power saving throttling process across various components in a system to save a few watts may outweigh the savings from the integration of a system such as ours. The savings achieved via TOE may be greater than the need to implement complex throttling systems in CPUs, chipsets, networking and storage controllers, for the throttling activity in and of itself may cause a certain amount of joule heating and affect overall processing performance. Simply put, is it economically viable to just use the TOE energy to compensate for the amount of energy lost from idle periods, energy leaked or wasted in other non business uses in contrast to purchasing, implementing and maintaining a power management system with the complex controls involved at the enterprise micro level (shutting down computers, monitors, printers, drives, Ethernet ports, etc)? The presence of TOE energy may help in reducing those (existing current leaks) without the overhead and complexity of additional management systems. Or, as to the contrary of this argument, if the use of an enterprise wide power management system, something similar to a Cisco’s Energy Wise offering, does provide greater power cost savings through efficiencies via scheduled device controls, a TGS based enterprise can also complement the power management system by still providing TOE energy during business activity cycles. This approach is enterprise dependent and an analysis would be required to determine how well the TGS based devices complements the power management system.
11.5 Other Benefits
You may have come across an article or two over the years covering the actions of the server administrator utilizing a watt meter or those little power “gizmos” to help determine what the true draw is from a server so the administrator can plan his/her energy requirements. Basing power usage on equipment specifications from the manufacturers of servers, routers, et al. is never clear, for most equipment is rated for a top end load. So, as high as the load rating for that piece of equipment is, in actuality some systems usually draw roughly 40% less in normal usage. Circuits may be underutilized, but even with underutilized circuits the TOE energy produced from TGS based systems is always available to offset the consumption from any level of draw. Our approach can help in eliminating thermal throttling - the endless start-stop-start cycle that accompanies fluctuations in server systems power draw. There is a boom in data center construction, most CEOs or CIOs believe that this will be a onetime catch up effort but some believe this is not true. No matter how perfect a data center is its assets must contribute to its overall efficiency. Our approach and system contributes to achieving this goal.
The Case for Thermoelectrics in the Data Center October 2009
43 © 2009 Applied Methodologies, Inc.
Other Benefits(continued) Our system and products may not dramatically reduce a corporation’s carbon footprint rating, for the systems still consume and exude energy after all efficiency methods are applied but we provide one additional benefit, surplus energy that was not available before. Our product’s energy profile shall consists of all of the necessary sanctioned “green” components, apply all the necessary industry “green” methods and adhere to the relevant industry “green” standards plus integrate our unique system to generate energy. The EPA and the Department of Energy are working on two major initiatives that will impact IT departments. The first is an Energy Star rating for data centers. The EPA has signed up over 120 data centers to assist with the collection of data that will serve as the basis of the rating. The goal is to create a standard energy efficiency benchmark, consider it as a MPG rating for the data center. Energy Star ratings are also forthcoming for servers. The EPA is currently working through the process of creating these, with the biggest issues revolving around the measurement and rating of idle power consumption. If possible someday our TOE will be considered as a part of the EPA’s or DOE rating system. Another use of TOE energy could be to power LED based lighting in a data center. If a data center is outfitted with newer, efficient LED lighting, TOE power can assist in providing the energy to power the data center’s lighting as well. Oh and don’t forget the rows upon rows of video games, slot machines, class room computers/labs et al. where our system and approach for Thermoelectric integration is applicable.
A TGS based system is no different than any other IT asset to install with the exception of connecting the TOE leads into the TGS power distribution system. Control and monitoring software is an available option and not even necessary for the systems will generate TOE energy upon boot and just continue until it is shut down or rebooted. Capacitance technology will enable some TOE energy to be provided even after a TGS based system is turned off. The manufacturing aspect of a TGS based system is also no different than any other IT system with the exception of the TEG integration process. There are many options available to economically integrate TEGs into, on top of or below any components inside the system that provide the ideal temperature gradient for harvesting energy. TEGs come in many sizes and can be custom manufactured for the systems in mind for optimal harvesting ratio and TOE output. There are nano/thin film and even flexible circular type TEGs that can wrap around components. The options available today for TEG integration are growing rapidly to provide the designer many alternatives to choose from.

The Case for Thermoelectrics in the Data Center October 2009
44 © 2009 Applied Methodologies, Inc.
12.0 Summary
We hope this paper increased your interest about the potential of utilizing Thermoelectrics in the data center. Many of the energy consumption issues outlined at the beginning of this paper can be diminished by utilizing the energy generated from applied Thermoelectrics in a scaled manner. Our approach and system of generating energy that has a value and use can be applied to assist in many of the energy consumption issues the IT industry faces. Using the fruits of our research and startup activities we hope we were able to demonstrate in this paper the value and potential of utilizing Thermoelectrics in the enterprise. Okay, now the big question. After this entire discussion on the benefits and economics of why the IT industry should consider Thermoelectrics one must wonder, “how come the big guys did not think of this before?” Well, maybe they did at a time and found the efficiencies aren’t viable enough, or the integration at the time to be too difficult or detrimental to system operation or the economics of savings at the time were not positive enough, or it was just completely overlooked.
Regardless of what the answer is we believed in 2006 and today that Thermoelectrics has a role in IT and as the technology matures the IT industry should embrace it for its inherent benefits are unavoidable. Joule heat will always be present in one form or another in all computing systems, even upcoming fully optical systems, so why not have the integration of Thermoelectrics to recycle the waste heat or temperature gradient in IT devices become as common a standard just like the standards for technologies such as USB, SATA, SCSI, ATX power supply, IEEE 802 series, or EnergyStar to name a few.
We truly believe that at this stage in computing history the time has come for a serious look into the use of Thermoelectrics in IT. Our approach and system may be an example from one small company to become the first to provide the enterprise data center another tool to assists in satisfying the CEO’s requirement to be environmentally aware and keep costs down and remain competitive at the same time, but we are certain we are not the last. Please visit our website www.amilabs.com/tgs for more information about our ongoing work and products relating to this promising technology.

The Case for Thermoelectrics in the Data Center October 2009
45 © 2009 Applied Methodologies, Inc.
About Applied Methodologies, Inc. (AMI) AMI is a technology consultation and research firm located in Wantagh, NY. AMI has been providing consulting services to corporate enterprises since 1995. AMILABS is the research and development arm of Applied Methodologies, Inc. AMILABS is also an online data communications and general Computer Science laboratory that is available online for students and professionals to study various networking and computer industry technologies. Visit www.amilabs.com for more information.
Appendix This appendix contains only some of the links utilized as our research sources for this paper. Many of the electrical/computer engineering and news articles utilized over the years would have be too numerous to list for this paper’s purpose. There is a tremendous amount of excellent information in these links so please take the time to review them.
GENERAL REPORTS AND NEWS FROM IT INDUSTRY SOURCES
Green IT Service Market to Grow to $4.8 Billion in 2013: Forrester http://www.eweek.com/c/a/Green-IT/Green-IT-Service-Market-to-Grow-to-48-Billion-in-2013-Forrester-587606/ InformationWeek Analytics: An Inconvenient Data Center http://www.informationweek.com/news/infrastructure/showArticle.jhtml?articleID=212900868 Analytics Green IT http://greenit.informationweek.com/ Cisco Subnet Going Green in the Data Center http://www.networkworld.com/subnets/cisco/063009-ch1-going-green-in-the-data-center.html Emerson Power Energy Logic http://www.liebert.com/common/ViewDocument.aspx?id=880 NETWORKWORLD compilation of Data Center energy articles http://www.networkworld.com/supp/2008/ndc1/ Optimizing server energy efficiency http://searchdatacenter.techtarget.com/tip/0,289483,sid80_gci1348917_mem1,00.html Gartner Says Users Are Becoming Increasingly Confused About the Issues and Solutions Surrounding Green IT http://www.gartner.com/it/page.jsp?id=756313 The Wild, Wild Cost Of Data Centers http://www.cioinsight.com/c/a/Expert-Voices/Wild-Cost-Of-Data-Centers/ The Data Center Journal http://datacenterjournal.com/index.php
Excellent source of information and one of the best locations for a complete list of green related links across IT sources The Green and Virtual Data Center http://thegreenandvirtualdatacenter.com/interestinglinks.html
IT AND BUSINESS NEWS SOURCES TO SEARCH FOR GREEN RELATED INFORMATION
http://www.informationweek.com/ http://www.eweek.com/ http://processor.com/ http://www.networkworld.com/ http://fcw.com/articles/2007/08/20/kobuszewski-the-new-green.aspx http://www.crn.com/index.jhtml;jsessionid=YFNRUAOAI0QLQQSNDLPCKHSCJUNN2JVN http://money.cnn.com/magazines/fortune/ http://searchdatacenter.techtarget.com/news/article/0,289142,sid80_gci1340740,00.html# http://www.businessgreen.com/ http://www.greenbiz.com/ http://greenercomputing.com/ http://www.greenit.net/ http://www.wattwatt.com/

The Case for Thermoelectrics in the Data Center October 2009
46 © 2009 Applied Methodologies, Inc.
Some manufactures sites reviewed for their “green” initiatives, white papers and best practices These are just the main links, for the specific “green” related links from these manufactures change periodically.
http://www.intel.com/index.htm#/en_US_01 http://www.cisco.com/ http://www.ibm.com/us/en/ http://www.hp.com/#Product http://www.dell.com/
Legacy data center related articles complied by AMILABS from 2006-2007 http://www.amilabs.com/Thermo/Thermo%20articles.htm
THEROMOELECTRICS Thermoelectric http://www.thermoelectrics.com/ Early history of Thermoelectrics http://www.dself.dsl.pipex.com/MUSEUM/POWER/thermoelectric/thermoelectric.htm Thermoelectric effect from Wikipedia http://en.wikipedia.org/wiki/Thermoelectric_effect Thermoelectricity from Wikipedia http://en.wikipedia.org/wiki/Thermoelectricity Joule Heating from Wikipedia http://en.wikipedia.org/wiki/Joule_heating Joule’s Law from Wikipedia http://en.wikipedia.org/wiki/Joule%27s_laws Basics of Theromoelectrics from Tellurex http://www.tellurex.com/pdf/new/Thermo%20Power%20Gen%20FAQ.pdf Basics of Theromoelectrics from Ferrotec http://www.ferrotec.com/technology/thermoelectric/thermalRef13/ Basics of Thin Film Thermoelectrics from Nextreme http://www.nextremethermal.com/media/pdf/whitepapers/Nextreme_Thin_Film.pdf
THERMOELECTRICS RELATED
Carnot Cycle Engineers Edge http://www.engineersedge.com/thermodynamics/carnot_cycle.htm Heat Transfer/Thermal Conductivity http://hyperphysics.phy-astr.gsu.edu/hbase/thermo/heatra.html#c2 http://en.wikipedia.org/wiki/Thermal_conductivity http://en.wikipedia.org/wiki/Heat_transfer Thermodynamics http://en.wikipedia.org/wiki/Thermodynamics NEAL NELSON BENCHMARK LABORATORY Power Efficiency Test Results for Dual Core Servers http://www.worlds-fastest.com/wf3200.html

The Case for Thermoelectrics in the Data Center October 2009
47 © 2009 Applied Methodologies, Inc.
THERMOELECTRIC MANUFACTURES
Tellurex http://www.tellurex.com/ Micropelt http://www.micropelt.com/index.php Nextreme http://www.nextremethermal.com/pages/power_gen/power_gen.shtml Power Chips http://www.powerchips.gi/index.shtml Hi-Z Technology, Inc. http://www.hi-z.com/ Watronix, Inc. http://www.inbthermoelectric.com/index.html Marlow Industries, Inc. http://www.marlow.com/power-generators/ TEG Power http://www.tegpower.com/ Power Puck http://www.perpetuapower.com/powerpuck_150.htm#
THERMOELECTRIC NEWS
International Thermoelectric Society http://www.its.org/ Thermoelectric News http://www.zts.com/ Energy Harvesting Journal http://www.energyharvestingjournal.com/articles/thermoelectric-ambient-energy-harvester-00001437.asp?sessionid=1 MIT http://web.mit.edu/newsoffice/2008/thermoelectric-0320.html PHYSORG http://www.physorg.com/news152801022.html Cooling Chips with Thermoelectrics http://www.technologyreview.com/computing/22016/ Paybacks from energy harvesting http://dataweek.co.za/article.aspx?pklArticleId=5590&pklCategoryId=31
BOOKS
Thermoelectrics Handbook: Macro to Nano http://www.amazon.com/o/ASIN/0849322642/104-9096660-6246329?SubscriptionId=1XFK01HK9NZWGPENWGG2 Thermoelectrics: Basic Principles and New Materials Developments http://www.amazon.com/Thermoelectrics-Basic-Principles-Materials-Developments/dp/354041245X/ref=pd_bxgy_b_img_b/104-9096660-6246329 Introduction to Thermoelectricity http://www.springer.com/materials/book/978-3-642-00715-6
AMILABS in eWeek http://www.eweek.com/c/a/IT-Infrastructure/Cooling-from-the-Inside-Out/

The Case for Thermoelectrics in the Data Center October 2009
48 © 2009 Applied Methodologies, Inc.
ENERGY EFFICIENCY CALCULATORS
APC Energy efficiency and PUE calculator http://www.apcmedia.com/salestools/WTOL-7CMGPL_R2_EN.swf APC List of calculators http://www.apc.com/prod_docs/results.cfm?DocType=Trade-Off%20Tool&Query_Type=10 42U – excellelent calculator works with PUE and DCiE http://www.42u.com/ http://www.42u.com/efficiency/energy-efficiency-calculator.htm The GreenGrid http://cooling.thegreengrid.org/calc_index.html Lawrence Berkeley National Laboratory http://hightech.lbl.gov/DCTraining/dc.html Electrical Energy Cost Calculator For Commercial Equipment http://www.csgnetwork.com/energycostcalc.html Power Joule - Watt calculator http://www.mhi-inc.com/Converter/watt_calculator.htm Generic Electrical Energy Cost Calculator http://www.csgnetwork.com/elecenergycalcs.html
STANDARDS AND BEST PRACTICES BODIES
The Green Grid http://www.thegreengrid.com/ EPEAT http://www.epeat.net/ LEED http://www.usgbc.org/DisplayPage.aspx?CategoryID=19 RoHS http://www.rohs.gov.uk/ 80 PLUS http://www.80plus.org/index.htm GDCM http://www.gdcm.com/ EPA http://www.epa.gov/ Site Infrastructure Power Overhead Multiplier(SI-POM) http://www.energystar.gov/ia/partners/prod_development/downloads/DC_Energy_Metrics.pdf EnergyStar Enterprise Server and Data Center Energy Efficiency Initiatives http://www.energystar.gov/index.cfm?c=prod_development.server_efficiency Department of Energy(DOE) Data Center Energy Profiler DC Pro http://dcpro.ppc.com/DCProDefault.aspx
ENERGY ECONOMICS
Energy Returned on Energy Invested(EROEI) http://en.wikipedia.org/wiki/EROEI Net Energy Gain (NEG) http://en.wikipedia.org/wiki/Net_energy_gain SPECpower http://www.spec.org/power_ssj2008/ Kilowatt hour http://en.wikipedia.org/wiki/Watt-hour US National Energy rates - Electricity http://www.eia.doe.gov/fuelelectric.html