the biennial report on the implementation of the title iii state
TRANSCRIPT

U.S. Department of eDUcation
The Biennial Report to Congress on The Implementation of the Title III
State Formula Grant ProgramSchool Years 2004-06

The Department of education’s mission is to promote student achievement and preparation for global competitiveness by fostering educational
excellence and ensuring equal access.
www.ed.gov

THE BIENNIAL REPORT TO CONGRESS ON THE IMPLEMENTATION OF THE
TITLE III STATE FORMULA GRANT PROGRAM
School Years 2004–06
U.S. Department of Education
Office of English Language Acquisition, Language Enhancement, and Academic Achievement for Limited English Proficient Students
This report was produced under U.S. Department of Education Contract No. ED-03-CO-0036 with the National Clearinghouse for English Language Acquisition and Language Instruction Educational Programs (NCELA). Timothy D’Emilio served as the contracting officer's representative. The views expressed herein do not necessarily represent the positions or policies of the Department of Education. No official endorsement by the U.S. Department of Education of any product, commodity, service or enterprise mentioned in this publication is intended or should be inferred. U.S. Department of Education Margaret Spellings Secretary Office of English Language Acquisition, Language Enhancement, and Academic Achievement for Limited English Proficient Students Richard Smith Acting Assistant Deputy Secretary and Director June 2008 This report is in the public domain. Authorization to reproduce it in whole or in part is granted. While permission to reprint this publication is not necessary, the citation should be:
Office of English Language Acquisition, Language Enhancement, and Academic Achievement for Limited English Proficient Students. Biennial Report to Congress on the Implementation of the Title III State Formula Grant Program, School Years 2004–06. Washington, DC; 2008.
To order copies of this report: Write to ED Pubs, Education Publications Center, U.S. Department of Education, P.O. Box 1398, Jessup, MD 20794-1398; or Call in your request toll-free to 1-877-433-7827 (1-877-4ED-PUBS). Those who use a telecommunications device for the deaf (TDD) or teletypewriter (TTY) should call 1-877-576-7734. If 877 service is not yet available in your area, call 1-800-872-5327 (1-800-USA-LEARN, TTY: 1-800-437-0833); or Fax your request to 1-301-470-1244; or E-mail your request to: [email protected]; or Order online at http://www.edpubs.ed.gov. The report is available on the U.S. Department of Education Web site at http://www.ed.gov/offices/oela or at http://www.ncela.gwu.edu.
Upon request, this report is available in alternate formats, such as Braille, large print or computer diskette. For more information, please contact the Department’s Alternate Format Center at 1-202-260-0852 or 1-202-260-0818.
CONTENTS
FIGURES .........................................................................................................................iv TABLES .........................................................................................................................iv ABBREVIATIONS ............................................................................................................. v EXECUTIVE SUMMARY.....................................................................................................vii INTRODUCTION ................................................................................................................ 1 Title III, Part A................................................................................................................................ 1 Accountability requirements.................................................................................................... 2 Consequences ........................................................................................................................ 2 Funding ................................................................................................................................... 3 Report Objectives and Design....................................................................................................... 5 DATA COLLECTION .......................................................................................................... 7
LANGUAGE INSTRUCTION FOR LIMITED ENGLISH PROFICIENT STUDENTS: NATIONAL OVERVIEW OF KEY FINDINGS............................................................................................ 8 Comparing Data Across States ..................................................................................................... 8 A Description of Limited English Proficient Students .................................................................... 8 Number of students................................................................................................................. 8 Languages spoken by LEP students .................................................................................... 12 Immigrant children and youths.............................................................................................. 13 Language Instruction Educational Programs for K–12 LEP Students ........................................ 16
Accountability: Testing K–12 LEP Students for English Language Proficiency and Content Achievement............................................................................................................................. 19
National Assessment of Educational Progress..................................................................... 19 Annual Measurable Achievement Objectives…………………………………………...………23 Progress and attainment of English language proficiency—AMAOs 1 and 2 ...................... 23 Content area achievement—AMAO 3 .................................................................................. 28 Academic content testing in the native language ................................................................. 34 Accommodations for content area achievement tests.......................................................... 35 Monitored students ............................................................................................................... 36 Subgrants to LEAs Experiencing Substantial Increases in Immigrant Children and Youths ...... 40 Preparing Educational Staff to Work With LEP Students: Technical Assistance........................ 42 PROFILES OF STATES, THE DISTRICT OF COLUMBIA, AND THE COMMONWEALTH OF PUERTO
RICO.................................................................................................................. 45 Introduction.................................................................................................................................. 46 Student Information............................................................................................................... 46 Educational Staff Information................................................................................................ 47 Summary of Survey Results in Graphical Format for States, the District of Columbia, and the
Commonwealth of Puerto Rico.......................................................................................... 48 REFERENCES .............................................................................................................. 154 APPENDIX A: SUMMARY OF RESULTS ORGANIZED AROUND THE NINE STATUTE-BASED
EVALUATION ELEMENTS.................................................................................... 155 APPENDIX B: OMB-APPROVED DATA COLLECTION FORM .............................................. 161 APPENDIX C: METHODOLOGY....................................................................................... 195
Page iii

FIGURES
1. Number of K–12 limited English proficient students identified and number participating in Title III language instruction educational programs: School years 2002–03 to 2005–06 ............ 9
2. Definitions of Language Instruction Educational Programs ....................................................... 17
3. Types of Language Instruction Educational Programs used by states ...................................... 19
4. Percentage of fourth- and eighth-grade LEP students (2000, 2003, 2005, 2007) and former LEP students (2005, 2007) scoring at or above basic proficiency on NAEP mathematics and reading ........................................................................................................................................ 21
5. Percentage difference between non-LEP students and LEP students scoring at or above basic proficiency on NAEP in 2000, 2003, 2005, and 2007 ....................................................... 23
6. Numbers of states reaching and not reaching AMAO 1 and AMAO 2: School years 2004–05 and 2005–06 ............................................................................................................................... 28
7. Number of states meeting content achievement targets, by grade level: School year 2005–06 ................................................................................................................................................ 33
8. Accommodations offered to K–12 LEP students by subgrantees .............................................. 36
9. Number of monitored students enrolled, tested, scoring at least proficient, and achieving grade-level standards in grades not tested for AYP purposes: School years 2004–05 and 2005–06....................................................................................................................................... 40
10. Activities funded by subgrants for immigrant children and youths ............................................. 41
11. Number of participants in state-offered professional development activities, by type of participant: School years 2004–06 ............................................................................................. 44
TABLES
1. Title III funding for limited English proficient students, by state: School years 2004–05 and 2005–06 ........................................................................................................................................ 4
2. Number of identified K–12 limited English proficient students and number participating in Title III-funded K–12 programs, by state: School years 2004–05 and 2005–06 ........................ 11
3. Ten native languages most frequently spoken by K–12 limited English proficient students....... 12
4. Immigrant K–12 students: School years 2004–05 and 2005–06 ............................................... 14
5. Number of K–12 immigrant children and youths identified and number participating in Title III-funded programs, by state: School years 2004–05 and 2005–06 ......................................... 15
6. Results for AMAOs 1 and 2, by state: School year 2004–05...................................................... 26
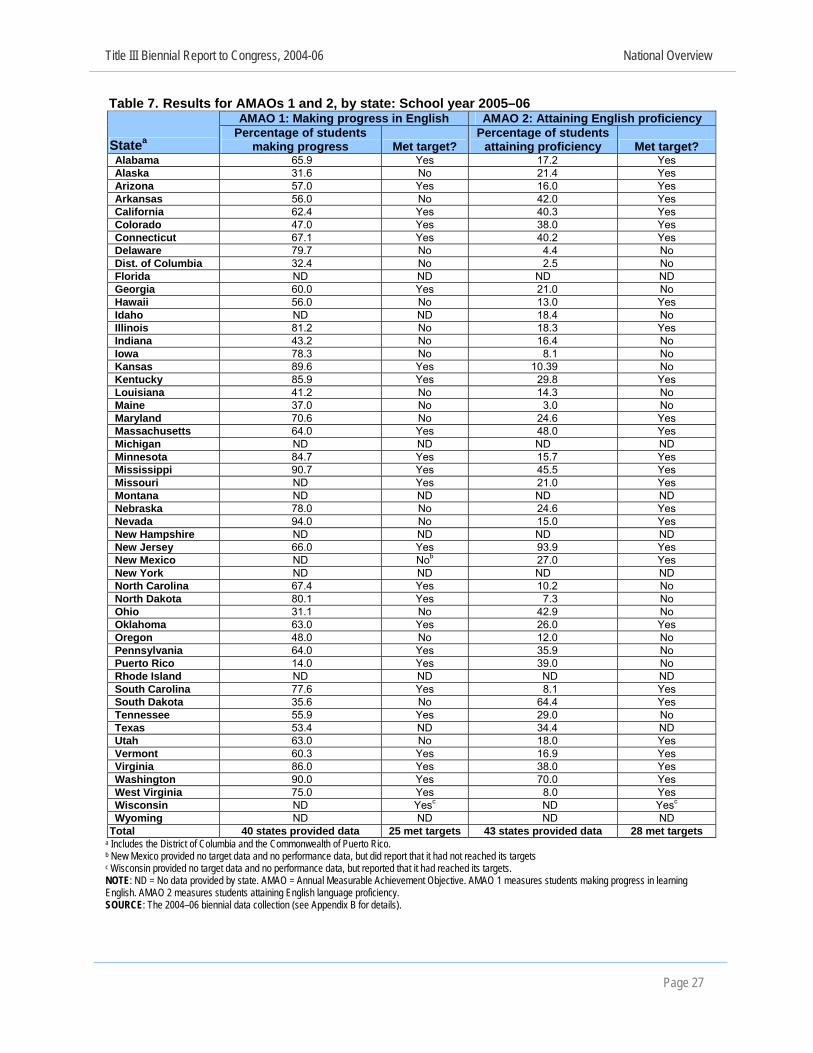
7. Results for AMAOs 1 and 2, by state: School year 2005–06 ..................................................... 27
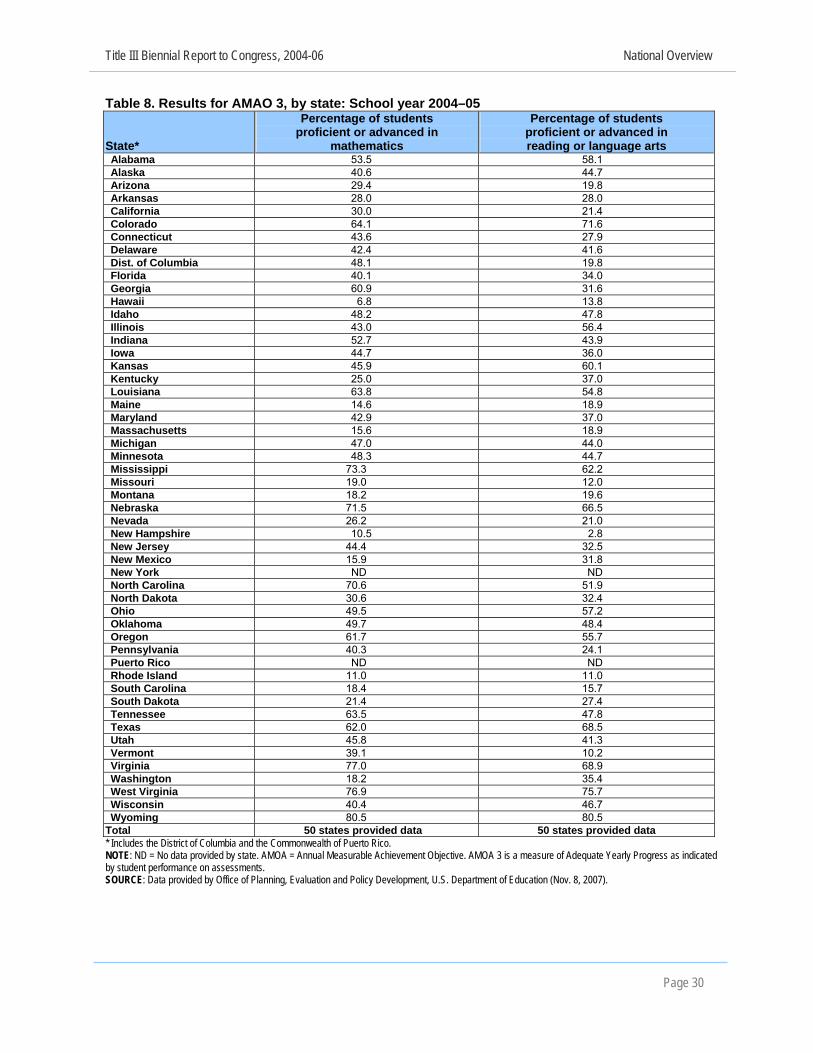
8. Results for AMAO 3, by state: School year 2004–05.................................................................. 30
9. Results for AMAO 3, by state: School year 2005–06.................................................................. 32
10. Number of monitored students and number scoring at least proficient in mathematics and reading or language arts, by state: School years 2004–05 and 2005–06 .................................. 38
Page iv
ABBREVIATIONS AMAO Annual Measurable Achievement Objective AYP Adequate Yearly Progress (from Title I) CBO Community-based organization ELP English language proficiency ESEA Elementary and Secondary Education Act LEP Limited English proficiency LIEP Language instruction educational program NAEP National Assessment of Educational Progress NCELA National Clearinghouse for English Language Acquisition and Language Instruction
Educational Programs NCLB No Child Left Behind Act of 2001, the most recent reauthorization of the Elementary and
Secondary Education Act OELA Office of English Language Acquisition, Language Enhancement, and Academic Achievement
for Limited English Proficient Students
Page v

Page vi
EXECUTIVE SUMMARY
The biennial report to Congress on the implementation of the Title III state formula grant program provides a snapshot of the status of the U.S. Department of Education’s efforts to hold states accountable for ensuring that all limited English proficient (LEP) students attain English language proficiency (ELP) and are achieving in the content areas of mathematics and reading or language arts at the same high level set by the states for all students. Title III of the Elementary and Secondary Education Act (ESEA), which focuses on the specific goals of identifying students who have limited English proficiency and serving them with effective language instruction educational programs (LIEPs), was first implemented upon the reauthorization of the ESEA by the No Child Left Behind Act of 2001. Title III further specifies that states must develop standards and targets for the acquisition of English and for the demonstration of academic content knowledge by LEP students.
The first biennial report since the reauthorization of the ESEA covers the years 2002–04. This report represents the second effort to collect data from states to determine how well these goals are being met. The analysis of these data has resulted in several key findings.
• The U.S. Department of Education distributed nearly $580 million to 50 states, the District of Columbia, and the Commonwealth of Puerto Rico during the 2005–06 school year. State grants ranged from a minimum of $500,000 to more than $149 million.
• The number of K–12 students in the United States who are identified as being LEP has grown by nearly 650,000 in the past three years and is now approximately 4,985,000.
• Close to 85 percent of identified LEP students are participating in Title III-funded programs.
• More than 1 million (1,087,000) immigrant students who met the definition in §3301(6) of ESEA were identified in school year 2005–06. About 65 percent of these students are served in Title III-funded programs designed to meet their needs.
• LEP students speak more than 400 different languages, including languages from outside the United States (e.g., Asian, European, and African languages) and inside the United States (American Indian languages). Nearly 80 percent of LEP students speak Spanish; another 5 percent speak Asian languages.
• A total of 40 states and the District of Columbia reported that their subgrantees were using LIEPs that focused both on literacy in English and in another language; six states and the Commonwealth of Puerto Rico reported that their subgrantees were using LIEPs that focused only on literacy in English.
• The National Assessment of Educational Progress (NAEP) indicates that the national sample of LEP students have improved their performance in the content areas of mathematics and reading or language arts. For mathematics, the percentage of fourth- and eighth-grade LEP students who scored at or
Page vii

Page viii
above the basic level was higher in school year 2007 than in any previous year. For reading, the percentage of fourth-grade LEP students who scored at or above the basic level was higher in 2007 than in 2005; eighth-grade LEP students showed no increases from 2005.
• Nearly all LEP students are tested annually for ELP; more than 90 percent of these students now have at least two test administrations that allow for a statement about their “growth” in ELP. Prior to the implementation of Title III and its reporting requirements, statewide data were not available to determine how well these students were learning English or achieving in the core academic content areas.
• In school year 2005–06, 24 states and the Commonwealth of Puerto Rico reported that they reached their targets for LEP students making progress in ELP, while 28 states reported that they met their targets for LEP students attaining proficiency in the English language.
• During school year 2005–2006, officials in 31 states and the District of Columbia tracked the continuing education progress of more than 312,000 students who were formerly classified as LEP; 86 percent of these students scored at the proficient level or above in mathematics and 99 percent scored at the proficient level or above in reading or language arts.

INTRODUCTION There are currently more than 10.5 million school-aged children in the United States
who live in homes in which a language other than English is spoken. Some of these
students are fluent in English, while others are not (U.S. Census Bureau, 2005).
Ensuring that students who are not fluent in English receive a quality education, and
achieve the same academic success as their English-proficient peers, is an essential
goal of the Elementary and Secondary Education Act (ESEA), as reauthorized by the
No Child Left Behind Act of 2001 (NCLB). It is critical to keep in mind, as U.S.
Secretary of Education Margaret Spellings recently noted, that NCLB “is not just an
education law, it’s a civil rights law” (U.S. Department of Education, 2007b). Indeed,
NCLB has placed a greater emphasis on addressing the education needs of limited
English proficient (LEP) students than ever before, with Title III designed specifically to
address these needs.
In this Biennial Report to Congress on the Implementation of the Title III State Formula
Grant Program School Years 2004–06 (henceforth the Biennial Report to Congress),
the U.S. Department of Education provides data reported by the 50 states, the District
of Columbia, and the Commonwealth of Puerto Rico, related to the education of LEP
students for the 2004–05 and 2005–06 school years.
Title III, Part A The overall goals of Title III of ESEA are to ensure that LEP students, including
immigrant children and youths, attain English language proficiency (ELP), develop
high levels of academic attainment in English, and meet the same challenging state
academic content and student academic achievement standards as all children
(§3102(1)). To accomplish these goals, each state1 is developing an integrated system
of ELP standards aligned with the achievement of its academic content standards, as
well as assessment(s) of ELP aligned with ELP standards and Annual Measurable
1 Henceforth generic use of the term “state” in reference to the actions, obligations or requirements of the states refers to the 50 states as well as the District of Columbia and the Commonwealth of Puerto Rico. Specific uses (for example, counts of states) will distinguish between states, the District of Columbia, and the Commonwealth of Puerto Rico.

Title III Biennial Report to Congress, 2004–06 Introduction
Page 2
Achievement Objectives (AMAOs, defined below) that set targets and goals for
ensuring that LEP students make progress in and attain ELP.
Accountability requirements
Title III requires states to develop ELP standards that include the recognized language
domains of reading, writing, speaking, listening, and comprehension and, as also
required by Title I, assess the ELP of LEP students on an annual basis. In addition,
states must establish AMAOs that measure subgrantee2 progress in helping LEP
students gain ELP and achieve academically. These AMAOs also are used to
measure the performance of Title III subgrantees and the states and hold them
accountable for the achievement of LEP students.
The first two AMAOs pertain to students’ acquisition of the English language, while the
third AMAO focuses on academic performance:
• AMAO 1 measures the extent to which LEP students make progress in English
proficiency;
• AMAO 2 measures the extent to which LEP students attain English proficiency;
and
• AMAO 3 measures the academic achievement of LEP K–12 students in
mathematics and reading or language arts and is the adequate yearly progress
(AYP) measure as it applies to LEP students, as measured under Title I of
ESEA.
Consequences
To enforce the requirements of Title III, subgrantees are subject to specific
consequences if they fail to meet the targets for any of the three AMAOs. After two
consecutive years of failing to meet the AMAO(s), a subgrantee must develop an
improvement plan for ensuring that the district will meet the objectives. The plan must
address the reasons why the subgrantee did not achieve the objectives. If a
subgrantee does not meet the AMAOs for four consecutive years, the state must either 2 Title III grants are allocated to states, which then provide funding to local education agencies and consortia of local education agencies, known as “subgrantees.”
Title III Biennial Report to Congress, 2004–06 Introduction
(1) require the subgrantee to modify its curriculum, program, and method of
instruction, or
(2) determine whether the subgrantee should continue to receive Title III funds. If
the state determines that the subgrantee should continue to receive Title III
funds, the state must require the subgrantee to replace educational personnel
and address the factors that prevented it from meeting the AMAOs.
Funding
Title III formula allocations to states are based on the number of LEP students in the
state using data obtained from the American Community Survey of the U.S. Census
Bureau. Each state is guaranteed a minimum of $500,000 per school year.
States allocate Title III funds to districts and consortia of districts (all referred to as
subgrantees) based on subgrantee plans submitted to the state, which describe how
the subgrantee will meet the goals established by the state for LEP students. In return
for accepting federal grant funds, states are required to meet Title III accountability
requirements which include collecting and reporting data on the achievement of LEP
students. States may use up to 5 percent of their Title III grant for state administrative
purposes and to conduct state-level activities, such as professional development;
planning, evaluation, and administration of subgrants; and providing subgrantees
technical assistance and recognition to those that have exceeded their Title III
AMAOs.
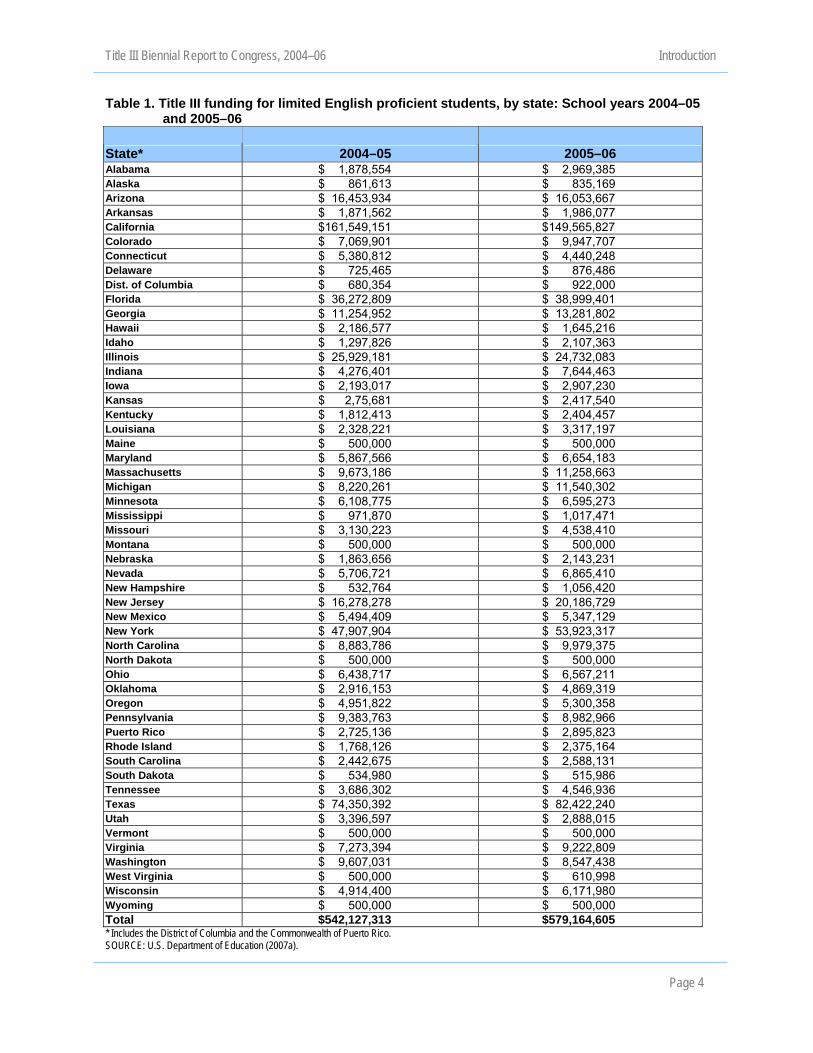
Table 1 lists Title III funds allocated to each state for school years 2004–05 and 2005–
06. In 2004–05, $542,127,313 of Title III funds were provided to the states. In 2005–
06, $579,164,605 were provided.
Page 3
Title III Biennial Report to Congress, 2004–06 Introduction
Table 1. Title III funding for limited English proficient students, by state: School years 2004–05 and 2005–06
State* 2004–05 2005–06 Alabama $ 1,878,554 $ 2,969,385 Alaska $ 861,613 $ 835,169 Arizona $ 16,453,934 $ 16,053,667 Arkansas $ 1,871,562 $ 1,986,077 California $161,549,151 $149,565,827 Colorado $ 7,069,901 $ 9,947,707 Connecticut $ 5,380,812 $ 4,440,248 Delaware $ 725,465 $ 876,486 Dist. of Columbia $ 680,354 $ 922,000 Florida $ 36,272,809 $ 38,999,401 Georgia $ 11,254,952 $ 13,281,802 Hawaii $ 2,186,577 $ 1,645,216 Idaho $ 1,297,826 $ 2,107,363 Illinois $ 25,929,181 $ 24,732,083 Indiana $ 4,276,401 $ 7,644,463 Iowa $ 2,193,017 $ 2,907,230 Kansas $ 2,75,681 $ 2,417,540 Kentucky $ 1,812,413 $ 2,404,457 Louisiana $ 2,328,221 $ 3,317,197 Maine $ 500,000 $ 500,000 Maryland $ 5,867,566 $ 6,654,183 Massachusetts $ 9,673,186 $ 11,258,663 Michigan $ 8,220,261 $ 11,540,302 Minnesota $ 6,108,775 $ 6,595,273 Mississippi $ 971,870 $ 1,017,471 Missouri $ 3,130,223 $ 4,538,410 Montana $ 500,000 $ 500,000 Nebraska $ 1,863,656 $ 2,143,231 Nevada $ 5,706,721 $ 6,865,410 New Hampshire $ 532,764 $ 1,056,420 New Jersey $ 16,278,278 $ 20,186,729 New Mexico $ 5,494,409 $ 5,347,129 New York $ 47,907,904 $ 53,923,317 North Carolina $ 8,883,786 $ 9,979,375 North Dakota $ 500,000 $ 500,000 Ohio $ 6,438,717 $ 6,567,211 Oklahoma $ 2,916,153 $ 4,869,319 Oregon $ 4,951,822 $ 5,300,358 Pennsylvania $ 9,383,763 $ 8,982,966 Puerto Rico $ 2,725,136 $ 2,895,823 Rhode Island $ 1,768,126 $ 2,375,164 South Carolina $ 2,442,675 $ 2,588,131 South Dakota $ 534,980 $ 515,986 Tennessee $ 3,686,302 $ 4,546,936 Texas $ 74,350,392 $ 82,422,240 Utah $ 3,396,597 $ 2,888,015 Vermont $ 500,000 $ 500,000 Virginia $ 7,273,394 $ 9,222,809 Washington $ 9,607,031 $ 8,547,438 West Virginia $ 500,000 $ 610,998 Wisconsin $ 4,914,400 $ 6,171,980 Wyoming $ 500,000 $ 500,000 Total $542,127,313 $579,164,605 * Includes the District of Columbia and the Commonwealth of Puerto Rico. SOURCE: U.S. Department of Education (2007a).
Page 4

Title III Biennial Report to Congress, 2004–06 Introduction
Page 5
Report Objectives and Design The Biennial Report to Congress on the Implementation of the Title III State Formula
Grant Program, School Years 2004–06 is the second ESEA-required analysis of state-
submitted biennial data on LEP students, as defined by each state and measured by
state-approved ELP assessment(s).3 It is designed to address the nine evaluation
elements described in §3123(b)(1–9) of the ESEA:
1. Programs and activities carried out to serve LEP children, and their
effectiveness in improving the academic achievement and English proficiency of
these children;
2. The types of LIEPs used by local education agencies that receive Title III funds;
3. A critical synthesis of data reported by eligible entities to states;
4. A description of technical assistance provided by state education agencies;
5. An estimate of the number of certified or licensed teachers working in LIEPs
and an estimate of the number who will be needed for the succeeding five
years;
6. Major findings of scientifically based research carried out by states or local
education agencies using Title III funds;4
7. The number of programs or activities, if any, that were terminated because the
entities carrying them out were not able to meet program goals;
8. The number of LEP students served by eligible entities receiving Title III funding
who were transitioned out of LIEPs into classrooms where instruction is not
tailored for LEP students; and
9. If appropriate, information gathered from the evaluations from specially qualified
agencies and other reports submitted to the secretary of education under
Title III.
These nine elements provide a framework for monitoring states’ progress towards
achieving the goals of Title III. This report uses these elements as a starting point to
3 The first report was submitted to Congress on March 15, 2005; it is available at http://www.ncela.gwu.edu/oela/biennial05/ index.htm. 4 As noted in Appendix A of this report, no state or local entity funded or carried out scientifically based research in 2004–05 or 2005–06 using Title III funds.

Title III Biennial Report to Congress, 2004–06 Introduction
Page 6
provide an overall picture of the success of the U.S. public education system in
meeting the needs of LEP students.5 These data were collected from the 50 states,
the District of Columbia, and the Commonwealth of Puerto Rico. The data were
collected during December 2006 and January 2007 for the 2004–05 and 2005–06
school years.
5 For an overview of the data and findings specific to each of the evaluation elements, please see Appendix A.

Title III Biennial Report to Congress, 2004–06 Methodology
Page 7
DATA COLLECTION
The data in this report are self-reported by states, which are responsible for collecting,
submitting, and verifying the accuracy of the data.
To systematically and consistently collect the data for this report, the Department
reviewed the legislative requirements for this Biennial Report to Congress and
collaborated with the Office of Management and Budget (OMB) to create the biennial
report data collection form. The OMB-approved data collection form provided to states
in September 2006 (OMB № 1885-0553, expires Aug. 31, 2009) is the first electronic
data submission instrument for reporting Title III data on the academic and linguistic
progress of LEP students. The electronic form was used to collect data from the states
on the nine “evaluation elements” listed in §3123(b)(1–9). The OMB-approved form is
in Appendix B of this report.
Data collection on LEP students for this report often was difficult for states. Some
states do not have systems that allow longitudinal data collection for measuring
individual student progress in ELP. Nevertheless, all states provided data in at least
some of the required areas. The Department is optimistic that state data collections
will improve as states establish better data collection and reporting systems. Data from
the various states are not equivalent and, in many respects, cannot be compared
because states use different criteria to identify LEP students. Thus, while ESEA
provides a definition of “limited English proficient” (see §9101(25)), there is no one,
common, approved method to operationalize the term, either for initial identification
purposes or for ultimate exit from an LIEP or the LEP category. In addition, states use
different assessments to determine the different levels of ELP. Even states that use
the same assessment use different criteria and methods for classifying students as
LEP or for exiting LEP students from LIEPs. For details on the methods used to collect
the state-reported data in this report, see Appendix C, Methodology.

Title III Biennial Report to Congress, 2004-06 National Overview
Page 8
LANGUAGE INSTRUCTION FOR LIMITED ENGLISH PROFICIENT STUDENTS: NATIONAL OVERVIEW OF KEY FINDINGS
This section includes tables and figures providing state-reported data on key issues. It
also provides some general statements describing overall state progress in meeting
NCLB requirements.
Comparing Data Across States The data in this report have been compiled to allow the reader easy access to each
state’s data submission in key areas covered by Title III. It may be tempting to
compare the data across states to determine how one state compares with another
state. However, in many respects, these data do not allow for state-by-state
comparisons.6
A Description of Limited English Proficient Students Number of students
The data submitted by states indicate that there are approximately 5 million students
classified as LEP through their participation in a Title III assessment of ELP. According
to the U.S. Census, LEP students are among the fastest-growing demographic group
of students in the United States. While the overall school population has grown by less
than 3 percent in the last 10 years, the number of LEP students has increased by
more than 60 percent in that same time period.7
6 It is important to stress that some comparisons across states are inappropriate. Each state has its own standards, both for ELP and for academic content. In addition, each state may use different assessments of both content area achievement and ELP; have different criteria for defining LEP status, identifying LEP students, and exiting students from the LEP category; and have different criteria for teacher education, professional development, and teacher placement in classrooms. Therefore, while it may be useful and informative to compare, for example, the number of LEP students and the numbers of teachers in LIEPs across states, the reader should be aware that states use different methodologies for identifying these students and teachers. Similarly, it would be entirely appropriate to compare the number of LEP students participating in Title III-funded programs across states, so long as one understands that the methods for identifying those children differed across the states. 7 Data collected annually from various sources, including the states themselves, by the National Clearinghouse for English Language Acquisition and Language Instruction Educational Programs (NCELA). For a summary of these data, see NCELA (2005).
Title III Biennial Report to Congress, 2004-06 National Overview
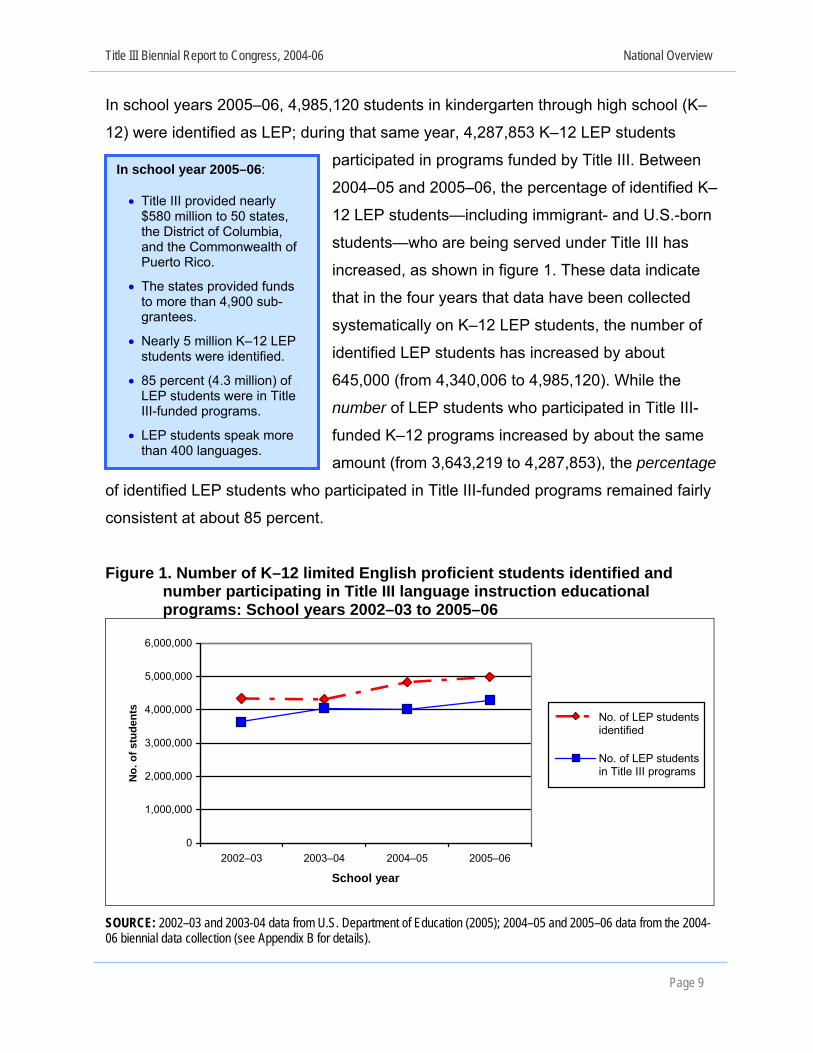
In school years 2005–06, 4,985,120 students in kindergarten through high school (K–
12) were identified as LEP; during that same year, 4,287,853 K–12 LEP students
participated in programs funded by Title III. Between
2004–05 and 2005–06, the percentage of identified K–
12 LEP students—including immigrant- and U.S.-born
students—who are being served under Title III has
increased, as shown in figure 1. These data indicate
that in the four years that data have been collected
systematically on K–12 LEP students, the number of
identified LEP students has increased by about
645,000 (from 4,340,006 to 4,985,120). While the
number of LEP students who participated in Title III-
funded K–12 programs increased by about the same
amount (from 3,643,219 to 4,287,853), the percentage
of identified LEP students who participated in Title III-funded programs remained fairly
consistent at about 85 percent.
In school year 2005–06: • Title III provided nearly
$580 million to 50 states, the District of Columbia, and the Commonwealth of Puerto Rico.
• The states provided funds to more than 4,900 sub-grantees.
• Nearly 5 million K–12 LEP students were identified.
• 85 percent (4.3 million) of LEP students were in Title III-funded programs.
• LEP students speak more than 400 languages.
Figure 1. Number of K–12 limited English proficient students identified and number participating in Title III language instruction educational programs: School years 2002–03 to 2005–06
0
1,000,000
2,000,000
3,000,000
4,000,000
5,000,000
6,000,000
2002–03 2003–04 2004–05 2005–06
School year
No.
of s
tude
nts
No. of LEP studentsidentified
No. of LEP studentsin Title III programs
SOURCE: 2002–03 and 2003-04 data from U.S. Department of Education (2005); 2004–05 and 2005–06 data from the 2004-06 biennial data collection (see Appendix B for details).
Page 9
Title III Biennial Report to Congress, 2004-06 National Overview
Page 10
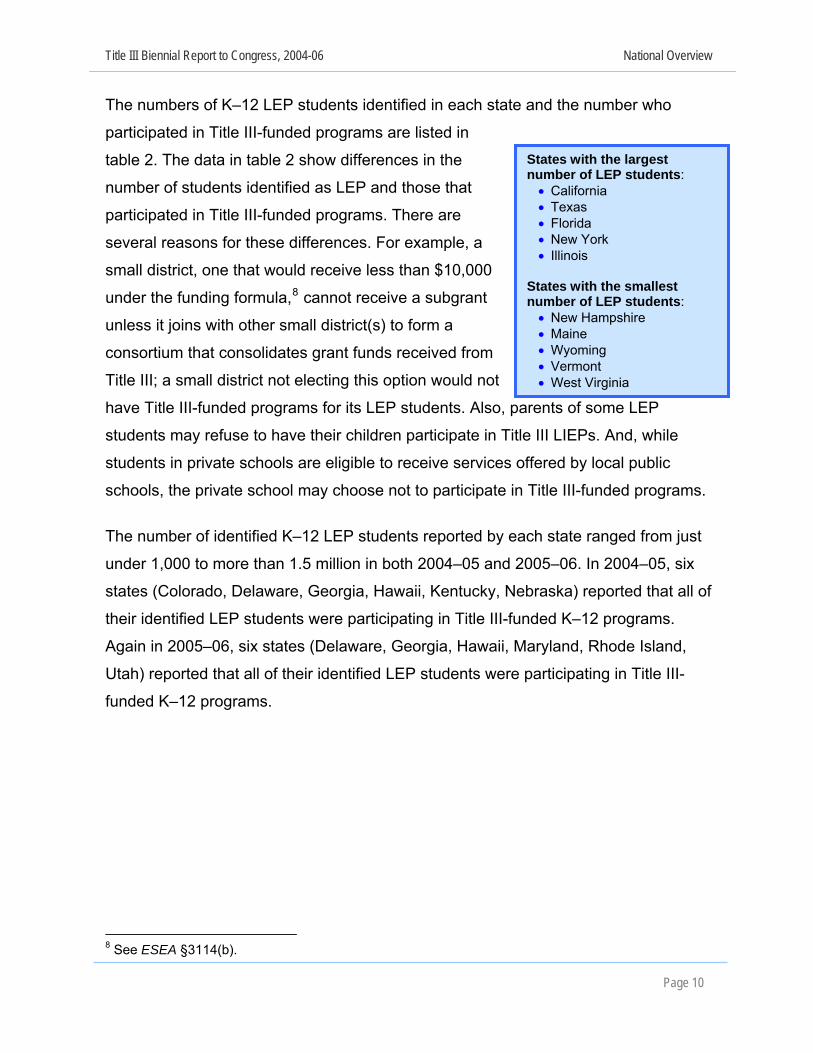
The numbers of K–12 LEP students identified in each state and the number who
participated in Title III-funded programs are listed in
table 2. The data in table 2 show differences in the
number of students identified as LEP and those that
participated in Title III-funded programs. There are
several reasons for these differences. For example, a
small district, one that would receive less than $10,000
under the funding formula,8 cannot receive a subgrant
unless it joins with other small district(s) to form a
consortium that consolidates grant funds received from
Title III; a small district not electing this option would not
have Title III-funded programs for its LEP students. Also, parents of some LEP
students may refuse to have their children participate in Title III LIEPs. And, while
students in private schools are eligible to receive services offered by local public
schools, the private school may choose not to participate in Title III-funded programs.
The number of identified K–12 LEP students reported by each state ranged from just
under 1,000 to more than 1.5 million in both 2004–05 and 2005–06. In 2004–05, six
states (Colorado, Delaware, Georgia, Hawaii, Kentucky, Nebraska) reported that all of
their identified LEP students were participating in Title III-funded K–12 programs.
Again in 2005–06, six states (Delaware, Georgia, Hawaii, Maryland, Rhode Island,
Utah) reported that all of their identified LEP students were participating in Title III-
funded K–12 programs.
8 See ESEA §3114(b).
States with the largest number of LEP students: • California • Texas • Florida • New York • Illinois
States with the smallest number of LEP students: • New Hampshire • Maine • Wyoming • Vermont • West Virginia

Title III Biennial Report to Congress, 2004-06 National Overview
Table 2. Number of identified K–12 limited English proficient students and number participating in Title III-funded K–12 programs, by state: School years 2004–05 and 2005–06
2004–05 2005–06
Statea
Number of LEP students
identified
Number of identified LEP students
in Title III-funded programs
Number of LEP students
identified
Number of identified LEP students
in Title III-funded programs
Alabama 15,295 12,202 16,520 15,088 Alaska 20,140 18,222 20,514 18,475 Arizona 155,789 153,669 152,962 152,568 Arkansas 17,384 15,197 20,320 17,723 California 1,591,525 1,581,178 1,571,463 1,565,675 Colorado 91,308 91,308 89,946 83,709 Connecticut 27,580 27,212 27,678 27,216 Delaware 4,949 4,949 6,015 6,015 Dist. of Columbia 5,555 ND 4,485 3,843 Florida 236,527 220,703 253,165 242,343 Georgia 50,381 50,381 56,465 56,465 Hawaii 18,376 18,376 16,190 16,190 Idaho 15,899 14,327 19,954 18,884 Illinois 192,764 149,700 204,803 155,810 Indiana 32,306 28,475 36,208 33,942 Iowa 15,452 12,403 15,181 14,742 Kansas 23,512 19,727 25,995 25,767 Kentucky 11,181 11,181 10,171 10,043 Louisiana 5,494 5,231 7,740 7,317 Maine 2,896 2,652 3,146 2,726 Maryland 24,811 31,111 29,778 29,778 Massachusetts 16,339 15,203 47,397 43,820 Michigan 25,889 25,738 42,007 65,419 Minnesota 58,815 49,652 59,127 55,531 Mississippi 4,152 2,862 4,866 3,611 Missouri 16,269 14,672 17,263 15,559 Montana 6,952 3,257 6,952 3,582 Nebraska 13,550 13,550 14,966 8,839 Nevada 72,117 72,185 74,305 74,009 New Hampshire 4,035 3,484 3,484 3,532 New Jersey 41,812 51,955 42,940 52,285 New Mexico 70,926 70,185 64,860 63,650 New York 203,583 105,374 234,578 229,470 North Carolina 78,395 77,677 83,627 83,010 North Dakota 4,749 2,319 5,529 2,684 Ohio 24,167 22,912 24,361 21,257 Oklahoma 33,508 29,971 31,011 29,564 Oregon 58,546 62,424 65,824 34,803 Pennsylvania 39,847 28,005 41,097 37,268 Puerto Rico 578,534 4,889b 586,724 1,704b
Rhode Island 10,273 10,000 10,000 10,000 South Carolina 15,396 14,958 20,013 19,540 South Dakota 5,847 2,666 5,275 2,649 Tennessee 19,355 18,340 20,901 18,671 Texas 615,466 640,749 640,749 638,863 Utah 56,319 52,582 52,582 52,582 Vermont 1,393 1,564 1,564 1,216 Virginia 67,933 72,680 72,380 39,862 Washington 78,816 78,236 78,236 73,499 West Virginia 843 1,224 1,224 1,140 Wisconsin 39,329 40,522 40,522 31,802 Wyoming 3,742 2,057 2,057 813 Total 4,826,021 4,021,549 4,985,120 4,287,853 a Includes the District of Columbia and the Commonwealth of Puerto Rico. b Puerto Rico reports the number of LEP students identified, but provides Language Instruction Educational Programs to limited Spanish proficient students. NOTE: ND = No data provided by state. SOURCE: The 2004–06 biennial data collection (see Appendix B for details). Page 11

Title III Biennial Report to Congress, 2004-06 National Overview
Page 12
Languages spoken by LEP students
Based on the information that NCELA collected from states, there are more than 400
languages spoken by LEP students who attend American schools, with nearly 80
percent of LEP students identified as Spanish speakers and 5 percent speaking
various Asian languages, including Vietnamese, Hmong, Chinese, and Korean, as
Table 3. Ten native languages most frequently spoken by K–12 limited English proficient
students Percentage of LEP students reported
Language By states By districts Spanish 79.6 76.9 Vietnamese 2.0 2.4 Chinese* 2.1 1.8 Hmong 1.6 1.8 Korean 1.0 1.2 Haitian Creole 0.9 1.1 Arabic 0.9 1.2 Russian 0.8 0.9 Tagalog 0.7 0.9 Navajo 0.9 0.9 * Chinese includes Cantonese, Mandarin, and unspecified Chinese dialects. SOURCE: Extracted from state data reported by the National Clearinghouse for English Language Acquisition and Language Instruction Educational Programs (NCELA, 2007b) and from district numbers reported by U. S. Department of Education (2003, p 5).
their first language. There is one Native American language, Navajo, that is among the
languages most frequently spoken within the LEP student population (see table 3).9
According to the U.S. Department of Education (2003), just over one-quarter of the
districts in the nation report that their LEP students come from only one language
group, and over one-sixth report that their LEP students come from 10 or more
language groups (28.3 percent and 17.1 percent, respectively) (U.S. Department of
Education, 2003, p.9).
9 These numbers were reported by states to NCELA (see NCELA, 2007b) and are consistent with those reported by districts to the U.S. Department of Education (2003).

Title III Biennial Report to Congress, 2004-06 National Overview
Immigrant children and youths
In school years 2005–06: • States provided more than $115
million of their Title III funds to subgrantees serving K–12 immigrant children and youths.
• States funded 1,200 subgrantees serving K–12 immigrant children and youths.
• Nearly 1.1 million newly arrived K–12 immigrant children and youths were identified, of whom 67 percent (more than 730,000) participated in Title III programs.
Although there are many languages spoken within
the LEP student population, this does not mean that
all LEP students are new to the United States.
According to The Urban Institute (2006), in 2006, 80
percent of the children of immigrants were born in
the United States. Batalova (2006) reports that
approximately 74 percent of the total number of
identified LEP students in 2005–06 were born in the
United States, are U.S. citizens, and began their
academic careers in kindergarten and first grade,
the same as their English-speaking peers. The remaining 26 percent were immigrant
children and youths born in a country other than the United States. The majority of
immigrant children and youths (52 percent) also began their U.S. education in
kindergarten and first grade. These data indicate that the predominant need for
English language development instruction in U.S. school systems is for a large native-
born population that does not speak English proficiently (Urban Institute, 2006).
States must reserve up to 15 percent of their Title III funds
for making subgrants to local education agencies (LEAs)
that experience a significant increase, compared to the
average of the two preceding fiscal years, in the
percentage or number of immigrant children and youths
enrolled in public and nonpublic elementary and secondary
schools (§3114(d)(1)). Each state determines the definition
of “significant increase” within its own jurisdiction. Table 4
provides national data for the number of K–12 immigrant
children and youths identified and served for the 2004–05
and 2005–06 school years.
States with the largest number of immigrant children and youths: • California • Florida • New York • Texas • Georgia States with the fewest number of immigrant children and youths: • Michigan • North Dakota • Alaska • Montana • Wyoming
Page 13

Title III Biennial Report to Congress, 2004-06 National Overview
Table 4. Immigrant K–12 students: School years 2004–05 and 2005–06 School year 2004–05 School year 2005–06
Immigrant students
Number of students identified
Number of identified students served
Percentage of identified students served
Number of
students identified
Number of
students served
Percentage of identified
students served
Reported Number
1,189,039 781,245 65.1 1,087,771 731,598 67.3
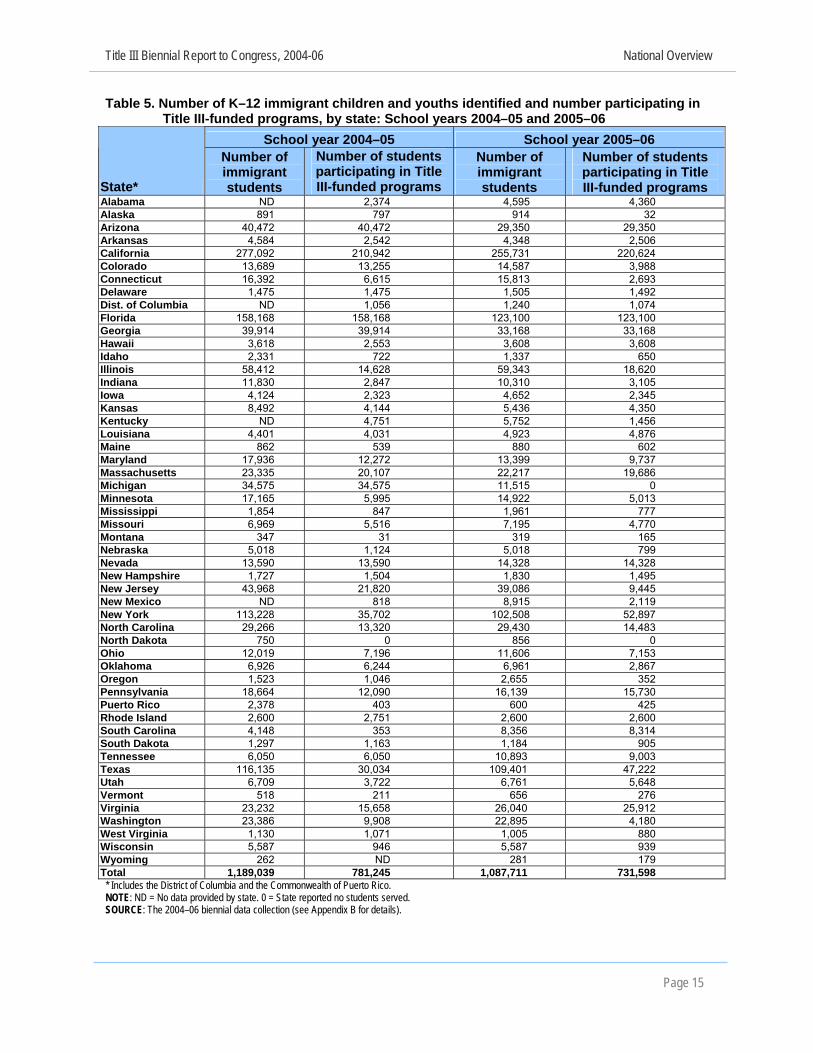
SOURCE: The 2004–06 biennial data collection (see Appendix B for details). Table 5 lists the number of immigrant students reported by each state, as well as the
number of immigrant students who participated in Title III-funded programs. In school
year 2005–06, a total of 1,087,771 immigrant children and youths were enrolled in
U.S. schools; 731,598 of these students were in programs funded by one of 1,193 Title
III subgrants. The data indicate that across the country, about two-thirds of immigrant
students are in Title III-funded programs for immigrant children and youths. (For more
information on immigrant children and youths, see the section “Subgrants to LEAs
experiencing substantial increases in immigrant children and youths”).
Page 14
Title III Biennial Report to Congress, 2004-06 National Overview
Table 5. Number of K–12 immigrant children and youths identified and number participating in Title III-funded programs, by state: School years 2004–05 and 2005–06
School year 2004–05 School year 2005–06
State*
Number of immigrant students
Number of students participating in Title III-funded programs
Number of immigrant students
Number of students participating in Title III-funded programs
Alabama ND 2,374 4,595 4,360 Alaska 891 797 914 32 Arizona 40,472 40,472 29,350 29,350 Arkansas 4,584 2,542 4,348 2,506 California 277,092 210,942 255,731 220,624 Colorado 13,689 13,255 14,587 3,988 Connecticut 16,392 6,615 15,813 2,693 Delaware 1,475 1,475 1,505 1,492 Dist. of Columbia ND 1,056 1,240 1,074 Florida 158,168 158,168 123,100 123,100 Georgia 39,914 39,914 33,168 33,168 Hawaii 3,618 2,553 3,608 3,608 Idaho 2,331 722 1,337 650 Illinois 58,412 14,628 59,343 18,620 Indiana 11,830 2,847 10,310 3,105 Iowa 4,124 2,323 4,652 2,345 Kansas 8,492 4,144 5,436 4,350 Kentucky ND 4,751 5,752 1,456 Louisiana 4,401 4,031 4,923 4,876 Maine 862 539 880 602 Maryland 17,936 12,272 13,399 9,737 Massachusetts 23,335 20,107 22,217 19,686 Michigan 34,575 34,575 11,515 0 Minnesota 17,165 5,995 14,922 5,013 Mississippi 1,854 847 1,961 777 Missouri 6,969 5,516 7,195 4,770 Montana 347 31 319 165 Nebraska 5,018 1,124 5,018 799 Nevada 13,590 13,590 14,328 14,328 New Hampshire 1,727 1,504 1,830 1,495 New Jersey 43,968 21,820 39,086 9,445 New Mexico ND 818 8,915 2,119 New York 113,228 35,702 102,508 52,897 North Carolina 29,266 13,320 29,430 14,483 North Dakota 750 0 856 0 Ohio 12,019 7,196 11,606 7,153 Oklahoma 6,926 6,244 6,961 2,867 Oregon 1,523 1,046 2,655 352 Pennsylvania 18,664 12,090 16,139 15,730 Puerto Rico 2,378 403 600 425 Rhode Island 2,600 2,751 2,600 2,600 South Carolina 4,148 353 8,356 8,314 South Dakota 1,297 1,163 1,184 905 Tennessee 6,050 6,050 10,893 9,003 Texas 116,135 30,034 109,401 47,222 Utah 6,709 3,722 6,761 5,648 Vermont 518 211 656 276 Virginia 23,232 15,658 26,040 25,912 Washington 23,386 9,908 22,895 4,180 West Virginia 1,130 1,071 1,005 880 Wisconsin 5,587 946 5,587 939 Wyoming 262 ND 281 179 Total 1,189,039 781,245 1,087,711 731,598
* Includes the District of Columbia and the Commonwealth of Puerto Rico. NOTE: ND = No data provided by state. 0 = State reported no students served. SOURCE: The 2004–06 biennial data collection (see Appendix B for details).
Page 15

Title III Biennial Report to Congress, 2004-06 National Overview
Language Instruction Educational Programs for K–12 LEP Students Once students have been identified as LEP using a state-approved ELP assessment,
their school districts must determine the type of research-based LIEP that will serve
their LEP students best. Title III requires districts to provide “high-quality LIEPs that
are based on scientifically based research demonstrating the effectiveness of the
programs” (§3115(c)(1)). Determining which type of program is most appropriate
depends on a variety of factors, such as:
• the number of LEP students in the school and district;
• the number of LEP students who speak the same native language;
• any state-legislated mandates that define program approaches for LEP
students in the state;
• the availability of appropriate materials, teachers, and other resources; and
• the preferences of individual parents.
The survey data collected for this report indicate that 43 states and the District of
Columbia provide subgrantees with written guidance on how to select a research-
based LIEP. Most states offered a variety of programs. Generally, these programs can
be classified by the language of instruction, whether predominantly English (possibly
with some support in the native language) or a combination of English and the native
language. Based on the work of Linquanti (1999) and NCELA (2000), there currently
are four general types of English-only LIEPs used within the states and five general
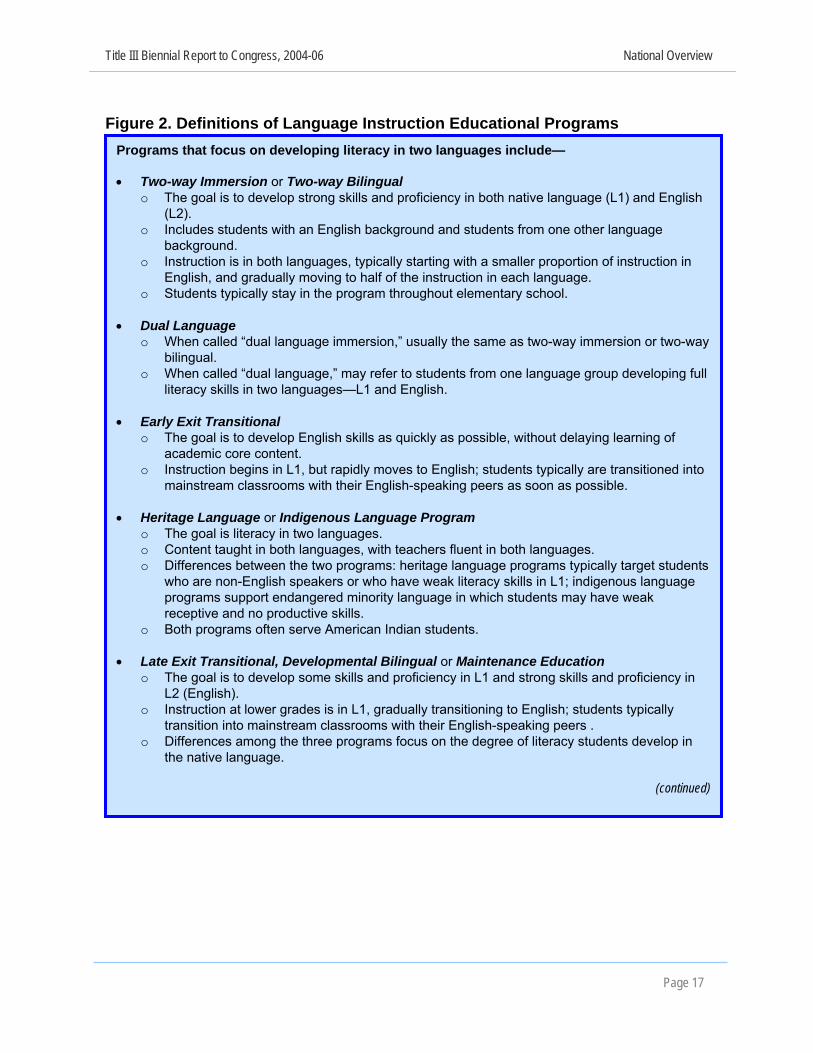
types of LIEPs that provide instruction in two languages. For brief descriptions of these
programs, see figure 2.
Page 16
Title III Biennial Report to Congress, 2004-06 National Overview
Figure 2. Definitions of Language Instruction Educational Programs Programs that focus on developing literacy in two languages include—
• Two-way Immersion or Two-way Bilingual
o The goal is to develop strong skills and proficiency in both native language (L1) and English (L2).
o Includes students with an English background and students from one other language background.
o Instruction is in both languages, typically starting with a smaller proportion of instruction in English, and gradually moving to half of the instruction in each language.
o Students typically stay in the program throughout elementary school.
• Dual Language o When called “dual language immersion,” usually the same as two-way immersion or two-way
bilingual. o When called “dual language,” may refer to students from one language group developing full
literacy skills in two languages—L1 and English.
• Early Exit Transitional o The goal is to develop English skills as quickly as possible, without delaying learning of
academic core content. o Instruction begins in L1, but rapidly moves to English; students typically are transitioned into
mainstream classrooms with their English-speaking peers as soon as possible.
• Heritage Language or Indigenous Language Program o The goal is literacy in two languages. o Content taught in both languages, with teachers fluent in both languages. o Differences between the two programs: heritage language programs typically target students
who are non-English speakers or who have weak literacy skills in L1; indigenous language programs support endangered minority language in which students may have weak receptive and no productive skills.
o Both programs often serve American Indian students.
• Late Exit Transitional, Developmental Bilingual or Maintenance Education o The goal is to develop some skills and proficiency in L1 and strong skills and proficiency in
L2 (English). o Instruction at lower grades is in L1, gradually transitioning to English; students typically
transition into mainstream classrooms with their English-speaking peers . o Differences among the three programs focus on the degree of literacy students develop in
the native language.
(continued)
Page 17

Title III Biennial Report to Congress, 2004-06 National Overview
Page 18
Figure 2. Definitions of Language Instruction Educational Programs (continued from p.17)
SOURCE: Adapted from work by Linquanti (1999) and NCELA (2000); as well as the 2004-06 biennial data collection (for details of the data collection, see Appendix B).
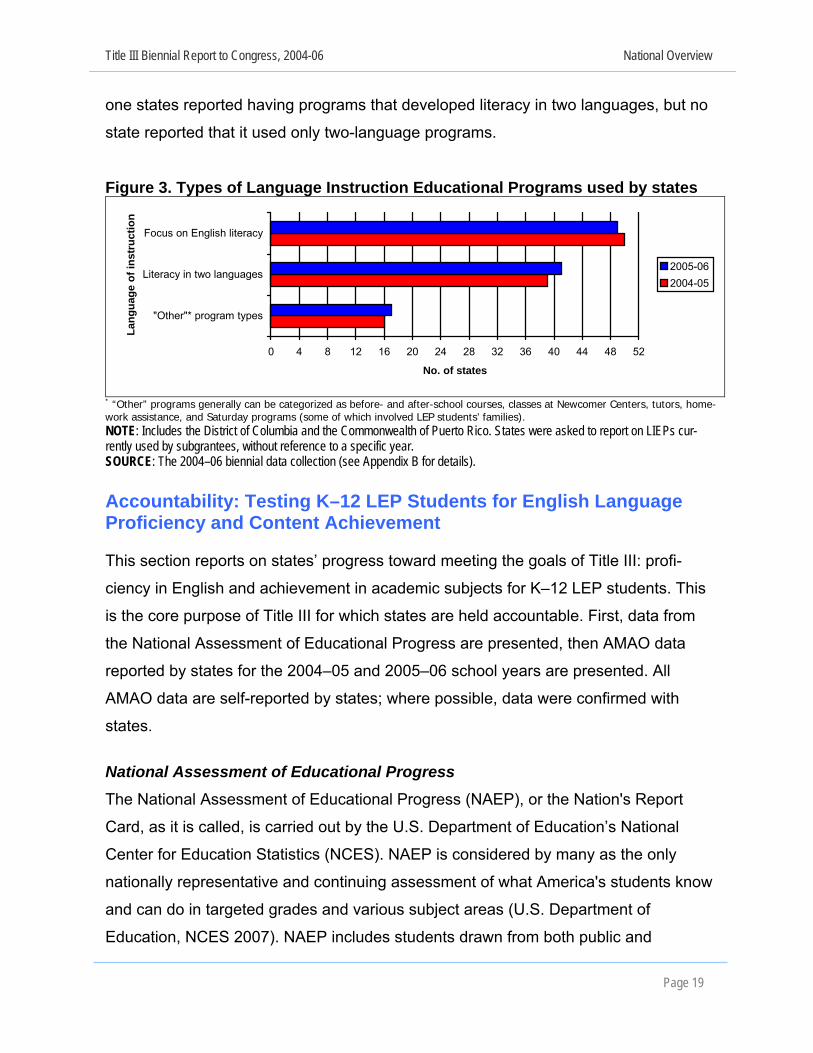
Figure 3 provides a summary of the number of states that reported subgrantees using
LIEPs that focus on developing literacy in English, on developing literacy in two
languages, and “other”10 program approaches. The “other” category of LIEPs that
states reported for LEP students generally can be categorized as before- and after-
school courses, classes at Newcomer Centers, tutors, homework assistance, and
Saturday programs (some of which involved LEP students’ families). Seven states
reported that they had programs focused on developing literacy only in English. Forty- 10 The extent to which some of these “other” programs truly were LIEPs was not clear, but they are reported here as reported by states on the biennial data collection form.
Programs that focus on developing literacy in only English include— • Specially Designed Academic Instruction in English (SDAIE), Content-based English as a
Second Language (ESL), Sheltered Instruction Observational Protocol (SIOP), or Sheltered English o The goal is proficiency in English while learning content in an all-English setting. o Students from various linguistic and cultural backgrounds can be in the same class. o Instruction is adapted to students’ proficiency level and supplemented by gestures and visual
aids. o May be used with other methods; e.g., early exit may use L1 for some classes and SDAIE for
others.
• Structured English Immersion (SEI) o The goal is fluency in English, with only LEP students in the class. o All instruction is in English, adjusted to the proficiency level of students so subject matter is
comprehensible. o Teachers need receptive skill in students’ L1 and sheltered instructional techniques.
• English Language Development (ELD) or ESL Pull-out
o The goal is fluency in English. o Students leave their mainstream classroom to spend part of the day receiving ESL instruction,
often focused on grammar, vocabulary, and communication skills, not academic content. o There is typically no support for students’ native languages.
• ESL Push-in o The goal is fluency in English. o Students are served in a mainstream classroom, receiving instruction in English with some
native language support if needed. o The ESL teacher or an instructional aide provides clarification, translation if needed, and uses
ESL strategies.
Title III Biennial Report to Congress, 2004-06 National Overview
one states reported having programs that developed literacy in two languages, but no
state reported that it used only two-language programs.
Figure 3. Types of Language Instruction Educational Programs used by states
0 4 8 12 16 20 24 28 32 36 40 44 48 52
"Other"* program types
Literacy in two languages
Focus on English literacy
Lang
uage
of i
nstr
uctio
n
No. of states
2005-062004-05
* “Other” programs generally can be categorized as before- and after-school courses, classes at Newcomer Centers, tutors, home-work assistance, and Saturday programs (some of which involved LEP students’ families). NOTE: Includes the District of Columbia and the Commonwealth of Puerto Rico. States were asked to report on LIEPs cur-rently used by subgrantees, without reference to a specific year. SOURCE: The 2004–06 biennial data collection (see Appendix B for details). Accountability: Testing K–12 LEP Students for English Language Proficiency and Content Achievement This section reports on states’ progress toward meeting the goals of Title III: profi-
ciency in English and achievement in academic subjects for K–12 LEP students. This
is the core purpose of Title III for which states are held accountable. First, data from
the National Assessment of Educational Progress are presented, then AMAO data
reported by states for the 2004–05 and 2005–06 school years are presented. All
AMAO data are self-reported by states; where possible, data were confirmed with
states.
National Assessment of Educational Progress
The National Assessment of Educational Progress (NAEP), or the Nation's Report
Card, as it is called, is carried out by the U.S. Department of Education’s National
Center for Education Statistics (NCES). NAEP is considered by many as the only
nationally representative and continuing assessment of what America's students know
and can do in targeted grades and various subject areas (U.S. Department of
Education, NCES 2007). NAEP includes students drawn from both public and
Page 19
Title III Biennial Report to Congress, 2004-06 National Overview
Page 20
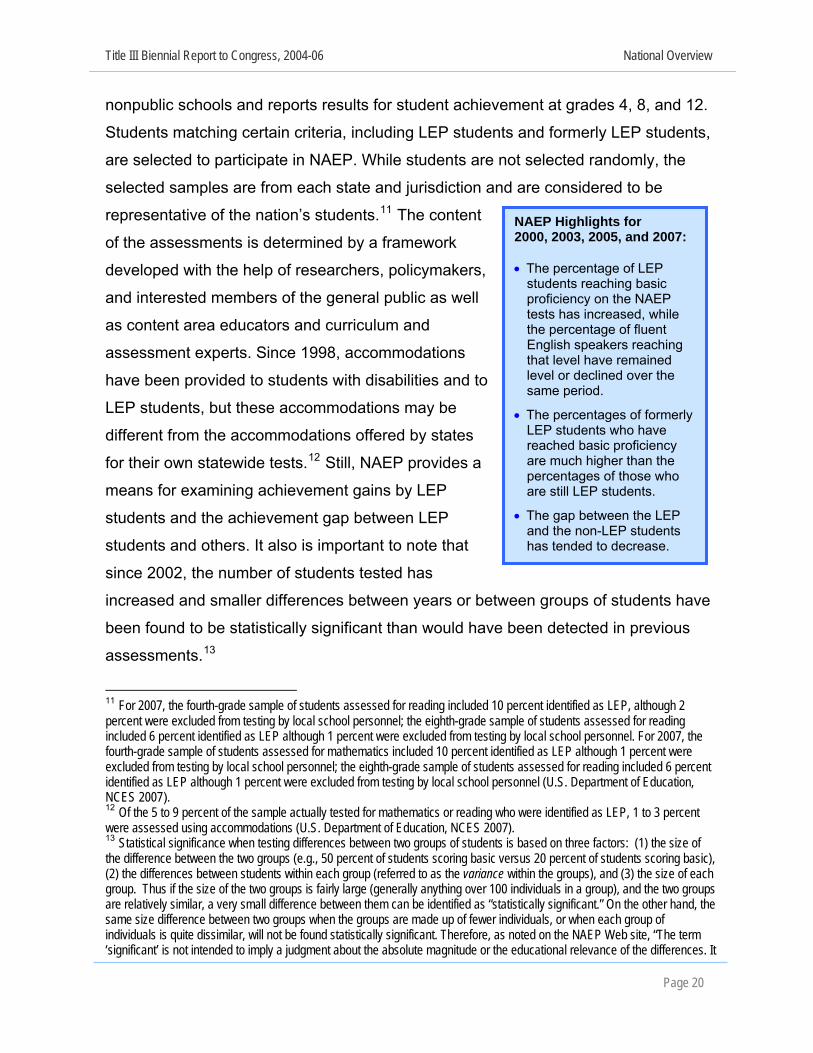
NAEP Highlights for 2000, 2003, 2005, and 2007: • The percentage of LEP
students reaching basic proficiency on the NAEP tests has increased, while the percentage of fluent English speakers reaching that level have remained level or declined over the same period.
• The percentages of formerly LEP students who have reached basic proficiency are much higher than the percentages of those who are still LEP students.
• The gap between the LEP and the non-LEP students has tended to decrease.
nonpublic schools and reports results for student achievement at grades 4, 8, and 12.
Students matching certain criteria, including LEP students and formerly LEP students,
are selected to participate in NAEP. While students are not selected randomly, the
selected samples are from each state and jurisdiction and are considered to be
representative of the nation’s students.11 The content
of the assessments is determined by a framework
developed with the help of researchers, policymakers,
and interested members of the general public as well
as content area educators and curriculum and
assessment experts. Since 1998, accommodations
have been provided to students with disabilities and to
LEP students, but these accommodations may be
different from the accommodations offered by states
for their own statewide tests.12 Still, NAEP provides a
means for examining achievement gains by LEP
students and the achievement gap between LEP
students and others. It also is important to note that
since 2002, the number of students tested has
increased and smaller differences between years or between groups of students have
been found to be statistically significant than would have been detected in previous
assessments.13
11 For 2007, the fourth-grade sample of students assessed for reading included 10 percent identified as LEP, although 2 percent were excluded from testing by local school personnel; the eighth-grade sample of students assessed for reading included 6 percent identified as LEP although 1 percent were excluded from testing by local school personnel. For 2007, the fourth-grade sample of students assessed for mathematics included 10 percent identified as LEP although 1 percent were excluded from testing by local school personnel; the eighth-grade sample of students assessed for reading included 6 percent identified as LEP although 1 percent were excluded from testing by local school personnel (U.S. Department of Education, NCES 2007). 12 Of the 5 to 9 percent of the sample actually tested for mathematics or reading who were identified as LEP, 1 to 3 percent were assessed using accommodations (U.S. Department of Education, NCES 2007). 13 Statistical significance when testing differences between two groups of students is based on three factors: (1) the size of the difference between the two groups (e.g., 50 percent of students scoring basic versus 20 percent of students scoring basic), (2) the differences between students within each group (referred to as the variance within the groups), and (3) the size of each group. Thus if the size of the two groups is fairly large (generally anything over 100 individuals in a group), and the two groups are relatively similar, a very small difference between them can be identified as “statistically significant.” On the other hand, the same size difference between two groups when the groups are made up of fewer individuals, or when each group of individuals is quite dissimilar, will not be found statistically significant. Therefore, as noted on the NAEP Web site, “The term ‘significant’ is not intended to imply a judgment about the absolute magnitude or the educational relevance of the differences. It

Title III Biennial Report to Congress, 2004-06 National Overview
Page 21
Figure 4 shows that LEP students generally have been making progress over the last
seven years in fourth-grade mathematics and reading, as well as in eighth-grade
mathematics, when looking at the percentage of students reaching at least the basic
level of proficiency. Although eighth-grade reading achievement of LEP students has
been level, as measured by the percentage reaching at least basic proficiency, the
percentage of eighth-grade non-LEP students reaching this level has declined over the
same time period. To describe LEP student progress statistically, the percentage of
fourth-grade and eighth-grade LEP students who scored at the basic level or higher in
mathematics was significantly higher in 2007 than in previous years (U.S. Department
of Education, NCES 2007). The percentage of fourth-grade LEP students who scored
at or above the basic level in reading was significantly higher in 2007 than in 2005;
however, the percentage of eighth-grade LEP students who scored at or above the
basic level in reading was not significantly different from 2005 (U.S. Department of
Education, NCES 2007).
Figure 4. Percentage of fourth- and eighth-grade LEP students (2000, 2003, 2005,
2007) and former LEP students (2005, 2007) scoring at or above basic proficiency on NAEP mathematics and reading
0
20
40
60
80
100
Grade 4 math Grade 8 math Grade 4 reading Grade 8 reading
Grade and subject
Perc
enta
ge s
corin
g at
or a
bove
bas
ic
LEP 2000LEP 2003LEP 2005LEP 2007Former LEP 2005Former LEP 2007
NOTE: Former LEP students have only been tracked since 2005. SOURCE: (U.S. Department of Education, NCES 2007)
Beginning in 2005, formerly LEP students have been identified and tracked (see figure
4). In reviewing data from 2005, it appears that formerly LEP students are is intended to identify statistically dependable population differences to help inform dialogue among policymakers, educators, and the public. … [Further, readers] are cautioned against interpreting NAEP results as implying causal relations” (U.S. Department of Education, NCES 2007).

Title III Biennial Report to Congress, 2004-06 National Overview
Page 22
outperforming their LEP peers; in the data from 2007, it appears that this pattern
continues: There are about 30-40 percent more formerly LEP students scoring at least
at the basic level of proficiency than their LEP peers at each grade level and in both
content areas. For those who were formerly LEP students, the percentage of students
scoring at least at the basic level of proficiency appears to have increased from 2005
to 2007 for the fourth-grade students in both math and reading and for the eighth-
grade students in reading.
An important question is whether and how LIEPs funded by Title III of ESEA may have
affected the gap in achievement scores between students who speak English
proficiently and those who do not. As indicated in figure 5, this gap has closed since
2000 in fourth-grade mathematics by nearly 10 percentage points; other grade levels
showed very small decreases in the gap—eighth-grade reading by about 3 percentage
points and fourth-grade reading by about 2 percentage points. While the relationship
between Title III funding and student achievement cannot be tested given the data
available, it may be possible to suggest that such a relationship may exist, especially
for fourth-grade LEP students.14
14 NAEP does not identify LEP students served within Title III-funded LIEPs. However, it was noted previously that 85 percent of LEP students are served by such programs. It therefore can be assumed that about 85 percent of the LEP students in the NAEP samples were participating in Title III-funded LIEPs. Thus a cause-and-effect relationship cannot be confirmed, but seems plausible.

Title III Biennial Report to Congress, 2004-06 National Overview
Figure 5:Percentage difference between non-LEP students and LEP students scoring at or above basic proficiency on NAEP in 2000, 2003, 2005, and 2007
05
101520253035404550
Grade 4 reading Grade 4 math Grade 8 reading Grade 8 math
Grade and subject
Perc
enta
ge d
iffer
ence
be
twee
n LE
P an
d no
n-LE
P st
uden
ts
2000200320052007
SOURCE: (U.S. Department of Education, NCES 2007).
Annual Measurable Achievement Objectives According to Title III of ESEA, all AMAOs must be developed in a manner that “reflects the amount of time an individual child has been enrolled in a language instruction educational program; and uses consistent methods and measurements to reflect the increases [in English language development]” ((§3122(a)(2)). AMAO 1 includes “at a minimum, annual increases in the number or percentage of children making progress in learning English” (§3122(a)(3)(A)(i)). AMAO 2 includes “at a minimum, annual increases in the number or percentage of children attaining English proficiency by the end of each school year, as determined by a valid and reliable assessment of English proficiency consistent with section 1111(b)(7)” (§3122(a)(3)(A)(ii)).
In addition to academic achievement in the core content
areas, each state must assess students on an annual basis
for ELP. They must set targets for and provide performance
data that indicate the percentage of students who reach the
targets. These requirements constitute Title III annual
measurable achievement objectives (AMAOs).
Progress and attainment of English language
proficiency—AMAOs 1 and 2
AMAO 1 requires states to demonstrate that LEP students
are making progress in learning English; AMAO 2 requires
states to demonstrate that LEP students are attaining ELP.
Each state sets its own AMAO target for the percentage
and number of students making progress and attaining
ELP. In addition, each state establishes its own standards,
assessments, and criteria for exiting students from the LEP subgroup. For these
reasons and others, these data cannot be used to determine, across states, whether
LEP students made progress in attaining ELP against any common standard; they can
Page 23

Title III Biennial Report to Congress, 2004-06 National Overview
be used only to review the progress of the LEP populations against the standards (and
using the assessments) of the individual states.
In 2004–05, for AMAO 1 (LEP students making progress in ELP):
• Seven states, the District of Columbia, and the Commonwealth of Puerto Rico
provided no data;
• 42 states provided target data;
• 40 states provided performance data; and
• 24 states reported that they met their targets.
During the same year, for AMAO 2 (LEP students attaining ELP):
• Six states, the District of Columbia, and the Commonwealth of Puerto Rico pro-
vided no data;
• 41 states provided target data;
• 42 states provided performance data; and
• 30 states reported that they met their targets.
These AMAO data are provided in table 6.
In 2005–06, for AMAO 1 (LEP students making progress in ELP):
• Six states provided no data;
• 41 states, the District of Columbia, and the
Commonwealth of Puerto Rico provided target data; In 2005–06: • 24 states and the
Commonwealth of Puerto Rico reached their targets for AMAO 1 and
• 28 States reached their targets for AMAO 2.
• 38 states, the District of Columbia, and the
Commonwealth of Puerto Rico provided performance
data; and
• 24 states and the Commonwealth of Puerto Rico
reported that they met their targets.
In 2005–06, for AMAO 2 (LEP students attaining ELP):
• Six states provided no data;
• 41 states, the District of Columbia, and the Commonwealth of Puerto Rico pro-
vided target data;
Page 24

Title III Biennial Report to Congress, 2004-06 National Overview
• 41 states, the District of Columbia, and the Commonwealth of Puerto Rico pro-
vided performance data; and
• 28 states reported that they met their targets.
Several states reported that they did not provide the required data because they
recently began administering new ELP assessments and had not yet collected
sufficient data to determine reasonable AMAO targets. However, OELA has
consistently reminded the states that developing and administering new assessments
did not exempt them from submitting the required data for the biennial report. The data
by state for 2005–06 are provided in table 7.
Page 25

Title III Biennial Report to Congress, 2004-06 National Overview
Table 6. Results for AMAOs 1 and 2, by state: School year 2004–05 AMAO 1: Making progress in English AMAO 2: Attaining English proficiency
State* Percentage of students
making progress Met target? Percentage of students
attaining proficiency Met target? Alabama ND ND ND ND Alaska 37.5 No 12.6 No Arizona 53.0 Yes 17.0 Yes Arkansas 37.0 Yes 48.0 Yes California 62.9 Yes 38.8 Yes Colorado ND ND ND ND Connecticut 62.9 Yes 19.6 Yes Delaware 78.0 No 4.6 No Dist. of Columbia ND ND ND ND Florida ND ND ND ND Georgia 63.1 Yes 37.6 Yes Hawaii 54.9 No 12.7 Yes Idaho 59.2 No 11.8 Yes Illinois 70.0 No 35.4 Yes Indiana 63.5 No 27.0 No Iowa 12.0 No 24.0 Yes Kansas 76.9 Yes 23.1 Yes Kentucky 40.0 No 24.0 Yes Louisiana 90.5 Yes 9.5 No Maine ND ND 4.0 No Maryland ND ND ND ND Massachusetts 56.1 Yes 39.9 Yes Michigan ND ND ND ND Minnesota 77.4 Yes 4.0 Yes Mississippi 73.4 No 53.7 Yes Missouri ND ND 22.1 ND Montana ND ND ND ND Nebraska ND ND 22.8 Yes Nevada 93.0 No 13.0 Yes New Hampshire 83.6 Yes 19.5 No New Jersey 64.0 Yes 96.5 Yes New Mexico 54.0 Yes 31.0 Yes New York 48.4 No 15.4 Yes North Carolina 81.0 Yes 53.3 Yes North Dakota 90.0 Yes 6.6 No Ohio 33.9 No 5.3 Yes Oklahoma 50.0 Yes 22.0 Yes Oregon 61.3 No 12.1 Yes Pennsylvania 75.0 Yes 24.8 No Puerto Rico ND ND ND ND Rhode Island 73.3 Yes 39.2 No South Carolina 64.7 Yes 1.8 Yes South Dakota 74.0 Yes 43.0 Yes Tennessee 52.6 Yes 14.3 No Texas 45.0 Yes ND ND Utah 47.1 No 37.0 Yes Vermont 66.3 No 6.8 No Virginia 54.3 Yes 26.6 Yes Washington 74.8 Yes 72.0 Yes West Virginia 85.0 Yes 7.0 Yes Wisconsin 55.0 No 45.0 No Wyoming 41.6 No 54.9 Yes Total 40 states provided data 24 met target 42 states provided data 30 met target
* Includes the District of Columbia and the Commonwealth of Puerto Rico. NOTE: ND = No data provided by state. AMAO = Annual Measurable Achievement Objective. AMAO 1 measures students making progress in learning English. AMAO 2 measures students attaining English language proficiency. SOURCE: The 2004–06 biennial data collection (see Appendix B for details).
Page 26
Title III Biennial Report to Congress, 2004-06 National Overview
Table 7. Results for AMAOs 1 and 2, by state: School year 2005–06 AMAO 1: Making progress in English AMAO 2: Attaining English proficiency
Statea Percentage of students
making progress Met target? Percentage of students
attaining proficiency Met target? Alabama 65.9 Yes 17.2 Yes Alaska 31.6 No 21.4 Yes Arizona 57.0 Yes 16.0 Yes Arkansas 56.0 No 42.0 Yes California 62.4 Yes 40.3 Yes Colorado 47.0 Yes 38.0 Yes Connecticut 67.1 Yes 40.2 Yes Delaware 79.7 No 4.4 No Dist. of Columbia 32.4 No 2.5 No Florida ND ND ND ND Georgia 60.0 Yes 21.0 No Hawaii 56.0 No 13.0 Yes Idaho ND ND 18.4 No Illinois 81.2 No 18.3 Yes Indiana 43.2 No 16.4 No Iowa 78.3 No 8.1 No Kansas 89.6 Yes 10.39 No Kentucky 85.9 Yes 29.8 Yes Louisiana 41.2 No 14.3 No Maine 37.0 No 3.0 No Maryland 70.6 No 24.6 Yes Massachusetts 64.0 Yes 48.0 Yes Michigan ND ND ND ND Minnesota 84.7 Yes 15.7 Yes Mississippi 90.7 Yes 45.5 Yes Missouri ND Yes 21.0 Yes Montana ND ND ND ND Nebraska 78.0 No 24.6 Yes Nevada 94.0 No 15.0 Yes New Hampshire ND ND ND ND New Jersey 66.0 Yes 93.9 Yes New Mexico ND Nob 27.0 Yes New York ND ND ND ND North Carolina 67.4 Yes 10.2 No North Dakota 80.1 Yes 7.3 No Ohio 31.1 No 42.9 No Oklahoma 63.0 Yes 26.0 Yes Oregon 48.0 No 12.0 No Pennsylvania 64.0 Yes 35.9 No Puerto Rico 14.0 Yes 39.0 No Rhode Island ND ND ND ND South Carolina 77.6 Yes 8.1 Yes South Dakota 35.6 No 64.4 Yes Tennessee 55.9 Yes 29.0 No Texas 53.4 ND 34.4 ND Utah 63.0 No 18.0 Yes Vermont 60.3 Yes 16.9 Yes Virginia 86.0 Yes 38.0 Yes Washington 90.0 Yes 70.0 Yes West Virginia 75.0 Yes 8.0 Yes Wisconsin ND Yesc ND Yesc Wyoming ND ND ND ND
Total 40 states provided data 25 met targets 43 states provided data 28 met targets a Includes the District of Columbia and the Commonwealth of Puerto Rico. b New Mexico provided no target data and no performance data, but did report that it had not reached its targets c Wisconsin provided no target data and no performance data, but reported that it had reached its targets. NOTE: ND = No data provided by state. AMAO = Annual Measurable Achievement Objective. AMAO 1 measures students making progress in learning English. AMAO 2 measures students attaining English language proficiency. SOURCE: The 2004–06 biennial data collection (see Appendix B for details).
Page 27
Title III Biennial Report to Congress, 2004-06 National Overview
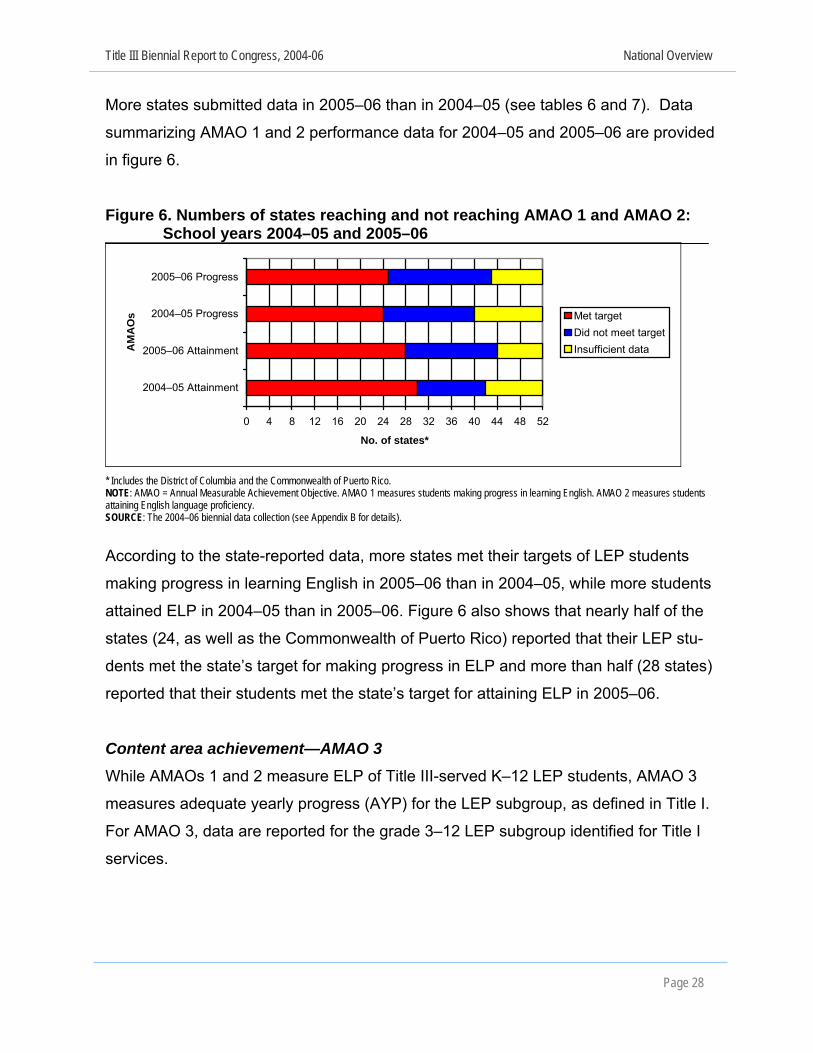
More states submitted data in 2005–06 than in 2004–05 (see tables 6 and 7). Data
summarizing AMAO 1 and 2 performance data for 2004–05 and 2005–06 are provided
in figure 6.
Figure 6. Numbers of states reaching and not reaching AMAO 1 and AMAO 2: School years 2004–05 and 2005–06
0 4 8 12 16 20 24 28 32 36 40 44 48 52
2004–05 Attainment
2005–06 Attainment
2004–05 Progress
2005–06 Progress
AM
AO
s
No. of states*
Met targetDid not meet targetInsufficient data
* Includes the District of Columbia and the Commonwealth of Puerto Rico. NOTE: AMAO = Annual Measurable Achievement Objective. AMAO 1 measures students making progress in learning English. AMAO 2 measures students attaining English language proficiency. SOURCE: The 2004–06 biennial data collection (see Appendix B for details).
According to the state-reported data, more states met their targets of LEP students
making progress in learning English in 2005–06 than in 2004–05, while more students
attained ELP in 2004–05 than in 2005–06. Figure 6 also shows that nearly half of the
states (24, as well as the Commonwealth of Puerto Rico) reported that their LEP stu-
dents met the state’s target for making progress in ELP and more than half (28 states)
reported that their students met the state’s target for attaining ELP in 2005–06.
Content area achievement—AMAO 3
While AMAOs 1 and 2 measure ELP of Title III-served K–12 LEP students, AMAO 3
measures adequate yearly progress (AYP) for the LEP subgroup, as defined in Title I.
For AMAO 3, data are reported for the grade 3–12 LEP subgroup identified for Title I
services.
Page 28

Title III Biennial Report to Congress, 2004-06 National Overview
Page 29
Although states were required to test only three grade levels in 2004–05, many states
tested more grade levels as they prepared to test seven grade levels by 2005–06.15
Table 8 shows that states differed greatly in the extent to which they reached their
targets for AMAO 3:
• 6.8 percent to 80.5 percent of
LEP students tested scored in
the proficient or advanced
categories on state annual
mathematics assessments;
• 2.8 percent to 80.5 percent of
LEP students tested scored in
the proficient or advanced
categories on state reading or
language arts assessments; and
• New York and Puerto Rico did
not provide achievement data for
mathematics or reading or
language arts for the LEP
subgroup.
15 As mandated by ESEA §1111(b)(3)(C).
AMAO 3 Is Adequate Yearly Progress (AYP) as defined in Title I of ESEA: “Each State plan shall demonstrate, based on academic assessments ... , what constitutes ade-quate yearly progress of the State, and of all pub-lic … schools, and local education agencies in the State, toward enabling all … students to meet the State’s student academic achievement standards, while working toward the goal of narrowing the achievement gaps …” (§1111(b)(2)(B)). “‘Adequate yearly progress’ shall be defined by the State in a manner that applies the same high standards of academic achievement to all … stu-dents in the State; … includes separate measur-able annual objectives for continuous and substantial improvement for each of the following: … students with limited English proficiency; … includes graduation rates for public secondary school students … and at least one other aca-demic indicator …” (§1111(b)(2)(C)(i), (v)(II)(dd), & (vi)). “Each year for a school to make adequate yearly progress under this paragraph – each group of students described in subparagraph (C)(v) must meet or exceed the objectives set by the State … and not less than 95 percent of each group of students described in subparagraph (C)(v) who are enrolled in the school are required to take the assessments” (§1111(b)(2)(I)(i-ii)).
Title III Biennial Report to Congress, 2004-06 National Overview
Table 8. Results for AMAO 3, by state: School year 2004–05
State*
Percentage of students proficient or advanced in
mathematics
Percentage of students proficient or advanced in reading or language arts
Alabama 53.5 58.1 Alaska 40.6 44.7 Arizona 29.4 19.8 Arkansas 28.0 28.0 California 30.0 21.4 Colorado 64.1 71.6 Connecticut 43.6 27.9 Delaware 42.4 41.6 Dist. of Columbia 48.1 19.8 Florida 40.1 34.0 Georgia 60.9 31.6 Hawaii 6.8 13.8 Idaho 48.2 47.8 Illinois 43.0 56.4 Indiana 52.7 43.9 Iowa 44.7 36.0 Kansas 45.9 60.1 Kentucky 25.0 37.0 Louisiana 63.8 54.8 Maine 14.6 18.9 Maryland 42.9 37.0 Massachusetts 15.6 18.9 Michigan 47.0 44.0 Minnesota 48.3 44.7 Mississippi 73.3 62.2 Missouri 19.0 12.0 Montana 18.2 19.6 Nebraska 71.5 66.5 Nevada 26.2 21.0 New Hampshire 10.5 2.8 New Jersey 44.4 32.5 New Mexico 15.9 31.8 New York ND ND North Carolina 70.6 51.9 North Dakota 30.6 32.4 Ohio 49.5 57.2 Oklahoma 49.7 48.4 Oregon 61.7 55.7 Pennsylvania 40.3 24.1 Puerto Rico ND ND Rhode Island 11.0 11.0 South Carolina 18.4 15.7 South Dakota 21.4 27.4 Tennessee 63.5 47.8 Texas 62.0 68.5 Utah 45.8 41.3 Vermont 39.1 10.2 Virginia 77.0 68.9 Washington 18.2 35.4 West Virginia 76.9 75.7 Wisconsin 40.4 46.7 Wyoming 80.5 80.5
Total 50 states provided data 50 states provided data * Includes the District of Columbia and the Commonwealth of Puerto Rico. NOTE: ND = No data provided by state. AMOA = Annual Measurable Achievement Objective. AMOA 3 is a measure of Adequate Yearly Progress as indicated by student performance on assessments. SOURCE: Data provided by Office of Planning, Evaluation and Policy Development, U.S. Department of Education (Nov. 8, 2007).
Page 30

Title III Biennial Report to Congress, 2004-06 National Overview
Page 31
In 2005–06, states were required to test content area achievement in grades 3–8 and
once in high school.16 Table 9 shows that 50 states and the District of Columbia
provided mathematics and reading or language arts achievement data at all seven
grade levels. As in 2004–05, there was wide variability in the extent to which states
met their targets for AMAO 3:
• 4.7 percent to 82.2 percent of LEP students tested scored in the proficient or
advanced categories in mathematics;
• 4.4 percent to 82.2 percent of LEP students tested scored in the proficient or
advanced categories in reading or language arts achievement; and
• The Commonwealth of Puerto Rico did not provide achievement data for either
mathematics or reading or language arts for the LEP subgroup.
Based on the information that states provided in their biennial reports to the
Department of Education, reaching state targets for AMAO 3 proved to be difficult for
states during 2005–06, possibly due to the greater number of grade levels that were
being tested.17 Nearly three-quarters of states did not reach their performance targets
at all grade levels in mathematics. A greater percentage of states did not reach their
performance targets at all grade levels in reading or language arts. One state met all
performance targets in mathematics. No state met all performance targets in reading
or language arts.
16 The grade tested in high school is at the discretion of the state. 17 In their biennial reports, some states noted that because students in some grade levels had not been tested previously, they did not know how to create targets without baseline data. As noted earlier, other states indicated that they had a new assessment (or had used their assessment only once), did not know how well students would perform on the assessment, and could not create a target without baseline data.

Title III Biennial Report to Congress, 2004-06 National Overview
Table 9. Results for AMAO 3, by state: School year 2005–06
State* Percentage of students
proficient or advanced in mathematics
Percentage of students proficient or advanced in
reading/language arts Alabama 57.5 53.2 Alaska 43.7 50.5 Arizona 29.2 18.5 Arkansas 39.8 37.4 California 33.2 24.1 Colorado 63.5 67.2 Connecticut 45.8 28.4 Delaware 39.7 38.4 Dist. of Columbia 20.0 22.2 Florida 42.9 38.7 Georgia 64.0 58.7 Hawaii 7.6 12.4 Idaho 60.3 56.7 Illinois 56.4 62.7 Indiana 55.7 45.5 Iowa 49.7 38.6 Kansas 53.4 46.7 Kentucky 27.3 38.0 Louisiana 62.8 55.9 Maine 28.3 25.8 Maryland 46.0 40.8 Massachusetts 15.8 15.6 Michigan 51.1 46.8 Minnesota 29.2 40.1 Mississippi 70.9 61.7 Missouri 4.7 4.4 Montana 19.1 33.2 Nebraska 77.3 69.7 Nevada 24.0 17.1 New Hampshire 31.7 31.6 New Jersey 43.1 34.3 New Mexico 19.7 34.6 New York 45.7 42.5 North Carolina 40.7 56.8 North Dakota 45.3 43.4 Ohio 53.3 56.3 Oklahoma 52.3 52.4 Oregon 55.9 50.8 Pennsylvania 40.3 23.8 Puerto Rico ND ND Rhode Island 14.3 17.3 South Carolina 33.4 26.9 South Dakota 37.7 53.1 Tennessee 64.3 57.7 Texas 65.9 71.2 Utah 48.3 48.4 Vermont 40.4 46.1 Virginia 65.1 72.3 Washington 18.1 31.3 West Virginia 70.8 66.2 Wisconsin 50.7 54.6 Wyoming 82.2 82.2
Total 51 states provided data 51 states provided data * Includes the District of Columbia and the Commonwealth of Puerto Rico. NOTE: ND = No data provided by state. AMOA = Annual Measurable Achievement Objective. AMOA 3 is a measure of Adequate Yearly Progress as indicated by student performance on assessments. SOURCE: Data provided by Office of Planning, Evaluation and Policy Development, U.S. Department of Education (Nov. 8, 2007).
Page 32

Title III Biennial Report to Congress, 2004-06 National Overview
Page 33
Examining the 2005–06 data by grade level shows some interesting patterns
emerging:
• Achievement decreases as grade level increases—with each grade level,
fewer states met their targets;
• Achievement in mathematics, as measured by states reaching their
performance targets, is higher than in reading or language arts;
• Fewer states reach their targets in mathematics in grades 3 to 7 as the
grade level increases (from a high of 21 states reaching their targets in
grade 3 to a low of five states in grade 7);
• The number of states reaching their targets in mathematics increases from
grade 8 to high school18 (six states and eight states, respectively, reaching
their targets); and
• Fewer states reach their targets in reading or language arts as the grade
level increases (from a high of nine states reaching their targets in grade 3
to a low of two states reaching their targets in high school).
These data are presented in figure 7.
Figure 7. Number of states meeting content achievement targets, by grade level: School year 2005–06
048
1216202428323640444852
3 4 5 6 7 8 HS*
Grade level
No.
of s
tate
s
MathReading or Lang. Arts
*States test once in high school, at their own discretion. NOTE: Includes the District of Columbia and the Commonwealth of Puerto Rico SOURCE: The 2004–06 biennial data collection (see Appendix B for details).
18 States test once in high school, at their own discretion.

Title III Biennial Report to Congress, 2004-06 National Overview
Academic content testing in the native language
Under ESEA, LEP students may be assessed in their native language in reading or
language arts for up to three years, with an additional two years permitted on a case-
by-case basis. The native language assessment must be equivalent to the grade-level
academic English language assessment given to all students and be aligned with the
content standards in reading or language arts (see §1111(b)(3)(C)(ii), (ix)(III), and (x)).
A total of 11 states reported that they provided tests of at least one academic content
area in a language other than English. Nine states tested mathematics in at least one
native language in at least one grade level; all of the nine tested in Spanish with three
also testing in at least one additional language. Six states tested reading or language
arts in Spanish in at least one grade level.
Accommodations for content area achievement tests Accommodations generally refer to supports and strategies used to assist students as
they take a test. However, accommodations should not invalidate the assessment
results by altering the constructs being tested or by providing an unfair advantage to
the students. The ESEA provides that LEP students “shall be assessed in a valid and
reliable manner and provided reasonable accommodations on assessments”
(§1111(b)(3)(C)(ix)(III)).
The performance of LEP students on content assessments, such as mathematics,
science, and history, can be confounded by language that may be irrelevant to the
content. As a result, these tests often measure students’ English language abilities
rather than their knowledge of the content. When this occurs, schools and districts are
unable to accurately determine students’ knowledge and skills. Accommodations can
improve the validity of LEP students’ test scores by measuring the academic content,
reducing the confounding effects of language, and allowing LEP students to
meaningfully participate in an assessment.
Page 34

Title III Biennial Report to Congress, 2004-06 National Overview
Page 35
Accommodations for LEP students that currently are supported by research include:
(1) reducing the linguistic complexity of the test items and the structure of the test
items;
(2) providing English glossaries or dictionaries that are customized to the
vocabulary and content of the particular test;
(3) allowing extra time to complete the assessment if the student has some
proficiency in English; and
(4) simplifying test directions, providing test directions in students’ native
language(s), or both.19
For the purposes of this Biennial Report to Congress, 20 accommodations that states
commonly offer were listed on the data collection form. States were asked to indicate
the accommodations that subgrantees offer their LEP students.20 The
accommodations that were most frequently indicated were extra time to complete the
test, administering the test individually or in small groups, and reading the test items
aloud. The least frequently indicated accommodations were modifying the vocabulary
of the test, providing additional examples or practice items, and modifying the linguistic
complexity of the test (see figure 8). Each state offered from two to 20
accommodations.
19 For more information about accommodations, including a greater discussion of recent and ongoing research and a lengthy reference list, see NCELA (2007a) or Francis, Rivera, Lesaux, Kieffer & Rivera (2006). 20 States were asked to indicate the accommodations used by subgrantees, but no specific year or time frame was indicated.

Title III Biennial Report to Congress, 2004-06 National Overview
Figure 8. Accommodations offered to K–12 LEP students by subgrantees
0 4 8 12 16 20 24 28 32 36 40 44 48 52
Modify vocabulary
Add more examples
Other
Modify linguistic complexity
Respond in Native Language
Provide English glossaries
Add more visuals
Provide Native Language glossaries
Modify test directions
Write answers in test booklet
Dictate answers
Oral directions in native language
Administer in separate rooms
Provide dictionaries
Administer in multiple sessions
Take breaks during testing
Read questions aloud in English
Read directions aloud
Allow extra time
Test in small groups/individually
Acc
omm
odat
ions
No. of states*
* Includes the District of Columbia and the Commonwealth of Puerto Rico. SOURCE: The 2004–06 biennial data collection (see Appendix B for details). Monitored students Students who are identified as LEP participate in LIEPs in order to gain literacy in
English and become proficient speakers, writers, readers, and listeners. Once they
attain this goal, as defined by the state, they transition into a regular classroom and no
longer participate in Title III-funded LIEPs. Title III requires that all students who have
exited programs be monitored for the following two years to ensure that they maintain
grade-appropriate English language skills and content area achievement.
Page 36

Title III Biennial Report to Congress, 2004-06 National Overview
States are required to report the number of students who are in their first or second
year of monitoring, as well as the number who have been returned to an LIEP or the
LEP category. In this report, 28 states and the District of Columbia provided data for
the 2004–05 school year and 31 states and the District of Columbia provided data for
the 2005–06 school year on the number and status of monitored students in each of
the two years of required monitoring. Other states provided total numbers of monitored
students across both years but could not distinguish students by year monitored.
States provided several explanations for not disaggregating monitored students by
year of monitoring, including:
• Students are tracked as “monitored,” not as year 1 monitoring and year 2
monitoring (11 states);
• There is no system to collect data for cohorts of students (eight states);
• These data will be collected beginning in 2006-07 (five states); and/or
• Collecting the data by year of monitoring began in 2005–06 and, thus, data are
not complete (five states).
According to Title III of ESEA, as part of its evaluation efforts, each subgrantee must provide the state, every second year, with “a description of the progress made by children in meeting challenging State academic content and stu-dent academic achievement stan-dards for each of the 2 years after such children are no longer receiv-ing services under [Title III]” (§3121(a)(4)).
The 43 states and the District of Columbia that reported on monitored students for the
2004–05 school year indicated that they were monitoring 380,894 students; for the
following year, 44 states and the District of Columbia reported that the number of
monitored students was 439,536. No states indicated that they had returned a student
to an LIEP either during or after monitoring. Because
developing ELP is one of the required goals of Title III,
following former LEP students is critical to evaluating
states’ progress toward that goal. Table 10 shows the
number of monitored students and the number of
those monitored students who scored at least
proficient in mathematics and reading or language arts
for the 2004–05 and 2005–06 school years.
Page 37

Title III Biennial Report to Congress, 2004-06 National Overview
Table 10. Number of monitored students and number scoring at least proficient in mathematics and reading or language arts, by state: School years 2004–05 and 2005–06
School year 2004–05 School year 2005–06 No. of monitored students scoring at least proficient
No. of monitored students scoring at least proficient
State*
Number of students
monitored Math Reading or
lang. arts
Number of students
monitored Math Reading or
lang. arts Alabama 430 578 582 2,640 294 301 Alaska 150 93 102 716 484 538 Arizona 19,270 4,941 4,724 50,418 22,037 20,664 Arkansas 0 ND ND 0 ND ND California 139,138 23,843 19,968 132,891 10,285 4,950 Colorado 12,231 18,103 20,947 11,565 7,461 8,498 Connecticut ND ND ND ND ND ND Delaware 1,494 261 273 1,008 403 362 Dist. of Columbia 754 109 95 717 166 223 Florida ND ND ND ND ND ND Georgia 8,443 8,442 8,443 8,089 8,089 7,916 Hawaii 1,634 469 953 1,491 368 601 Idaho 3,565 1,164 1,243 4,437 4,862 4,319 Illinois 10,871 4,965 4,027 ND ND ND Indiana 3,269 3,287 3,269 5,438 ND ND Iowa 526 526 490 1,071 743 703 Kansas ND 249 220 2,338 2,338 2,335 Kentucky 1,181 ND ND 946 370 455 Louisiana 1,884 348 317 1,367 276 271 Maine 8 7 8 47 157 487 Maryland 4,057 4,051 4,057 7,469 7,287 7,469 Massachusetts 22,421 3,579 4,597 18,362 1,689 2,055 Michigan ND 1,061 980 4,074 4,072 4,074 Minnesota 7,634 1,742 1,866 9,038 5,415 5,506 Mississippi 397 117 94 447 298 283 Missouri 183 183 155 931 931 802 Montana 14 35 32 51 ND ND Nebraska ND ND ND ND ND ND Nevada 3,000 2,108 3,000 8,552 8,492 8,498 New Hampshire 185 8 7 79 ND ND New Jersey 5,732 3,982 3,910 8,730 6,055 5,972 New Mexico 3,657 1,988 3,657 11,370 5,172 5,171 New York ND ND ND ND ND ND North Carolina 9,299 4,902 4,616 4,805 3,276 3,836 North Dakota 11 10 11 48 3 1 Ohio 1,271 547 600 143 117 132 Oklahoma 3,232 1,575 1,657 7,283 3,571 3,687 Oregon 378 1,297 1,264 344 2,572 2,605 Pennsylvania 756 756 605 0 ND ND Puerto Rico ND ND ND ND ND ND Rhode Island 2,748 3 3 2,246 2,154 2,139 South Carolina 3,497 963 888 1,898 834 782 South Dakota 442 1,557 1,557 1,163 392 531 Tennessee 5,259 2,441 2,424 6,416 2,963 11,020 Texas 81,131 75,502 81,131 92,842 87,342 92,842 Utah 3,999 1,470 1,526 6,191 1,254 1,162 Vermont 8 ND ND 66 ND ND Virginia 13,163 4,844 3,028 12,655 4,724 4,594 Washington 1,007 204 175 5,004 3,305 5,062 West Virginia 91 137 134 77 40 41 Wisconsin 2,474 2,473 2,474 4,053 3,491 4,053 Wyoming ND ND ND ND ND ND Total 380,894 184,920 190,109 439,536 213,782 224,940
* Includes the District of Columbia and the Commonwealth of Puerto Rico. NOTE: ND = No data provided by state. Data presented as provided and approved by the states. For most, number of monitored students comes from biennial data collection form item 3.1, former LEP students monitored by year; for those that did not respond to 3.1, numbers in this table come from 3.2, monitored former LEP student results by grade (and total). Numbers of students scoring at least proficient come from 3.2. See Appendix B for the biennial data collection form in full. SOURCE: 2004–06 biennial data collection.
Page 38

Title III Biennial Report to Congress, 2004-06 National Overview
Page 39
In 2005–06: • There were about 440,000
monitored, former LEP students enrolled in public schools;
• At least 225,000 monitored students were tested for mathematics and reading or language arts achievement;
• More than 210,000 monitored students scored at least proficient on the mathematics test;
• Almost 225,000 monitored students scored at least proficient on the reading or language arts test; and
• More than 50,000 monitored students were in grades that were not tested for AYP, as those above were, but were deemed to be meeting grade-level academic achievement standards.
In addition to the number of students monitored and the
test results for monitored students, states were asked to
provide the number of students in monitoring status but
in grades not tested for AYP;21 and the number of these
students who were achieving grade-level standards.
Several states found collecting these data challenging
in 2004–05, but fewer had problems in 2005–06. These
data are provided in figure 9 and show the following:
• The number of monitored students enrolled in
the states is higher than the number of monitored
students for whom test results or grade-level
achievement were reported. The major reasons
for this are that:
o some states did not maintain assessment
data on monitored students; and
o some states did not maintain information
about monitored students by grade level.
• During school years 2004–05 and 2005–06 nearly all monitored students for
whom states reported test scores for mathematics or reading or language arts
achievement were scoring at the proficient or advanced levels. However, the
number of achieving students is relatively low, and it is possible that states
reported scores only for students who were doing well.
• Although it appears that relatively few monitored students were achieving
grade-level standards, states only had to report these data for the monitored
students who were in grades not tested for AYP (in 2005–06, this was grades
K–2 and some high school grades).
21 During 2004–05, states tested from three grades (one in elementary school, one in middle school, and one in high school) to seven grades (grades 3–8 plus one in high school); during 2005–06 states were required to test grades 3–8 and one grade in high school—all other grades (e.g., K–2, the non-tested high school grades) still could have enrolled monitored students.
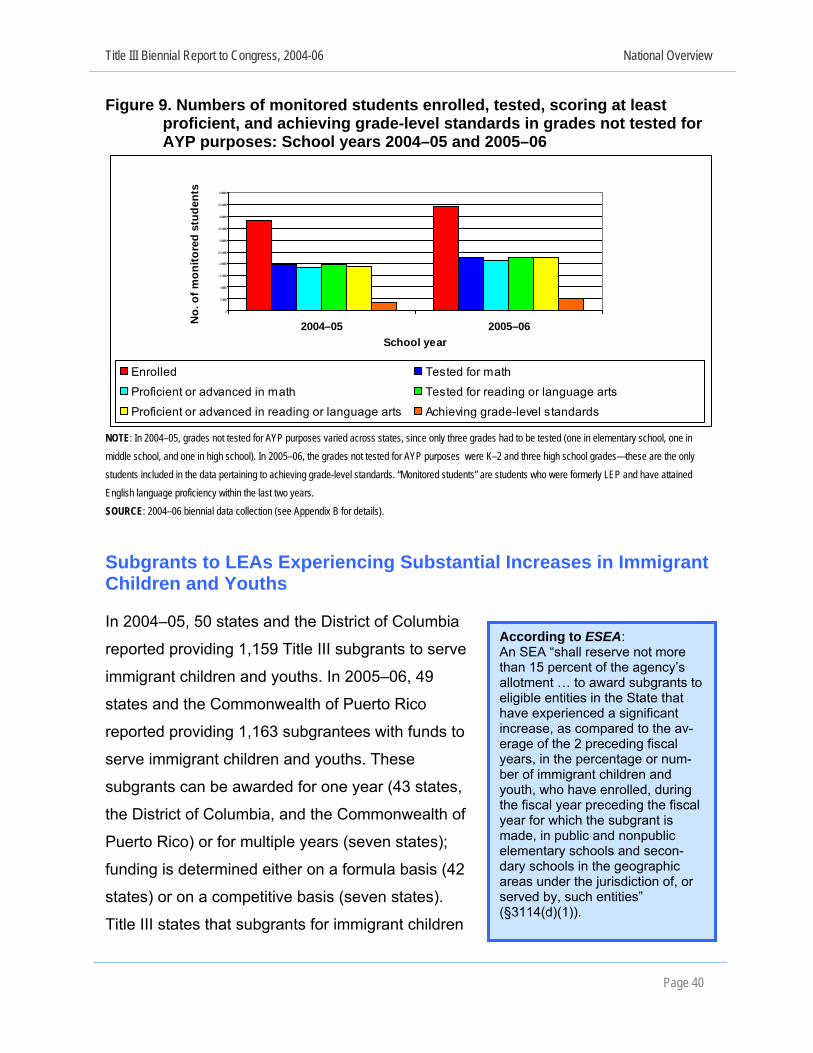
Title III Biennial Report to Congress, 2004-06 National Overview
Figure 9. Numbers of monitored students enrolled, tested, scoring at least proficient, and achieving grade-level standards in grades not tested for AYP purposes: School years 2004–05 and 2005–06
0
50,000
100,000
150,000
200,000
250,000
300,000
350,000
400,000
450,000
500,000
2004–05 2005–06School year
No.
of m
onito
red
stud
ents
Enrolled Tested for math
Proficient or advanced in math Tested for reading or language arts
Proficient or advanced in reading or language arts Achieving grade-level standards
NOTE: In 2004–05, grades not tested for AYP purposes varied across states, since only three grades had to be tested (one in elementary school, one in middle school, and one in high school). In 2005–06, the grades not tested for AYP purposes were K–2 and three high school grades—these are the only students included in the data pertaining to achieving grade-level standards. “Monitored students” are students who were formerly LEP and have attained English language proficiency within the last two years. SOURCE: 2004–06 biennial data collection (see Appendix B for details). Subgrants to LEAs Experiencing Substantial Increases in Immigrant Children and Youths In 2004–05, 50 states and the District of Columbia
reported providing 1,159 Title III subgrants to serve
immigrant children and youths. In 2005–06, 49
states and the Commonwealth of Puerto Rico
reported providing 1,163 subgrantees with funds to
serve immigrant children and youths. These
subgrants can be awarded for one year (43 states,
the District of Columbia, and the Commonwealth of
Puerto Rico) or for multiple years (seven states);
funding is determined either on a formula basis (42
states) or on a competitive basis (seven states).
Title III states that subgrants for immigrant children
According to ESEA: An SEA “shall reserve not more than 15 percent of the agency’s allotment … to award subgrants to eligible entities in the State that have experienced a significant increase, as compared to the av-erage of the 2 preceding fiscal years, in the percentage or num-ber of immigrant children and youth, who have enrolled, during the fiscal year preceding the fiscal year for which the subgrant is made, in public and nonpublic elementary schools and secon-dary schools in the geographic areas under the jurisdiction of, or served by, such entities” (§3114(d)(1)).
Page 40

Title III Biennial Report to Congress, 2004-06 National Overview
and youths should be used to fund “activities that provide enhanced instructional
opportunities for immigrant children and youth” (§3115(e)(1)). These activities may
include, but are not limited to, any of a list of seven activities specified in Title III.
Nearly all states indicated that funds in 2004-06 were used for all seven of the listed
activities. The two most frequently funded activities (each funded by 45 states, the
District of Columbia, and the Commonwealth of Puerto Rico) were:
(1) family literacy, parent outreach, and training activities designed to assist
parents to become active participants in the education of their children; and
(2) support for personnel, including teacher aides who have been specifically
trained, or are being trained, to provide services to immigrant children and
youths.
The least-funded activity was coordination with community-based organizations
(CBOs).
The number of states in which subgrantees used funds for each of the seven activities
is listed in figure 10.
Figure 10. Activities funded by subgrants for immigrant children and youths
0 4 8 12 16 20 24 28 32 36 40 44 48 52
Other
Coordinate with CBOs*
Other instructional services
Tutors & counselors
Basic instructional services
Identify & acquire materials
Support personnel
Family Literacy programs
Act
iviti
es
No. of states
* CBO = Community based organizations NOTE: Includes the District of Columbia and the Commonwealth of Puerto Rico. States were asked on the 2004-06 biennial data collection form to provide the number of subgrantees that were funding each of these activities, but the form did not indicate the year of the services. Thus states may have collected data for either or both of the years of this biennial report. SOURCE: The 2004-06 biennial data collection (see Appendix B for details).
Page 41

Title III Biennial Report to Congress, 2004-06 National Overview
Preparing Educational Staff to Work With LEP Students: Technical Assistance
According to Title I of ESEA: Title I requires that states “ensure that all teachers teaching in core academic subjects within the State are highly qualified not later than the end of the 2005–06 school year” (§1119(2)).
In order to ensure that all LEP children in our schools attain ELP
and high academic achievement, there must be appropriate,
research-based LIEPs and highly qualified teachers to meet the
needs of the LEP student group. States were asked to provide
the number of Title III teachers currently employed, and the
number they anticipated would be needed in five years. The 49
states and the Commonwealth of Puerto Rico that reported on
their Title III teaching staff indicated that they employed 319,624
teachers, an increase of about 6,000 teachers from the data reported in the first
biennial report to Congress for the 2002–03 and 2003–04 school years. States
anticipated needing another 104,394 teachers in five years (a total of 424,018
teachers in five years). These data illustrate the increasing need to expand the
recruitment and development of teachers prepared to meet the instructional needs of
LEP students. The Title III provision for highly qualified teachers to instruct students in
the content areas appears particularly challenging for small districts, rural or outlying
areas, and districts with increasing numbers of LEP students.
Of the District of Columbia, and the Commonwealth of Puerto Rico, and the 50 states
that submitted data, 41 states and the Commonwealth of Puerto Rico indicated that
they require special qualifications for Title III teachers. The most common requirement
was to have a basic teaching credential with an ESL or bilingual endorsement (42
states). Another important requirement was the need to demonstrate fluency in the
language of instruction (English, another language, or both, depending on the type of
program in which the teacher works). In some cases these requirements are enforced
by the state:
• 16 states require tests of English fluency;
• 11 states require tests of fluency in another language, if appropriate; and
• 33 states require a specific endorsement that includes language proficiency. Page 42

Title III Biennial Report to Congress, 2004-06 National Overview
In some cases, states hold the subgrantees accountable for hiring teachers who are
fluent in appropriate languages (seven states) and, in other cases, the subgrantees
have additional requirements (21 states and the Commonwealth of Puerto Rico).
Finally, most states require teachers to meet the ESEA requirements of a “highly
qualified” teacher if they are teaching core content to LEP students.
Teachers often are assisted in their classrooms
by paraprofessionals. Eleven states reported
that they require their ESL paraprofessionals to
have additional credentials, such as fluency in
English and any language of instruction,
participation in in-service training, a minimum of
60 college credits, or a passing score on a state-
developed assessment.
With regard to teachers for LEP students, states: • Currently employ about 320,000;
• Will need an additional 104,000 within the next five years;
• Require a basic teaching credential plus an ESL or bilingual endorse-ment (42 states);
• Test English fluency (required in 16 states; in nine states, LEAs do this testing);
• Test fluency in another language, as appropriate for the LIEP (re-quired in 11 states; in seven states, LEAs do this testing); and/or
• Require language proficiency as part of an endorsement (33 states).
To continue building and improving this
workforce, Title III requires states to provide
technical assistance to their subgrantees in
implementing professional development
programs for teachers of LEP students and specifically indicates that Title III
administrative funds can be used for these activities (§3111(b)(2)). States must
provide assistance to school districts in four distinct areas. Over the last two years,
nearly all states reported that they have assisted districts in these four areas:
(1) identifying, developing, and implementing measures of ELP (50 states, the
District of Columbia, and the Commonwealth of Puerto Rico);
(2) identifying and implementing LIEPs and curricula based on scientific research
(49 states, the District of Columbia, and the Commonwealth of Puerto Rico);
(3) helping LEP students meet academic content and student academic
achievement standards (49 states, the District of Columbia, and the
Commonwealth of Puerto Rico); and
Page 43

Title III Biennial Report to Congress, 2004-06 National Overview
Page 44
(4) promoting parental and community participation in programs that serve LEP
children (47 states, the District of Columbia, and the Commonwealth of Puerto
Rico).
The types of professional development assistance that states offered ranged from
training in instructional techniques and assessments to training in subject matter
content. The data show that the largest group receiving such professional
development services is general or regular classroom teachers, followed by teachers
working with LEP students. It is critical for LEP students’ attainment of ELP and
academic achievement that regular classroom teachers be fully prepared to meet their
needs, because most LEP students spend a substantial part of the school day in a
regular classroom. In addition, some states provide services to principals and
administrators, other educational personnel, and personnel from CBOs. States
reported providing professional development activities in 2004–06 to a total of 412,105
individuals; this number is presented by category of participant in figure 11.
Figure 11. Numbers of participants in state-offered professional development activities, by type of participant: School years 2004–06
0
50,000
100,000
150,000
200,000
250,000
300,000
Type of participant
No.
of p
artic
ipan
ts General classroom teachersTeachers of LEP studentsPrincipalsOther administratorsOther education personnelCBO* personnel
* CBO = Community based organization SOURCE: 2004-06 biennial data collection (see Appendix B for details).
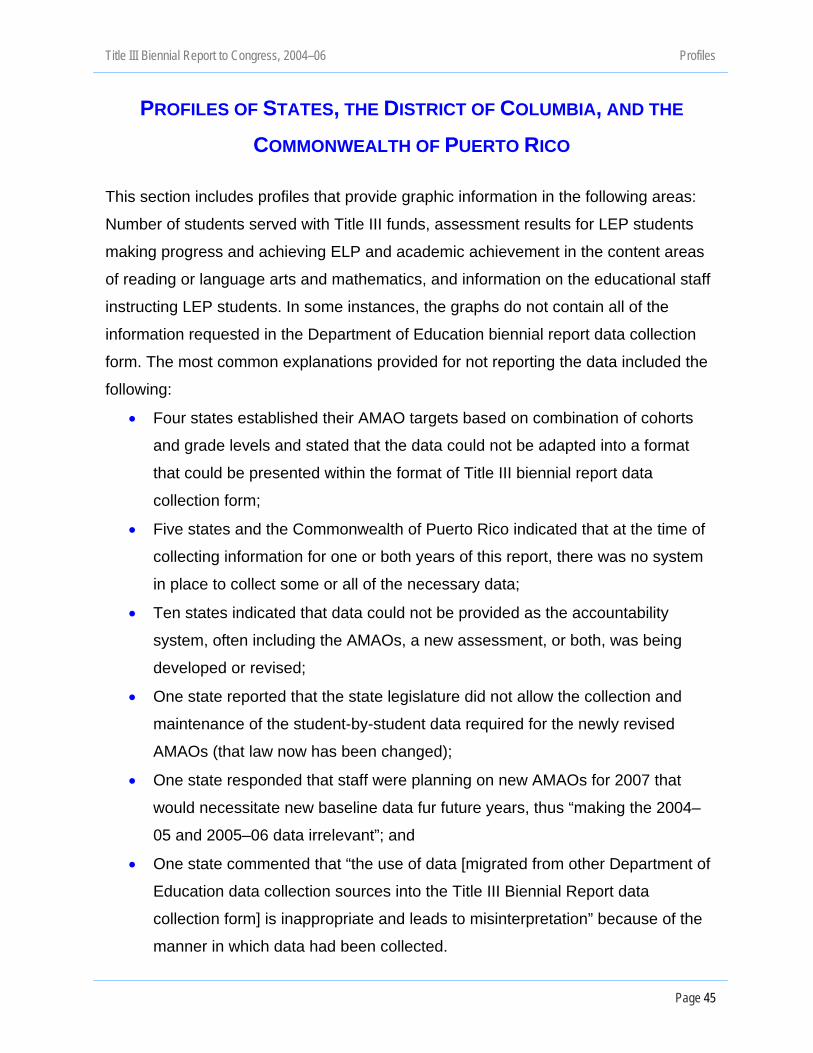
Title III Biennial Report to Congress, 2004–06 Profiles
PROFILES OF STATES, THE DISTRICT OF COLUMBIA, AND THE
COMMONWEALTH OF PUERTO RICO This section includes profiles that provide graphic information in the following areas:
Number of students served with Title III funds, assessment results for LEP students
making progress and achieving ELP and academic achievement in the content areas
of reading or language arts and mathematics, and information on the educational staff
instructing LEP students. In some instances, the graphs do not contain all of the
information requested in the Department of Education biennial report data collection
form. The most common explanations provided for not reporting the data included the
following:
• Four states established their AMAO targets based on combination of cohorts
and grade levels and stated that the data could not be adapted into a format
that could be presented within the format of Title III biennial report data
collection form;
• Five states and the Commonwealth of Puerto Rico indicated that at the time of
collecting information for one or both years of this report, there was no system
in place to collect some or all of the necessary data;
• Ten states indicated that data could not be provided as the accountability
system, often including the AMAOs, a new assessment, or both, was being
developed or revised;
• One state reported that the state legislature did not allow the collection and
maintenance of the student-by-student data required for the newly revised
AMAOs (that law now has been changed);
• One state responded that staff were planning on new AMAOs for 2007 that
would necessitate new baseline data fur future years, thus “making the 2004–
05 and 2005–06 data irrelevant”; and
• One state commented that “the use of data [migrated from other Department of
Education data collection sources into the Title III Biennial Report data
collection form] is inappropriate and leads to misinterpretation” because of the
manner in which data had been collected.
Page 45

Title III Biennial Report to Congress, 2004–06 Profiles
Page 46
Introduction It should be noted that there is a specific statement with each graph for which a
jurisdiction did not provide data and all such graphs are shaded entirely grey. For
graphs that specify “0” students or “0” teachers, the jurisdiction indicated that not one
student or teacher was in the affected category. Having no students or teachers in an
area is different from providing no data for that area.
Student information
Student information includes numbers of LEP K–12 students and immigrant K–12
students served by Title III funds as well as their assessment results for ELP and
academic achievement. These data do not repeat the information provided in the
national overview tables and figures (pp. 8–43).
Previous data provided in this Biennial Report to Congress listed the number of LEP
students and the number of immigrant children and youths identified and served in
2004–05 and 2005–06 (see Figure 1 and Tables 2 and 5 in the section Language
Instruction for Limited English Proficient Students: National Overview of Key Findings).
In this section the data represent the numbers of LEP and immigrant students actually
served by each state within Title III LEP programs from 2002–03 through 2005–06 so
that a larger pattern can be viewed.23 There generally are fewer LEP students and
immigrant students served than are identified. This is because parents may request
that their children not participate in Title III services, private schools might choose not
to participate in Title III services, or districts may choose not to request Title III funding.
States were asked to provide the percentage of LEP K–12 students who were
progressing in ELP and the percentage who had attained ELP. States used different
approaches to collect and report these data. States used a variety of methods for
determining targets for progressing in ELP and for attaining ELP. To simplify the
charts, and because states did not always indicate their decision process, separate
bars in each graph representing “progress” and “attained” are presented. 23 Data for 2002–03 and 2004–05 were taken from the Biennial Evaluation Report to Congress on the Implementation of the State Formula Grant Program 2002–04 (U.S. Department of Education, 2005).

Title III Biennial Report to Congress, 2004–06 Profiles
Page 47
Content area achievement data are presented only for 2005–06, the most recent year
for which data are available and the first year for which all states were to provide data
for the same grade levels: 3–8 and once in high school.24 As ESEA specifies that all
K–12 students should be scoring in the advanced and proficient categories by 2013–
14, the bar charts are set to compare the actual percentage of students who are
scoring in these categories against the 100 percent of students who “should” be
scoring in these categories. Separate bars for mathematics and reading or language
arts are presented. As noted in the national overview (see Figure 7 in the national
overview section of this report), there are two general patterns in these data: (1) the
percentage of LEP students scoring in at least the proficient category decreased as
grade level increased; and (2) the percentage of LEP students scoring in the proficient
category or higher was greater for mathematics than for reading or language arts. Each state was asked whether it exercised the option of testing students in their native
language(s). Although few states are taking this option (11 states tested students in
their native language; of these, nine tested mathematics and six tested reading or
language arts), the information is presented. The graphs are quite similar to those that
presented the results of testing academic content achievement in English—simple bar
graphs for each content area, by grade level; the data are those collected within the
Title III biennial report data collection form (see Appendix B). It again is important to
remember that comparisons across states should not be made. As noted previously,
each state creates its own standards, develops or identifies its own assessment(s),
identifies its own curricula, creates its own cut scores for the achievement categories
(e.g., advanced, proficient), and trains its own teachers. These differences mean that
the outcomes should not be compared among states.
Educational staff information The number of staff available to work with K–12 LEP students, and the training they
receive to ensure that their skills and knowledge meet the needs of the K–12 LEP
students, are keys to the success of LIEPs and the students they serve.
24 The grade tested in high school is at the discretion of the state.

Title III Biennial Report to Congress, 2004–06 Profiles
Each state was asked to provide information about the number of teachers currently
working with LEP students. States also were asked to indicate the number of
additional teachers that they anticipated needing in five years; this projection was not
to include current teachers. Some states indicated that they do not use Title III funds
for teachers (e.g., Hawaii) and other states (e.g., Pennsylvania) indicated that they
cannot differentiate between Title III-funded teachers and any other teachers serving
LEP students. Nevertheless, the numbers do indicate that a great many more teachers
are needed in most states. It is important to maintain and increase the skills and knowledge of all teachers who
currently work with K–12 LEP students and who may work with K–12 LEP students in
the future; the needs of various administrators and personnel from CBOs also must be
considered. Subgrantees (districts and consortia of districts) are expected to provide
professional development activities to all types of educational staff: teachers of K–12
LEP students, regular K–12 classroom teachers, principals, other building
administrators, other school personnel, and personnel employed by CBOs.
Subgrantees are asked to maintain records of the number of individuals within each of
these categories who participate in such activities.
Summary of Survey Results in Graphical Format for States, the District of Columbia, and the Commonwealth of Puerto Rico The following pages provide bar graphs and stacked bar graphs for each state. The
graphs provide information pertaining directly to students and include: Number of LEP
and immigrant students served by Title III funds for school years 2002–03 through
2005–06, the percentage of students making progress in ELP and the percentage
attaining proficiency, and the percentage of students advanced and proficient in
academic content for school year 2005–06. Information on whether or not tests were
offered in languages other than English is provided—in those cases where such tests
were available, the percentage of students scoring advanced or proficient on the test
for 2005–06 also is provided. The graphs also present information regarding
Page 48

Title III Biennial Report to Congress, 2004–06 Profiles
Page 49
educational staff, including the current number of certified teachers working with LEP
students as well as the number which the state estimates will be needed in five years,
and the number of educational staff receiving professional development via
subgrantees. There are two pages for each profile.

Profiles Alabama
Alabama Student Information Number of LEP and immigrant students served by Title III funds, 2002–03 through 2005–06
02,0004,0006,0008,000
10,00012,00014,00016,000
2002–03 2003–04 2004–05 2005–06
School year
No.
of s
tude
nts
No. LEP studentsNo. immigrant students
Percentage of students who made progress in ELP and percentage of students who attained ELP No data provided for 2004–05.
020
4060
80100
2004–05 2005–06
School year
Perc
enta
ge
Made progress in ELPAttained ELP
Percentage of students advanced or proficient in academic content achievement, school year 2005–06
0
20
40
60
80
100
3 4 5 6 7 8 HS*Grade level
Perc
enta
ge p
rof.
or a
dvan
ced
MathReading or Lang. Arts
*States test once in high school, at their own discretion. Testing in Native Language: Is testing offered in students’ native language(s)? No If yes, what language(s)? Not applicable
Page 50

Profiles Alabama
Page 51
Educational Staff Information NOTE: Numbers for educational staff information are current as of data collection; see Appendix C for details. Current number of certified teachers working with LEP students, and additional number needed in five years
0
100
200
300
400
500
Current and additional needed
No.
of c
ertif
ied
teac
hers
Additional neededCurrent no.
Number of educational staff receiving professional development via subgrantees, by type of staff
050
100150200250
Classro
om te
ache
rs
Teach
ers fo
r LEP
Princip
als
Other a
dmins
Other s
choo
l pers
onne
l
CBO* pers
onne
l
Type of staff
No.
par
ticip
ants
*Community-based organization

Profiles Alaska
Alaska Student Information Number of LEP and immigrant students served by Title III funds, 2002–03 through 2005–06
0
5,000
10,000
15,000
20,000
2002–03 2003–04 2004–05 2005–06
School year
No.
of s
tude
nts
No. LEP studentsNo. immigrant students
Percentage of students who made progress in ELP and percentage of students who attained ELP
0
20
40
60
80
100
2004–05 2005–06
School year
Perc
enta
ge
Made progress in ELPAttained ELP
Percentage of students advanced or proficient in academic content achievement, school year 2005–06
0
20
40
60
80
100
3 4 5 6 7 8 HS*Grade level
Perc
enta
ge p
rof.
or a
dvan
ced
MathReading or Lang. Arts
*States test once in high school, at their own discretion. Testing in Native Language: Is testing offered in students’ native language(s)? No If yes, what language(s)? Not applicable
Page 52

Profiles Alaska
Page 53
Educational Staff Information NOTE: Numbers for educational staff information are current as of data collection; see Appendix C for details. Current number of certified teachers working with LEP students, and additional number needed in five years.
0
200
400
600
800
1,000
1,200
Current and certified teachers
No.
of c
ertif
ied
teac
hers
Additional needed
Current no.
Number of educational staff receiving professional development via subgrantees, by type of staff No data provided.
0
0.2
0.4
0.6
0.8
1
Classro
om te
ache
rs
Teach
ers fo
r LEP
Princip
als
Other a
dmins
Other s
choo
l pers
onne
l
CBO* pers
onne
l
Type of staff
No.
par
ticip
ants
*Community-based organization

Profiles Arizona
Arizona Student Information Number of LEP and immigrant students served by Title III funds, 2002–03 through 2005–06
0
50,000
100,000
150,000
200,000
2002–03 2003–04 2004–05 2005–06
School year
No.
of s
tude
nts
No. LEP studentsNo. immigrant students
Percentage of students who made progress in ELP and percentage of students who attained ELP
0
20
40
60
80
100
2004–05 2005–06
School year
Perc
enta
ge
Made progress in ELPAttained ELP
Percentage of students advanced or proficient in academic content achievement, school year 2005–06
0
20
40
60
80
100
3 4 5 6 7 8 HS*Grade level
Perc
enta
ge p
rof.
or a
dvan
ced
MathReading or Lang. Arts
*States test once in high school, at their own discretion. Testing in Native Language: Is testing offered in students’ native language(s)? No If yes, what language(s)? Not applicable
Page 54

Profiles Arizona
Page 55
Educational Staff Information NOTE: Numbers for educational staff information are current as of data collection; see Appendix C for details. Current number of certified teachers working with LEP students, and additional number needed in five years
02,0004,0006,0008,000
10,00012,00014,000
Current and additional needed
No.
of c
ertif
ied
teac
hers
Additional neededCurrent no.
Number of educational staff receiving professional development via subgrantees, by type of staff
0
50
100
150
200
250
300
Classro
om te
ache
rs
Teach
ers fo
r LEP
Princip
als
Other a
dmins
Other s
choo
l pers
onne
l
CBO* pers
onne
l
Type of staff
No.
par
ticip
ants
*Community-based organization

Profiles Arkansas
Arkansas Student Information Number of LEP and immigrant students served by Title III funds, 2002–03 through 2005–06
0
5,000
10,000
15,000
20,000
2002–03 2003–04 2004–05 2005–06
School year
No.
of s
tude
nts
No. LEP studentsNo. immigrant students
Percentage of students who made progress in ELP and percentage of students who attained ELP
0
20
40
60
80
100
2004–05 2005–06
School year
Perc
enta
ge
Made progress in ELPAttained ELP
Percentage of students advanced or proficient in academic content achievement, school year 2005–06
0
20
40
60
80
100
3 4 5 6 7 8 HS*Grade level
Perc
enta
ge p
rof.
or a
dvan
ced
MathReading or Lang. Arts
*States test once in high school, at their own discretion. Testing in Native Language: Is testing offered in students’ native language(s)? No If yes, what language(s)? Not applicable
Page 56
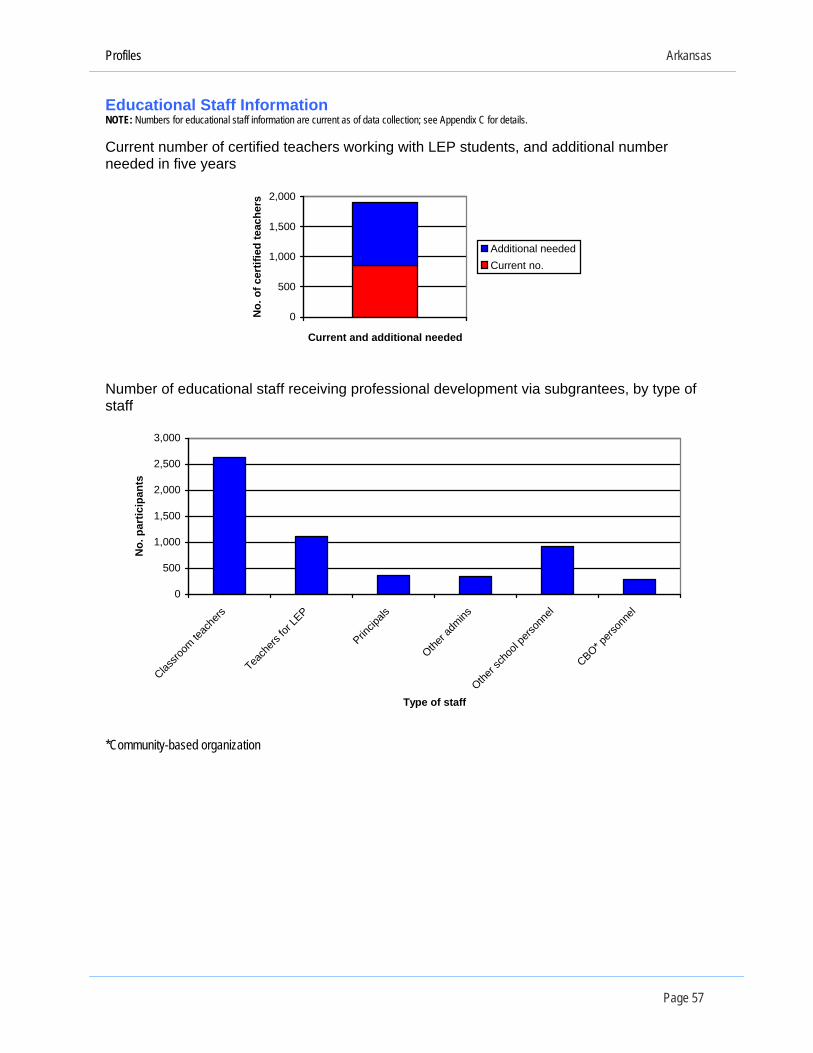
Profiles Arkansas
Page 57
Educational Staff Information NOTE: Numbers for educational staff information are current as of data collection; see Appendix C for details. Current number of certified teachers working with LEP students, and additional number needed in five years
0
500
1,000
1,500
2,000
Current and additional needed
No.
of c
ertif
ied
teac
hers
Additional neededCurrent no.
Number of educational staff receiving professional development via subgrantees, by type of staff
0
500
1,000
1,500
2,000
2,500
3,000
Classro
om te
ache
rs
Teach
ers fo
r LEP
Princip
als
Other a
dmins
Other s
choo
l pers
onne
l
CBO* pers
onne
l
Type of staff
No.
par
ticip
ants
*Community-based organization

Profiles California
California Student Information Number of LEP and immigrant students served by Title III funds, 2002–03 through 2005–06
0
500,000
1,000,000
1,500,000
2,000,000
2002–03 2003–04 2004–05 2005–06
School year
No.
of s
tude
nts
No. LEP studentsNo. immigrant students
Percentage of students who made progress in ELP and percentage of students who attained ELP
0
20
40
60
80
100
2004–05 2005–06
School year
Perc
enta
ge
Made progress in ELPAttained ELP
Percentage of students advanced or proficient in academic content achievement, school year 2005–06
0
20
40
60
80
100
3 4 5 6 7 8 HS*Grade level
Perc
enta
ge p
rof.
or a
dvan
ced
MathReading or Lang. Arts
*States test once in high school, at their own discretion. Testing in Native Language: Is testing offered in students’ native language(s)? No If yes, what language(s)? Not applicable
Page 58

Profiles California
Page 59
Educational Staff Information NOTE: Numbers for educational staff information are current as of data collection; see Appendix C for details. Current number of certified teachers working with LEP students, and additional number needed in five years
0
50,000
100,000
150,000
200,000
Current and additional needed
No.
of c
ertif
ied
teac
hers
Additional neededCurrent no.
Number of educational staff receiving professional development via subgrantees, by type of staff No data provided.
0
0.2
0.4
0.6
0.8
1
Classro
om te
ache
rs
Teach
ers fo
r LEP
Princip
als
Other a
dmins
Other s
choo
l pers
onne
l
CBO* pers
onne
l
Type of staff
No.
par
ticip
ants
*Community-based organization

Profiles Colorado
Colorado NOTE:In instances where data are missing, state did not have a system in place to collect all of the necessary data requested
by the biennial data collection form (reproduced in Appendix B).
Student Information Number of LEP and immigrant students served by Title III funds, 2002–03 through 2005–06
0
20,000
40,000
60,000
80,000
100,000
2002–03 2003–04 2004–05 2005–06
School year
No.
of s
tude
nts
No. LEP studentsNo. immigrant students
Percentage of students who made progress in ELP and percentage of students who attained ELP No data provided for 2004–05.
0
20
40
60
80
100
2004–05 2005–06
School year
Perc
enta
ge
Made progress in ELPAttained ELP
Percentage of students advanced or proficient in academic content achievement, school year 2005–06
0
20
40
60
80
100
3 4 5 6 7 8 HS*Grade level
Perc
enta
ge p
rof.
or a
dvan
ced
MathReading/LA
*States test once in high school, at their own discretion. Testing in Native Language: Is testing offered in students’ native language(s)? Yes If yes, what language(s)? Reading achievement: Spanish
Page 60

Profiles Colorado
Page 61
Percentage of students advanced and proficient in Spanish language test of reading or language arts, school year 2005–06
0
20
40
60
80
100
3 4
Grade level
Perc
enta
ge p
rof.
or
adva
nced
Reading or Lang. Arts
Educational Staff Information NOTE: Numbers for educational staff information are current as of data collection; see Appendix C for details. Current number of certified teachers working with LEP students, and additional number needed in five years
02,0004,0006,0008,000
10,00012,00014,000
Current and additional needed
No.
of c
ertif
ied
teac
hers
Additional neededCurrent no.
Number of educational staff receiving professional development via subgrantees, by type of staff
0
2,000
4,000
6,000
8,000
10,000
12,000
Classro
om te
ache
rs
Teach
ers fo
r LEP
Princip
als
Other a
dmins
Other s
choo
l pers
onne
l
CBO* pers
onne
l
Type of staff
No.
par
ticip
ants
*Community-based organization

Profiles Connecticut
Connecticut Student Information Number of LEP and immigrant students served by Title III funds, 2002–03 through 2005–06
05,000
10,00015,000
20,00025,000
30,000
2002–03 2003–04 2004–05 2005–06
School year
No.
of s
tude
nts
No. LEP studentsNo. immigrant students
Percentage of students who made progress in ELP and percentage of students who attained ELP
0
20
40
60
80
100
2004–05 2005–06
School year
Perc
enta
ge
Made progress in ELPAttained ELP
Percentage of students advanced or proficient in academic content achievement, school year 2005–06
0
20
40
60
80
100
3 4 5 6 7 8 HS*Grade level
Perc
enta
ge p
rof.
or a
dvan
ced
MathReading or Lang. Arts
*States test once in high school, at their own discretion. Testing in Native Language: Is testing offered in students’ native language(s)? No If yes, what language(s)? Not applicable
Page 62

Profiles Connecticut
Page 63
Educational Staff Information NOTE: Numbers for educational staff information are current as of data collection; see Appendix C for details. Current number of certified teachers working with LEP students, and additional number needed in five years
0
200
400
600
800
1,000
Current and additional needed
No.
of c
ertif
ied
teac
hers
Additional neededCurrent no.
Number of educational staff receiving professional development via subgrantees, by type of staff
01,0002,0003,0004,0005,0006,0007,0008,0009,000
10,000
Classro
om te
ache
rs
Teach
ers fo
r LEP
Princip
als
Other a
dmins
Other s
choo
l pers
onne
l
CBO* pers
onne
l
Type of staff
No.
par
ticip
ants
*Community-based organization

Profiles Delaware
Delaware Student Information Number of LEP and immigrant students served by Title III funds, 2002–03 through 2005–06
01,0002,0003,0004,0005,0006,0007,000
2002–03 2003–04 2004–05 2005–06
School year
No.
of s
tude
nts
No. LEP studentsNo. immigrant students
Percentage of students who made progress in ELP and percentage of students who attained ELP
0
20
40
60
80
100
2004–05 2005–06
School year
Perc
enta
ge
Made progress in ELPAttained ELP
Percentage of students advanced or proficient in academic content achievement, school year 2005–06
0
20
40
60
80
100
3 4 5 6 7 8 HS*Grade level
Perc
enta
ge p
rof.
or a
dvan
ced
MathReading or Lang. Arts
*States test once in high school, at their own discretion. Testing in Native Language: Is testing offered in students’ native language(s)? Yes If yes, what language(s)? Math achievement: Spanish
Page 64
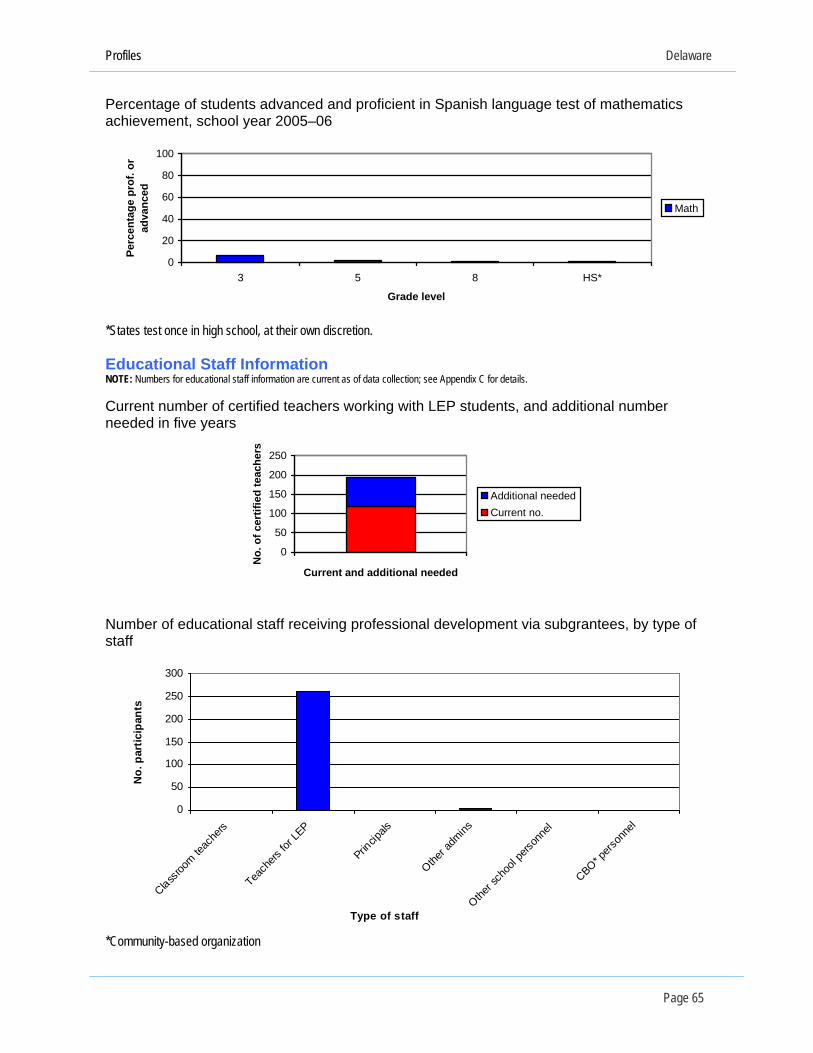
Profiles Delaware
Page 65
Percentage of students advanced and proficient in Spanish language test of mathematics achievement, school year 2005–06
0
20
40
60
80
100
3 5 8 HS*
Grade level
Perc
enta
ge p
rof.
or
adva
nced
Math
*States test once in high school, at their own discretion. Educational Staff Information NOTE: Numbers for educational staff information are current as of data collection; see Appendix C for details. Current number of certified teachers working with LEP students, and additional number needed in five years
0
50
100
150
200
250
Current and additional needed
No.
of c
ertif
ied
teac
hers
Additional neededCurrent no.
Number of educational staff receiving professional development via subgrantees, by type of staff
0
50
100
150
200
250
300
Classroo
m teac
hers
Teach
ers fo
r LEP
Princip
als
Other a
dmins
Other s
choo
l pers
onne
l
CBO* pers
onne
l
Type of staff
No.
par
ticip
ants
*Community-based organization
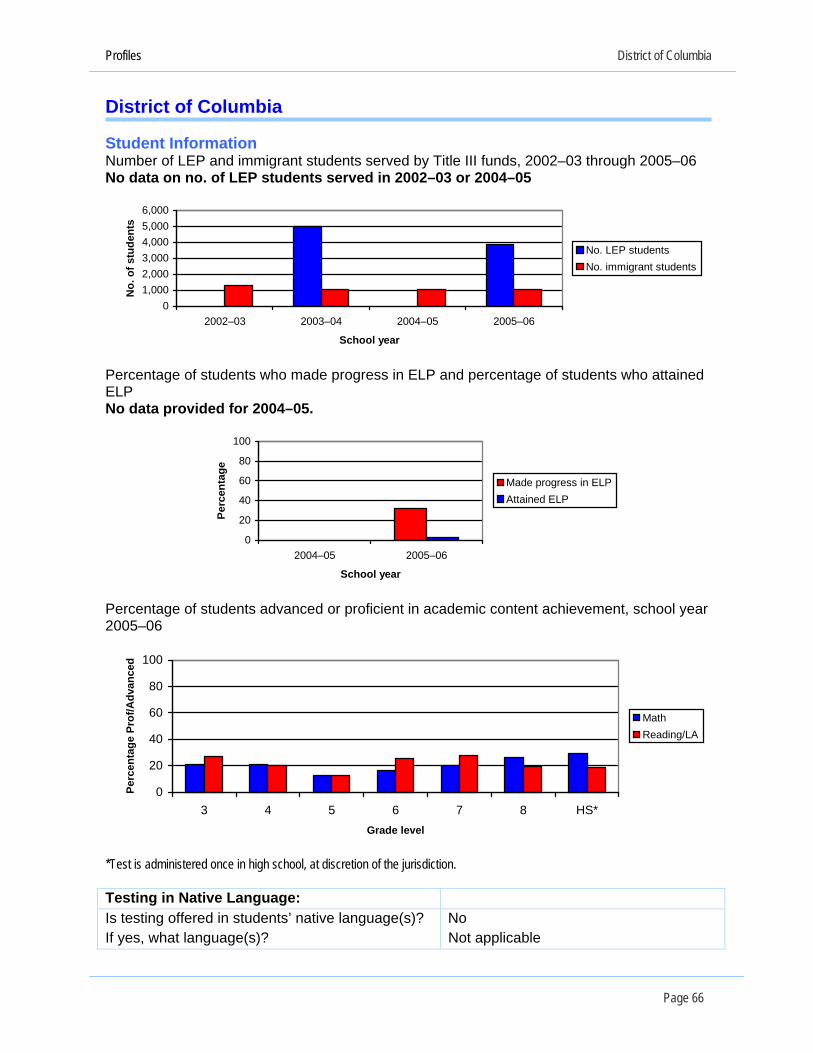
Profiles District of Columbia
District of Columbia Student Information Number of LEP and immigrant students served by Title III funds, 2002–03 through 2005–06 No data on no. of LEP students served in 2002–03 or 2004–05
01,0002,0003,0004,0005,0006,000
2002–03 2003–04 2004–05 2005–06
School year
No.
of s
tude
nts
No. LEP studentsNo. immigrant students
Percentage of students who made progress in ELP and percentage of students who attained ELP No data provided for 2004–05.
0
20
40
60
80
100
2004–05 2005–06
School year
Perc
enta
ge
Made progress in ELPAttained ELP
Percentage of students advanced or proficient in academic content achievement, school year 2005–06
0
20
40
60
80
100
3 4 5 6 7 8 HS*Grade level
Perc
enta
ge P
rof/A
dvan
ced
MathReading/LA
*Test is administered once in high school, at discretion of the jurisdiction. Testing in Native Language: Is testing offered in students’ native language(s)? No If yes, what language(s)? Not applicable
Page 66

Profiles District of Columbia
Page 67
Educational Staff Information NOTE: Numbers for educational staff information are current as of data collection; see Appendix C for details. Current number of certified teachers working with LEP students, and additional number needed in five years No data provided.
0
0.2
0.4
0.6
0.8
1
Current and additional needed
No.
of c
ertif
ied
teac
hers
Additional neededCurrent no.
Number of educational staff receiving professional development via subgrantees, by type of staff
0
100
200
300
400
500
600
700
Classro
om te
ache
rs
Teach
ers fo
r LEP
Princip
als
Other a
dmins
Other s
choo
l pers
onne
l
CBO* pers
onne
l
Type of staff
No.
par
ticip
ants
*Community-based organization
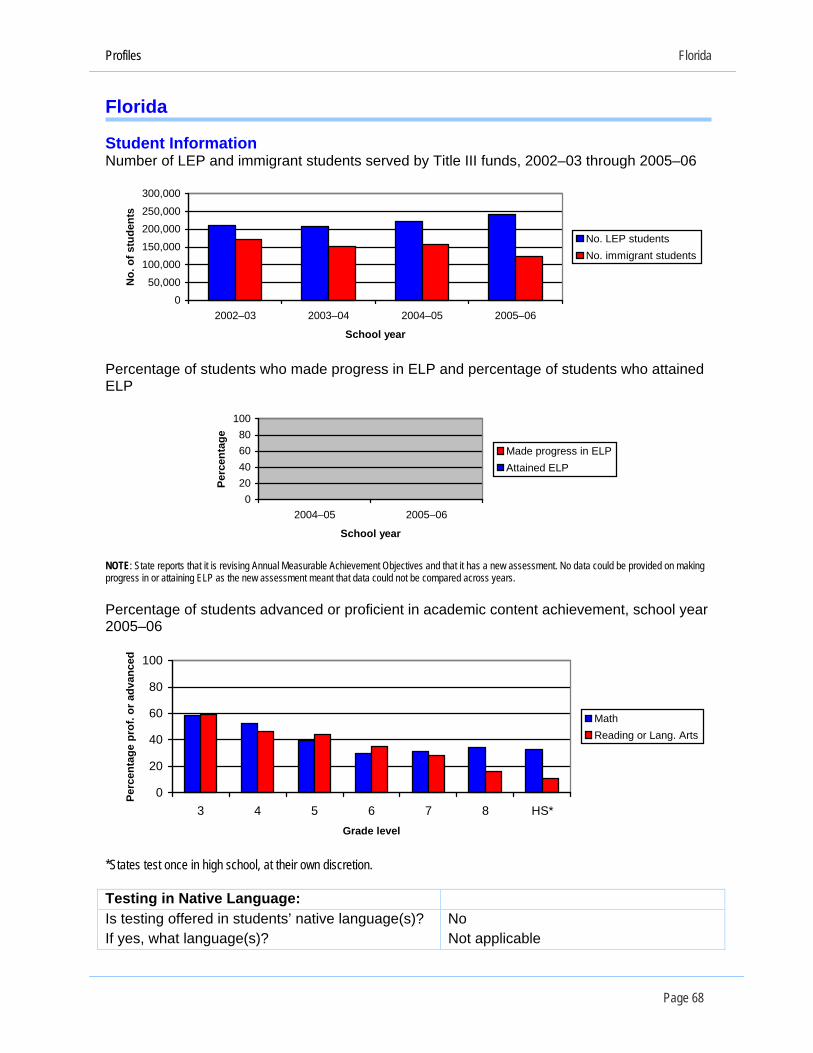
Profiles Florida
Florida Student Information Number of LEP and immigrant students served by Title III funds, 2002–03 through 2005–06
050,000
100,000150,000
200,000250,000
300,000
2002–03 2003–04 2004–05 2005–06
School year
No.
of s
tude
nts
No. LEP studentsNo. immigrant students
Percentage of students who made progress in ELP and percentage of students who attained ELP
020406080
100
2004–05 2005–06
School year
Perc
enta
ge
Made progress in ELPAttained ELP
NOTE: State reports that it is revising Annual Measurable Achievement Objectives and that it has a new assessment. No data could be provided on making progress in or attaining ELP as the new assessment meant that data could not be compared across years.
Percentage of students advanced or proficient in academic content achievement, school year 2005–06
0
20
40
60
80
100
3 4 5 6 7 8 HS*Grade level
Perc
enta
ge p
rof.
or a
dvan
ced
MathReading or Lang. Arts
*States test once in high school, at their own discretion. Testing in Native Language: Is testing offered in students’ native language(s)? No If yes, what language(s)? Not applicable
Page 68

Profiles Florida
Page 69
Educational Staff Information NOTE: Numbers for educational staff information are current as of data collection; see Appendix C for details. Current number of certified teachers working with LEP students, and additional number needed in five years No data provided on number of teachers needed in five years.
0
10,000
20,000
30,000
40,000
50,000
60,000
Current and additional needed
No.
of c
ertif
ied
teac
hers
Additional neededCurrent no.
Number of educational staff receiving professional development via subgrantees, by type of staff No data provided.
0
0.2
0.4
0.6
0.8
1
Classro
om te
ache
rs
Teach
ers fo
r LEP
Princip
als
Other a
dmins
Other s
choo
l pers
onne
l
CBO* pers
onne
l
Type of staff
No.
par
ticip
ants
*Community-based organization

Profiles Georgia
Georgia Student Information Number of LEP and immigrant students served by Title III funds, 2002–03 through 2005–06
010,00020,00030,00040,00050,00060,00070,00080,000
2002–03 2003–04 2004–05 2005–06
School year
No.
of s
tude
nts
No. LEP studentsNo. immigrant students
Percentage of students who made progress in ELP and percentage of students who attained ELP
0
20
40
60
80
100
2004–05 2005–06
School year
Perc
enta
ge
Made progress in ELPAttained ELP
Percentage of students advanced or proficient in academic content achievement, school year 2005–06
0
20
40
60
80
100
3 4 5 6 7 8 HS*Grade level
Perc
enta
ge p
rof.
or a
dvan
ced
MathReading or Lang. Arts
*States test once in high school, at their own discretion. Testing in Native Language: Is testing offered in students’ native language(s)? No If yes, what language(s)? Not applicable
Page 70

Profiles Georgia
Page 71
Educational Staff Information NOTE: Numbers for educational staff information are current as of data collection; see Appendix C for details. Current number of certified teachers working with LEP students, and additional number needed in five years
01,0002,0003,0004,0005,0006,0007,000
Current and additional needed
No.
of c
ertif
ied
teac
hers
Additional neededCurrent no.
Number of educational staff receiving professional development via subgrantees, by type of staff
0
10,000
20,000
30,000
40,000
50,000
60,000
70,000
Classro
om te
ache
rs
Teach
ers fo
r LEP
Princip
als
Other a
dmins
Other s
choo
l pers
onne
l
CBO* pers
onne
l
Type of staff
No.
par
ticip
ants
*Community-based organization

Profiles Hawaii
Hawaii Student Information Number of LEP and immigrant students served by Title III funds, 2002–03 through 2005–06 No data provided on no. LEP served in 2002–03.
0
5,000
10,000
15,000
20,000
2002–03 2003–04 2004–05 2005–06
School year
No.
of s
tude
nts
No. LEP studentsNo. immigrant students
Percentage of students who made progress in ELP and percentage of students who attained ELP
0
20
40
60
80
100
2004–05 2005–06
School year
Perc
enta
ge
Made progress in ELPAttained ELP
Percentage of students advanced or proficient in academic content achievement, school year 2005–06
0
20
40
60
80
100
3 4 5 6 7 8 HS*Grade level
Perc
enta
ge p
rof.
or a
dvan
ced
MathReading or Lang. Arts
*States test once in high school, at their own discretion. Testing in Native Language: Is testing offered in students’ native language(s)? No If yes, what language(s)? Not applicable
Page 72
Profiles Hawaii
Page 73
Educational Staff Information NOTE: Numbers for educational staff information are current as of data collection; see Appendix C for details. Current number of certified teachers working with LEP students, and additional number needed in five years State uses no Title III funds for teachers
0
0.2
0.4
0.6
0.8
1
Current and additional needed
No.
of c
ertif
ied
teac
hers
Additional neededCurrent no.
Number of educational staff receiving professional development via subgrantees, by type of staff No data provided.
0
0.2
0.4
0.6
0.8
1
Classro
om te
ache
rs
Teach
ers fo
r LEP
Princip
als
Other a
dmins
Other s
choo
l pers
onne
l
CBO* pers
onne
l
Type of staff
No.
par
ticip
ants
*Community-based organization
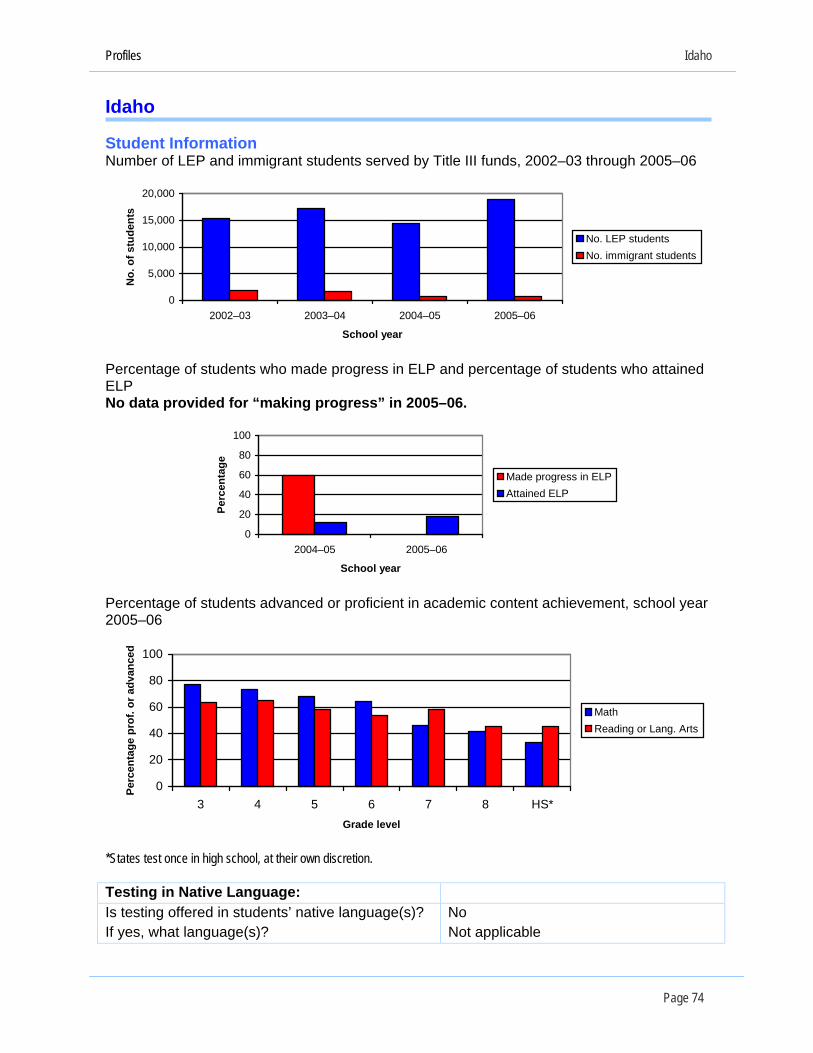
Profiles Idaho
Idaho Student Information Number of LEP and immigrant students served by Title III funds, 2002–03 through 2005–06
0
5,000
10,000
15,000
20,000
2002–03 2003–04 2004–05 2005–06
School year
No.
of s
tude
nts
No. LEP studentsNo. immigrant students
Percentage of students who made progress in ELP and percentage of students who attained ELP No data provided for “making progress” in 2005–06.
0
20
40
60
80
100
2004–05 2005–06
School year
Perc
enta
ge
Made progress in ELPAttained ELP
Percentage of students advanced or proficient in academic content achievement, school year 2005–06
0
20
40
60
80
100
3 4 5 6 7 8 HS*Grade level
Perc
enta
ge p
rof.
or a
dvan
ced
MathReading or Lang. Arts
*States test once in high school, at their own discretion. Testing in Native Language: Is testing offered in students’ native language(s)? No If yes, what language(s)? Not applicable
Page 74

Profiles Idaho
Page 75
Educational Staff Information NOTE: Numbers for educational staff information are current as of data collection; see Appendix C for details. Current number of certified teachers working with LEP students, and additional number needed in five years
0200400600800
1,0001,2001,400
Current and additional needed
No.
of c
ertif
ied
teac
hers
Additional neededCurrent no.
Number of educational staff receiving professional development via subgrantees, by type of staff
0
500
1,000
1,500
2,000
2,500
3,000
3,500
Classro
om te
ache
rs
Teach
ers fo
r LEP
Princip
als
Other a
dmins
Other s
choo
l pers
onne
l
CBO* pers
onne
l
Type of staff
No.
par
ticip
ants
*Community-based organization
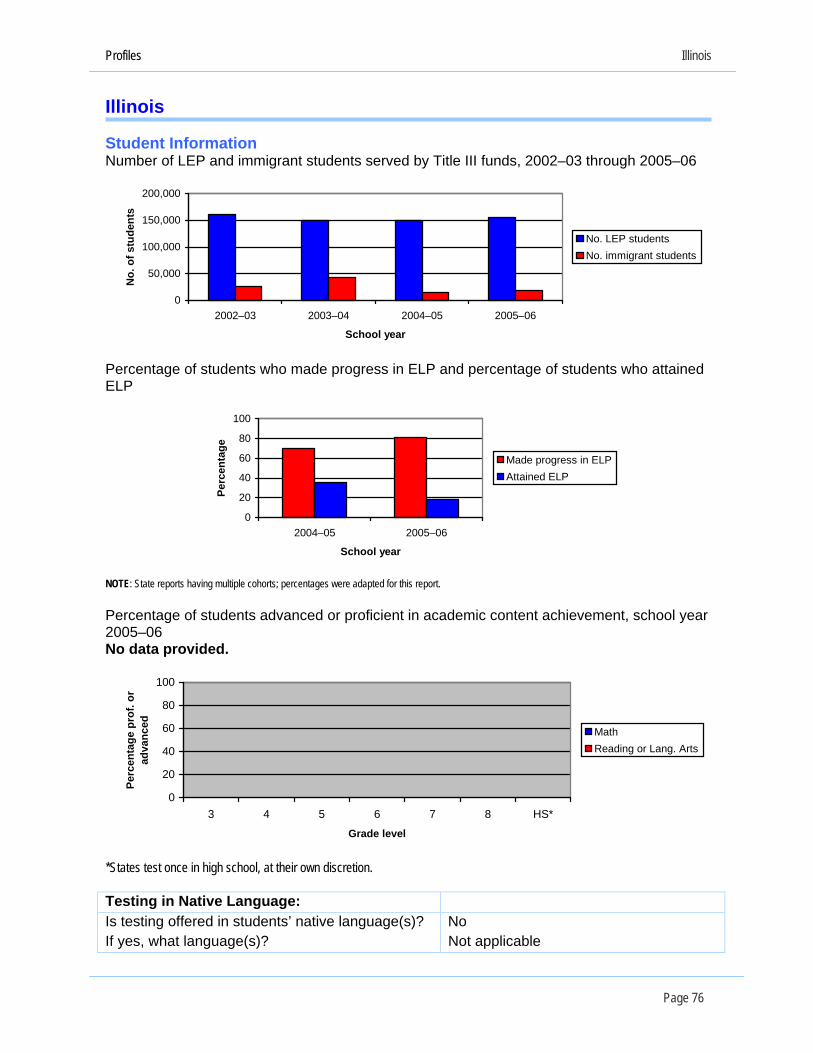
Profiles Illinois
Illinois Student Information Number of LEP and immigrant students served by Title III funds, 2002–03 through 2005–06
0
50,000
100,000
150,000
200,000
2002–03 2003–04 2004–05 2005–06
School year
No.
of s
tude
nts
No. LEP studentsNo. immigrant students
Percentage of students who made progress in ELP and percentage of students who attained ELP
0
20
40
60
80
100
2004–05 2005–06
School year
Perc
enta
ge
Made progress in ELPAttained ELP
NOTE: State reports having multiple cohorts; percentages were adapted for this report. Percentage of students advanced or proficient in academic content achievement, school year 2005–06 No data provided.
0
20
40
60
80
100
3 4 5 6 7 8 HS*
Grade level
Perc
enta
ge p
rof.
or
adva
nced
MathReading or Lang. Arts
*States test once in high school, at their own discretion. Testing in Native Language: Is testing offered in students’ native language(s)? No If yes, what language(s)? Not applicable
Page 76

Profiles Illinois
Page 77
Educational Staff Information NOTE: Numbers for educational staff information are current as of data collection; see Appendix C for details. Current number of certified teachers working with LEP students, and additional number needed in five years
01,0002,0003,0004,0005,0006,0007,000
Current and additional needed
No.
of c
ertif
ied
teac
hers
Additional neededCurrent no.
Number of educational staff receiving professional development via subgrantees, by type of staff
0
2,000
4,000
6,000
8,000
10,000
12,000
Classro
m teac
hers
Teach
ers fo
r LEP
Princip
als
Other a
dmins
Other s
choo
l pers
onne
l
CBO* pers
onne
l
Type of staff
No.
par
ticip
ants
*Community-based organization

Profiles Indiana
Indiana Student Information Number of LEP and immigrant students served by Title III funds, 2002–03 through 2005–06
05,000
10,00015,00020,00025,00030,00035,00040,000
2002–03 2003–04 2004–05 2005–06
School year
No.
of s
tude
nts
No. LEP studentsNo. immigrant students
Percentage of students who made progress in ELP and percentage of students who attained ELP
0
20
40
60
80
100
2004–05 2005–06
School year
Perc
enta
ge
Made progress in ELPAttained ELP
NOTE: State reports having a new assessment for 2005–06, so data cannot be directly compared.
Percentage of students advanced or proficient in academic content achievement, school year 2005–06
0
20
40
60
80
100
3 4 5 6 7 8 HS*Grade level
Perc
enta
ge p
rof.
or a
dvan
ced
MathReading or Lang. Arts
*States test once in high school, at their own discretion. Testing in Native Language: Is testing offered in students’ native language(s)? No If yes, what language(s)? Not applicable
Page 78
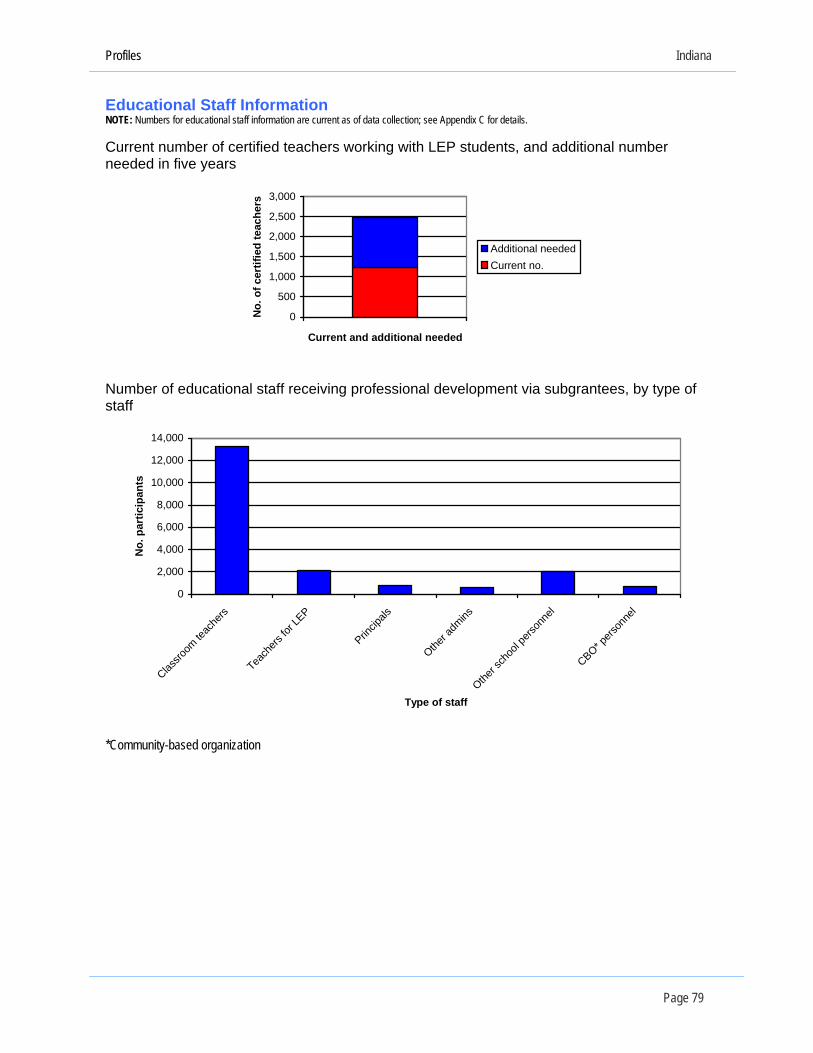
Profiles Indiana
Page 79
Educational Staff Information NOTE: Numbers for educational staff information are current as of data collection; see Appendix C for details. Current number of certified teachers working with LEP students, and additional number needed in five years
0
500
1,000
1,500
2,000
2,500
3,000
Current and additional needed
No.
of c
ertif
ied
teac
hers
Additional neededCurrent no.
Number of educational staff receiving professional development via subgrantees, by type of staff
0
2,000
4,000
6,000
8,000
10,000
12,000
14,000
Classro
om te
ache
rs
Teach
ers fo
r LEP
Princip
als
Other a
dmins
Other s
choo
l pers
onne
l
CBO* pers
onne
l
Type of staff
No.
par
ticip
ants
*Community-based organization

Profiles Iowa
Iowa NOTE: In instances where data are missing, state did not have a system in place to collect all of the necessary data requested
by the biennial data collection form (reproduced in Appendix B). Student Information Number of LEP and immigrant students served by Title III funds, 2002–03 through 2005–06
02,0004,0006,0008,000
10,00012,00014,00016,000
2002–03 2003–04 2004–05 2005–06
School year
No.
of s
tude
nts
No. LEP studentsNo. immigrant students
Percentage of students who made progress in ELP and percentage of students who attained ELP
0
20
40
60
80
100
2004–05 2005–06
School year
Perc
enta
ge
Made progress in ELPAttained ELP
Percentage of students advanced or proficient in academic content achievement, school year 2005–06
0
20
40
60
80
100
3 4 5 6 7 8 HS*Grade level
Perc
enta
ge p
rof.
or a
dvan
ced
MathReading or Lang. Arts
*States test once in high school, at their own discretion. Testing in Native Language: Is testing offered in students’ native language(s)? No If yes, what language(s)? Not applicable
Page 80

Profiles Iowa
Page 81
Educational Staff Information NOTE: Numbers for educational staff information are current as of data collection; see Appendix C for details. Current number of certified teachers working with LEP students, and additional number needed in five years
050
100150200250300350400
Current and additional needed
No.
of c
ertif
ied
teac
hers
Additional neededCurrent no.
Number of educational staff receiving professional development via subgrantees, by type of staff
0
500
1,000
1,500
2,000
2,500
3,000
3,500
Classro
om te
ache
rs
Teach
ers fo
r LEP
Princip
als
Other a
dmins
Other s
choo
l pers
onne
l
CBO* pers
onne
l
Type of staff
No.
par
ticip
ants
*Community-based organization
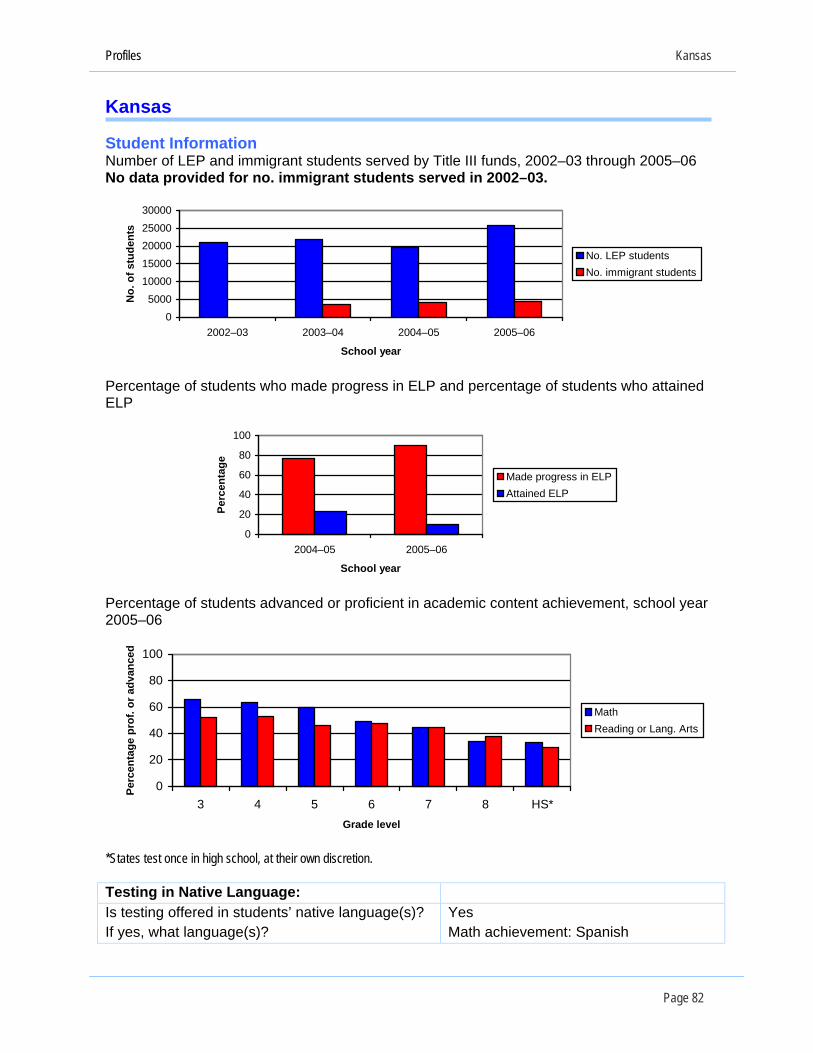
Profiles Kansas
Kansas Student Information Number of LEP and immigrant students served by Title III funds, 2002–03 through 2005–06 No data provided for no. immigrant students served in 2002–03.
05000
1000015000
2000025000
30000
2002–03 2003–04 2004–05 2005–06
School year
No.
of s
tude
nts
No. LEP studentsNo. immigrant students
Percentage of students who made progress in ELP and percentage of students who attained ELP
0
20
40
60
80
100
2004–05 2005–06
School year
Perc
enta
ge
Made progress in ELPAttained ELP
Percentage of students advanced or proficient in academic content achievement, school year 2005–06
0
20
40
60
80
100
3 4 5 6 7 8 HS*Grade level
Perc
enta
ge p
rof.
or a
dvan
ced
MathReading or Lang. Arts
*States test once in high school, at their own discretion. Testing in Native Language: Is testing offered in students’ native language(s)? Yes If yes, what language(s)? Math achievement: Spanish
Page 82

Profiles Kansas
Page 83
Percentage of students advanced and proficient in Spanish language test of mathematics achievement, school year 2005–06
0
20
40
60
80
100
3 4 5 6 7 8 HS*
Grade level
Perc
enta
ge p
rof.
or
adva
nced
Math
*States test once in high school, at their own discretion. Educational Staff Information NOTE: Numbers for educational staff information are current as of data collection; see Appendix C for details. Current number of certified teachers working with LEP students, and additional number needed in five years
0
1,000
2,000
3,000
4,000
5,000
Current and additional needed
No.
of c
ertif
ied
teac
hers
Additional neededCurrent no.
Number of educational staff receiving professional development via subgrantees, by type of staff
0500
1,0001,5002,0002,5003,0003,5004,000
Classro
om te
ache
rs
Teach
ers fo
r LEP
Princip
als
Other a
dmins
Other s
choo
l pers
onne
l
CBO* pers
onne
l
Type of staff
No.
par
ticip
ants
*Community-based organization

Profiles Kentucky
Kentucky Student Information Number of LEP and immigrant students served by Title III funds, 2002–03 through 2005–06
02,000
4,0006,000
8,00010,000
12,000
2002–03 2003–04 2004–05 2005–06
School year
No.
of s
tude
nts
No. LEP studentsNo. immigrant students
Percentage of students who made progress in ELP and percentage of students who attained ELP
0
20
40
60
80
100
2004–05 2005–06
School year
Perc
enta
ge
Made progress in ELPAttained ELP
Percentage of students advanced or proficient in academic content achievement, school year 2005–06
0
20
40
60
80
100
3 4 5 6 7 8 HS*Grade level
Perc
enta
gepr
of. o
r adv
ance
d
MathReading or Lang. Arts
*States test once in high school, at their own discretion. Testing in Native Language: Is testing offered in students’ native language(s)? No If yes, what language(s)? Not applicable
Page 84

Profiles Kentucky
Page 85
Educational Staff Information NOTE: Numbers for educational staff information are current as of data collection; see Appendix C for details. Current number of certified teachers working with LEP students, and additional number needed in five years
0
200
400
600
800
1000
Current and additional needed
No.
of c
ertif
ied
teac
hers
Additional neededCurrent no.
Number of educational staff receiving professional development via subgrantees, by type of staff No data provided.
0
0.2
0.4
0.6
0.8
1
Classro
om te
ache
rs
Teach
ers fo
r LEP
Princip
als
Other a
dmins
Other s
choo
l pers
onne
l
CBO* pers
onne
l
Type of staff
No.
par
ticip
ants
*Community-based organization

Profiles Louisiana
Louisiana Student Information Number of LEP and immigrant students served by Title III funds, 2002–03 through 2005–06
0
2,000
4,000
6,000
8,000
10,000
2002–03 2003–04 2004–05 2005–06
School year
No.
of s
tude
nts
No. LEP studentsNo. immigrant students
Percentage of students who made progress in ELP and percentage of students who attained ELP
0
20
40
60
80
100
2004–05 2005–06
School year
Perc
enta
ge
Made progress in ELPAttained ELP
Percentage of students advanced or proficient in academic content achievement, school year 2005–06
0
20
40
60
80
100
3 4 5 6 7 8 HS*Grade level
Perc
enta
ge p
rof.
or a
dvan
ced
MathReading or Lang. Arts
*States test once in high school, at their own discretion. Testing in Native Language: Is testing offered in students’ native language(s)? No If yes, what language(s)? Not applicable
Page 86
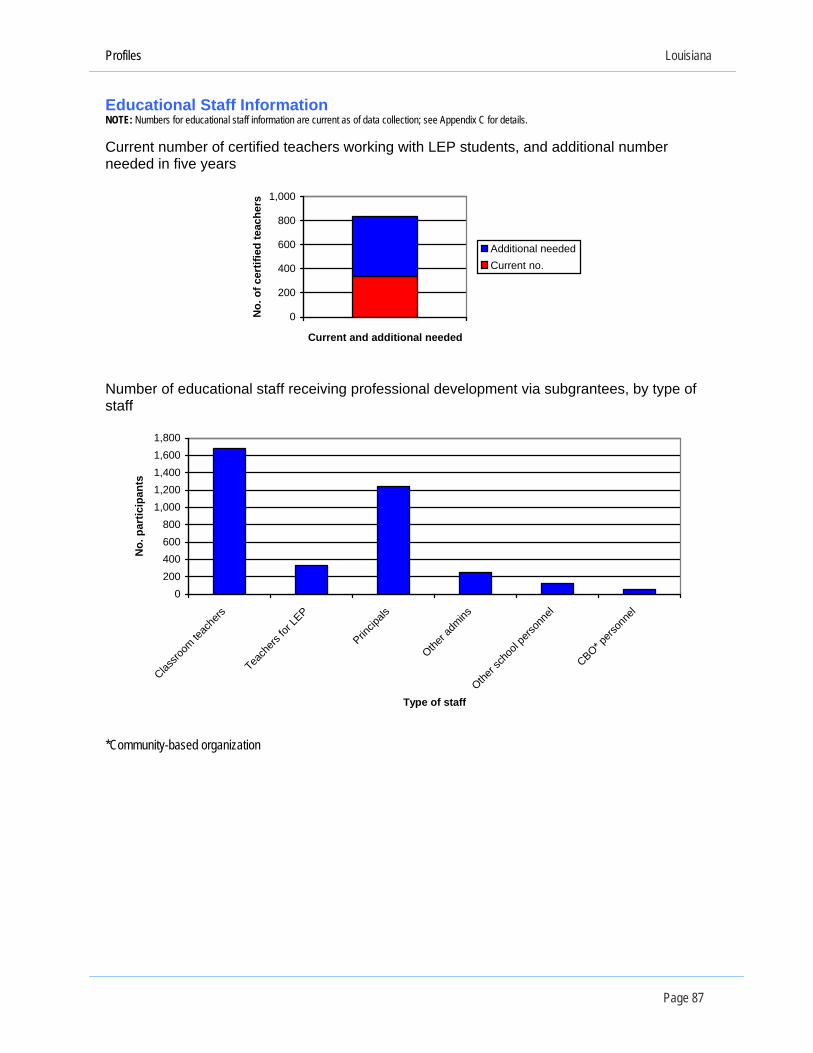
Profiles Louisiana
Page 87
Educational Staff Information NOTE: Numbers for educational staff information are current as of data collection; see Appendix C for details. Current number of certified teachers working with LEP students, and additional number needed in five years
0
200
400
600
800
1,000
Current and additional needed
No.
of c
ertif
ied
teac
hers
Additional neededCurrent no.
Number of educational staff receiving professional development via subgrantees, by type of staff
0200400600800
1,0001,2001,4001,6001,800
Classro
om te
ache
rs
Teach
ers fo
r LEP
Princip
als
Other a
dmins
Other s
choo
l pers
onne
l
CBO* pers
onne
l
Type of staff
No.
par
ticip
ants
*Community-based organization
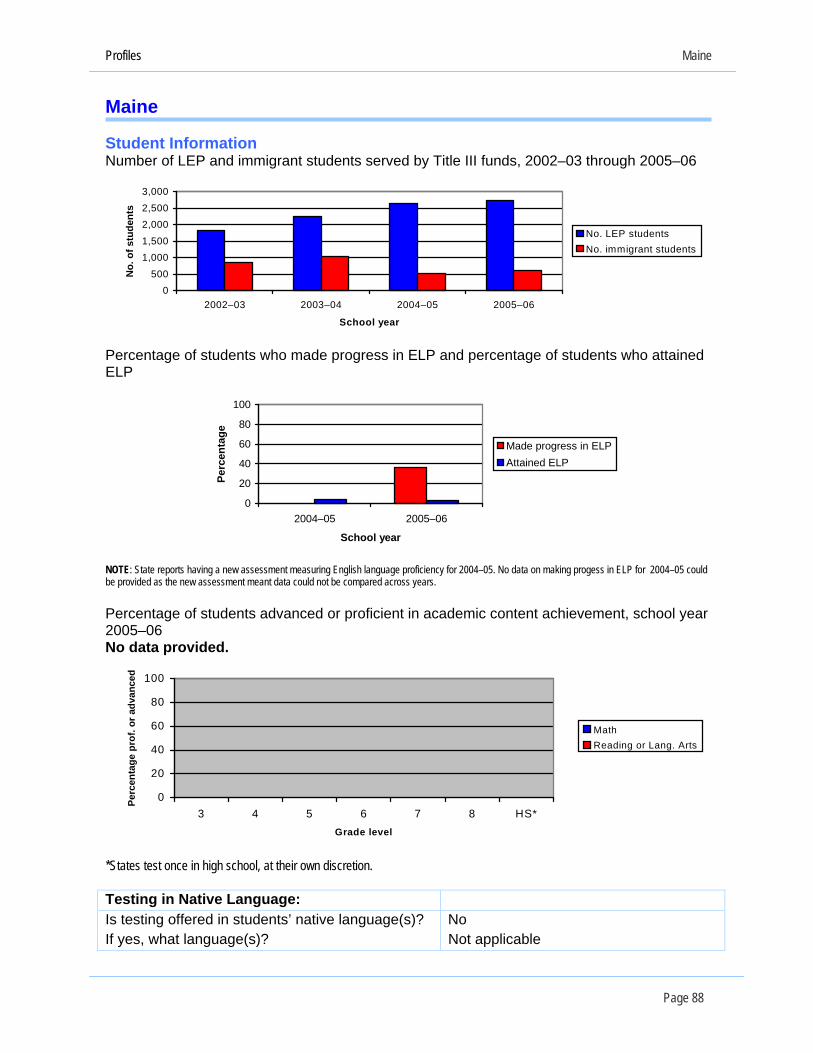
Profiles Maine
Maine Student Information Number of LEP and immigrant students served by Title III funds, 2002–03 through 2005–06
0500
1,0001,500
2,0002,500
3,000
2002–03 2003–04 2004–05 2005–06
School year
No.
of s
tude
nts
No. LEP studentsNo. immigrant students
Percentage of students who made progress in ELP and percentage of students who attained ELP
0
20
40
60
80
100
2004–05 2005–06
School year
Perc
enta
ge
Made progress in ELPAttained ELP
NOTE: State reports having a new assessment measuring English language proficiency for 2004–05. No data on making progess in ELP for 2004–05 could be provided as the new assessment meant data could not be compared across years.
Percentage of students advanced or proficient in academic content achievement, school year 2005–06 No data provided.
0
20
40
60
80
100
3 4 5 6 7 8 HS*Grade level
Perc
enta
ge p
rof.
or a
dvan
ced
MathReading or Lang. Arts
*States test once in high school, at their own discretion. Testing in Native Language: Is testing offered in students’ native language(s)? No If yes, what language(s)? Not applicable
Page 88

Profiles Maine
Page 89
Educational Staff Information NOTE: Numbers for educational staff information are current as of data collection; see Appendix C for details. Current number of certified teachers working with LEP students, and additional number needed in five years
0
50
100
150
200
Current and additional needed
No.
of c
ertif
ied
teac
hers
Additional neededCurrent no.
Number of educational staff receiving professional development via subgrantees, by type of staff
0
50
100
150
200
250
300
350
400
Classro
om te
ache
rs
Teach
ers fo
r LEP
Princip
als
Other a
dmins
Other s
choo
l pers
onne
l
CBO* pers
onne
l
Type of staff
No.
par
ticip
ants
*Community-based organization
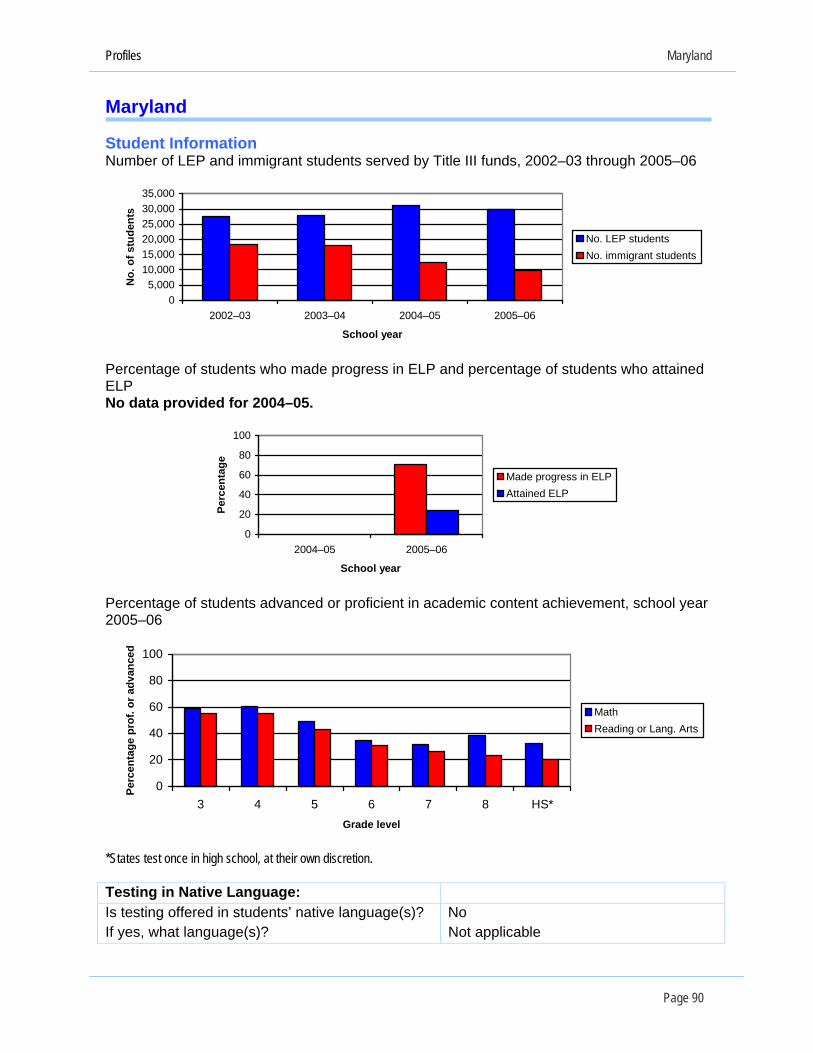
Profiles Maryland
Maryland Student Information Number of LEP and immigrant students served by Title III funds, 2002–03 through 2005–06
05,000
10,00015,00020,00025,00030,00035,000
2002–03 2003–04 2004–05 2005–06
School year
No.
of s
tude
nts
No. LEP studentsNo. immigrant students
Percentage of students who made progress in ELP and percentage of students who attained ELP No data provided for 2004–05.
0
20
40
60
80
100
2004–05 2005–06
School year
Perc
enta
ge
Made progress in ELPAttained ELP
Percentage of students advanced or proficient in academic content achievement, school year 2005–06
0
20
40
60
80
100
3 4 5 6 7 8 HS*Grade level
Perc
enta
ge p
rof.
or a
dvan
ced
MathReading or Lang. Arts
*States test once in high school, at their own discretion. Testing in Native Language: Is testing offered in students’ native language(s)? No If yes, what language(s)? Not applicable
Page 90

Profiles Maryland
Page 91
Educational Staff Information NOTE: Numbers for educational staff information are current as of data collection; see Appendix C for details. Current number of certified teachers working with LEP students, and additional number needed in five years
0
500
1,000
1,500
2,000
2,500
Current and additional needed
No.
of c
ertif
ied
teac
hers
Additional neededCurrent no.
Number of educational staff receiving professional development via subgrantees, by type of staff
0
1,000
2,000
3,000
4,000
5,000
6,000
Classro
om te
ache
rs
Teach
ers fo
r LEP
Princip
als
Other a
dmins
Other s
choo
l pers
onne
l
CBO* pers
onne
l
Type of staff
No.
par
ticip
ants
*Community-based organization

Profiles Massachusetts
Massachusetts Student Information Number of LEP and immigrant students served by Title III funds, 2002–03 through 2005–06
010,000
20,00030,000
40,00050,000
60,000
2002–03 2003–04 2004–05 2005–06
School year
No.
of s
tude
nts
No. LEP studentsNo. immigrant students
Percentage of students who made progress in ELP and percentage of students who attained ELP
0
20
40
60
80
100
2004–05 2005–06
School year
Perc
enta
ge
Made progress in ELPAttained ELP
Percentage of students advanced or proficient in academic content achievement, school year 2005–06
0
20
40
60
80
100
3 4 5 6 7 8 HS*Grade level
Perc
enta
ge p
rof.
or a
dvan
ced
MathReading or Lang. Arts
*States test once in high school, at their own discretion. Testing in Native Language: Is testing offered in students’ native language(s)? Yes If yes, what language(s)? Spanish, high school only
Page 92
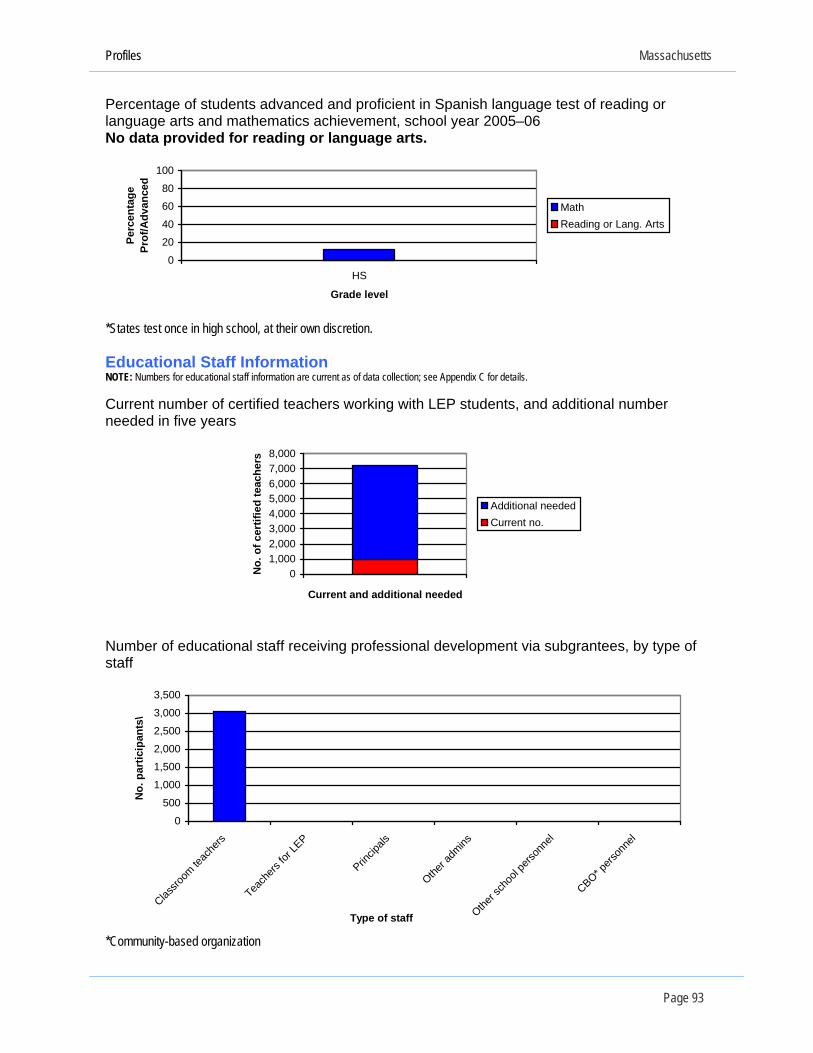
Profiles Massachusetts
Page 93
Percentage of students advanced and proficient in Spanish language test of reading or language arts and mathematics achievement, school year 2005–06 No data provided for reading or language arts.
0
20
40
60
80
100
HS
Grade level
Perc
enta
ge
Prof
/Adv
ance
d
MathReading or Lang. Arts
*States test once in high school, at their own discretion. Educational Staff Information NOTE: Numbers for educational staff information are current as of data collection; see Appendix C for details. Current number of certified teachers working with LEP students, and additional number needed in five years
01,0002,0003,0004,0005,0006,0007,0008,000
Current and additional needed
No.
of c
ertif
ied
teac
hers
Additional neededCurrent no.
Number of educational staff receiving professional development via subgrantees, by type of staff
0
500
1,000
1,500
2,000
2,500
3,000
3,500
Classro
om te
ache
rs
Teach
ers fo
r LEP
Princip
als
Other a
dmins
Other s
choo
l pers
onne
l
CBO* pers
onne
l
Type of staff
No.
par
ticip
ants
\
*Community-based organization
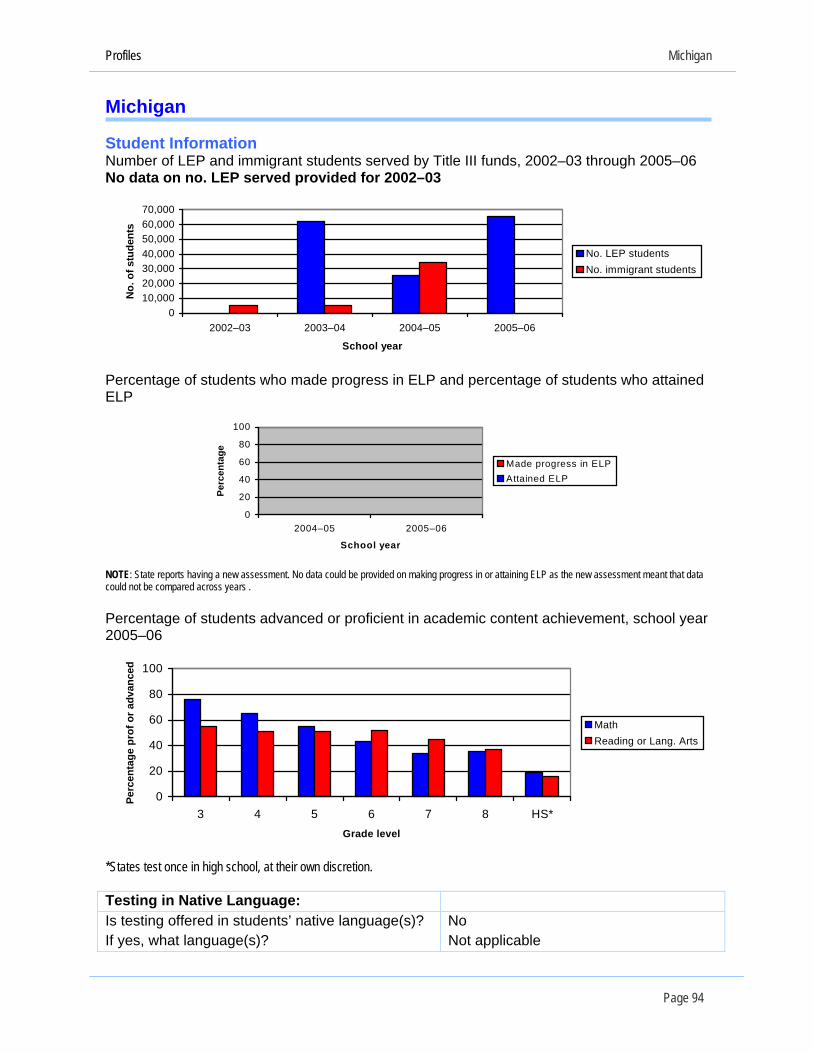
Profiles Michigan
Michigan Student Information Number of LEP and immigrant students served by Title III funds, 2002–03 through 2005–06 No data on no. LEP served provided for 2002–03
010,00020,00030,00040,00050,00060,00070,000
2002–03 2003–04 2004–05 2005–06
School year
No.
of s
tude
nts
No. LEP studentsNo. immigrant students
Percentage of students who made progress in ELP and percentage of students who attained ELP
0
20
40
60
80
100
2004–05 2005–06
School year
Perc
enta
ge
Made progress in ELPAttained ELP
NOTE: State reports having a new assessment. No data could be provided on making progress in or attaining ELP as the new assessment meant that data could not be compared across years .
Percentage of students advanced or proficient in academic content achievement, school year 2005–06
0
20
40
60
80
100
3 4 5 6 7 8 HS*Grade level
Perc
enta
ge p
rof o
r adv
ance
d
MathReading or Lang. Arts
*States test once in high school, at their own discretion. Testing in Native Language: Is testing offered in students’ native language(s)? No If yes, what language(s)? Not applicable
Page 94
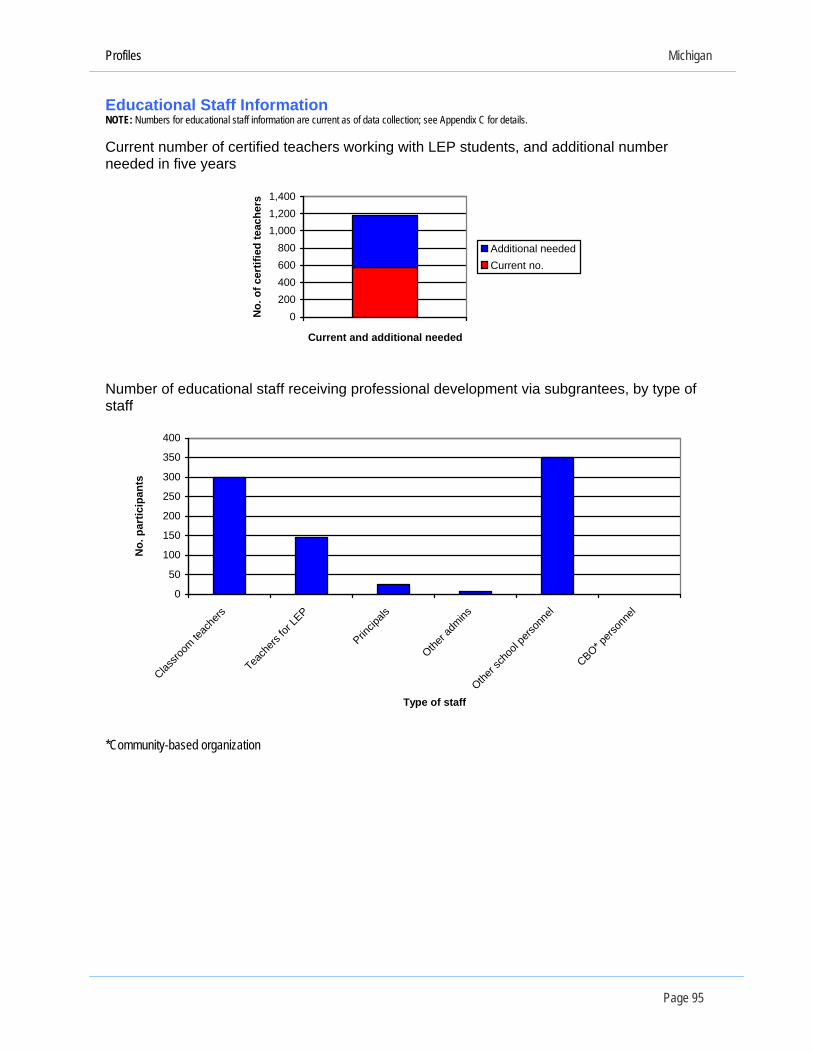
Profiles Michigan
Page 95
Educational Staff Information NOTE: Numbers for educational staff information are current as of data collection; see Appendix C for details. Current number of certified teachers working with LEP students, and additional number needed in five years
0200400600800
1,0001,2001,400
Current and additional needed
No.
of c
ertif
ied
teac
hers
Additional neededCurrent no.
Number of educational staff receiving professional development via subgrantees, by type of staff
0
50
100
150
200
250
300
350
400
Classro
om te
ache
rs
Teach
ers fo
r LEP
Princip
als
Other a
dmins
Other s
choo
l pers
onne
l
CBO* pers
onne
l
Type of staff
No.
par
ticip
ants
*Community-based organization
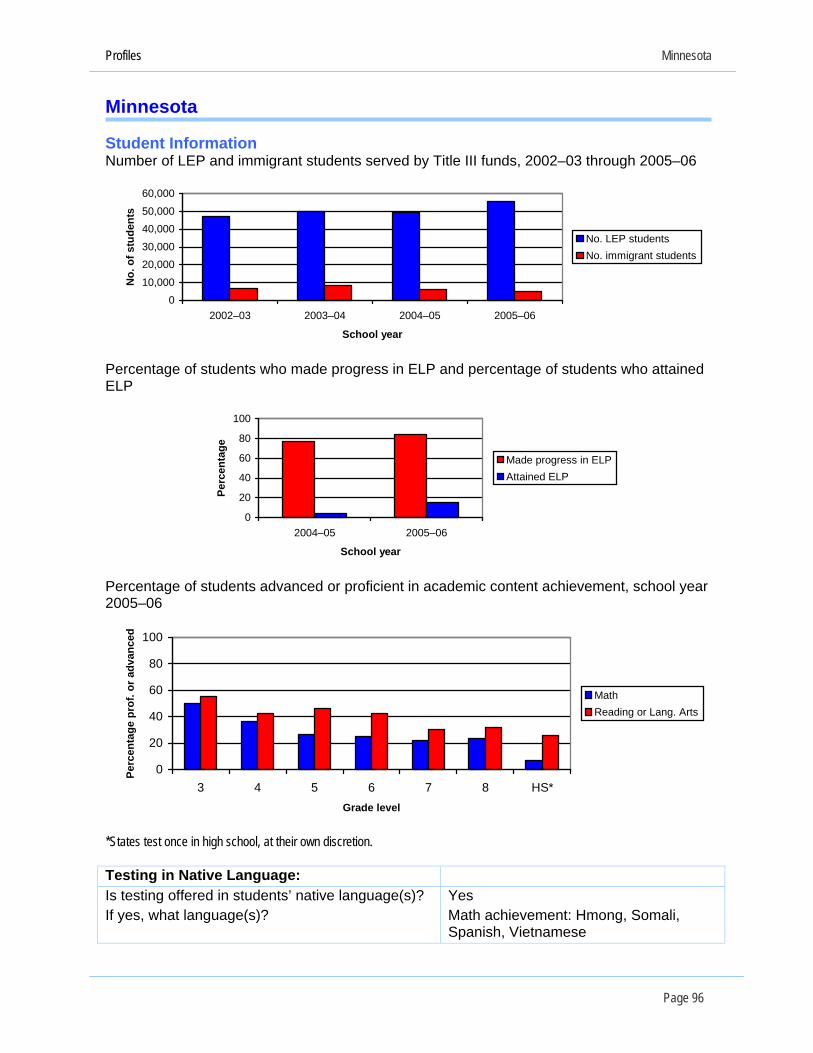
Profiles Minnesota
Minnesota Student Information Number of LEP and immigrant students served by Title III funds, 2002–03 through 2005–06
010,000
20,00030,000
40,00050,000
60,000
2002–03 2003–04 2004–05 2005–06
School year
No.
of s
tude
nts
No. LEP studentsNo. immigrant students
Percentage of students who made progress in ELP and percentage of students who attained ELP
0
20
40
60
80
100
2004–05 2005–06
School year
Perc
enta
ge
Made progress in ELPAttained ELP
Percentage of students advanced or proficient in academic content achievement, school year 2005–06
0
20
40
60
80
100
3 4 5 6 7 8 HS*Grade level
Perc
enta
ge p
rof.
or a
dvan
ced
MathReading or Lang. Arts
*States test once in high school, at their own discretion. Testing in Native Language: Is testing offered in students’ native language(s)? Yes If yes, what language(s)? Math achievement: Hmong, Somali,
Spanish, Vietnamese
Page 96

Profiles Minnesota
Page 97
Percentage of students advanced and proficient in native language tests of mathematics achievement, school year 2005–06
0
20
40
60
80
100
3rd 5th 7th HS
Grade level
Per
cent
age
Pro
f/Adv
ance
d
Math
Educational Staff Information NOTE: Numbers for educational staff information are current as of data collection; see Appendix C for details. Current number of certified teachers working with LEP students, and additional number needed in five years
0200400600800
1,0001,2001,4001,600
Current and additional needed
No.
of c
ertif
ied
teac
hers
Additional neededCurrent no.
Number of educational staff receiving professional development via subgrantees, by type of staff No data provided.
0
0.2
0.4
0.6
0.8
1
Classro
om teach
ers
Teachers
for LEP
Princip
als
Other admins
Other sch
ool perso
nnel
CBO* perso
nnel
Type of staff
No.
par
ticip
ants
*Community-based organization

Profiles Mississippi
Mississippi Student Information Number of LEP and immigrant students served by Title III funds, 2002–03 through 2005–06
0500
1,0001,5002,0002,5003,0003,5004,000
2002–03 2003–04 2004–05 2005–06
School year
No.
of s
tude
nts
No. LEP studentsNo. immigrant students
Percentage of students who made progress in ELP and percentage of students who attained ELP
0
20
40
60
80
100
2004–05 2005–06
School year
Perc
enta
ge
Made progress in ELPAttained ELP
NOTE: State reports having multiple cohorts; percentages were adapted for this report.
Percentage of students advanced or proficient in academic content achievement, school year 2005–06
0
20
40
60
80
100
3 4 5 6 7 8 HS*Grade level
Perc
enta
ge p
rof.
or a
dvan
ced
MathReading or Lang. Arts
*States test once in high school, at their own discretion. Testing in Native Language: Is testing offered in students’ native language(s)? No If yes, what language(s)? Not applicable
Page 98

Profiles Mississippi
Page 99
Educational Staff Information NOTE: Numbers for educational staff information are current as of data collection; see Appendix C for details. Current number of certified teachers working with LEP students, and additional number needed in five years
0
500
1,000
1,500
2,000
2,500
3,000
Current and additional needed
No.
of c
ertif
ied
teac
hers
Additional neededCurrent no.
Number of educational staff receiving professional development via subgrantees, by type of staff No data provided.
0
0.2
0.4
0.6
0.8
1
Classro
om te
ache
rs
Teach
ers fo
r LEP
Princip
als
Other a
dmins
Other s
choo
l pers
onne
l
CBO* pers
onne
l
Type of staff
No.
par
ticip
ants
*Community-based organization

Profiles Missouri
Missouri NOTE: In instances where data are missing, state did not have a system in place to collect all of the necessary data requested
by the biennial data collection form (reproduced in Appendix B).
Student Information Number of LEP and immigrant students served by Title III funds, 2002–03 through 2005–06
0
5,000
10,000
15,000
20,000
2002–03 2003–04 2004–05 2005–06
School year
No.
of s
tude
nts
No. LEP studentsNo. immigrant students
Percentage of students who made progress in ELP and percentage of students who attained ELP No data provided on making progress.
0
20
40
60
80
100
2004–05 2005–06
School year
Perc
enta
ge
Attained ELPMade progress in ELP
Percentage of students advanced or proficient in academic content achievement, school year 2005–06
0
20
40
60
80
100
3 4 5 6 7 8 HS*Grade level
Perc
enta
ge p
rof.
or a
dvan
ced
MathReading or Lang. Arts
*States test once in high school, at their own discretion. Testing in Native Language: Is testing offered in students’ native language(s)? No If yes, what language(s)? Not applicable
Page 100
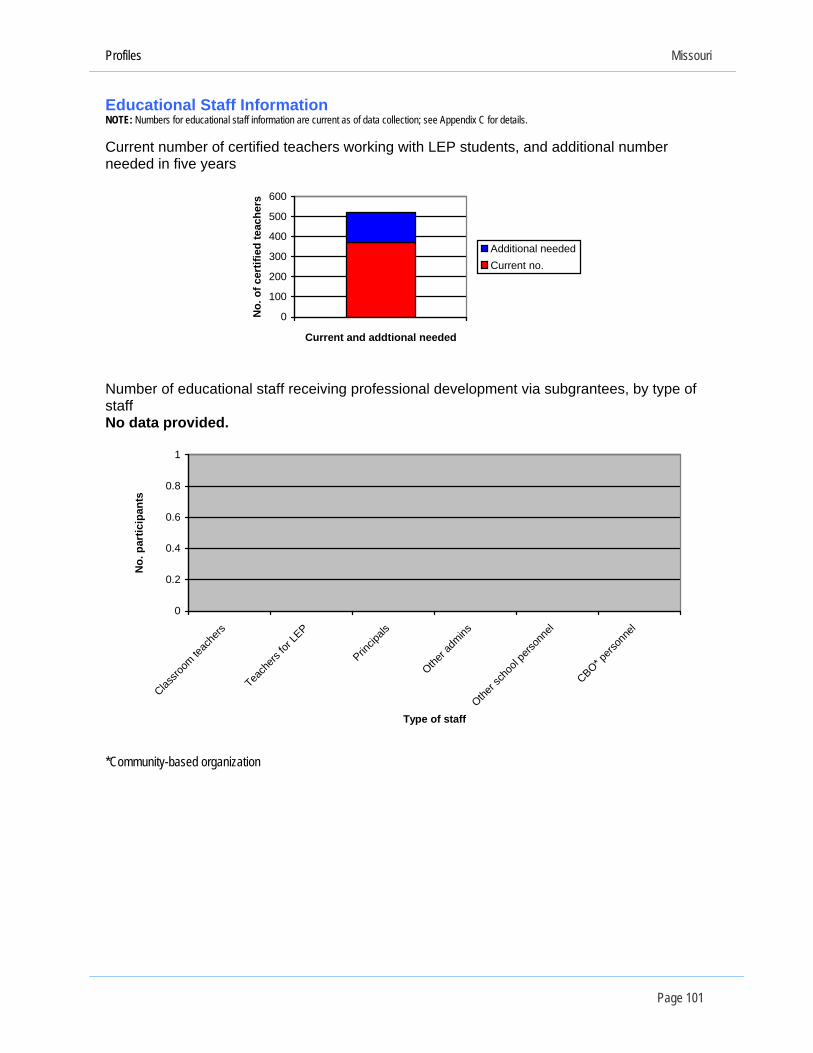
Profiles Missouri
Page 101
Educational Staff Information NOTE: Numbers for educational staff information are current as of data collection; see Appendix C for details. Current number of certified teachers working with LEP students, and additional number needed in five years
0
100
200
300
400
500
600
Current and addtional needed
No.
of c
ertif
ied
teac
hers
Additional neededCurrent no.
Number of educational staff receiving professional development via subgrantees, by type of staff No data provided.
0
0.2
0.4
0.6
0.8
1
Classro
om te
ache
rs
Teach
ers fo
r LEP
Princip
als
Other a
dmins
Other s
choo
l pers
onne
l
CBO* pers
onne
l
Type of staff
No.
par
ticip
ants
*Community-based organization

Profiles Montana
Montana Student Information Number of LEP and immigrant students served by Title III funds, 2002–03 through 2005–06
0500
1,0001,5002,0002,5003,0003,5004,000
2002–03 2003–04 2004–05 2005–06
School year
No.
of s
tude
nts
No. LEP studentsNo. immigrant students
Percentage of students who made progress in ELP and percentage of students who attained ELP
0
20
40
60
80
100
2004–05 2005–06
School year
Perc
enta
ge
Attained ELPMade progress in ELP
NOTE: State reports having a new assessment. No data could be provided on making progress in or attaining ELP as the new assessment meant that data could not be compared across years.
Percentage of students advanced or proficient in academic content achievement, school year 2005–06
0
20
40
60
80
100
3 4 5 6 7 8 HS*Grade level
Perc
enta
ge p
rof.
or a
dvan
ced
MathReading or Lang. Arts
*States test once in high school, at their own discretion. Testing in Native Language: Is testing offered in students’ native language(s)? No If yes, what language(s)? Not applicable
Page 102

Profiles Montana
Page 103
Educational Staff Information NOTE: Numbers for educational staff information are current as of data collection; see Appendix C for details. Current number of certified teachers working with LEP students, and additional number needed in five years
0
20
40
60
80
100
Current and additional neeeded
No.
of c
ertif
ied
teac
hers
Additional neededCurrent no.
Number of educational staff receiving professional development via subgrantees, by type of staff
0
50
100
150
200
250
Classro
om te
ache
rs
Teach
ers fo
r LEP
Princip
als
Other a
dmins
Other s
choo
l pers
onne
l
CBO* pers
onne
l
Type of staff
No.
par
ticip
ants
*Community-based organization
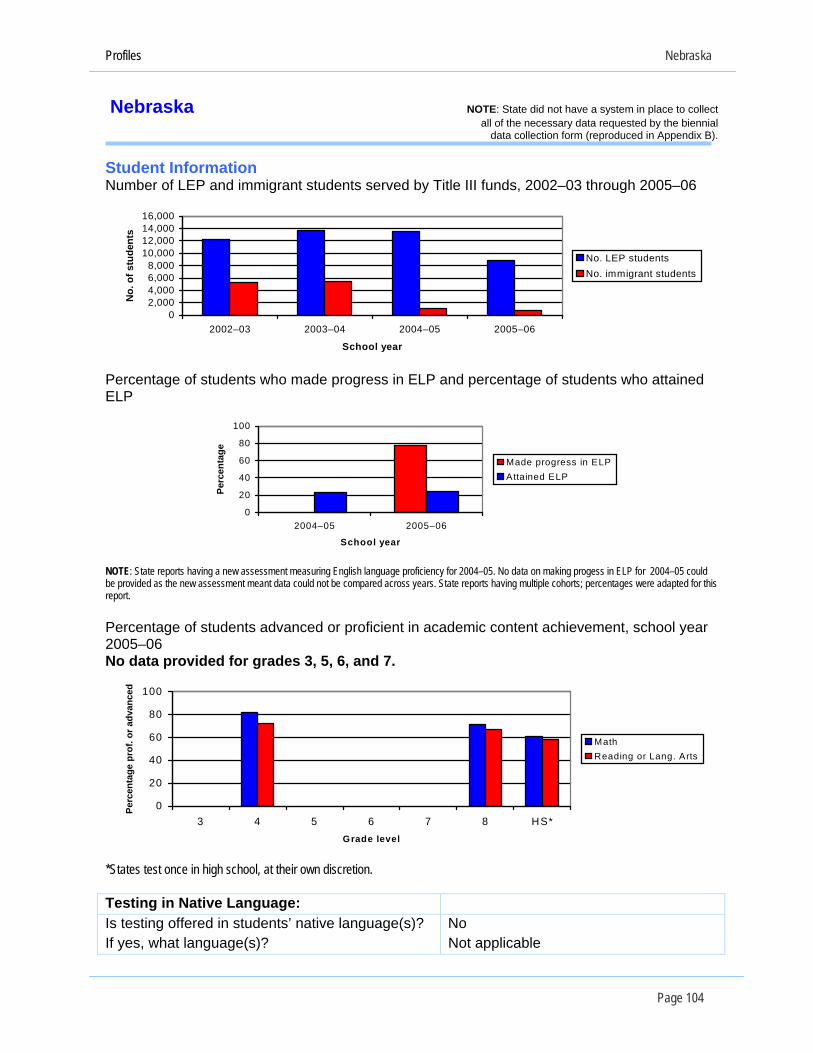
Profiles Nebraska
Nebraska NOTE: State did not have a system in place to collect all of the necessary data requested by the biennial
data collection form (reproduced in Appendix B). Student Information Number of LEP and immigrant students served by Title III funds, 2002–03 through 2005–06
02,0004,0006,0008,000
10,00012,00014,00016,000
2002–03 2003–04 2004–05 2005–06
School year
No.
of s
tude
nts
No. LEP studentsNo. immigrant students
Percentage of students who made progress in ELP and percentage of students who attained ELP
0
20
40
60
80
100
2004–05 2005–06
School year
Perc
enta
ge
Made progress in ELPAttained ELP
NOTE: State reports having a new assessment measuring English language proficiency for 2004–05. No data on making progess in ELP for 2004–05 could be provided as the new assessment meant data could not be compared across years. State reports having multiple cohorts; percentages were adapted for this report. Percentage of students advanced or proficient in academic content achievement, school year 2005–06 No data provided for grades 3, 5, 6, and 7.
0
20
40
60
80
100
3 4 5 6 7 8 HS*Grade level
Perc
enta
ge p
rof.
or a
dvan
ced
MathReading or Lang. Arts
*States test once in high school, at their own discretion. Testing in Native Language: Is testing offered in students’ native language(s)? No If yes, what language(s)? Not applicable
Page 104
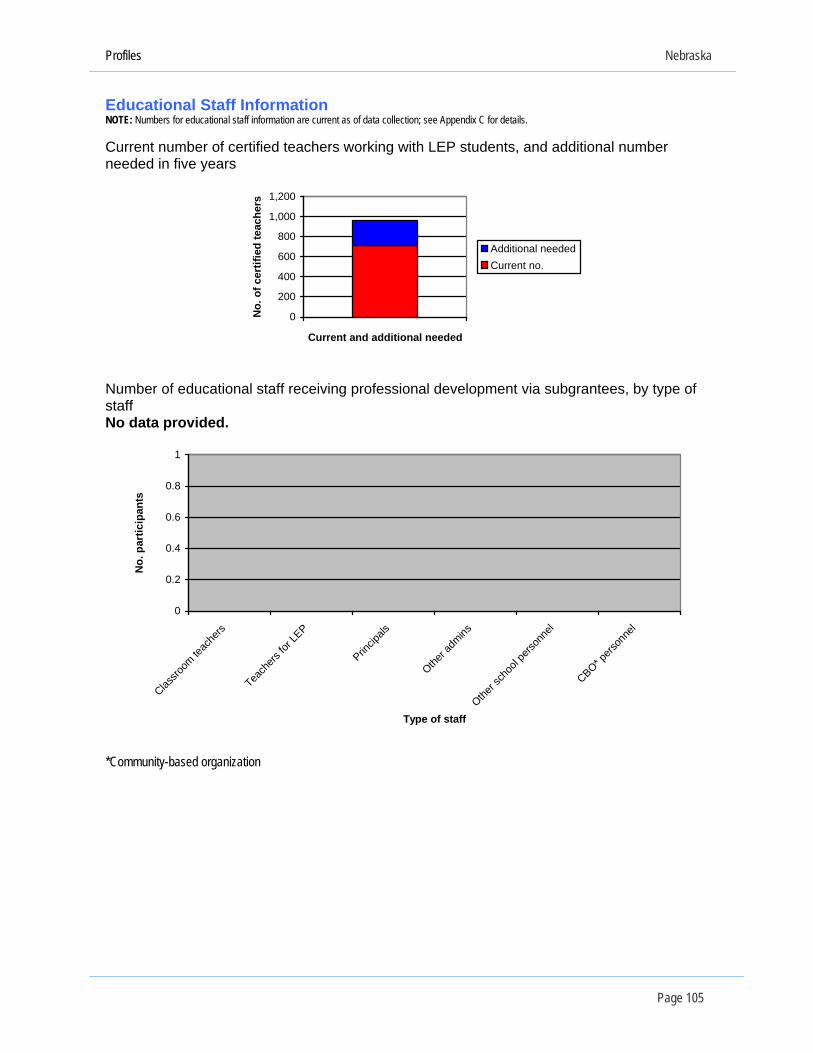
Profiles Nebraska
Page 105
Educational Staff Information NOTE: Numbers for educational staff information are current as of data collection; see Appendix C for details. Current number of certified teachers working with LEP students, and additional number needed in five years
0
200
400
600
800
1,000
1,200
Current and additional needed
No.
of c
ertif
ied
teac
hers
Additional neededCurrent no.
Number of educational staff receiving professional development via subgrantees, by type of staff No data provided.
0
0.2
0.4
0.6
0.8
1
Classro
om te
ache
rs
Teach
ers fo
r LEP
Princip
als
Other a
dmins
Other s
choo
l pers
onne
l
CBO* pers
onne
l
Type of staff
No.
par
ticip
ants
*Community-based organization

Profiles Nevada
Nevada Student Information Number of LEP and immigrant students served by Title III funds, 2002–03 through 2005–06
0
20,000
40,000
60,000
80,000
100,000
2002–03 2003–04 2004–05 2005–06
School year
No.
of s
tude
nts
No. LEP studentsNo. immigrant students
Percentage of students who made progress in ELP and percentage of students who attained ELP
0
20
40
60
80
100
2004–05 2005–06
School year
Perc
enta
ge
Made progress in ELPAttained ELP
Percentage of students advanced or proficient in academic content achievement, school year 2005–06 No data provided for grades 6 and 7.
0
20
40
60
80
100
3 4 5 6 7 8 HS*Grade level
Perc
enta
ge p
rof.
or a
dvan
ced
MathReading or Lang. Arts
*States test once in high school, at their own discretion. Testing in Native Language: Is testing offered in students’ native language(s)? No If yes, what language(s)? Not applicable
Page 106

Profiles Nevada
Page 107
Educational Staff Information NOTE: Numbers for educational staff information are current as of data collection; see Appendix C for details. Current number of certified teachers working with LEP students, and additional number needed in five years
0500
1,0001,5002,0002,5003,0003,500
Current and additional needed
No.
of c
ertif
ied
teac
hers
Additional neededCurrent no.
Number of educational staff receiving professional development via subgrantees, by type of staff
02,0004,0006,0008,000
10,00012,00014,00016,00018,000
Classro
om te
ache
rs
Teach
ers fo
r LEP
Princip
als
Other a
dmins
Other s
choo
l pers
onne
l
CBO* pers
onne
l
Type of staff
No.
par
ticip
ants
*Community-based organization
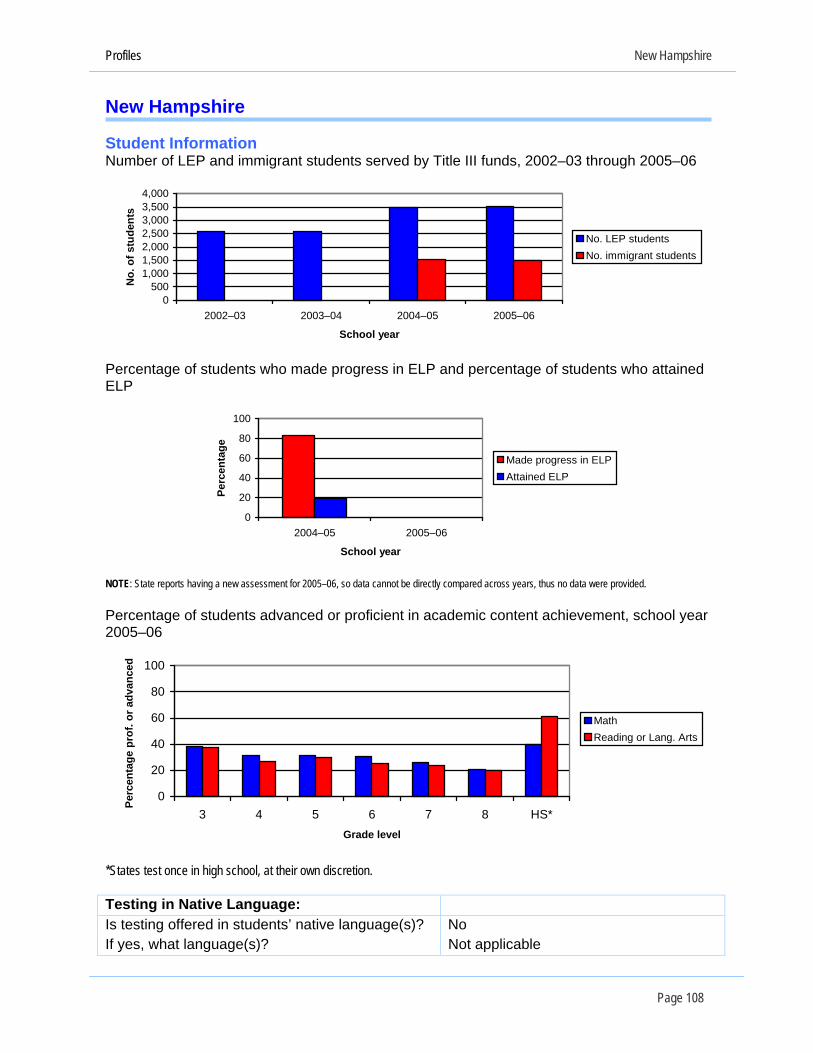
Profiles New Hampshire
New Hampshire Student Information Number of LEP and immigrant students served by Title III funds, 2002–03 through 2005–06
0500
1,0001,5002,0002,5003,0003,5004,000
2002–03 2003–04 2004–05 2005–06
School year
No.
of s
tude
nts
No. LEP studentsNo. immigrant students
Percentage of students who made progress in ELP and percentage of students who attained ELP
0
20
40
60
80
100
2004–05 2005–06
School year
Perc
enta
ge
Made progress in ELPAttained ELP
NOTE: State reports having a new assessment for 2005–06, so data cannot be directly compared across years, thus no data were provided.
Percentage of students advanced or proficient in academic content achievement, school year 2005–06
0
20
40
60
80
100
3 4 5 6 7 8 HS*Grade level
Perc
enta
ge p
rof.
or a
dvan
ced
MathReading or Lang. Arts
*States test once in high school, at their own discretion. Testing in Native Language: Is testing offered in students’ native language(s)? No If yes, what language(s)? Not applicable
Page 108

Profiles New Hampshire
Page 109
Educational Staff Information NOTE: Numbers for educational staff information are current as of data collection; see Appendix C for details. Current number of certified teachers working with LEP students, and additional number needed in five years No data provided on number of teachers needed in five years.
0
50
100
150
200
Current and additional needed
No.
of c
ertif
ied
teac
hers
Additional neededCurrent no.
Number of educational staff receiving professional development via subgrantees, by type of staff No data provided.
0
0.2
0.4
0.6
0.8
1
Classro
om te
ache
rs
Teach
ers fo
r LEP
Princip
als
Other a
dmins
Other s
choo
l pers
onne
l
CBO* pers
onne
l
Type of staff
No.
par
ticip
ants
*Community-based organization

Profiles New Jersey
New Jersey Student Information Number of LEP and immigrant students served by Title III funds, 2002–03 through 2005–06
0
10,000
20,000
30,000
40,00050,000
60,000
2002–03 2003–04 2004–05 2005–06
School year
No.
of s
tude
nts
No. LEP studentsNo. immigrant students
Percentage of students who made progress in ELP and percentage of students who attained ELP
0
20
40
60
80
100
2004–05 2005–06
School year
Perc
enta
ge
Made progress in ELPAttained ELP
NOTE: State reports having a new assessment and data collection process for 2005–06, so data may not be directly comparable across years.
Percentage of students advanced or proficient in academic content achievement, school year 2005–06
0
20
40
60
80
100
3 4 5 6 7 8 HS*Grade level
Perc
enta
ge p
rof.
or a
dvan
ced
MathReading or Lang. Arts
*States test once in high school, at their own discretion. Testing in Native Language: Is testing offered in students’ native language(s)? No If yes, what language(s)? Not applicable
Page 110
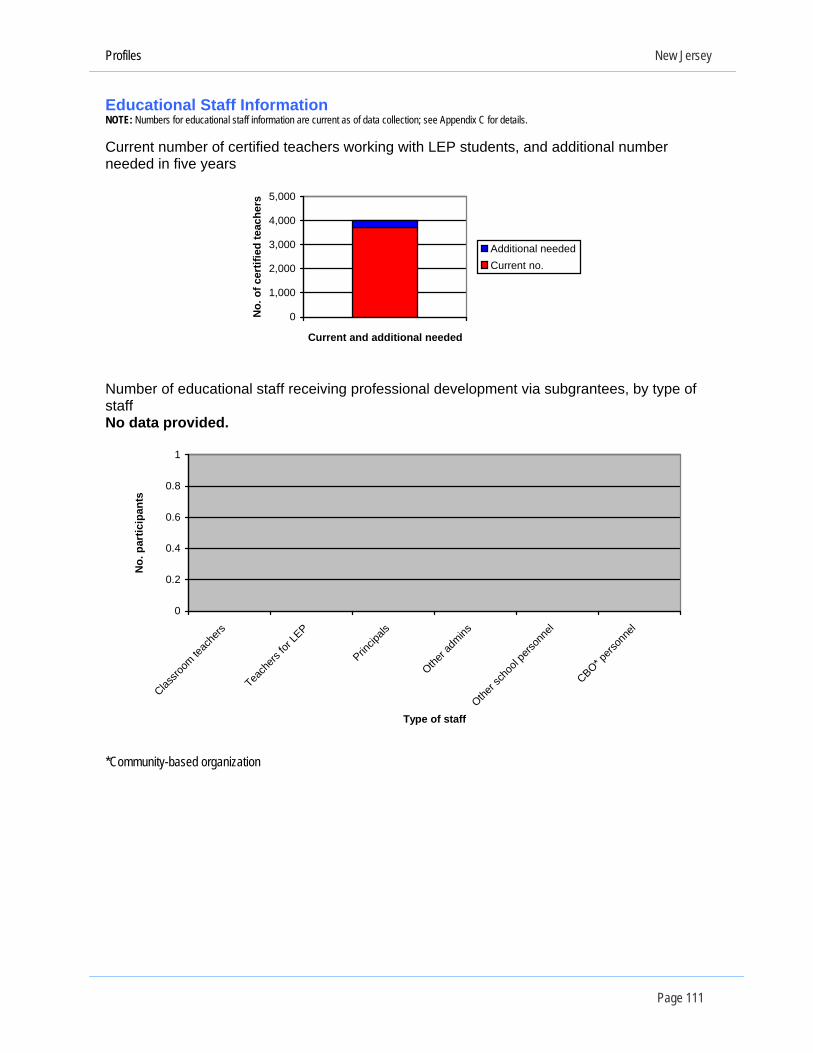
Profiles New Jersey
Page 111
Educational Staff Information NOTE: Numbers for educational staff information are current as of data collection; see Appendix C for details. Current number of certified teachers working with LEP students, and additional number needed in five years
0
1,000
2,000
3,000
4,000
5,000
Current and additional needed
No.
of c
ertif
ied
teac
hers
Additional neededCurrent no.
Number of educational staff receiving professional development via subgrantees, by type of staff No data provided.
0
0.2
0.4
0.6
0.8
1
Classro
om te
ache
rs
Teach
ers fo
r LEP
Princip
als
Other a
dmins
Other s
choo
l pers
onne
l
CBO* pers
onne
l
Type of staff
No.
par
ticip
ants
*Community-based organization
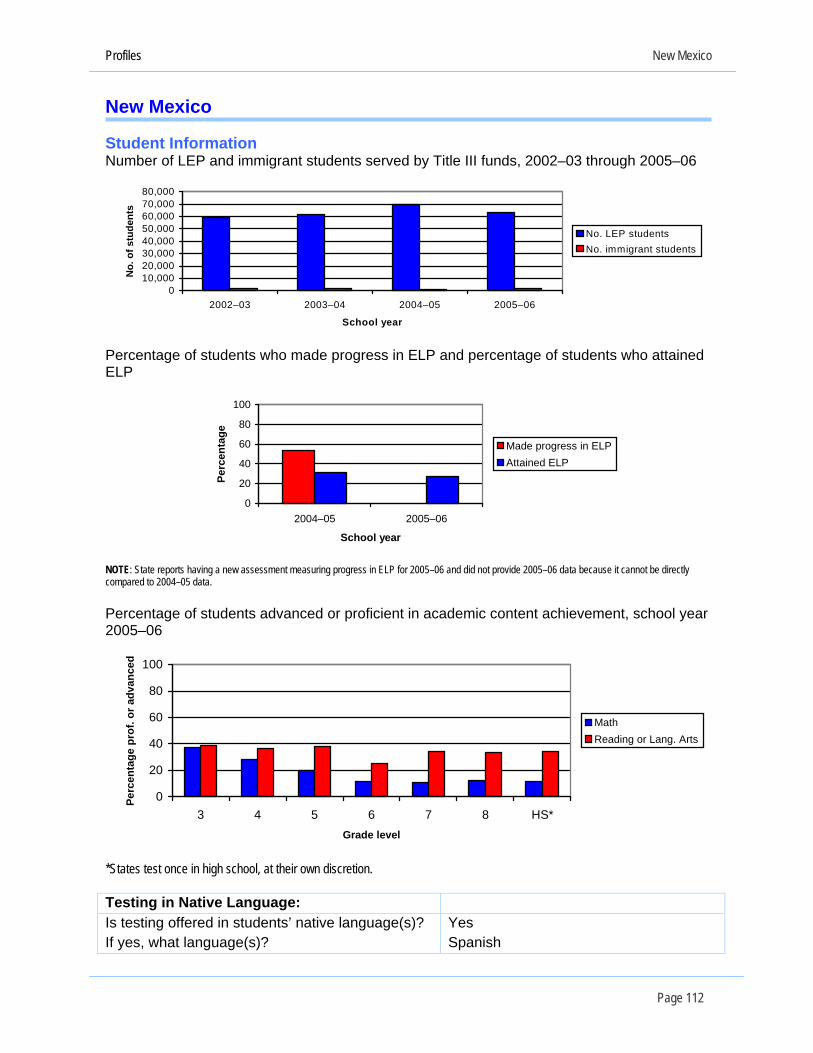
Profiles New Mexico
New Mexico Student Information Number of LEP and immigrant students served by Title III funds, 2002–03 through 2005–06
010,00020,00030,00040,00050,00060,00070,00080,000
2002–03 2003–04 2004–05 2005–06
School year
No.
of s
tude
nts
No. LEP studentsNo. immigrant students
Percentage of students who made progress in ELP and percentage of students who attained ELP
0
20
40
60
80
100
2004–05 2005–06
School year
Perc
enta
ge
Made progress in ELPAttained ELP
NOTE: State reports having a new assessment measuring progress in ELP for 2005–06 and did not provide 2005–06 data because it cannot be directly compared to 2004–05 data.
Percentage of students advanced or proficient in academic content achievement, school year 2005–06
0
20
40
60
80
100
3 4 5 6 7 8 HS*Grade level
Perc
enta
ge p
rof.
or a
dvan
ced
MathReading or Lang. Arts
*States test once in high school, at their own discretion. Testing in Native Language: Is testing offered in students’ native language(s)? Yes If yes, what language(s)? Spanish
Page 112
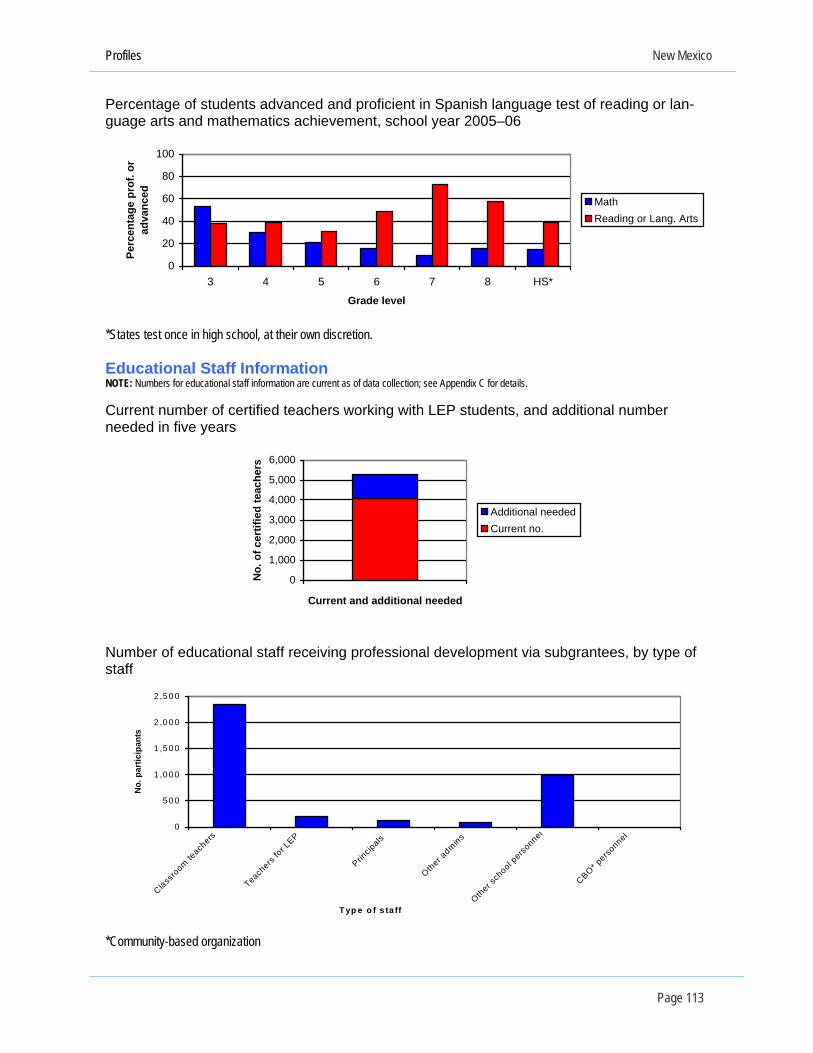
Profiles New Mexico
Page 113
Percentage of students advanced and proficient in Spanish language test of reading or lan-guage arts and mathematics achievement, school year 2005–06
0
20
40
60
80
100
3 4 5 6 7 8 HS*
Grade level
Perc
enta
ge p
rof.
or
adva
nced
MathReading or Lang. Arts
*States test once in high school, at their own discretion. Educational Staff Information NOTE: Numbers for educational staff information are current as of data collection; see Appendix C for details. Current number of certified teachers working with LEP students, and additional number needed in five years
0
1,000
2,000
3,000
4,000
5,000
6,000
Current and additional needed
No.
of c
ertif
ied
teac
hers
Additional neededCurrent no.
Number of educational staff receiving professional development via subgrantees, by type of staff
0
5 0 0
1 ,0 0 0
1 ,5 0 0
2 ,0 0 0
2 ,5 0 0
Classro
om teach
ers
Teachers
for LEP
Princip
als
Other admins
Other sch
ool perso
nnel
CBO* perso
nnel
T yp e o f s ta ff
No.
par
ticip
ants
*Community-based organization
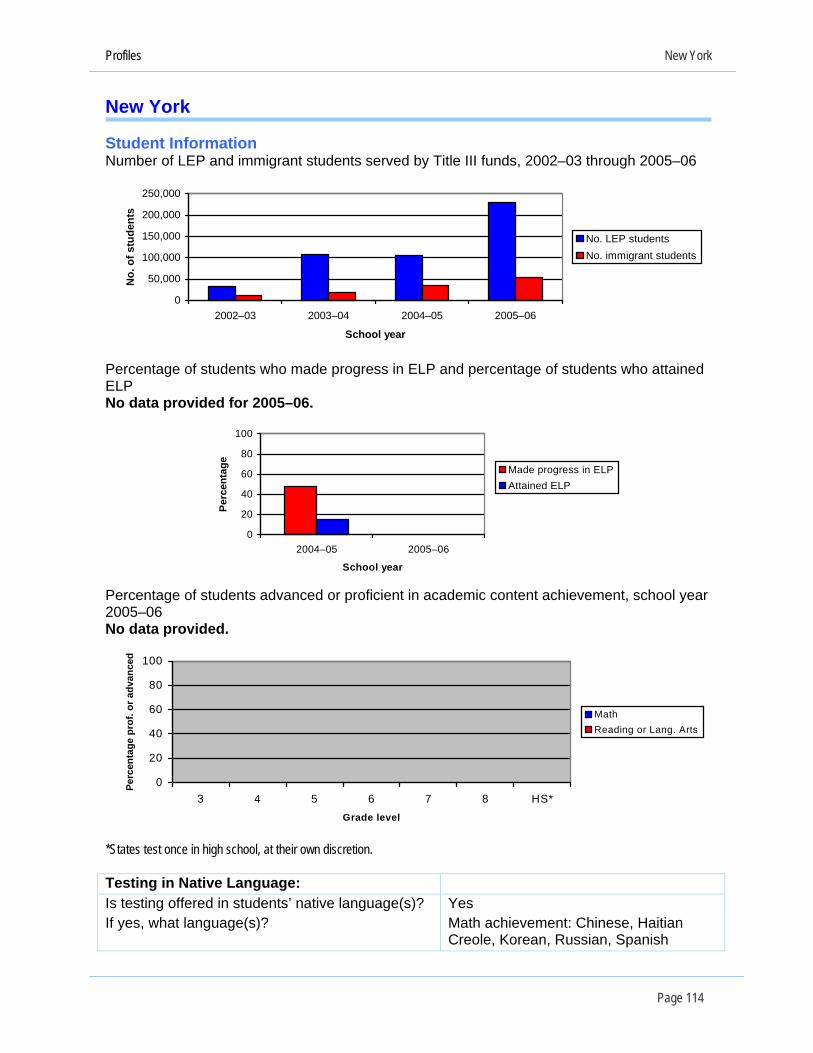
Profiles New York
New York Student Information Number of LEP and immigrant students served by Title III funds, 2002–03 through 2005–06
0
50,000
100,000
150,000
200,000
250,000
2002–03 2003–04 2004–05 2005–06
School year
No.
of s
tude
nts
No. LEP studentsNo. immigrant students
Percentage of students who made progress in ELP and percentage of students who attained ELP No data provided for 2005–06.
0
20
40
60
80
100
2004–05 2005–06
School year
Perc
enta
ge Made progress in ELPAttained ELP
Percentage of students advanced or proficient in academic content achievement, school year 2005–06 No data provided.
0
20
40
60
80
100
3 4 5 6 7 8 HS*Grade level
Perc
enta
ge p
rof.
or a
dvan
ced
MathReading or Lang. Arts
*States test once in high school, at their own discretion. Testing in Native Language: Is testing offered in students’ native language(s)? Yes If yes, what language(s)? Math achievement: Chinese, Haitian
Creole, Korean, Russian, Spanish
Page 114

Profiles New York
Page 115
Percentage of students advanced and proficient in native language tests of mathematics achievement, school year 2005–06 No data provided.
0
20
40
60
80
100
3 4 5 6 7 8 HS*
Grade level
Perc
enta
ge p
rof.
or
adva
nced
Math
*States test once in high school, at their own discretion. Educational Staff Information NOTE: Numbers for educational staff information are current as of data collection; see Appendix C for details. Current number of certified teachers working with LEP students, and additional number needed in five years
0
10,000
20,000
30,000
40,000
50,000
Current and additional needed
No.
of c
ertif
ied
teac
hers
Additional neededCurrent no.
Number of educational staff receiving professional development via subgrantees, by type of staff
0
2 ,000
4 ,000
6 ,000
8 ,000
10 ,000
12 ,000
14 ,000
16 ,000
Classro
om teach
ers
Teachers
for LEP
Princip
als
Other admins
Other sch
ool perso
nnel
CBO* perso
nnel
Typ e o f s ta ff
No.
par
ticip
ants
*Community-based organization
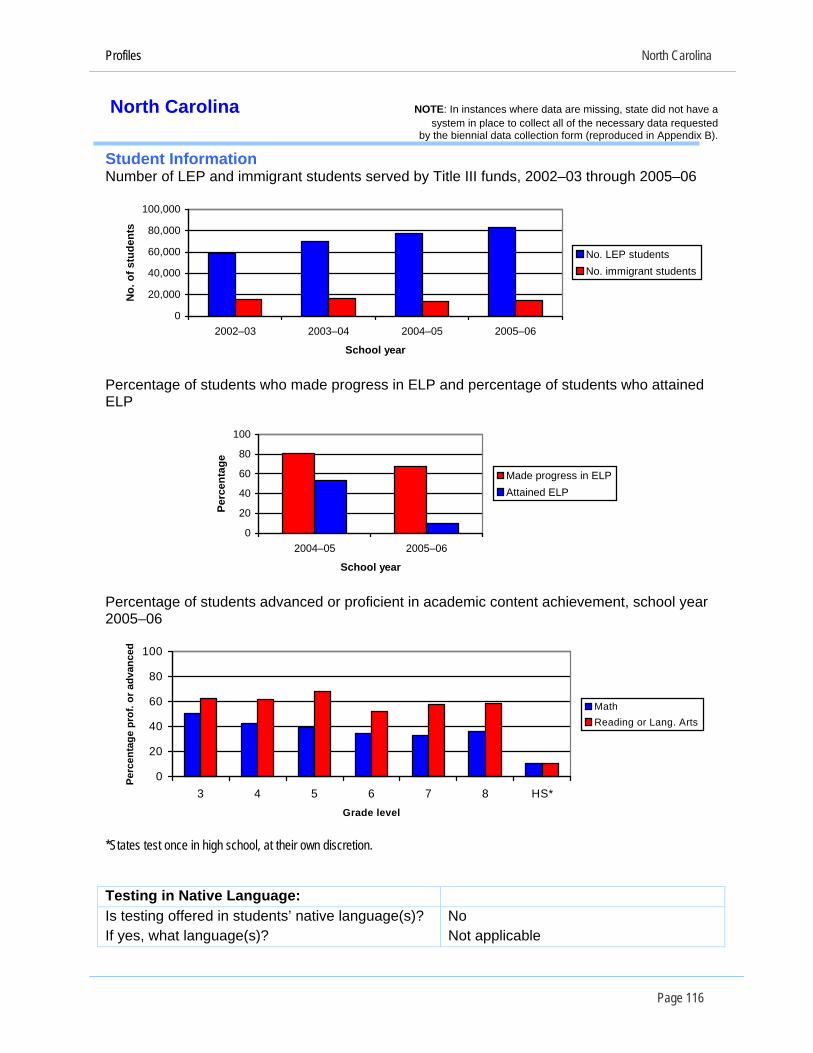
Profiles North Carolina
North Carolina NOTE: In instances where data are missing, state did not have a system in place to collect all of the necessary data requested
by the biennial data collection form (reproduced in Appendix B).
Student Information Number of LEP and immigrant students served by Title III funds, 2002–03 through 2005–06
0
20,000
40,000
60,000
80,000
100,000
2002–03 2003–04 2004–05 2005–06
School year
No.
of s
tude
nts
No. LEP studentsNo. immigrant students
Percentage of students who made progress in ELP and percentage of students who attained ELP
0
20
40
60
80
100
2004–05 2005–06
School year
Perc
enta
ge
Made progress in ELPAttained ELP
Percentage of students advanced or proficient in academic content achievement, school year 2005–06
0
20
40
60
80
100
3 4 5 6 7 8 HS*Grade level
Perc
enta
ge p
rof.
or a
dvan
ced
MathReading or Lang. Arts
*States test once in high school, at their own discretion. Testing in Native Language: Is testing offered in students’ native language(s)? No If yes, what language(s)? Not applicable
Page 116
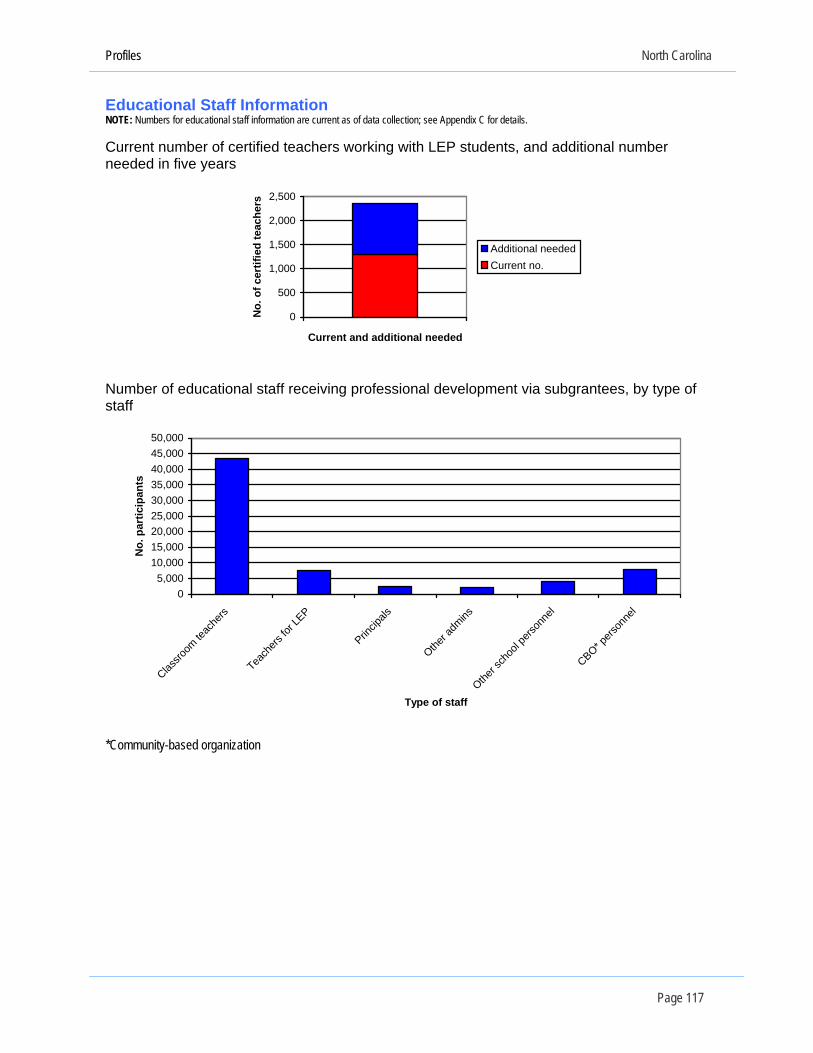
Profiles North Carolina
Page 117
Educational Staff Information NOTE: Numbers for educational staff information are current as of data collection; see Appendix C for details. Current number of certified teachers working with LEP students, and additional number needed in five years
0
500
1,000
1,500
2,000
2,500
Current and additional needed
No.
of c
ertif
ied
teac
hers
Additional neededCurrent no.
Number of educational staff receiving professional development via subgrantees, by type of staff
05,000
10,00015,00020,00025,00030,00035,00040,00045,00050,000
Classro
om te
ache
rs
Teach
ers fo
r LEP
Princip
als
Other a
dmins
Other s
choo
l pers
onne
l
CBO* pers
onne
l
Type of staff
No.
par
ticip
ants
*Community-based organization
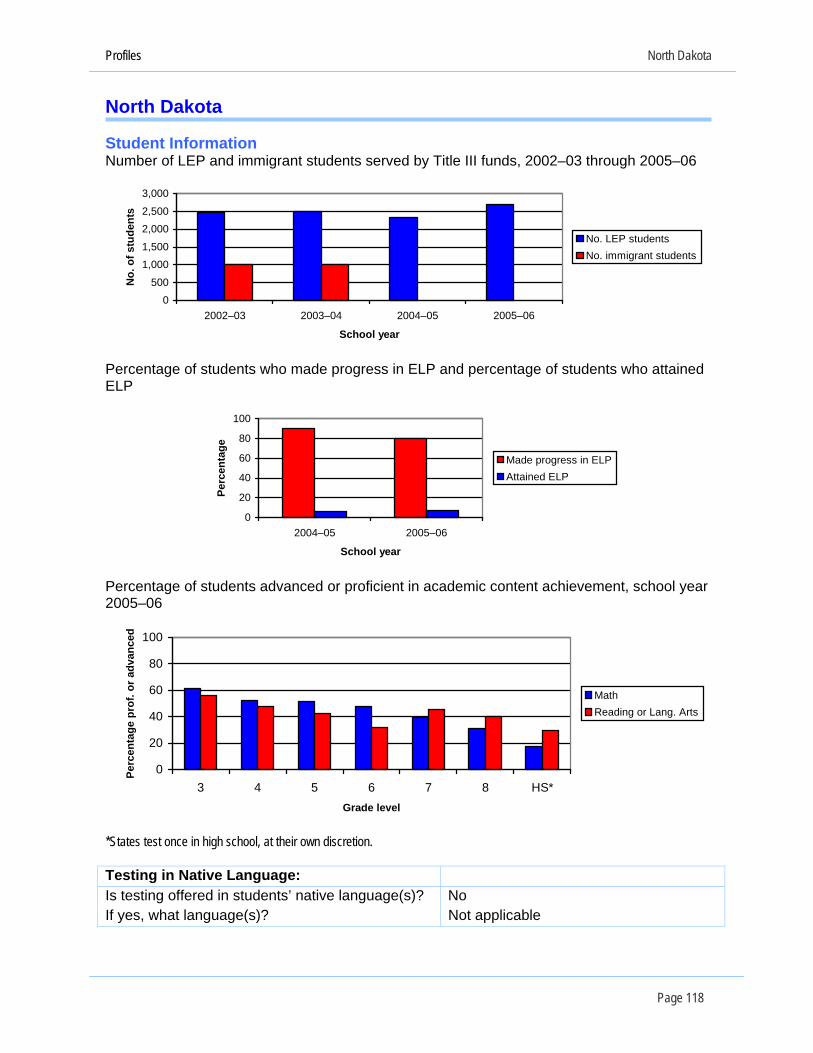
Profiles North Dakota
North Dakota Student Information Number of LEP and immigrant students served by Title III funds, 2002–03 through 2005–06
0
500
1,000
1,500
2,0002,500
3,000
2002–03 2003–04 2004–05 2005–06
School year
No.
of s
tude
nts
No. LEP studentsNo. immigrant students
Percentage of students who made progress in ELP and percentage of students who attained ELP
0
20
40
60
80
100
2004–05 2005–06
School year
Perc
enta
ge
Made progress in ELPAttained ELP
Percentage of students advanced or proficient in academic content achievement, school year 2005–06
0
20
40
60
80
100
3 4 5 6 7 8 HS*Grade level
Perc
enta
ge p
rof.
or a
dvan
ced
MathReading or Lang. Arts
*States test once in high school, at their own discretion. Testing in Native Language: Is testing offered in students’ native language(s)? No If yes, what language(s)? Not applicable
Page 118

Profiles North Dakota
Page 119
Educational Staff Information NOTE: Numbers for educational staff information are current as of data collection; see Appendix C for details. Current number of certified teachers working with LEP students, and additional number needed in five years
0
20
40
60
80
100
Current and additional needed
No.
of c
ertif
ied
teac
hers
Additional neededCurrent no.
Number of educational staff receiving professional development via subgrantees, by type of staff
0
200
400
600
800
1,000
1,200
Classro
om te
ache
rs
Teach
ers fo
r LEP
Princip
als
Other a
dmins
Other s
choo
l pers
onne
l
CBO* pers
onne
l
Type of staff
No.
par
ticip
ants
*Community-based organization
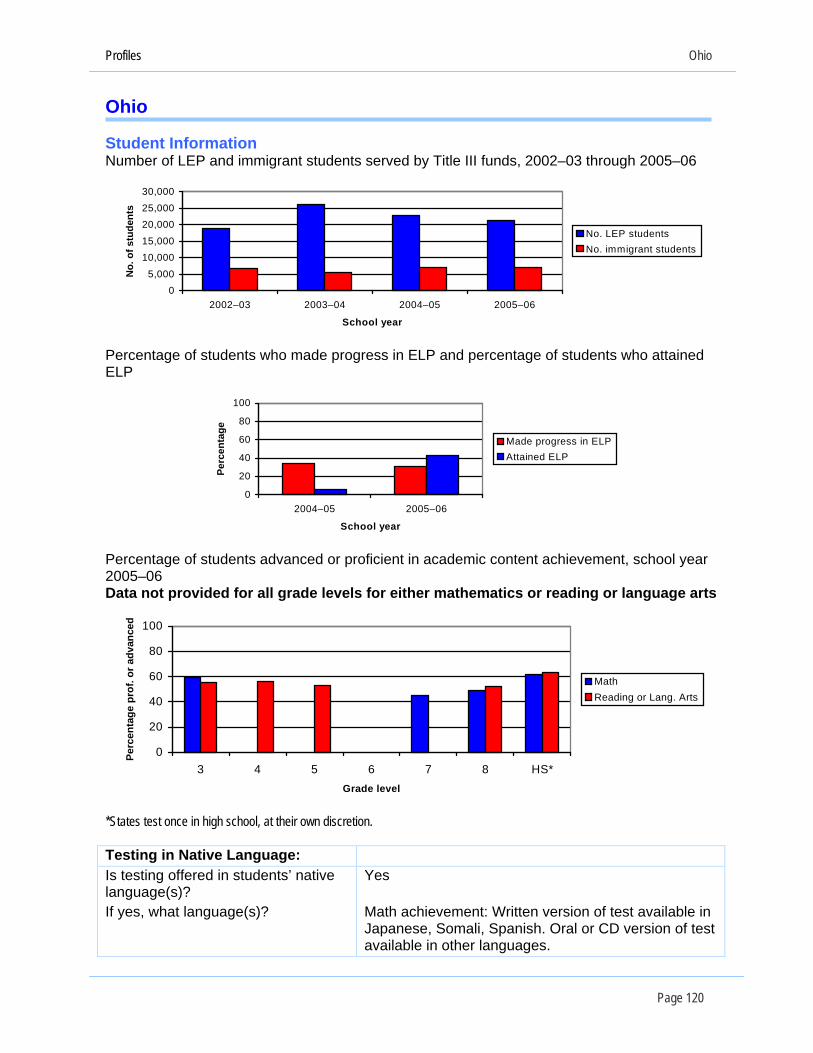
Profiles Ohio
Page 120
Ohio Student Information Number of LEP and immigrant students served by Title III funds, 2002–03 through 2005–06
05,000
10,00015,000
20,00025,000
30,000
2002–03 2003–04 2004–05 2005–06
School year
No.
of s
tude
nts
No. LEP studentsNo. immigrant students
Percentage of students who made progress in ELP and percentage of students who attained ELP
0
20
40
60
80
100
2004–05 2005–06
School year
Perc
enta
ge
Made progress in ELPAttained ELP
Percentage of students advanced or proficient in academic content achievement, school year 2005–06 Data not provided for all grade levels for either mathematics or reading or language arts
0
20
40
60
80
100
3 4 5 6 7 8 HS*Grade level
Perc
enta
ge p
rof.
or a
dvan
ced
MathReading or Lang. Arts
*States test once in high school, at their own discretion. Testing in Native Language: Is testing offered in students’ native language(s)?
Yes
If yes, what language(s)? Math achievement: Written version of test available in Japanese, Somali, Spanish. Oral or CD version of test available in other languages.

Profiles Ohio
Page 121
Percentage of students advanced and p ts of mathematics achievement, school year 2005–06
roficient in native language tes
0
20
40
60
80
100
3 4 5 6 7 8 HS*
Grade level
Perc
enta
ge p
rof.
or
adva
nced
Math
*States test once in high school, at their own discretion. Educational Staff Information NOTE: Numbers for educational staff information are current as of data collection; see Appendix C for details. Current number of certified teachers working with LEP students, and additional number needed in five years
0200400600800
1,0001,2001,4001,600
Current and additional needed
No.
of c
ertif
ied
teac
hers
Additional neededCurrent no.
Number of educational staff receiving professional development via subgrantees, by type of staff
0
500
1,000
1,500
2,000
2,500
3,000
3,500
4,000
4,500
Classro
om teach
ers
Teachers
for LEP
Princip
als
Other admins
Other sch
ool perso
nnel
CBO* perso
nnel
Type o f staff
No.
par
ticip
ants
*Community-based organization
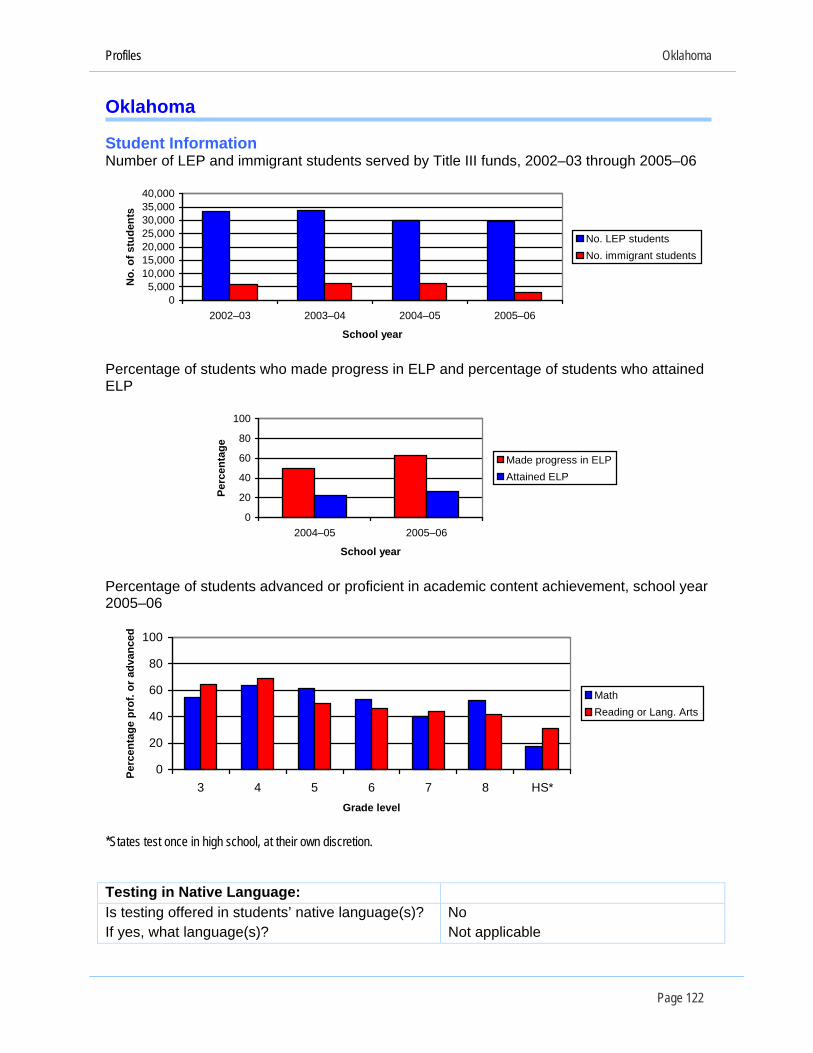
Profiles Oklahoma
Page 122
Oklahoma Student Information Number of LEP and immigrant students served by Title III funds, 2002–03 through 2005–06
05,000
10,00015,00020,00025,00030,00035,00040,000
2002–03 2003–04 2004–05 2005–06
School year
No.
of s
tude
nts
No. LEP studentsNo. immigrant students
udents who attained Percentage of students who made progress in ELP and percentage of st
LP E
0
20
40
60
80
100
2004–05 2005–06
School year
Perc
enta
ge
Made progress in ELPAttained ELP
Percentage of students advanced or proficient in academic content achievement, school year 2005–06
0
20
40
60
80
100
adv
ance
d
3 4 5 6 7 8 HS*Grade level
Perc
enta
ge p
rof.
or
MathReading or Lang. Arts
*States test once in high school, at their own discretion. Testing in Native Language: Is testing offered in students’ native language(s)? No If yes, what language(s)? Not applicable

Profiles Oklahoma
Page 123
Educational SOTE: Numbers for educ
taff Information ational staff information are current as of data collection; see Appendix C for details.
d teachers working with LEP students, and additional number
N Current number of certifieneeded in five years
01,0002,0003,0004,0005,0006,0007,000
Current and additional needed
No.
of c
ertif
ied
teac
hers
Additional neededCurrent no.
Number of educational staff receiving professional development via subgrantees, by type of staff
0
2,000
4,000
6,000
8,000
10,000
12,000
14,000
Classro
om te
ache
rs
Teach
ers fo
r LEP
Princip
als
Other a
dmins
Other s
choo
l pers
onne
l
CBO* pers
onne
l
Type of staff
No.
par
ticip
ants
*Community-based organization
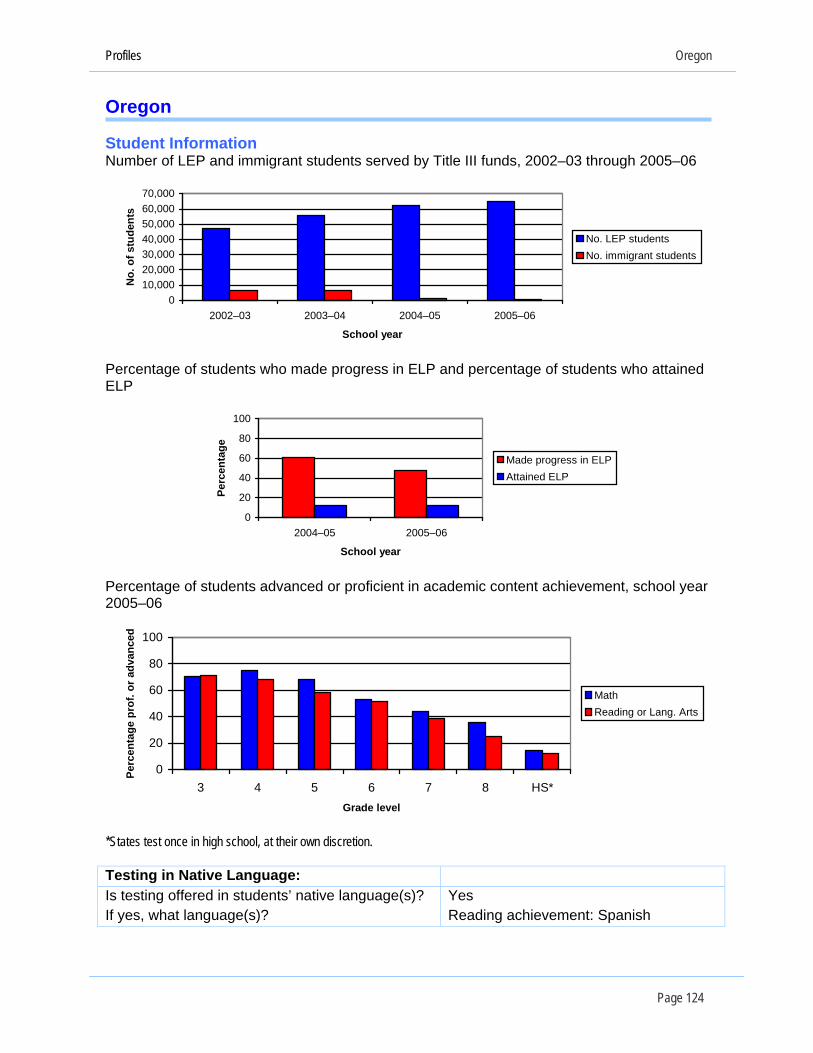
Profiles Oregon
Page 124
Oregon Student Information Number of LEP and immigrant students served by Title III funds, 2002–03 through 2005–06
010,00020,00030,00040,00050,00060,00070,000
2002–03 2003–04 2004–05 2005–06
School year
No.
of s
tude
nts
No. LEP studentsNo. immigrant students
Percentage of students who made progress in LP and percentage of students who attained EELP
0
20
40
60
80
100
2004–05 2005–06
School year
Perc
enta
ge
Made progress in ELPAttained ELP
Percentage of students advanced or proficient in academic content achievement, school year 2005–06
0
20
rcen
tag
40
60
80
100
3 4 5 6 7 8 HS*Grade level
Pee
prof
. or a
dvan
ced
MathReading or Lang. Arts
*States test once in high school, at their own discretion. Testing in Native Language: Is testing offered in students’ native language(s)? Yes If yes, what language(s)? Reading achievement: Spanish
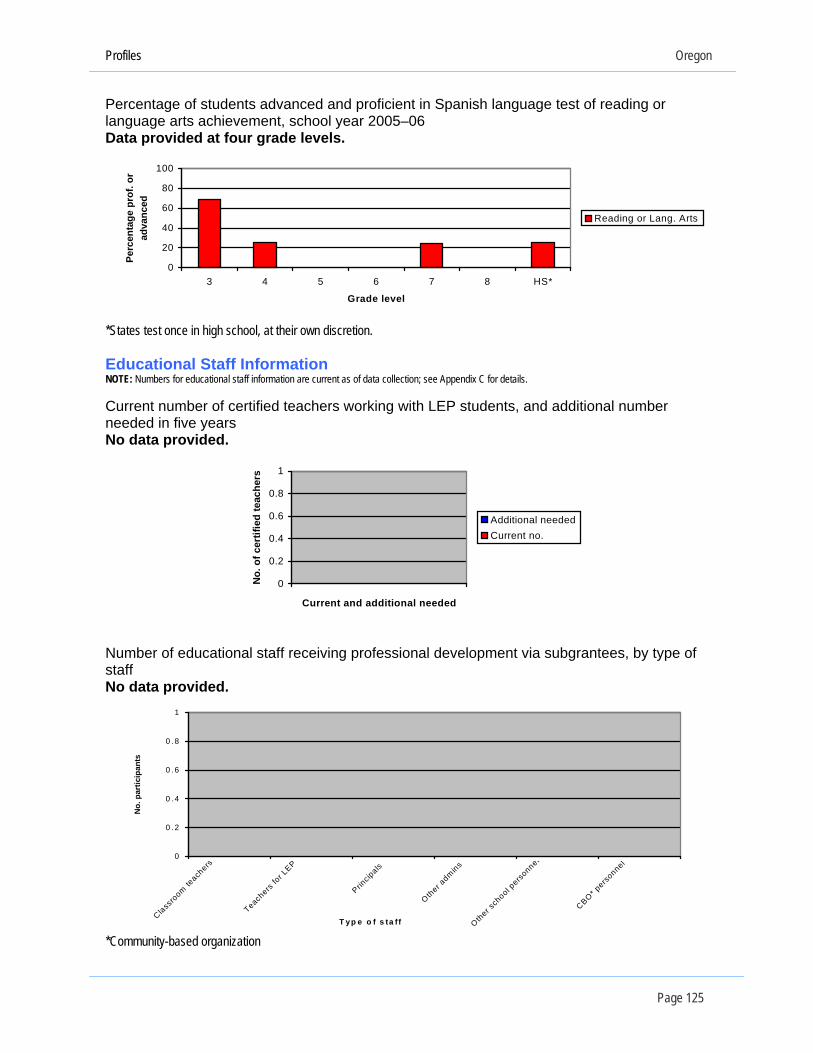
Profiles Oregon
Page 125
Percentagenguage a
of students advanced and proficient in Spanish language test of reading or rts achievement, school year 2005–06
rade levels. laData provided at four g
0
20
40
60
80
100
3 4 5 6 7 8 HS*
Grade level
Perc
enta
ge p
rof.
orad
vanc
ed
Reading or Lang. Arts
*States test once in high school, at their own discretion.
Current number of certified teachers working with LEP students, and additional number needed in five years No data provided.
Educational Staff Information NOTE: Numbers for educational staff information are current as of data collection; see Appendix C for details.
0No
0.2
0.4
0.6
0.8
1
Current and additional needed
. of c
ertif
ied
teac
hers
Additional neededCurrent no.
Number of educational staff receiving professional development via subgrantees, by type of staff No data provided.
0
0 .2
0 .4
0 .6
0 .8
1
Classro
om te
achers
Teachers
for L
EP
Prin
Other
cipals
ad
hool pers
onnm
ins
Other s
c
el
CBO* pers
onnel
T yp e o f s ta f f
No.
par
ticip
ants
*Community-based organization

Profiles Pennsylvania
Page 126
Pennsylvania Student Information Number of LEP and immigrant students served by Title III funds, 2002–03 through 2005–06
0
10,000
20,000
30,000
40,000
50,000
2002–03 2003–04 2004–05 2005–06
School year
No.
of s
tude
nts
No. LEP studentsNo. immigrant students
udents who attained Percentage of students who made progress in ELP and percentage of st
LP E
0
20
40
60
80
100
2004–05 2005–06
School year
Perc
enta
ge
Made progress in ELPAttained ELP
NOTE: Data may not be comparable across years as state reports having a new assessment. Percentage of students advanced or proficient in academic content achievement, school year
005–06 2
0
20
40
60
80
adv
an
100ced
3 4 5 6 7 8 HS*Grade level
Perc
enta
ge p
rof.
or
MathReading or Lang. Arts
*States test once in high school, at their own discretion. Testing in Native Language: Is testing offered in students’ native language(s)? Yes If yes, what language(s)? Math achievement: Spanish
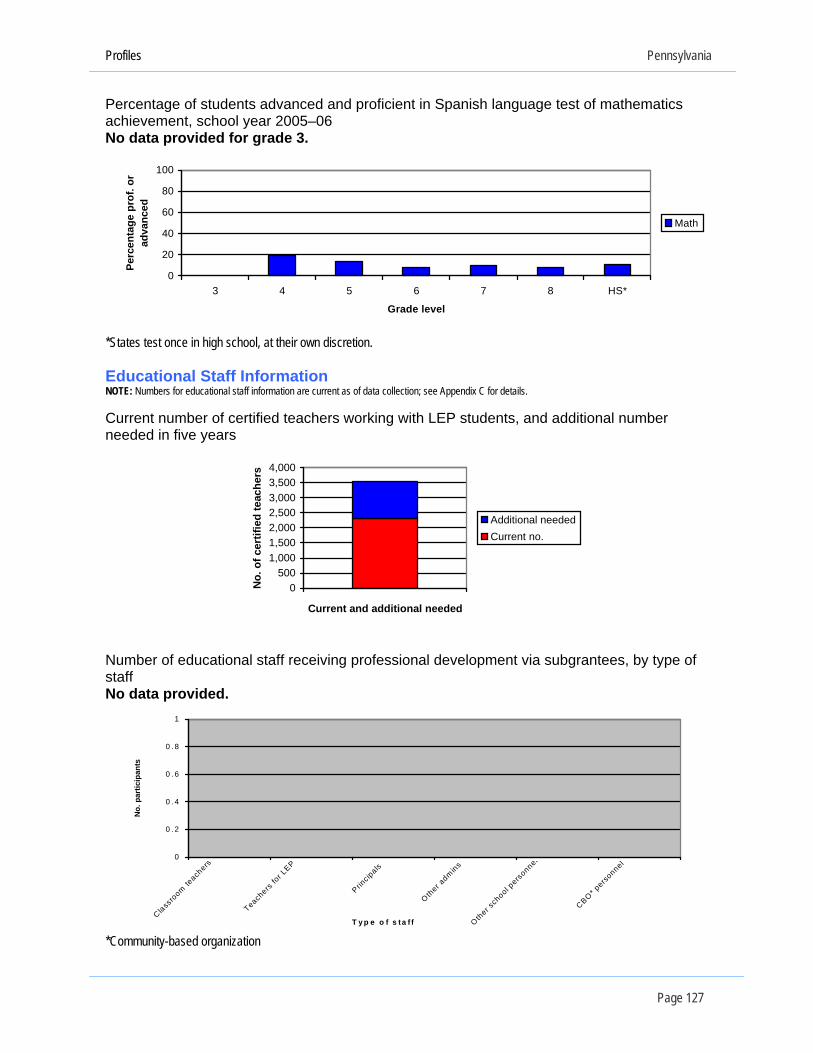
Profiles Pennsylvania
Page 127
Percentage of studechievement, school ye
nts advanced and proficient in Spanish language test of mathematics ar 2005–06
ade 3. aNo data provided for gr
0
20
40
60
80
100
3 4 5 6 7 8 HS*
Grade level
Perc
enta
ge p
rof.
or
adva
nced
Math
*States test once in high school, at their own discretion.
umbers for educational staff information are current as of data collection; see Appendix C for details. Current number of certified teachers working with LEP students, and additional number needed in five years
Educational Staff Information NOTE: N
0No. 500
1,0001,5002,0002,5003,0003,5004,000
of c
ertif
ied
teac
hers
Additional needed
Current and additional needed
Current no.
Number of educational staff receiving professional development via subgrantees, by type of staff No data provided.
0 .2
0 .4
0 .6
0 .8
1
0
acher
Class
te
room
s
Teachers
for L
EP
Princ
Other a
dmins
r sch
ool pers
onnipals el
CBO* pers
onne
Othe
l
T y p e o f s ta f f
No.
par
ticip
ants
*Community-based organization

Profiles Puerto Rico
Page 128
Puerto Rico NOTE:In instances where data are missing, state did not have a system in place to collect all of the necessary data requested
Student Information Number of LEP and immigrant students served by Title III funds, 2002–03 through 2005–06 No data provided for no. of LEP students served in 2002–03 and 2003–04. Data presented for 2004–05 and 2005–06 are the number of limited English proficient students; however, the other data in this profile represent the performance of limited Spanish proficient students.
by the biennial data collection form (reproduced in Appendix B).
02002–03 2003–0
500
No.
of
1000
1500
2000
stu
dent
s
4 2004–05 2005–06
School year
No. LEP studentsNo. immigrant students
e of
nish language proficiency No data provided.
Percentage of students making progress in Spanish language proficiency and percentagstudents attaining Spa
0
20
40
60
80
100
2004–05 2005–06
S chool year
Perc
enta
ge M ade progress in S panishlanguage profic iencyA tta ined S panishlanguage profic iency
Percentage of students advanced or proficient in academic content achievement, school year 2005–06 No data provided.
0
20
40
60
80
100
3 4 5 6 7 8 HS*Grade level
Perc
enta
ge p
rof.
or a
dvan
ced
MathReading or Lang. Arts
*Test is administered once in high school, at discretion of the jurisdiction. Testing in Native Language: Is testing offered in students’ native language(s)? No If yes, what language(s)? Not applicable
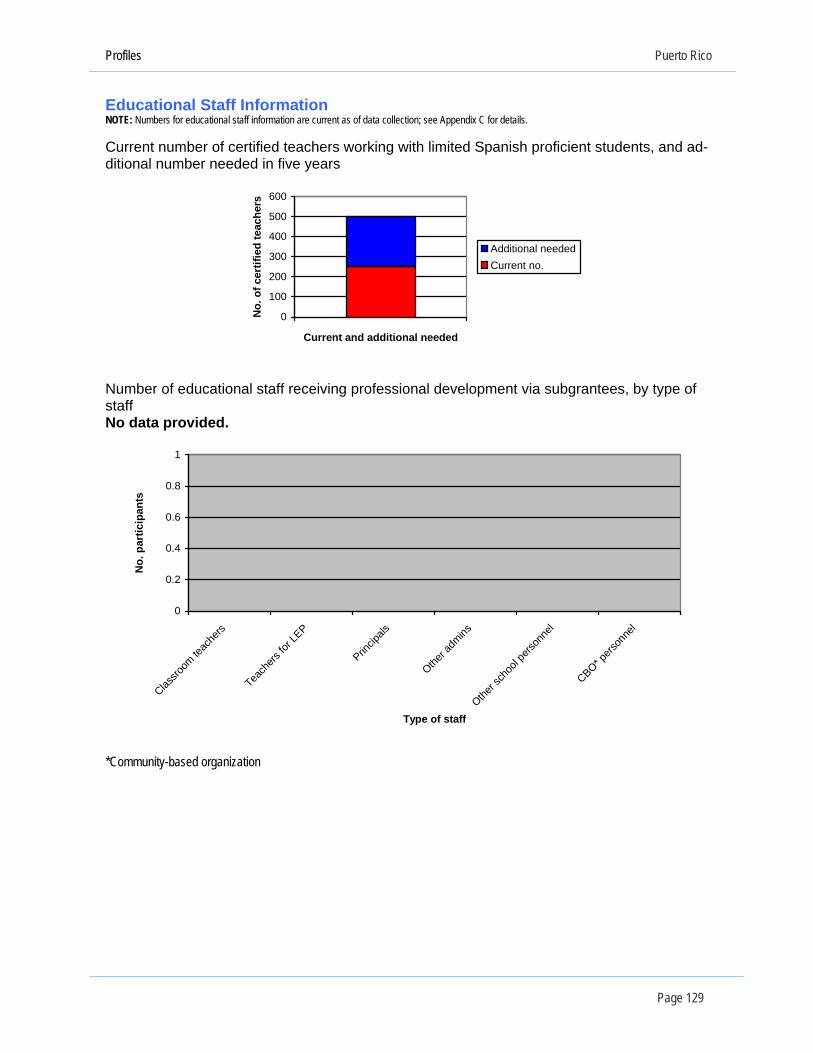
Profiles Puerto Rico
Page 129
Educational StaffNOTE: Numbers for educationa ; s
Information l staff information are current as of data collection
working with limited Spanish proficient students, and ad-
ee Appendix C for details.
Current number of certified teachers ditional number needed in five years
0
100
200
300
400
500
600
ed te
ache
rsAdditional needed
Current and additional needed
No.
of c
ertif
iCurrent no.
Number of educational staff receiving professional development via subgrantees, by type of staff No data provided.
0
0.2
0.4
0.6
0.8
1
Classro
oea
Teach
ers fo
rPrin
Other a
Other s
choo
l pers
o
CBO* pers
Type of staff
No.
par
ticip
ants
*Community-based organization
m tch
ers LEP
cipals
dmins nn
elon
nel
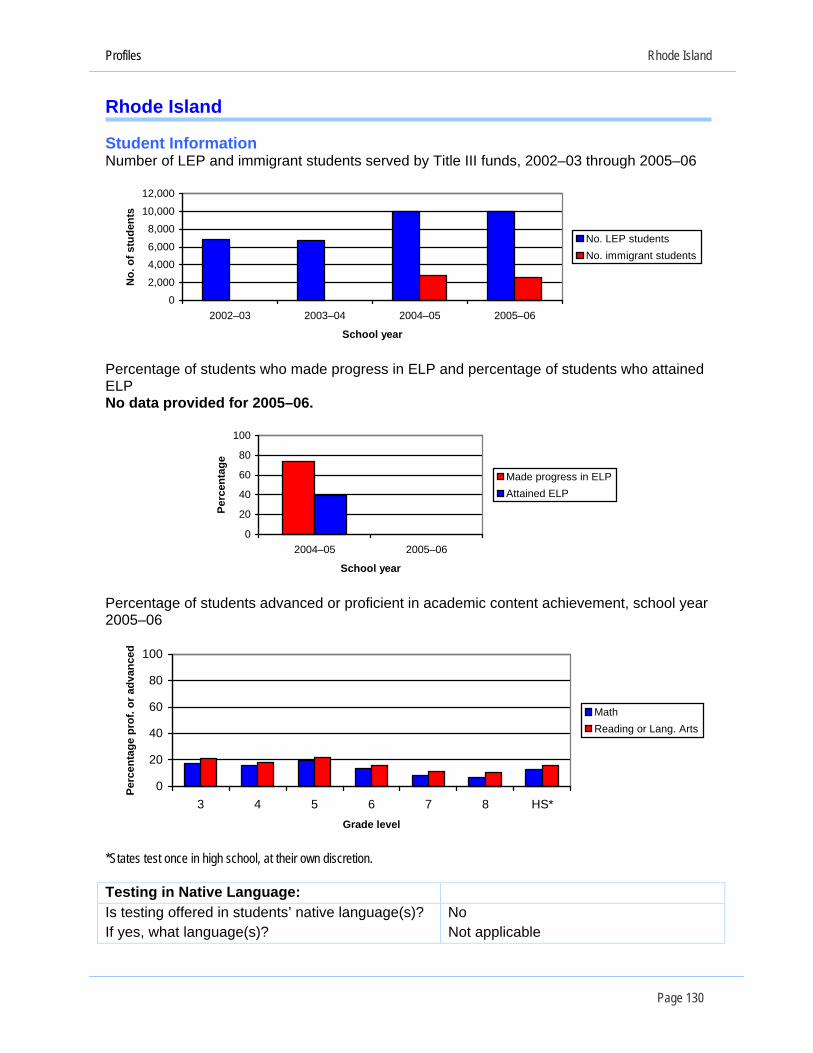
Profiles Rhode Island
Page 130
Rhode Island Student Information Number of LEP and immigrant students served by Title III funds, 2002–03 through 2005–06
0
2,000
4,000
6,000
8,00010,000
12,000
2002–03 2003–04 2004–05 2005–06
School year
No.
of s
tude
nts
No. LEP studentsNo. immigrant students
Percentage of students who made progress in LP and percentage of students who attained
ta provided for 2005–06.
EELP No da
0
20
40
60
80
100
2004–05 2005–06
School year
Perc
enta
ge
Made progress in ELPAttained ELP
Percentage of students advanced or proficient in academic content achievement, school year 2005–06
0
20
rcen
tag
40
60
80
100
3 4 5 6 7 8 HS*Grade level
Pee
prof
. or a
dvan
ced
MathReading or Lang. Arts
*States test once in high school, at their own discretion. Testing in Native Language: Is testing offered in students’ native language(s)? No If yes, what language(s)? Not applicable
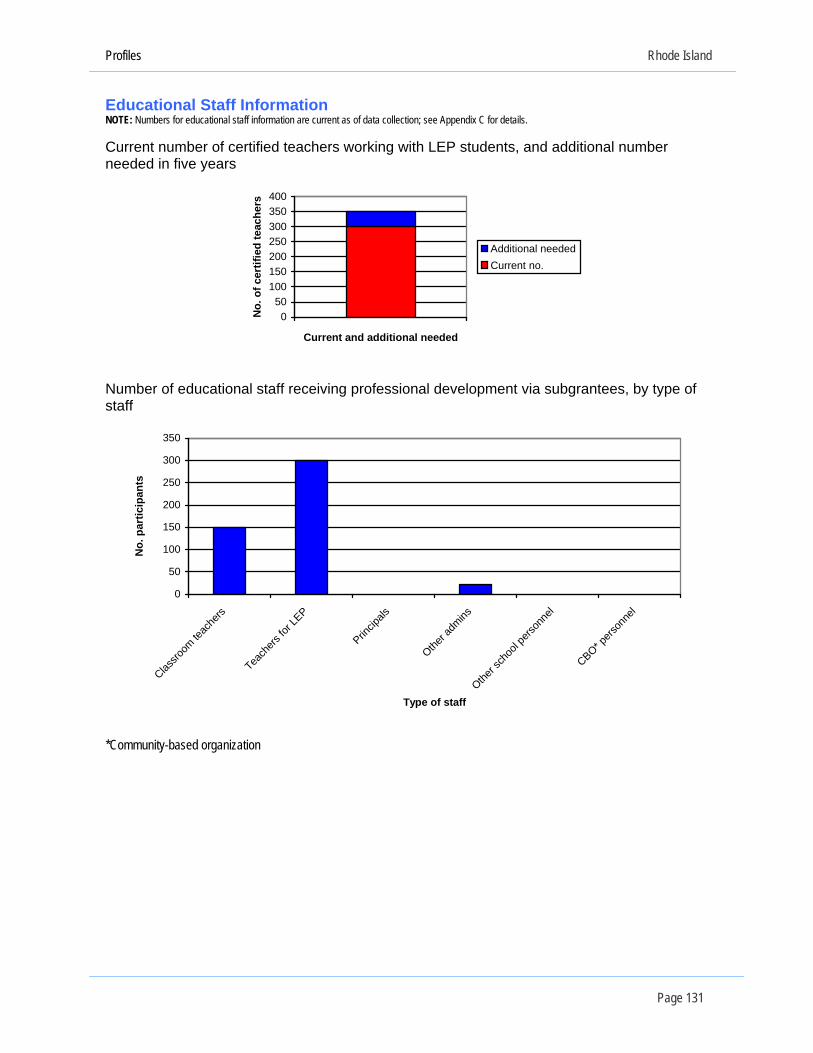
Profiles Rhode Island
Page 131
Educational StafOTE: Numbers for educational
f Information staff information are current as of data collection; see Appendix C for details.
d teachers working with LEP students, and additional number
N Current number of certifieneeded in five years
050
100150200250300350400
Current and additional needed
No.
of c
ertif
ied
teac
hers
Additional neededCurrent no.
Number of educational staff receiving professional development via subgrantees, by type of staff
0
rs P ls ns el nel
50
100
150
200
250
300
350
Classro
om te
ache
Teach
ers fo
r LE
Princip
a
Other a
dmi
Other s
choo
l pers
onn
CBO* pers
on
Type of staff
No.
par
ticip
ants
*Community-based organization
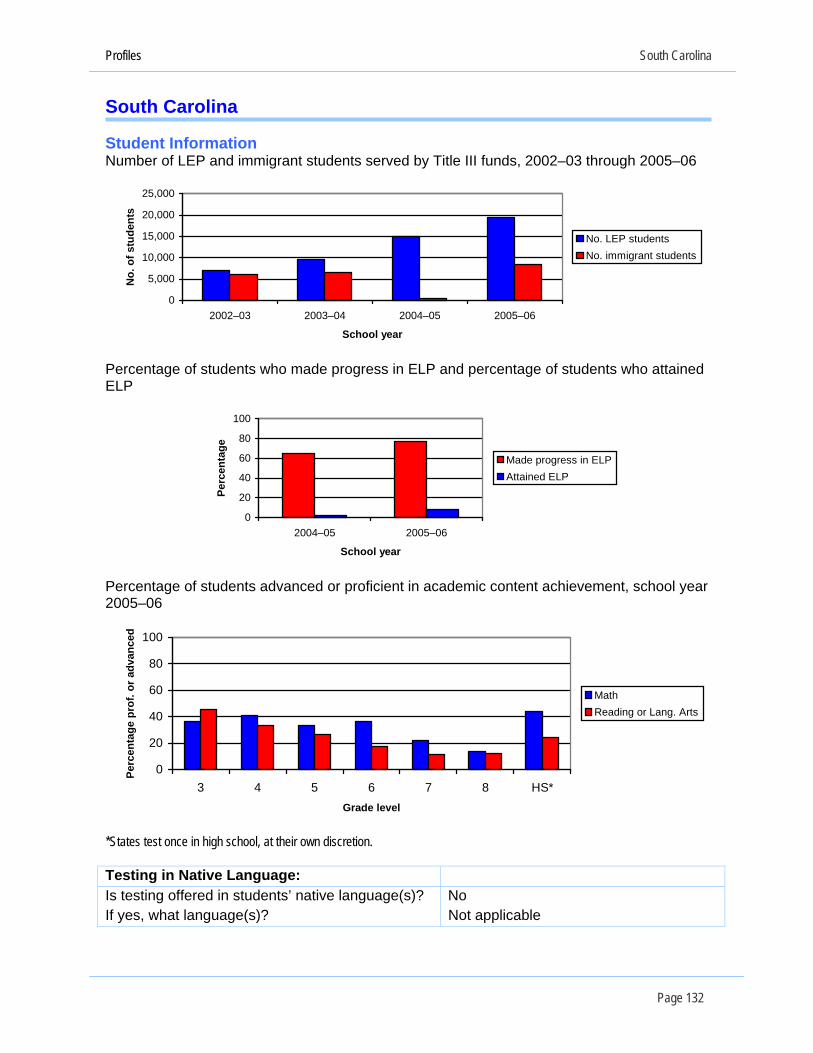
Profiles South Carolina
Page 132
South Carolina Student Information Number of LEP and immigrant students served by Title III funds, 2002–03 through 2005–06
0
5,000
10,000
15,000
20,000
25,000
2002–03 2003–04 2004–05 2005–06
School year
No.
of s
tude
nts
No. LEP studentsNo. immigrant students
Percentage of students who made progress in LP and percentage of students who attained EELP
0
20
40
60
80
100
2004–05 2005–06
School year
Perc
enta
ge
Made progress in ELPAttained ELP
Percentage of students advanced or proficient in academic content achievement, school year 2005–06
0
20
rcen
tag
40
60
80
100
3 4 5 6 7 8 HS*Grade level
Pee
prof
. or a
dvan
ced
MathReading or Lang. Arts
*States test once in high school, at their own discretion. Testing in Native Language: Is testing offered in students’ native language(s)? No If yes, what language(s)? Not applicable
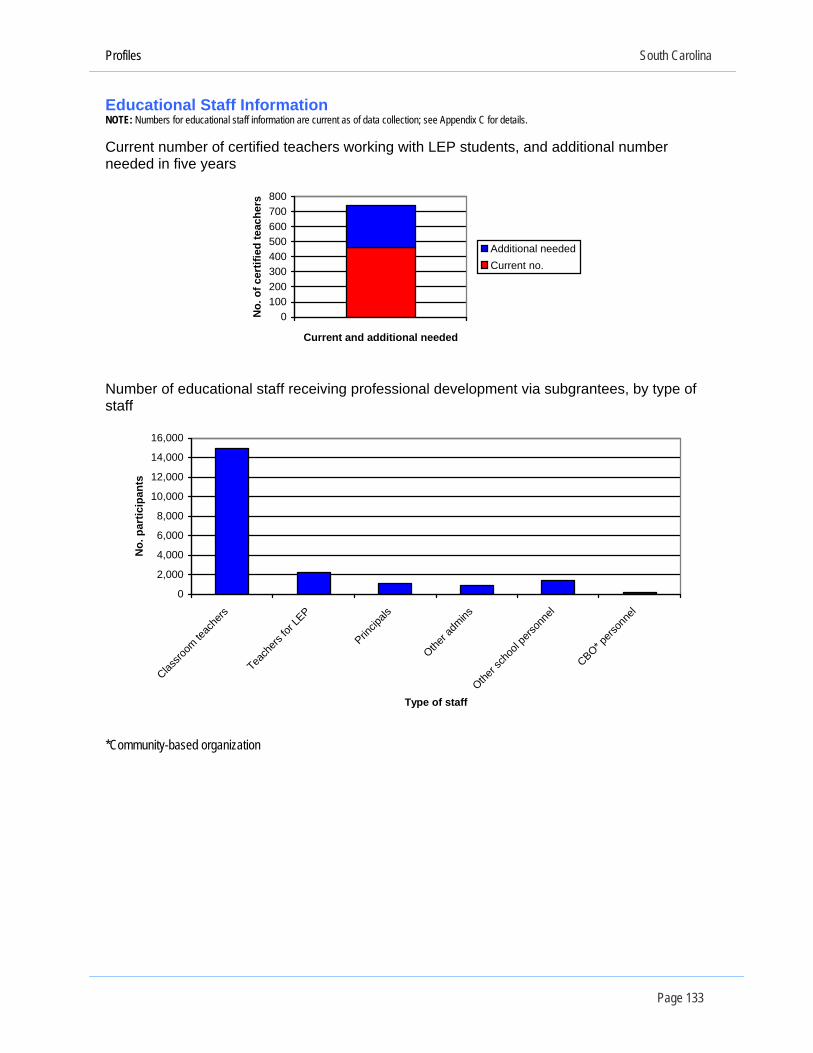
Profiles South Carolina
Page 133
Educational Staff InOTE: Numbers for educational staf
formation f information are current as of data collection; see Appendix C for details.
d teachers working with LEP students, and additional number
N Current number of certifieneeded in five years
0100200300400500600700800
Current and additional needed
No.
of c
ertif
ied
teac
hers
Additional neededCurrent no.
Number of educational staff receiving professional development via subgrantees, by type of staff
0
2,000
4,000
6,000
8,000
10,000
12,000
14,000
16,000
Classro
om te
ache
rs
Teach
ers fo
r LEP
Princip
als
Other a
dmins
Other s
choo
l pers
onne
l
CBO* pers
onne
l
Type of staff
No.
par
ticip
ants
*Community-based organization
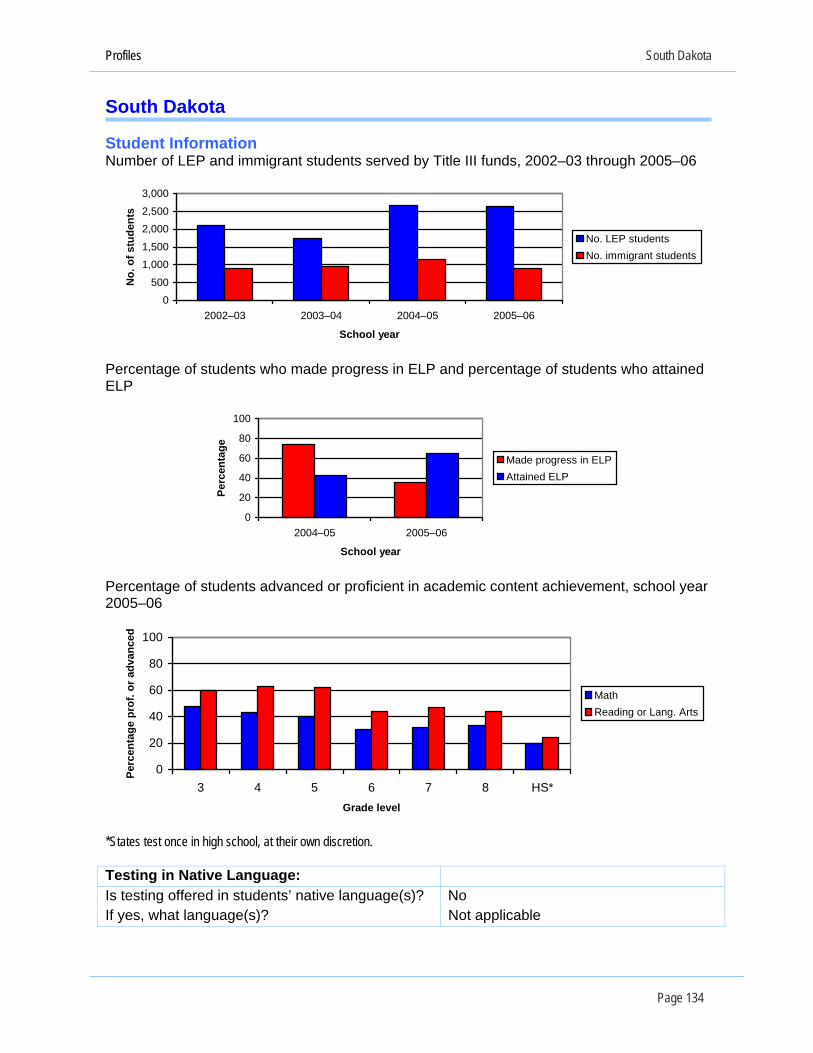
Profiles South Dakota
Page 134
South Dakota Student Information Number of LEP and immigrant students served by Title III funds, 2002–03 through 2005–06
0
500
1,000
1,500
2,0002,500
3,000
2002–03 2003–04 2004–05 2005–06
School year
No.
of s
tude
nts
No. LEP studentsNo. immigrant students
Percentage of students who made progress in LP and percentage of students who attained EELP
0
20
40
60
80
100
2004–05 2005–06
School year
Perc
enta
ge
Made progress in ELPAttained ELP
Percentage of students advanced or proficient in academic content achievement, school year 2005–06
0
20
rcen
tag
40
60
80
100
3 4 5 6 7 8 HS*Grade level
Pee
prof
. or a
dvan
ced
MathReading or Lang. Arts
*States test once in high school, at their own discretion. Testing in Native Language: Is testing offered in students’ native language(s)? No If yes, what language(s)? Not applicable

Profiles South Dakota
Page 135
Educational StaffOTE: Numbers for educational s
Information taff information are current as of data collection; see Appendix C for details.
d teachers working with LEP students, and additional number
N Current number of certifieneeded in five years
0
5
10
15
20
25
30
Current and additional needed
No.
of c
ertif
ied
teac
hers
Additional neededCurrent no.
Number of educational staff receiving professional development via subgrantees, by type of staff No data provided.
0
0.2
0.4
0.6
0.8
1
Classro
om te
ache
rs
Teach
ers fo
r LEP
Princip
als
Other a
dmins
Other s
choo
l pers
onne
l
CBO* pers
onne
l
Type of staff
No.
par
ticip
ants
*Community-based organization

Profiles Tennessee
Page 136
Tennessee Student Information Number of LEP and immigrant students served by Title III funds, 2002–03 through 2005–06
0
5,000
10,000
15,000
20,000
2002–03 2003–04 2004–05 2005–06
School year
No.
of s
tude
nts
No. LEP studentsNo. immigrant students
Percentage of students who made progress in LP and percentage of students who attained EELP
0
20
40
60
80
100
2004–05 2005–06
School year
Perc
enta
ge
Made progress in ELPAttained ELP
Percentage of students advanced or proficient in academic content achievement, school year 2005–06
0erce
n 20
40
60
80
100
3 4 5 6 7 8 HS*Grade level
Pta
ge p
rof.
or a
dvan
ced
MathReading or Lang. Arts
*States test once in high school, at their own discretion. Testing in Native Language: Is testing offered in students’ native language(s)? No If yes, what language(s)? Not applicable

Profiles Tennessee
Page 137
Educational SOTE: Numbers for educat
taff Information ional staff information are current as of data collection; see Appendix C for details.
d teachers working with LEP students, and additional number
N Current number of certifieneeded in five years
050
100150200250300350400
Current and additional needed
No.
of c
ertif
ied
teac
hers
Additional neededCurrent no.
Number of educational staff receiving professional development via subgrantees, by type of staff No data provided.
0
0.2
0.4
0.6
0.8
1
Classro
om te
ache
rs
Teach
ers fo
r LEP
Princip
als
Other a
dmins
Other s
choo
l pers
onne
l
CBO* pers
onne
l
Type of staff
No.
par
ticip
ants
*Community-based organization

Profiles Texas
Page 138
Texas Student Information Number of LEP and immigrant students served by Title III funds, 2002–03 through 2005–06
0100,000200,000300,000400,000500,000600,000700,000
2002–03 2003–04 2004–05 2005–06
School year
No.
of s
tude
nts
No. LEP studentsNo. immigrant students
Percentage of students who made progress in LP and percentage of students who attained EELP
0
20
40
60
80
100
2004–05 2005–06
School year
Perc
enta
ge
Made progress in ELPAttained ELP
NOTE: State provided data for students who attained ELP in 2004–05; however, the data was broken down such that it could not be adapted into a single figure.
Percentage of students advanced or proficient in academic content achievement, school year 2005–06
0
20
40
60
80
100
3 4 5 6 7 8 HS*Grade level
Perc
enta
ge p
rof.
or a
dvan
ced
MathReading or Lang. A
*States test once in high school, at their own discretion. Testing in Native Language:
rts
Is testing offered in students’ native language(s)? Yes If yes, what language(s)? Spanish
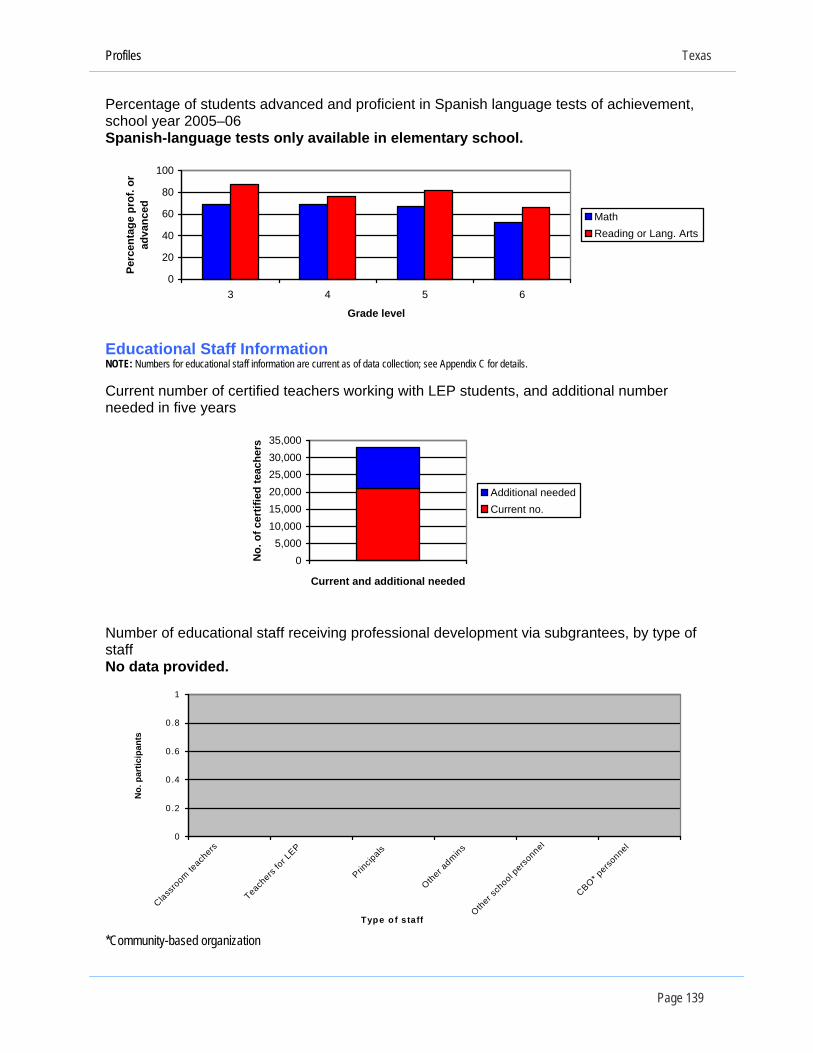
Profiles Texas
Page 139
Percentagchool ye
e of students advanced and proficient in Spanish language tests of achievement, ar 2005–06
only available in elementary school. sSpanish-language tests
0
20
40
60
80
100
3 4 5 6
Grade level
Perc
enta
ge p
rof.
or
adva
nced
MathReading or Lang. Arts
Educational Staff Information
number of certified teachers working with LEP students, and additional number needed in five years
NOTE: Numbers for educational staff information are current as of data collection; see Appendix C for details. Current
05,000
10,00015,00020,00025,00030,00035,000
No.
of c
ertif
ied
teac
hers
Additional needed
Current and additional needed
Current no.
No data provided.
Number of educational staff receiving professional development via subgrantees, by type of staff
0
0.2
0.4
0.6
0.8
1
Classr
ers
eacher
LEPals
Other admins
ther sch
ool perso
nnel
oom teach
s for
Princip
T
O
CBO* perso
nnel
No.
par
ticip
ants
Type o f staff
*Community-based organization

Profiles Utah
Page 140
Utah Student Information Number of LEP and immigrant students served by Title III funds, 2002–03 through 2005–06
0
10,000
20,000
30,000
40,00050,000
60,000
2002–03 2003–04 2004–05 2005–06
School year
No.
of s
tude
nts
No. LEP studentsNo. immigrant students
Percentage of students who made progress in ELP and percentage of students who attained ELP
0
20
40
60
80
100
2004–05 2005–06
School year
Perc
enta
ge
Made progress in ELPAttained ELP
Percentage of students advanced or proficient in academic content achievement, school year 2005–06
0
20
40
60
80
adv
an
100
ced
3 4 5 6 7 8 HS*Grade level
Perc
enta
ge p
rof. Math
Reading
*States test once in high school, at their own discretion. Testing in Native Language: Is testing offered in students’ native language(s)? No If yes, what language(s)? Not applicable

Profiles Utah
Page 141
EducatOTE: Numb
ional Staff Information ers for educational staff information are current as of data collection; see Appendix C for details.
d teachers working with LEP students, and additional number
N Current number of certifieneeded in five years
0
1,000
2,000
3,000
4,000
5,000
6,000
Current and additional needed
No.
of c
ertif
ied
teac
hers
Additional neededCurrent no.
Number of educational staff receiving professional development via subgrantees, by type of staff
0500
1,0001,5002,0002,5003,0003,5004,0004,5005,000
Classro
om te
ache
rs
Teach
ers fo
r LEP
Princip
als
Other a
dmins
Other s
choo
l pers
onne
l
CBO* pers
onne
l
Type of staff
No.
par
ticip
ants
*Community-based organization
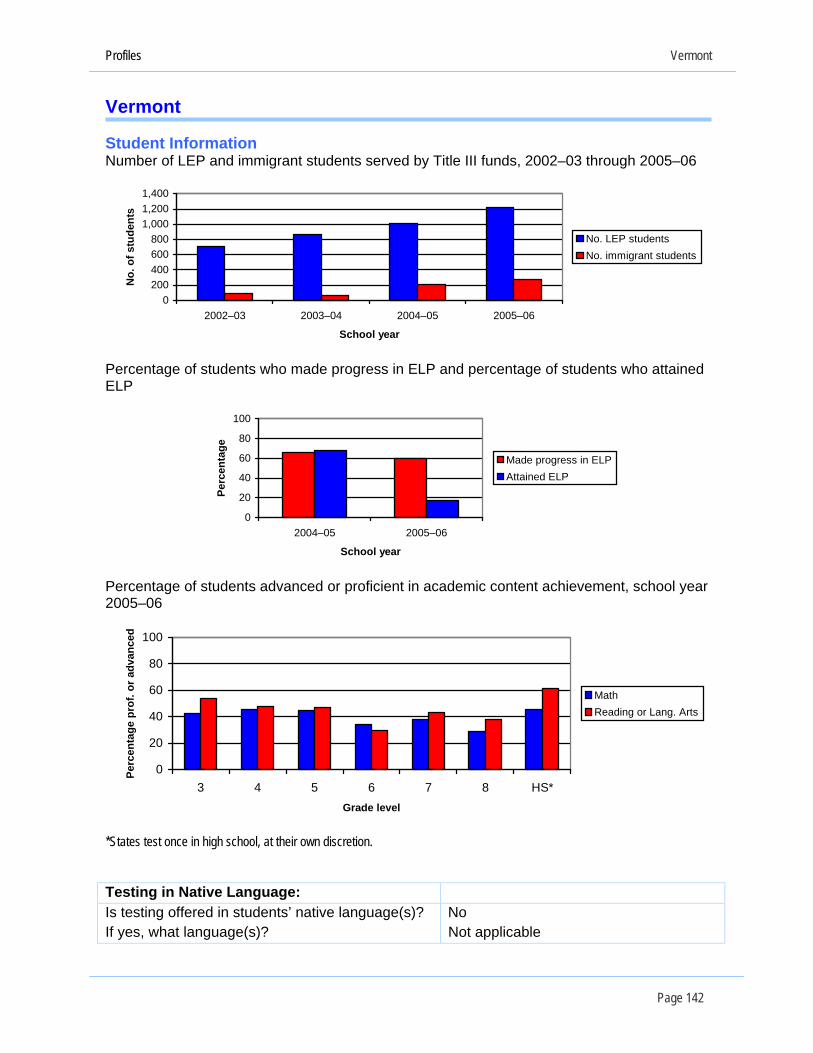
Profiles Vermont
Page 142
Vermont Student Information Number of LEP and immigrant students served by Title III funds, 2002–03 through 2005–06
0200400600800
1,0001,2001,400
2002–03 2003–04 2004–05 2005–06
School year
No.
of s
tude
nts
No. LEP studentsNo. immigrant students
Percentage of students who made progress in LP and percentage of students who attained EELP
0
20
40
60
80
100
2004–05 2005–06
School year
Perc
enta
ge
Made progress in ELPAttained ELP
Percentage of students advanced or proficient in academic content achievement, school year 2005–06
0
20
rcen
tag
40
60
80
100
3 4 5 6 7 8 HS*Grade level
Pee
prof
. or a
dvan
ced
MathReading or Lang. Arts
*States test once in high school, at their own discretion. Testing in Native Language: Is testing offered in students’ native language(s)? No If yes, what language(s)? Not applicable

Profiles Vermont
Page 143
EducationaOTE: Numbers for educat
l Staff Information ional staff information are current as of data collection; see Appendix C for details.
d teachers working with LEP students, and additional number
N Current number of certifieneeded in five years
0
20
40
60
80
100
Current and additional needed
No.
of c
ertif
ied
teac
hers
Additional neededCurrent no.
Number of educational staff receiving professional development via subgrantees, by type of staff
0
100
200
300
400
500
600
700
800
Classro
om te
ache
rs P ls ns el nel
Teach
ers fo
r LE
Princip
a
Other a
dmi
Other s
choo
l pers
onn
CBO* pers
on
Type of staff
No.
par
ticip
ants
*Community-based organization

Profiles Virginia
Page 144
Virginia Student Information Number of LEP and immigrant students served by Title III funds, 2002–03 through 2005–06
010,00020,00030,00040,00050,00060,00070,00080,000
2002–03 2003–04 2004–05 2005–06
School year
No.
of s
tude
nts
No. LEP studentsNo. immigrant students
Percentage of students who made progress in LP and percentage of students who attained EELP
0
20
40
60
80
100
2004–05 2005–06
School year
Perc
enta
ge
Made progress in ELPAttained ELP
Percentage of students advanced or proficient in academic content achievement, school year 2005–06
0
20
40
tage
p
60
80
100
3 4 5 6 7 8 HS*Grade level
Perc
enro
f. or
adv
ance
d
MathReading or Lang. A
*States test once in high school, at their own discretion. Testing in Native Language:
rts
Is testing offered in students’ native language(s)? No If yes, what language(s)? Not applicable

Profiles Virginia
Page 145
EducationOTE: Numbers for
al Staff Information educational staff information are current as of data collection; see Appendix C for details.
d teachers working with LEP students, and additional number
No data provided on number of teachers needed in five years.
N Current number of certifieneeded in five years
0
500
1,000
1,500
2,000
Current and additional needed
No.
of c
ertif
ied
teac
hers
Additional neededCurrent no.
Number of educational staff receiving professional development via subgrantees, by type of staff No data provided.
0
0.2
No
0.4
0.6
0.8
1
Classro
om te
ache
rs
Teach
ers fo
r LEP
Princip
als
Other a
dmins
Other s
choo
l pers
onne
l
CBO* pers
onne
l
Type of staff
. par
ticip
ants
*Community-based organization

Profiles Washington
Page 146
Washington Student Information Number of LEP and immigrant students served by Title III funds, 2002–03 through 2005–06
0
20,000
40,000
60,000
80,000
100,000
2002–03 2003–04 2004–05 2005–06
School year
No.
of s
tude
nts
No. LEP studentsNo. immigrant students
Percentage of students who made progress in ELP and percentage of students who attained ELP
0
20
40
60
80e
100
2004–05 2005–06
School year
Perc
enta
g
Made progress in ELPAttained ELP
Percentage of students advanced or proficient in academic content achievement, school year 2005–06
03 4
Pe
20
40
60
80
100
5 6 7 8 HS*Grade level
rcen
tage
pro
f. or
adv
ance
d
MathReading or Lang. Arts
*States test once in high school, at their own discretion. Testing in Native Language: Is testing offered in students’ native language(s)? No If yes, what language(s)? Not applicable
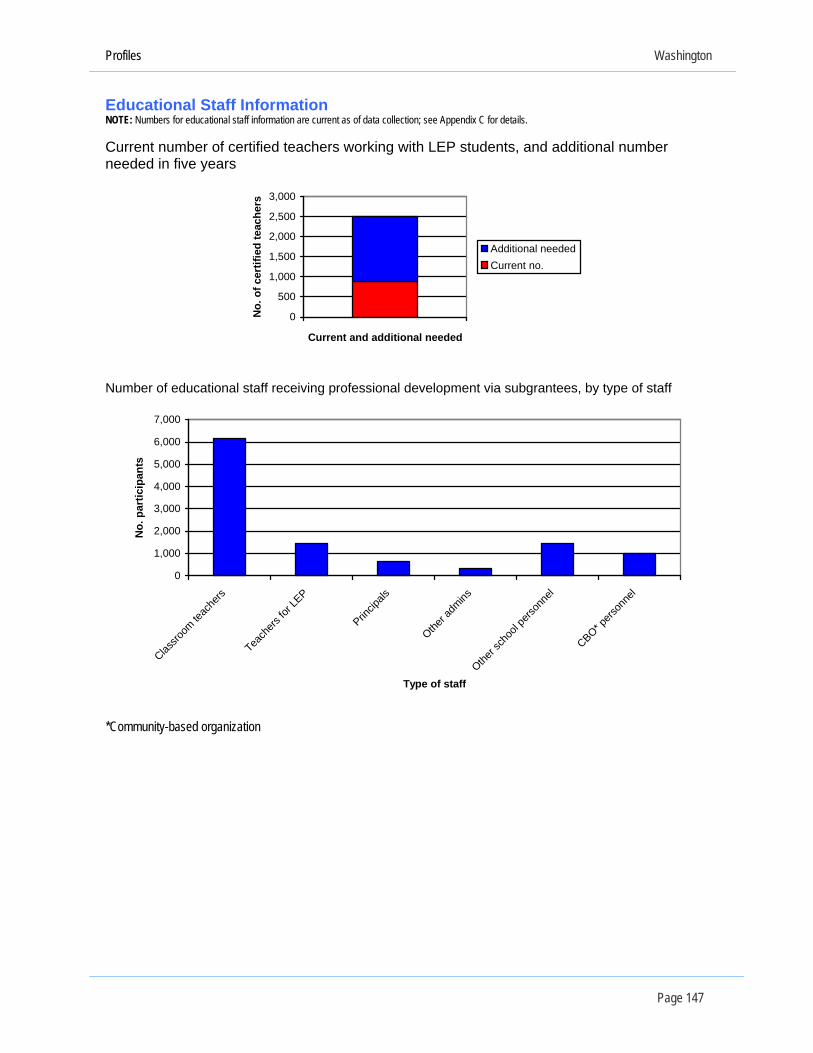
Profiles Washington
Page 147
Educational StaOTE: Numbers for education
ff Information al staff information are current as of data collection; see Appendix C for details.
d teachers working with LEP students, and additional number
N Current number of certifieneeded in five years
0
500
1,000
1,500
2,000
2,500
3,000
Current and additional needed
No.
of c
ertif
ied
teac
hers
Additional neededCurrent no.
Number of educational staff receiving professional development via subgrantees, by type of staff
0
1,000
2,000
3,000
4,000
5,000
6,000
7,000
Classro
om te
ache
rs P ls ns el nel
Teach
ers fo
r LE
Princip
a
Other a
dmi
Other s
choo
l pers
onn
CBO* pers
on
Type of staff
No.
par
ticip
ants
*Community-based organization

Profiles West Virginia
Page 148
West Virginia Student Information Number of LEP and immigrant students served by Title III funds, 2002–03 through 2005–06
0
200
400
600
8001,000
1,200
2002–03 2003–04 2004–05 2005–06
School year
No.
of s
tude
nts
No. LEP studentsNo. immigrant students
Percentage of students who made progress in LP and percentage of students who attained EELP
0
20
40
60
80
100
2004–05 2005–06
School year
Perc
enta
ge
Made progress in ELPAttained ELP
Percentage of students advanced or proficient in academic content achievement, school year 2005–06
0
20
40
tage
p
60
80
100
3 4 5 6 7 8 HS*Grade level
Perc
enro
f. or
adv
ance
d
MathReading or Lang. A
*States test once in high school, at their own discretion. Testing in Native Language:
rts
Is testing offered in students’ native language(s)? No If yes, what language(s)? Not applicable

Profiles West Virginia
Page 149
Educational StafOTE: Numbers for educational
f Information staff information are current as of data collection; see Appendix C for details.
d teachers working with LEP students, and additional number
N Current number of certifieneeded in five years
020406080
100120140
Current and additional needed
No.
of c
ertif
ied
teac
hers
Additional neededCurrent no.
Number of educational staff receiving professional development via subgrantees, by type of staff No data provided.
0
0.2
0.4
0.6
0.8
1
Classro
om te
ache
rs
Teach
ers fo
r LEP
Princip
als
Other a
dmins
Other s
choo
l pers
onne
l
CBO* pers
onne
l
Type of staff
No.
par
ticip
ants
*Community-based organization

Profiles Wisconsin
Page 150
Wisconsin Student Information Number of LEP and immigrant students served by Title III funds, 2002–03 through 2005–06
0
10,000
20,000
30,000
40,000
50,000
2002–03 2003–04 2004–05 2005–06
School year
No.
of s
tude
nts
No. LEP studentsNo. immigrant students
Percentage of students who made progress in ELP and percentage of students who attained ELP
0
20
40
60
80
100
2004–05 2005–06
School year
Perc
enta
ge
Made progress in ELPAttained ELP
NOTE: No data provided for 2005–06 due to state law that did not allow student-specific data collection, as required for Annual Measurable Achievement Objectives.
Percentage of students advanced or proficient in academic content achievement, school year 2005–06
0
20
40e pr
o
60
80
100
3 4 5 6 7 8 HS*Grade level
Perc
enta
gf.
or a
dvan
ced
MathReading or Lang. A
*States test once in high school, at their own discretion. Testing in Native Language:
rts
Is testing offered in students’ native language(s)? No If yes, what language(s)? Not applicable

Profiles Wisconsin
Page 151
Educational SOTE: Numbers for educa
taff Information tional staff information are current as of data collection; see Appendix C for details.
d teachers working with LEP students, and additional number
N Current number of certifieneeded in five years
0
1,000
2,000
3,000
4,000
5,000
6,000
Current and additional needed
No.
of c
ertif
ied
teac
hers
Additional neededCurrent no.
Number of educational staff receiving professional development via subgrantees, by type of staff
0500
1,0001,5002,0002,5003,0003,5004,0004,500
Classro
om te
Teach
ers PrOthe
r
Other s
choo
l pe
CBO* pe
Type of staff
No.
par
ticip
ants
*Community-based organization
ache
rs
for L
EP
incipa
ls
admins
rsonn
el
rsonn
el

Profiles Wyoming
Page 152
Wyoming Student Information Number of LEP and immigrant students served by Title III funds, 2002–03 through 2005–06 No data provided for no. immigrant students served in 2002–03 or 2004–05.
0500
1,0001,500
2,0002,500
3,000
2002–03 2003–04 2004–05 2005–06
School year
No.
of s
tude
nts
No. LEP studentsNo. immigrant students
Percentage of students who made progress in ELP and percentage of students who attai
LP ned
No data provided for 2005–06; State has a new assessment. E
0
20
40
60
80
100
2004–05 2005–06
School year
Perc
enta
ge
Made progress in ELPAttained ELP
Percentage of students advanced or proficient in academic content achievement, school year 2005–06
0
20
40 pro
f 60
80
100
3 4 5 6 7 8 HS*Grade level
Perc
enta
ge. o
r adv
ance
d
MathReading or Lang. Arts
*States test once in high school, at their own discretion. Testing in Native Language: Is testing offered in students’ native language(s)? No If yes, what language(s)? Not applicable

Profiles Wyoming
Page 153
Educational OTE: Numbers for edu
Staff Information cational staff information are current as of data collection; see Appendix C for details.
d teachers working with LEP students, and additional number
N Current number of certifieneeded in five years No data provided on additional number of teachers needed in five years.
05
10152025303540
Current and additional needed
No.
of c
ertif
ied
teac
hers
Additional neededCurrent no.
Number of educational staff receiving professional development via subgrantees, by type of staff
0
500
1,000
1,500
2,000
2,500
3,000
Classro
om te
ache
rsr L
EPcip
alsdm
ins
sonn
elon
nel
Teach
ers fo Prin
Other a
Other s
choo
l per
CBO* pers
Type of staff
No.
par
ticip
ants
*Community-based organization
Title III Biennial Report to Congress, 2004–06 References
Page 154
R
recommendations for the use of accommodations in large-scale assessments: Vol. 3. Practical guidelines for the education of English language learners. Houston: Center on Instruction, University of Houston.
Linquanti, R. (1999). Fostering academic success for English language learners: What do we know? San Francisco: WestEd. Retrieved Jan. 29, 2005 from http://www.wested.org/ policy/pubs/fostering/models.htm.
National Clearinghouse for English Language Acquisition (formerly National Clearinghouse for Bilingual Education) (2000). If your child learns in two languages: A parent’s guide for improving educational opportunities for children acquiring English as a second language. Washington, DC: Author.
National Clearinghouse for English Language Acquisition. (2005). The growing numbers of limited
GrowingLEP_0405_Nov06.pdf. National Clearinghouse for English Language Acquisition. (2007a). Accommodations for English
language learners. Washington, DC: Author. Retrieved Jan. 16, 2008 from http://www.ncela.gwu.edu/resabout/accommodations/index.html.
National Clearinghouse for English Language Acquisition. (2007b). NCELA FAQ: What are the most common language groups for ELL students? Washington, DC: Author. Retrieved Jan. 16, 2008 from http://www.ncela.gwu.edu/expert/faq/05toplangs.html.
School Information Partnership. (n.d.). Comparing results across states. Retrieved Jan. 5, 2005 from http://www.SchoolResults.org/comparing_results.html.
Urban Institute. (May 2006). Children of immigrants: Facts and figures. Washington, DC: Author. U.S. Census Bureau, American Community Survey. (2005). Characteristics of people who speak a
language other than English at home. Retrieved July 27, 2007 from http://factfinder.census.gov/servlet/STTable?_bm=y&-qr_name=ACS_2005_ EST_G00_S1603&-geo_id=01000US&-ds_name=ACS_2005_EST_G00_&-_lang=en.
U.S. Department of Education, National Center for Education Statistics. (2007). The nation’s report card. Retrieved Jan. 17, 2008 from http://nces.ed.gov/nationsreportcard.
U.S. Department of Education. (September 2003). Descriptive study of services to LEP students with disabilities—–Special topic report #1: Native languages of LEP
students. (Contract #ED-00-CO-0089, OELA, U.S. Department of Education.) Washington, DC: Development Associates.
U.S. Department of Education. (2005). Biennial evaluation report to Congress on the implementation of the state formula grant program 2002–04, Washington, DC: Author. Retrieved Jan. 16, 2008 from http://www.ncela.gwu.edu/oela/biennial05/index.htm.
U.S. Department of Education. (2007a). Department of education fiscal year 2006 congressional action. Washington, DC: Author. Retrieved Jan. 16, 2008 from http://www.ed.gov/about/overview/budget/budget06/06action.pdf.
U.S. Deparment of Education. (2007b). Secretary Spellings’ keynote address. Speech Presented at the National Association for the Advancement of Colored People 7th Biennial Daisy Bates Education Summit, May 19, Little Rock, AR.
EFERENCES
Batalova, J. (Feb. 1, 2006). Spotlight on limited English proficient students in the United States. Washington, DC: Migration Policy Institute.
Francis, D.J., Rivera, M., Lesaux, N., Kieffer, M., & Rivera, H. (2006). Research-based
English proficient students. Washington, DC: Author. Retrieved Jan. 16, 2008 from http://www.ncela.gwu.edu/policy/states/reports/statedata/2004LEP/
and LEP students

Title III Biennial Report to Congress, 2004-2006 Appendixes
Page 155
APPENDIX A: SUMMARY OF SURVEY RESULTS ORGANIZED AROUND THE NINE STATUTE-BASED EVALUATION ELEMENTS
This Biennial Report to Congress reports on data from an Office of Management and
Budget (OMB) approved biennial data collection form (see Appendix B). All nine
evaluation elements described in §3123(b)(1–9) have been addressed within the main
body of the report, but are repeated below, with a summary of the findings related to
each. Data from 2005–06, the most recent school year for which data were collected
and the first year in which all grades 3–8 plus at least one high school grade25 were
tested to measure students’ academic content proficiency in reading or language arts
and mathematics, are reviewed in this section; much more complete data are
presented in the previous sections of this report.
EVALUATION ELEMENT 1: Programs and activities carried out to serve LEP children and the effectiveness of those programs [as stipulated in §3121(a)(1), §3121(b)(2), §3123(b)(1)] This evaluation element requires states to report information on two areas related to
program effectiveness:
• The number of students participating in Title III-funded LIEPs—4,287,853
Limited English Proficient (LEP) students participated in such programs in
2005–06, 86 percent of all identified LEP students and
• The number of subgrantees funded within the state—4,923 subgrantees
were funded in 50 states and the District of Columbia (see pages 8–12 for
elaborations on these data).
In order to describe fully the effectiveness of programs for any students, data must be
collected on the same set of students, responding to the same set of assessments,
over a period of time. Those students must be followed individually for the analysis to
be valid. This type of data is not available. Therefore, for the purposes of this report,
the best data available are from National Assessment of Educational Progress
(NAEP)—the same set of assessments administered over time, but to different (albeit
25 The grade tested in high school is at the discretion of the state.
Title III Biennial Report to Congress, 2004-2006 Appendixes
Page 156
similar) sets of students. These data show that the percentage of fourth and eighth-
grade LEP students scoring at or above the basic level in math, and the percentage of
fourth-grade LEP students scoring at or above the basic level in reading have
improved significantly, with 2007 results better than previous years. In addition, the
percentage of former LEP students in grades 4 and 8 scoring at or above basic is
about twice that of their LEP peers in both mathematics and reading. These data are
elaborated upon in pages 19–23 in this report.
In addition, a description of the progress being made on a statewide level toward
increasing the ELP and academic content achievement (Annual Measurable
Achievement Objectives [AMAO] 1–3) of LEP students in Title III-funded LEAs is
elaborated upon in pages 19–32 in this report.
EVALUATION ELEMENT 2: Types of language instruction educational programs (LIEPs) used by subgrantees to teach LEP students [as stipulated in §3121(a)(1), §3123(b)(2)] Title III requires subgrantees to use funds to “increase the English proficiency of LEP
children by providing high-quality LIEPs that are based on scientifically-based
research demonstrating the effectiveness of the programs in increasing English
proficiency and student academic achievement in the core academic subjects”
(§3115(c)(1)). Using a list of nationally recognized LIEP types, states indicated which
types of programs were used by subgrantees in the state. Data show that:
• The subgrantees of 47 states, the District of Columbia, and the
Commonwealth of Puerto Rico have LIEPs that use English as the
language of instruction;
• The subgrantees of 40 states and the District of Columbia have LIEPs that
use two languages, including English, for instruction; and
• The subgrantees of 16 states and the District of Columbia support “other”
types of instructional programs.
These data are elaborated upon in pages 16–19 of this report.

Title III Biennial Report to Congress, 2004-2006 Appendixes
Page 157
EVALUATION ELEMENT 3: Critical synthesis of data reported by subgrantees on student performance [as stipulated in §3121(a)(2,4), §3123(b)(3)] This third evaluation element is a synthesis of the data submitted to each state by its
subgrantees and a description of the progress being made on a statewide level toward
increasing the ELP and academic content knowledge of LEP students in Title III-
funded LEAs. LEP student academic content achievement and progress toward the
attainment of ELP are measured by state-developed AMAOs.
Overall, the data indicate that:
• 24 states and the Commonwealth of Puerto Rico reached their targets for
making progress in ELP (AMAO 1);
• 28 states reached their targets for attaining ELP (AMAO 2); and
• 49 states and the District of Columbia reported to Title I a wide range of
percentages of the LEP subgroup reaching at least the proficient level in
mathematics and reading or language arts achievement (please see pages
23–33).
When testing for academic content knowledge, states must provide “reasonable
accommodations on assessments … including, to the extent practicable, assessment
in the language and form most likely to yield accurate data on what students know and
can do in academic content areas” (§1111(b)(3)(C)(ix)(III)). The most frequently
offered accommodations were testing in small groups or individually, reading
directions aloud, and allowing extra time for the test. Additionally, 11 states reported
that they offer tests in students’ native languages. These data are elaborated upon on
pages 33–35 and 33, respectively, in this report.
EVALUATION ELEMENT 4: Technical assistance provided by state education agencies under section 3111(b)(2)(C) [as stipulated in §3122(b), §3123(b)(4)]
Title III requires that states provide technical assistance to subgrantees to ensure that
they can implement LIEPs successfully. Within the statute, four general areas of
technical assistance are suggested. Data for this report indicate that states provided
technical assistance in the following areas:

Title III Biennial Report to Congress, 2004-2006 Appendixes
Page 158
• Identifying and implementing English language instructional programs and
curricula based on scientific research (49 states, the District of Columbia,
and the Commonwealth of Puerto Rico);
• Helping LEP students to meet academic content and student academic
achievement standards expected of all students (49 states, the District of
Columbia, and the Commonwealth of Puerto Rico);
• Identifying or developing and implementing measures of ELP (50 states, the
District of Columbia, and the Commonwealth of Puerto Rico); and
• Promoting parental and community participation in programs that serve LEP
children (47 states, the District of Columbia, and the Commonwealth of
Puerto Rico).
In addition, states may reserve up to 5 percent of their Title III grant allocation to carry
out various activities described within the statute. These include the following:
• Professional development (49 states, the District of Columbia, and the
Commonwealth of Puerto Rico);
• Conduct planning (48 states), evaluation (43 states), administration (36
states), and inter-agency coordination (43 states);
• Provide technical assistance (50 states, the District of Columbia, and the
Commonwealth of Puerto Rico); and
• Provide recognition to subgrantees that have exceeded annual measurable
achievement objectives (7 states and the District of Columbia).
These data are elaborated upon on pages 41–43 of this report.
EVALUATION ELEMENT 5: An estimate of the number of certified or licensed teachers working in LIEPs and educating LEP children, and an estimate of the number of such teachers that will be needed for the succeeding 5 fiscal years [as stipulated in §3115(c)(2), §3116(c), §3123(b)(5)]
Title III requires that all teachers working in any Title III-funded LIEP for LEP students
have fluent written and oral communication skills in English and any other language

Title III Biennial Report to Congress, 2004-2006 Appendixes
Page 159
used for instruction (§3116(c)). This evaluation element elicited the following data from
states:
• There currently are 319,624 teachers employed in Title III-funded LIEPs;
• An additional 104,394 teachers will be needed in five years (a total of
424,018 teachers); and
• A total of 41 states and the Commonwealth of Puerto Rico require at least a
basic teaching certificate, with some type of endorsement to teach LEP
students. In many cases, states require language proficiency testing (16
states test in English, 11 states test in another language) or that the
teaching certificate include an endorsement pertaining to language fluency
(33 states).
These data also are elaborated upon in pages 41–43 of this report.
EVALUATION ELEMENT 6: The major findings of scientifically based research carried out under this part [as stipulated in §3123(b)(6)]
No states reported that any scientifically based research projects were funded during
2004–05 or 2005–06.
EVALUATION ELEMENT 7: Number of programs or activities that were terminated for failure to reach program goals [as stipulated in §3121(b)(3), §3123(b)(7)]
This evaluation element documents the termination of any Title III LIEPs or activities,
including a description of terminated programs or activities and the circumstances
surrounding the termination. Program termination is based on student outcome results
and program performance. During the two years this biennial report covers, there were
no LIEPs or activities terminated in any state.

Title III Biennial Report to Congress, 2004-2006 Appendixes
Page 160
EVALUATION ELEMENT 8: Number of LEP students transitioned out of language instruction educational programs into classrooms where instruction is not designated for LEP students [as stipulated in §3121(a)(4), §3123(b)(8)]
The primary goal of any LIEP is that LEP students learn English and achieve the same
high academic standards set by the state for all students. In order to achieve this goal,
LEP students must learn English and meet the criteria established by the state to
transition from the LIEP into classrooms where instruction is not designed for LEP
students.26 These transitioned students must then be monitored for two years to
ensure that their academic content achievement and ELP continue to increase. The
data show that:
• 380,894 LEP students were being monitored in 2004–05 and 439,536 LEP
students were being monitored in 2005–06; and
• Of the monitored students, nearly half tested at the proficient level or higher
in mathematics in both 2004–05 and 2005–06 and over half tested at the
proficient level or higher in reading or language arts in both 2004–05 and
2005–06.
These data are elaborated upon in pages 35–39 of this report.
EVALUATION ELEMENT 9: Other information gathered from the evaluations from specially qualified agencies and other reports [as stipulated in §3123(b)(9)]
No other information was gathered from specially qualified agencies and other reports.
The biennial report data collection form requested additional information on a voluntary
basis, but too few states replied to make any general statements about the data.
26 Exceptions are such programs as dual language, two-way immersion, maintenance, and some heritage language and developmental bilingual education programs in which the programmatic goal is full literacy in two languages, English and another language, as well as high academic achievement. Students in these programs are not transitioned when they attain ELP, but rather remain in the program because they are receiving high-level academic content instruction in two languages, one of which is English. See figure 2 for more detail on LIEPs which focus on developing literacy in two languages.

Title III Biennial Report to Congress, 2004-2006 Appendixes
Page 161
APPENDIX B: OMB-APPROVED DATA COLLECTION FORM The following form is the result of multiple revisions, meetings with states and
contractors, and internal discussions. It was provided to states on Sept. 30, 2006, via
e-mail from OELA with the suggestion that they could begin in-house data collection.
The online system was opened for states from Dec. 1–Dec. 31, 2006, for data input.

Title III Biennial Report to Congress, 2004-2006 Appendixes
Page 162
Office of English Language Acquisition Washington, D.C. 20024-6510
Title III Biennial Report
State Formula Grants under Title III, Part A, English Language Acquisition, Lan-guage Enhancement and Academic Achievement Act
(Public Law 107-110)
CFDA NUMBER: 84.365A FORM APPROVED
OMB NO. 1885-0553, EXP. 8/31/2009
DATED MATERIAL – OPEN IMMEDIATELY
DUE DATE: DECEMBER 31, 2006

Title III Biennial Report to Congress, 2004-2006 Appendixes
Page 163
GENERAL INSTRUCTIONS AND TIMELINES All States that received funding on the basis of the Consolidated State Application for each of these years (2004-05 and 2005-06) must respond to this Title III Biennial Report (TBR) by December 31, 2006. This report is based on student performance data and other related information from the two preceding years 2004-05 and 2005-06. The format states will use to submit the Title III Biennial Report has changed to an online submission. This online submission system is being developed through the Education Data Exchange Network (EDEN) and will make the submission process less burdensome. Please see the following section on transmittal instructions for more information on how to submit this year’s Title III Biennial Report.
TRANSMITTAL INSTRUCTIONS The Title III Biennial Report data will be collected online from the SEAs, using the EDEN web site. The EDEN web site will be modified to include a separate area (sub-domain) for TBR data entry. This area will utilize EDEN formatting to the extent possible and the data will be entered in the order of the revised TBR form. The data entry screens will include or provide access to all instructions and notes on the revised TBR forms; additionally, an effort will be made to design the screens to balance efficient data collection and reduction of visual clutter. Initially, a state user will log onto EDEN and be provided with an option that takes him or her to the “2006 TBR”. The main TBR screen will allow the user to select the section of the TBR that he or she needs to either view or enter data. After selecting a section of the TBR, the user will be presented with a screen or set of screens where the user can input the data for that section of the TBR. A user can only select one section of the TBR at a time. After a state has included all available data in the designated sections of the TBR, a lead state user will certify it and transmit it to the Department. Once the form has been transmitted, ED will have access to the data. States may still make changes or additions to the transmitted data, by creating an updated version of the TBR. Detailed instructions for transmitting the 2006 TBR will be found on the main TBR page of the EDEN website (https://EDEN.ED.GOV/EDENPortal/). According to the Paperwork Reduction Act of 1965, no persons are required to respond to a collection of information unless it displays a valid OMB control number. The valid OMB control number for this information collection is 1885-0553. The time required to complete this information collection is estimated to average 2.50 hours (or 150 minutes) per response, including the time to review instructions, search existing data resources, gather the data needed, complete and review the information collection. If you have any comments concerning the accuracy of the time estimate(s) or suggestions for improving this form, please write to: U.S. Department of Education, Washington, D.C. 20202-6510. If you have comments or concerns regarding the status of your individual submission of this form, write directly to: OELA, U.S. Department of Education 550 12th Street SW, Room PCP 10-113, Washington, D.C. 20202-6510. Questions about the new electronic TBR submission process, should be directed to the EDEN Partner Support Center at 1-877-HLP-EDEN (1-877-457-3336).

Title III Biennial Report to Congress, 2004-2006 Appendixes
Page 164
State Response for Meeting Title III State Biennial Reporting Requirements
Reporting Instructions
States are to provide information for each section required for the Title III Biennial Re-port. States should respond to the items listed under each of the elements. If any of the information requested is not available, please explain why it is not available.
Please note the following:
• Specific instructions for each item are shown in bold type and/or enclosed in paren-theses in this format.
• Responses are required for all sections in the Title III Biennial Report. • Note that comment boxes are provided for each response should further information
be needed however there is a limitation to the number of characters available there-fore it is recommended that written responses be comprehensive and concise. Do not provide web site links or references and no attachments.
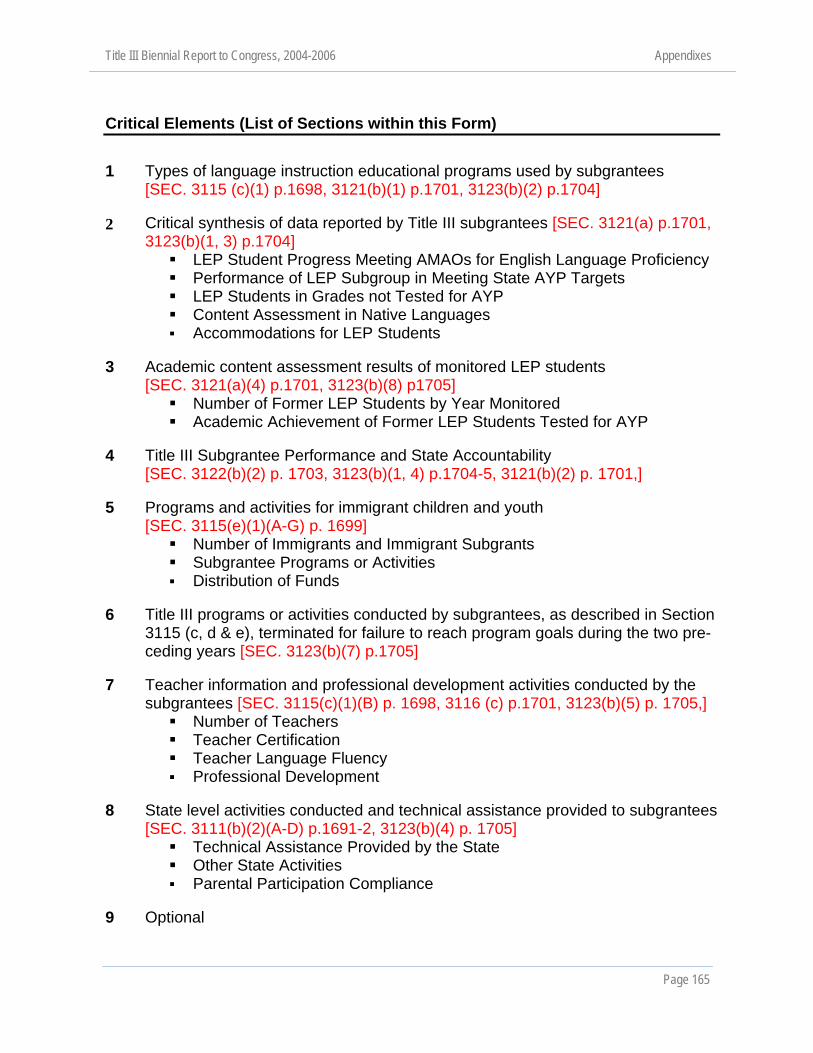
Title III Biennial Report to Congress, 2004-2006 Appendixes
Page 165
Critical Elements (List of Sections within this Form) 1
Types of language instruction educational programs used by subgrantees [SEC. 3115 (c)(1) p.1698, 3121(b)(1) p.1701, 3123(b)(2) p.1704]
2 Critical synthesis of data reported by Title III subgrantees [SEC. 3121(a) p.1701, 3123(b)(1, 3) p.1704]
LEP Student Progress Meeting AMAOs for English Language Proficiency Performance of LEP Subgroup in Meeting State AYP Targets LEP Students in Grades not Tested for AYP Content Assessment in Native Languages Accommodations for LEP Students
3 Academic content assessment results of monitored LEP students [SEC. 3121(a)(4) p.1701, 3123(b)(8) p1705]
Number of Former LEP Students by Year Monitored Academic Achievement of Former LEP Students Tested for AYP
4 Title III Subgrantee Performance and State Accountability [SEC. 3122(b)(2) p. 1703, 3123(b)(1, 4) p.1704-5, 3121(b)(2) p. 1701,]
5 Programs and activities for immigrant children and youth [SEC. 3115(e)(1)(A-G) p. 1699]
Number of Immigrants and Immigrant Subgrants Subgrantee Programs or Activities Distribution of Funds
6 Title III programs or activities conducted by subgrantees, as described in Section 3115 (c, d & e), terminated for failure to reach program goals during the two pre-ceding years [SEC. 3123(b)(7) p.1705]
7 Teacher information and professional development activities conducted by the subgrantees [SEC. 3115(c)(1)(B) p. 1698, 3116 (c) p.1701, 3123(b)(5) p. 1705,]
Number of Teachers Teacher Certification Teacher Language Fluency Professional Development
8 State level activities conducted and technical assistance provided to subgrantees [SEC. 3111(b)(2)(A-D) p.1691-2, 3123(b)(4) p. 1705]
Technical Assistance Provided by the State Other State Activities Parental Participation Compliance
9 Optional

Title III Biennial Report to Congress, 2004-2006 Appendixes
Page 166
1. TYPES OF LANGUAGE INSTRUCTION EDUCATIONAL PROGRAMS USED BY SUBGRANTEES [SEC. 3115 (c)(1) p. 1698, 3121(b)(1) p.1701, 3123(b)(2) p. 1704] 1.1 Indicate the number of Title III subgrantees that use each type of language
instruction educational program (as defined in Section 3301(8)) in Table 1.1. Note: A significant amount of information needed to generate the Biennial Report to Congress will be gathered through other information collections. Specifically, the Consolidated State Performance Re-port (CSPR) for the 2004-2005 (OMB # 1810-0614) and 2005-2006 school years, the Annual Collection of Elementary and Secondary Education Data for the Education Data Exchange Network (EDEN) for 2004-2005 and 2005-2006 (OMB # 1880-0541). Each provides information to the OELA Biennial Re-port. Information from other collections, which will be utilized in the OELA Biennial Report, has been marked in this collection form with the exact question or element number in the specific data collections. It is not necessary to respond to items that reference other collections in this form. Information provided by SEAs to the referenced collections will be collected and utilized to produce the Biennial Report. Blackened cells in this form indicate information which, each SEA should collect and maintain, but which is not being collected at this time for use in the current Biennial Report to Congress. Definitions:
1. # of Subgrantees Using Program = Number of subgrantees that reported us-ing a specific type of language instruction educational program. Subgrantees may have multiple programs. If multiple programs are used, report each pro-gram.
2. Type of Program = type of programs described in the subgrantee local plan (as submitted to the State or as implemented) that is closest to the descriptions in http://www.ncela.gwu.edu/expert/glossary.html
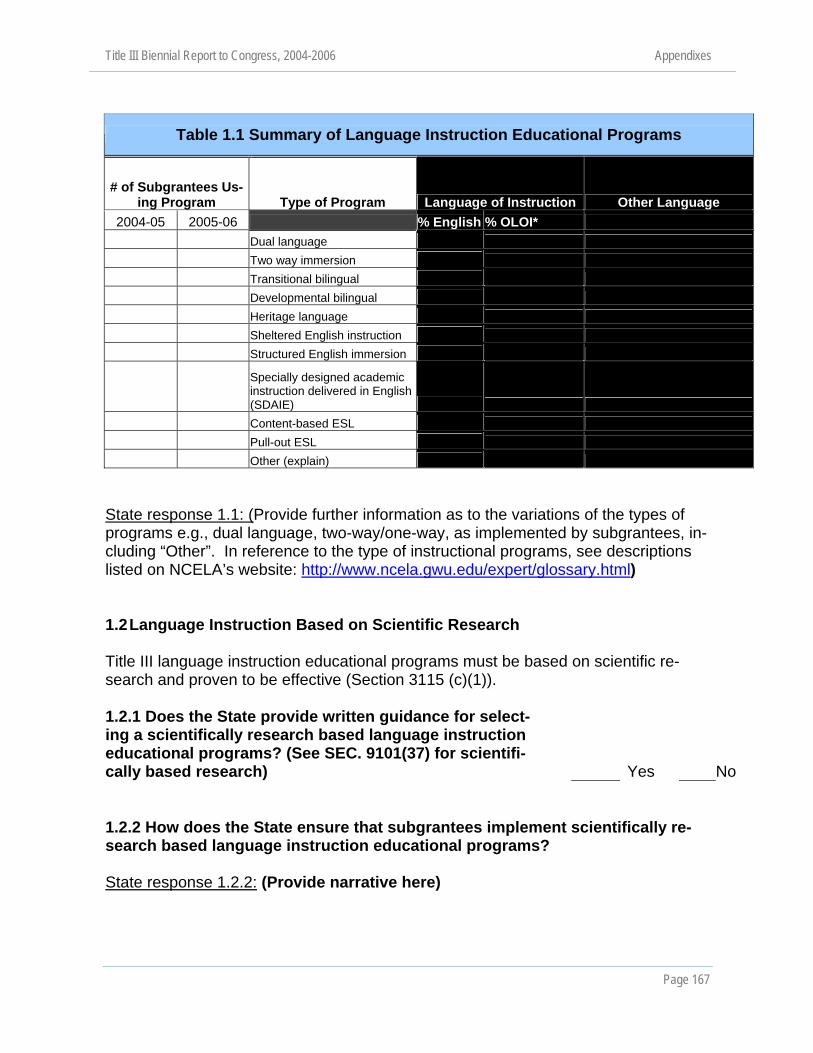
Title III Biennial Report to Congress, 2004-2006 Appendixes
Page 167
Table 1.1 Summary of Language Instruction Educational Programs
# of Subgrantees Us-ing Program Type of Program Language of Instruction Other Language
2004-05 2005-06 % English % OLOI* Dual language Two way immersion Transitional bilingual Developmental bilingual Heritage language Sheltered English instruction Structured English immersion
Specially designed academic instruction delivered in English (SDAIE)
Content-based ESL Pull-out ESL Other (explain)
State response 1.1: (Provide further information as to the variations of the types of programs e.g., dual language, two-way/one-way, as implemented by subgrantees, in-cluding “Other”. In reference to the type of instructional programs, see descriptions listed on NCELA’s website: http://www.ncela.gwu.edu/expert/glossary.html) 1.2 Language Instruction Based on Scientific Research Title III language instruction educational programs must be based on scientific re-search and proven to be effective (Section 3115 (c)(1)). 1.2.1 Does the State provide written guidance for select-ing a scientifically research based language instruction educational programs? (See SEC. 9101(37) for scientifi-cally based research)
Yes
No
1.2.2 How does the State ensure that subgrantees implement scientifically re-search based language instruction educational programs? State response 1.2.2: (Provide narrative here)

Title III Biennial Report to Congress, 2004-2006 Appendixes
Page 168
2. CRITICAL SYNTHESIS OF DATA REPORTED BY TITLE III SUBGRANTEES [SEC. 3121(a) p. 1701, 3123(b)(1, 3) p.1704] 2.1 LEP Student Progress in Meeting State AMAOs for English Language Profi-
ciency Included in this section are several tables that provide evidence of LEP student pro-gress in meeting the Title III State annual measurable achievement objectives (AMAOs) for English language proficiency (i.e., AMAO/making progress; AMAO/attainment) and academic achievement (AMAO/AYP). It is not necessary to respond to items that reference other collections in this form. Information provided by SEAs to the referenced collections will be collected and utilized to produce the Biennial Report. 2.1.1 Number of LEP Students 2004-05 2005-06 Total number of “ALL LEP” students in the State for each year.
CSPR
1.6.3.1.3
CSPR 1.6.3.1.3
Note: ”ALL LEP” students = All students in K-12: (1) who were newly enrolled in the year of reporting and assessed for English language proficiency using a
State selected/approved ELP placement assessment and who meet the LEP definition in section 9101(25), and
(2) who were assessed by State annual English language proficiency assessment and achieved below “profi-cient,” a) in the previous year and continued to be enrolled in the year of reporting, (if the State English lan-
guage proficiency assessment is at the end of the school year); or b) in the year of reporting, (if the State English language proficiency is at the beginning of the school
year). "All LEP" students should include the newly enrolled and continually enrolled LEP students in the State for each year of this report, whether or not they receive services in a Title III language instruction educational program. 2.1.2 Number of LEP Students who Received Services 2004-05 2005-06 Total number of LEP students in the State who received services in a Title III language in-struction educational program for each year.
CSPR
1.6.3.3.2
CSPR 1.6.3.3.2

Title III Biennial Report to Congress, 2004-2006 Appendixes
Page 169
2.1.3 Results on Achieving AMAO’s in English Language Proficiency Provide the results of Title III LEP students in meeting the State English language pro-ficiency (ELP) annual measurable achievement objectives (AMAOs) for making pro-gress and attainment of English language proficiency as required in Table 2.1 Instructions:
Report ONLY the results from State annual English language proficiency assess-ment(s) for LEP students who participate in Title III English language instruction edu-cational programs in grades K-12.
It is not necessary to respond to items that reference other collections in this form. Information provided by SEAs to the referenced collections will be collected and utilized to produce the Biennial Report. Blackened cells in this form indicate information that each SEA should collect and maintain, but which is not being collected at this time for use in the current Biennial Report to Congress.
Definitions:
1. MAKING PROGRESS = as defined by the State and submitted to OELA in the
State Consolidated Application (CSA), or as amended. 2. DID NOT MAKE PROGRESS = The number and percentage of Title III LEP stu-
dents who did not meet the State definition of “Making Progress.” 3. ELP ATTAINMENT = The number and percentage of Title III LEP students who at-
tained English language proficiency as defined by the State and submitted to OELA in the State Consolidated Application (CSA), or as amended. (If the State is track-ing true cohorts of LEP students, the number of monitored former LEP students in-cluded in the cohorts can be cumulative from year to year for up to two years.)
4. AMAO TARGET = the AMAO target for the year as established by the State and submitted to OELA in the CSA (September 2003 submission), or as amended and approved, for each of “Making progress” and “Attainment” of English language pro-ficiency.
5. AMAO RESULTS = The number and percentage of Title III LEP students who met/did not meet the State definitions of “Making Progress” and the number and percentage of Title III LEP students who met the definition for “Attainment” of Eng-lish language proficiency.
6. Met AMAO Target = Designation of whether the LEP students in Title III language instruction educational programs did or did not meet the AMAO targets for the year.

Title III Biennial Report to Congress, 2004-2006 Appendixes
Page 170
Table 2.1.3 Title III LEP Student English Language Proficiency Results
2004-2005 2005-2006
AMAO TARGET AMAO RESULTS
Met AMAO Target
AMAO TARGET AMAO RESULTS
Met AMAO Tar-
get
% # % Y/N % # % Y/N
MA
KIN
G
PRO
GR
ESS
CSPR 1.6.9
CSPR 1.6.9
CSPR 1.6.9
Auto calc
CSPR 1.6.9
CSPR 1.6.9
CSPR 1.6.9
Auto calc
DID
NO
T M
AK
E PR
OG
RES
S
SEE NOTE
ELP
ATT
AIN
MEN
T
CSPR 1.6.9
CSPR 1.6.9
CSPR 1.6.9
Auto calc
CSPR 1.6.9
CSPR 1.6.9
CSPR 1.6.9
Auto calc
NOTE: CSPR table 1.6.9 must be modified before it can be used to provide this information. It is hoped that modifications can be made for the 2005-2006 CSPR. 2.1.4. Monitored Former LEP Students Check the answer to the following question. Are monitored former LEP students reflected in Table 2.1.3 “At-tainment”/“AMAO Results”? (Note: ONLY if the State is using true cohort data, i.e., the State tracked the same LEP students in the same groups for progress each year and has longitudinal data available.)
Yes
No
Note: Monitored former LEP students are those who
• have achieved “proficient” on the State ELP assessment; • have transitioned into classrooms that are not designed for LEP students; • are no longer receiving Title III services; and who • are being monitored for academic content achievement for 2 years after transition.

Title III Biennial Report to Congress, 2004-2006 Appendixes
Page 171
2.1.4. State response (Provide narrative here if needed.) 2.1.5 Unduplicated count of Title III LEP students in the State. Definitions:
1. # Total LEP Enrolled = the unduplicated count of LEP students who enrolled in a Title III language instruction educational program in the State.
2. # Tested/State Annual ELP = the number of LEP students in Title III language instruction educational programs who took the State annual English language proficiency assessment.
3. # Not Available for State Annual ELP = the number of LEP students in Title III language instruction educational programs who were enrolled at the time of testing, but were not available for State annual English language proficiency assessment for an excusable reason, acceptable “excusable reason” being the student was seriously ill, injured or in some way physically incapacitated state, to the point of keeping the student from attending school.
4. Subtotal = the sum of “Tested/State Annual ELP” and “Not Available for State Annual ELP.”
5. # LEP/One Data Point = the number of LEP students in Title III language in-struction educational programs who took the State annual English language proficiency assessment for the first time. This number should be part of the total number of “Tested/State Annual ELP” in 2 above.
Table 2.1.5 Title III LEP Student/Testing Status
2004-05 2005-06 # Total LEP Enrolled
# Tested / State Annual ELP # Not Available for State Annual ELP Test Subtotal # LEP/One Data Point

Title III Biennial Report to Congress, 2004-2006 Appendixes
Page 172
2.2 Report performance of the LEP subgroup in meeting the State adequate yearly progress (AYP) targets in math and reading/language arts in Table 2.2. Instructions: Fill in the number and percentage of LEP subgroup scoring at “Proficient & Advanced” compared to the State’s AYP targets for math and reading/language arts, for grades tested in 2004-2005 and for all grades listed in 2005-2006. It is not necessary to respond to items that reference other collections in this form. Information provided by SEAs to the referenced collections will be collected and utilized to produce the Biennial Report.
Definitions:
1. Grade = the grade tested for AYP 2. 3-HS not proficient = the number of LEP students in all grades 3-8 and the HS
grade tested for the year who were below proficient. 3. Total # Tested = the number of students in the LEP subgroup in all grades tested
for the year. Provide the State aggregate number in the column labeled “Proficient & Advanced #”
4. Total # 3-HS LEP not tested = the total number of LEP students not tested and/or not counted as participating for AYP in grades 3-8 and the HS grade for the year.
5. Proficient & Advanced = the number and the percent of the students in the LEP subgroup that achieved “proficient” and “advanced”, in each of the content areas for the year
6. Target = the AYP target established by the State for that subject in that year

Title III Biennial Report to Congress, 2004-2006 Appendixes
Page 173
Does the State exercise the LEP flexibility afforded States by the Sec-retary for recent arrivals in AYP determination? (http://www.ed.gov/legislation/FedRegister/finrule/2006-3/091306a.html) [2.2.3.]
Yes
No
Table 2.2 LEP Subgroup Content Results
2004-05 2005-06
GRADE PROFICIENT &
ADVANCED TARGET GRADE PROFICIENT &
ADVANCED TARGET # % % # % %
3 CSPR 1.3.1 CSPR 1.3.1 Acct. Wkb 3 CSPR 1.3.1 CSPR 1.3.1 Acct. Wkb
4 CSPR 1.3.3 CSPR 1.3.3 Acct. Wkb 4 CSPR 1.3.3 CSPR 1.3.3 Acct. Wkb5 CSPR 1.3.5 CSPR 1.3.5 Acct. Wkb 5 CSPR 1.3.5 CSPR 1.3.5 Acct. Wkb
6 CSPR 1.3.7 [1.1.4.1.]
CSPR 1.3.7 [1.1.4.2.]
Acct. Wkb[1.1.4.3.] 6
CSPR 1.3.7 [1.2.4.1.]
CSPR 1.3.7 [1.2.4.2.]
Acct. Wkb[1.2.4.3.]
7 CSPR 1.3.9 [1.1.5.1.]
CSPR 1.3.9 [1.1.5.2.]
Acct. Wkb[1.1.5.3.] 7
CSPR 1.3.9 [1.2.5.1.]
CSPR 1.3.9 [1.2.5.2.]
Acct. Wkb[1.2.5.3.]
8 CSPR 1.3.11 [1.1.6.1.]
CSPR 1.3.11[1.1.6.2.]
Acct. Wkb[1.1.6.2.] 8
CSPR 1.3.11 [1.2.6.1.]
CSPR 1.3.11[1.2.6.2.]
Acct. Wkb[1.2.6.2.]
HS CSPR 1.3.13 [1.1.7.1.]
CSPR 1.3.13[1.1.7.2.]
Acct. Wkb[1.1.7.3.] HS
CSPR 1.3.13 [1.2.7.1.]
CSPR 1.3.13[1.2.7.2.]
Acct. Wkb[1.2.7.3.]
3-HS NOT PROFICIENT
Auto Calc [1.1.8.1.]
3-HS NOT PROFICIENT
Auto Calc [1.2.8.1.]
TOTAL # TESTED
EDEN DG#588
[1.1.9.1.] TOTAL # TESTED
EDEN DG#588
[1.2.9.1.]
MA
THEM
ATI
CS
TOTAL # 3-HS LEP NOT TESTED [1.1.10.1.]
TOTAL # 3-HS LEP NOT TESTED [1.2.10.1.]
3 CSPR 1.3.2 [2.1.1.1.]
CSPR 1.3.1 [2.1.1.2.]
Acct. Wkb[2.1.1.3.] 3
CSPR 1.3.2 [2.2.1.1.]
CSPR 1.3.1 [2.2.1.2.]
Acct. Wkb[2.2.1.3.]
4 CSPR 1.3.4 [2.1.2.1.]
CSPR 1.3.3 [2.1.2.2.]
Acct. Wkb[2.1.2.3.] 4
CSPR 1.3.4 [2.2.2.1.]
CSPR 1.3.3 [2.2.2.2.]
Acct. Wkb[2.2.2.3.]
5 CSPR 1.3.6 [2.1.3.1.]
CSPR 1.3.5 [2.1.3.2.]
Acct. Wkb[2.1.3.3.] 5
CSPR 1.3.6 [2.2.3.1.]
CSPR 1.3.5 [2.2.3.2.]
Acct. Wkb[2.2.3.3.]
6 CSPR 1.3.7 [2.1.4.1.]
CSPR 1.3.7 [2.1.4.2.]
Acct. Wkb[2.1.4.3.] 6
CSPR 1.3.7 [2.2.4.1.]
CSPR 1.3.7 [2.2.4.2.]
Acct. Wkb[2.2.4.3.]
7 CSPR 1.3.10 [2.1.5.1.]
CSPR 1.3.9 [2.1.5.2.]
Acct. Wkb[2.1.5.3.] 7
CSPR 1.3.10 [2.2.5.1.]
CSPR 1.3.9 [2.2.5.2.]
Acct. Wkb[2.2.5.3.]
8 CSPR 1.3.12 [2.1.6.1.]
CSPR 1.3.11[2.1.6.2.]
Acct. Wkb[2.1.6.3.] 8
CSPR 1.3.12 [2.2.6.1.]
CSPR 1.3.11[2.2.6.2.]
Acct. Wkb[2.2.6.3.]
HS CSPR 1.3.14 [2.1.7.1.]
CSPR 1.3.13[2.1.7.2.]
Acct. Wkb[2.1.7.3.] HS
CSPR 1.3.14 [2.2.7.1.]
CSPR 1.3.13[2.2.7.2.]
Acct. Wkb[2.2.7.3.]
3-HS NOT PROFICIENT
Auto Calc [2.1.8.1.]
3-HS NOT PROFICIENT
Auto Calc [2.2.8.1.]
TOTAL # TESTED
EDEN DG#588
[2.1.9.1.] TOTAL # TESTED
EDEN DG#588
[2.2.9.1.] REA
DIN
G/E
NG
LISH
LA
NG
UA
GE
AR
TS
TOTAL # 3-HS LEP NOT TESTED [2.1.10.1.]
TOTAL # 3-HS LEP NOT TESTED [2.2.10.1.]

Title III Biennial Report to Congress, 2004-2006 Appendixes
Page 174
2.3 LEP Students in Grades not Tested for AYP
Instructions: Provide the total number of LEP students in grades that were not tested for AYP. These figures reflect all students in grades K-2 and in the high school grades not tested for AYP.
Table 2.3 LEP Students/Non-AYP Grades [2.3.x.x.]
Grade 2004-05 2005-06 # LEP K-2 [1.1.] [2.1.]
# LEP HS [1.2.] [2.2.] # LEP Other Grades [1.3.] [2.3.]
2.4 Content assessment in Students’ Native Language
2.4.1. Does the State offer the State academic content tests in the students’ na-tive language(s)? [2.4.1.]
Yes No (If no, go to 2.5. If yes, complete Tables 2.4.2 and 2.4.3.) 2.4.2 If the answer is yes to 2.4.1, list the languages other than English, of the aca-demic content tests provided in the State by the grades for which these native lan-guage tests are available, in Table 2.4.2. If more than one language is available for the grade, place a hard return (if electronic) in the row to add more space. State should only report tests used for AYP purposes in the table
Definitions:
1. Grade = grades for which the native language version of the academic con-
tent test is offered 2. Language(s) = name of the language in which the academic content test is
offered

Title III Biennial Report to Congress, 2004-2006 Appendixes
Page 175
Table 2.4.2 Test in Student’s Native Language [2.4.2.x.x.]
GRADE LANGUAGE GRADE LANGUAGE 3 [1.1.] 3 [2.1.] 4 [1.2.] 4 [2.2.] 5 [1.3.] 5 [2.3.] 6 [1.4.] 6 [2.4.] 7 [1.5.] 7 [2.5.] 8 [1.6.] 8 [2.6.] M
ATH
EMA
TIC
S
HS [1.7.] RD
G/L
AN
GU
AG
E A
RTS
HS [2.7.] State response 2.4.2: (Provide narrative here if needed.) [2.4.2.3.]
Instructions:
If State response to 2.4.1 is YES, fill in the number and percentage of LEP subgroup scoring at “Proficient & Advanced” compared to the State’s AYP targets for math and reading/language arts, for grades tested in 2004-2005 and for all grades listed in 2005-2006. It is not necessary to respond to items that reference other collections in this form. Information provided by SEAs to the referenced collections will be collected and utilized to produce the Biennial Report. This table is populated only if the state’s response to 2.4.1 is YES. Definitions: 1. Grade = grades in which the native language versions of the State academic con-
tent assessment is provided for LEP students 2. Proficient & Advanced = the number and the percent of students of the LEP sub-
group that achieved “proficient” and “advanced”, for each year 3. Total Tested = total number of ALL LEP students in all grades tested for each year
through native language versions of the State academic content assessments

Title III Biennial Report to Congress, 2004-2006 Appendixes
Page 176
State response 2.4.3.3: (Provide narrative here if needed.) [2.4.3.3.] 2.5 Accommodations on State academic content assessments for LEP students
If the State allows accommodations for academic content assessments, check the accommodations used by subgrantees for LEP students in Table 2.5. Note: if the State has provided information regarding academic content assess-ment in the students’ native language in Table 2.4, check “Assessment in the na-tive language” in this table.
Table 2.4.3 Native Language Version of State Academic Content Assessment Results
2004-05 2005-06
GRADE PROFICIENT & ADVANCED GRADE PROFICIENT & ADVANCED # % # %
3 [1.1.1.1]
[1.1.1.2.] 3
[1.2.1.1]
[1.2.1.2.]
4 [1.1.2.1.]
[1.1.2.2.] 4
[1.2.2.1.]
[1.2.2.2.]
5 [1.1.3.1.]
[1.1.3.2.] 5
[1.2.3.1.]
[1.2.3.2.]
6 [1.1.4.1.]
[1.1.4.2.] 6
[1.2.4.1.]
[1.2.4.2.]
7 [1.1.5.1.]
[1.1.5.2.] 7
[1.2.5.1.]
[1.2.5.2.]
8 [1.1.6.1.]
[1.1.6.2.] 8
[1.2.6.1.]
[1.2.6.2.]
HS [1.1.7.1.]
[1.1.7.2.] HS
[1.2.7.1.]
[1.2.7.2.]
MA
THEM
ATI
CS
TOTAL TESTED
Auto Calc [1.1.8.1.]
TOTAL TESTED
Auto Calc [1.2.8.1.]
# % # %
3 [2.1.1.1]
[2.1.1.2.] 3
[2.2.1.1]
[2.2.1.2.]
4 [2.1.2.1.]
[2.1.2.2.] 4
[2.2.2.1.]
[2.2.2.2.]
5 [2.1.3.1.]
[2.1.3.2.] 5
[2.2.3.1.]
[2.2.3.2.]
6 [2.1.4.1.]
[2.1.4.2.] 6
[2.2.4.1.]
[2.2.4.2.]
7 [2.1.5.1.]
[2.1.5.2.] 7
[2.2.5.1.]
[2.2.5.2.]
8 [2.1.6.1.]
[2.1.6.2.] 8
[2.2.6.1.]
[2.2.6.2.]
HS [2.1.7.1.]
[2.1.7.2.] HS
[2.2.7.1.]
[2.2.7.2.]
REA
DIN
G/E
NG
LISH
LA
NG
UA
GE
AR
TS
TOTAL TESTED
Auto Calc [2.1.8.1.]
TOTAL TESTED
Auto Calc [2.2.8.1.]

Title III Biennial Report to Congress, 2004-2006 Appendixes
Page 177
Table 2.5 Test Accommodations [2.5.x.]
Accommodations to Presentation Accommodations to Response [1.] Assessment in the native language [13.] Answers written directly in test booklet [2.] Text changes in vocabulary [14.] Answers dictated [3.] Modification of linguistic complexity [15.] Responses in native language [4.] Addition of visual supports
[5.] Use of glossaries in native lan-guage
Accommodations to Tim-ing/Scheduling
[6.] Use of glossaries in English [16.] Extra assessment time
[7.] Linguistic modification of test direc-tions
[17.]
Breaks during testing
[8.] Additional example items/tasks [18.] Administration in several sessions
[9.] Oral directions in the native lan-guage
[10.] Use of dictionaries Accommodations to Setting
[11.] Reading aloud of questions in Eng-lish
[19.]
Small-group or individual administra-tion
[12.] Directions read aloud or explained [20.] Separate room administration [21.] Other (Explain)
Rivera, C. and C. Stansfield (2000). An analysis of state policies for the inclusion and accommodation of English language learners in state assessment programs during 1998-1999 (Executive Summary). Washington, DC: Center for Equity and Excellence in Education, The George Washington University.
State response 2.5: (Provide narrative here if “Other” is checked and/or provide addi-tional information as needed.) [2.5.1.1.]
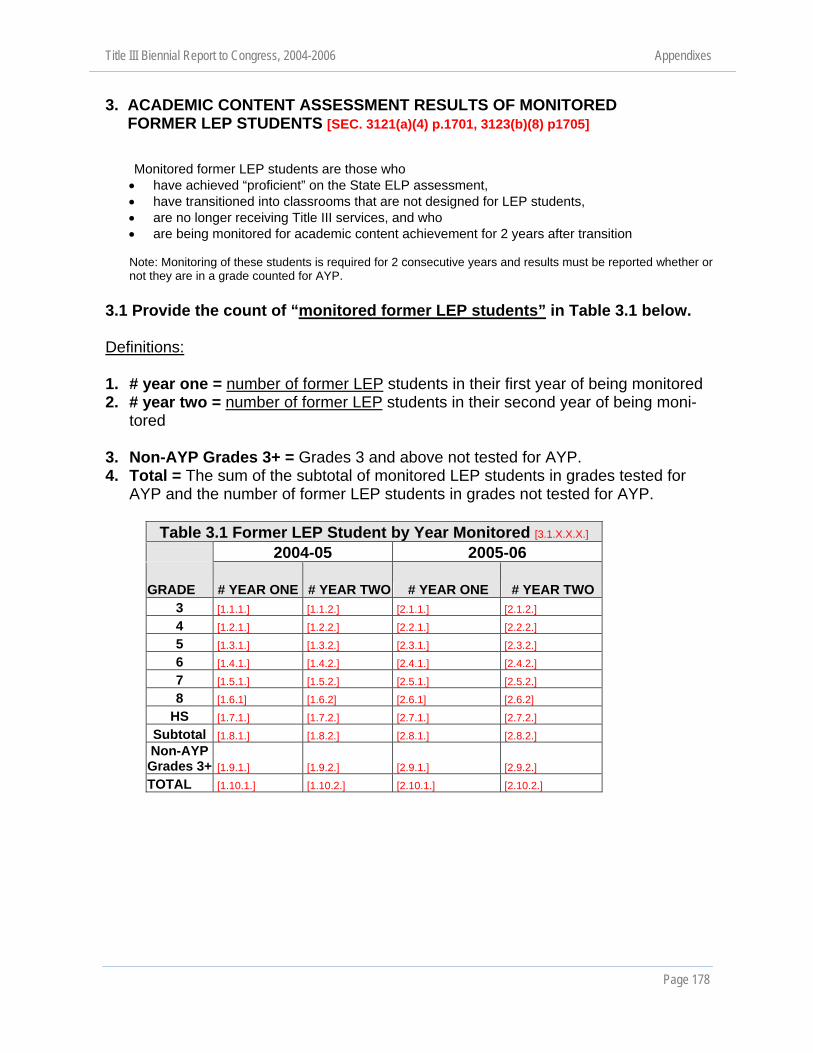
Title III Biennial Report to Congress, 2004-2006 Appendixes
Page 178
3. ACADEMIC CONTENT ASSESSMENT RESULTS OF MONITORED FORMER LEP STUDENTS [SEC. 3121(a)(4) p.1701, 3123(b)(8) p1705]
Monitored former LEP students are those who • have achieved “proficient” on the State ELP assessment, • have transitioned into classrooms that are not designed for LEP students, • are no longer receiving Title III services, and who • are being monitored for academic content achievement for 2 years after transition Note: Monitoring of these students is required for 2 consecutive years and results must be reported whether or not they are in a grade counted for AYP.
3.1 Provide the count of “monitored former LEP students” in Table 3.1 below. Definitions:
1. # year one = number of former LEP students in their first year of being monitored 2. # year two = number of former LEP students in their second year of being moni-
tored 3. Non-AYP Grades 3+ = Grades 3 and above not tested for AYP. 4. Total = The sum of the subtotal of monitored LEP students in grades tested for
AYP and the number of former LEP students in grades not tested for AYP.
Table 3.1 Former LEP Student by Year Monitored [3.1.X.X.X.]
2004-05 2005-06
GRADE # YEAR ONE # YEAR TWO # YEAR ONE # YEAR TWO 3 [1.1.1.] [1.1.2.] [2.1.1.] [2.1.2.] 4 [1.2.1.] [1.2.2.] [2.2.1.] [2.2.2.] 5 [1.3.1.] [1.3.2.] [2.3.1.] [2.3.2.] 6 [1.4.1.] [1.4.2.] [2.4.1.] [2.4.2.] 7 [1.5.1.] [1.5.2.] [2.5.1.] [2.5.2.] 8 [1.6.1] [1.6.2] [2.6.1] [2.6.2]
HS [1.7.1.] [1.7.2.] [2.7.1.] [2.7.2.] Subtotal [1.8.1.] [1.8.2.] [2.8.1.] [2.8.2.] Non-AYP Grades 3+ [1.9.1.] [1.9.2.] [2.9.1.] [2.9.2.] TOTAL [1.10.1.] [1.10.2.] [2.10.1.] [2.10.2.]

Title III Biennial Report to Congress, 2004-2006 Appendixes
Page 179
3.2 Academic achievement results by grade of monitored former LEP students tested for AYP. It is not necessary to respond to items that reference other collections in this form. Information provided by SEAs to the referenced collections will be collected and utilized to produce the Biennial Report. Definitions: 1. Subject = academic content subject areas in which former LEP student achieve-
ments are monitored 2. Grade = grade of the monitored former LEP students 3. # monitored = number of former LEP students being monitored for each year (year
1 plus year 2) 4. # Proficient & Advanced = the sum of the number of monitored former LEP stu-
dents who achieved the “Proficient” level and the number of monitored LEP stu-dents who achieved the “Advanced” level on the State content tests
5. # Below proficient = the number of monitored former LEP students who did not achieve proficient level on the State academic content test at grade level
6. Total = the total numbers for each column and each subject

Title III Biennial Report to Congress, 2004-2006 Appendixes
Page 180
Table 3.2 Monitored Former LEP Student Results by Grade [3.2.X.X.X.X.] 2004-05 2005-06
SUBJECT GRADE #
MONITORED
# PROFICIENT
& ADVANCED
# BELOW PROFICIENT
# MONITORED
# PROFICIENT
& ADVANCED
# BELOW PROFICIENT
3 Auto Calc
[1.1.1.1.] CSPR 1.6.11.2
[1.1.1.2.] Auto Calc
[1.1.1.3.] Auto Calc
[1.2.1.1.] CSPR 1.6.11.2
[1.2.1.2.] Auto Calc
[1.2.1.3.]
4 Auto Calc
[1.1.2.1.] CSPR 1.6.11.2
[1.1.2.2.] Auto Calc
[1.1.2.3.] Auto Calc
[1.2.2.1.] CSPR 1.6.11.2
[1.2.2.2.] Auto Calc
[1.2.2.3.]
5 Auto Calc
[1.1.3.1.] CSPR 1.6.11.2
[1.1.3.2.] Auto Calc
[1.1.3.3.] Auto Calc
[1.2.3.1.] CSPR 1.6.11.2
[1.2.3.2.] Auto Calc
[1.2.3.3.]
6 Auto Calc
[1.1.4.1.] CSPR 1.6.11.2
[1.1.4.2.] Auto Calc
[1.1.4.3.] Auto Calc
[1.2.4.1.] CSPR 1.6.11.2
[1.2.4.2.] Auto Calc
[1.2.4.3.]
7 Auto Calc
[1.1.5.1.] CSPR 1.6.11.2
[1.1.5.2.] Auto Calc
[1.1.5.3.] Auto Calc
[1.2.5.1.] CSPR 1.6.11.2
[1.2.5.2.] Auto Calc
[1.2.5.3.]
8 Auto Calc
[1.1.6.1.] CSPR 1.6.11.2
[1.1.6.2.] Auto Calc
[1.1.6.3.] Auto Calc
[1.2.6.1.] CSPR 1.6.11.2
[1.2.6.2.] Auto Calc
[1.2.6.3.]
HS Auto Calc
[1.1.7.1.] CSPR 1.6.11.2
[1.1.7.2.] Auto Calc
[1.1.7.3.] Auto Calc
[1.2.7.1.] CSPR 1.6.11.2
[1.2.7.2.] Auto Calc
[1.2.7.3.]
MA
THEM
ATI
CS
TOTAL Auto Calc
[1.1.8.1.] Auto Calc
[1.1.8.2.] Auto Calc
[1.1.8.3.] Auto Calc
[1.2.8.1.] Auto Calc
[1.2.8.2.] Auto Calc
[1.2.8.3.]
3 Auto Calc
[2.1.1.1.] CSPR 1.6.11.2
[2.1.1.2.] Auto Calc
[2.1.1.3.] Auto Calc [2.2..1.1.]
CSPR 1.6.11.2[2.2..1.2.]
Auto Calc [2.2..1.3.]
4 Auto Calc
[2.1.2.1.] CSPR 1.6.11.2
[2.1.2.2.] Auto Calc
[2.1.2.3.] Auto Calc [2.2..2.1.]
CSPR 1.6.11.2[2.2..2.2.]
Auto Calc [2.2..2.3.]
5 Auto Calc
[2.1.3.1.] CSPR 1.6.11.2
[2.1.3.2.] Auto Calc
[2.1.3.3.] Auto Calc [2.2..3.1.]
CSPR 1.6.11.2[2.2..3.2.]
Auto Calc [2.2..3.3.]
6 Auto Calc
[2.1.4.1.] CSPR 1.6.11.2
[2.1.4.2.] Auto Calc
[2.1.4.3.] Auto Calc [2.2..4.1.]
CSPR 1.6.11.2[2.2..4.2.]
Auto Calc [2.2..4.3.]
7 Auto Calc
[2.1.5.1.] CSPR 1.6.11.2
[2.1.5.2.] Auto Calc
[2.1.5.3.] Auto Calc [2.2..5.1.]
CSPR 1.6.11.2[2.2..5.2.]
Auto Calc [2.2..5.3.]
8 Auto Calc
[2.1.6.1.] CSPR 1.6.11.2
[2.1.6.2.] Auto Calc
[2.1.6.3.] Auto Calc [2.2..6.1.]
CSPR 1.6.11.2[2.2..6.2.]
Auto Calc [2.2..6.3.]
HS Auto Calc
[2.1.7.1.] CSPR 1.6.11.2
[2.1.7.2.] Auto Calc
[2.1.7.3.] Auto Calc [2.2..7.1.]
CSPR 1.6.11.2[2.2..7.2.]
Auto Calc [2.2..7.3.] R
DG
/LA
NG
UA
GE
AR
TS
TOTAL Auto Calc
[2.1.8.1.] Auto Calc
[2.1.8.2.] Auto Calc
[2.1.8.3.] Auto Calc [2.2..8.1.]
Auto Calc [2.2..8.2.]
Auto Calc [2.2..8.3.]
3.2.3 Does the State include the students reported in Table 3.2 in the calcula-tions for the LEP subgroup AYP? [3.2.3.]
Yes No

Title III Biennial Report to Congress, 2004-2006 Appendixes
Page 181
3.2.4 Provide the number of the Year 1 and Year 2 monitored former LEP stu-dents in grades not tested for AYP who met grade level academic achievement standards in Math and Reading/Language Arts based on State/local criteria.
3.2.4 Performance of Monitored Former LEP Students /Non-AYP Grades [3.2.4.X.X.]
2004 – 2005 2005 - 2006 # Achieved Grade level Standards # Achieved Grade level Standards
Monitored Year 1 Monitored Year 2 Monitored Year 1 Monitored Year 2 [1.1.] [1.2.] [2.1.] [2.2.]
State response 3.2.4: (Describe how the monitored former LEP students in the State are performing at grade level or meeting grade level standards.) [3.2.4.3.] 3.2.5 What percentage of the monitored former LEP students were returned to LEP services, if the State exercises such practices? State response 3.2.5: (Explain the criteria and process of returning monitored former LEP students to LEP services.) [3.2.5.] 3.2.6 If monitored former LEP students were returned to LEP services, how does this impact the performance of the subgrantees and the State in meeting Title III AMAO for “Attainment” of English proficiency? [3.2.6.] State response 3.2.6: 3.3 What is the State’s policy on monitored former LEP students when they fail to meet state academic achievement standards? What technical assistance does the State provide to subgrantees whose monitored former LEP students do not meet State academic achievement standards during the 2 years while those stu-dents were being monitored? State response 3.3: (Provide narrative here) [3.3.]

Title III Biennial Report to Congress, 2004-2006 Appendixes
Page 182
4. TITLE III SUBGRANTEE PERFORMANCE AND STATE ACCOUNTABILITY [SEC. 3122(b)(2) p. 1703, 3123(b)(1, 4) p.1704-5, 3121(b)(2) p. 1701]
4.1 Provide the count for each year in Table 4.1.
It is not necessary to respond to items that reference other collections in this form. Information provided by SEAs to the referenced collections will be collected and utilized to produce the Biennial Report.
Table 4.1 Title III Subgrantee Performance Information [4.1.X.X.]
2004-05 2005-06
Total number of subgrantees for each year CSPR 1.6.10 [1.1.]
CSPR 1.6.10[2.1.]
Total number of subgrantees that met all three Title III AMAOs* CSPR 1.6.10 [1.2.]
CSPR 1.6.10[2.2.]
Total number of subgrantees that met 2 AMAOs only Auto Calc [1.3.]
Auto Calc [2.3.]
Number of subgrantees that met AMAOs of Making Progress and ELP Attainment [1.4.] [2.4.] Number of subgrantees that met AMAOs of Making Progress and AYP [1.5.] [2.5.] Number of subgrantees that met AMAOs of ELP Attainment and AYP [1.6.] [2.6.]
Total number of subgrantees that met 1 AMAO only Auto Calc [1.7.]
Auto Calc [2.7.]
Number of subgrantees that met AMAO of Making Progress [1.8.] [2.8.]
Number of subgrantees that met AMAO of Attainment of ELP [1.9.] [2.9.]
Number of subgrantees that met AMAO AYP [1.10.] [2.10.] Total number of subgrantees that did not meet any AMAO [1.11.] [2.11.]
Total number of subgrantees that did not meet AMAOs for two consecutive years [1.12.] [2.12.] Total number of subgrantees with an improvement plan for not meeting Title III AMAOs
CSPR 1.6.10[2.13.]
Total number of subgrantees who have not met Title III AMAOs for four consecutive years (beginning in 2007-08)

Title III Biennial Report to Congress, 2004-2006 Appendixes
Page 183
4.2 Did the State meet all three Title III AMAOs in 2005-2006? * [4.2.]
YES NO
*Meeting all three Title III AMAOs means meeting each State set target for each objective: Making Pro-gress, Attaining Proficiency and making AYP. State response 4.2.1: (Provide narrative here if needed.) [4.2.1.]
4.3 Describe the State plan to provide technical assistance in developing im-provement plans and other technical assistance to subgrantees that have failed to meet Title III AMAOs for two or more consecutive years. State response 4.3: (Provide narrative here.) [4.3.]

Title III Biennial Report to Congress, 2004-2006 Appendixes
Page 184
5. PROGRAMS AND ACTIVITIES FOR IMMIGRANT CHILDREN AND YOUTH [SEC. 3115(e)(1)(A-G) p. 1699]
5.1 Complete Table 5.1 It is not necessary to respond to items that reference other collections in this form. Information provided by SEAs to the referenced collections will be collected and utilized to produce the Biennial Report. Definitions:
1. # immigrants enrolled in the State = the number of students, who meet the de-finition of immigrant children and youth in Section 3301(6), enrolled in elementary or secondary schools in the State
2. # immigrants served by Title III = the number of immigrant students who partici-pated in programs for immigrant children and youth funded under Section 3114(d)(1), using the funds reserved for immigrant education programs/activities
3. # of immigrant subgrants = the number of subgrants made in the State under Section 3114(d)(1), with the funds reserved for immigrant education pro-grams/activities
Table 5.1 Education Programs for Immigrant Students [5.1.X.X.]
2004-2005 2005-2006 # Immi-
grants en-rolled in the State
# Immi-grants
served by Title III
# Immigrant subgrants
# Immi-grants en-rolled in the State
# Immi-grants
served by Title III
# Immigrant subgrants
[1.1.]
CSPR 1.6.4.2 [1.2.]
CSPR 1.6.4.3 [1.3.]
SEE NOTE [2.1.]
CSPR 1.6.4.2 [2.2.]
CSPR 1.6.4.3 [2.3.]
State response 5.1: (Provide information on what has changed, e.g., sudden influx of large number of immigrant children and youth, increase/change of minority language groups, or sudden population change in school districts that are less experienced with education services for immigrant students in the State during the 2 previous years.) [5.1.3.]

Title III Biennial Report to Congress, 2004-2006 Appendixes
Page 185
5.2 Provide information on the programs or activities conducted by subgrantees for immigrant children and youth. Instructions: Provide the number of subgrantees who have conducted each of the ac-tivities in Table 5.2 for the education enhancement of immigrant children and youth. A subgrantee may conduct more than one such activity. This table requires the aggre-gated number of activities conducted in the 2 years covered by this biennial report. The State should provide more detailed information for each year in the narrative if needed.
Table 5.2 Subgrantee Activities for Immigrant Youth and Children [5.2.1.X.]
# subgran-tees Activity conducted
[1.] family literacy, parent outreach, and training
[2.] support for personnel, including teacher aides, to provide services for im-migrant children and youth
[3.] provision of tutorials, mentoring, and academic career counseling
[4.] identification and acquisition of curricular materials, software, and tech-nologies
[5.] basic instructional services
[6.] other instructional services, such as programs of introduction to the educa-tional system and civics education
[7.]
activities coordinated with community based organizations, institutions of higher education, private sector entities, or other entities to assist parents by offering comprehensive community services
[8.] Other authorized activities for the education of immigrant children and youth (Describe)
State response 5.2: (Summarize the most common activities conducted and discuss the effectiveness of the activities in meeting the needs of the immigrant children and youth and in achieving the goals of this program.) [5.2.2.] 5.3 Distribution of Funds How does the State distribute the funds reserved for the education of immigrant chil-dren and youth to subgrantees? (Check those that apply) [5.3.1.x.]
[1.] Annual [3.] Competitive [2.] Multi-year [4.] Formula State response 5.3: (Provide additional information on the State’s subgrant proc-ess, as needed) [5.3.2.]
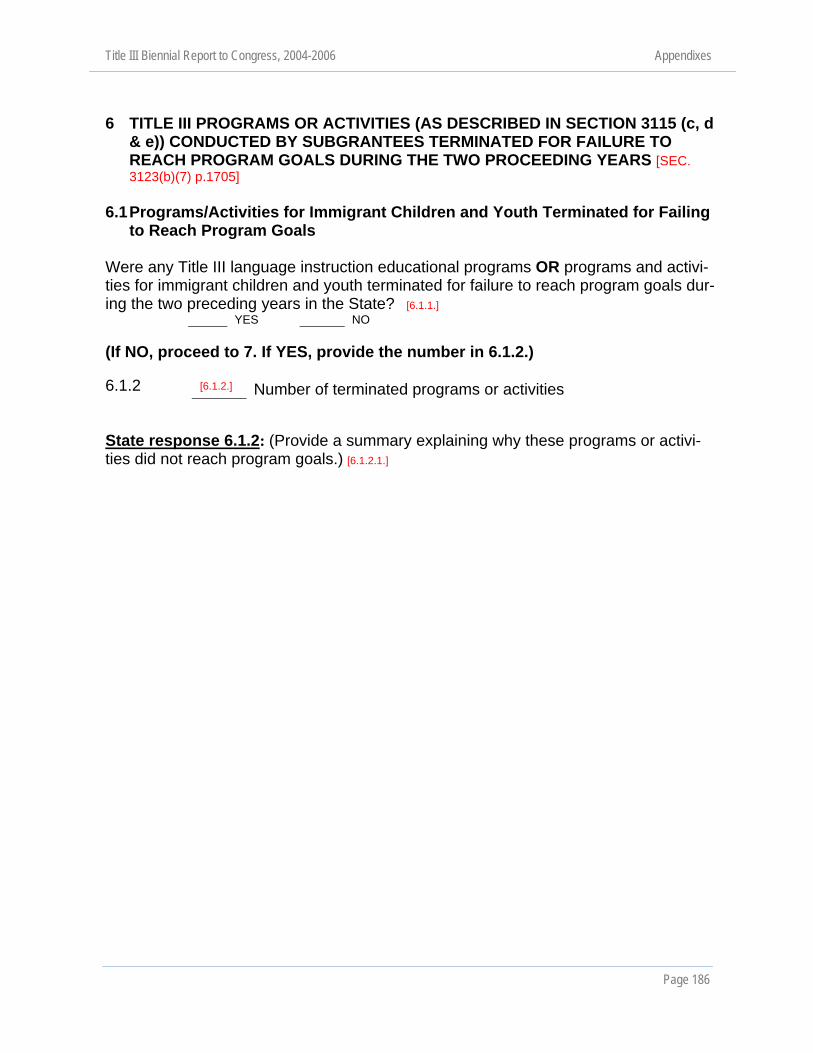
Title III Biennial Report to Congress, 2004-2006 Appendixes
Page 186
6 TITLE III PROGRAMS OR ACTIVITIES (AS DESCRIBED IN SECTION 3115 (c, d
& e)) CONDUCTED BY SUBGRANTEES TERMINATED FOR FAILURE TO REACH PROGRAM GOALS DURING THE TWO PROCEEDING YEARS [SEC. 3123(b)(7) p.1705]
6.1 Programs/Activities for Immigrant Children and Youth Terminated for Failing
to Reach Program Goals Were any Title III language instruction educational programs OR programs and activi-ties for immigrant children and youth terminated for failure to reach program goals dur-ing the two preceding years in the State? [6.1.1.]
YES NO (If NO, proceed to 7. If YES, provide the number in 6.1.2.) 6.1.2 State response 6.1.2: (Provide a summary explaining why these programs or activi-ties did not reach program goals.) [6.1.2.1.]
[6.1.2.] Number of terminated programs or activities

Title III Biennial Report to Congress, 2004-2006 Appendixes
Page 187
7. TEACHER INFORMATION AND PROFESSIONAL DEVELOPMENT ACTIVITIES CONDUCTED BY SUBGRANTEES [SEC. 3115(c)(1)(B) p. 1698, SEC. 3116(c) p.1701, 3123(b)(5) p. 1705] 7.1 Provide the number of teachers in the State who are working in the Title III
language instruction educational programs as defined in SEC. 3301(8) and reported in Table 1.1.
Note: Section 3301(8) - The term ‘Language instruction educational program’ means an instruction
course – (A) in which a limited English proficient child is placed for the purpose of developing and attaining English proficiency, while meeting challenging State academic content and student aca-demic achievement standards, as required by section 1111(b)(1); and (B) that may make instruc-tional use of both English and a child’s native language to enable the child to develop and attain English proficiency, and may include the participation of English proficient children if such course is designed to enable all participating children to become proficient in English and a second lan-guage.)
[7.1.1.]
Total number of certified/licensed teachers currently working in Title III lan-guage instruction educational programs in the State.
[7.1.2.]
Total estimated number of additional certified/licensed teachers that the State will need for the Title III language instruction educational programs in the next 5 years *
*This number should be the total additional teachers needed for the next five years. Do not include the number of teachers currently working in Title III English language instruction educational pro-grams.
State response 7.1: (Provide narrative here if needed.) [7.1.3.] 7.2.1 Does the State require special certification/licensure/endorsement for teachers who teach in language instruction educational programs (Section 3301(8))? [7.2.1.1.]
Yes No If yes, describe the eligibility requirements for teachers to teach in language in-struction educational programs in the State. If no, does the State plan to develop eligibility requirements for teachers to teach in language instruction educational programs?
State response 7.2.1: (Provide narrative here if needed.) [7.2.1.2.]

Title III Biennial Report to Congress, 2004-2006 Appendixes
Page 188
7.2.2 Does the State have specific qualification requirements in addition to those cited in Section 1119(3)(g) for paraprofessionals who assist teachers in Title III language instruction educational programs? [7.2.2.]
Yes No State response 7.2: (Provide narrative here if necessary) [7.2.3.] 7.3 How is teacher language fluency determined for English and any other lan-guage of instruction used in Title III language instruction educational programs? (SEC. 3116(c)) Instructions : Fill in the number of subgrantees that use each of the following methods. This table requires the aggregated data for the 2 years covered by this biennial report. The State should provide additional information for each year in the narrative response, if needed.
# of Sub-grantees
Table 7.3 Methods of Determining Language Fluency [7.3.1.X.]
[1.] State required English fluency exam for oral and written skills [2.] State required exam for fluency in another language for oral and written skills [3.] State certification/recertification/licensing requirement [4.] LEA required English fluency exam for oral and written communication skills [5.] LEA required fluency exam for another language for oral and written skills [6.] LEA testing/interview during hiring [7.] LEA endorsed, based on professional development and other training [8.] LEA determined other evidence of language fluency (explain) [9.] Other (explain) [10]
State response 7.3: (Provide narrative here if needed.) [7.3.2.] 7.4 Provide information on the subgrantees that conducted professional devel-
opment activities that met Title III requirements (SEC. 3115 (c)(2 A-D) in Table 7.4.

Title III Biennial Report to Congress, 2004-2006 Appendixes
Page 189
Instructions: Report professional development activities that are funded under Title III and/or related to Title III required activities ONLY. The table covers the period of this report. Definitions:
1. Professional Development Activity = subgrantee activities for professional development required under Title III [SEC. 3115(c)(2)(A-D)]
2. # subgrantees = the number of subgrantees who conducted each type of pro-fessional development activity. A subgrantee may conduct more than one pro-fessional development activity.
3. Total Number of Participants = the total number of teachers, administrators and other personnel who participated in each type of the professional develop-ment (PD) activities
Table 7.4 Subgrantee Professional Development Activities [7.4.X.X.X.]
Type of PD Activity # Subgrantees
Instructional strategies for LEP students [1.1.1.] Understanding and implementation of assessment of LEP students [1.2.1.] Understanding and implementation of ELP standards and academic con-tent standards for LEP students [1.3.1.] Alignment of the curriculum in language instruction educational programs to ELP standards [1.4.1.] Subject matter knowledge for teachers [1.5.1.] Other (Explain) [1.6.1.]
Participant Information # Subgrantees Total Number of Partici-
pants PD provided to content classroom teachers [2.1.1.] [2.1.2.]
PD provided to LEP classroom teachers [2.2.1.] [2.2.2.]
PD provided to principals [2.3.1.] [2.3.2.]
PD provided to administrators/other than principals [2.4.1.] [2.4.2.]
PD provided to other school personnel/non-administrative [2.5.1.] [2.5.2.]
PD provided to community based organizational personnel [2.6.1.] [2.6.2.]
7.4 State Response: (Explain what the State did to ensure that PD activities conducted by subgrantees meet the Title III requirements under Section 3115 (c)(2)(A-D), includ-ing how the PD activities were based on scientific research and were effective in en-hancing teacher knowledge and skills in teaching LEP students.) [7.4.3.]

Title III Biennial Report to Congress, 2004-2006 Appendixes
Page 190
8. STATE LEVEL ACTIVITIES CONDUCTED AND TECHNICAL ASSISTANCE
PROVIDED TO SUBGRANTEES [SEC. 3111(b)(2)(A-D) p.1691-2, 3123(b)(4) p. 1705] 8.1 Technical Assistance Provided by the States [8.1.1.x.]
During the two preceding years, what technical assistance was provided by the State to subgrantees?
(Check all that apply) The State provided technical assistance to subgrantees in:
[1.]
1. Identifying and implementing English language instructional pro-grams and curricula based on scientific research
[2.]
2. Helping LEP students to meet academic content and student aca-demic achievement standards expected of all students
[3.]
3. Identifying or developing and implementing measures of English lan-guage proficiency
[4.]
4. Promoting parental and community participation in programs that serve LEP children
State response 8.1: (Describe how the State evaluates the effectiveness of State level technical assistance (TA), including how the TA has improved subgrantees’ perform-ance in assisting LEP students to achieve English proficiency and academic stan-dards.) [8.1.2.]

Title III Biennial Report to Congress, 2004-2006 Appendixes
Page 191
8.2 Other State activities conducted during the two preceding years, and the ef-fectiveness of such activities.
Check all that apply.
1) Professional development and other activities to assist personnel in meeting certification requirements [8.2.1.x.]
[1.]
Increased the number of certified/licensed/endorsed teachers for language instruc-tion educational programs in the State
[2.]
Increased the number of teachers trained in teaching LEP students by course cred-its or professional development points towards certification/endorsement
[3.]
Increased teacher knowledge and ability in using State ELP standards and assess-ment
[4.]
Other (Explain) [8.2.1.4.1]
2) Planning, evaluation, administration, and interagency coordination related to
subgrants [8.2.2.x.]
[1.]
Planning: facilitated comprehensive services for LEP students
[2.]
Planning: facilitated utilizing all professional development resources for the training of all teachers on the teaching and learning of LEP students
[3.]
Evaluation: informed improvement of Title III program implementation
[4.]
Interagency Coordination: facilitated establishing State level standards and/or guide-lines for instructional and other educational services for LEP students
[5.]
Consolidating Title III SEA Administrative Funds: provided additional resources for Title III program implementation/administration
[6.]
Other (Explain) [8.2.2.6.1]
3) Recognition of subgrantees that exceeded AMAOs [8.2.3.] 4) Other state level authorized activities [8.2.4.]

Title III Biennial Report to Congress, 2004-2006 Appendixes
Page 192
State response 8.2: (Describe how the State evaluates the effectiveness of State level activities conducted, including how these activities have improved sub-grantees’ performance in assisting LEP students to achieve English proficiency and academic standards.) [8.2.5.x.]
1. [1.]
2. [2.] 3. [3.] 4. [4.] 8.3 Compliance with parental notification and parental participation require-ments under Section 3302. Describe how the State ensured that subgrantees:
1. complied with parental notification provisions for identification and placement. Ensured that parents were informed on all the requirements specified in [SEC. 3302(a)(1-8) p. 1732]
2. complied with parental notification when the LEA failed to meet Title III annual
measurable achievement objectives each year within prescribed time frame [SEC. 3302(b) p. 1732]
3. provided parental notifications in an understandable and uniform format, and, to
the extent practical, in a language that the parent could understand. [SEC. 3302(c) p. 1732-3]
4. fulfilled the parental participation and outreach provisions. [SEC. 3302(e) p. 1732-3]
State response 8.3: (Address each of the items above.) 1. [8.3.1.]
2. [8.3.2.]
3. [8.3.3.]
4. [8.3.4.]
Title III Biennial Report to Congress, 2004-2006 Appendixes
Page 193
9. OPTIONAL QUESTIONS
RESPONSES TO THE FOLLOWING QUESTIONS ARE NOT REQUIRED, BUT WOULD BE HELPFUL TO THE DEPARTMENT IN UNDERSTANDING SERVICES TO LEP STUDENTS IN THE STATE. 9.1 Do LEAs provide information to the State on mobility rates for all students? (Mobility rate has been collected by NCES. It is defined in the Common Core of Data collection and in the national education data dictionary.) [9.1.]
Yes No (If yes, Please provide that rate.) [9.1.1.] 9.2 Does the State calculate a State LEP mobility rate? [9.2.]
Yes No (If yes, please provide that rate.) [9.2.1.] 9.3 Does the State calculate the difference between the LEP subgroup AYP sta-tus with or without the inclusion of monitored former LEP students’ achieve-ment results? [9.3.]
Yes No If yes, what is the difference? [9.3.1.]

Title III Biennial Report to Congress, 2004-2006 Appendixes
Page 194

Title III Biennial Report to Congress, 2004-2006 Appendixes
Page 195
APPENDIX C: METHODOLOGY
Requirements ESEA requires that each eligible entity receiving Title III funds (referred to as a “sub-grantee”) prepare a biennial report for the state. Subgrantees must provide:
(1) A description of the programs and activities conducted by the en-tity with funds received under [Title III] subpart 1 during the two immedi-ately preceding fiscal years; (2) A description of the progress made by children in learning the English language and meeting challenging State academic content and student academic achievement standards; (3) The number and percentage of children in the programs and ac-tivities attaining English proficiency by the end of each school year, as determined by a valid and reliable assessment of English proficiency; and (4) A description of the progress made by children in meeting chal-lenging State academic content and student academic achievement standards for each of the two years after such children are no longer re-ceiving services under this part [of Title III] (§3121(a)).
The state collects and synthesizes the data from its subgrantees, adds state-level data, and provides the Department of Education with this information. As described in §3123(a) –
STATES—Based upon the evaluations provided to a State educational agency under section 3121, each such agency that receives a grant un-der this part shall prepare and submit every second year to the Secretary a report on programs and activities carried out by the State educational agency under this part and the effectiveness of such programs and ac-tivities in improving the education provided to children who are limited English proficient.
Based on state-reported data, the secretary of education, through OELA, prepares the biennial report to Congress, pursuant to §3123(b)(1–9).
(b) SECRETARY—Every second year, the Secretary shall prepare and submit to the Committee on Education and the Workforce of the House of Representations and the Committee on Health, Education, La-bor, and Pensions of the Senate a report—
(1) on programs and activities carried out to serve limited English proficient children under this part, and the effectiveness of such pro-

Title III Biennial Report to Congress, 2004-2006 Appendixes
Page 196
grams and activities in improving the academic achievement and English proficiency of children who are limited English proficient; (2) on the types of language instruction educational programs used by local educational agencies or eligible entities receiving fund-ing under this part to teach limited English proficient children; (3) containing a critical synthesis of data reported by eligible enti-ties to States under §3121(a); (4) containing a description of technical assistance and other as-sistance provided by State educational agencies under §3111(b)(2)(C); (5) containing an estimate of the number of certified or licensed teachers working in language instruction educational programs and educating limited English proficient children, and an estimate of the number of such teachers that will be needed for the succeeding 5 fis-cal years; (6) containing the major findings of scientifically based research carried out under this part; (7) containing the number of programs or activities, if any, that were terminated because the entities carrying out the programs or ac-tivities were not able to reach program goals; (8) containing the number of limited English proficient children served by eligible entities receiving funding under this part who were transitioned out of language instruction educational programs funded under this part into classrooms where instruction is not tailored for limited English proficient children; and (9) containing other information gathered from the evaluations from specially qualified agencies and other reports submitted to the Secretary under this title when applicable.
These reporting requirements are reflective of the accountability provisions of ESEA and of the expectations for states with regard to data collection. ESEA requires that states report, on a statewide basis, on the progress LEP students are making in learning and attaining English at the same time as they are included in the same academic achievement targets established for all students (§1111(b)(3)(C)(xiii)).
Data Collection Approach To collect the needed data in a systematic fashion, OELA staff analyzed the legislative requirements for the biennial report to Congress and worked with the Office of Management and Budget (OMB) to create a biennial report data collection form. The final biennial report form approved by OMB (OMB No. 1885-0553, which expires Aug. 31, 2009) requests data from the states on the nine “evaluation elements” listed in

Title III Biennial Report to Congress, 2004-2006 Appendixes
Page 197
§3123(b)(1–9). The questionnaire was the tool used to gather the information on which this biennial report is based.
The biennial report form includes items that ask respondents to choose one or more responses from a list, to fill in tables with specific data, such as the percentage or number of LEP students reaching certain levels of English fluency and content achievement, and to provide some responses in narrative form. (See Appendix B for a copy of the OMB-approved biennial report form.) OELA sent this biennial report form to SEAs on Sept. 30, 2006. The online data collection system, with online and telephone support, was open for states from Dec. 1 through Dec. 31, 2006. Much of the data required for this biennial report now are collected through the annual online data collection for the Consolidated State Performance Reports (CSPRs), and other data already were available through the states’ Accountability Workbooks.29 In order to minimize the data entry for states and maximize the comparability of the two data collection efforts —CSPR and biennial report—data from both the CSPRs and the states’ Accountability Workbooks were migrated to the online OMB data collection form, as appropriate.
Data Review There were two types of data collected through the biennial report form: (1) counts and numbers (e.g., number and type of LIEPs implemented in each state, number of LEP students served, percentage of students achieving at the proficient or advanced level in reading or language arts) and (2) narrative responses, such as descriptions of successful professional development activities, that states provided.
Although all 50 states, the District of Columbia, and the Commonwealth of Puerto Rico submitted responses, they varied in depth and breadth. Once the data were reviewed, states were contacted to clarify answers, to determine whether missing data could be obtained, or both. States were informed that further explanations and additional data would be accepted for inclusion in the report until Jan. 12, 2007. Further, some data were modified to reflect responses that states provided in the written comments.
29 The Consolidated State Performance Report (CSPR) is the required annual reporting tool for of each state as authorized under ESEA §9303. Each state is additionally required to submit to the U.S. Department of Education, a workbook that detailes the implementation of its single accountability system under Title I.
Title III Biennial Report to Congress, 2004-2006 Appendixes
Page 198
Data collection and review processes are summarized briefly below. The summaries cover data from the CSPRs (for both 2004–05 and 2005–06, listed separately) and from the OMB biennial report data collection form.
The process related to data collection and review from the 2004–05 CSPR is as follows. • Data were collected in the fall of 2005. Once completed, the state chief or
superintendent “certified” that the data were correct. During August 2006, personnel from the Department of Education and its contractor NCELA reviewed the Title III-related data for missing or anomalous data. Follow-up phone calls and e-mails were made; some states provided additional or modified data during September 2006. These corrected data are referred to herein as “verified” data.
• Verified data were migrated into the Title III biennial report online data collection form. These data were received on Dec. 3, 2006. If a Title III state director believed that data were erroneous, he or she could request, in writing, a change in the data.
The process related to data collection and review from the 2005–2006 CSPR is as follows. • Data were collected during November 2006. Once completed, the state chief or
superintendent “certified” that the data were correct. • Certified data were migrated into the Title III biennial report online data
collection form. If a Title III state director believed that data were erroneous, he or she could request that the data be modified within the CSPR system. These changes are reflected in both the Title III biennial report database and the Department of Education database (EDEN). These data still are referred to as “certified” since they have not gone through a formal review.
• Certified data were received on Dec. 3, 2006. NCELA staff reviewed the data for missing or anomalous data. States were contacted by Dec. 15 to request further data or explanations of anomalous data by Dec. 22. Only the most obvious and egregious omissions and defects were identified and addressed. These data are as correct as possible, given the quick turnaround. They are referred to herein as “verified,” but are not yet “final.” They may or may not match the data available in the EDEN system; the Department of Education reviewed these data later in Spring 2007.
Title III Biennial Report to Congress, 2004-2006 Appendixes
Page 199
The process related to data specific to Title III that were collected first and only with the OMB-approved Title III biennial report data collection form is as follows. • These data were collected during December 2006. Once completed, the state
chief or superintendent “certified” that the data were correct. • Certified data were provided on Jan. 6, 2007. NCELA staff reviewed the data for
missing or anomalous data. States were contacted by Jan. 8 to request further data or explanations of these data by Jan. 15. Only the most obvious and egregious omissions and defects were identified and addressed with states. These data are as correct as possible, given the quick turnaround. They are referred to herein as “verified,” but are not yet “final.”
A “final” Department of Education data set was provided on Jan. 18, 2007. At this point, all comments and narrative information related to items in the data collection form that required numeric data were reviewed by NCELA staff. Where appropriate, some data were modified to meet the explanations provided by the states. For instance, some states indicated that they had difficulty in entering certain data in the format specified by the OMB-approved data collection form and provided those data in the “comments” fields of the form. These “new” data were entered into the database. These are the data on which this report is based, and they may not match the data within the EDEN system.
Data from the various states are not equivalent, and should not be compared. While ESEA provides a definition of “limited English proficient” (see §9101(25)), there is no one, common, approved method to operationalize this term either for initial identification purposes or to exit LEP students from LIEPs. States use different assessments to determine levels of ELP, and even states that use the same instrument may use different cut scores for classifying students as LEP. Data submitted by the states are as varied as the states themselves. Aggregating or comparing test results across states is like comparing apples and oranges. As stated by the School Information Partnership, a public-private collaboration designed to empower parents, educators, and policymakers to use the ESEA data to make informed decisions and improve school results (funded by the Broad Foundation and the U.S. Department of Education):
Title III Biennial Report to Congress, 2004-2006 Appendixes
Page 200
The No Child Left Behind Act allows states to set their own curricular standards and to design state assessments to measure mastery of those standards. In addition, each state has established a different definition for what it means to a student to be “proficient.” Consequently, … making cross state comparisons would not yield analytically sound results. (School Information Partnership, n.d.)
Each state defined “limited English proficient” for its own purposes, then created its own ELP standards, identified or created its own assessments, developed its own cut scores, and identified different cohorts for which data would be reported. Therefore, the information in the body of this report is presented in individual state profiles that provide an overview of the activities and programs supported by Title III, and the progress students are making in each state. To the extent possible, data are reported as provided by the states. There are exceptions: (1) When questions arose, NCELA staff contacted the state, and requested clarification(s), and data reported herein are based on those “new” data, (2) when appropriate, numbers have been reported at one decimal place using standard rounding procedures, and (3) some minor adjustments had to be made so data could be reported in as systematic a fashion as possible.30
Several items on the biennial report form offered states the opportunity to provide explanations of numbers provided “as appropriate” or “if necessary.” Some states provided detailed narrative responses, others chose not to respond to one or more items. Narrative responses were reviewed carefully and grouped together in coherent categories. This information is used when appropriate to further understand states’ activities.
Challenges
The stipulations for reporting set forth in §3121(a)(1-4) require a data collection and reporting system that no state had in place at the time of the reauthorization of ESEA. The nine evaluation elements address not only descriptive data on practices and services, but precise quantitative data on teachers and students in a broad range of areas. Some states still are establishing or refining systems to collect these data. Thus, in a number of areas, states have reported that data are not yet available or that
30 As an example, some states reported no data in the tables provided, but did include data from multiple cohorts in the narrative text area. When possible, these data were manipulated to provide one number that could be reported. However, in some cases, these states indicated that they had used complicated formulae (which were not provided or explained further) to create test scores for students in different cohorts—these scores could not be manipulated.

Title III Biennial Report to Congress, 2004-2006 Appendixes
Page 201
data on LEP students served by Title III cannot be separated from data on all LEP students or cannot be separated from Title I-served LEP students. These problems are most prevalent in reporting on academic achievement in the content areas with regard to both students currently served and students who have been transitioned out of LIEPs.
Similarly, several states have developed or implemented new ELP or academic achievement assessments. Some of these states have indicated that they have not yet used these assessments for a long enough period of time to develop appropriate AMAOs. While OELA has consistently reminded states of the need to provide these data, there are missing data in virtually every area of data collection.
States have reported challenges in dealing with students new to public schools in the United States and in showing academic and language proficiency gains among the varying LEP groups of students. To help alleviate these challenges, the secretary introduced two provisions in February 2004 allowing states flexibility in (1) the testing of LEP students “newly arrived” to public schools in the United States,31 as well as (2) the LEP students who have made sufficient progress in English language acquisition to exit the LEP category.
Regarding the testing of newly arrived LEP students, states have indicated that it often is difficult to test them in English because of their lack of familiarity with the English language and the content being tested. During LEP students’ first year of enrollment in a U.S. school, the LEAs have the option of using an ELP assessment in place of a reading or language arts content assessment, in addition to the mathematics content assessment, with accommodations as necessary (these students may be “counted” as tested, but the ELP test score is not combined with reading or language arts test scores). This is a one-time exemption only. If a state develops and administers a native-language content assessment it does count toward the first year of participation in assessment.
The second challenge reported by states is that LEP students typically exit the LEP subgroup once they attain ELP and new students join the LEP subgroup when they enter the schools. States have maintained that they have difficulty demonstrating that the LEP subgroup is making progress because: (1) “successful” students leave the
31 “Newly arrived” students are those students who have been enrolled in school in the United States for less than one year.
Title III Biennial Report to Congress, 2004-2006 Appendixes
Page 202
subgroup and (2) students join the subgroup who are less proficient in English and score poorly on English-language content assessments. Accordingly, the flexibilities allow states to combine assessment results of current LEP students and students who have exited from LIEPs within the past two years. This means that “successful” students’ test scores are maintained in the LEP subgroup for two years. This should make it possible for states and LEAs to show growth (ELP and academic content) in the LEP subgroup.
While both of these provisions offer states flexibility in demonstrating progress for the two groups of students—newly arrived and the LEP subgroup—there remains a challenge to data collection: For many states, the ability to collect and maintain these data is not yet in their accountability system. And, until states have this ability, they will not have complete data on either newly arrived LEP students or on the entire LEP subgroup.
Collecting and reporting these data have not been without challenges. However, taken collectively, reasonable profiles of activities and progress within each state are possible. The “Profiles of States, District of Columbia, and Commonwealth of Puerto Rico” section of this report examines the evaluation elements and the information each provides on Title III programs and services.

U.S. Department of eDUcation
The Biennial Report to Congress on The Implementation of the Title III
State Formula Grant ProgramSchool Years 2004-06

The Department of education’s mission is to promote student achievement and preparation for global competitiveness by fostering educational
excellence and ensuring equal access.
www.ed.gov