biennial update report - unfcccunfccc.int/files/national_reports/non-annex_i_parties/biennial... ·...
TRANSCRIPT

Lebanon’s Second Biennial Update Report to the UNFCCC
Ministry of Environment
Beirut, Lebanon
October 2017

Lebanon’s Second Biennial Update Report to the UNFCCC
This document should be referenced as:
MoE/UNDP/GEF (2017). Lebanon’s second biennial update report to the UNFCCC. Beirut, Lebanon.
The climate change project management team
Vahakn Kabakian, Portfolio Manager/Climate Change Advisor Lea Kai Aboujaoudé, Project Manager Yara Daou, Project Research Assistant Mary Awad, Project Assistant UNFCCC focal point
Samar Malek, Acting Head of Service of Environmental Technology, Ministry of Environment
Copyright © 2017 by the Ministry of Environment – United Nations Development Programme
Reproduction is authorized provided the source is acknowledged and provided the reproduction is not sold.
The United Nations Development Programme (UNDP) is the UN’s global development network, advocating for change and connecting countries to knowledge, experience and resources to help people build a better life. We are on the ground in 166 countries, working with them on their own solutions to global and national development challenges. As they develop local capacity, they draw on the people of UNDP and our wide range of partners.
For more information
http://climatechange.moe.gov.lb/ [email protected]
Disclaimer
The contents of this document are the sole responsibility of its authors, and do not necessarily reflect the opinion of the Ministry of Environment or the United Nations Development Programme, who will not accept any liability derived from its use. This study can be used for research, teaching and private study purposes. Please give credit where it is due.

Lebanon’s Second Biennial Update Report to the UNFCCC
Lebanon’s Second Biennial Update Report to the UNFCCC Executed by Ministry of Environment Funded by Global Environment Facility Implemented by United Nations Development Programme, Lebanon Main authors Léa Kai Aboujaoudé Yara Daou Chalfoun Contributing authors Dr. Charbel Mansour Dr. Charbel Afif Dr. Georges Mitri Mr. Nader Hajj Shehadeh Internal Reviewer Vahakn Kabakian Acknowledgments Mr. Zakaria Rammal Mr. Karim Osseiran Mr. Jean Stephan Mr. Marwan Rizkallah Mr. Jean Boustani Ms. Amal Salibi Mr. Zafer Chaoui

Lebanon’s Second Biennial Update Report to the UNFCCC
Foreword
Lebanon’s Second Biennial Update Report (BUR) to the United Nations Framework Convention on Climate Change (UNFCCC) was prepared with the Enhanced Transparency Framework of the Paris Agreement in mind. Fully aware of the challenges and gaps that it had to face during the preparation of the First Biennial Update Report, and encouraged by the guidance and assessment under the International Consultation and Analysis (ICA) process, the BUR expert team drafted more than a report. It started drafting a vision for efficient institutional arrangements and transparent reporting of emissions, mitigation, finance and MRV for the Paris Agreement implementation era. While this vision is far from being complete and perfect, it has created the much needed national momentum for a broader involvement of national stakeholders and a sense of responsibility towards established and upcoming UNFCCC processes. The importance of the Second BUR also lies in the appropriation of its dual international and national dimension. While Lebanon understands that preparing a BUR is an opportunity to assess gaps and needs in terms of climate finance and capacity building, and to monitor progress of implementation of national development and sectoral policies with mitigation action components, the country is also fully ready to participate in the international stocktaking cycles. Cautiously and consistently submitting constantly improved BURs shows that we strongly believe in joining efforts to make sure we are collectively efficiently working as parties towards achieving the global temperature goal we have set for the planet under the Paris Agreement. Concretely, main improvements on the technical level in the present BUR include a detailed trend analysis, an incorporation of all recommendations from the ICA process in terms of reporting capacity building needs, and improved tables with more complete information for reporting mitigation actions and finance and capacity building information in line with discussed suggestions by parties in the Ad Hoc Working Group on the Paris Agreement (APA). Institutionally, Lebanon’s Second BUR has been an opportunity to launch work on a national data repository for tracking emissions and progress on the implementation of the Intended Nationally Determined Contribution (INDC), on the design of a climate finance reporting system, and on the establishment of standard procedures for preparation and communication of BURs. It is with great honour and enthusiasm that I present Lebanon’s Second Biennial Update Report to the international community. We hope readers will be able to appreciate our progress and challenges, and we are looking forward to an era of unprecedented multilateral cooperation to advance implementation of climate action through improved reporting.
Tarek El Khatib Minister of Environment
Lebanon’s Second Biennial Update Report to the UNFCCC
Table of contents
Table of contents ................................................................................................................. v
List of figures .....................................................................................................................vii
List of tables ...................................................................................................................... viii
Acronyms .............................................................................................................................xi
Executive Summary .......................................................................................................... xiv
I. National circumstances ............................................................................................. 1
Government structure ................................................................................................ 1 1
Population profile ....................................................................................................... 2 2
Geographic profile ..................................................................................................... 2 3
Climate profile ............................................................................................................ 3 4
Economic profile ........................................................................................................ 3 5
Energy ......................................................................................................................... 3 6
Transport .................................................................................................................... 4 7
Industry ....................................................................................................................... 5 8
Waste and wastewater ............................................................................................... 7 9
Agriculture .................................................................................................................. 9 10
Land use, land use change and forestry .................................................................12 11
II. The national GHG inventory in 2013 ........................................................................14
The GHG inventory preparation process .................................................................17 1
Breakdown of emissions by IPCC sector ................................................................19 2 Energy .............................................................................................................................. 19 2.1 Industrial processes ......................................................................................................... 36 2.2 Agriculture ........................................................................................................................ 41 2.3 Land use, land use change and forestry ......................................................................... 54 2.4 Waste and wastewater .................................................................................................... 59 2.5
Key category analysis ...............................................................................................66 3
Trend analysis ...........................................................................................................66 4
Indirect GHG emissions ............................................................................................71 5
Quality assurance/ quality control procedures .......................................................73 6 Quality control .................................................................................................................. 73 6.1 Quality assurance ............................................................................................................ 74 6.2 Uncertainty analysis ......................................................................................................... 75 6.3
III. Mitigation policies and actions ................................................................................75
Energy ........................................................................................................................75 1
Transport ...................................................................................................................78 2
Land-Use, Land Use Change and Forestry ..............................................................79 3
Preparation of Nationally Appropriate Mitigation Actions (NAMAs) ......................81 4

Lebanon’s Second Biennial Update Report to the UNFCCC
Information on international market mechanisms ..................................................82 5
IV. Lebanon’s transparency framework, institutional arrangements and MRV system 83
Minister of Environment decision 99/1 ........................................................................................ 83 Cooperation between Ministries of Environment, Industry and of Finance ................................. 83 The Lebanon Climate Act initiative: reporting of climate change mitigation and adaptation projects ........................................................................................................................................ 83 Transparency law – access to public information ....................................................................... 84 Management and Information System for Climate Action (MISCA) ............................................ 84
V. Constraints and gaps, and related financial, technical and capacity needs, including a description of support needed and received ................................................85
Gaps, constraints and needs....................................................................................85 1 Gaps and constraints in the BUR preparation process ................................................... 85 1.1 Gaps and constraints in inventory preparation ................................................................ 87 1.2 Gaps and constraints in capturing and reporting of mitigation actions ............................ 90 1.3 Gaps and constraints in reporting of finance and capacity building needs and support 1.4
received ....................................................................................................................................... 92 Gaps and needs in establishing of a national MRV system ............................................ 93 1.5
Information on support received ..............................................................................93 2
VI. Other information considered relevant to the achievement of the convention ....97 1. Teacher’s guide on climate change for schools in Lebanon ................................................... 97 2. How to create value from climate change: a guide for businesses in Lebanon ...................... 97
References ..........................................................................................................................98
Annexes ............................................................................................................................ 102
Annex I. GHG inventory technical annex ........................................................................ 103
Annex II. Activity data and emission factor - indirect gases in industrial processes .. 107
Annex III. Activity data for the agriculture sector .......................................................... 110
Annex IV. Land-use classification, definitions and disaggregation ............................. 110
Annex V. Recalculations .................................................................................................. 129
Annex VI. Mitigation actions of energy sector ............................................................... 131
Annex VII. Mitigation actions of LULUCF ....................................................................... 149
Annex VIII: Gaps and constraints .................................................................................... 155

Lebanon’s Second Biennial Update Report to the UNFCCC
List of figures
Figure 1: Geographical location of Lebanon ........................................................................................................... 2 Figure 2: The 2013 vehicle fleet distribution .......................................................................................................... 5 Figure 3: Distribution of industrial establishments by economic activity in 2007 in Lebanon ............................... 6 Figure 4: Agricultural land use in Lebanon (% of total agriculture area) .............................................................. 10 Figure 5: Agricultural production in Lebanon ....................................................................................................... 11 Figure 6: Lebanon's national greenhouse gas inventory by category in 2013 ...................................................... 14 Figure 7: Lebanon's national greenhouse gas inventory by gas in 2013 ............................................................... 15 Figure 8: GHG Inventory preparation process ...................................................................................................... 18 Figure 9: Distribution of fuel used in Lebanon ...................................................................................................... 22 Figure 10: Classification per country of origin of the 2010 Lebanese vehicle fleet .............................................. 32 Figure 11: Contribution of energy emission sources to the sector’s total for 2013 ............................................. 33 Figure 12: Amount of gas diesel oil and fuel oil consumed per subcategory ....................................................... 34 Figure 13: CO2 emissions from industrial processes in Lebanon per category ..................................................... 41 Figure 14: GHG emissions by agricultural source (Gg) and contribution (% of total from agriculture) ................ 50 Figure 15: Distribution of methane emissions from manure management per selected species in 2013. .......... 52 Figure 16: Amount of nitrogen (kg N/year) excreted from animals in different manure management systems in Lebanon in 2013 .................................................................................................................................................... 53 Figure 17: Contribution of subcategories to direct and indirect emissions from agricultural soils in 2013 ......... 54 Figure 18: CO2 emissions/removals by category in 2013. ..................................................................................... 58 Figure 19: Trend in GHG emissions 1994-2013 ..................................................................................................... 68 Figure 20: Trend of GHG emissions 1994-2013..................................................................................................... 69 Figure 21: Fuel import and GHG emissions trends of the energy sector .............................................................. 69 Figure 22: CO2 emissions/removals from the changes in the LULUCF sector ....................................................... 71 Figure 23: Indirect GHG emissions and SO2 emissions in 2013 ............................................................................. 72 Figure 24: Emissions of indirect greenhouse gases from industrial processes for the year 2013 ........................ 73
Lebanon’s Second Biennial Update Report to the UNFCCC
List of tables
Table 1: Lebanon’s Intended Nationally Determined Contribution ........................................................ 1 Table 2: OMSAR-implemented MSW Treatment Facilities (outside GBA and Mount Lebanon) ............ 8 Table 3: Lebanon’s GHG emissions and removals for 2013 per gas and category ............................... 16 Table 4: Sources of activity data ........................................................................................................... 17 Table 5: Reporting categories under stationary combustion ................................................................ 19 Table 6: Reporting categories under mobile combustion ..................................................................... 20 Table 7: Activity data for the energy sector .......................................................................................... 21 Table 8: Quantities of fuel imported for the period 1994-2013 (for selected years) ........................... 23 Table 9: Distribution of fuel consumption by end-use for 2013 ........................................................... 23 Table 10: Activity data for fuel consumption in energy industries ....................................................... 24 Table 11: Activity data for fuel consumption in manufacturing industries and construction .............. 25 Table 12: Description of the vehicles categories used in the calculation of road transport emissions 25 Table 13: Classification of the 2013 vehicle fleet per category and EU emission control technologies 26 Table 14: Activity data for fuel consumption in the commercial and institutional sector.................... 29 Table 15: Fuel consumption for marine bunkers ktonnes/year ............................................................ 29 Table 16: Carbon content, net calorific value and other parameters by fuel type ............................... 30 Table 17: CH4 and N2O emission factors ............................................................................................... 30 Table 18: Default EU emission factors for gasoline passenger cars under the tier 2 methodology ..... 31 Table 19: Default EU emission factors for gasoline light-duty vehicles under the tier 2 methodology 31 Table 20: Default EU emission factors for diesel heavy-duty vehicles under the tier 2 methodology . 31 Table 21: Default EU emission factors for motorcycles under the tier 2 methodology ....................... 32 Table 22: GHG emissions from energy by source category and gas for 2013 ....................................... 33 Table 23: Transport sector GHG emissions for 2013............................................................................. 34 Table 24: CO2 emissions from manufacturing industries and the commercial/institutional sector in 2013 ....................................................................................................................................................... 35 Table 25: Difference in GHG emissions from manufacturing industries and the commercial/institutional sector ............................................................................................................ 35 Table 26: Difference between the reference and sectoral approach for 2013 .................................... 36 Table 27: Reporting categories investigated in the inventory of the Lebanese industrial processes sector ..................................................................................................................................................... 36 Table 28: Summary of data sources used in the GHG inventory for the industrial processes sector .. 38 Table 29: Activity data for industrial processes in Lebanon for selected years .................................... 38 Table 30: Emission factors and other parameters for industrial processes .......................................... 39 Table 31: CO2 emissions from industrial processes in Lebanon for selected years .............................. 40 Table 32: Summary of data sources used in the GHG inventory for the agricultural sector ................ 42 Table 33: Activity Data for livestock population in Lebanon for selected years ................................... 43 Table 34: Fraction of Manure Nitrogen per Manure Management System (MMS) in Lebanon based on expert judgement .................................................................................................................................. 44 Table 35: Amount of synthetic fertilizer applied to soil in Lebanon for selected years........................ 44 Table 36: Amount of pulses produced in Lebanon for selected years, reported in tonnes on a dry matter basis ........................................................................................................................................... 44 Table 37: Amount of non-N fixing crop produced in Lebanon for selected years, reported in tonnes on a dry matter basis .................................................................................................................................. 45 Table 38: Methane emission factors for enteric fermentation. ............................................................ 45 Table 39: Methane emission factors for manure management. .......................................................... 46 Table 40: Nitrogen excretion rate for animal species and fraction of manure managed in each manure management system in Lebanon .......................................................................................................... 47 Table 41: Emission factors for Nitrous Oxide emission for each utilized manure management system. ............................................................................................................................................................... 47 Table 42: Factors used for the calculation of nitrogen from synthetic fertilizer .................................. 48

Lebanon’s Second Biennial Update Report to the UNFCCC
Table 43: Factors used for the calculation of nitrogen from animal manure ....................................... 48 Table 44: Factors used for the calculation of nitrogen from crop residues .......................................... 49 Table 45: Fractions and emission factors used for calculating indirect emissions from agricultural soils ............................................................................................................................................................... 49 Table 46: GHG emissions for the agriculture sector for selected years ............................................... 50 Table 47: Methane emissions from enteric fermentation for selected years ..................................... 51 Table 48: Nitrous oxide emissions from major manure management systems utilized in Lebanon for selected years ........................................................................................................................................ 52 Table 49: Total emissions from agricultural soils and its subcategories in Lebanon for selected years ............................................................................................................................................................... 53 Table 50: Land use categories and subcategories, carbon pools and non-CO2 gases accounted for in the inventory estimation of the LULUCF sector in Lebanon ................................................................. 54 Table 51: Causes of GHG emissions and removals reported for the LULUCF sector in Lebanon ......... 55 Table 52: Lebanon’s GHG emissions/removals summary from the LULUCF sector for 2013 ............... 56 Table 53: Changes in emissions/removals in 2013 ............................................................................... 57 Table 54: Emissions from burned areas in 2013 ................................................................................... 58 Table 55: Lebanon’s GHG emissions/removals summary from the LULUCF sector for the period 1994-2013 (for selected years). ...................................................................................................................... 59 Table 56: Activity data for solid waste emissions calculations ............................................................. 60 Table 57: Main data collected and computed for solid waste .............................................................. 61 Table 58: Solid waste generation and disposal considered for Syrian Displaced for the year 2013 .... 61 Table 59: Description of SWDS categories ............................................................................................ 62 Table 60: Proportion of waste received by each category of unmanaged sites ................................... 62 Table 61: Quantities of medical waste being incinerated ..................................................................... 62 Table 62: Activity data and assumptions made for wastewater emissions calculations ...................... 63 Table 63: Specific data for wastewater ................................................................................................. 63 Table 64: Parameters adopted for methane generation from MSW .................................................... 64 Table 65: Methane correction factor from SWDS ................................................................................. 64 Table 66: Incineration default values considered for HCW and municipal waste ................................ 64 Table 67: Wastewater parameters and conversion factors .................................................................. 64 Table 68: Wastewater methane emission factor for commercial and domestic wastewater .............. 65 Table 69: Wastewater methane emission factor for commercial and domestic wastewater .............. 65 Table 70: Parameters used for N2O emissions calculation ................................................................... 65 Table 71: Greenhouse gas emissions from solid waste and wastewater per gas in 2013 .................... 66 Table 72: Key category analysis for 2013 .............................................................................................. 66 Table 73: Changes in national emissions after recalculation ................................................................ 67 Table 74: Changes in emissions of the year 1994 after recalculations ................................................. 67 Table 75: Trend of emissions during the period 1994-2013 ................................................................. 67 Table 76: Trends of road transport emissions in Gg/year and in % during the period 1994-2013 ....... 70 Table 77: Indirect GHG emissions and SO2 emissions in 2013 .............................................................. 72 Table 78: Indirect GHG emissions for the transport sector in Gg in 2013 ........................................... 72 Table 79: Types of energy mitigation measures ................................................................................... 76 Table 80: Summary of mitigation activities in Lebanon in 2013 ........................................................... 77 Table 81: Increasing energy efficiency and introducing E in public power production ........................ 78 Table 82: Summary of annual GHG removals per type of mitigation project (2005-2011) .................. 79 Table 83: Summary of achieved removals as per 2013 ......................................................................... 81 Table 84: CDM project in Lebanon ........................................................................................................ 82 Table 85: Challenges and needs for the preparation and communication of BURs ............................. 86 Table 86: Gaps related to the preparation of GHG emissions in the energy sector ............................. 87 Table 87: data-specific gaps related to the preparation of GHG emissions in the agriculture sector .. 88 Table 88: Gaps for the calculation of GHG emissions from the waste sector ....................................... 90 Table 89: Data gaps in preparing mitigation actions for the other sectors .......................................... 90
Lebanon’s Second Biennial Update Report to the UNFCCC
Table 90: Data gaps in capturing and reporting mitigation actions for the energy sector ................... 91 Table 91: Challenges hindering complete and transparent climate finance reporting ........................ 92 Table 92: Financial support received by the Ministry of Environment since the submission of the first BUR ........................................................................................................................................................ 94 Table 93: Capacity building received by the Ministry of Environment ................................................. 95

Lebanon’s Second Biennial Update Report to the UNFCCC
Acronyms
AFDC Association for Forests, Development and Conservation
BRT Bus Rapid Transit
CAS Central Administration of Statistics
CCCU Climate Change Coordination Unit
CCGT Combined Cycle Gas Turbines
CDR Council for Development and Reconstruction
CDM Clean Development Mechanism
CFL Compact Fluorescent Lamp
CEDRO Country Energy Efficiency and Renewable Energy Demonstration Project for the Recovery of Lebanon
CNRS National Council for Scientific Research
CoM Council of Ministers
COP Conference of Parties
DGUP Directorate General for Urban Planning
DM Dry Matter
DO Diesel Oil
DREG Decentralized Renewable Energy Power Generation
EIA Environmental Impact Assessment
EDL Electricité du Liban
E/R Emissions/Removals
FAO Food and Agriculture Organization
FSRU Floating Storage And Regasification Unit
FSV Facilitative sharing of views
GBA Greater Beirut Area
GDP Gross Domestic Product
GEF Global Environment Facility
GHG Greenhouse Gas
GIS Geographic Information System
GIZ The Deutsche Gesellschaft für Internationale Zusammenarbeit
GoL Government of Lebanon
GPG Good Practice Guidance
GPS Global Positioning System
GWP Global Warming Potential
HCW Health Care Waste
HDV Heavy-Duty Vehicles
HFO Heavy Fuel Oil
HPS High Pressure Sodium
HRSG Heat Recovery Steam Generators
ICA International Consultation and Analysis
IFAD International Fund for Agricultural Development
ITS Informal Tent Settlements
Lebanon’s Second Biennial Update Report to the UNFCCC
INC Initial National Communication
IPCC Intergovernmental Panel on Climate Change
IPP Independent Power Producer
IPTEC IPT Energy Center
IWRM Integrated Water Resoure Management
KP Kyoto Protocol
LAF Lebanese Army Forces
LARI Lebanese Agricultural Research Institute
LDV Light-Duty Vehicles
LCEC Lebanese Center for Energy Conservation
LECB Low Emission Capacity Building Project
LED Light Emitting Diode
LIBNOR Lebanese Standards Institution
LPG Liquefied Petroleum Gas
LNG Liquefied Natural Gas
LRF Lebanon Recovery Fund
LRI Lebanese Reforestation Initiative
LULUCF Land Use, Land Use Change and Forestry
MEA Middle East Airlines
MMS Manure Management System
MoA Ministry of Agriculture
MoE Ministry of Environment
MoEW Ministry of Energy and Water
MoI Ministry of Industry
MoIM Ministry of Interior and Municipalities
MoPWT Ministry of Public Works and Transport
MPG Modalities, Procedures and Guidelines
MRV Measuring, Reporting and Verifying
MRVCE Measuring, Reporting and Verifying Coordinating Entity
MSW Municipal Solid Waste
NAMA Nationally Appropriate Mitigation Action
NDC Nationally Determined Contribution
NEEAP National Energy Efficiency Action Plan
NEEREA National Energy Efficiency and Renewable Energy Action
NCE National Council for the Environment
NCV Net Calorific Value
NG Natural Gas
NGO Non-Governmental Organization
NREAP National renewable Energy Action Plan
NRP National Reforestation Plan
OMSAR Office of the Minister of State for administrative Reform
PC Passenger Cars
PRP Pasture Range and Paddock

Lebanon’s Second Biennial Update Report to the UNFCCC
Pr Persons
PV Photovoltaics
QA/QC Quality Assurance/Quality Control
RISICO RISchio Icendi e COordinamento
SLM Sustainable Land Management
SNC Second National Communication
SWH Solar Water Heaters
UN United Nations
UNDP United Nations Development Programme
UNFCCC United Nations Framework Convention on Climate Change
USAID United States Agency for International Development
USDA United States Department of Agriculture
USFS United States Forest Service
WtE Waste to Energy
WUI Wildland-Urban Interface
WWE Water and Wastewater Establishment
WWTP Wastewater Treatment Plant

Lebanon’s Second Biennial Update Report to the UNFCCC
Executive Summary
National circumstances
Lebanon is located on the eastern basin of the Mediterranean Sea with a surface area of 10,452 km2, characterized by mostly mountainous areas. The country’s population is estimated to be 6,131,254 in 2013, including foreign workers, Palestinian and Syrian displaced. It is estimated that 858,641 displaced have settled in Lebanon in 2013, including Syrian nationals, Palestine Refugees from Syria and Lebanese returnees.
Lebanon’s economy is relatively diversified with trade, manufacturing, construction and finance representing around half of the economy, and a Gross Domestic Product (GDP) of USD 49.9 billion in 2014 and a GDP per capita of USD 18,052. Lebanon's growth track record is volatile. During the period 2006-2010, real GDP growth averaged 7.7% before falling to 1.9% in 2011-2015 as a result of geopolitical developments.
Lebanon is a sovereign state with a centralized political and administrative structure. The decision-making involves the Lebanese Parliament (128 seats) and the Council of Ministers which enacts regulations in the form of decisions and decrees. The Environmental Protection Law (law no. 444/2002) is the overarching legal instrument for environmental protection and management in Lebanon and the National Council for the Environment (NCE) chaired by the Ministry of Environment is the body responsible for providing environmental policy and planning.
Greenhouse gas inventory
In 2013, Lebanon emitted 26,285 Gg CO2eq. with the most significant greenhouse gas being carbon dioxide, primarily produced from the burning of fossil fuels. The main contributor to greenhouse gas emissions is the energy sector (including transport) with 79% of GHG emissions, followed by industrial processes (10%) and waste sector (7%). CO2 removals from the land use, land use change and forestry category amounted to 3,518.80 Gg CO2, bringing Lebanon’s net emissions down to 22,766 Gg CO2eq.
Figure i: Lebanon's national greenhouse gas inventory by category in 2013
Energy 56% Transport
23%
Industrial processes
10%
Agriculture 4%
Land Use, Land use change and forestry
0% Waste
7%

Lebanon’s Second Biennial Update Report to the UNFCCC
Table i: Lebanon’s GHG emissions and removals for 2013 per gas and category
Greenhouse gas source and sink categories
CO2 emissions
CO2 removals
CH4 CH4 N2O N2O Total
Gg Gg Gg Gg CO2eq.
Gg Gg CO2eq.
Gg CO2eq.
Total national emissions and removals
23,246.21 -3,518.80 96.68 2,030.36 3.25 1,008.53 26,284.69
1 Energy 20,551.07 2.12 44.47 0.58 179.56 20,775.10
Energy industries 7,367.39 0.297 6.25 0.06 18.44 7,392.08
Manufacturing industries and construction
4,403.84 0.106 2.23 0.03 9.89 4,415.96
Transport 5,987.93 1.273 26.74 0.46 143.69 6,158.35
Other sectors 2,791.91 0.441 9.26 0.02 7.55 2,808.72
Fugitive emissions from fuels NO NO NO NO
2 Industrial processes 2,545.42 2,545.42
Mineral products 2,545.42 2,545.42
Chemical industry NE NE NE NE
Metal production NO NO NO NO
Other production NA NA NA NA
Production of halocarbons and sulphur
NO
Consumption of halocarbons and sulphur
NE
Other NO NO NO NO
3 Solvent and other product use
NE NE NE
4 Agriculture 14.55 305.55 2.20 682.00 987.55
Enteric fermentation 12.64 265.44 265.44
Manure management 1.91 40.11 0.55 170.50 210.61
Rice cultivation NO NO
Agricultural soils 1.65 511.50 511.50
Prescribed burning of savannas
NO NO NO NO NO
Field burning of agricultural residues
NO NO NO NO NO
Other NO NO NO NO NO
5 Land use, land use change and forestry
149.67 -3,518.80 0.01 0.23 0.0001 0.04 149.95
Changes in forest and other woody biomass stocks
Forest and grassland conversion
Abandonment of managed lands
CO2 emissions and removals from soil
6 Waste 0.05 80.00 1,680.11 0.47 146.51 1,826.67

Lebanon’s Second Biennial Update Report to the UNFCCC
Solid waste disposal on land 60.91 1,279.14 0.00 1,279.14
Wastewater handling 19.09 400.97 0.47 146.51 547.48
Waste incineration 0.05 0.05
NA: not applicable – NE: not estimated – NO: not occurring Numbers may reflect rounding.
Indirect greenhouse gases such as carbon monoxide (CO), nitrogen oxides (NOx) non-methane organic volatile compounds (NMVOCs) and sulphur dioxide which have indirect impacts on climate and alter the atmospheric lifetimes of other greenhouse gases have also been estimated. In Lebanon, the transport sector is the major source of indirect greenhouses, being responsible for 61% of NOx emissions, 99% of CO emissions and 65% of NMVOCs. Fuel combustion for energy production is the main emitter of SO2 with 94% of emissions, mainly caused by the sulphur content in burnt fuel. As for industrial processes, they mainly emit NMVOCs, being responsible for 34% of these emissions.
Figure ii: Indirect GHG emissions and SO2 emissions in 2013
Lebanon’s GHG emissions are increasing at an average rate of 3.4% every year, which lead to a
doubling of emissions since 1994. The trend of increase in total GHG emissions closely follows the
trend of emissions from the energy sector, which constituted 53% to 59% of total emissions during
this period. This significant growth in emissions reflects the growing demand for electricity, due in
part to the changing socio-economic conditions and to the expansion of the national grid. The 2
detectable drops in 2007 and 2010 and the significant increase in 2009 are mainly due to the impacts
of the July 2006 war where significant damage to the road network and electricity infrastructure was
inflicted. The rehabilitation of the infrastructure extended over 2 years, and it was not until 2009 that
power plants started to run on full capacity again, hence explaining the peak in GHG emissions in
2009.
0
50
100
150
200
250
300
350
400
NOx CO NMVOCs SO2
Gg
LULUCF
Industrial processes
Transport
Energy

Lebanon’s Second Biennial Update Report to the UNFCCC
0
5,000
10,000
15,000
20,000
25,000
30,000
Gg
CO
2e
q.
Total emissions Energy Transport Agriculture Waste IPPU
The sector with the most significant change in emissions is still the transport sector with emissions increasing by a factor of 3.9 reaching 6.1 million tonnes CO2eq. in 2013. This increase is mostly related to the upturn of the number of registered vehicles in Lebanon from 500,000 in 1994 to 1,640,000 in 2013.
The waste sector also witnessed a significant increase in emissions, increasing by a factor of 2.4 from
1994. With an increase in population, in waste generation and in percent of waste deposited in
landfills, methane emissions from solid waste disposal on land have increased by 93% during this
period.
The agriculture sector is still showing a decrease in emissions with a reduction of -5% from the 1994
levels, mainly due to the decrease in emissions from agricultural soils and to a lesser extent from
enteric fermentation.
As for Land Use, Land Use and Forestry, forests are still constituting important sinks of greenhouse gases. However, changes in forest and vegetation covers due to wildfires and mainly urbanization resulted in a net decrease of 2.37% in CO2 emissions.
Figure iii: Trend of GHG emissions 1994-2013

Lebanon’s Second Biennial Update Report to the UNFCCC
Climate change mitigation
As a party to the UNFCCC, Lebanon has made efforts to implement activities that lead to emission reduction based on its capabilities and taking into account its national circumstances. Mitigation measures are mainly achieved in the power and forestry sectors.
In 2013, mitigation measures implemented in the energy sector contributed in reducing emissions by
513,063 tonnes CO2eq., with the expansion of the solar water heaters and the replacement of
incandescent lamps inducing the most significant emission reductions.
As for land use, land change and forestry, afforestation and reforestation activities were sustained
and increased by the Ministry of Agriculture and leader organizations in the country such as the
Association for Forest Development and Conservation and Jouzour Loubnan. In 2013, the total
amount of GHG emissions that has been removed from mitigation actions in this sector to 18.996 Gg
CO2eq. in 2013.
Lebanon’s transparency framework, institutional arrangements and MRV system
As part of enhancing Lebanon’s readiness to implement the Paris Agreement’s article 13 on transparency, several initiatives are being undertaken:
- Minister of Environment decision 99/1 which provides an incentive to the private sector to report on a voluntary basis their GHG emissions and related activity data to the Ministry of Environment. The latter is planning to undertake an assessment to determine the relevance and scalability of the initiative for better informing climate change policy in Lebanon.
- Cooperation between Ministries of Environment and Industry, which entail collection of information by requesting that basic activity data be included as part of the standard procedures followed for industries to acquire their business licenses.
- Cooperation between Ministries of Environment and Finance, which entails data request included in the online tax declaration template. A first round of data collection will be launched starting 2018 for the companies registered at the Large Taxpayer Office.
- The Lebanon Climate Act initiative, which aims to engage the private sector and non-state actors in climate action. A series of trainings have been conducted to support companies in determining their level of engagement, identifying potential partners from civil society and municipalities, and developing implementation, monitoring and reporting plan for their climate actions.
- Transparency law, which give access to information law to the public and which prescribes that all government entities publish online key documents showing performance indicators. The law is a positive step towards improving transparency and public accountability, and work for climate change transparency will benefit from this initiative.
- Management and Information System for Climate Action (MISCA), which is an online information system that tracks progress of implementation of the energy target of Lebanon’s Nationally Determined Contribution. The Ministry of Environment aims at expanding the MISCA initiative to include other ministries. This would be an important move towards enhancing Lebanon’s effectiveness and transparency.
Some gaps and challenges still exist to coordinate these initiatives and to enforce their efficient implementation.

Lebanon’s Second Biennial Update Report to the UNFCCC
Constraints and gaps, and related financial, technical and capacity needs, including a description of support needed and received
The main challenge related to the preparation process of the BUR is the absence of sustainability of the team responsible for the climate reporting processes at the Ministry of Environment. Therefore, the main need is the provision of permanent financial and administrative support to the Ministry of Environment in order to guarantee the sustainability, continuity and integrity of the information reported in the BUR. This can be ensured through the establishment of the MRV Coordinating Entity which will be responsible not only for tracking climate change activities and collecting relevant data, but also in identifying needs to strengthen climate reporting processes in Lebanon.
Other significant challenges relate to the preparation of national inventories. They include but are not limited to the centralization of data management, the development of measurement campaigns to better characterize Lebanon’s energy systems and vehicle fleet, or even the undertaking of an official census on the population in Lebanon or the manure management systems.
Challenges also exist in the collection and consolidation of information related to existing mitigation actions. They are mainly related to limited availability of data, weak coordination between institutions working in climate change and the difficulty in quantifying emission reductions achieved.
Lebanon also needs to improve its institutional arrangements that would allow exhaustive and accurate reporting of support received for climate change activities. Efforts are underway to define climate finance and devise a process to establish a system for MRV of support received (including capacity-building and technology transfer) and their respective financing and linkages to NDC goals. Lebanon has attempted in the present BUR to gather readily available and trusted information, in a format that, if developed and improved, could inform the global stocktake more easily. Only information on climate related projects that have been approved by donors and whose beneficiary is the Ministry of Environment since the submission of BURI has been considered in this report and presented in tabular formats. The report also includes a table which lists the participation of representatives of Lebanon in capacity building events related to climate change since the submission of the first BUR.

Lebanon’s Second Biennial Update Report to the UNFCCC
1
I. National circumstances
Government structure 1
Lebanon’s legislative body, represented by the Lebanese Parliament (128 seats), is organized into specialized committees, among which the Committee for Environment. The Environmental Protection Law (law no. 444/2002) is the overarching legal instrument for environmental protection and management in Lebanon.
The Ministry of Environment is the main national coordinator for climate change and the UNFCCC focal point. The Ministry also chairs the National Council for the Environment (NCE) which is composed of official representatives from 7 ministries (the Ministry of Environment; and the ministries of Finance, Interior and Municipalities, Agriculture, Public Works and Transport, Energy and Water, and Industry) and 7 non-public entities (Order of Physicians, Order of Engineers and Architects, The Bar Association, Association of Banks, Association of Insurance Companies, representative of Non-Governmental Organizations (NGOs), representative of the academic sector). The NCE is mandated to approve environmental policies and strategies and integrate environmental concept, including climate change issues, into national development plans.
Work on climate change in Lebanon is mandated by virtue of law 359/1994 and law 738/2006 relating to the ratification of the United Nations Framework Convention on Climate Change (UNFCCC) and the Kyoto Protocol (KP) respectively. The Paris Agreement was signed by the Lebanese Prime Minister in April 2016 and the draft ratification law is awaiting approval by the Lebanese Parliament after having been approved by the relevant parliamentarian committees. Under the Paris Agreement, Lebanon submitted its Nationally Determined Contribution (NDC) under which the country has set a 2030 target of reducing its GHG emissions by 15% as an unconditional target and by 30% conditional to financial, technical and capacity building support.
No major legislation directly addresses climate change in Lebanon. However, a number of regulations have addressed issues that could be linked to climate change, such as the reduction of air pollution from transport (law 341/2001), the reduction of energy import by developing local energy including renewable energies (Council of Ministers, decision no. 13/2004), energy efficiency standards and labels, tax incentives on green products as well as large scale renewable energy industries (decree 167 under Law 444) and other decisions relating to the ratification of conventions such as the United Nations (UN) Convention on Biodiversity or the UN Convention to Combat Desertification.
Table 1: Lebanon’s Intended Nationally Determined Contribution
Targets Unconditional Target by 2030 Conditional Target by 2030
National 15% reduction of greenhouse gas emissions 30% reduction of greenhouse gas emissions
Energy Refurbishment, replacement and extension of conventional power generation capacities and fuel switch to natural gas
15%increase in the share of renewables in meeting the power and het demand 3% reduction in power demand through energy efficiency measures
20%increase in the share of renewables in meeting the power and het demand 10% reduction in power demand through energy efficiency measures
Transport 36% stabilization of the share of annual passengers-kilometres driven using public transport
48% stabilization of the share of annual passengers-kilometres driven using public transport 20% increase in the share of fuel efficient vehicles in the fleet by 2030
Waste waste management through energy recovery, equivalent to avoiding emissions from landfilling of 1,000 tonnes solid waste per day

Lebanon’s Second Biennial Update Report to the UNFCCC
2
25% recycling rate 51% of municipal wastewater treatment
30% recycling rate 70%% of municipal wastewater treatment
Forestry 20 million trees planted
26 million trees planted
Population profile 2
Lebanon’s population is estimated to be 6,131,254 in 2013, including foreign workers, Palestinian and Syrian displaced. Lebanon’s population profile has changed drastically between 2012 and 2013 due to the increasing influx of Syrian displaced entering the country, dispersing themselves across more than 1,200 villages in Lebanon. In 2013, it is estimated that 858,641 displaced have settled in Lebanon, including Syrian nationals, Palestine Refugees from Syria and Lebanese returnees (UNHCR, 2013). Although most of the displaced Syrians are living in rented accommodations or hosted within Lebanese communities, 4,231 informal settlements have spread across the country, mainly in the Bekaa and the North Regions. The large influx of displaced has constituted a heavy burden on already fragile environmental resources and has directly impacted energy demand and consumption, solid waste and wastewater generation and management, air quality, food consumption and land use (MoE/EU/UNDP, 2014).
Geographic profile 3
Lebanon is located on the eastern basin of the Mediterranean Sea and is characterized by mostly mountainous areas constituted of the following parts:
- A narrow coastal plain composed of 2 plains, one in the north (Aakar) and one in the south (Tyre) and a succession of little narrow plains separated by rocky headlands in the center.
- The Mount Lebanon chain has an average elevation of about 2,200 m. Cut by deep canyons, and composed essentially of Jurassic thick carbonate sediments, the northern part of the chain is the higher region.
- The Anti Lebanon chain - subdivided into two massives: Talaat Moussa (2,629 m) in the north and Jabal el Sheikh or the Mount Hermon (2,814 m) in the south.
- The Bekaa valley - a flat basin with a length of about 120 km, located between the Mount Lebanon and the Anti Lebanon chains. Its elevation averages at 900 m, peaking at 1,000 m at its center.
Figure 1: Geographical location of Lebanon

Lebanon’s Second Biennial Update Report to the UNFCCC
3
Climate profile 4
Lebanon has a Mediterranean-type climate characterized by hot and dry summers (June to September) and cool and rainy winters (December to mid-March). Spring and autumn are warm and pleasant. The average annual temperature is 15˚C.
Along the coast, summers are hot and humid with temperatures crossing 35°C in August. But due to the moderating effect of the sea, the daily temperature range is narrower than it is inland. January is the coldest month, with temperatures around 5 to 10°C. The mean annual rainfall on the coast ranges between 700 and 1,000 mm (Asmar, 2011). About 70% of the average rainfall in the country falls between November and March and is concentrated during only a few days of the rainy season, falling in heavy cloudbursts or violent storms. Rainfall in inland Lebanon is higher with snow in the mountains (1,600 mm according to Asmar, 2011) than that along the coast.
Economic profile 5
Lebanon’s economy is relatively diversified, with four sectors – trade, manufacturing, construction and finance – representing around half of the economy, and a Gross Domestic Product (GDP) of USD 49.9 billion in 2014 and a GDP per capita of USD 18,052. Lebanon's growth track record is volatile. During the period 2006-2010, real GDP growth averaged 7.7% before falling to 1.9% in 2011-2015 as a result of geopolitical developments.
Lebanon’s economy suffers from a number of structural weaknesses, including weak basic infrastructure (e.g., roads, water, electricity and telecommunications). Conflicts over the years have damaged infrastructure, which suffers from underinvestment and inefficient management. Accounting for less than 2% of GDP, the government’s capital expenditure is very low because it is crowded out by large and rising debt-servicing and wage expenditures. The economy continues to face heavy shortages of electricity because of the lack of investment in new capacity and an inefficient energy subsidy system.
Energy 6
In Lebanon, electricity is generated from thermal and hydroelectric power plants, with a rate of 91% and 9% respectively in 2013 (MoEW, 2016a) (hydropower averaged at 6.54% from 2009 to 2015). Almost all of Lebanon’s primary energy requirements are imported, since the country does not have any indigenous energy sources. Out of the 7 thermal power plants in Lebanon, 3 operate on heavy fuel oil and 4 on gas diesel oil. Currently, there is no supply of natural gas to Lebanon although a gas pipeline has been connected and a natural gas station has been constructed at the Tripoli installations. Recent studies and surveys conducted in the deep offshore Exclusive Economic Zones have shown very promising seismic conditions for hydrocarbon deposits, mainly natural gas with some oil. As a result, Lebanon had already started the development phase for the exploration and production era which is expected to have a positive economic impact on the country.
Due to load shedding, technical losses and the aging of power plants, Lebanon’s electricity sector suffers from frequent shortages from the difference between supply and demand. In 2013, Electricité du Liban has supplied 11,728 GWh of electricity while the demand was estimated at 19,876 GWh, giving space to the proliferation of privately owned generators. While some of these generators are located in industrial facilities or in commercial institutions, most of them are spread within neighbourhoods, supplying electricity to residential buildings and small retailers at a monthly fixed subscription fee.
To overcome the problems faced by the energy sector, the Ministry of Energy and Water (MoEW) published the Energy Policy Paper in 2010, which proposed a series of actions related to generation, transmission, and distribution of electricity including the generation of 12% of renewable energy by 2020. The Policy Paper was followed by the 2 National Energy Efficiency Action Plans NEEAP (for

Lebanon’s Second Biennial Update Report to the UNFCCC
4
2011-2015 and 2016-2020) in addition to the National Renewable Energy Action Plan NREAP for 2016-2020 setting up a series of activities to implement the targets set by the Policy Paper (MoEW/LCEC, 2011; MoEW/LCEC, 2016a; MoEW/LCEC, 2016b).
In 2015, and as part of Lebanon’s Nationally Determined Contribution (NDC), sectoral targets for 2020 were set for the energy sector: 15% renewable energy and 3% reduction in demand from energy efficiency as an unconditionally target and 20% renewable energy with 10% reduction in demand as a target conditional to technical, financial and capacity building support.
In terms of renewable energy in Lebanon, its share in energy production is slowly but steadily increasing. The main contributor to the renewable energy mix is hydropower, producing between 6% and 11% of the country’s total energy production depending on the precipitation levels in each year. The potential for hydroelectric power in Lebanon is significant, conditional to the rehabilitation and upgrade of existing units, the installation of new hydro units on the main rivers and streams and the development of micro-hydro potential on small streams and non-river sources.
Lebanon has an abundant solar resource with high solar irradiance levels, providing a net feasible potential energy production of 6,780 GWh/year. Photovoltaic (PV) power systems are currently being used in Lebanon mostly at the micro level and for specific applications like street lighting, small decentralised residential installations and other municipal use. In 2013, a 1 MW grid connected PV farm has been installed over Beirut River as part of the MoEW/LCEC Beirut River Solar Snake project, generating up to 1,665 MWh/year as per the initial simulations. In addition, more than 700 small-scale PV projects and 8,000 public street lighting systems are installed in Lebanon by the government, local municipalities and internationally funded projects such as the Country Energy Efficiency and Renewable Energy Demonstration Project (CEDRO) and UNDP Small Decentralized Renewable Energy Power Generation Project (DREG) projects managed by the United Nations Development Programme (UNDP) (MoEW/LCEC; 2016b).
Solar water heating technology is already a mature technology in Lebanon and its market is witnessing a steady growth. In 2013 around 400,000 m2 of solar water heaters were installed in the country, exceeding the 190,000 m2 target set initially by the first NEEAP 2011-2015 (MoEW/LCEC; 2016b).
The country has a significant wind potential of 12,139 GWh/year, however no wind farm has been commissioned yet in Lebanon (MoEW/LCEC, 2016b). The licensing of 3 farms with a total capacity of ca. 200 MW has started in 2017, with energy production expected by 2020.
As an incentive for increasing the share of decentralized renewable energy, net metering was launched by the Electricité du Liban to boost the development of distributed renewable energy generation. A number of private consumers are benefiting from the net metering contract. In addition, a financing mechanism known as National Energy Efficiency and Renewable Energy Action (NEEREA) has been established by the Central Bank of Lebanon and the LCEC in 2012 in which subsidized loans are given to financing new and existing energy efficiency, renewable energy and green building projects to private sector entities. NEEREA has benefited from a USD 15 million grant from the European Union in its start-up phase of 2011-2014 and has helped to fund more than 225 projects with a total amount of loans of USD 240 Million by mid-2015 (MoEW/LCEC, 2016a).
Transport 7
Land transport in Lebanon consists mainly of road-motorized vehicles, since appropriate infrastructure for non-motorized vehicles does not exist (i.e. bicycle lanes, safe storage, and convenient and affordable bike rentals) and the entire rail network is currently derelict. Road-motorized vehicles rely mainly on personal-owned passenger cars. The 2013 vehicle fleet database shows a total of 1.64 million registered vehicles, mainly constituted of passenger cars.

Lebanon’s Second Biennial Update Report to the UNFCCC
5
Figure 2: The 2013 vehicle fleet distribution
Mass transport consists of public and private buses, mini-vans as well as exclusive and shared-ride taxis, all operating on an ad-hoc basis without any coordination, resulting in very poor occupancy rates (MoE/URC/GEF, 2012). The mass transport market share in Lebanon is weak due to the impracticality, lack of safety and restricted reach of public transportation compared to the attractiveness of owning a private automobile, an alternative that is still promoted in Lebanon through bank loan facilities and affordable new and used car imports.
The driving patterns in Lebanon are characterized by a relatively low driving range with a high rate of congestion and frequent stops at short time intervals. It is estimated that 50% of trips have a distance lower than 5 km, 25% of stops are below 2 seconds and the total stop time per trip corresponds to more than 15% of travel time (Mansour, 2011). Moreover, observed results reflect the continuous stop-and-go driving patterns, therefore resulting in the inefficient operation of internal combustion engines, and a high rate of fuel consumption and pollutant emissions as a result.
The main road transport legislations are law 341 (6/08/2001) and decree no. 7858/2002, banning the use of private and public cars of diesel engines starting from 15/06/2002, and the use of public buses of 16 to 24 passengers of diesel engines starting from 31/10/2002. In 2014, the Ministry of Public Works and Transport (MoPWT) presented to the Council of Ministers the master plan to revitalize the land public transport for passengers. It encloses a set of actions to be implemented on the short and medium terms, shifting the passenger transport demand to mass transit systems.
In terms of aviation activities, Middle East Airlines is the national air carrier of Lebanon and Beirut International Airport is the only operational commercial airport in the country. Lebanon doesn’t have any scheduled domestic flights due to the small surface area of the country.
As for maritime activities, Lebanon has five legal harbors: Beirut, Tripoli, Saida, Tyre and Jounieh. The port of Beirut hosts around 78% of the incoming ships to Lebanon and the port of Tripoli hosts around 16% (CAS, 2014). The number of yearly incoming ships and oil tankers to Beirut port ranges between 2,000 and 2,400 ships, with a total capacity around 700,000 containers Total Equivalent Unit per year (Beirut port statistics, 2014). As for Tripoli, its port hosts around 350 to 450 yearly incoming container and cargo ships, and 50 to 90 oil tankers (Tripoli port statistics, 2014).
The fisheries host a fleet of around 2,860 boats with a yearly catch of 9,000 tonnes. About 98% of the fleet is constituted of open woody boats with length less than 12 m (EastMed, 2012). The fleet is old (e.g. average age of 17 years at the port of Tyre) and spread over 44 local harbors, most of which requiring major infrastructure maintenance intervention.
Industry 8
The industrial sector in Lebanon remains an important pillar of the economy contributing to roughly 7.2% of the country’s GDP in 2011 although this rate was much higher in the nineties (e.g., estimated
85.0%
7.1%
2.3% 5.6%
Passenger cars
Light duty vehicles
Heavy duty vehicles
Motorcycles

Lebanon’s Second Biennial Update Report to the UNFCCC
6
at 12.5% in 1997). The Lebanese industrial establishments are considered as new industries, with 61.7% established between 1990 and 2007 (MoI/ALI/UNIDO, 2010). According to the Ministry of Industry (MoI) latest census, conducted in 2007 and published in 2010, the total industrial output for 4,033 industrial establishments (establishments employing more than 5 workers) reached USD 6.8 billion. As such, the industrial sector productivity has significantly increased compared to 1998, whereby the industrial output was equivalent to USD 3.1 billion (for 5,082 industrial establishments employing more than 4 workers). This significant increase in productivity of the industrial sector is reflected by the fact that the average value of output per enterprise has increased to USD 1,686,162 in 2007 compared to USD 542,326 in 1998 (MoI/ALI/UNIDO, 2010). The industrial census has not been updated since 2007. The key industrial sectors in Lebanon are food products and beverages, fabricated metal products and other non-metallic mineral products. These constitute 50% of the economic activity of the industries in the country. Other sectors include the chemical sector, furniture manufacturing and electrical machinery manufacturing (Figure 3) (MoI/ALI/UNIDO, 2010).
Figure 3: Distribution of industrial establishments by economic activity in 2007 in Lebanon
The industrial sector hosts large units in rural and remote areas, mainly manufacturing activities using large surface areas for their operations. The largest industrial establishments are located out of the Governorate of Beirut and Mount Lebanon, especially in North Lebanon and Bekaa. According to the MoI, around 75% of the industries were mostly established prior to the enactment of the decree 8018/2002 “Permitting of Establishments”. This issue has major consequences on the alignment of industrial enterprises with recent permitting systems, including the environmental management re quirements (EFL, 2013). The MoE is responsible for the environmental compliance of industrial establishments through the implementation of the Environmental Compliance Decree 8471/2012 and its related decisions (202/1, 203/1 & 271/1 - 2013). Depending on the size and type
Printed matter and recorded media
5% Machinery
and equipment
3% Other activities 14%
Food products and beverages
18%
Other non-metallic mineral products
15%
Fabricated metal products
14%
Electrical machinery and apparatus
2%
Chemicals and man-
made fibres 5%
Furniture and other manufactured
goods n.e.c 18%
Pulp, paper and paper products
2%
Rubber and plastic products
4%

Lebanon’s Second Biennial Update Report to the UNFCCC
7
of each industrial establishment, water and air pollution abatement measures have to be undertaken to comply with the decree.
Waste and wastewater 9
Solid waste management
Throughout the last 20 years, solid waste management in Lebanon has witnessed significant technical, legal and institutional changes, in an attempt to organize the sector. However, to date, no clear well-defined strategy has been agreed in the country. National consensus has not been reached yet on a specific solid waste management strategy despite the various attempts and efforts put in place throughout the years, especially after the waste crisis the country is witnessing since July 2015, after the closure of the main landfill of the country.
Municipal Solid Waste (MSW) generated in Lebanon is either disposed of in managed landfills (mainly in urban agglomerations) or disposed of in open dumpsites (mainly in rural areas) where open burning occurs. Hazardous waste, that are mainly produced from industrial activities is disposed of with MSW in landfills and open dumps or stored on location. In rare cases, it is exported to be treated abroad according to the Basel Convention. It is estimated that around 17% of the waste generated is recycled or composted. Estimates for the amount recycled may understate the actual importance of recycling since this activity is conducted in part by the «informal» sector whose activities are, by definition, difficult to quantify. Informal and semi-formal private sector entities, which collect recyclable materials from municipalities, treatment facilities or directly from consumers, have created a market for recycling, providing livelihood for thousands of people. Although, the extent of this recycling activity varies according to market conditions, the draft Law on integrated solid waste management clearly aims at reducing the quantity of wastes to be disposed by promoting waste minimization, source separation, recycling and energy recovery (Sweepnet, 2014).
There are 4 main landfills in Lebanon that have been receiving since 1998 around 55% of the total generated solid waste in Lebanon. Waste sorting in dedicated facilities precede most of the landfilling activities. The Naameh Landfill was established in 1997 as part of the emergency plan for solid waste management for the GBA and receives the majority of the waste generated in Lebanon. The Landfill received around 2,500 tonnes per day and is complemented by 2 sorting facilities and a composting facility. The landfill is equipped with a 7MW power plant with 7 containerized generating sets and is designed to generate energy for own use at the facility. After 18 years of operation and 12 million tons of waste, the site was closed on 17 July 2015, leading to a major waste crisis in the country. The Zahle landfill was opened in 2002 in the Bekaa valley and was designed and built to receive 150 tonnes per day, serving 18 out of 33 municipalities in the Caza of Zahle. The landfill is complemented by a sorting facility since 2008 but no composting activities are taking place. Around 160 tonnes of MSW are landfilled per day. Methane generation is insignificant and is flared. The Tripoli controlled dumpsite is located on the Tripoli seafront and serves the city of Tripoli as well as the neighboring towns with an estimated population of 400,000 inhabitants. The managed dumpsite, which receives around 380 tonnes of waste, is annexed by a sorting facility however not operational yet. The Saida waste facility and landfill has been operational since 2013 to treat the MSW generated by the city of Saida and its surrounding areas. The facility includes a sorting facility and anaerobic

Lebanon’s Second Biennial Update Report to the UNFCCC
8
digestion plant with a treatment capacity of 300 tons/day. Currently around 200 tonnes are landfilled per day and 1.6 megawatts are being produced for internal use. A number of small and medium sized sorting and composting facilities have also been implemented at a municipal level with treatment capacity ranging from 5 to 250 tonnes/day. Funding has been secured through European Commission grants, United States Agency for International Development (USAID), as well as some Non-Governmental Organizations (NGOs) like the Young Men’s Christian Association, Pontifical Mission, and Creative Associates International Inc. The execution of the facilities has been undertaken by the private sector, contracted through the concerned municipalities while the operation of these facilities is carried out by the municipalities themselves. However, the projects have known limited success due to lack of financing of the operation and maintenance services and lack of technical capabilities of the municipalities to ensure efficient solid waste management.
Table 2: OMSAR-implemented MSW Treatment Facilities (outside GBA and Mount Lebanon)
MSW treatment and disposal facility1
Treatment / design capacity (t/d)
2
Status
Hbaline (Jbeil) Sorting and Composting Facility 100
Operational (based on management contract)
Khiam (South Leb.) Sorting and Composting Facility 25
Qabrikha (South Leb.) Sorting and Composting Facility 25
KherbitSilm (South Leb.) Sorting and Composting Facility 10
Union of Municipalities of Tyre / Ain Baal (South Leb.) Sorting and Composting Facility
150
Ansar / Nabatieh (South Leb.) Sorting and Composting Facility 10
Union of Municipalities of Minieh (Akkar) Sorting and Composting Facility
70
Michmich (Akkar) Sorting and Composting Facility 10
Union of Municipalities of Baalbeck-Hermel Sorting and Composting Facility
200
Tripoli (Union of Municipalities of Al Fayhaa) Sorting Facility 420 Constructed and non-operational (awaiting management contract)
ChoufSwaijani – Kahlouneyye (Chouf) Sorting and Composting Facility 30
Union of Municipalities of Nabatieh – Chquif (Kfour) Sorting and Composting Facility
250
Taibeh (Nabatieh) – Sorting and Composting 10
Operational
Qlaiaa (Nabatieh) – Sorting and Composting 5.0
Kfarsir (Nabatieh) – Sorting 7.5
Aitaroun (Bent Jbeil) – Sorting and Composting 15.0
Chaqra (Bent Jbeil) – Sorting and Composting 5.0
Bent Jbeil (Bent Jbeil) – Sorting and Composting 20.0
1 Composting capacities of the facilities are estimated to be approximately 50% of their respective sorting capacities
2 Capacities for operational facilities indicate the treatment capacities. Capacities for under-construction and constructed – non-operational facilities indicate the initial design capacity.
Source| Sweepnet, 2014; MoE/UNDP/ECODIT, 2011

Lebanon’s Second Biennial Update Report to the UNFCCC
9
Open dumping and open burning of MSW are still practiced in Lebanon. Around 670 dumpsites have been reported in 2010 (MoE/UNDP/ELARD, 2011), out of which 504 are MSW dumpsites and the rest is construction and demolition dumpsites. Industrial solid waste is still dumped with MSW since no industrial waste treatment facilities exist in the country. Incineration of MSW is not practiced in Lebanon. Only a small quantity of health care waste is being incinerated by hospitals. Currently, and after the enactment of decree 8006 in 2002 on the proper management of the health care waste in Lebanon, several hospitals started managing their waste mainly through autoclaving. However, although no license for medical waste incinerators has been issued after 2004, some hospitals are still using this practice. It is estimated that in 2013, 57 tonnes of health care waste have been incinerated. In addition, an incinerator at a university animal care facility has been incinerating an estimated 37 tonnes/year of animal carcasses since 2004 (MoE/UNEP/GEF, 2017). Wastewater generation and management
Lebanon generates around 248 million m3 of wastewater per year, most of which is discharged without prior treatment. Although 66% of households are estimated to be connected to a wastewater network, only 8% of wastewater is being currently treated in small scale rural waste water treatment plants (MoEW, 2010a; World Bank, 2011). Wastewater is discharged directly in the sea and surface water bodies, in open sewers or in septic tanks that are still widely adopted in rural areas. Coastal waters receive more than 60% of the total sewage load of Lebanon, from at least 53 sewage outfalls, 16 of which lie in the Beirut area (MoE/UNDP/Ecodit,2011). Industrial wastewater is rarely treated at the industry level prior to its discharge in the environment or in the public sewer network. The government of Lebanon, through the Ministry of Energy and Water (MoEW) developed the National Water Sector Strategy in 2012, which aims at increasing the wastewater collection, treatment and reuse rates by 2020. Due to the regulatory, institutional and financial barriers, the implementation of the plan is being delayed. Some wastewater treatment plants were built in recent years through grants and/or loans, however only few of them are efficiently operating due to lack of financing of operation and maintenance services and lack of technical capabilities of the municipalities or water establishments to ensure proper wastewater treatment. The heavy-flow influx of Syrian displaced to the Lebanese territories since the Syrian conflict has also had its implications on solid waste and wastewater generation and management. It has been estimated that the incremental annual waste generated by displaced is equivalent to 15.7% of the solid waste generated by Lebanese citizens prior to the crisis. In addition, national wastewater generation rates have increased between 8 and 14% with the Bekaa having the highest share of displaced population. Most of this incremental wastewater is being discharged of without treatment in the Litani River and 10% into open lands (MoE/EU/UNDP, 2014).
Agriculture 10
Agriculture is a vital part of the Lebanese economy and its social and cultural heritage. Even though the sector’s share of the GDP, is relatively low (4% in 2011), agriculture employs 20-30% of the active work force and constitutes 17% of the total exports (MoA, 2010a). In rural areas, however, agriculture is reported to contribute up to 80% of the local GDP and represents the major income-earning and employment opportunity (Verner et al.; 2013). In comparison with Lebanon’s neighbors, agriculture production in the country is characterized by a higher value added per square kilometer,

Lebanon’s Second Biennial Update Report to the UNFCCC
10
reflecting a higher intensity of production and greater focus on higher value fruits and vegetables (FAO, 2011a). Compared to 1970 when agriculture’s share of the GDP reached 9% agricultural contribution to the GDP has been steadily decreasing. There are many reasons for this decline including the post-war economic crisis, urban encroachment that changed the rural landscape of the country, government economic policies favoring other sectors, emigration of young generation of farmers and the switch from farming to higher-paid jobs, and climate change with its concomitant effect on crops, pastures, and water resources. According to FAOSTAT (FAO, 2011a) the total agricultural area is estimated at 638,000 ha (62% of total surface area). As indicated in Figure 4, pastures and meadows constitute approximately 39% of the total area, permanent crops 12%, arable land 11%, and forests 13% of the total surface area of Lebanon.
Figure 4: Agricultural land use in Lebanon (% of total agriculture area) Source| Adapted from FAOSTAT, 2011a
According to the Ministry of Agriculture (MoA) 2010 census, the utilized agricultural area was approximately 231,000 ha, which is lower by 6% in comparison with the value from previous census in 1998. Of these, 106,272 ha were dedicated for seasonal crops (grains, vegetables, legumes, root crops, industrial crops, and forages) including 3,800 ha of greenhouse crops and 125,928 ha for permanent crops (olives, fruit trees, citrus, and grapes).
Permanent meadows and
pastures 39%
Other land 25%
Forest area 13%
Permanent crops 12%
Arable land 11%

Lebanon’s Second Biennial Update Report to the UNFCCC
11
Figure 5: Agricultural production in Lebanon Source| MoA, 2010b
Of the total utilized agricultural land, approximately half is irrigated, and increased by 8% compared to irrigated areas in 1998. Flood and furrow irrigation comprise 50% of irrigated land, while approximately 30% is through drip and 20% through sprinkler irrigation. Agricultural production in Lebanon is diverse reflecting a Mediterranean climate with variable temperature and precipitation regimes, and distributed in the following regions of the country: 1. The Bekaa: Once regarded as the ‘bread basket of the Roman Empire”, the Bekaa valley is the
most important production area and accounts for the highest percentage of seasonal crops (60%) as in cereals, potatoes, and vegetables, and in stone fruits, and grapevine. It also contains the highest percentage of cattle population (43%), sheep (72%), goats (51%) and poultry layers (60%).
2. The north and Akkar Plain: Olives, cereals, potatoes, vegetables, cattle and poultry broilers production.
3. South and Nabatieh: Olives, cereals, vegetables, and tobacco production. 4. Mount Lebanon: Fruits, vegetables, poultry broilers, and swine production.
In addition, the geographical coastal strip along the Mediterranean coast from the North of the country to the South is home for intensive vegetable greenhouse production, citrus fruits, and bananas. Crop production
Lebanon’s main agricultural crops are fruits, vegetables, olives, cereals, tubers, and legume crops. Pressure on the land base has led to a decline in cereal production in favor of high-value crops such as vegetables. Lebanon is self-sufficient in fruits and vegetables, although competition from open markets is leading to import of these commodities as well. The most important cereals cultivated are wheat and barley, with some production of forage crops such as alfalfa, vetch, corn, oats, and sorghum. Most of the barley grown in the arid parts of Bekaa
Grain crops 20%
Legumes 4%
Forages 1%
Vegetables 17%
Industrial crops 4%
Fruit Trees 31%
Olives 23%

Lebanon’s Second Biennial Update Report to the UNFCCC
12
(Hermel and El Qaa) is left as pasture for grazing animals. It is anticipated that forage crop production would increase after recent incentives introduced by the MoA to encourage milk and forage production by farmers with small animal holdings. In 2010, wheat, barley, and potato production decreased due to a combination of drought and reduction in the areas planted. Although wheat and barley production recovered in 2011 and 2012, potato crop production remained at least 80% less compared with 2005, mainly due to the shrinkage in hectares planted (20,000 ha in 2005 vs. 12,000 ha in 2012). Also, imports from Saudi Arabia and Egypt rendered potato farming, once a profitable and prominent enterprise, vulnerable to open markets. Fertilizer use
Statistics on fertilizer consumption in Lebanon are sporadic and contradictory. The Lebanese customs provide extensive data about imports but these could not be corroborated from the major agricultural importing companies. The amount of fertilizers used in Lebanon has been decreasing since 1994: approximately 122,000 tonnes of total nitrogenous fertilizers were used in 1994 (average of 31,000 tonnes of Nitrogen (N)), while in 2006 total nitrogenous fertilizers used were approximately 50,000 tonnes (average of 9,500 tonnes N). However, fertilizer consumption increased in recent years to reach 85,000 tonnes (19,000 tonnes of N) in 2013. Most of the nitrogenous fertilizers used were Nitrogen-Phosphorus-Potassium (NPK) fertilizer, (17-17-17; and 15-15-15, and other combinations), Ammonium Sulphate, Ammonium Nitrate and Urea. Application rates of nitrogen fertilizers far exceed the recommended agronomic rates (Al-Hassan, 2011). For example, potato growers apply on average 590 kg N/ha while the suggested agronomic rate is 220 kg N/ha. For vegetables, growers apply the average of 900 kg N/ha while the agronomic rate is 500 kg N/ha. Unfortunately, soil testing for soil nutrient content is not widely practiced and growers apply nitrogen rates based on experience or on the recommendation of agents from fertilizer distributors. Animal production
The livestock sector contributes to around 30% of the total value of production (FAO, 2011a). Although animal production is considered secondary with respect to crop production, Lebanon’s poultry and dairy sectors both hold importance in terms of production and quality. The poultry sector is the only agriculture sector that satisfies domestic demand and is dominated by few companies utilizing closed systems producing quality broilers and egg products. Cattle are mainly raised for milk production with the majority of stocks raised in large farms as well as small-sized holdings (FAO, 2011b). Beef production is limited and imported live animals (in addition to imported chilled and frozen cuts) provide a major source for local consumption. The size of sheep and goat herds has fluctuated since 1994 but decreased in recent years mainly due to decrease in the number of shepherds and due to competition from imported meat from Australia, Turkey and Syria. In addition, the crisis in Syria has caused the influx of goat and sheep herders to Lebanese rangelands with their flocks but this is hard to quantify. Swine production has decreased steadily since 1994 due to a shift in consumer preferences towards poultry, mutton and beef, and due to fear from the swine flu.
Land use, land use change and forestry 11
In Lebanon, the lack of land management plans and/or inadequate urban regulations has strongly affected the natural and built environment. This has facilitated unplanned urban sprawl at the expense of natural landscapes). The construction of new roads and highways in mountain areas has also affected landforms, vegetation cover, and ecosystems. Several initiatives have been conducted to document and map land cover attributes in Lebanon. Accordingly, the first land cover map was produced in 1961 by the Lebanese army in partnership with the French “Institut Géographique National”. Later in 2002, a land use/ land cover map of Lebanon

Lebanon’s Second Biennial Update Report to the UNFCCC
13
was produced by the Ministry of Environment in cooperation with the National Center for Remote Sensing of the National Council for Scientific Research (NCSR) which involved the use of satellite remote sensing data acquired in 1998. The final map disaggregated land use and land cover into seven main categories and 23 subcategories. The NCSR is currently aiming at completing the Land Cover / Land Use map using remote sensing data acquired in 2013. National forest resources assessments for Lebanon were conducted in 2005, 2010 and 2015 by the Ministry of Agriculture with the assistance of the Food and Agriculture Organization. The latest results showed that forests cover 13.2% of the total area of the country. In addition, 10.2% of the Lebanese territory is covered by other wooded land (MoA/FAO, 2015). Increasingly, Lebanon’s forests, which include valuable broad-leaved trees, conifer forests and evergreen trees that cover the mountains in patches, are exposed to degradation due to quarries, urbanization, pests and diseases, fires, wars, human neglect, improper management, outdated laws, and poor law enforcement. Like other Euro-Mediterranean countries, fires have been especially damaging Lebanon’s forests in recent years, representing one of the most important elements that destroy Lebanon’s natural resources. Moreover, the absence of a national forest management strategy and the lack of human and technical resources contribute to the degradation of Lebanon’s forests. Overall, the lack of land management in Lebanon is the cause for the over-exploitation and degradation of lands in many areas. It is estimated that 84% of the Lebanese territory still does not have adequate master plans, which has allowed for a lot of chaos when it comes to construction or any activities that change land cover and land use. It is estimated that there are about 1,278 quarries in Lebanon covering an area of 5,267 ha (MoE, 2012). Most recently, an indicative research study conducted showed that the largest area of artificialization on the coastal zone of Lebanon between 1998 and 2010 affected grasslands followed by forests and agricultural lands, consecutively (MoE/UNEP, 2013). Furthermore, it was found that wetlands decreased by 47%, grassland by 27%, and forests by 9%. Further investigation showed that most of artificialization in grassland affected moderately to highly dense vegetation, while most of the artificialization in forested lands affected shrublands. In an attempt to tackle deforestation and to preserve what is left of natural areas, Lebanon has created until the year 2015, a total of 15 nature reserves, 3 biosphere reserves, 16 protected forests, 18 protected natural sites/landscapes, 4 Ramsar sites, 5 world heritage sites, and 15 important bird areas (MoE/UNDP/ECODIT, 2011). The MoA developed a National Forest Plan (NFP) and pursue efforts to update Lebanon’s forest law to protect better the remaining forest cover and promote the increase in forest cover by 40 million trees by 2020. MoE has been involved in developing a forest fire law complementing Lebanon’s National strategy for forest fire management. In addition, a number of projects such as the GEF funded “Smart Adaptation of Forest Landscapes in Mountain Areas” project and the adaptation fund “Climate Smart Agriculture: Enhancing Adaptive Capacity of the Rural Communities in Lebanon” project are aiming at increasing forest areas in Lebanon and limit degradation losses. Also, Lebanon has set a target towards land neutrality by 2030 under the United Nations Convention to Combat Desertification. The influx of Syrian displaced has also had impacts on land resources through the expansion of Informal Tented Settlement (ITS) and their distribution in relation to agricultural areas, environmentally sensitive areas and vulnerable towns.

Lebanon’s Second Biennial Update Report to the UNFCCC
14
II. The national GHG inventory in 2013
The inventory of greenhouse gas emissions in this report covers the year 2013, with a recalculated time series for 1994-2013. The inventory was prepared based on IPCC Guidelines and Guidance used for the Inventory preparation, the 1996 IPCC Revised Guidelines and elements from the IPCC Good Practice Guidances 2000 and 2003 (IPCC GPG 2000 and IPCC GPG-LULUCF 2003) in line with Decisions 17/CP.8 and 2/CP.17. Emissions of Carbon Dioxide (CO2), Methane (CH4), Nitrous Oxide (N2O) were estimated. The UNFCCC Non-Annex I greenhouse gas inventory system, version 1.3.2. was used for the computation exercise. In 2013, Lebanon emitted 26,285 Gg CO2eq. with the most significant greenhouse gas being carbon dioxide, primarily produced from the burning of fossil fuels. The main contributor to greenhouse gas emissions is the energy sector (including transport) with 79% of GHG emissions, followed by industrial processes (10%) and waste sector (7%). CO2 removals from the land use, land use change and forestry category amounted to 3,518.80 Gg CO2, bringing Lebanon’s net emissions down to 22,766 Gg CO2eq.
Figure 6: Lebanon's national greenhouse gas inventory by category in 2013
Energy 56%
Transport 23%
Industrial processes
10%
Agriculture 4%
Land Use, Land use change and forestry
0% Waste
7%

Lebanon’s Second Biennial Update Report to the UNFCCC
15
Figure 7: Lebanon's national greenhouse gas inventory by gas in 2013
0%
10%
20%
30%
40%
50%
60%
70%
80%
90%
100%
CO2 CH4 N2O
Waste
Land Use, Land use change andforestry
Agriculture
Industrial processes
Transport
Energy

Lebanon’s Second Biennial Update Report to the UNFCCC
16
Table 3: Lebanon’s GHG emissions and removals for 2013 per gas and category
Greenhouse gas source and sink categories
CO2 emissions
CO2 removals
CH4 CH4 N2O N2O Total
Gg Gg Gg Gg CO2eq.
Gg Gg CO2eq.
Gg CO2eq.
Total national emissions and removals
23,246.21 -3,518.80 96.68 2,030.36 3.25 1,008.53 26,284.69
1 Energy 20,551.07 2.12 44.47 0.58 179.56 20,775.10
Energy industries 7,367.39 0.297 6.25 0.06 18.44 7,392.08
Manufacturing industries and construction
4,403.84 0.106 2.23 0.03 9.89 4,415.96
Transport 5,987.93 1.273 26.74 0.46 143.69 6,158.35
Other sectors 2,791.91 0.441 9.26 0.02 7.55 2,808.72
Fugitive emissions from fuels NO NO NO NO
2 Industrial processes 2,545.42 2,545.42
Mineral products 2,545.42 2,545.42
Chemical industry NE NE NE NE
Metal production NO NO NO NO
Other production NA NA NA NA
Production of halocarbons and sulphur
NO
Consumption of halocarbons and sulphur
NE
Other NO NO NO NO
3 Solvent and other product use NE NE NE
4 Agriculture 14.55 305.55 2.20 682.00 987.55
Enteric fermentation 12.64 265.44 265.44
Manure management 1.91 40.11 0.55 170.50 210.61
Rice cultivation NO NO
Agricultural soils 1.65 511.50 511.50
Prescribed burning of savannas NO NO NO NO NO
Field burning of agricultural residues NO NO NO NO NO
Other NO NO NO NO NO
5 Land use, land use change and forestry
149.67 -3,518.80 0.01 0.23 0.0001 0.04 149.95
Changes in forest and other woody biomass stocks
Forest and grassland conversion
Abandonment of managed lands
CO2 emissions and removals from soil
6 Waste 0.05 80.00 1,680.11 0.47 146.51 1,826.67
Solid waste disposal on land 60.91 1,279.14 0.00 1,279.14
Wastewater handling 19.09 400.97 0.47 146.51 547.48
Waste incineration 0.05 0.05
NA: not applicable – NE: not estimated – NO: not occurring Numbers may reflect rounding.
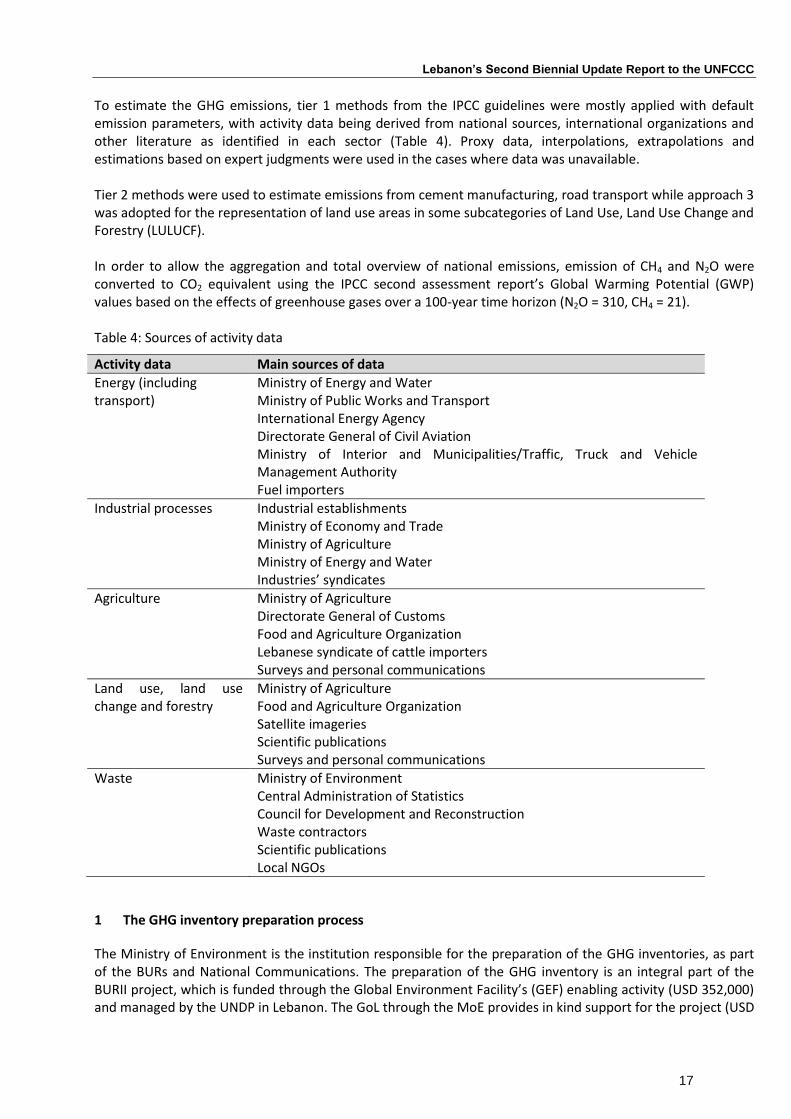
Lebanon’s Second Biennial Update Report to the UNFCCC
17
To estimate the GHG emissions, tier 1 methods from the IPCC guidelines were mostly applied with default emission parameters, with activity data being derived from national sources, international organizations and other literature as identified in each sector (Table 4). Proxy data, interpolations, extrapolations and estimations based on expert judgments were used in the cases where data was unavailable. Tier 2 methods were used to estimate emissions from cement manufacturing, road transport while approach 3 was adopted for the representation of land use areas in some subcategories of Land Use, Land Use Change and Forestry (LULUCF). In order to allow the aggregation and total overview of national emissions, emission of CH4 and N2O were converted to CO2 equivalent using the IPCC second assessment report’s Global Warming Potential (GWP) values based on the effects of greenhouse gases over a 100-year time horizon (N2O = 310, CH4 = 21). Table 4: Sources of activity data
Activity data Main sources of data
Energy (including transport)
Ministry of Energy and Water Ministry of Public Works and Transport International Energy Agency Directorate General of Civil Aviation Ministry of Interior and Municipalities/Traffic, Truck and Vehicle Management Authority Fuel importers
Industrial processes Industrial establishments Ministry of Economy and Trade Ministry of Agriculture Ministry of Energy and Water Industries’ syndicates
Agriculture Ministry of Agriculture Directorate General of Customs Food and Agriculture Organization Lebanese syndicate of cattle importers Surveys and personal communications
Land use, land use change and forestry
Ministry of Agriculture Food and Agriculture Organization Satellite imageries Scientific publications Surveys and personal communications
Waste Ministry of Environment Central Administration of Statistics Council for Development and Reconstruction Waste contractors Scientific publications Local NGOs
The GHG inventory preparation process 1
The Ministry of Environment is the institution responsible for the preparation of the GHG inventories, as part of the BURs and National Communications. The preparation of the GHG inventory is an integral part of the BURII project, which is funded through the Global Environment Facility’s (GEF) enabling activity (USD 352,000) and managed by the UNDP in Lebanon. The GoL through the MoE provides in kind support for the project (USD

Lebanon’s Second Biennial Update Report to the UNFCCC
18
50,000). The overall coordination of the project was handled by the climate change office at the MoE, which works under the Service of Environmental Technology.
The GHG inventory and report were compiled and drafted by the climate change office at the Ministry of Environment. The recruitment of local consultants was undertaken for the preparation of LULUCF and transport GHG inventories. Intensive stakeholders and key data holders consultations are conducted during the process, building on existing institutional arrangements.
Figure 8: GHG Inventory preparation process

Lebanon’s Second Biennial Update Report to the UNFCCC
19
Breakdown of emissions by IPCC sector 2
Energy 2.1
Methodology
According to the IPCC guidelines, the source category “Energy” covers all combustion sources of CO2, CH4 and N2O emissions (1A) and fugitive emissions associated with the production, transport and distribution of fossil fuels (1B). Since no oil production activities occur in the country, therefore they are reported as not occurring (NO) in the inventory reporting tables.
Fuel combustion activities (1A) are divided in two main categories, on the basis of the characteristics of the methodology applied for the calculation of emissions:
- Stationary combustion, including energy industries, manufacturing industries and construction and other sectors (agriculture, residential and commercial / institutional sectors and agriculture/forestry/fisheries) (Table 5)
- Transport, including domestic civil aviation, road transport, and domestic navigation (Table 6)
Table 5: Reporting categories under stationary combustion
Reporting categories
Description Remarks Methodology
Energy industries
Emissions from combustion of gas/diesel oil, heavy fuel oil and lubricants for electricity generation from the 7 power plants.
Lubricants store 50% of their carbon content and only emit the remaining 50%.
Emissions are calculated based on the tier 1 methodology and disaggregated by power plant.
Manufacturing industries and construction
Emissions from combustion of gas/diesel oil, heavy fuel oil, petroleum coke and LPG for electricity or heat generation for own use in industries.
Gas/diesel oil is considered to be used mainly for electricity production within the industrial facilities (generators).
Fuel consumed by neighborhood generators is considered under this category.
Petroleum coke is only used by cement industries.
Emissions are calculated based on the tier 1 methodology.
Commercial and institutional sector
Emissions from combustion of gas/diesel oil for electricity generation and space heating and LPG for cooking activities in commercial and institutional buildings.
Gas/diesel oil is considered to be used for electricity production from generators.
Emissions are calculated based on the tier 1 methodology.
Residential sector
Emissions from combustion of gas/diesel oil, LPG, and biomass fuel for space heating and cooking activities.
Emissions are calculated based on the tier 1 methodology.
Agriculture, forestry and fisheries
Emissions from combustion of diesel oil for stationary and mobile activities related to in agriculture, forestry and fishing.
Emissions are calculated based on the tier 1 methodology.

Lebanon’s Second Biennial Update Report to the UNFCCC
20
Table 6: Reporting categories under mobile combustion
Reporting categories
Description Remarks Methodology
Aviation
Military helicopters; civil, commercial aircrafts; and private jet- and propeller-type aircrafts.
Emissions from military aircrafts are not calculated due to the confidentiality of activity data for military case.
Civil, private and commercial aircrafts emissions are calculated based on the tier 1 methodology.
Maritime transport Domestic navigation between local ports, and international navigation.
Emissions from military navigation are not calculated due to the unavailability of activity data for military case. Emissions from fishing are not reported under transport, but rather under the agriculture/forestry/fisheries category of the energy sector.
Emissions from international navigation are calculated based on the tier 1 methodology.
Road transport vehicles
On-road vehicle technologies rely on gasoline and gas/diesel internal combustion engines. The fleet encompasses motorcycles, passenger cars, vans, buses and trucks.
Road transport is the only mobility mean considered under land transport as the entire rail network is derelict.
Emissions are estimated using the tier 2 methodology based on the number of vehicles per category and their activity in terms of distance and/or fuel consumption.
Activity data
The country’s primary energy imports include jet kerosene, gasoline, gas/diesel oil, heavy fuel oil (also known as residual fuel oil), petroleum coke, Liquefied Petroleum Gas (LPG), Petroleum coke, bitumen, and lubricants. Biomass or logged wood is still used in fireplaces or stoves mainly for heating purposes in rural houses.
No national system has been established yet for the collection of data for the GHG inventory, particularly for the consumption of fuel by end use. Therefore, for the reference approach, the main source of data is the list of aggregated amounts of fuel imports provided by the Ministry of Energy and Water (MoEW, 2016a). For the sectoral approach, activity data has been estimated based on a survey that has been undertaken by the IPT Energy Center (IPTEC) for the Ministry of Environment on the sales of fuel from IPT stations to end users. The survey was conducted for the year 2013.

Lebanon’s Second Biennial Update Report to the UNFCCC
21
Table 7: Activity data for the energy sector
Subcategory Data Source Assumptions
Energy industries
Ministry of Energy and Water for fuel imports (MoEW, 2016a)
All quantities of fuel reported to be delivered to EDL are consumed within one reported calendar year.
Manufacturing industries and construction
Ministry of Energy and Water for fuel imports (MoEW, 2016a)
Ministry of Environment for petroleum coke use (MoE, 2017a)
IPT Energy Center (IPT, 2014)
13% of imported LPG is used in industries.
49% of the gas diesel oil consumed for private generation is used by industries and neighborhood generators (1 liter of diesel oil generates 3.65 kWh). All imported quantities of petroleum coke are consumed within one reported calendar year.
Transport
Ministry of Energy and Water (MoEW, 2016a)
International Energy Agency (IEA, 2017)
Ministry of Interior and Municipalities, Traffic, Trucks and Vehicles Management Authority for vehicle fleet characteristics (MoIM, 2017).
Scientific publications (Waked and Afif, 2012) for number of vehicles equipped with a catalyst for emission control
Gas diesel oil is only used for Heavy Duty Vehicles (HDV), with an estimated consumption of 7.06 mpg (33.3 l of diesel/100km).
Passenger cars annual mileage is 12,000 km/year.
Light Duty Vehicles annual mileage is 27,250 km/year
HDV annual mileage is 50,000 km/year.
Motorcycles annual mileage is 5,000 km/year.
Commercial and institutional sector
IPT Energy Center (IPT, 2014)
15% of imported LPG is used in the commercial and institutional sector.
51% of the gas diesel oil consumed for private generation is used commercial institutions (1 liter of diesel oil generates 3.65 kWh).
Residential sector
Ministry of Energy and Water for fuel imports (MoEW, 2016a)
Biomass from FAOSTAT (FAO, 2017)
IPT Energy Center (IPT, 2014)
73% of imported LPG is used in residential sector.
52% of remaining gas diesel oil in the market is used in the residential sector.
Agriculture, forestry and fisheries
Ministry of Energy and Water for fuel imports (MoEW, 2016a)
IPT Energy Center (IPT, 2014)
48% of remaining gas diesel oil in the market is used in the agriculture, forestry and fisheries.

Lebanon’s Second Biennial Update Report to the UNFCCC
22
Figure 9: Distribution of fuel used in Lebanon
Jet kerosene
International aviation
Gasoline
Domestic aviation
Road Transport
Gas Diesel Oil
Agriculture, forestry and
fisheries
Residential sector
Electricity production
Commercial sector
generators
Industrial and neighborhood
generators
Energy industries
(power plants)
Heavy Fuel oil
International navigation
Energy production
Industrial sector
Petroleum Coke LPG
Cooking
Residential sector
Commercial Insitutional
Bitumen
Roofing and road paving
Lubricants
Machineries in EDL
Biomass
Space heating Cooking
Residential sector

Lebanon’s Second Biennial Update Report to the UNFCCC
23
Table 8: Quantities of fuel imported for the period 1994-2013 (for selected years)
Fuel type (1,000 tonnes)
1994 2000 2006 2011 2013
Gasoline 1243.18 1263.757 1,224.61 1,598.42 1,596.340
Jet kerosene 145.91 124.511 103.36 223.88 258.891
Gas diesel oil 818.123 1315.64 1,596.28 2,448.07 3,075.57
Heavy fuel oil 1411.01 1507.9 1,039.72 1,347.36 1332.03
LPG 146 165.12 161.12 196.67 250.976
Bitumen 66 91.72 43.86 59.19 57.102
Lubricants 0.29 37.7 29.86 35.24 40.61
Petroleum coke 180 157.01 477.86 335.60 542.342
Biomass 9.77 10.08 9.99 9.95 9.92
Source| MoEW, 2016a and MoE; 2017
Table 9: Distribution of fuel consumption by end-use for 2013
Fuel type Consumption (1000 tonnes)
Gas diesel oil (GDO)
Energy industries (EDL) 1,174.53
Road transport 534.02
Private generation 1,359.15
Manufacturing industries and construction 663.20
Commercial and institutional sector 695.95
Residential sector 4.08
Agriculture/forestry/fisheries 4.28
Heavy Fuel Oil (HFO)
Energy industries (EDL) 1,183.43
International navigation 30.00
Manufacturing industries and construction 118.6
LPG
Residential sector 180.70
Manufacturing industries and construction 32.63
Commercial and institutional sector 37.65
Gasoline
Domestic aviation 3.00
Road transport 1,592.95
Jet kerosene
International aviation 258.89
Petroleum coke
Cement industries 542.34
Lubricants
Energy industries (EDL) 40.61 Source| MoEW, 2016a and IPTEC, 2014
Energy industries – public electricity and heat production
The fuel consumption used under the energy industries category for the estimation of GHG emissions is presented in Table 10. It includes amounts of heavy fuel oil and gas/diesel oil that are delivered by the Ministry of Energy and Water to EDL, considering that these amounts are being consumed during one calendar year.

Lebanon’s Second Biennial Update Report to the UNFCCC
24
Table 10: Activity data for fuel consumption in energy industries
Fuel type Quantity (1,000 tonnes)
1994 2000 2006 2011 2013
Gas diesel oil 48.65 532.805 1,057.70 1,305.67 1174.529
Heavy fuel oil 1,124.07 1294.362 956.61 1,186.78 1,183.43
Lubricants 0.197 37.7 29.86 35.24 40.611
Source| MoEW, 2016a
Manufacturing industries and construction
This category includes GHG emissions from fuel consumption in the 2 following activities:
1- Production of electricity, steam and process heat by industries: the industrial sector is one of the major energy consuming sectors in Lebanon. However, due to the intermittent electricity supplied by EDL and the constant power shortages, most industries in Lebanon generate their own energy from in-house generators. Gas/diesel oil and fuel oil are bought either directly from the Ministry of Energy and Water or from private fuel distributors and are used in the premises. Unfortunately, no data is recoded on these quantities. Therefore, estimations have been calculated based on the IPTEC survey on the sale of fuel per end user for 2013 (IPT, 2014).
2- Production of electricity by neighbourhood generators: due to the frequent power shortages, neighbourhood generators have flourished in Lebanon, supplying electricity to households during cut-off hours (which range from 3 to 15 hours a day depending on the region). All these generators work on gas/diesel oil which is bought either directly from private fuel distributors or from gas stations. Unfortunately, no data is available on the number, capacity or quantity of fuel used for private generators in the country. Therefore, based on an intensive consultation process was put in place with the main stakeholders (Ministry of Energy, Electricité du Liban, private distributers of fuel, and owners of generators) it was agreed to assume that the gap between public electricity supply and demand (referred as Energy not Supplied ENS) is being met at 80% by private generators.
As most developing countries, Lebanon suffers from a major gap between energy demand and supply, resulting in a deficit in energy of around 23%. This energy not supplied by public utilities is being supplied by privately owned generators providing electricity to households and commerce during cut-off hours. All these generators work on gas diesel oil which is bought either directly from private fuel distributors or from gas stations. Unfortunately, no data is available on the number, capacity or quantity of fuel used for private generators in the country. Therefore, an intensive consultation process was put in place with the main stakeholders (Ministry of Energy, Electricité du Liban, private distributers of fuel, and owners of generators) to attempt to quantify the diesel used in private generation. As a result of this process, it was agreed to assume that the gap between public electricity supply and demand (referred as Energy not Supplied ENS) is being met at 80% by private generators. The below table presents the values that were used for the year 2011. The energy not supplied is estimated by calculating the difference between the energy produced in 2011 and the estimated demand. Then, the diesel consumption of what is equivalent to 80% of this ENS is estimated using a conversion factor of 222.98 g/KWh. Finally, GHG emissions are calculated by using a country specific NCV and default emission as per IPCC guidelines

Lebanon’s Second Biennial Update Report to the UNFCCC
25
Table 11 presents the quantities of fuel used in manufacturing industries and construction for selected years based on the following assumptions:
The heavy fuel oil used in manufacturing industries is calculated as the difference between the total fuel oil imported to Lebanon minus the amount consumed by public utilities and the amount consumed for international navigation.
The gas/diesel oil used in this category constitutes 49% of the total gas/diesel oil consumed for private generation (the other 51% is used by the commercial/institutional sector).
The LPG used in this sector is estimated at 13% of the total LPG import to Lebanon.
Petroleum coke is consumed only in cement industries and imported quantities are delivered directly to the industries’ locations after receiving approval from the Ministry of Environment.
Table 11: Activity data for fuel consumption in manufacturing industries and construction
Fuel type Quantity (1,000 tonnes)
1994 2000 2006 2011 2013
Gas diesel oil 424.42 292.20 153.75 361.89 663.20
Heavy fuel oil 286.94 198.54 64.11 133.59 118.60
LPG 21.06 21.47 20.95 25.57 32.63
Petroleum coke 180 157.01 477.86 335.60 542.34
Lubricants 0.102 - - - -
Source| MoEW, 2016a and MoE, 2017a
Transport
Road transport covers all internal combustion vehicles used for passengers and goods mobility in Lebanon, except farm tractors and public-work vehicles. Types of vehicles investigated in this inventory are motorcycles, passenger cars, vans, buses and trucks, classified into categories in accordance with the guidelines: Passenger Cars (PC), Light-Duty Vehicles (LDV), Heavy-Duty Vehicles (HDV) and motorcycles (Table 12). After banning the use of diesel for vehicles with gross weight lower than 3,500 kg (law 341 (6/08/2001) and decree 341/2002), passenger cars, light-duty vehicles and motorcycles run only on gasoline, while heavy duty vehicles run on diesel.
Table 12: Description of the vehicles categories used in the calculation of road transport emissions
Vehicle category Description
Passenger Cars (PC) Private personal gasoline cars used for mobility including Sport Utility Vehicles (SUV).
Light Duty Vehicles (LDV)
Gasoline vehicles with rated gross weight less than 3,500 kg including light trucks and coaches, designed for transportation of cargo or passengers.
Heavy Duty Vehicles (HDV)
Diesel vehicles with rated gross weight exceeding 3,500 kg including heavy trucks and coaches, designed for transportation of cargo or passengers.
Motorcycles Includes a mixture of 2-stroke and 4-stroke engines as well as mopeds having an engine less than 50cc.
The following activity data are considered:
The numbers of registered vehicles for are provided by the Ministry of Interior and Municipalities/traffic, truck and vehicle management authority for the years 2012 and 2015

Lebanon’s Second Biennial Update Report to the UNFCCC
26
(MoIM, 2017). The database includes the number of registered vehicles by category, type of use (private or public), production date, circulation date, horsepower, and type of fuel used, as well as by emission control technologies, following the European Union (EU) classification described in the IPCC guidelines (IPCC, 1997). The number of vehicles per category for 2013 are interpolated from the 2012 and the 2015 databases.
Table 13 summarizes the classification of the 2013 vehicle fleet per vehicle category and EU emission control technology. Note that the classification per emission control technologies takes into consideration the common practice in Lebanon of removing the emission control catalyst without any replacement. The fraction of vehicles for which the catalyst was removed is obtained from a survey conducted in Beirut on 3,000 vehicles. (Waked, 2012; Waked and Afif, 2012; Unpublished data). The results from this survey were extrapolated to the rest of the vehicle fleet.
Table 13: Classification of the 2013 vehicle fleet per category and EU emission control technologies
EU emission control technology Passenger Cars Light Duty Vehicles Heavy Duty Vehicles Motorcycles
Uncontrolled 7,220 599 298 -
Early non-catalyst control 169,027 8,081 2,991 -
Non-catalyst control 352,375 21,310 2,925 -
Oxidation catalyst 89,764 13,062 363 -
Three-way catalyst 775,306 73,370 31,973 -
<50 cc1 - - - 84,594
2-strokes2 - - - 4,811
4-strokes3 - - - 2,504
Total 1,393,692 116,422 38,550 91,910 1 Motorcycles having 1 cylinder
2 Motorcycles having 2 to 3 cylinders
3 Motorcycles having 4 cylinders and above
The annual travelled distance per vehicle category is considered. Due to field data unavailability, an assumption was made using the ForFITS (For Future Inland Transport Systems) database. ForFITS is a modeling tool intended to evaluate the transport activity, energy use and CO2 emissions, using transport data collected from different national and international transport related agencies (UNECE, 2014). For countries with mobility characteristics similar to Lebanon, a value of 12,000 km/year is estimated for passenger cars, 27,250 km/year for light-duty vehicles, 50,000 km/year for heavy-duty vehicles and 5,000 km/year for motorcycles.
Gas/diesel oil is only used by heavy-duty vehicles and is estimated to be 534,021 tonnes in 2013 (see Box 1 for calculation methodology). The amounts used by passenger cars (taxis in general) and LDV are considered insignificant.
Box 1: Estimation of gas/diesel oil used in road transport
HDV diesel consumption is assumed to be 7.06 mpg (33.3 l of diesel/100km), based on the data provided by IPT on their trucks fleet consumption, and double checked against the GREET Model default value (from Argonne National Laboratory) and also compared to the results study conducted by VTT Technical Research Centre of Finland. The consumption value is averaged taking into consideration the loaded and unloaded truck trips.
HDV annual mileage assumed 50,000 km/year in ForFITS, which was validated by experts in the field (Afif, 2017).
Uncertainties
- Consumption is averaged for the whole fleet without taking into consideration the age distribution effect on consumption. It is noteworthy to mention that 2% of fuel reduction is estimated every 5 years for model year trucks above 1990. However, since the HDV fleet in Lebanon is old, the considered value (33.3 l/100km) is

Lebanon’s Second Biennial Update Report to the UNFCCC
27
representative of national conditions. Further refinement of this number could be done later.
- Expert judgments have validated the estimated 50,000 km/year based on survey that is currently being undertaken by the Universite Saint Joseph. However, it is unsure how representative the survey is to the HDV fleet.
- Diesel buses constitute a small share compared to HDV trucks, therefore, buses consumption was approximated to be similar to the average consumption of the diesel truck.
Conclusion
The gas/diesel oil total consumption for transport in Lebanon is 534,021 tonnes in 2013. The difference with numbers calculated in this file is related to the assumptions estimated above.
Domestic flights consist of 5 small propeller-type aircrafts, used only for training. They operate on gasoline (AVGAS LBP 100) with an annual consumption ranging between 2 and 3 ktonnes. Which is estimated on a capita basis then weighted by the population and extrapolated to cover the 1994-2011 yearly consumption.
Activities related to domestic navigation are limited to fishing boats, which are reported under the category agriculture/forestry/fisheries, and consequently, their emissions are not reported under transport. Emissions related to military maritime transport were not considered due to the unavailability of the activity data.
Other sectors
This category includes the greenhouse gases emitted by fuel combustion in the commercial/ institutional sector, residential sector and agriculture/ forestry/ fisheries. Different types of fuel are considered under this category and are mainly used for electricity generation, cooking, heating, navigating and use of other mobile equipment.
Emissions from burning of wood are allocated under the residential sector’s, where in rural areas logged wood is still being used for cooking and heat generation. The biomass activity data is based on the volume of fuelwood logged from coniferous and non-coniferous forests (referred to as wood waste) as reported by FAOSTAT (FAO, 2017). Only emissions of non-CO2 gases derived from biomass fuels are included, and reported, in the emissions of the energy sector and national totals of the inventory. Therefore, CO2 emissions from biomass fuels are included only as information item because it is assumed that the consumption of biomass is similar to the volume that is regenerated. Any variation to this hypothesis is reflected and calculated in the LULUCF sector. Therefore, carbon dioxide emissions from biomass combustion are not included in national totals, but are recorded as memo item for cross-checking purposes as well as avoiding double counting.

Lebanon’s Second Biennial Update Report to the UNFCCC
28
Table 14 presents the quantities of fuel used in per category based on the following assumptions:
The gas/diesel oil used for electricity generation in the commercial and institutional sector constitutes 51% of the total gas/diesel oil consumed for private generation (the other 49% is used by manufacturing industries sector)
The remaining gas/diesel oil is used by the residential sector (52%) and by agriculture/forestry/fisheries (48%)
The LPG used in the commercial and institutional sector is estimated at 13% and the amount used in the residential sector at 72% of the total LPG import to Lebanon.

Lebanon’s Second Biennial Update Report to the UNFCCC
29
Table 14: Activity data for fuel consumption in the commercial and institutional sector
Fuel type Quantity (1,000 tonnes) End-use
1994 2000 2006 2011 2013
Commercial/institutional sector
Gas diesel oil 57.67 306.63 161.34 379.76 695.95 - Electricity generation - Space heating - Water heating
LPG 14.58 24.77 24.17 29.50 37.65 - Cooking - Space heating - Water heating
Residential sector
Gas diesel oil 65.45 - 30.02 4.08 - Space heating - Water heating
LPG 110.36 118.89 116 141.61 180.70 - Cooking - Space heating - Water heating
Biomass 9.77 10.08 9.98 9.95 9.92 - cooking - Space heating
Agriculture/forestry/fisheries
Gas diesel oil
179.98 - - 19 3 Mobile equipment
179.98 - -
9.40 1.28
Fishing boats
Source| MoEW, 2016a
Feedstock and non-energy use of fuels
Some of the imported fuels are used as raw materials for the production of other products in chemical industry and metal production, or the use of fuels for non-energy purposes such as bitumen and lubricants (HS code used for Lebanon is HS 27.10.19.90). Since these fuels are not combusted, their carbon content is totally or partially stored in the product and is not oxidized into carbon dioxide for a certain period of time. The CO2 released from the use or decomposition of the product is not reported under the energy sector’s inventory but under the industrial sector’s inventory (MoE/UNDP/GEF, 2015). The calculation of carbon dioxide emissions from non-energy use of fuels is based on the relevant consumption by fuel type and the fraction of the carbon stored by fuel type (50% for lubricants and 100% for bitumen).
International Bunkers
International bunkers include international aviation and navigation. Emissions from these sources are not accounted in national totals and are reported as memo items in the inventory. The activity data for international civil aviation includes the jet kerosene consumption and is collected from the Ministry of Energy and Water (MoEW, 2016a). The activity data for navigation is limited to the heavy fuel oil consumption for international bunkers and it is collected from the fuel imports data by the International Energy Agency (IEA, 2017). Fuel consumption in ktonnes/year is presented in Table 15.
Table 15: Fuel consumption for marine bunkers ktonnes/year
Year 1994 2000 2006 2011 2013
Jet-kerosene 145.91 124.51 103.36 223.88 258.89
Marine bunkers - 15 19 27 30

Lebanon’s Second Biennial Update Report to the UNFCCC
30
Emission factors and other parameters
Due to the lack of country specific emission factors and emissions measurements, tier 1 methodologies are adopted for the calculation of all greenhouse gases emissions from stationary combustion. CO2, CH4 and N2O emission factors and other parameters used in the calculation are based on default values of the Revised 1996 IPCC Guidelines and the IPCC Good Practice Guidance. CH4 and N2O emission factors are differentiated by technology and fuel, while CO2 emission factors are differentiated only by fuel. Information on the Net Calorific Value (NCV) per imported fuel for 2013 is provided by the Ministry of Energy and Water.
Table 16: Carbon content, net calorific value and other parameters by fuel type
Fuel type Net calorific value
(TJ/ktonnes)
Carbon content
(tonnes C/TJ)
Oxidation factor
(%)
Fraction of carbon stored
1
Gasoline 43.50 18.9 0.99 0
Jet kerosene 42.80 19.5 0.99 0
Diesel oil 41.60 20.2 0.99 0
Heavy fuel oil 41.10 21.1 0.99 0
LPG 47.31 17.2 0.99 0
Lubricants 40.19 20.0 0.99 0.5
Bitumen 40.19 22.0 0.99 1
Petroleum coke 35.30 27.5 0.99 0
Natural gas 48.00 15.3 0.995 0
Biomass 15.00 29.9 0.98 0
1 Assumption is made that no carbon is stored, except for bitumen and 50% of lubricants, as per the IPCC default values.
Table 17: CH4 and N2O emission factors
CH4 emission factor (kg/TJ)
N2O emission factor(kg/TJ)
NOx emission factor (kg/TJ)
CO emission factor (kg/TJ)
NMVOC emission factor (kg/TJ)
Oil Biomass Oil Biomass Oil Biomass Oil Biomass Oil Biomass
Energy industries 3
0.6 200
15 5
Manufacturing industries and construction
2
0.6 200
10 5
Transport Gasoline
20 0.6 60
0 8,0
00 1500
Diesel 5
0.6 800
1,000
200
Commercial/institutional
10 300
0.6 4 100
20 5
Residential 10 300
0.6 4 100
100 20 5000 5 600
Agriculture/forestry/
fisheries 10 300
0.6 4 100
20 5
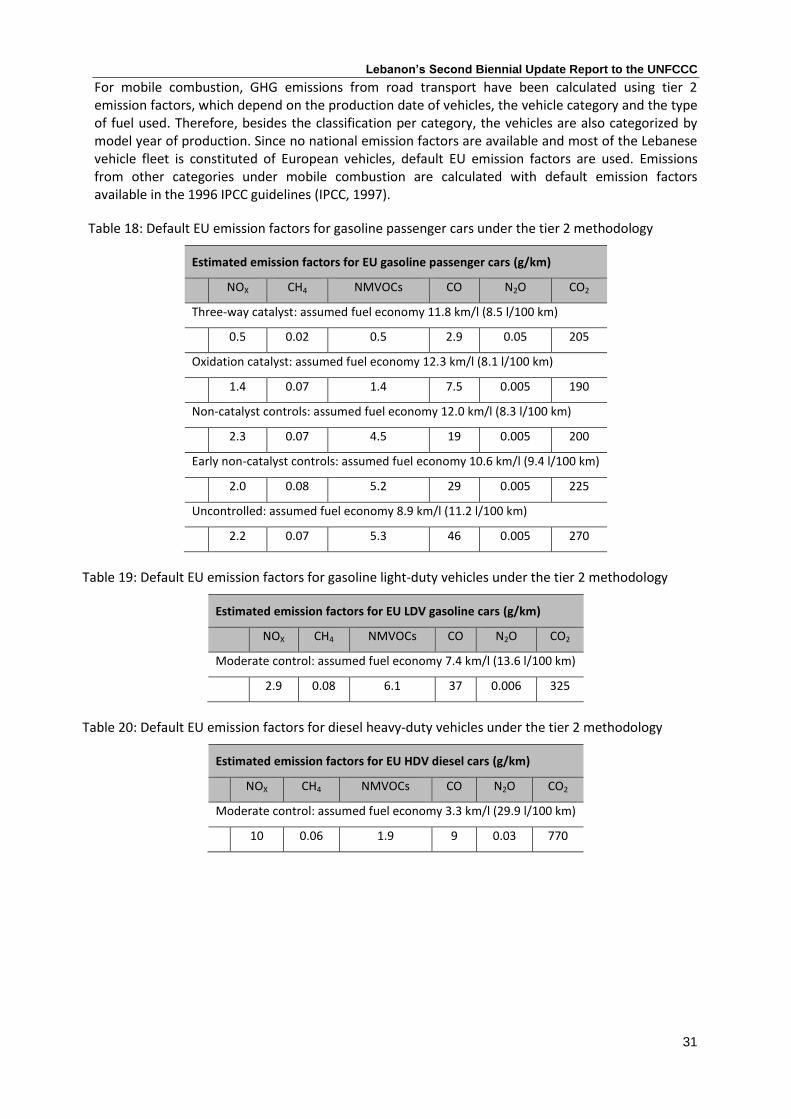
Lebanon’s Second Biennial Update Report to the UNFCCC
31
For mobile combustion, GHG emissions from road transport have been calculated using tier 2 emission factors, which depend on the production date of vehicles, the vehicle category and the type of fuel used. Therefore, besides the classification per category, the vehicles are also categorized by model year of production. Since no national emission factors are available and most of the Lebanese vehicle fleet is constituted of European vehicles, default EU emission factors are used. Emissions from other categories under mobile combustion are calculated with default emission factors available in the 1996 IPCC guidelines (IPCC, 1997).
Table 18: Default EU emission factors for gasoline passenger cars under the tier 2 methodology
Estimated emission factors for EU gasoline passenger cars (g/km)
NOX CH4 NMVOCs CO N2O CO2
Three-way catalyst: assumed fuel economy 11.8 km/l (8.5 l/100 km)
0.5 0.02 0.5 2.9 0.05 205
Oxidation catalyst: assumed fuel economy 12.3 km/l (8.1 l/100 km)
1.4 0.07 1.4 7.5 0.005 190
Non-catalyst controls: assumed fuel economy 12.0 km/l (8.3 l/100 km)
2.3 0.07 4.5 19 0.005 200
Early non-catalyst controls: assumed fuel economy 10.6 km/l (9.4 l/100 km)
2.0 0.08 5.2 29 0.005 225
Uncontrolled: assumed fuel economy 8.9 km/l (11.2 l/100 km)
2.2 0.07 5.3 46 0.005 270
Table 19: Default EU emission factors for gasoline light-duty vehicles under the tier 2 methodology
Estimated emission factors for EU LDV gasoline cars (g/km)
NOX CH4 NMVOCs CO N2O CO2
Moderate control: assumed fuel economy 7.4 km/l (13.6 l/100 km)
2.9 0.08 6.1 37 0.006 325
Table 20: Default EU emission factors for diesel heavy-duty vehicles under the tier 2 methodology
Estimated emission factors for EU HDV diesel cars (g/km)
NOX CH4 NMVOCs CO N2O CO2
Moderate control: assumed fuel economy 3.3 km/l (29.9 l/100 km)
10 0.06 1.9 9 0.03 770

Lebanon’s Second Biennial Update Report to the UNFCCC
32
Table 21: Default EU emission factors for motorcycles under the tier 2 methodology
Estimated emission factors for motorcycles (g/km)
NOX CH4 NMVOCs CO N2O CO2
Motorcycles < 50 cc Uncontrolled: assumed fuel economy 41.7 km/l (2.4 l/100 km)
0.05 0.1 6.5 10 0.001 57
Motorcycles > 50 CC 2 stroke Uncontrolled: assumed fuel economy 25.0 km/l (4.0 l/100 km)
0.08 0.15 16 22 0.002 95
Motorcycles > 50 cc 4 stroke Uncontrolled: assumed fuel economy 19.6 km/l (5.1 l/100 km)
0.3 0.2 3.9 20 0.002 120
Figure 10: Classification per country of origin of the 2010 Lebanese vehicle fleet
Results
In 2013, the energy sector’s GHG emissions were estimated at 20,775 Gg CO2eq. (20.7 million tonnes CO2eq.), representing 79% of the total greenhouse gas emissions in Lebanon. Energy is mainly responsible for carbon dioxide emissions (99.63%), while it also contributes to methane and nitrous oxide emissions with 0.12% and 0.28% respectively. The contribution of each subcategory to the total of the energy sector is presented in Table 22 and Figure 11.
60%
8%
4%
28%
<1%
Europe
USA
Korea
Japan
China

Lebanon’s Second Biennial Update Report to the UNFCCC
33
Table 22: GHG emissions from energy by source category and gas for 2013
Categories Emissions
CO2 (Gg)
CH4 (Gg)
CH4 (Gg
CO2eq.)
N2O (Gg)
N2O (Gg
CO2eq.)
Total (Gg
CO2eq.)
Total energy 20,551.07 2.12 44.47 0.58 179.56 20,775.10
Energy industries 7,367.39 0.29 6.25 0.06 18.44 7,392.08
Manufacturing energy and construction
4,403.84 0.11 2.23 0.03 9.89 4,415.96
Transport 5,987.93 1.27 26.74 0.46 143.69 6,158.35
Other sectors 2,791.91 0.44 9.26 0.02 7.55 2,808.72
Commercial/Institutional 2,234.11 0.307 6.447 0.018 5.580 2,246.14
Residential 546.21 0.132 2.772 0.006 1.806 550.84
Agriculture/Fishing/Forestry 11.59 0.002 0.042 0.000 0.000 11.63
A Global Warning Potential of 1 was used for CO2, 21 for CH4 and 310 for N2O, Numbers may reflect rounding.
Figure 11: Contribution of energy emission sources to the sector’s total for 2013
Energy industries
The energy sector in Lebanon relies on fossil fuel combustion for meeting the bulk of energy requirements in the country. The final energy consumption in 2013 amounted to approximately 287,465 TJ. Since electricity generation from public power plants (energy industries) is the main fuel
Energy Industries 35.58%
Manufacturing industries and construction
21.26%
Transport 29.64%
Commercial/ Institutional
10.81%
Residential 2.65%
Agriculture/Fishing
/Forestry 0.06%

Lebanon’s Second Biennial Update Report to the UNFCCC
34
consumer, it is responsible for 35.58% of the sector’s emissions followed by transport (29.64%) and manufacturing industries (21.26%) as illustrated in Figure 11. Indeed, public electricity generation is the largest contributor to the sector’s emission due to the fact that more than 88% of imported fuel oil and 38% of imported gas diesel oil are used in thermal power plants for public electricity generation (Figure 12).
Figure 12: Amount of gas diesel oil and fuel oil consumed per subcategory
Transport
In 2013, GHG emissions from transport are estimated at 6,158.35 Gg CO2eq. Carbon dioxide, methane, and nitrous oxide contribute to 97.2%, 0.43%, and 2.3% of total CO2eq. respectively.
Table 23: Transport sector GHG emissions for 2013
CO2eq. CO2 CH4 N2O
Emissions (Gg)
6,158 5,988 1.27 0.46
Contribution 97.2% 0.43% 2.3%
As for the contribution of the different vehicle categories, passenger cars have the highest share of the 2013 emissions with 58.1% of the total road transport GHG emissions (CO2eq.), while LDV, HDV, and motorcycles account for 17%, 24.5%, and 0.5% respectively.
Manufacturing industries and construction and commercial/institutional sectors
Other high-emitting subcategories in the energy sector are manufacturing industries and construction and the commercial/institutional sector since they cover all combustion activities related to the private generation of electricity. Due to high difference between electricity supply and
0
500
1000
1500
2000
2500
3000
3500
Gas/Diesel oil Residual Fuel oil
Kilo
ton
ne
s
International aviation
Agriculture/Fishing/Forestry
Residential
Commercial/Institutional
Transport
Manufacturing Industries andconstruction
Energy Industries

Lebanon’s Second Biennial Update Report to the UNFCCC
35
demand, private generation in industries, commercial institutions and at neighbourhood levels consume considerable amounts of Gas/Diesel (GDO). In 2013, it is estimated that private generators supplied 6,095 GWh of electricity, calculated as 80% of the Energy-Not-Supplied (ENS), i.e. the difference between supply1 (12,257 GWh) and demand (19,987 GWh) in 2013. Assuming a rate of consumption of 222.98 g/kWh of GDO, it is estimated that 1,359,149 tonnes of gas diesel have been used for private electricity generation in 2013, exceeding the amount of GDO used in EDL power plants and constituting 44% of total import of gas diesel oil. Manufacturing industries and construction and commercial/institutional sectors also emit GHG emissions from their consumption of Liquefied Petroleum Gas (LPG) for heating and cooking, heavy fuel oil for heat generation in industries and petroleum coke for cement production (Table 24).
Table 24: CO2 emissions from manufacturing industries and the commercial/institutional sector in 2013
Manufacturing industries (including neighbourhood generators)
Commercial/institutional sector
Fuel Type Emissions in 2013 (Gg CO2)
Gas/Diesel oi for private generation 2,023.00 2,122.90
Heavy fuel oil 373.35 -
LPG use 96.38 111.21
Petroleum coke 1,911.11 -
Total 4,403.84 2,234.11
Compared to the results reported in Lebanon’s first BUR, the emissions from manufacturing industries and the commercial/institutional sector in 2013 seems to be twice as much as the emissions in 2011 (4,592.03 Gg CO2eq.). This is mainly driven by the increased reliance on private generation resulting from the growing gap between the electricity supplied by EDL and electricity demand.
Table 25: Difference in GHG emissions from manufacturing industries and the commercial/institutional sector
2011 2013
Emissions (Gg CO2eq.) 4,592.03 7,224.68
DO for private generation (ktonnes) 741 1,359
Energy-not Supplied 4,158 7,619
EDL Supply (GWh) 12,406 12,257
Electricity demand (GWh) 16,564 19,876
Residential sector
In the residential sector, LPG is estimated to be the main source of GHG emissions (537.095 Gg CO2eq.), followed by gas diesel oil that is used for space and water heating in households. Emissions from the use of private generators in residential buildings are not allocated in this category to avoid double counting from private generation under the manufacturing industries and construction category.
1 Electricity supply takes into account electricity production and purchase for any given year

Lebanon’s Second Biennial Update Report to the UNFCCC
36
Comparison between the sectoral approach and the reference approach
According to the IPCC guidelines, carbon dioxide emissions from the energy sector should be calculated using both the reference and the sectoral approach. The reference approach is based on detailed data on primary energy consumption, which leads to the calculation of apparent consumption of fuel and to the consequent calculation of emissions, while the sectoral approach is based on a detailed disaggregation of energy consumption by sector and fuel for the calculation of CO2 emissions. The application of the reference approach can be considered as a quality control procedure, as the deviation of estimations should not be significant (deviations in the order of ±2%) or else explanations should be provided. In Lebanon, carbon dioxide emissions for the energy sector are calculated according to the two methodologies. In the reference approach, it was considered stock change was not taken into consideration due lack of data, and it was assumed that all fuel imported are consumed within the same calendar year. As shown in Table 26, the difference between the 2 approaches is 2.48%, which is slightly above the threshold defined by the IPCC guidelines. The existing difference results mainly from statistical differences in fuel consumption and the use of tier 2 methodology in the transport sector.
Table 26: Difference between the reference and sectoral approach for 2013
CO2 emissions (Gg)
Difference
Reference approach 21,072.72 2.48%
Sectoral approach 20,551.07
International bunkers
For international bunkers, the total direct GHG emissions from aviation and marine amounted to 879.77 Gg of CO2eq. in 2013, with 90% of these direct GHG emissions originating from international aviation.
Industrial processes 2.2
Methodology
The GHG inventory of industrial processes in Lebanon is carried out based on calculation methodologies of the Revised 1996 IPCC Guidelines for national greenhouse gas inventories and the IPCC Good Practice Guidance. Further descriptions of the methodologies used and gases covered for each source of emissions identified by the guidelines are detailed in Table 27. Table 27: Reporting categories investigated in the inventory of the Lebanese industrial processes sector
Reporting categories Emitted gases Methodology, description and remarks
Cement production CO2
All cement industries in Lebanon are covered in this calculation. Cement manufacturing is a key category in Lebanon. Tier 2 is adopted to calculate emissions from this category.
Lime production CO2 The only lime production plant in Lebanon is covered in this calculation. Lime is also produced in cement manufacturing; however it is already accounted for in clinker produced in cement industries.

Lebanon’s Second Biennial Update Report to the UNFCCC
37
Limestone use CO2 Limestone is mainly used in Lebanon in cement, glass and lime industries. Therefore emissions from limestone are already accounted for in each of these categories.
Soda ash production and use
CO2 There is no soda ash production in Lebanon. Therefore all soda ash used is imported. Percentages of soda ash used for each type of industry (glass manufacturing, soap and detergents, water treatment etc.) are not available.
Production and use of miscellaneous mineral products
NMVOCs CO SO2
Asphalt use and production Bitumen used for asphalt road paving in Lebanon is imported. It is assumed that all asphalt used for non-paving applications is produced by blowing process (IPCC, 1997). Therefore, the amount of asphalt blown was derived by subtracting cement asphalt for road paving from total bitumen imports. Glass production Glass production does occur in Lebanon; however, production data could not be accessed. Therefore emissions from glass production are not estimated. Concrete pumice stone production There is no concrete pumice stone production in Lebanon. Therefore emissions are not occurring.
Ammonia production CO2 NMVOCs CO SO2
There is no ammonia production in Lebanon. Therefore emissions are not occurring.
Nitric acid production N2O NOx
There is no nitric acid production in Lebanon. Therefore emissions are not occurring.
Adipic acid production N2O NOx NMVOCs CO
There is no adipic acid production in Lebanon. Therefore emissions are not occurring.
Carbide production CO2 CH4
There is no carbide production in Lebanon. Therefore emissions are not occurring.
Production of other chemicals
CH4 NOx NMVOCs CO SO2
Phosphate fertilizers are reported to be produced in Lebanon. However, data from producing companies is inaccessible to any government agency. Therefore, emissions from this category are not estimated.
Metal production CO2 NOx NMVOCs CO SO2
There is no metal production in Lebanon. Production of Iron and Steel from the years 2000 to 2002. Then the only metal producing company in Lebanon closed. Besides emissions from this period, none have occurred for this category.
Pulp and paper industries NOx CO SO2 NMVOCs
In Lebanon, there is no pulp production in any of the paper industries. Pulp is imported. Therefore emissions are not occurring.

Lebanon’s Second Biennial Update Report to the UNFCCC
38
Food and drink NMVOCs Categories included in this module are: wine production, beer production, meat, fish and poultry production. Estimations were also made for bread and cake and biscuits production based on quantities of imported as well as locally produced wheat. Data on coffee, animal feeds and Arak (locally produced spirit) production could not be obtained, therefore emissions from these subcategories were not estimated.
Production of halocarbons and sulphur hexafluoride
HFCs PFCs
Halocarbons are not produced in Lebanon. Therefore, emissions from production are not occurring.
Consumption of halocarbons and sulphur hexafluoride
HFCs PFCs
There is no data available on consumption of fluorinated gases. Lebanon’s national ozone office is in the process of finalizing a survey to estimate the amount of ODS, mainly HFC, in the country.
Activity data
Table 28 below summarizes the data sources used for the calculation of CO2 emissions industrial processes in Lebanon’s second BUR. Details of the calculation of activity data are presented in Annex II.
Table 28: Summary of data sources used in the GHG inventory for the industrial processes sector
Reporting category Activity data needed Reference
Cement production Quantity of cement produced Quantity of clinker produced
The three cement industries in Lebanon
Lime production Quantity of lime produced The only lime producing company in Lebanon
Soda ash use Soda ash used Lebanese customs through Ministry of Economy and Trade (except for the year 2013 for which data was retrieved directly from the customs website). HS code: 28.36.30.00
Data for the present inventory was collected for the time series 1994 – 2013. Table 29 present some of the activity data collected for the source categories for the industrial sector for selected years.
Table 29: Activity data for industrial processes in Lebanon for selected years
Year 1994 2000 2006 2011 2013
Quantity of clinker produced (tonnes) 298,000 3,135,084 3,868,051 4,955,079 4,881,844
Quantity of cement produced (tonnes) 298,000 2,790,336 4,043,357 5,771,074 5,905,811
Quantity of lime produced (tonnes ) 15,000 2,500 2,503 2,722 1,901
Quantity of soda ash used (t) 12,072.6 9,555 14,601 9,122.62 10,564
Emission factors
The emission factors used in the calculation of emissions from industrial processes are based on default values provided by the IPCC 1996 revised guidelines except for cement industries for which a national emission factor has been calculated.

Lebanon’s Second Biennial Update Report to the UNFCCC
39
Table 30: Emission factors and other parameters for industrial processes
Reporting categories Emission factor and other parameters
Source of emission factor
Cement production 0.51 t CO2/t clinker produced Nationally developed emission factor, SNC (MoE/UNDP/GEF, 2011)
Correction factor for cement kiln dust (CKD): 1.02
IPCC Good Practice Guidance and Uncertainty Management, p.3.12
0.3 kg SO2/t cement produced Revised 1996 IPCC guidelines, reference manual, p.2.7
Lime production 0.79 t CO2/t quicklime produced Revised 1996 IPCC guidelines, reference manual, p.2.9
Soda ash use
415 kg CO2/t soda ash used Revised 1996 IPCC guidelines, reference manual, p.2.13
320 kg NMVOCs/t road paving material used
Revised 1996 IPCC guidelines, reference manual, p.2.14
Production and use of miscellaneous mineral products
2.4 kg NMVOCs/t asphalt roofing produced
Revised 1996 IPCC guidelines, reporting instructions, p.2.9
0.095 kg CO/t asphalt roofing produced
Revised 1996 IPCC guidelines, reference manual, p.2.13
0.035 kg NMVOCs/hl beer produced
Revised 1996 IPCC guidelines, reference manual, p.2.41
0.3 kg NMVOCs/t fish processed Revised 1996 IPCC guidelines, reference manual, p.2.42
0.3 kg NMVOCs/t meat processed
Revised 1996 IPCC guidelines, reference manual, p.2.42
0.3 kg NMVOCs/t poultry processed
Revised 1996 IPCC guidelines, reference manual, p.2.42
8 kg NMVOCs/t bread processed Revised 1996 IPCC guidelines, reference manual, p.2.42
8 kg NMVOCs/t bread processed Revised 1996 IPCC guidelines, reference manual, p.2.42
1 kg NMVOCs/t cakes and biscuits processed
Revised 1996 IPCC guidelines, reference manual, p.2.42

Lebanon’s Second Biennial Update Report to the UNFCCC
40
Box 2: Calculation of national emission factor for clinker and a correction factor for cement kiln dust
According to the IPCC Good Practice Guidance and Uncertainty Management, data on calcium oxide (CaO) content of the clinker (CaO_Clinker) is needed in order to generate a national emission factor for tier 2 method as per equation 3.3 p.3.12:
EFclinker = 0.785 x CaO_Clinker
0.785 is the molecular weight ratio of CO2 to CaO in the raw material mineral calcite (CaCO3) from which most or all the CaO in clinker is derived.
The value obtained from the three plants producing cement in Lebanon for CaO content of clinker is: 65%.
Therefore,
EFclinker = 0.785 x 0.65 = 0.51 t CO2/t clinker
Cement Kiln Dust (CKD) is a mix of raw material and clinker that is produced by cement furnaces. It may be partly recycled to the furnace. Good practice is to correct for the CO2 contained in the non-recycled, therefore lost calcined CKD because this CO2 will not be accounted for by the clinker produced. The default CKD correction factor is 1.02 (i.e. add 2% to the CO2 calculated for clinker).
Therefore, the emissions from the cement industries from clinker production as per the tier 2 method will be:
Emissions = clinker production x EFclinker x CKD correction factor
Results
In 2013, total emissions from industrial processes in Lebanon amounted to 2,545.42 Gg of CO2. Greenhouse gas emissions primary entail the CO2 gas from the cement and lime production sectors, with the largest contributor being cement production. Lime production and soda ash use have a very minimal contribution to CO2 emissions in the sector. CH4 and N2O are not emitted from industrial processes. Table 31: CO2 emissions from industrial processes in Lebanon for selected years
Year Total Emissions CO2 (Gg)
Emissions from cement production (Gg)
Emission from lime production (Gg)
Emissions from use of soda ash (Gg)
1994 171.88 155.02 11.85 5.01
2000 1,765 1,631 2 4
2006 2,020 2,012 2 6
2011 2,584 2,578 2 4
2013 2,545 2,539 1.50 4.38
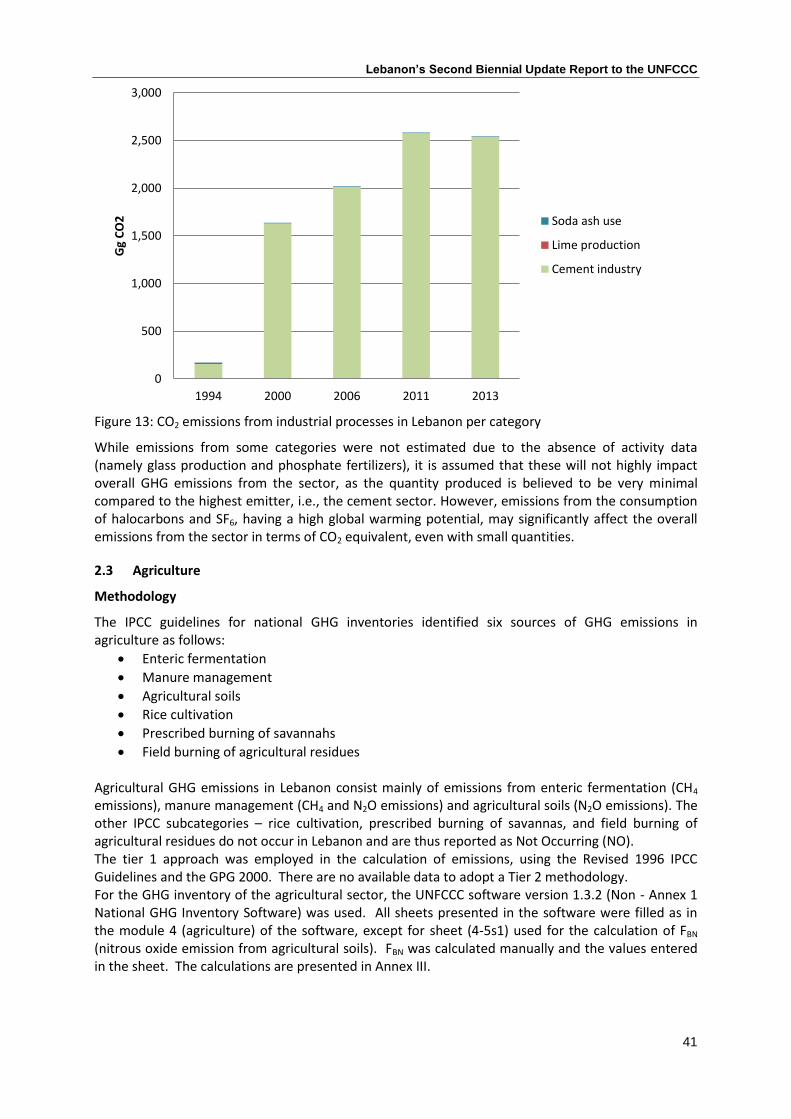
Lebanon’s Second Biennial Update Report to the UNFCCC
41
Figure 13: CO2 emissions from industrial processes in Lebanon per category
While emissions from some categories were not estimated due to the absence of activity data (namely glass production and phosphate fertilizers), it is assumed that these will not highly impact overall GHG emissions from the sector, as the quantity produced is believed to be very minimal compared to the highest emitter, i.e., the cement sector. However, emissions from the consumption of halocarbons and SF6, having a high global warming potential, may significantly affect the overall emissions from the sector in terms of CO2 equivalent, even with small quantities.
Agriculture 2.3
Methodology
The IPCC guidelines for national GHG inventories identified six sources of GHG emissions in agriculture as follows:
Enteric fermentation
Manure management
Agricultural soils
Rice cultivation
Prescribed burning of savannahs
Field burning of agricultural residues Agricultural GHG emissions in Lebanon consist mainly of emissions from enteric fermentation (CH4 emissions), manure management (CH4 and N2O emissions) and agricultural soils (N2O emissions). The other IPCC subcategories – rice cultivation, prescribed burning of savannas, and field burning of agricultural residues do not occur in Lebanon and are thus reported as Not Occurring (NO). The tier 1 approach was employed in the calculation of emissions, using the Revised 1996 IPCC Guidelines and the GPG 2000. There are no available data to adopt a Tier 2 methodology. For the GHG inventory of the agricultural sector, the UNFCCC software version 1.3.2 (Non - Annex 1 National GHG Inventory Software) was used. All sheets presented in the software were filled as in the module 4 (agriculture) of the software, except for sheet (4-5s1) used for the calculation of FBN (nitrous oxide emission from agricultural soils). FBN was calculated manually and the values entered in the sheet. The calculations are presented in Annex III.
0
500
1,000
1,500
2,000
2,500
3,000
1994 2000 2006 2011 2013
Gg
CO
2
Soda ash use
Lime production
Cement industry

Lebanon’s Second Biennial Update Report to the UNFCCC
42
Activity data
In BUR I, activity data of the agriculture sector was mainly derived from the FAO database (FAO Stat), which was the most complete database, with additions from the Lebanese Ministry of Agriculture, the Lebanese Customs, and the Lebanese syndicate of cattle importers. Imported beef had not been included in any national greenhouse inventory before the first BUR, which was considered an improvement in the methodology. Based on lessons learned from the BURI and recommendations from the technical review under the ICA process to: (1) rely on national primary sources rather than secondary sources, (2) enhance sustainable institutional arrangements for data exchange between ministries, and (3) decrease reliance on independent consultants to improve institutional memory and build capacities within national institutions, a different approach for data collection has been adopted for the second BUR. The new approach consists of adopting data available at the MoA, even if incomplete or based on assumptions, and work on the establishment of institutional arrangements for continuous data exchange, which would save significant amounts of resources and time. The data missing from the Ministry of Agriculture was completed by secondary sources or extrapolation. In addition, the MoE and the MoA have initiated a long-term dialogue to understand each other’s needs in terms of data collection and segregation level, in addition to participation in trainings on GHG inventories. Table 32 below summarizes the data sources used for the GHG inventory of the agriculture sector in the second BUR. Table 32: Summary of data sources used in the GHG inventory for the agricultural sector Reporting category and activity data needed
Source used in BUR I Source used in BUR II
Livestock population
Dairy Cattle FAOSTAT under the domain production\Livestock primary\Milk, whole fresh cow\producing animals
Ministry of Agriculture
Non-Dairy Cattle Non-Dairy Cattle Population = Total Cattle population minus Dairy Cattle population.
Total Cattle is the summation of two sources: 1) Total Cattle: Obtained from FAOSTAT under the domain production\Live animals\Cattle\Stock. 2) Imported beef: Local data obtained from Syndicate of Cattle Importers (1997-2012). Values for 1994-1996 were extrapolated.
Ministry of Agriculture – Imported beef was not included due to: 1) lack of records and archives from BUR I on the source and contacts to obtain data on imported beef 2) the exclusion of imported beef from the MoA statistics. Future institutional arrangements will explore the possibility of gathering this data on a sustainable basis.
Sheep, Goats. FAOSTAT under the domain production\live animals\(name of the species)\stock
Ministry of Agriculture
Swine, Camels, Horses, Mules, Asses
FAOSTAT under the domain production\live animals\(name of the species)\stock
FAOSTAT under the domain production\live animals\(name of the species)\stock
Poultry (Laying Hens, Broilers and traditional chicken)
For laying hens and broilers: FAOSTAT under the domain production\livestock primary\”meat poultry > (list)” and “eggs primary >
All data obtained from the Ministry of Agriculture, and broilers were adjusted to 60 days alive using the following

Lebanon’s Second Biennial Update Report to the UNFCCC
43
(list)\producing animals. Broilers were adjusted to 60 days alive. For traditional chicken, data was obtained from Lebanese MOA. However population were missing for 1994-1996, 2006-2007 and 2011-2012. These were obtained through extrapolation and interpolation.
equation: Population = Days alive x (NAPA/365) Where: Days alive= Average number of days for the animal before it is slaughtered NAPA = Number of Animals Produced Annually Detailed calculation of poultry population is presented in Annex III.
Nitrogen Fertilizer Consumption Consumption data was taken from local imports. Data obtained from The Lebanese Customs. Values for 1994-1996 were extrapolated.
2013 data obtained by extrapolation from the available data series from the previous inventory. Data available at the Lebanese customs did not match the data series gathered for the first BUR and no explanation could be obtained. Data not available at the Ministry of Agriculture.
Crop Production
Dry beans, green beans, broad beans, horse beans, chickpeas, lentils, lupins, dry peas, green peas, vetches, barley, maize, oats, sorghum, wheat, carrots and turnips, garlic, onions, potatoes.
FAOSTAT under the domain Production\crops\(name of crop)\production quantity.
FAOSTAT under the domain Production\crops\(name of crop)\production quantity. Data available at the Ministry of Agriculture only until 2009. Crop production values should be reported on dry matter (DM) basis. Therefore all crop production values were multiplied by the appropriate DM fractions.
Alfalfa. Alfalfa production was obtained by multiplying the area harvested by the yield. Area harvested was obtained from FAOSTAT. Yield (40 tonnes Fresh Weight/ha) was obtained from expert judgment.
Alfalfa production was obtained by multiplying the area harvested by the yield. Area harvested was obtained from FAOSTAT, except for the year 2013, estimation was provided by Ministry of Agriculture. Yield (40 tonnes Fresh Weight/ha) was adopted from expert judgment during BUR I.
Manure Management systems Data was obtained though expert judgment and survey of selected dairy, poultry and swine farms (Liban Lait, Dairy Khoury, Hariri Farms, Hawa Chicken, Tanmia, Wilco, Porkys).
Data was adopted from BUR I.
Table 33 to Table 37 present some of the activity data collected for livestock population, fertilizer consumption, crop production and manure management for selected years.
Table 33: Activity Data for livestock population in Lebanon for selected years

Lebanon’s Second Biennial Update Report to the UNFCCC
44
Number of animals (heads)
1994 2000 2006 2011 2013
Dairy Cows 51,620 38,900 43,900 55,000 67,118
Other Cattle 43,480 38,100 33,100 15,000 13,382
Sheep 242,980 354,000 370,400 450,000 450,000
Goats 418,980 417,000 484,400 550,000 550,000
Camels 530 450 440 200 200
Horses 6,810 3,580 3,580 2,634 4,000**
Mules and asses 26,500 19,780 19,780 20,000 20,000
Swine 52,800 26,000 10,000 7,650 5,300*
Poultry 11,790,260 14,491,781 16,972,603 13,363,014 12,705,479
*extrapolation **estimation
Table 34: Fraction of Manure Nitrogen per Manure Management System (MMS) in Lebanon based on expert judgement
Dairy Cows
Other Cattle
Sheep Goats Camels Horses Mules Swine Poultry
Anaerobic Lagoons 0.01
Liquid systems 0.005
Solid storage and drylot 0.955 1 0.33 0.33 0.9
Daily spread 0.01 0.1
Pasture range and paddock 0.02 0.67 0.67 1 1 1 0.04
Poultry manure without bedding
0.19
Poultry manure with bedding 0.77
Table 35: Amount of synthetic fertilizer applied to soil in Lebanon for selected years
1994 2000 2006 2011 2013
Synthetic Fertilizer Applied to Soil NFERT (Kg N/yr)
31,016,000 25,354,000 9,535,000 18,359,000 18,269,111*
*extrapolation
Table 36: Amount of pulses produced in Lebanon for selected years, reported in tonnes on a dry matter basis
Production of pulses (dry) (tonnes) Dry matter
1994 2000 2006 2011 2013
Dry beans 1 (a)
4,726 100 200 743 426
Green beans 0.85 (b)
25,500 39,015 10,795 21,250 20,773
Broad beans, horse beans 1 (a)
1,950 300 300 126 150
Chick peas 1 (a)
9,700 2,200 1,200 3,547 2,435
Alfalfa 0.5 (c)
13,600 15,000 15,000 15,000 10,000

Lebanon’s Second Biennial Update Report to the UNFCCC
45
Lentils 1 (a)
13,000 800 600 1,893 1,471
Lupins 1 (a)
1,170 1,150 450 132 115
Dry peas 1 (a)
1,986 2,450 2,400 2,500 2,495
Green peas 0.85 (b)
10,880 3,740 2,465 3,715 3,476
Vetches 0.9 (d)
4,500 4,725 2,835 648 742.5
Total (dry basis) 87,012 69,480 36,245 49,554.35 42,084.15
(a) Pulses data from FAO are on DM basis; (b) 2000 GPG; Table 4.16; (c) WSU, 2016; (d) 2006 IPCC GL, Table 11.2; (N-Fixing Forages)
Table 37: Amount of non-N fixing crop produced in Lebanon for selected years, reported in tonnes on a dry matter basis
Production (dry) (tonnes) DM 1994 2000 2006 2011 2013
Barley 0.88 (e)
17,762.8 8,272 27,984 26,400 30,800
Maize 0.88 (e)
3,595.68 3,080 2,728 2,640 2,640
Oats 0.88 (e)
448.8 352 211.2 161.04 128.48
Sorghum 0.88 (e)
1,454.64 1,232 756.8 396 440
Wheat 0.88 (e)
46,354 95,128 134,992 110,000 123,200
Carrots and turnips 0.12 (c)
3,914.4 984 696 612.72 456.96
Garlic 0.35 (f)
12,250 3,850 1,085 992.95 668.85
Onions 0.14 (f)
9,910.46 22,064 6300 12,131.98 10,701.18
Potatoes 0.45 (g)
144,795.2 123,750 179,100 123,750 185,400
Total (dry basis) 240485.9 258712 353853 277084.7 354435.5
(c) WSU, 2016; (e) 2006 IPCC GL -Table 11.2; (f) Slovenian NIR; (g) 1996 IPCC GL - reference Manual Table 4.17
Emission factors
Enteric fermentation
Emission factors used for calculation of methane emissions from enteric fermentation are default values from 1996 IPCC GL and reported in Table 38 below. Total CH4 emissions is then the sum of emissions from all animal categories, except poultry as per the guidelines (enteric fermentation in poultry is insignificant). Table 38: Methane emission factors for enteric fermentation. Species CH4 Emission
factor (kg/head/year)
Source
Sheep 5 1996 IPCC GL, reference manual, Table 4.3
Goats 5
Camels 46
Horses 18
Mules and asses 10
Swine 1
Dairy cows 100 1996 IPCC GL, reference manual Table 4.4. Milk production data are

Lebanon’s Second Biennial Update Report to the UNFCCC
46
Other cattle 48 used in estimating an emission factor for enteric fermentation using the Tier 1 method. Average annual milk production for dairy cows in Lebanon is 4,200 kg/head/yr (comparable to Western Europe).
Manure management
Methane (CH4) Table 39 below shows the emission factors used for calculating methane emission from manure management. In addition to the livestock populations used for calculating methane emission from enteric fermentation, poultry populations were also included for estimating methane emissions from manure management. For cattle and swine, emission factors suitable for Eastern Europe were chosen as they better reflect the conditions for manure management in Lebanon (i.e. solid based systems are used for the majority of manure). For the other species shown in Table 39, emission factors for temperate regions were chosen from the default factors proposed by the 1996 IPCC guidelines. Indeed, in the Reference Manual, Table 4-1, three climate regions are defined in terms of annual average temperature: cool (<15°C), temperate (15°C - 25°C), and warm (>25°C). Livestock population in Lebanon all fall within the temperate region. Table 39: Methane emission factors for manure management. Species EF (kg/head/year) Source
Sheep 0.16 1996 IPCC GL, reference manual, Table 4-5 (Temperate regions)
Goats 0.17
Camels 1.9
Horses 1.6
Mules and asses 0.9
Poultry 0.018
Dairy cattle 19 1996 IPCC GL, reference manual, Table 4-5 (Eastern Europe)
Other cattle 13
Swine 7
Nitrous Oxide (N2O)
The amount of N2O emitted from manure management is estimated using the IPCC Tier 1 approach where the total amount of Nitrogen excretion (from all livestock species/categories) in each type of Manure Management System (MMS) is multiplied by an emission factor for that type of MMS. In the absence of country-specific emission factors, the IPCC default nitrogen excretion rates (Nex) and emission factors were used. Table 40 and Table 41 provide the nitrogen excretion rates for animal species Nex and emission factors used for each type of MMS. Fraction of manure managed in each MMS was determined using surveys of major dairy, non-dairy, swine, and poultry farms as well as expert judgment from academic experts.
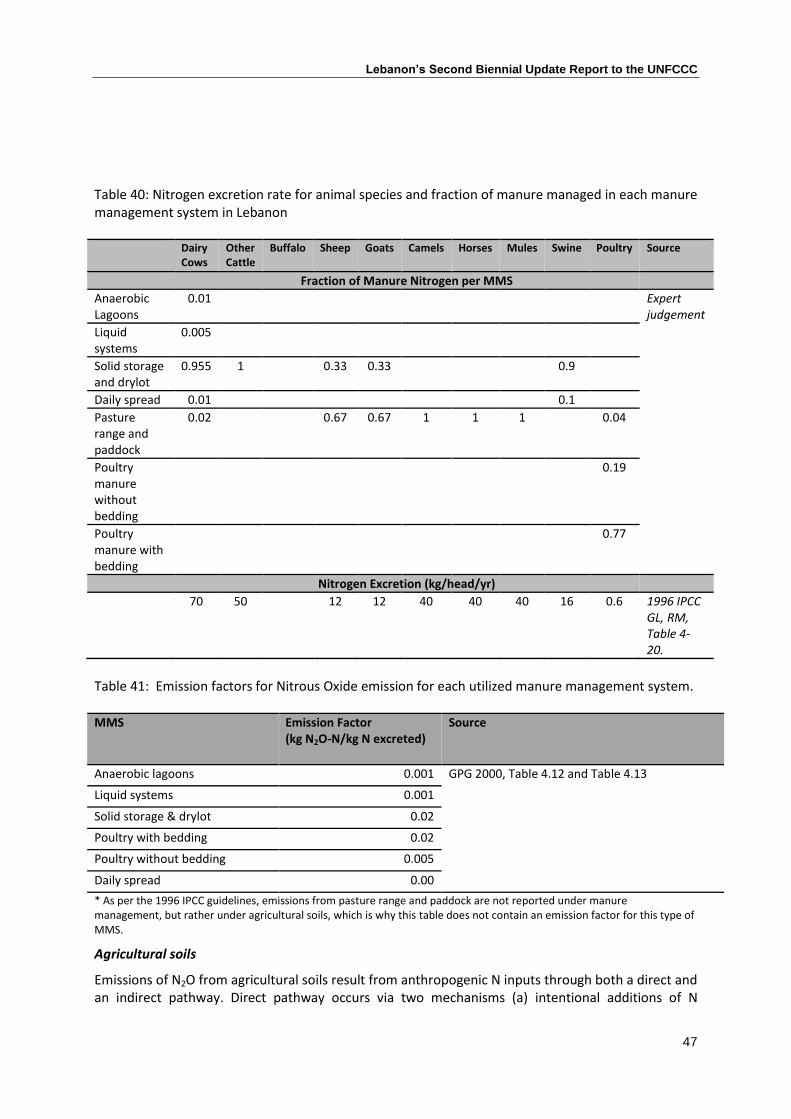
Lebanon’s Second Biennial Update Report to the UNFCCC
47
Table 40: Nitrogen excretion rate for animal species and fraction of manure managed in each manure management system in Lebanon Dairy
Cows Other Cattle
Buffalo Sheep Goats Camels Horses Mules Swine Poultry Source
Fraction of Manure Nitrogen per MMS
Anaerobic Lagoons
0.01 Expert judgement
Liquid systems
0.005
Solid storage and drylot
0.955 1 0.33 0.33 0.9
Daily spread 0.01 0.1
Pasture range and paddock
0.02 0.67 0.67 1 1 1 0.04
Poultry manure without bedding
0.19
Poultry manure with bedding
0.77
Nitrogen Excretion (kg/head/yr)
70 50 12 12 40 40 40 16 0.6 1996 IPCC GL, RM, Table 4-20.
Table 41: Emission factors for Nitrous Oxide emission for each utilized manure management system. MMS Emission Factor
(kg N2O-N/kg N excreted) Source
Anaerobic lagoons 0.001 GPG 2000, Table 4.12 and Table 4.13
Liquid systems 0.001
Solid storage & drylot 0.02
Poultry with bedding 0.02
Poultry without bedding 0.005
Daily spread 0.00
* As per the 1996 IPCC guidelines, emissions from pasture range and paddock are not reported under manure management, but rather under agricultural soils, which is why this table does not contain an emission factor for this type of MMS.
Agricultural soils
Emissions of N2O from agricultural soils result from anthropogenic N inputs through both a direct and an indirect pathway. Direct pathway occurs via two mechanisms (a) intentional additions of N

Lebanon’s Second Biennial Update Report to the UNFCCC
48
directly to soils through synthetic fertilizers, nitrogen fixation by N-fixing crops, animal manure, and crop residues and (b) unintentional additions of N through animals grazing on pasture, ranges, and paddocks (PRP). Indirect N2O emissions occur through two pathways – volatilization from applied fertilizer and manure as NH3 and NOx and subsequent deposition, and through leaching and runoff of applied fertilizer and animal manure.
Direct Nitrous Oxide emissions FSN: Nitrogen from Synthetic Fertilizer FSN is annual amount of synthetic fertilizer nitrogen added to soil, adjusted for NH3 and NOx volatilization.
Table 42: Factors used for the calculation of nitrogen from synthetic fertilizer
Fraction of Synthetic Fertilizer Applied Emitted as NOx and NH3
FracGASF
0.1 1996 IPCC GL, Reference Manual, Table 4-24
Emission factor for direct emissions (kg N2O-N/kg N)
0.0125 1996 IPCC GL, Reference Manual, Table 4 -18
FAW: Nitrogen from Animal Manure FAW is annual amount of animal manure nitrogen adjusted for (a) NH3 and NOx volatilization, (b) for manure dropped on soil from animal grazing (PRP), and (c) for fraction of manure N burned (i.e. used as fuel, assumed zero). In order to avoid double counting, N-inputs from animals on pasture, range, and paddock (PRP) is subtracted from nitrogen additions from animal manure (FAW) and added separately as direct N2O emissions from Pasture, Range, and Paddock.
Table 43: Factors used for the calculation of nitrogen from animal manure
Fraction of Nitrogen excreted during grazing (FracPRP)
0.2-0.34
FracPRP was calculated as the ratio of the amount of nitrogen excreted during grazing (PRP) to the total nitrogen excreted from all MMS.
Appropriate cells on worksheet:
4-1s2 A24/ 4-1s2 A27
Fraction of Nitrogen excreted emitted as NOx and NH3
0.2 1996 IPCC GL, Reference Manual, Table 4-19
Emission factor for direct emissions (kg N2O-N/kg N)
0.0125 1996 IPCC GL, Reference Manual, Table 4 -18
Emission Factor for AWMS (kg N2O – N/kg N) 0.02 GPG 2000, Table 4.12
FBN: N fixed by Crops FBN is the annual amount of nitrogen added to soil through the process of nitrogen fixation by N-fixing crops cultivated annually. Nitrogen fixing crops include pulses (dry beans, broad beans, peas, chickpeas, and lentils), leguminous crops (green peas and green beans) and N fixing forages (alfalfa and vetch). FBN is manually calculated using Tier 1a method (Equation 4.25; 2000 GPG): FBN = 2 x CropBF x FracNCRBF
Where CropBF = Yield of Pulses and leguminous vegetables (kg dry Matter/year, refer to Table 36) FracNCRBF = Fraction of biomass that is nitrogen (0.03, default value: 1996 IPCC GL, Reference Manual, Table 4.19)

Lebanon’s Second Biennial Update Report to the UNFCCC
49
As per IPCC recommendations, crop production values for N-fixing crops are all reported on dry matter (DM) basis. Therefore, all crop production values were multiplied by the appropriate DM fractions (see AnnexI V for detailed calculations of FBN). The factor 2 converts the edible portion of the crop (which is reflected in the production data) to total crop biomass. The emission factor for direct emissions (0.0125 kg N2O-N/kg N) also applies for the calculation of nitrogen fixed by crops. FCR: Nitrogen from crop residues Nitrogen returned to soil from crop residues left to decompose in the field.
Table 44: Factors used for the calculation of nitrogen from crop residues
Fraction of nitrogen in N fixing crops 0.03 1996 IPCC GL, Reference Manual, Table 4.19
Fraction of nitrogen in non N fixing crops 0.010
Fraction of crop residue burned FracBURN 0 Experts judgement
Average of fraction of residue removed from field for N fixing and non N fixing crops FracR 0.66
Experts judgement (LARI) for FracR of each crop. We calculated the average
Emission factor for direct emissions (kg N2O-N/kg N) 0.0125 1996 IPCC GL, Reference Manual, Table 4 -18
Indirect Nitrous Oxide emissions Indirect N2O emission from nitrogen added to agricultural soils are based on two sources. These are: volatilization and subsequent atmospheric deposition of NH3 and NOx from the application of fertilizers and animal manure, and leaching and runoff of the nitrogen that is applied to or deposited on soils. Note: Emissions of N2O produced from the discharge of human sewage into rivers are reported under the waste sector. Table 45: Fractions and emission factors used for calculating indirect emissions from agricultural soils Fraction of total manure N excreted that volatizes FracGASM kg NH3-N + NOx -N volatilized/kg of N excreted by livestock
0.2 1996 IPCC GL, Reference Manual, Table 4-19
Fraction of synthetic fertilizer N applied that volatizes FracGASF kg NH3-N + NOx -N volatilized/ kg of fertilizer N applied
0.1 1996 IPCC GL, Reference Manual, Table 4-24
Fraction of N that leaches FracLEACH kg N leached /kg of fertilizer or manure N applied
0.3 1996 IPCC GL, Reference Manual, Table 4-24
Emission Factor for atmospheric deposition of NH3 and NOx (EF4) (kg N2O – N/kg N)
0.01 1996 IPCC GL, Reference Manual, Table 4-23
Emission factor for leaching (EF5) (kg N2O – N/kg N) 0.025
1996 IPCC GL, Reference Manual, Table 4-23

Lebanon’s Second Biennial Update Report to the UNFCCC
50
Results
In 2013, total GHG emissions from the agricultural sector were 987.55 Gg CO2eq, constituting 4% of total national emissions. Nitrous oxide (N2O) emissions from agricultural soils (511.5 Gg CO2eq..) represented over half of emissions from agriculture, CH4 emissions from enteric fermentation were 265.61 Gg CO2eq., and N2O and CH4 emissions from manure management 210.4 Gg CO2eq. Most of the emissions from manure management were due to N2O emissions as opposed to CH4. The summary of methane (CH4) emissions from enteric fermentation and manure management and nitrous oxide (N2O) emissions from manure management and agricultural soils are presented in Table 46 below. Table 46: GHG emissions for the agriculture sector for selected years
Year 1994 2000 2006 2011 2013
Enteric fermentation (Gg CH4) 11.02 9.88 10.55 11.48 12.64
Enteric fermentation (Gg CO2eq.) 231.42 207.48 221.55 241.06 265.44
Manure management (Gg CH4) 2.27 1.83 1.80 1.72 1.91
Manure management (Gg CO2eq.) 47.67 38.43 37.80 36.20 40.11
Total Gg CH4 13.29 11.71 12.35 13.21 14.55
Manure management (Gg N2O) 0.46 0.47 0.52 0.53 0.55
Manure management (Gg CO2eq.) 141.05 145.70 161.20 164.3 170.50
Agricultural soils (Gg N2O) 1.99 1.75 1.29 1.62 1.65
Agricultural soils (Gg CO2eq.) 615.35 542.50 399.90 502.20 511.50
Total Gg N2O 2.44 2.22 1.81 2.15 2.20
Total emissions from agriculture (Gg CO2eq.) 1,035.49 934.11 820.45 943.87 987.55
The main source of emissions across the years is N2O from agricultural soils, which constitute over half of total agricultural emissions, while the remaining sources of emissions are almost equally from enteric fermentation (CH4) and from manure management (CH4 and N2O) (Figure 14).
Figure 14: GHG emissions by agricultural source (Gg) and contribution (% of total from agriculture)
231.42 207.48 221.55 241.06 265.44
188.72 184.13 199 200.5 210.61
615.35 542.5 399.9 502.2 511.5
0%
10%
20%
30%
40%
50%
60%
70%
80%
90%
100%
1994 2000 2006 2011 2013
Gg
CO
2e
q.
Enteric fermentation Manure management Agricultural soils

Lebanon’s Second Biennial Update Report to the UNFCCC
51
Enteric fermentation
Enteric fermentation is a major source of emissions within the agricultural sector. In 2013, it constituted 265.44 Gg CO2eq., compared to 241.16 Gg CO2eq. in 2011 and 221.55 Gg CO2eq. in 2006. Dairy cattle are the main methane emission source for enteric fermentation, followed by sheep and goats (Table 47).
Table 47: Methane emissions from enteric fermentation for selected years
Species 1994 2000 2006 2011 2013
Dairy Cattle CH4 (Gg) 5.16 3.89 4.39 5.50 6.71
Non-Dairy Cattle CH4 (Gg) 2.08 1.82 1.58 0.72 0.64
Sheep CH4 (Gg) 1.21 1.77 1.85 2.25 2.25
Goats CH4 (Gg) 2.09 2.08 2.42 2.75 2.75
Camels CH4 (Gg) 0.024 0.02 0.020 0.0092 0.0092
Horses CH4 (Gg) 0.12 0.064 0.064 0.0047 0.072
Mules and Asses CH4 (Gg) 0.26 0.197 0.197 0.20 0.2
Swine CH4 (Gg) 0.052 0.026 0.010 0.0076 0.0053
Poultry CH4 (Gg) 0.00 0.00 0.00 0.00 0.00
Total CH4 (Gg) 11.02 9.88 10.55 11.48 12.64
Total CO2eq. (Gg) 231.42 207.48 221.55 241.16 265.44
Manure management
In 2013, dairy cattle were also the largest contributor to CH4 emissions from manure management (67%). They are followed by non-dairy cattle (9%) and poultry (12%) (Figure 15).
Dairy Cattle 67% Non-Dairy Cattle
9%
Sheep 4%
Goats 5%
Mules and Asses 1%
Swine 2% Poultry
12%
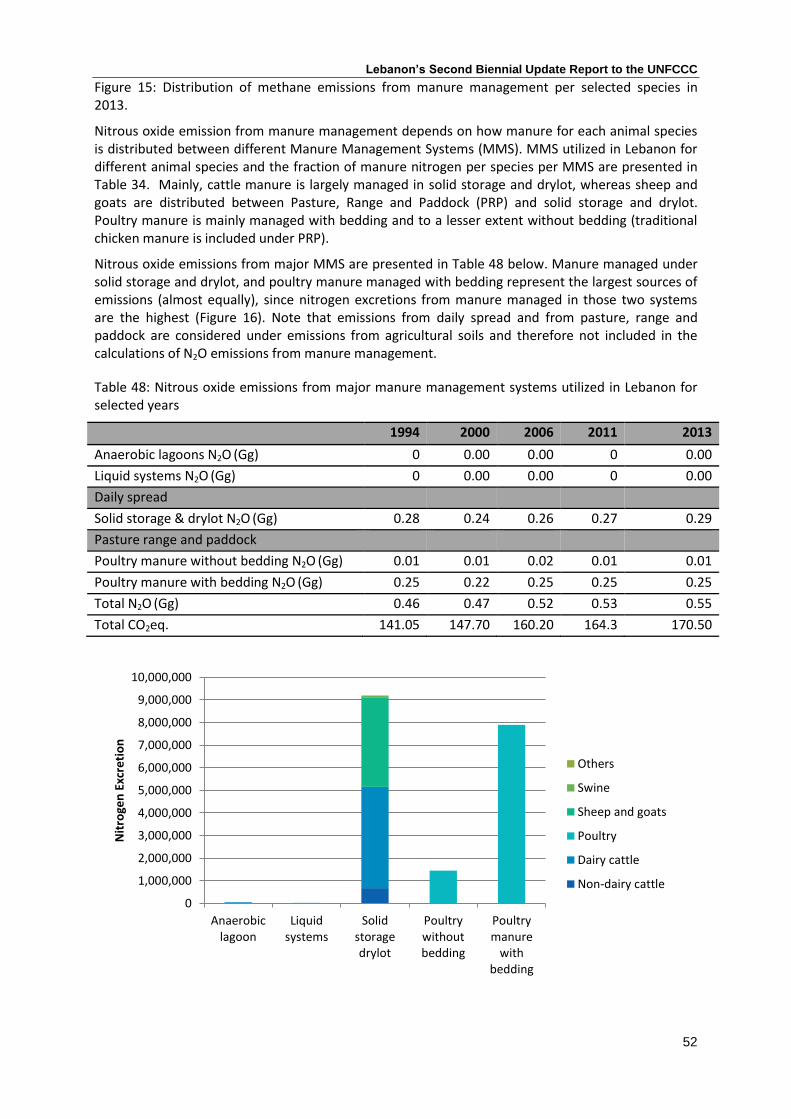
Lebanon’s Second Biennial Update Report to the UNFCCC
52
Figure 15: Distribution of methane emissions from manure management per selected species in 2013.
Nitrous oxide emission from manure management depends on how manure for each animal species is distributed between different Manure Management Systems (MMS). MMS utilized in Lebanon for different animal species and the fraction of manure nitrogen per species per MMS are presented in Table 34. Mainly, cattle manure is largely managed in solid storage and drylot, whereas sheep and goats are distributed between Pasture, Range and Paddock (PRP) and solid storage and drylot. Poultry manure is mainly managed with bedding and to a lesser extent without bedding (traditional chicken manure is included under PRP).
Nitrous oxide emissions from major MMS are presented in Table 48 below. Manure managed under solid storage and drylot, and poultry manure managed with bedding represent the largest sources of emissions (almost equally), since nitrogen excretions from manure managed in those two systems are the highest (Figure 16). Note that emissions from daily spread and from pasture, range and paddock are considered under emissions from agricultural soils and therefore not included in the calculations of N2O emissions from manure management.
Table 48: Nitrous oxide emissions from major manure management systems utilized in Lebanon for selected years
1994 2000 2006 2011 2013
Anaerobic lagoons N2O (Gg) 0 0.00 0.00 0 0.00
Liquid systems N2O (Gg) 0 0.00 0.00 0 0.00
Daily spread
Solid storage & drylot N2O (Gg) 0.28 0.24 0.26 0.27 0.29
Pasture range and paddock
Poultry manure without bedding N2O (Gg) 0.01 0.01 0.02 0.01 0.01
Poultry manure with bedding N2O (Gg) 0.25 0.22 0.25 0.25 0.25
Total N2O (Gg) 0.46 0.47 0.52 0.53 0.55
Total CO2eq. 141.05 147.70 160.20 164.3 170.50
0
1,000,000
2,000,000
3,000,000
4,000,000
5,000,000
6,000,000
7,000,000
8,000,000
9,000,000
10,000,000
Anaerobiclagoon
Liquidsystems
Solidstoragedrylot
Poultrywithoutbedding
Poultrymanure
withbedding
Nit
roge
n E
xcre
tio
n
Others
Swine
Sheep and goats
Poultry
Dairy cattle
Non-dairy cattle

Lebanon’s Second Biennial Update Report to the UNFCCC
53
Figure 16: Amount of nitrogen (kg N/year) excreted from animals in different manure management systems in Lebanon in 2013
Agricultural soils
In 2013, 40% of total N2O emissions from soils were due to indirect emissions, while direct emissions were 42%, and emissions from grazing (PRP) were 18%. Shares of subcategories from agricultural soils emissions remain fairly stable over the years as shown in Table 49. Figure 17 further disaggregates direct and indirect emissions into their subcategories for the year 2013. Leaching constitutes a much larger fraction (90%) than atmospheric deposition (10%). Leached nitrogen enters the groundwater, riparian areas, and rivers where it enhances biogenic production of N2O. Emissions from this category are therefore directly linked to the use of N fertilizers, and they will vary accordingly. On the other hand, fertilizer use and animal waste are the main sources of direct emissions.
Table 49: Total emissions from agricultural soils and its subcategories in Lebanon for selected years
Year Total direct emissions
Total indirect emissions
Emissions from animal grazing
Total N2O emissions from soils
Total N2O emissions from soils
Gg N2O % total Gg N2O % total Gg N2O % total Gg N2O Gg CO2eq
1994 0.98 49 0.79 40 0.22 11 1.99 615.35
2000 0.81 46 0.70 40 0.24 14 1.75 542.50
2006 0.51 40 0.52 40 0.26 20 1.29 399.90
2011 0.68 42 0.65 40 0.29 18 1.62 502.20
2013 0.69 42 0.66 40 0.30 18 1.65 511.50
Direct 42%
Indirect 40%
Animal grazing
18%
Volatized 10%
Leached 90%
Synthetic fertiliser
(FSN) 47%
Animal waste (FAW)
37%
N-fixing crops (FBN)
6%
Crop residue (FCR)
10%

Lebanon’s Second Biennial Update Report to the UNFCCC
54
Figure 17: Contribution of subcategories to direct and indirect emissions from agricultural soils in 2013
Land use, land use change and forestry 2.4
Methodology and activity data Selection of the appropriate tier level for the land categories and subcategories, non-CO2 gases and carbon pools, was mostly based on the resources available for the inventory process. The representation of most land-use areas and land conversions was done following the Approach 3 which is a Tier 3 level methodology used in the selection of activity data. The top-level land categories which were considered in the change detection mapping were forest land, cropland, grassland, wetlands, settlements and other land. The definitions for these categories according to the National classification system based on the Land Cover / Land Use map of 1998 are listed in Annex IV. Initial collection and calculation of the activity data (Annex IV) was conducted following three methodologies depending on the availability and type of country-specific data:
Approach 3 within Intergovernmental Panel Climate Change Good Practice Guidance
Surveys and personal communications
Interpolations and extrapolation The abbreviations FF, GG, CC, WW, SS, OO denoted land-use categories undergoing no conversions; and the abbreviations LF, LG, LC, LW, LS, LO denoted land conversions to these land-use categories (Annex IV). Overall, land categories and subcategories were accounted for in the inventory estimation depending on data availability. Table 50: Land use categories and subcategories, carbon pools and non-CO2 gases accounted for in the inventory estimation of the LULUCF sector in Lebanon
Land use categories
Subcategories Estimations calculated1
Not Estimated (NE)/No activity data available
Assumptions
Forest land
Forest land remaining forest land
Estimated - -
Land converted to Forest land
Other land converted to Forest land through afforestation/ plantations
Grassland and Cropland converted to Forest land
No Settlements converted to Forest land
Cropland
Cropland remaining Cropland
Estimated
Land converted to cropland
-
Forest land, Grassland and Other land converted to Cropland
No Settlements converted to Cropland
Grassland
Grassland remaining Grassland
Estimated - -
Land converted to Grassland
Cropland, Forest land and Other land converted to
No Settlements converted to Grassland

Lebanon’s Second Biennial Update Report to the UNFCCC
55
Land use categories
Subcategories Estimations calculated1
Not Estimated (NE)/No activity data available
Assumptions
Grassland
Wetland
Wetland remaining Wetland
- - Estimations not required for calculation2
Land converted to Wetland
Grassland converted to Wetland
-
No Cropland, Forest land, Settlements or Other lands that are converted to Wetlands
Settlement
Settlements remaining Settlement
Estimations not required for calculation2
Land converted to Settlements
Forest land, Grassland and Cropland converted to Settlements
Other land converted to Settlements
-
Other land
Other land remaining Other land
- -
Typically unmanaged in reference to GPG (IPCC, 2003-p.3.145)
Land converted to Other land
-
Forest land, Grassland and Cropland converted to Other land
No Settlements converted to Other land
1 Estimations are calculated for the following carbon pools and non-CO2 gases depending on data availability: AGB, BGB, DOM, litter and soil carbon; CH4, N2O, CO and NOx 2 Lebanon is considered as non-Annex I Party in the UNFCCC convention. GHG emissions and removals reported from the LULUCF sector in Lebanon are respectively caused by biomass losses and increments and by variation in soil carbon stocks from the different land use and land use change categories which were taken into consideration in this work (Table 51).
Table 51: Causes of GHG emissions and removals reported for the LULUCF sector in Lebanon
Biomass losses Biomass increments Increase in soil carbon stocks and litter
Forest converted to settlement Growth of forest lands Growth of croplands (Perennial crops) Growth of lands converted to forests or plantations (Afforestation)
Afforestation
Grassland converted to settlement
Cropland converted to settlement
Burned forest lands
Burned croplands (perennial crops)
Burned grasslands
Fuelwood gathering from forests
Almost all burned areas in Lebanon have resulted from human-caused fires. It is not easily possible to have natural causes of fires such as lightning due to the coincidence of lightning with the start of the wet season.

Lebanon’s Second Biennial Update Report to the UNFCCC
56
Emission factors and other parameters
Collection of the Emission/Removal (E/R) factors was done following two methodologies according to the availability and type of data:
Tier 1: IPCC GPG default data or assumptions
Tier 2: Country-specific data from global databases, literature or surveys, and personal communications
A complete list of the E/R factors investigated and reported in reporting tables for the calculation of GHG emissions and removals from 1994-2013 is provided in Annex IV. E/R factors were collected or calculated (by averages and extrapolations) for each category depending on the disaggregation level required by the GHG emission/removal calculation method and depending on the data availability. Detailed calculations, values and sources of all the E/R factors are reported and documented in the UNFCCC reporting tables. Results
In 2013, LULUCF acted as a greenhouse gas sink in Lebanon, with net removals equal to -3,368.86Gg CO2 (Table 52). Indeed, Lebanon’s wide forest cover still represents a significant CO2 sink, although a downward trend in sink capacities have been observed in recent years due to deforestation, forest fires and most importantly, urbanization. Table 52: Lebanon’s GHG emissions/removals summary from the LULUCF sector for 2013
CO2 emissions
Gg
CO2
removals Gg
CH4 emissions
Gg
N2O emissions
Gg
Total emissions Gg CO2 eq.
Land use, land use change and forestry 149.67 -3,518.80 0.01094 0.00014 -3,368.86
A. Forest land 0.00 -2,296.94 0.01066 0.00013 -2,296.67
1. Forest land remaining forest land -2,210.73 -2210.73
2. land converted to forest land -86.21 -86.21
B. Cropland 0.00 -1,221.86 0.00 0.00 -1,221.86
1. Cropland remaining cropland -1,221.86 -1,221.86
2. Land converted to cropland 0.00
C. Grassland 0.00 0.00028 0.00001 0.00 0.01
1. Grassland remaining grassland 0.00028
0.00001 0.00
2. Land converted to grassland 0.00
D. Wetlands 0.04 0.00 0.00 0.00 0.04
1. Wetlands remaining wetlands 0.00
2. Land converted to wetlands 0.04 0.01
E. Settlements 149.63 0.00 0.00 0.00 149.63
1. Settlements remaining settlements
2. Land converted to settlements 149.63 149.63
F. Other land 0.00 0.00 0.00 0.00 0.00
1. Other land remaining other land
2. Land converted to other land
Results reflect calculations of emissions from LULUCF based on 2003 GPG for LULUCF.

Lebanon’s Second Biennial Update Report to the UNFCCC
57
Numbers may reflect rounding.
The main categories that are contributing significantly to the emissions/removals in LULUCF are the conversion from forest land, crop land and grassland to settlements. These are mainly driven by the following factors:
- Unregulated urban sprawl
- Active market of the real estate sector
- Absence of clear zoning
- Expansion and improvement of the road networks in rural areas
- Improvement of public and private services in rural areas
- Lack of interest of owners of cropland, forest land and grassland in keeping such type of lands
due to increase in land prices and increase demand for commercial and residential
development projects
- High costs of labors to maintain croplands
- Lack of a market for the agricultural products
- Degrading financial situation of citizens (selling agricultural lands and grasslands which are
eventually converted to urbanized areas)
It is important to note, however, that the reported numbers of annual conversion to settlement
accounted only for the annual sum of any conversion that is above 90 to 100 m2. This was mainly
due to the spatial resolution of the employed satellite imagery. Counting the changes that are
below 90 m2 can slightly increase the total areas of conversion to settlement.
Table 53: Changes in emissions/removals in 2013
Type of change Change in area (ha) CO2 emissions/removals (Gg)
Forest to settlements
Coniferous 48.62 +11.94
Broadleaf 258.75 +57.87
Mixed 49.56 +11.63
Cropland to settlements
Perennial 265.25 +61.27
Annual 329.37 +6.04
Grassland to settlements 296.687 +0.87
Fuelwood gathering (m3) 18,769 m
3 +26.8
Forest land remaining forest land (difference between 2012 and 2013) -356.94
+3.15
Afforestation (Cumulative) 3,597.56 -86.20
Further observations showed that broadleaf forests were the most affected by land conversion to settlements. This was mainly the result of the relatively large extent of broadleaf forests in the country and the fact that urbanization most likely occurs more on shrubland (mostly broadleaf vegetation) than on forested areas. Conversions to settlements have also affected croplands and grasslands. It is easier, however, to convert annual crops than removing perennial crops (mainly comprising fruit trees and orchards). Conversions of cropland and grassland to settlements might be related to the lack of interest of owners in keeping such type of lands (e.g. increase in land prices related to an increasing number of population, increasing demand for development projects), high costs of labors and lack of a market for the agricultural products, and degrading financial situation of citizens (selling agricultural lands and grasslands which were eventually converted to urbanized areas). This has been at least confirmed for artificialized cropland on the Lebanese coast.

Lebanon’s Second Biennial Update Report to the UNFCCC
58
The total estimate for fuelwood gathering in 2013 was 18,769 m3, a quite constant number over the inventory time period resulting in an average CO2 emission of about 27 Gg/yr. Moreover, a decrease of 0.14% in forest lands from 2012 was shown in 2013, which is was mainly attributed to urbanization resulting in a decrease in CO2 removals from forest areas by 12.1 Gg. Afforestation activities in 2013 covered a total area of 302.62 ha of forests leading to a cumulative increase in CO2
removal of 86.20 Gg in 2013. The main source of GHG emissions in 2013 was wildfires affecting forest land, cropland and grassland, with forest lands being the main target of these fires (Table 54). Table 54: Emissions from burned areas in 2013
Type Burned areas (ha) CO2 emissions (Gg) CH4 emissions (Gg) N2O emissions (Gg)
Forest
Coniferous 4.75 +0.68
+0.01066 +0.00013 Broadleaf 44.25 +5.79
Mixed 78.56 +10.78
Cropland1
Annual NE NE NE NE
Perennial 9.56 +2.20 NE NE
Grassland2 37.88 NE +0.00028 +0.00001
1CH4 and N2O emissions from croplands are not accounted for in the GPG for LULUCF since the source of these types of emissions are
mainly agricultural activities (fertilization, livestock, burning, etc.). These are included in the agricultural sector. 2CO2 emissions from burned grasslands are not accounted for in Tier 1 of the IPCC GPG for LULUCF, since it is assumed that there is a
balance in biomass stocks of grasslands. Burned lands are only calculated for perennial crops.
In 2013, forests followed by croplands had the largest contribution to CO2 emissions/removals in the LULUCF sector in Lebanon (Figure 18).
Figure 18: CO2 emissions/removals by category in 2013.
Table 55 shows for selected years a summary of the total CO2 and non-CO2 emissions/removals in Gg CO2 equivalent from the LULUCF sector.

Lebanon’s Second Biennial Update Report to the UNFCCC
59
Table 55: Lebanon’s GHG emissions/removals summary from the LULUCF sector for the period 1994-2013 (for selected years)
GHG emissions/removals of the LULUCF sector 1994
* 2000 2005 2010
2013
CO2 (Gg) -3450.84 -3221.29 -3303.30 -3218.00 -3369.12
CH4 (Gg) NE 0.03 0.04 0.04 0.01094
CH4 (Gg CO2 eq.) NE 0.57 0.74 0.81 0.22974
N2O (Gg) NE 0.00 0.00 0.00 0.00014
N2O (Gg CO2 eq.) NE 0.11 0.14 0.16 0.0434
NOx (Gg) NE 0.00 0.00 0.01 0.00149
CO (Gg) NE 0.41 0.52 0.59 0.16316
Total emissions (Gg CO2 eq.)
NE
0.68 0.88 0.97 0.2731
Total removals (Gg CO2) -3450.84 -3221.29 -3303.30 -3218.00 -3369.12
Net GHG removals (Gg CO2 eq.)
-3450.84 -3220.61 -3302.42 -3217.03 -3368.85
*NE: Not Estimated. No activity data about burned areas from 1994-1998 resulting in no data about total emissions during
this period.
Waste and wastewater 2.5
Methodology
According to the IPCC guidelines, the source category “waste” covers emission from disposal and discharge of both solid waste and wastewater, while differentiating between the various management options. The fundamental basis for the inventory methodology rests upon three assumptions:
1. The flux of methane (CH4) to the atmosphere is assumed to be equal to the sum of emissions from solid waste disposal sites and wastewater treatment, and emissions from waste incineration (considered to be negligible).
2. The flux of nitrous oxide (N2O) to the atmosphere is assumed to be equal to the sum of emissions from wastewater treatment and emissions from waste incineration.
3. Carbon dioxide (CO2) can be estimated by first establishing the rates of organic content in waste incinerated.
Based on the availability and level of aggregation of the information on waste and wastewater characteristics in Lebanon, the tier 1 method was adopted for the emissions calculations.
Activity data –Solid waste
Data on solid waste generation is not readily available and where available, information is disaggregated (by site, operator, local authority, etc.), decentralized and often reported in hard copy reports making any manipulation and analysis time consuming and difficult. Furthermore, solid waste amounts are generally estimated based on population and generation rate per capita estimations and not on direct weighing and monitoring of collected solid waste from households and institutions. Surveys and assessment conducted for the years 1994 (El Fadel and Sbayti, 2000), 2006 (CDR, 2006), and 2010 (MoE, 2010) produced generation rates for these respective years. Due to the increased

Lebanon’s Second Biennial Update Report to the UNFCCC
60
migration from rural to urban areas and major cities during the past 20 years, a significant increase in the quantity of waste in Beirut and Mount Lebanon (excluding Jbeil Caza which is served by a private waste collection operator) took place over the last years. The estimated quantities of municipal solid waste generated within the Greater Beirut Area and Mount Lebanon in year 2013 was estimated to be 2,850 tonnes/day, compared to 2000 tons/day back in year 1999 (SWEEP-net, 2014). The data collection for this GHG inventory (was conducted using several references and studies that helped retrieving basic information to start building up the model. This information was mainly based on population statistics, waste statistics, review of literature made available through national reports and publications and personal communication. In addition, expert consultation meetings were held in order to validate assumptions and findings. Extrapolations and interpolations were used when data was unavailable. Table 56: Activity data for solid waste emissions calculations
Population
Population includes: - Lebanese residents in 2013 was extrapolated from published surveys from CAS
for the years 1997, 2004 and 2010 - Foreign workers (Approx. 840,000 in 2013) as per CAS - Palestinian refugees (calculated as 441,000 in 2013) as per the United Nations
Relief and Works Agency - Syrian displaced starting 2012 were retrieved from official yearly publicationsby
the UNHCR (UNHCR, 2013) Interpolation and extrapolation were performed using a growth rate of 1.65% as commonly used in studies for World Bank (World Bank, 2011; SWEEP-Net, 2010).
Per capita waste generation rate
The generation rate for the Lebanese population, including foreign workers and Palestinian refugees, was extrapolated based on publications issued for the years 1994 (El Fadel and Sbayti, 2000), 2006 (CDR, 2006), and 2010 (MoE, 2010). For other years, rates were calculated by extrapolation and interpolation. The generation rate used for Syrian displaced was adapted from Lebanon Environmental Assessment of the Syrian Conflict. The waste generation rate for the Lebanese population (including foreign workers and Palestinian refugees) is 1.05. The rate for Syrian displaced varies between 0.47 for the bekaa region, 0.5 for the south, 0.51 for the north and 0.53 for Beirut and Mount Lebanon (MoE/EU/UNDP, 2014).
Municipal solid waste generation
Waste generation for the years 1994 through 2013 was calculated based on the “per capita waste generation rate” (tonnes/capita/year) and the population (capita and refugees) for each year respectively.
Municipal solid waste disposed in Solid Waste Disposal Sites (SWDS)
4 “managed” Solid Waste Disposal Sites (SWDS) are considered in Lebanon: Naameh ,Zahle ,Tripoli and as of 2013, Saida. 3 other landfills in Minieh, Nabatieh and Baalbeck have partially received waste during 2013, 2014 and 2015. Information on the waste quantities landfilled/dumped in these sites was retrieved from the managing entities of these landfills: LACECO reports for the Naameh Landfill, Moores for the Zahle landfill, BATCO for Tripoli landfill, Sidon Environmental for Saida and OMSAR for Minieh, Baalbeck and Nabatieh. Waste quantities generated by Syrian displaced were adapted from Lebanon Environmental Assessment of the Syrian Conflict (MoE/EU/UNDP, 2014).
Open dumpsites In 2011, a detailed survey was conducted on dumpsites in Lebanon (MoE, UNDP, ELARD,
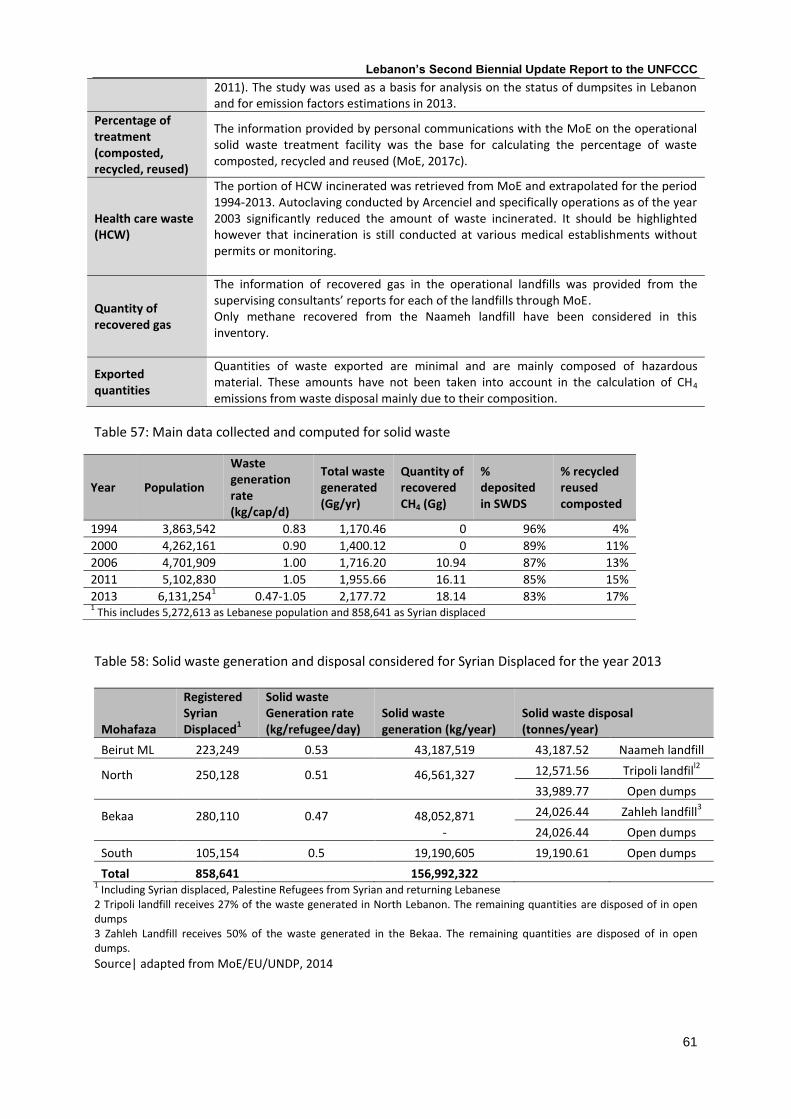
Lebanon’s Second Biennial Update Report to the UNFCCC
61
2011). The study was used as a basis for analysis on the status of dumpsites in Lebanon and for emission factors estimations in 2013.
Percentage of treatment (composted, recycled, reused)
The information provided by personal communications with the MoE on the operational solid waste treatment facility was the base for calculating the percentage of waste composted, recycled and reused (MoE, 2017c).
Health care waste (HCW)
The portion of HCW incinerated was retrieved from MoE and extrapolated for the period 1994-2013. Autoclaving conducted by Arcenciel and specifically operations as of the year 2003 significantly reduced the amount of waste incinerated. It should be highlighted however that incineration is still conducted at various medical establishments without permits or monitoring.
Quantity of recovered gas
The information of recovered gas in the operational landfills was provided from the supervising consultants’ reports for each of the landfills through MoE. Only methane recovered from the Naameh landfill have been considered in this inventory.
Exported quantities
Quantities of waste exported are minimal and are mainly composed of hazardous material. These amounts have not been taken into account in the calculation of CH4
emissions from waste disposal mainly due to their composition.
Table 57: Main data collected and computed for solid waste
Table 58: Solid waste generation and disposal considered for Syrian Displaced for the year 2013
Mohafaza
Registered Syrian Displaced
1
Solid waste Generation rate (kg/refugee/day)
Solid waste generation (kg/year)
Solid waste disposal (tonnes/year)
Beirut ML 223,249 0.53 43,187,519 43,187.52 Naameh landfill
North
250,128
0.51
46,561,327
12,571.56 Tripoli landfill2
33,989.77 Open dumps
Bekaa
280,110
0.47
48,052,871 -
24,026.44 Zahleh landfill3
24,026.44 Open dumps
South 105,154 0.5 19,190,605 19,190.61 Open dumps
Total 858,641
156,992,322
1 Including Syrian displaced, Palestine Refugees from Syrian and returning Lebanese
2 Tripoli landfill receives 27% of the waste generated in North Lebanon. The remaining quantities are disposed of in open dumps 3 Zahleh Landfill receives 50% of the waste generated in the Bekaa. The remaining quantities are disposed of in open dumps.
Source| adapted from MoE/EU/UNDP, 2014
Year Population
Waste generation rate (kg/cap/d)
Total waste generated (Gg/yr)
Quantity of recovered CH4 (Gg)
% deposited in SWDS
% recycled reused composted
1994 3,863,542 0.83 1,170.46 0 96% 4%
2000 4,262,161 0.90 1,400.12 0 89% 11%
2006 4,701,909 1.00 1,716.20 10.94 87% 13%
2011 5,102,830 1.05 1,955.66 16.11 85% 15%
2013 6,131,2541 0.47-1.05 2,177.72 18.14 83% 17%
1 This includes 5,272,613 as Lebanese population and 858,641 as Syrian displaced

Lebanon’s Second Biennial Update Report to the UNFCCC
62
The calculation of methane generated from solid waste disposal sites based on the use of the Methane Correction Factor (MCF) available by the IPCC (IPCC, 2007) taking into account the different SWDS categories. Naameh, Tripoli, Zahleh and Saida landfills are categorized as Managed, with an MCF of 1. The 504 unmanaged dumpsites are classified between deep and shallow, as per the data available by MoE/UNDP/ELARD (2011). It is worth noting that some dumpsites were classified as shallow in this study despite having a depth of ≥ 5 m since they were reported to be regularly on fire, thus losing potential methane generation. Total amounts of waste received by the different managed and unmanaged classes are presented in Table 59 and Table 60.
Table 59: Description of SWDS categories
SWDS Category MCF Description
Managed 1
- Sufficient depth - High compaction with suitable equipment - Properly designed and well-operated leachate and storm water systems - Proper site management with no scavenging at the operational area - Control of incoming waste types and quantities and environmental
monitoring schemes established - Frequent surface covering - Prevention of landfill fires, litter and scavenging animals - Gas control and extraction/recovery
Unmanaged – deep (≥ 5 m waste)
0.8
- Sufficient depth - High compaction - Anaerobic degradation conditions in substantial or all parts of the sites - Poor and light operational equipment - Scavenging by people and animals
Unmanaged – shallow (< 5 m waste)
0.4
- Poor and light operational equipment - Scavenging by people and animals - Aerobic degradation conditions in substantial or all parts of the sites, - Frequent fires, often used deliberately and systematically mainly to reduce
volumes and to “get rid of” the SW
Source| IPCC, 2007
Table 60: Proportion of waste received by each category of unmanaged sites
Proportion of waste (by weight) for each type of SWDSs 1
Year Managed Unmanaged – deep (≥5 m waste) Unmanaged – shallow (< 5 m waste or >=5 m with open burning)
1994 0.00 0.31 0.69
2000 0.54 0.14 0.31
2006 0.56 0.14 0.30
2011 0.65 0.11 0.24
2013 0.65 0.11 0.24 1
it is considered that 31% of open dumpsites are unmanaged-deep and 69% are unmanaged-shallow (by weight) (MoE/UNDP/ELARD, 2011).
As for health care waste, a new sectoral assessment on industrial and unintentionally released POPs was prepared by the Ministry of Environment in 2017. The inventory updated the amount of health care waste being incinerated since 2004 based on a field survey with hospitals, which necessitated the recalculation of CO2 emissions from waste incineration to preserve a time-series consistency.
Table 61: Quantities of medical waste being incinerated
2004 2006 2009 2011 2013
Medical waste (tonnes/year) 330 284 219 216 57 Source | MoE/UNEP/GEF, 2017

Lebanon’s Second Biennial Update Report to the UNFCCC
63
Activity data -Wastewater
Limited information is available in Lebanon with regards to wastewater generation rates, treatment percentages and discharge media. Therefore, all of the activity data relies on assumptions and estimation that are either made for this inventory or adopted from other publications.
Table 62: Activity data and assumptions made for wastewater emissions calculations
Wastewater quantities
Wastewater quantities are estimated based on the degradable organic content (kg BOD/1000 persons) of the Lebanese population. Calculations take into account Syrian displaced located in Lebanon, where it is assumed that the same wastewater discharge practices are adopted.
Wastewater management
There is no large-size wastewater treatment plan (WWTP) that is currently operational in Lebanon. Some small size rural WWTPs are reported to be partially operational and/or their efficiency questioned. These are therefore not considered in this inventory.
Wastewater discharge
The discharge media of wastewater considers only three options: river discharge, septic tank and sea. Discharge percentages were computed based on the percentage of households’ sewerage connections onto the networks vs. connections to septic tanks as published by CAS in 2009. This was complemented by overlaying GIS layers showing population data in various regions in Lebanon to calculate the percentage of the wastewater discharged in the different media. It is assumed that the inside regions in Lebanon (Bekaa) discharge into rivers and/or septic tanks and coastal zones discharge into sea and/or septic tanks.
Industrial Wastewater
In Lebanon, quantities of industrial wastewater generated from the industrial sector are not available. Relevant studies estimate it as 20% of municipal wastewater generation, which is also the assumption made for this inventory (MoEW, 2010a)
Industrial wastewater is generally discharged either in sewers that release wastewater directly in the sea without treatment or directly in rivers. Therefore, and based on the geographic distribution of industries between coastal and inland area, it is considered in this inventory that 85% of industrial wastewater is discharged in the sea and 15% in rivers (MoInd, 2015)
Since there is limited information on the wastewater generation per type of industry, its Chemical Organic Demand content could not be determined. Therefore, the degradable organic component of municipal wastewater is used.
Table 63: Specific data for wastewater
Year Population
Degradable Organic Component (kg BOD/1000 Pers)
Total Organic Wastewater generated (kg BOD/yr))
Wastewater generation incl. industrial
3
(kg BOD/yr)
Discharge in Rivers (%)
Discharge in septic tanks (%)
Discharge in sea (%)
1994 3,863,542 23700 91,565,935 109,879,122 0.15 0.26 0.59
2000 4,262,161 23700 101,013,224 121,215,869 0.15 0.26 0.59
2006 4,701,909 23700 111,435,234 133,722,281 0.15 0.26 0.59
2011 5,102,830 23700 120,937,071 145,124,485 0.09 0.28 0.63
2013 6,131,2541 23700
2 145,310,711 174,372,853 0.09 0.28 0.63 1 This includes 5,272,613 as Lebanese population and 858,641 as Syrian displaced (UNHCR, 2013)
2 considered to be the same for Lebanese population and Syrian displaced
3 industrial wastewater adds a load of 20% on the domestic wastewater

Lebanon’s Second Biennial Update Report to the UNFCCC
64
Emission factors
For the calculation of GHG emissions from solid waste, the following tables show the parameters and the methane correction factor used for each type of disposal site. The main source of information for the SWDS parameters and MCF used is the IPCC (2000) considering the unavailability of country specific and site-specific data. Expert judgment was used to estimate some of the parameters in the cases where ranges were provided in the guidelines or in the cases where no clear provision is taken in the guidelines. These parameters were discussed and validated during the expert consultation meeting. Based on the recommendations of the inventory review of the first BUR, the fraction of degradable organic carbon (DOC) which actually degrades (DOCf) used for Lebanon was estimated inconsistent with the IPCC Good Practice Guidance. It was suggested use the value 0.5 instead of 0.77 and revise estimates. The fraction of DOC which actually degrades has been changed accordingly.
Table 64: Parameters adopted for methane generation from MSW
Parameters Values
Fraction of DOC in MSW (%) 17
Fraction of DOC which actually degrades (%) 50
Fraction of carbon released as CH4 (%) 50
CH4 oxidation correction factor (%) 0 Source | IPCC, 2000
Table 65: Methane correction factor from SWDS
Type of site CH4 correction factor
Managed 1.0
Unmanaged – deep (>= 5 m waste) 0.8
Unmanaged – shallow (< 5 m waste) 0.4 Source | IPCC, 2000
Table 66: Incineration default values considered for HCW and municipal waste
Table 67: Wastewater parameters and conversion factors
Incineration default values Source
MSW HCW
Carbon content of waste (%) 40 60 (IPCC, 2000)
Fossil carbon as % of total carbon 40 40 (IPCC, 2000)
Efficiency of combustion 95 95 (IPCC, 2000)
CH4 Emission Factor (EF) (%) 0 0
N2O emission factor (kg N2O/Gg waste (dry))
400 0 (CDR, Ramboll, 2012)
Parameters Value Source
Degradable organic component (kg Biological Oxygen Demand (BOD)/1000pr/yr)
23,700 Expert judgment
Fraction of degradable organic component removed as sludge (%)
0 Expert judgment
CH4 conversion factor for river discharge (0 to 1) 0.1 Expert judgment
CH4 conversion factor for septic tank (0 to 1) 0.3 Expert judgment
CH4 conversion factor for sea (0 to 1) 0.2 Expert judgment
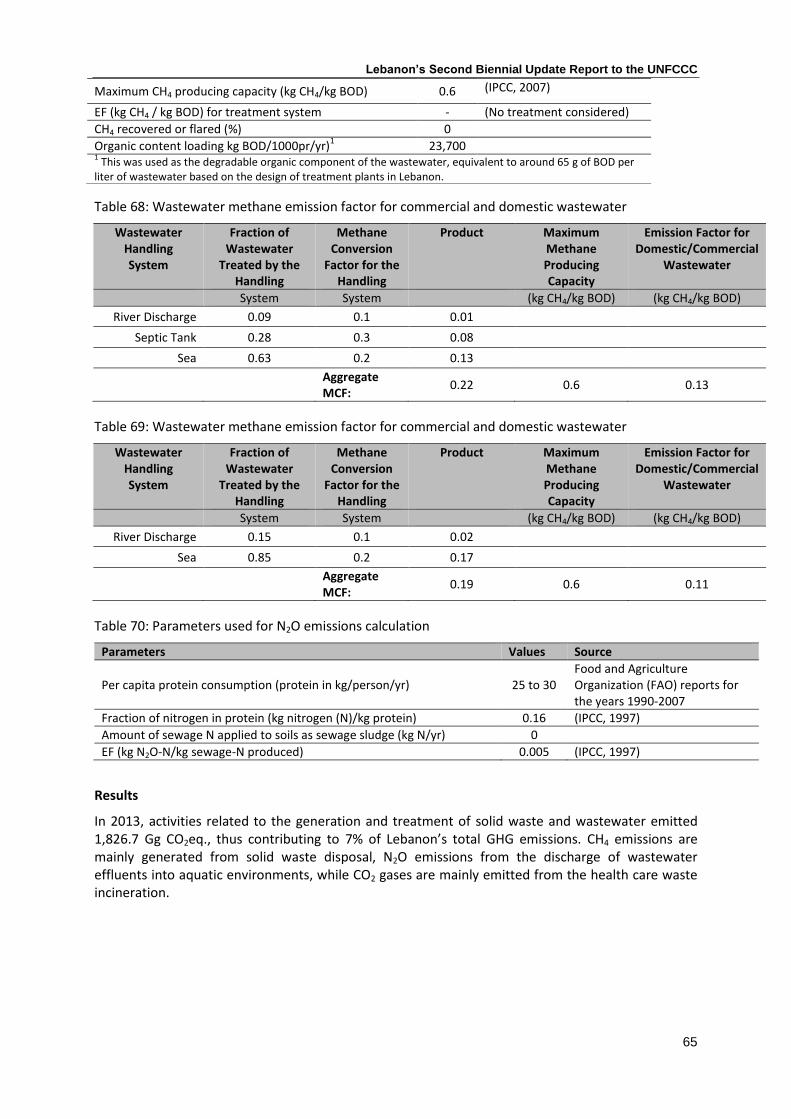
Lebanon’s Second Biennial Update Report to the UNFCCC
65
Table 68: Wastewater methane emission factor for commercial and domestic wastewater
Wastewater Handling System
Fraction of Wastewater
Treated by the Handling
Methane Conversion
Factor for the Handling
Product Maximum Methane Producing Capacity
Emission Factor for Domestic/Commercial
Wastewater
System System (kg CH4/kg BOD) (kg CH4/kg BOD)
River Discharge 0.09 0.1 0.01
Septic Tank 0.28 0.3 0.08
Sea 0.63 0.2 0.13
Aggregate MCF:
0.22 0.6 0.13
Table 69: Wastewater methane emission factor for commercial and domestic wastewater
Wastewater Handling System
Fraction of Wastewater
Treated by the Handling
Methane Conversion
Factor for the Handling
Product Maximum Methane Producing Capacity
Emission Factor for Domestic/Commercial
Wastewater
System System (kg CH4/kg BOD) (kg CH4/kg BOD)
River Discharge 0.15 0.1 0.02
Sea 0.85 0.2 0.17
Aggregate MCF:
0.19 0.6 0.11
Table 70: Parameters used for N2O emissions calculation
Parameters Values Source
Per capita protein consumption (protein in kg/person/yr) 25 to 30 Food and Agriculture Organization (FAO) reports for the years 1990-2007
Fraction of nitrogen in protein (kg nitrogen (N)/kg protein) 0.16 (IPCC, 1997)
Amount of sewage N applied to soils as sewage sludge (kg N/yr) 0
EF (kg N2O-N/kg sewage-N produced) 0.005 (IPCC, 1997)
Results
In 2013, activities related to the generation and treatment of solid waste and wastewater emitted 1,826.7 Gg CO2eq., thus contributing to 7% of Lebanon’s total GHG emissions. CH4 emissions are mainly generated from solid waste disposal, N2O emissions from the discharge of wastewater effluents into aquatic environments, while CO2 gases are mainly emitted from the health care waste incineration.
Maximum CH4 producing capacity (kg CH4/kg BOD) 0.6 (IPCC, 2007)
EF (kg CH4 / kg BOD) for treatment system - (No treatment considered)
CH4 recovered or flared (%) 0
Organic content loading kg BOD/1000pr/yr)1 23,700
1 This was used as the degradable organic component of the wastewater, equivalent to around 65 g of BOD per
liter of wastewater based on the design of treatment plants in Lebanon.

Lebanon’s Second Biennial Update Report to the UNFCCC
66
Table 71: Greenhouse gas emissions from solid waste and wastewater per gas in 2013
CO2
CH4
N2O
Total CO2eq.
Gg Gg Gg CO2eq. Gg Gg CO2eq. Gg CO2eq.
Solid waste* 0.05 60.91 1,279.14 1,279.14
Wastewater 0.00 19.09 400.97 0.47 146.51 547.47
Total 0.05 80.00 1,680.11 0.47 146.51 1,826.67 *including waste incineration The results of the inventory show that GHG emissions are highly dependent on emissions from solid waste generation and management activities, constituting more that 80% of the sector’s emissions. CH4 is the main greenhouse gas emitted by these activities due to high proportion of waste being disposed in dumpsites coupled to low methane recovery rates. As for the CO2 emissions from incineration, they are insignificant compared to emissions from other disposal methods since autoclaving has become the most used method for treating health care waste in Lebanon. Emissions of N2O are mainly linked to wastewater generation and disposal, whether it is discharged in rivers, sea or septic tanks.
Key category analysis 3
Key category analysis is performed in accordance with GPG 2000 and GPG-LULUCF 2003 guidelines. Key categories under the guidelines are sectors whose emissions when summed in descending order of magnitude, add up to 95% of total greenhouse gas emissions. 8 categories have been identified as key in the analysis, with CO2 being the main gas and the energy sector being the main key category. Key categories have remained the same throughout the 1994- 2013 period. The results of key category analysis are shown in Table 72.
Table 72: Key category analysis for 2013
Sector Source categories GHG Emission estimate
(Gg CO2eq.) Level assessment
(%) Cumulative total
(%)
Energy CO2 mobile combustion: energy industries
CO2 7,367.39 28.05% 28.05%
Energy CO2 mobile combustion: road vehicles
CO2 5,977.51 22.76% 50.80%
Energy CO2 emissions from manufacturing industries and construction
CO2 4,403.84 16.76% 67.57%
Industrial processes
CO2 emissions from cement production
CO2 2,539.54 9.67% 77.23%
Energy Other sectors: commercial CO2 CO2 2,234.11 8.50% 85.74%
Waste CH4 emissions from solid waste disposal sites
CH4 1,279.14 4.87% 90.61%
Energy Other sectors: residential CO2 CO2 5,46.20 2.08% 92.69%
Agriculture N2O (direct and indirect) emissions from agricultural soils
N2O 511.50 1.95% 94.63%
Trend analysis 4
Lebanon has already prepared national GHG inventories as part of national communication and
biennial update report processes and has produced and updated its numbers since 1994. In light of

Lebanon’s Second Biennial Update Report to the UNFCCC
67
new activity data, improved methodologies and revised emission factors, the inventory has gone
through 2 recalculation exercises: one for the Third National Communication (TNC) which resulted in
changes in the transport, agriculture, and waste sectors and one for this second BUR which mainly
affected the results of the waste sector’s emissions. The GHG emissions for the period 1994-2013
have therefore changed twice, reducing emissions by 3% to 5.5% across period, hence modifying
Lebanon’s business-as-usual emission trajectory. Table 73 and Table 74 present the changes in
emissions caused by recalculations and Annex V provides additional details on sectoral
recalculations.
Table 73: Changes in national emissions after recalculation
Year Emissions reported in TNC (Gg CO2 eq.)
Emissions reported in BURII (Gg CO2 eq.)
Percent change
1994 13,947 13,185 -5.46%
2000 17,062 16,288 -4.54%
2006 18,790 17,890 -4.79%
2011 24,653 23,743 -3.69%
2012 26,333 25,550 -2.97%
Table 74: Changes in emissions of the year 1994 after recalculations
Emissions (Gg CO2eq.)
1994 1994 recalculated in BURI
1994 recalculated in BUR II
Reasons for recalculation
Energy 7,743 7,743 7,833 Change fuel type from coking coal to petroleum coke
Transport 3,991 1,571 1,577 Change from tier 1 to tier 2 methodology Addition of GHG emissions from domestic aviation
Industrial processes
1,924 1,924 1,924
Agriculture 1,130 1,037 1,035 Change in activity data
LULUCF 210 210 -3,450
54 -3,450
Change from approach 1 to approach 3 methodology
Waste 902 1462 762.36 Change in activity data in solid waste and health care waste quantities Change in fraction of DOC which actually degrades
Total 15,900 13,947 13,186
Table 75: Trend of emissions during the period 1994-2013
Total GHG emissions
(Gg CO2eq.)
Energy (Gg CO2eq.)
Transport (Gg
CO2eq.)
Industry (Gg
CO2eq.)
Agriculture (Gg CO2eq.)
Land Use and
Forestry (Gg
CO2eq.)
Waste (Gg
CO2eq.)
1994 13,186 7,833 1,577 1,924 1,035 -3,450 762
2013 26,285 14,617 6,158 2,545 987 -3,519 1,827
% change 1994-2013
99% 87% 291% 32% -5% -2% 140%

Lebanon’s Second Biennial Update Report to the UNFCCC
68
Average % change/year
5.23% 4.56% 15.30% 1.70% -0.24% -0.13% 7.35%
Figure 19: Trend in GHG emissions 1994-2013
-5,000
0
5,000
10,000
15,000
20,000
25,000
30,000G
g C
O2
eq
.
Energy Transport Agriculture Waste IPPU LULUCF net removal
0
5,000
10,000
15,000
20,000
25,000
30,000
Gg
CO
2e
q.
Total emissions Energy Transport
Agriculture Waste IPPU

Lebanon’s Second Biennial Update Report to the UNFCCC
69
Figure 20: Trend of GHG emissions 1994-2013
Lebanon’s GHG emissions are increasing at an average rate of 3.4% every year, which lead to a
doubling of emissions since 1994. As shown in Figure 20, the trend of increase in total GHG
emissions closely follows the trend of emissions from the energy sector, which constituted 53% to
59% of total emissions during this period. This significant growth in emissions reflects the growing
demand for electricity, due in part to the changing socio-economic conditions and to the expansion
of the national grid. In fact, the sharp increase noticed between the 1994 and 2000 emissions is due
to the increase in gas/diesel oil consumption that accompanied the installation and operation of the
Baalbeck, Tyre, Beddawi and Zahrani diesel power plants during this period.
However, emission growth did not follow a stable trend, as it witnessed 2 detectable drops in 2007 and 2010 in addition to one significant increase in 2009. The drop in the emission trend in 2007, mainly driven by a similar drop in gas diesel oil import is an indirect result of the July 2006 war where significant damage to the road network and electricity infrastructure was inflicted. Indeed, due to the impairment of the electricity distribution network, it was impossible to distribute all the electricity produced and consequently thermal power plants were operating at partial load during the year 2007. The rehabilitation of the infrastructure extended over 2 years, and it was not until 2009 that power plants started to run on full capacity again, hence explaining the peak in GHG emissions in 2009. As for the decrease in emissions observed in 2010 which is proportional to the decrease in gas/diesel oil import, it is mainly caused by 1) the use of natural gas in the Deir Aamar plant in 2010 thus consuming 40% less gas/diesel oil, 2) the increase in hydropower production by 34% from 2009 to 2010 and 3) the decrease in production of the Tyre plant (consuming 30% less gas diesel oil).
Figure 21: Fuel import and GHG emissions trends of the energy sector
The sector with the most significant change in emissions is still the transport sector with emissions increasing by a factor of 3.9 reaching 6.1 million tonnes CO2eq. in 2013. Nitrous oxide has increased by a significant factor of 11.5 due to the fact that vehicles equipped with technologies for emission control are suspected to emit higher amounts of nitrous oxide.
This increase is mostly related to the upturn of the number of registered vehicles in Lebanon from 500,000 in 1994 to 1,640,000 in 2013. Among the main reasons for this significant increase is the inefficient and unreliable management of the mass transport sector, preventing the modernization and growth of the system and allowing the market to be controlled by private operators with an ad-hoc evolution strategy; consequently, encouraging passengers to rely on their private cars for their
0
500
1,000
1,500
2,000
2,500
3,000
0
2,000
4,000
6,000
8,000
10,000
12,000
14,000
Fue
l (kt
on
ne
s)
GH
G e
mis
sio
ns
(Gg
CO
2 e
q)
Energy total GHG emissions HFO import GDO import

Lebanon’s Second Biennial Update Report to the UNFCCC
70
daily trips, along with the lack of policy enforcement for encouraging deployment of new fuel efficient vehicle technologies.
It is worth mentioning that the decrease in the yearly emission rates of the different greenhouse gases between 1994 – 2000 and 2000 – 2005 is a natural consequence to the advancements in reduction of consumption and emissions of new vehicles with emission control technologies. However, this technology advancement in emissions savings did not reduce the fleet average emissions over the period 2005 – 2013 as shown in Table 76, and the upturn that took place is explained by the 8.62% yearly increase in the number of registered vehicles over the same period, and more likely in the increase in the yearly average distance travelled.
Table 76: Trends of road transport emissions in Gg/year and in % during the period 1994-2013
The waste sector also witnessed a significant increase in emissions, increasing by a factor of 2.4 from 1994. With an increase in population, in waste generation and in percent of waste deposited in landfills, methane emissions from solid waste disposal on land have increased by 93% during this period. A significant increase in emissions is detected in 1997 coinciding with the start of operations of the Naameh landfill and a small decrease in emissions may be attributed the 2006 war. Following the evacuation of a part of the population to abroad and the displacement of the residents of the southern suburbs of Beirut, less waste was generated and disposal methods were altered during this period. In fact, waste displacement occurred from areas served by managed landfills (Beirut) in the direction of areas served by unmanaged solid waste disposal sites (mainly in the South of Lebanon) thus impacting the generation of methane and total GHG emissions.
The increasing emission trend is also caused by the development of the industrial sector. The shy
increase is mainly due to the cement and lime production that increased from 2006 to 2013. The
sector witnessed a decrease of emissions from 1994 to 2002 due to decrease in soda ash use and
lime production. Industrial activity picked up starting 2003 with a yearly increase in emissions of
3.9%, except in 2006, where a significant drop of cement production was caused by the July 2006
war. This was compensated by the booming of reconstruction activities after the war, resulting in an
increase in emissions again.
The agriculture sector is still showing a decrease in emissions with a reduction of -5% from the 1994
levels. This is mainly due to the decrease in emissions from agricultural soils and to a lesser extent
from enteric fermentation. These are in turn caused by the decrease in the use of nitrogen fertilizers
and in crop residues added to soils in addition to the decline in dairy, sheep, and swine populations
during the period 1994-2013.
As for Land Use, Land Use and Forestry, forests are still constituting important sinks of greenhouse gases. However, changes in forest and vegetation covers due to wildfires and mainly urbanization resulted in a net decrease of 2.37% in CO2 emissions. Indeed, the peak of land converted to settlement recorded in 2013 coincides with a peak in the amount of cement deliveries (a total of
Number of
vehicles
CO2
(Gg)
CH4
(Gg)
N2O
(Gg)
1994 479,120 1,548.18 0.46 0.04
2000 756,885 2,629.29 0.71 0.10
2005 970,803 3,540.62 0.85 0.20
2013 1,640,574 5,977.51 1.27 0.46
Yearly increase (%) 1994-2000 9.66% 11.64% 9.06% 25.00%
Yearly increase (%) 2000-2005 5.65% 6.93% 3.94% 20.00%
Yearly increase (%) 2005-2013 8.62% 8.60% 6.22% 16.45%

Lebanon’s Second Biennial Update Report to the UNFCCC
71
5,905,811 tonnes) in the same year 2013, which explains the high rate of urbanization on the expense on forested or planted areas.
Figure 22: CO2 emissions/removals from the changes in the LULUCF sector
Overall, the comparison of emissions and removals shows that emissions from land conversions, burning of biomass and fuelwood gathering are higher than the removals caused by the growth of new plantations (afforestation). Although net emissions/removals proved that LULUCF is a major sink, emissions from changes in land use and land cover were still high and couldn’t be compensated by the afforestation activities.
Reforestation activities have played an important role in increasing removals during the last decade, especially after the Ministry of Environment signed in 2010 around 41 reforestation agreements covering 185 ha. and the five-year Lebanon Reforestation Initiative (LRI) was launched by the United States Forest Service in 2010.
Indirect GHG emissions 5
The role of carbon monoxide (CO), nitrogen oxides (NOx) and non-methane organic volatile compounds (NMVOCs) is important for climate change as these gases act as precursors of tropospheric ozone. In this way, they contribute to ozone formation and alter the atmospheric lifetimes of other greenhouse gases. Sulphur dioxide (SO2) also has an indirect impact on climate, as it increases the level of aerosols with a subsequent cooling effect. Therefore, emissions of these gases should be taken into account in national inventories. Emissions of non-CO2 gases are calculated based on tier 1 methodology by applying emission factors which are organized by sector. In reality, emissions depend on the fuel type used, energy combustion technology, operating conditions, control technology and on maintenance and age of the equipment. However, since such detailed data is unavailable in Lebanon, the use of more detailed methodologies was not possible.

Lebanon’s Second Biennial Update Report to the UNFCCC
72
In Lebanon, the transport sector is the major source of indirect greenhouses, being responsible for 61% of NOx emissions, 99% of CO emissions and 65% of NMVOCs. Fuel combustion for energy production is the main emitter of SO2 with 94% of emissions, mainly caused by the sulphur content in burnt fuel. As for industrial processes, they mainly emit NMVOCs, being responsible for 34% of these emissions.
Table 77: Indirect GHG emissions and SO2 emissions in 2013
Emissions (Gg)
NOx CO NMVOCs SO2
Energy 34.43 3.55 1.05 111.66
Transport 54.23 371.06 75.83 5.58
Industrial processes
40.31 1.77
Agriculture 0.00 0.00 0.00 0.00
LULUCF 0.01 0.16 0.00 0.00
Waste 0.00 0.00 0.00 0.00
Total 88.67 374.77 117.19 119.01
Figure 23: Indirect GHG emissions and SO2 emissions in 2013
For the transport sector, indirect GHG emissions are dominated by passenger cars, with a significant HDV contribution to SO2 emissions since HDV uses diesel fuel with higher sulphur content compared to gasoline in passenger cars (Table 78)
Table 78: Indirect GHG emissions for the transport sector in Gg in 2013
Category CO2eq. NOx CO NMVOCs SO2
PC 3,571.95 25.69 231.32 49.63 2.07
LDV 1,042.29 9.20 117.38 19.35 0.63
0
50
100
150
200
250
300
350
400
NOx CO NMVOCs SO2
Gg
LULUCF
Industrial processes
Transport
Energy

Lebanon’s Second Biennial Update Report to the UNFCCC
73
HDV 1,504.52 19.27 17.35 3.66 2.87
Motorcycles 29.07 0.03 5.01 3.18 0.02
Total 6,147.83 54.19 371.06 75.83 5.58
Industrial processes emit SO2 and NMVOC mainly from use of asphalt for road surface, food and beverage production and cement production.
Figure 24: Emissions of indirect greenhouse gases from industrial processes for the year 2013
Quality assurance/ quality control procedures 6
Quality control 6.1
The inventory compilation team performed some quality control procedures intended to ensure transparency and quality of the GHG inventory. The implemented measures that have been monitored and documented are mainly focused on the general level related to the processing, handling, documenting, archiving and reporting procedures that are common to all the inventory source categories. Source category specific quality control procedures were also implemented, but these were not comprehensively documented by the respective coordinators of the various national inventory chapters. By adopting this approach, the inventory compilation team intended to bring significant improvement on both the implementation and reporting of QC procedures, while balancing quality control requirements, improved accuracy and reduced uncertainty against requirements for timeliness and cost effectiveness. It is the aim of the inventory team of experts to maintain this balance in subsequent inventories and enable continuous improvement of Transparency, Accuracy, Completeness, Comparability and Consistency of inventory estimates.
Below is a list of the general QC performed measures:
- Ensured that the description of activity data and emission factors match information on source categories described in IPCC guidelines and that they are properly recorded.
- Confirmed that bibliographical data references are properly cited in the BUR report and in internal documentation.

Lebanon’s Second Biennial Update Report to the UNFCCC
74
- Double checked a sample of activity data, emission factors and other parameters from each source category for transcription errors in the UNFCCC model, the BUR report and the internal documentation sheets.
- Checked that emissions are calculated correctly through performing recalculation of emissions from selected sources and years.
- Checked that units of numbers entered in UNFCCC calculation sheets correspond to the unit mentioned in labels.
- Searched for outlier emission figures and double check accuracy of reported emissions. - Identified activity data and other parameters that are common to multiple source categories
and confirmed that there is consistency in the values used for these parameters in the emissions calculations.
- Ensured that qualifications of individuals providing expert judgement for estimates are appropriate.
- Ensured that assumptions and expert judgements are properly recorded. - Checked that inventory data, supporting data, and inventory records are saved and stored to
facilitate review and provision of needed clarifications in the ICA process. - Identified methodological and data changes resulting from recalculations and analyze how
they affect the overall estimations of national emissions. Make sure these are reported in the final report.
- Performed a completeness check through confirming that estimates are reported for all source categories and for all reported years.
- Checked that data gaps that result in incomplete estimations of source category emissions are documented.
- For each source category, compared current inventory estimates to previous estimates in previous models for years that have already been reported in previous national inventories. If there are changes or departures from expected trends, estimates were rechecked.
Quality assurance 6.2
The GHG inventory methodologies, activity data, results and reporting tables of the BURI have been reviewed by an independent international inventory reviewer and the resulting recommendations have been taken into account in the preparation of the current inventory.
In the BURII project, UNDP Global Support Programme provided support for reviewing the GHG inventory. Recommendations included some immediate improvements, which have been incorporated in this report, and other suggestions for future improvements, which will be tackled in subsequent inventories.
Box 3: Quality Assurance through external review undertaken for BURI
- Performed initial checks to determine the completeness of data in the CRF
- Examined procedures and methodologies used from the collection of data to the reported emission estimates (double counting, completeness of years and sources/sinks, key category analysis, QC procedures, assumptions, units, recalculations, etc.).
- Assessed the quality and reliability of the methodology in accordance to established guidelines.
- Detected anomalies/mistakes in activity data.
- Assessed reliability of emission factors used.
- Validated time series consistency and compared with data from previous submissions.
- Identified areas for further improvement and noted possible ways for improving the estimation and the reporting of inventory information.

Lebanon’s Second Biennial Update Report to the UNFCCC
75
Uncertainty analysis 6.3
The QA/QC procedure that Lebanon adopted for its GHG inventory in the second BUR did not include uncertainty assessment due to the lack of relevant information to facilitate the uncertainty estimation. Lebanon is trying to improve its transparency in reporting and is aiming to collect required information to complete its uncertainty analysis in subsequent reports.
III. Mitigation policies and actions
As a party to the UNFCCC, Lebanon has made efforts to implement activities that lead to emission reduction based on its capabilities and taking into account its national circumstances. This chapter outlines Lebanon’s commitment to address the challenges of climate change in the context of sustainable development and provides information on actions undertaken till 2013 to mitigate anthropogenic emissions by sources and removals by sinks. Information on these mitigation actions and their effects has been documented, to the extent possible, following the guidelines on BUR, including the associated methodologies and assumptions. Wherever possible, information on emissions reductions has been calculated. Mitigation measures are mainly achieved in the power and forestry sectors. Unfortunately, emission reduction initiatives in the industrial, transport, agriculture and waste sectors are few and not well documented. Therefore, the list of measures reported in this section is not exhaustive, which underestimates the emission reduction that Lebanon is undertaken to combat climate change. Lebanon is committed to improve data collection and management and to formalize institutional arrangements that support the long-term collection, analysis and reporting of information on mitigation actions and efforts to explore co-benefits in more details. Currently Lebanon has no specific methodology for monitoring the progress of actions described. Consultations with project proponents and main stakeholders helped identify the extent to which each mitigation action was implemented and accordingly, percentages of completion were used to calculate emission reductions achieved. Consequently, capacity building is much needed on the national level to improve monitoring and reporting of sectoral mitigation activities. The methodology adopted for the calculation of emission reduction of the identified mitigation actions was based on the 1996 IPCC revised guidelines, IPCC good practice guidance and 2003 IPCC guidelines for the LULUCF sector, as already adopted in the preparation of the inventory. Consequently, and similar to how emissions are aggregated in national inventories, emissions reduction levels were also aggregated by sector.
Table 79 and Table 82 present the progress of these measures as per end of 2013. A detailed description of the measures developed and implemented in Lebanon until 2013 including information on objectives and goals, coverage, budget, and GHG reduction potential, is provided in tabular format as per decision 2/CP.17 in Annex VI and Annex VII.
Energy 1
As reported in the national GHG inventory, the majority of Lebanon’s emissions are from the energy
sector. Energy is a strategic resource for Lebanon as the country is almost completely reliant on the
import of oil for energy needs. Therefore, climate mitigation in this sector plays an important role in
achieving positive environmental, economic, and social impact through demand side management
and cleaner energy production. In 2013, mitigation measures implemented in the energy sector
contributed in reducing emissions by 513,063 tonnes CO2 eq., with the expansion of the solar water

Lebanon’s Second Biennial Update Report to the UNFCCC
76
heaters and the replacement of incandescent lamps inducing the most significant emission
reductions.
Although renewable energy has not taken yet its proper share in energy production due to physical
and regulatory barriers, the government is nonetheless continuing to invest actively in the research,
development, and demonstration of clean energy technologies in Lebanon.
Energy mitigation actions are classified into 11 major categories, covering both energy efficiency and renewable energy, as presented in Table 79.
Table 79: Types of energy mitigation measures
Category Description
Decentralized Solar PV Installations Solar PV installations in residences, commercial institutions, and industrial facilities for power generation
Solar-Powered Water Pumping Solar PV installations for agricultural applications and water pumping
Solar-Powered Public Street Lighting Solar PV for public streetlights. Includes addition of new poles and replacement of existing poles
Energy-Efficient Public Street Lighting Replacement of existing HPS and LPS street lamps with LED street lamps and the use of photocells and timers
Solar Water Heating Solar water heating systems in residential, commercial, industrial, and public institutions
Certified Green Buildings Certified green buildings under the BREEAM and LEED schemes
Energy Conservation Measures Implemented energy conservation measures by energy audit companies and ESCOS, including measures related to lighting, cooling, heating, etc.
Biomass Space Heating Biomass and pellet stoves for space heating
Other Renewables Other renewable technologies including wind, hydro, geothermal, and others
Other Energy Efficiency Energy efficiency measures undertaken by the public and private sector including energy efficient lighting, equipment, and others
Energy efficiency in power plants Implemented measures such as upgrades and increase capacity in thermal power plant to increase efficiency of production.
Based on the data collected from the Ministry of Energy and Water, private entities, donor agencies and international organizations, a significant number of initiatives are being undertaken in the energy sector. For the purpose of the BURII, A detailed and comprehensive database was designed by the Ministry of Environment to report all the energy-related mitigation actions in Lebanon. The database includes information on implementing body, funding source, budget, timeframe, energy savings and emission reductions for each initiative, which have all been aggregated and compiled in
Table 80 and in reporting tables presented in Annex VI. The database structure and related data collection process have served in further developing the Management and Information System for Climate Action (MISCA) platform that was developed under the UNDP LECB project in partnership with the Ministry of Energy and Water and the EU-funded ClimaSouth. Indeed, MISCA contains a section on collecting information and calculating emission reductions from the implementation of mitigation actions in the energy sector.

Lebanon’s Second Biennial Update Report to the UNFCCC
77
Table 80: Summary of mitigation activities in Lebanon in 2013
Activity Achieved outcome by 2013 Cumulative reduction of GHG emissions up to 2013*
(tonnes CO2 eq.)
Decentralized solar PV installations Cumulative energy savings: 3,897,784 kWh
2,811
Solar-powered water pumping Cumulative energy savings: 91,433 kWh
62
Solar powered public street lighting Cumulative energy savings: 550,971 kWh
339
Energy-efficient public street lighting Cumulative energy savings: 245,714 kWh
164
Installation of Solar Water Heaters (SWH) Cumulative energy savings: 358,650,466 kWh
246,269
Certified green building Cumulative energy avoided: 1,326,310 kWh
905
Energy conservation measures Cumulative energy savings: 240,000 kWh
166
Biomass Space heating Cumulative energy savings: 2,029,000 kWh
1,384
Other renewables Cumulative energy savings: 28,823 kWh
20
Other Energy Efficiency measures Cumulative energy savings: 382,579,313 kWh
260,943
Energy efficiency in power plants - -
Total known GHG emissions reduced by 2013 513,063
*calculated as the sum of yearly emission reductions achieved through the date of implementation of the action up to 2013 (including 2013)
As presented in Table 80, solar water heaters, which are by far the most developed renewable energy technology in Lebanon, represent 48% of the estimated emissions have been reduced during the reporting period. Indeed in 2013, more than 400,000 m2 of solar collector area were installed in the country, further expanding the market of solar water heaters. Other initiative with a high emission reduction is the “3 million Lamp” initiative launched in 2011 by the Ministry of Energy and Water to distribute 3 million CFLs to 1.5 million residential households across the country to replace incandescent lamps. This is estimated to have saved 382 million kWh and 260, 943 tonnes of CO2eq., representing 51% of reported emission reductions by 2013. Other activities such as the installations of decentralized PV and wind power, solar water pumping, public street lighting, biomass space heating and other renewable energy activities are being implemented on a pilot and demonstration scales mainly by international organizations with the close coordination and guidance of the Ministry of Energy and Water. This is translated by their

Lebanon’s Second Biennial Update Report to the UNFCCC
78
relative low emission reduction potential reported in 2013. The respective implementing agencies are however planning to scale-up these initiatives for more significant energy savings and emission reductions. The government led activities are mainly related to increasing efficiency in thermal power plants as guided by the Policy Paper of the Electricity Sector and introducing renewable energy in public power production. Most of these activities have started in 2013, resulting in no emission reductions to be reported for 2013. However, it is estimated that these measures can result in a yearly reduction of 1,312,996 tonnes of CO2 emissions.
Table 81: Increasing energy efficiency and introducing E in public power production
Activity Description Expected GHG reduction/yr
(tonnes CO2eq.)
Zouk ICE 194 MW (HFO) Construction of new power plants in Zouk and Jiyeh which utilizes the energy in the exhaust gases and the hot cooling water from the engines in order to improve the efficiency of the plant by installation.
250,032
Jiyeh ICE 78.2 MW (HFO) 100,788
DACCPP II 539.2 MW (HFO)
Construction of an indoor gas turbine plant at Deir Ammar site with Nox control system a mini Hydro unit at the condenser outlet to improve efficiency. 597,849
ZCCPP 33.5MW Upgrade (DO) Upgrade of design, material and coatings of Zahrani and Deir Amar power plants, which leads to improvement in turbine performance, and increases the overall power output and efficiency of the gas turbine.
177,315
DACCPP I 29.5MW Upgrade (DO) 156,143
HFO Conditioning Zouk Power Plant
Improvement of quality of HFO before boiler furnace combustion, which reduces emissions and increases the combustion efficiency. 29,895
PV Beirut River Snake Project 1 MWp solar PV farm built on the top of a river to generate an estimated 1,665 MWh/year. 974
Total 1,312,996
Transport 2
In 2014, the Ministry of Public Works and Transport (MoPWT) presented to the Council of Ministers the master plan to revitalize the land public transport for passengers. It encloses a set of actions to be implemented on the short and medium terms, shifting the passenger transport demand to mass transit systems. The main actions with direct impact on reducing GHG emissions are:
On the short term: − Implementation of phase 1 of the rail transportation plan, namely the lane connecting
port of Tripoli to the Syrian border.
− Revitalization and restructuring of the operation of public buses inside cities.
− Continuing the development project of traffic management in GBA.
− Improvement of the pedestrian infrastructure.
On the long term: − Deployment of a Bus Rapid Transit (BRT) on Beirut north and south gates, commuting
Jounieh to Jiyeh.

Lebanon’s Second Biennial Update Report to the UNFCCC
79
− Development of a mass transit system covering territories all over Lebanon and commuting cities.
− Restructuring the freight transport.
The full implementation of the master plan would eventually induce significant emission reductions. However to date, since no concrete action has been taken yet towards the implementation of the masterplan, no emissions reduction could be quantified and reported in this BUR.
Land-Use, Land Use Change and Forestry 3
In the identification of climate mitigation measures related to Land Use, Land-Use Change and Forestry that have the potential to significantly contribute to emission reduction or sink enhancing, the following main categories are considered:
- Protecting existing carbon reservoirs from losses associated with deforestation, forest and
land degradation, urbanization, and other land management practices.
- Enhancing carbon sequestration and expanding carbon stores in forests, other biomass, soils,
and wood products (including through reforestation, afforestation, and forest management
efforts).
- Reducing emissions of other greenhouse gases, primarily CH4 and N2O, from land use
interventions on from fire management
This section reviews and updates the mitigation actions published in the first Biennial Update Report in the LULUCF sector (i.e., covering the period 2005 and 2011 as in Table 82) by adding the progress achieved and any new initiative launched in 2012 and 2013 (Table 83). Table 82 reports activities that have been implemented prior to 2012 but whose emission reductions still happen on a yearly basis even after project completion.
Table 83 reports projects are still ongoing for 2012 and 2013 inducing more emission removals or that started in 2012/2013. The methodology adopted for the calculation of CO2 removals and emission reductions in these projects is described in Annex VII.
Table 82: Summary of annual GHG removals per type of mitigation project (2005-2011)
Title of mitigation action Annual GHG removals and emission reductions (Gg CO2 eq.)
Type of project
The 40 million forest trees Initiative of the Ministry of Agriculture
N.A. Reforestation/afforestation
National Physical Master Plan of the Lebanese Territory
N.A. Forest management and landcover/land use planning
Alleviating barriers for quarries rehabilitation
N.A. Land restoration
Reforestation on degraded lands
0.49 Reforestation/afforestation

Lebanon’s Second Biennial Update Report to the UNFCCC
80
Title of mitigation action Annual GHG removals and emission reductions (Gg CO2 eq.)
Type of project
Regaining ecological integrity of forest
0.05 Reforestation/afforestation
Restoration and conservation of sensitive forest areas in Lebanon
0.66 Reforestation/afforestation
Support the national early recovery efforts in restoring a part of the burned Lebanese Forests
0.266 Reforestation/afforestation
Forest for peace project 0.269 Reforestation/afforestation
Reforestation: development of a community forest
0.093 Reforestation/afforestation
Management and sustainable development of forest areas
0.133 Reforestation/afforestation
Reforestation within an integrated forest fire management
1.332 Reforestation/afforestation
Developing Lebanon’s National Strategy for forest fire management
N.A. Fire prevention
Strengthening Lebanese capabilities in forest fire control operations
N.A. Fire prevention
RISICO system for forest fire forecasting
N.A. Fire prevention
Total 3.293
* based on assumptions
In 2012 and 2013, afforestation and reforestation activities were sustained and increased by the Ministry of Agriculture and leader organizations in the country such as the Association for Forest Development and Conservation and Jouzour Loubnan, increasing the total amount of GHG emissions that has been removed from mitigation actions in LULUCF to 18.996 Gg CO2eq. in 2013 as presented in Table 83 and Annex VII.
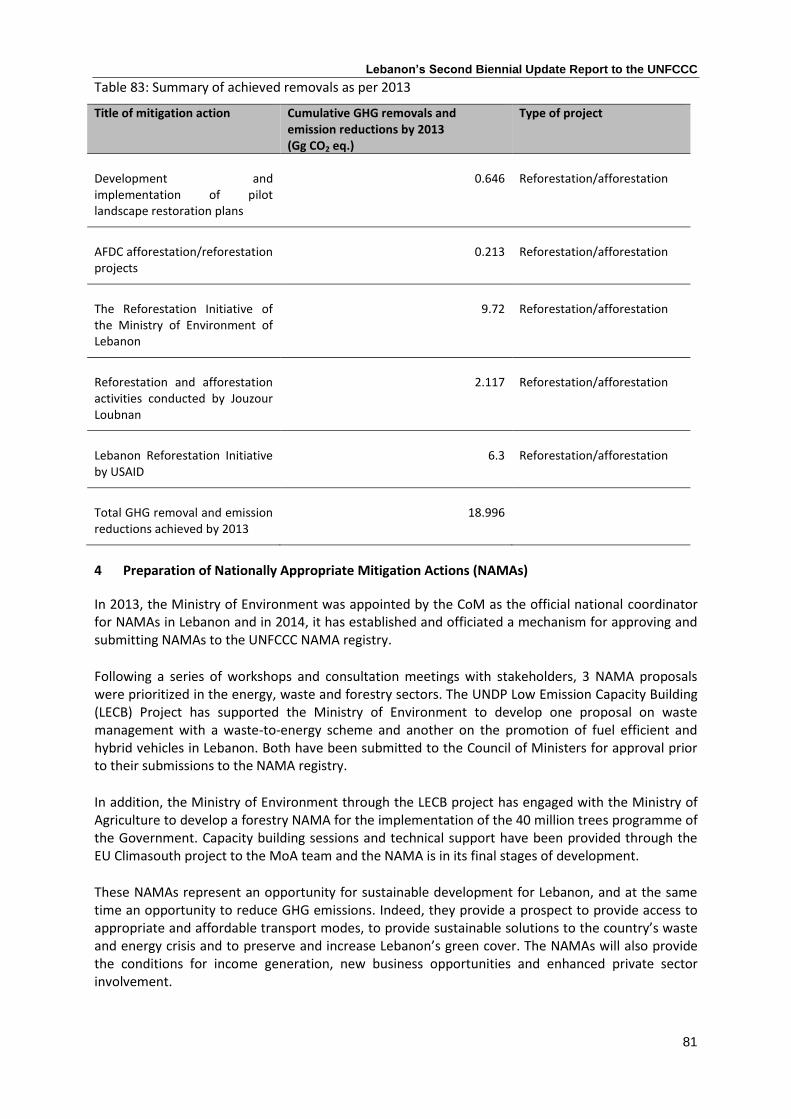
Lebanon’s Second Biennial Update Report to the UNFCCC
81
Table 83: Summary of achieved removals as per 2013
Title of mitigation action Cumulative GHG removals and emission reductions by 2013 (Gg CO2 eq.)
Type of project
Development and implementation of pilot landscape restoration plans
0.646 Reforestation/afforestation
AFDC afforestation/reforestation projects
0.213 Reforestation/afforestation
The Reforestation Initiative of the Ministry of Environment of Lebanon
9.72 Reforestation/afforestation
Reforestation and afforestation activities conducted by Jouzour Loubnan
2.117 Reforestation/afforestation
Lebanon Reforestation Initiative by USAID
6.3 Reforestation/afforestation
Total GHG removal and emission reductions achieved by 2013
18.996
Preparation of Nationally Appropriate Mitigation Actions (NAMAs) 4
In 2013, the Ministry of Environment was appointed by the CoM as the official national coordinator for NAMAs in Lebanon and in 2014, it has established and officiated a mechanism for approving and submitting NAMAs to the UNFCCC NAMA registry.
Following a series of workshops and consultation meetings with stakeholders, 3 NAMA proposals were prioritized in the energy, waste and forestry sectors. The UNDP Low Emission Capacity Building (LECB) Project has supported the Ministry of Environment to develop one proposal on waste management with a waste-to-energy scheme and another on the promotion of fuel efficient and hybrid vehicles in Lebanon. Both have been submitted to the Council of Ministers for approval prior to their submissions to the NAMA registry.
In addition, the Ministry of Environment through the LECB project has engaged with the Ministry of Agriculture to develop a forestry NAMA for the implementation of the 40 million trees programme of the Government. Capacity building sessions and technical support have been provided through the EU Climasouth project to the MoA team and the NAMA is in its final stages of development.
These NAMAs represent an opportunity for sustainable development for Lebanon, and at the same time an opportunity to reduce GHG emissions. Indeed, they provide a prospect to provide access to appropriate and affordable transport modes, to provide sustainable solutions to the country’s waste and energy crisis and to preserve and increase Lebanon’s green cover. The NAMAs will also provide the conditions for income generation, new business opportunities and enhanced private sector involvement.

Lebanon’s Second Biennial Update Report to the UNFCCC
82
Information on international market mechanisms 5
The Ministry of Environment has been appointed Designated National Authority for CDM projects in 2006 and 7 projects have been approved by the CDM Executive Board with the total potential of CER generation of 91,721 CERs every year. The table below provides details on these projects.
Table 84: CDM project in Lebanon
Project name Project proponent Potential CO2 savings per year
Thermal Solar Plant Project at Zeenni Trading Agency; Bsarma El Koura, Lebanon
Zeenni Trading Agency 1,685 tonnes CO2eq
The Lebanese CFL Replacement CDM Project – Mount Lebanon
Ministry of Energy and Water (MEW)
Lebanese Center for Energy Conservation (LCEC)
20,091 tonnes CO2eq
The Lebanese CFL Replacement CDM Project – South Lebanon
Ministry of Energy and Water (MEW)
Lebanese Center for Energy Conservation (LCEC)
14,435 tonnes CO2eq
The Lebanese CFL Replacement CDM Project - North and Bekaa
Ministry of Energy and Water (MEW)
Lebanese Center for Energy Conservation (LCEC)
21,281 tonnes CO2eq
The Lebanese CFL Replacement CDM Project – in and around Beirut Central, Northern and Eastern Suburbs
Ministry of Energy and Water (MEW)
Lebanese Center for Energy Conservation (LCEC)
20,091 tonnes CO2eq
The Lebanese CFL Replacement CDM Project – in and around Beirut Southern Suburbs
Ministry of Energy and Water (MEW)
Lebanese Center for Energy Conservation (LCEC)
14,138 tonnes CO2eq
Programme for Grid Connected Renewable Energy in the Mediterranean Region
Renewable Energy for the Mediterranean (R.E.M.)
Not determined yet
Total potential CO2 savings per year 91,721 tCO2eq
Lebanon’s Second Biennial Update Report to the UNFCCC
83
IV. Lebanon’s transparency framework, institutional arrangements and MRV system
The requirements of the Paris Agreement’s article 13 on transparency, which call for a considerable improvement of Parties’ Measurement, Reporting and Verification (MRV) systems to reach a mechanism that ensures the periodic flow of needed information while ensuring the transparency, accuracy, completeness, consistency and comparability in all of its components, currently represents a challenge for Lebanon. As part of enhancing climate information sharing and outreach, several initiatives are being undertaken as described below. Some gaps and challenges still exist to coordinate the initiatives and to enforce their efficient implementation. Lebanon will continue to raise awareness and build capabilities to sustain and gradually improve the implementation of these efforts while addressing specific barriers using incentives or regulatory measures where appropriate.
Minister of Environment decision 99/1
The Minister of Environment’s decision 99/1, which was established in April 2013 under the UNDP LECB project, provides an incentive to the private sector (commercial, institutional and industrial enterprises) to report on a voluntary basis their GHG emissions and related activity data to the Ministry of Environment using a MS Excel-based simple tool. As a quality assurance measure, the reported data is verified and certified by an auditor or accountant (from the submitter’s side) prior to its submission and is further checked for completeness and consistency by the Ministry of Environment. This scheme is designed with an awareness raising approach in instigating a reporting culture (GHG emission reporting) by the private sector and to provide a self-tracking tool to be used by participating companies to monitor their GHG emission growth/reduction. The Ministry of Environment is planning to undertake a systematic and objective assessment of Decision 99/1 to determine its relevance and scalability for better informing climate change policy in Lebanon.
Cooperation between Ministries of Environment, Industry and of Finance
In an attempt to institutionalize data sharing between ministries, the Ministry of Environment has established 2 cooperation mechanisms under the UNDP LECB project: 1. Collection of information from the Ministry of Industry by requesting that basic activity data be included as part of the standard procedures followed for industries to acquire their business licenses. To date, information for the years 2015 and 2016 have been collected in hard-copy format by the Ministry of Industry. While this initiative was successful in guaranteeing activity data collection by the Ministry of Industry in a systematic manner, the data needs to be digitalized in order to facilitate its analysis and use for inventory preparation. 2. Collection of information from the Ministry of Finance on energy and raw material consumption from commercial, institutional and industrial companies. Requested data have been included in the online tax declaration template of the Ministry of Finance and a first round of data collection will be launched starting 2018 for the companies registered at the Large Taxpayer Office of the Ministry of Finance.
The Lebanon Climate Act initiative: reporting of climate change mitigation and adaptation projects
The Lebanon Climate Act (LCA) is an initiative that has been launched in 2016 by the Green Mind NGO in cooperation with the UNDP LECB project, the Central Bank of Lebanon, the Federation of

Lebanon’s Second Biennial Update Report to the UNFCCC
84
Chamber of Commerce, Industries and Agriculture and the Ministry of Environment to engage the private sector and non-state actors in climate action. A series of trainings labelled as Business Knowledge Platforms have been conducted in cooperation with the EU ClimaSouth project to support companies in determining their level of engagement, identifying potential partners from civil society and municipalities, and developing implementation, monitoring and reporting plan for their climate actions. To date, around 100 companies and non-state actors have joined this initiate with different level of engagements. In 2017, 10 champion companies have been selected from the LCA members and rewarded for their engagement in a high-level ceremony organized in Beirut.
Transparency law – access to public information
Lebanon’s Parliament ratified an access to information law in January 2017 that prescribes that virtually all government entities publish online key documents showing performance indicators such as annual reports, orders and decisions, and office expenditures. The full enactment of the law is pending the issuance of other legislative documents as the establishment of an anti-corruption commission to enforce the law. Nevertheless, the law is a positive step towards improving transparency and public accountability, and work for climate change transparency will benefit from this initiative.
Management and Information System for Climate Action (MISCA)
The Ministry of Environment with the support of the UNDP LECB project liaised with the EU-funded ClimaSouth project to design and develop an online information system to facilitate the exchange of data between Ministries. It is intended to track progress of implementation of Lebanon’s Nationally Determined Contribution. The system targets the energy sector as priority sector for the first phase to enhance data sharing between the Ministry of Environment and the Ministry of Energy and Water, and improve the preparation of the energy sector’s GHG emission inventory and mitigation action reporting. MISCA is also designed to help the ministry to track its own progress and automatically calculate resulting CO2 reductions. Quality of data entered in the system is ensured throughout the data entry cycle, by the strict separation of functions associated with the entry, verification and release of data. The management of potentially sensitive or confidential data is also supported. The success of the system lies in the engagement and commitment of the Ministry of Energy and Water, which in turn serves towards meeting the energy sector’s emission reduction targets, the country’s most significant target of its The Ministry of Environment aims at expanding the MISCA initiative to include other ministries such as the Ministry of Agriculture and the Ministry of Public Works and Transport in the future, based on the experience and lessons-learned from the first phase. This would be an important move towards enhancing the effectiveness and transparency of Lebanon’s Monitoring Reporting and Verification (MRV) of data on climate action.

Lebanon’s Second Biennial Update Report to the UNFCCC
85
V. Constraints and gaps, and related financial, technical and capacity needs, including a description of support needed and received
Gaps, constraints and needs 1
Numerous constraints and gaps still exist for Lebanon to report to the required standards and frequency to the UNFCCC. Constraint removal and filling of gaps will be possible in the medium and longer term with continuous national efforts and sustained support from bilateral and multilateral partners and donor agencies. The main challenge related to the preparation of the BUR is the absence of sustainability of the team responsible for the climate reporting processes at the Ministry of Environment. Therefore, the main need is the provision of permanent financial and administrative support to the Ministry of Environment in order to guarantee the sustainability, continuity and integrity of the information reported in the BUR. This can be ensured through the establishment of the MRV Unit which will be responsible not only for tracking climate change activities and collecting relevant data, but also in identifying needs to strengthen climate reporting processes in Lebanon. Other significant challenges relate to the preparation of national inventories. Although some progress has been achieved so far in order to create databases, institutionalize data generation and sharing, and develop national emission factors, some challenges surpass the mandate of the BUR project and require significant financial, technical and institutional support to be surmounted. Concrete examples include the empowerment of the Central Administration of Statistics to centralize and manage data, the development of measurement campaigns to better characterize Lebanon’s energy systems and vehicle fleet, or even the undertaking of an official census on the population in Lebanon. In addition, with BUR preparation, new challenges have emerged from the collection and consolidation of information related to existing mitigation actions. These challenges are mainly related to limited availability of data, weak coordination between institutions working in climate change and the difficulty in quantifying emission reductions achieved.
Gaps and constraints in the BUR preparation process 1.1
Lebanon has already submitted 3 national communications to the UNFCCC (1999, 2011 and 2016) and two BURs including the present one. In the wake of the increasing reporting requirements under the UNFCCC (1/CP.16, 2.CP/17), Lebanon’s capacities in producing national communications and BURs have been enhanced, relying more on in-house expertise and less on outsourced services. However, the Ministry of Environment is aware that these reporting requirements for developing countries will soon be enhanced with the adoption of the 2018 Rulebook as per the Paris Agreement work programme, and therefore wishes to take the necessary steps to enable readiness for optimized compliance with upcoming guidelines.
Technically, the Ministry of Environment, with the support of UNDP, is able to compile a BUR or a National Communication without setting up a reporting management system. However, such a system will optimize resources invested in the process. The challenges faced in the preparation of Lebanon’s second BUR and previous UNFCCC reports are listed in Table 85, along with corresponding capacity building needs. Many of the below-listed challenges have also been identified by the technical team of expert of the BURI ICA process. They have been further formulated to better structure the development of a UNFCCC reporting management system.

Lebanon’s Second Biennial Update Report to the UNFCCC
86
Table 85: Challenges and needs for the preparation and communication of BURs
Challenge Description Needs
Human resources Currently, the BUR process is being led by the Ministry of Environment, with the involvement of independent sectoral expert on an ad-hoc basis.
Little technical involvement is provided by other ministries, where their role is limited to consultations and validation of information.
Engage more ministries in the technical preparation of BURs.
Build technical capacities of public servants
Retain competent experts
Establish a reporting management system that allocates clear responsibilities between ministries and departments
Funding cycles The Ministry of Environment fully relies on GEF’s enabling activities funding window for the preparation of national communications and BURs, and therefore is dependent on the funding cycles made available by GEF. This paralyses the planning stages of BUR preparation.
Ensure a continuous and sustainable fund for the preparation of BUR
Integrate the preparation of BURs in ministries existing workplans
Institutional arrangements The current institutional structure relies on informal mutual agreements for data collection with relevant institutions. However, there is no protocols or institutional arrangements that guarantee the sustainability of data collection that often requires heavy administrative processes.
Formalize processes and protocols to institutionalize collection, compilation and verification of activity data and required information
Design and implement a complete national GHG inventory system for activity data and proxy data
IPCC Guidelines Shifting to 2006 IPCC Guidelines requires additional data collection, recalculation, and technical expertise that may be cumbersome for the inventory team, given the time and fund restrictions of the GEF projects.
Establish procedures to shift to the 2006 IPCC Guidelines in future GHG inventory procedures including adjustment of historical data
Improve technical skills of inventory team to adopt adopt the 2006 IPCC Guidelines
Establish a reporting management system that includes documentation and archiving procedures, QA/QC protocols, and uncertainty management procedures
Enhancing national ownership of reports
The BUR has a limited role in informing national climate policy, as it is still being considered as a reporting requirement instead of policy tracking tool.
Develop a communication plan to policy makers to facilitate integration of BUR and national communication results in national policy making
Develop a communication plan to the general public to raise awareness on climate change.
Identification of capacity building needs
No methodology or systematic approach is adopted to identify capacity building needs, training, equipment and other resources needed for the preparation of the BUR.
Support to identify gaps and constraints in a more institutional manner, and capacity building needs

Lebanon’s Second Biennial Update Report to the UNFCCC
87
Gaps and constraints in inventory preparation 1.2
Energy
Although a lot if improvements have been done to collect complete data on the fuel combustion in the energy sector, constraints still hinder the completeness and consistency of the process. The main challenges include (1) underdeveloped institutional arrangements data monitoring and collection, (2) the unavailability of specific data and/or the inaccessibility of existing data for adopting tiers 2 and (3) the use of default emission factors from IPCC guidelines instead of Lebanon fuel-specific emission factors. Table 86 presents in detail the gaps related to the inventory preparation of the energy sector.
Table 86: Gaps related to the preparation of GHG emissions in the energy sector
Gaps Description
Underdeveloped data collection for the inventory
1. Lack of institutional arrangement for data monitoring and reporting
2. Absence of the role of the Central Administration of Statistics, Ministry of Transport and Ministry of Energy and Water to develop and activity data
3. Inconsistency of information between different governmental agencies
4. Lack of an energy balance for Lebanon
5. Lack of information on private generation in the industrial, commercial and residential sector
6. Lack of data on passenger kilometres and on off-road vehicles
7. Lack of accurate data on fuel combustion in national aviation and navigation
8. Lack of knowledge to conduct uncertainty assessment
Unavailable and/or unshared specific data for tiers 2 and 3 calculations
1. Lack of road transport activity data on annual fuel consumption per type of fuel and yearly average vehicle mileage per category
2. Lack of technology-related information per power plant
3. Lack of standardized/centralized data reporting system and protocols for data accessibility.
Use of IPCC default emissions factors
1. Lack of Lebanon-specific methodologies using advanced bottom-up approaches for inventory preparation
2. Lack of fuel-specific emission factors for Lebanon
3. Lack of capacity of national laboratories to calculate carbon content of fuels
Industrial processes
The main gap of the industrial processes GHG inventory preparation is related to not estimating emissions from consumption of Halocarbons and SF6. These estimations, if included in the national GHG inventory, would probably significantly change Lebanon’s currently estimated total net emissions due to the very high global warming potential of Halocarbons. The National Ozone Unit in Lebanon will publish a survey on consumption of Halocarbons in Lebanon in the very near future as part of the project “Enabling Activities for the Early Ratification of the Kigali Amendments” funded by the Multilateral Fund Secretariat.

Lebanon’s Second Biennial Update Report to the UNFCCC
88
Industrial processes in Lebanon is one of the national inventory chapters with a lot of potential for improvement. However, due to its insignificance in the overall national emissions scheme, time and budget have not yet been prioritized for these improvements. The latter include an adjustment of historical data on lime production, a detailed survey on production of asphalt roofing and use of road paving material, the initiation of regular preparation and publishing of surveys on all the food and drinks subcategories (beer, wine, fish, meat, poultry, bread, cakes and biscuits, coffee beans, sugar, margarine and animal feed) as most of the numbers used so far in Lebanon’s inventories are based on assumptions and estimations.
Finally, the current BUR does not include information regarding Solvent and Other Product Use due to lack of detailed methodology for inventory preparation for this sector in the 1996 and 2000 IPCC guidelines as well as the lack of published activity data. This category covers mainly NMVOC emissions resulting from the use of solvents and other product containing volatile compounds. It also includes evaporative emissions of greenhouse gases arising from other types of product use such as N2O emissions from medical use. It is however believed that these emissions from categories considered under this sector (i.e. paint, application, degreasing and dry cleaning, printing and publishing, degreasing and dry cleaning, chemical product manufacture and processing) would not be significant in the context of the national GHG inventory.
Agriculture
The calculation of emissions from the agriculture sector necessitates a solid scientific base of data and parameters, which is a challenging issue in Lebanon. The gaps and constraints reported in BURI are still valid for the preparation of BURII, namely the scattering and inconsistency of data throughout agencies, the lack of institutional arrangements for data sharing as well as the inadequacy of default emission factors to local conditions. Some of the data challenges were overcome in the BURII, however technical and capacity building needs related to the preparation of the inventory in the agriculture sector are still a necessity, as presented in Table 87.
Table 87: data-specific gaps related to the preparation of GHG emissions in the agriculture sector
Gaps or constraints How it was tackled in BURII Recommendation
Data on imported beef: lack of detailed archiving from BUR I on data source and related contacts at the syndicate of beef importers; the Ministry of Agriculture does not collect this data.
Imported beef not included in national GHG inventory of BUR II, and recalculations performed for the entire time series covered in the inventory.
Develop appropriate institutional arrangements with the Ministry of Agriculture to make data on imported beef readily available for every round of inventory.
Data on Swine, Camels, Horses, Mules, Asses: not available at the Ministry of Agriculture.
Obtained from FAOSTAT, considered a secondary source of information.
Provide support to the Ministry of Agriculture in order to gather and regularly publish data on Swine, Camels, Horses, Mules, Asses.
Data on nitrogen fertilizer consumption: not available at the Ministry of Agriculture, not segregated by chemical at the Lebanese customs. Assumption that all imported fertilizer is consumed nationally.
Extrapolation from data series made available from BUR II.
Provide support to the Ministry of Agriculture in other to gather and regularly publish data on Nitrogen fertilizer consumption.
Data on crop production: available at the Ministry of Agriculture only until the year 2009.
Obtained from FAOSTAT, considered a secondary source of information.
Provide support to the Ministry of Agriculture in other to gather and regularly publish data on crop production.
Fraction of manure nitrogen per Fractions adopted from BUR I Provide support to the Ministry of Agriculture

Lebanon’s Second Biennial Update Report to the UNFCCC
89
manure management system: no survey exists for accurate estimations.
based on expert judgment. in order to perform a complete survey of manure management systems in Lebanon.
Burning of agricultural residues: the assumption is that it does not occur in Lebanon, at least during the period covered by the inventory. However, no published study confirms this information.
Burning of agricultural residues was considered not occurring in the BUR II based on expert judgement.
Provide support to the Ministry of Agriculture in order to perform a complete survey on disposal of agricultural residues.
Fraction of crop residue removed from field: no survey exists for accurate estimations.
Fractions adopted from BUR I based on expert judgment.
Provide support to the Ministry of Agriculture in order to perform a complete survey on disposal of crop residues removed from fields.
Land use, land use change and forestry
The gaps in the preparation of the LULUCF inventory in relation to emission and removals factors are related to the unavailability of country specific data (and the use of Tier 1 IPCC default assumptions that the net change is zero. More specifically, emission/removals for the subcategories Land converted to Croplands and Land converted to Grassland were not estimated due to lack of data. Accordingly, the notation key NE (not estimated) was used. Further data (when available) on areas of grasslands along with their management systems (e.g. status of grazing,) can help in providing new insights on their level of contribution in GHG emissions or removals in the future. Also, alternatives to estimate emissions and removals from the land use subcategories and pools declared as “Not Estimated” in this report could be made available in future inventory submissions. These include the design and implementation of an operational mechanism for continuous spatial monitoring and assessment of land subcategories with the combined use of satellite remote sensing and Geographic Information System (GIS) data in addition to data published by official reports. This, however, requires the direct coordination of relevant ministries (i.e., Ministry of Agriculture and Ministry of Environment). Waste and wastewater
Similar to the other sectors, the challenges in the calculation of waste and wastewater related emissions are mainly linked to the availability of complete and accurate data on waste and wastewater generation as well as adopted management and treatment practices. Table 88 summarizes the gaps identified in the calculation of the GHG emissions from the waste sector.

Lebanon’s Second Biennial Update Report to the UNFCCC
90
Table 88: Gaps for the calculation of GHG emissions from the waste sector
Gaps Description
Estimation of population and waste generation rate
- Population is based on data from CAS that is only available for 2 years. No census on Lebanese population is available
- Studies on waste generation analysis conducted are outdated
Methodology of quantification of waste and wastewater
- Waste and wastewater generation rates are not based on quantitative exercises and are often estimated based on population counts.
- Industrial wastewater is not clearly addressed and related information is missing
Estimation of methane generation and recovery rates
- Data on methane recovery is not made available from all landfills and for all reporting years
- Methodology of 1996 Revised IPCC guidelines does not take into account the lag time between waste disposal and methane generation
Estimation of wastewater disposal practices
- No information is documented on the methods used to disposed of wastewater in urban versus rural areas
Absence of national emission factors
- The use of default emissions factors might under or overestimate emissions from waste and wastewater generation and disposal
Gaps and constraints in capturing and reporting of mitigation actions 1.3
Mitigation measures are mainly achieved in the power and forestry sectors, as reported in section III. Unfortunately, emission reduction initiatives in the industrial, transport, agriculture and waste sectors are few and not well documented. Therefore, there are gaps in the list of measures reported, which leads to believe that the emission reductions achieved by Lebanon are underestimated as reported in the present BUR. Consequently, capacity building is much needed on the national level to improve monitoring and reporting of sectoral mitigation activities. While some improvements have been brought in the second BUR compared to the first one, especially in terms of identifying information related to the progress of implementation of some actions in the energy sector, more capacity building is needed to address the challenges presented in Table 89 and Table 90.
Table 89: Data gaps in preparing mitigation actions for the other sectors
Gaps and constraints – other sectors
Transport - Limited data available on the progress of activities related to public transport initiatives
- Absence of clear workplan and indicators for the Government’s Transport Strategy - Difficulty in estimating the climate-change related component, achievements and
budget of transport development projects - Difficulty in estimating emissions reductions from the complete or partial
implementation of the Transport Strategy, and specifically the revitalization of public transport
Agriculture - Limited data available on cropland management, livestock and manure management, and good agricultural practices
- Difficulty in estimating the climate-change related component, achievements and budget of agriculture development projects
- Absence of information on the implementation progress of the Ministry of Agriculture’s 5-year plan
Industrial - Absence of a strategy to improve the environmental performance of the industrial sector, including reduction of emissions from industrial processes

Lebanon’s Second Biennial Update Report to the UNFCCC
91
Processes - Limited data on the implementation of industrial activities with a co-benefit to reduce GHG emissions
Waste - Slow progress of waste and wastewater management activities in Lebanon - Difficulty in estimating the climate-change related component, achievements and
budget of waste and wastewater management projects
Table 90: Data gaps in capturing and reporting mitigation actions for the energy sector
Data gaps – Energy Mitigation actions
Decentralized Solar PV Installations
- Data collected for PV installations is a result of a survey conducted by UNDP-DREG project. The survey covers a big share of the market, yet it is not guaranteed to be covering 100% of the real installations.
- Data collected on PV installations involves currently active companies, but does not include companies that were but are no longer in business. These companies might have good contribution to installations performed prior to 2012.
- Donor-funded PV projects include CEDRO implementations only. Other donor-funded installations that might have taken place are accounted for within the privately-installed cumulative values.
- PV Installations taking place before 2012 are available in cumulative numbers. Thus the average emission factor and budget estimate for the year 2010 and 2011 are used.
Solar-Powered Water Pumping - Donor-funded PV pumping projects include USAID and UNDP implementations only. Other donor-funded installations that might have taken place are accounted for within the privately-installed cumulative values
Solar-Powered Public Street Lighting
- Donor-funded PV Public Street Lighting projects include CEDRO, UNIFIL, and Live Lebanon implementations only. Other donor-funded installations that might have taken place are accounted for within the privately-installed cumulative values.
Solar Water Heating - Data collected for SWH installations is a result of a survey conducted by LCEC. The survey covers a big share of the market, yet it is not guaranteed to be covering 100% of the real installations.
- Data collected on PV and SWH installations involves currently active companies, but does not include companies that were but are no longer in business. These companies might have good contribution to installations performed prior to 2012
- Donor-funded SWH projects include CEDRO, SIDA, and Italian Cooperation implementations only. Other donor-funded installations that might have taken place are accounted for within the privately-installed cumulative values.
Energy Conservation Measures - Data collected on energy audits and energy conservation measures involves the largest companies in the market. There are definitely initiatives undertaken by the facility owners or by third parties that cannot be quantified
- Budget related to energy saving measures cannot be made available.
Biomass Space Heating - For pellet stoves, it is not clear what these stoves are replacing, thus the emission factor used is for EDL and private generators. In some cases, these stoves might be replacing diesel heaters.
Other Renewables - Other renewable energy installations done by private sector could not

Lebanon’s Second Biennial Update Report to the UNFCCC
92
be quantified. Yet they are expected to have minor effect on the cumulative values.
- For the micro-hydro installation, the average saving of 2,000 kWh per installed kW is a rough estimate based on international market data. No similar data is available for these systems in Lebanon.
Other Energy Efficiency - For photo sensors, savings are calculated assuming all photo sensors and timers are installed immediately and properly maintained. In fact some were installed at a later stage, and others are not properly maintained, which reduces their performance and saving potential.
Gaps and constraints in reporting of finance and capacity building needs and support 1.4received
Reporting of financial support needed and received
Lebanon has yet to enhance its capacity to undertake MRV of support with respect to mapping domestic and international climate finance flows, clarifying the support received, identifying support gaps, enhancing related decision-making and ultimately supporting Lebanon’s NDC implementation. Lebanon is still not able to provide a comprehensive report on finance needs and received, due to the challenges presented in Table 91.
Table 91: Challenges hindering complete and transparent climate finance reporting
Data collection Climate finance monitoring is challenging mainly because of untraceable finance flows, and the lack of disaggregated data. This is the case for all finance flows between international donors, central and subnational government, NGOs and the private sector Furthermore, when data is available, it is not disaggregated per source of funding, the type of support (grant, loan, concessional loan, guarantee etc.), percent of disbursement, etc.
Institutional arrangements
The needed arrangements to formulate and communicate climate finance in Lebanon are not established. There is little awareness in the institutions on the importance of tracking finance and its relationship to efficient policy- making.
Definition and methodology synchronization
There is neither definition of climate finance nor an understanding of estimating the incremental cost/budget of climate change mitigation and adaption benefits. This in turn affects the understanding of climate finance across different national institutions and stakeholders and hinders the coherence and consistency of climate finance information.
Moreover, there is no established methodology for identifying and tracking capacity-building or technology transfer related to climate change.
Progress tracking No indicators exist to assess the effectiveness of climate finance; progress towards lowering greenhouse gas emissions or increasing resilience is not being tracked. Therefore, it is challenging to assess the effectiveness of climate finance.
Efforts are underway to define climate finance and devise a process to establish a system for MRV of support received (including capacity-building and technology transfer) and their respective financing and linkages to NDC goals. Reporting of capacity building needed and received
There are many improvements in the present BUR related to reporting of capacity building needs. They are due to a better understanding of the BUR requirements, the improved compilation activities and the ICA and FSV processes.

Lebanon’s Second Biennial Update Report to the UNFCCC
93
Gaps and needs in establishing of a national MRV system 1.5
Lebanon has not yet a defined a comprehensive MRV framework for mitigation and adaptation actions and policies due to the technical constraints described before as well as weak institutional arrangements, which hinder the country’s readiness to comply with Modalities, Procedures and Guidelines (MPGs) under the Paris Agreement. Various efforts undertaken by different national ministries, local governments and private sector have had limited impact in efficiently assessing implementation progress of NDC and informing national climate policy. Lebanon’s first BUR stressed the necessity for the creation of a MRV unit to overcome these challenges. Following the development of Lebanon’s NDC, and the entry into force of the Paris Agreement, the envisaged MRV unit has further been conceptually developed into an MRV Coordinating Entity (MRVCE), which still needs to be established.
Concretely, the MRVCE will primarily enable the measuring of the progress of climate policies, through NDC goals, will be responsible in periodically evaluating the national transparency framework’s effectiveness and will also assist in identifying support needed. In addition, the MRVCE will coordinate all reporting activities under the UNFCCC and progress on NDC implementation. In addition, it will build capacities of national institutions to implement transparency-related activities and procedures.
There is also a need to develop a web based knowledge management platform targeted to relevant institutions to centralize and publish climate information, while building on existing systems. The platform can host 1) the GHG inventory system, 2) the tracking system for climate action (NDC intranet) and 3) adopted tools and methodologies.
Lebanon needs support in elaborating the MRVCE’s detailed design, including proposed governance structure, legal and institutional arrangements as well as operating cost-analysis, and possible financing sources. Therefore, Lebanon will be seeking support from the GEF under the Capacity Building Initiative for Transparency funding window.
Information on support received 2
Climate finance from multilateral and bilateral sources plays an important role in advancing climate action in Lebanon. It has contributed to the implementation of sectoral policies and programs and supported initiatives from governmental and non-governmental institutions. Therefore, having a clear understanding of these finance flows is crucial to assess outcomes of support received and optimize available and future climate resources. The Ministry of Environment is the National Designated Authority to the Green Climate Fund (GCF). Lebanon has not yet submitted proposals to the GCF, but the NDA has issued a no-objection letter for the IFC green bond cornerstone programme. Lebanon is currently seeking support from the GCF to prepare its National Adaptation Plan (NAP) through the readiness programme and is working with the UNDP-UNEP NAP-GSP programme to prepare and submit the proposal.
Building on the progress of UNFCCC negotiations related to transparency of reporting on climate finance, and based on recommendations from the ICA process, Lebanon has attempted in the present BUR to gather readily available and trusted information, in a format that, if developed and improved, could inform the global stocktake more easily. Given the gaps and constraints previously mentioned related to reporting on support received; only information on climate related projects that have been approved by donors and whose beneficiary is the Ministry of Environment since the submission of BURI has been considered in this report (Table 92).
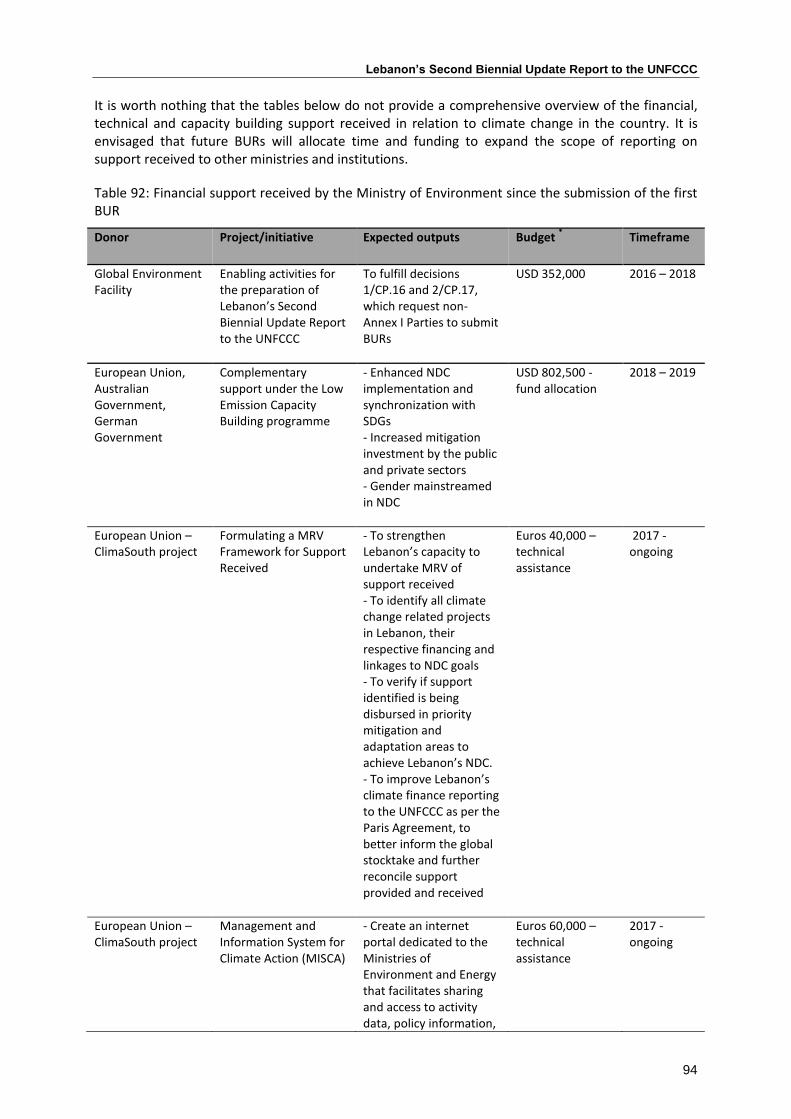
Lebanon’s Second Biennial Update Report to the UNFCCC
94
It is worth nothing that the tables below do not provide a comprehensive overview of the financial, technical and capacity building support received in relation to climate change in the country. It is envisaged that future BURs will allocate time and funding to expand the scope of reporting on support received to other ministries and institutions.
Table 92: Financial support received by the Ministry of Environment since the submission of the first BUR
Donor Project/initiative Expected outputs Budget *
Timeframe
Global Environment Facility
Enabling activities for the preparation of Lebanon’s Second Biennial Update Report to the UNFCCC
To fulfill decisions 1/CP.16 and 2/CP.17, which request non-Annex I Parties to submit BURs
USD 352,000 2016 – 2018
European Union, Australian Government, German Government
Complementary support under the Low Emission Capacity Building programme
- Enhanced NDC implementation and synchronization with SDGs - Increased mitigation investment by the public and private sectors - Gender mainstreamed in NDC
USD 802,500 - fund allocation
2018 – 2019
European Union – ClimaSouth project
Formulating a MRV Framework for Support Received
- To strengthen Lebanon’s capacity to undertake MRV of support received - To identify all climate change related projects in Lebanon, their respective financing and linkages to NDC goals - To verify if support identified is being disbursed in priority mitigation and adaptation areas to achieve Lebanon’s NDC. - To improve Lebanon’s climate finance reporting to the UNFCCC as per the Paris Agreement, to better inform the global stocktake and further reconcile support provided and received
Euros 40,000 – technical assistance
2017 - ongoing
European Union – ClimaSouth project
Management and Information System for Climate Action (MISCA)
- Create an internet portal dedicated to the Ministries of Environment and Energy that facilitates sharing and access to activity data, policy information,
Euros 60,000 – technical assistance
2017 -ongoing

Lebanon’s Second Biennial Update Report to the UNFCCC
95
related actors and finance. - Automatically generate results of CO2 emitted and avoided - Establish institutional arrangements to anchor MISCA in the national transparency framework
European Union – ClimaSouth project
NAMA support - Drafting of transport and forestry NAMAs is completed
Euros 30,000 - technical assistance
2017 – ongoing
European Union – ClimaSouth project
Engaging the Lebanese private sector in climate action – support to the Lebanon Climate Act
- Establish Business Knowledge Platforms to enhance capacities of private sector on implementing climate action - Publish business manual on how to create value from climate change published
Euros 60,000 – technical assistance
2016 – 2017
GIZ (Adaptation to Climate Change in the Water Sector in the MENA Region (ACCWAM)
-to mainstream adaptation to climate change in water policies and actions plans in the region, including Lebanon
NA 2011-2017
*Budget includes the allocated amounts from the donors and not disbursed amount
In terms of capacity building, experts from ministries, governmental agencies and from academic institutions have been nominated to participate in trainings related to climate change and to join the UNFCCC Roster of Expert. Consequently, the country has now a team of experts in various fields (namely energy, agriculture, LULUCF, waste and transport) that have an improved knowledge of the national inventories, national communications and BURs. This has contributed in improving the preparation and compilation of the present GHG inventory. However, unfortunately, Lebanon does not have the required resources to plan and implement a comprehensive training programme to develop the capacities of specialists in different ministries and agencies who should be fully involved in the BUR process. Initiatives in this sense remain sporadic and subject to the availability of funds.
Table 93 presents the participation of representatives of Lebanon in capacity building events related to climate change since the submission of the first BUR.
Table 93: Capacity building received by the Ministry of Environment
Donor Title of Workshop Objectives Date and place Capacity building indicator
UNFCCC Secretariat
Hands on training on the preparation and reporting of mitigation actions (Asia-Pacific and Eastern European regions)
Enhance preparation and implementation of mitigation actions and provision of knowledge on reporting information in national
September 2017
Siem Reap, Cambodia
1 national expert trained
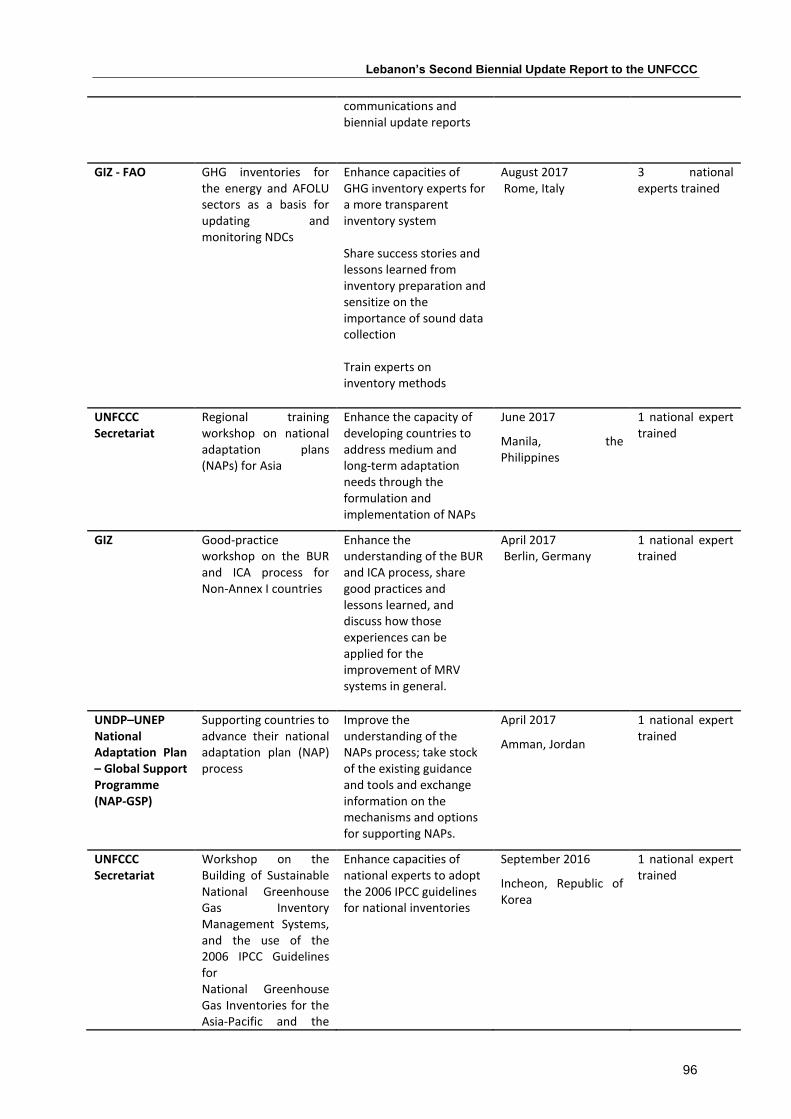
Lebanon’s Second Biennial Update Report to the UNFCCC
96
communications and biennial update reports
GIZ - FAO GHG inventories for the energy and AFOLU sectors as a basis for updating and monitoring NDCs
Enhance capacities of GHG inventory experts for a more transparent inventory system Share success stories and lessons learned from inventory preparation and sensitize on the importance of sound data collection Train experts on inventory methods
August 2017 Rome, Italy
3 national experts trained
UNFCCC Secretariat
Regional training workshop on national adaptation plans (NAPs) for Asia
Enhance the capacity of developing countries to address medium and long-term adaptation needs through the formulation and implementation of NAPs
June 2017
Manila, the Philippines
1 national expert trained
GIZ Good-practice workshop on the BUR and ICA process for Non-Annex I countries
Enhance the understanding of the BUR and ICA process, share good practices and lessons learned, and discuss how those experiences can be applied for the improvement of MRV systems in general.
April 2017 Berlin, Germany
1 national expert trained
UNDP–UNEP National Adaptation Plan – Global Support Programme (NAP-GSP)
Supporting countries to advance their national adaptation plan (NAP) process
Improve the understanding of the NAPs process; take stock of the existing guidance and tools and exchange information on the mechanisms and options for supporting NAPs.
April 2017
Amman, Jordan
1 national expert trained
UNFCCC Secretariat
Workshop on the Building of Sustainable National Greenhouse Gas Inventory Management Systems, and the use of the 2006 IPCC Guidelines for National Greenhouse Gas Inventories for the Asia-Pacific and the
Enhance capacities of national experts to adopt the 2006 IPCC guidelines for national inventories
September 2016
Incheon, Republic of Korea
1 national expert trained

Lebanon’s Second Biennial Update Report to the UNFCCC
97
Eastern European Regions
Consultative Group of Experts on National Communications from Parties not included in Annex I to the Convention (CGE)
Regional training workshop for the Asian and Eastern European region
on the preparation of biennial update reports from non-Annex I Parties
Enhance the capacity of national experts from non-Annex I Parties in understanding and applying the “UNFCCC biennial update reporting guidelines for Parties not included in Annex I to the Convention”
April 2016 Colombo, Sri Lanka
1 national expert trained
VI. Other information considered relevant to the achievement of the convention With a view to facilitating the integration of climate change considerations into relevant social, economic and environmental policies and actions in accordance with Article 4, paragraph 1 (f), of the Convention, Lebanon has undertaken steps various initiatives with schools and with the private sector, namely the development and dissemination of a teacher’s guide on climate change and a guide for businesses in Lebanon to create value from climate change.
1. Teacher’s guide on climate change for schools in Lebanon
The guidebook aims to provide teachers in schools across Lebanon with a wide range of activities and exercises which can be integrated into their teaching subjects and classes in order to enhance student knowledge and skills on climate change. The guidebook was developed with the aim to engage both teachers and students in climate change through an approach that emphasizes critical thinking, interactive dialogues, practical and solutions-based learning, and creative projects. The activities and exercises have been developed with particular focus on the impacts, challenges and opportunities regarding climate change in Lebanon, and include national statistics, data, facts and case studies on climate change in Lebanon. They cover a wide range of topics for primary, middle and secondary cycles across both the scientific and socio-political aspects of climate change. The Ministry of Environment has engaged in a series of awareness activities to disseminate the guidebook to schools and has partnered with UNESCO and the Ministry of Education to develop the Arabic version of the guidebook and integrate it officially in the Lebanese curriculum.
2. How to create value from climate change: a guide for businesses in Lebanon
The guidebook, primarily intended for businesses in Lebanon, has been developed as part of the Lebanon Climate Act (LCA) initiative with support from the EU Cimasouth project and the UNDP LCEB project. The guidebook provides information for businesses to gain a better and deeper understanding of the risks that climate change poses to the modern world and capitalise on opportunities arising from climate change. It is a tool to help companies develop and implement plans to effectively take part in climate change action on the scale of each business. Non-state actors can also benefit from the guidebook to design, implement and monitor their climate actions.

Lebanon’s Second Biennial Update Report to the UNFCCC
98
References
ACAPS (2013). Syria Needs Analysis Project- Lebanon Baseline Information. Available: http://www.acaps.org/en/pages/syria-snap-project [Accessed 2 December 2014].
AFDC/MoE (2009). Lebanon’s National Forest Fire Management Strategy. Mitri G. (Ed.). Association for Forest Development and Conservation, Ministry of Environment. Beirut, Lebanon.
Al-Hassan, R. (2011). A National Consultancy on the Fertilizer Supply Chain in Lebanon. Survey Report submitted to Food and Agriculture Organization (FAO).
ASHRAE (2009). Standard Benchmark Energy Utilization Index. Retrieved July 12, 2017, from http://cms.ashrae.biz/EUI/
Asmar, F. (2011). FAO Country Pasture/Forage Resource Profiles: Lebanon. Available: http://www.fao.org/ag/AGP/AGPC/doc/counprof/lebanon/lebanon.html [Accessed 28 November 2014].
BATCO (2013). Annual reports of Tripoli dumpsites. December 2013.
Beirut port statistics (2014). Annual number of incoming ships from 2009 to 2013. Retrieved from www.portdebeyrouth.com. (Last accessed, April, 2014).
BREEAM (2017). Explore the data behind BREEAM projects. Retrieved July 10, 2017, from http://www.breeam.com/projects/explore/buildings.jsp
Bsaibes, J. (2017). Energy Audit Implementations. Personal communication with Mr. J. Bsaibes on July 6, 2017.
CAS (2014). Monthly Data Per Year From 2000 To 2012. Central Administration of Statistics. Retrieved from www.cas.gov.lb
CDR (2006). Municipal Solid Waste Management in Lebanon. Council for Development and Reconstruction.
CDR (2014). Personal communication. Council for Development and Reconstruction. October 2014.
CDR and Ramboll (2012). National Strategy for Solid Waste Management in Lebanon. Feasibility study – Phase 1.
CEDRO (2015). Sustainable Street Lighting: A Guide to Efficient Public Street Lighting for Lebanon (Rep.). Beirut: CEDRO-UNDP.
CEDRO (2017). Renewable Energy Implementations. Personal Communication Dr. Hassan Harajli, July 10, 2017.
Diab, R. (2017). Energy Audit Implementations. Personal Communiocation Mr. Ronal Diab on July 25, 2017.
EastMED (2012). Report of the FAO EastMED Support to the Fishing Trials Carried Out of the South Lebanese Coasts. Retrieved from www.faoeastmed.org
El Fadel, M., and Sbayti, H. (2000). Economics of mitigation greenhouse gas emissions from solid waste in Lebanon. Waste Management and Research (18), 329-340.
Electricité du Liban (2012). Assistance for the Corporization of EDL. July, 2012.
El-Hage (2014). Personal communication with captain Said El-Hage. Environment Affairs Manager, Middle East Airlines.
FAO (2011a). Lebanon Country Pasture/Forage Resource Profiles. Food and Agriculture Organization. Author: Fady Asmar.
FAO (2011b). FAOSTAT- Lebanon- Land Use. Food and Agriculture Organization Statistics.
FAO (2017). FAOSTAT- Lebanon- Food and Agriculture Organization Statistics.
Hajj Shehadeh, N. (2017. Database on Energy Audit Implementations. Personal Communication Mr. Nader Hajj Chehadeh on June6, 2017
IEA (2017). Fuel imports from 2005 to 2014: International Energy Agency.
IPCC (1995). Climate change 1995, the science of climate change. IPCC second assessment report, United Nations Environmental Program.

Lebanon’s Second Biennial Update Report to the UNFCCC
99
IPCC (1997). Revised 1996 IPCC guidelines for national greenhouse inventories. Houghton J.T., Meira Filho L.G., Lim B., Tréanton K., Mamaty I., Bonduki Y. et al. (Eds). London: Intergovernmental Panel on Climate Change WGI technical support unit.
IPCC (2000). Good practice guidance and uncertainty management in national greenhouse gas inventories. Pennman J., Kruger D., Galbally I., Hiraishi T., buruhani N., Emmanuel S. et al. (Eds). Japan: Institute for Global Environmental Strategies.
IPT (2014). Survey on fuel consumption by end user. IPT Energy Center: Beirut
Jordan, D., and Kurtz, S. (2012). Photovoltaic Degradation Rates - An Analytical Review (NREL/JA-5200-51664, Publication). NREL. Retrieved June 28, 2017, from http://www.nrel.gov/docs/fy12osti/51664.pdf
LACECO (2013), Annual reports of solid waste management.
LCEC (2012a). Net Metering in Lebanon. Lebanese Center for Energy Conservation. UNDP, September 2012.
LCEC (2012b). The Residential Solar Heaters Market in Lebanon. Lebanese Center for Energy Conservation. UNDP, September 2012.
LCEC (2013). National Milestones for Energy Efficient Lighting and Solar Water Heaters. Lebanese Center for Energy Conservation. UNDP, GEF, Hellenic Aid. July 2013.
LCEC (2016). NEEREA - Statistics & Results. Retrieved July 10, 2017, from http://www.lcec.org.lb/en/NEEREA/StatisticsResults
LCEC (2017a). Energy data. Personal Communication Dr. Sorina Mortada, S. on June 28, 2017.
LCEC (2017b). Energy data. Personal Communication Mr. Pierre el Khoury on July 25, 2017.
Mansour, C. (2011). Evaluating impact of electrified vehicles on fuel consumption and CO2 emissions reduction in Lebanese driving conditions using onboard GPS survey. Mansour C., Zgheib E., Saba S., Journal of Energy Procedia, Elsevier, 2011, vol. 6, pp. 261-276.
MoA (2010a). Ministry of Agriculture. Lebanon, Strategy 2010-2014. Retrieved from http://www.agriculture.gov.lb/Arabic/AboutUs/Strategy_2010_2014/Pages/default.aspx
MoA (2010b). Ministry of Agriculture, Lebanon. Agriculture Census 2010. Retrieved from http://www.agriculture.gov.lb/Arabic/DataAndAgriStatistics/OverallAgriStatistics/Pages/defaul.aspx
MoA/FAO (2005). National Forest and Tree Resources Assessment 2003-05 (TCP/LEB/2903). Food and Agriculture Organization. Working Paper 95, Forest Resources Assessment, Forestry.
MoA/FAO (2015). Global Forest Resources Assessment 2015. Country Report: Lebanon, Forestry Department, Rome. Food and Agriculture Organization.
MoE (2010). Country Report on the Solid Waste Management in Lebanon. Ministry of Environment.
MoE (2012). Lebanon’s National Report to the United Nations Conference on Sustainable Development - RIO+20. Lebanon: Wide Expertise Group. Ministry of Environment.
MoE (2017a). Petroleum Coke Imports to Lebanon. Personal Communication Mrs. Viviane Sassine, 4 July, 2017.
MoE (2017b). Lebanon Recycling rates. Personal Communication Mr. Bassam Sabbagh, 14 April 2017.
MoE (2017c). Grid Emission Factors for Lebanon. Personal Communication Mrs. Lea Kai Aboujaoude, 21 July, 2017.
MoE/EU/UNDP (2014). Lebanon Environmental Assessment of the Syrian Conflict and Priority Interventions. September 2014.
MoE/UNDP (2015). Optimal Renewable Energy Mix of the Power Sector by 2020: Investment Cost Implications on Lebanon. Ministry of Environment. Beirut, Lebanon.
MoE/UNDP/Ecodit (2011). State and trends of the Lebanese Environment 2010. Beirut: Ministry of Environment.
MoE/UNDP/ELARD (2011). Provision of consultancy services for the Preparation of a Master Plan for the Closure and Rehabilitation of Uncontrolled Dumps throughout the country of Lebanon.

Lebanon’s Second Biennial Update Report to the UNFCCC
100
MoE/UNDP/GEF (2011). Lebanon’s Second National Communication (SNC) to the United Nations Framework Convention on Climate Change (UNFCCC).
MoE/UNDP/GEF (2015). National Greenhouse Gas Inventory Report and Mitigation Analysis for the Energy Sector in Lebanon. Beirut, Lebanon
MoE/UNDP/GEF (2016). Lebanon’s Third National Communication report to the UNFCCC. Beirut Lebanon
MoE/UNEP (2013). Environmental Resources Monitoring in Lebanon Project, Analysis of the Current Land Use and Socio-Economic Activities in the Coastal Zone (to be published). Ministry of Environment.
MoE/UNEP/GEF (2017). National Implementation plan on Persistent Organic Pollutants. Section 5- assessment of industrial POPs and unintentionally released POPs. Lebanon
MoE/URC/GEF (2012). Lebanon Technology Needs Assessment Report for Climate Change. Ministry of Environment. Beirut, Lebanon.
MoEW (2010a). National Water Sector Strategy. Ministry of Energy and Water. Beirut, Lebanon.
MoEW (2010b). Policy Paper for the Electricity Sector. Ministry of Energy and Water. June 2010.
MoEW (2015). Public Street Lighting Initiatives. Personal communication Mr. Sarkis Farah on 12 March, 2015.
MoEW (2016a). Fuel import data sheet 2012-2016. Ministry of Envergy and Water, Directorate General of Petroleum.Beirut, Lebanon.
MoEW (2016b). Personal Communication. Ministry of Envergy and Water. Beirut, Lebanon.
MoEW/LCEC (2011). The National Energy Efficiency Action Plan for Lebanon NEEAP 2011-2015. Ministry of Energy and Water. Beirut, Lebanon.
MoEW/LCEC (2016a). National Energy Efficiency Action Plan 2016-2020. Ministry of Energy and Water, Lebanese Center for Energy Conservation, 2016.
MoEW/LCEC (2016b). National Renewable Energy Action Plan 2016-2010. Ministry of Energy and Water, Lebanese Center for Energy Conservation, 2016.
MoEW/UNDP/GEF (2016). Solar PV Status Report for Lebanon 2016. Small Decentralized Renewable Energy Power Generation (DREG) Project, Ministry of Energy and Water, Lebanon.
MoF (2016). Credit analysis report on Lebanon. Ministry of Finance, 2016.
MoI/ALI/UNIDO, (2010). The Lebanese Industrial Sector: Facts and Findings – 2007. 71pp.
MoIM (2017). Database of vehicle fleet characterstics 2015. Ministyr of Interior and Municipalities, Traffic, Trucks and Vehicles Management Authority. Beirut, Lebanon.
MoInd (2015). Industrial sector database. Ministry of Industries, 2015
Sfeir, JP. (2017). Pellet Stove Reference Work. Personal Communication Mr. Jean Paul Sfeir on July 8, 2017.
SWEEP-Net (2010). Country Report on the Solid Waste Management in Lebanon.
SWEEP-Net (2014). Cost Assessment of Solid Waste Degradation due to waste Management Practices in Beirut and Mount Lebanon
Tripoli port statistics (2014). Annual number of incoming ships from 2005 to 2009. Retrieved from www.portdetripoli.com. (Last accessed, April, 2014).
UNDP (2015). Solar-Powered Pumping in Lebanon: A Comprehensive Guide on Solar Water Pumping Solutions. Beirut: UNDP.
UNECE (2013). United Nations Economic Commission for Europe. ForFITS Model - Assessing Future CO2 Emissions.
UNECE (2014). United Nations Economic Commission for Europe. Retrieved from www.unece.org. (Last accessed, July, 2014).
UNEP (2016). Solar Water Heaters’ Market Evaluation: Case Study of Lebanon 2015. Beirut: UNEP.
UNHCR (2013). Syrian Refugees in Lebanon. Daily Statistics. UNHCR registration Unit, December 31, 2013

Lebanon’s Second Biennial Update Report to the UNFCCC
101
USGBC (2017). Retrieved July 02, 2017, from https://www.usgbc.org/projects
Verner, D., David R., Maximillian A. and Wilby R. (2013). Increasing Resilience to Climate Change in the Agricultural Sector of the Middle East: The Cases of Jordan and Lebanon. Washington, DC: World Bank. doi:10.1596/978-0-8213-9844-9 License: Creative Commons Attribution CC BY 3.0 potato and impact of fertigation on efficient water use in central Bekaa, Lebanon. In: Fifth Arab Conference on the Peaceful Uses of Atomic Energy, Vol. IV, 13– 17/11/2000, Beirut, pp. 93–105.
Waked (2012). Caractérisation des aerosols organiques à Beyrouth, Liban: Unpublished data.
Waked and Afif (2012). Emissions of air pollutants from road transport in 987 Lebanon and other countries in the Middle East region. Atmos. Environ. 988 61, 446–452.
World Bank (2009). Electricity Sector: Public Expenditure Report. Washington DC.
World Bank (2011). Lebanon - Country environmental analysis. Washington DC.
WSU (2016). Washington State University Extension fact sheet. http://cru.cahe.wsu.edu/CEPublications/FS032E/FS032E.pdf.

Lebanon’s Second Biennial Update Report to the UNFCCC
102
Annexes

Lebanon’s Second Biennial Update Report to the UNFCCC
103
Annex I. GHG inventory technical annex
Lebanon’s GHG inventory - summary report for national GHG inventory 2013
Greenhouse gas source and sink categories
CO2
emissions / removals CO2
(Gg)
CO2 removals CH4
CO2 eq. (Gg)
N2O
CO2 eq. (Gg)
NOx
(Gg)
CO
(Gg)
NMVOCs
(Gg)
SOx
(Gg)
HFCs
(Gg)
PFCs*
(Gg)
SF6 *
(Gg)
Other fluorinated
(Gg)
Total gross
CO2 CO2 eq. (Gg)
Total national emissions and removals 2013
23,246.21 -3,518.80 96.68 1,008.11 88.67 374.77 117.19 119.01 NE NE NE NE 26,284.69
1. Energy 20,551.07 2.12 179.56 88.67 374.61 76.88 117.24 20,775.10
A. Fuel combustion
Reference approach
2
21,072.72
Sectoral approach
20,551.07 2.12 179.56 88.67 374.61 76.88 117.24 20,775.10
1. Energy industries 7,367.39 6.25 18.44 19.83 1.49 0.50 69.42 7,392.08
2. Manufacturing industries and construction
4,403.84 2.23 9.89 10.63 0.53 0.27 28.28 4,415.96
3. Transport 5,987.93 26.74 143.69 54.23 371.06 75.83 5.58 6,158.35
4. Other sectors 2,791.91 9.26 7.55 3.98 1.54 0.29 13.96 2,808.72
5. Other (please specify) 0.00 0.00 0.00 0.00 0.00 0.00 0.00 0.00
B. Fugitive emissions from fuels
- NO NO NO NO NO
1. Solid fuels NO NO NO NO NO
2. Oil and natural gas NO NO NO NO NO
2 The IPCC reference approach allows to validate the results of the sectoral approach, which considers energy consumption using a bottom up approach, whereas the IPCC reference approach considers
energy suppusing top down approach This requires a balance of primary fuels produced, plus imports, minus exports, minus international bunkers and minus net changes in stocks.

Lebanon’s Second Biennial Update Report to the UNFCCC
104
Greenhouse gas source and sink categories
CO2
emissions / removals CO2
(Gg)
CO2 removals CH4
CO2 eq. (Gg)
N2O
CO2 eq. (Gg)
NOx
(Gg)
CO
(Gg)
NMVOCs
(Gg)
SOx
(Gg)
HFCs
(Gg)
PFCs*
(Gg)
SF6 *
(Gg)
Other fluorinated
(Gg)
Total gross
CO2 CO2 eq. (Gg)
2. Industrial processes 2,545.42 0.00 0.00 0.00 0.00 40.31 1.77 2,545.42
A. Mineral products 2,545.42 0.00 0.00 26.12 1.77 2,545.42
B. Chemical industry NE NE NE NE NE NE NE -
C. Metal production NO NO NO NO NO NO NO -
D. Other production 0.00 0.00 0.00 14.19 0.00 0.00
E. Production of halocarbons and sulphur hexafluoride
NO NO NO NO
F. Consumption of halocarbons and sulphur hexafluoride
NE NE NE NE
G. Other (please specify) NO NO NO NO NO NO NO
3. Solvent and other product use
NE NE NE -
4. Agriculture 305.55 682.00 0.00 0.00 0.00 987.55
1.a. Enteric fermentation 265.44
1.b. Manure management 40.11
170.50
0.00
210.61
2. Rice cultivation NO NO
3. Agricultural soils 0.00 511.50 0.00 511.50
4. Prescribed burning of savannas
NO NO NO NO NO -
5. Field burning of agricultural residues
NO NO NO NO NO -
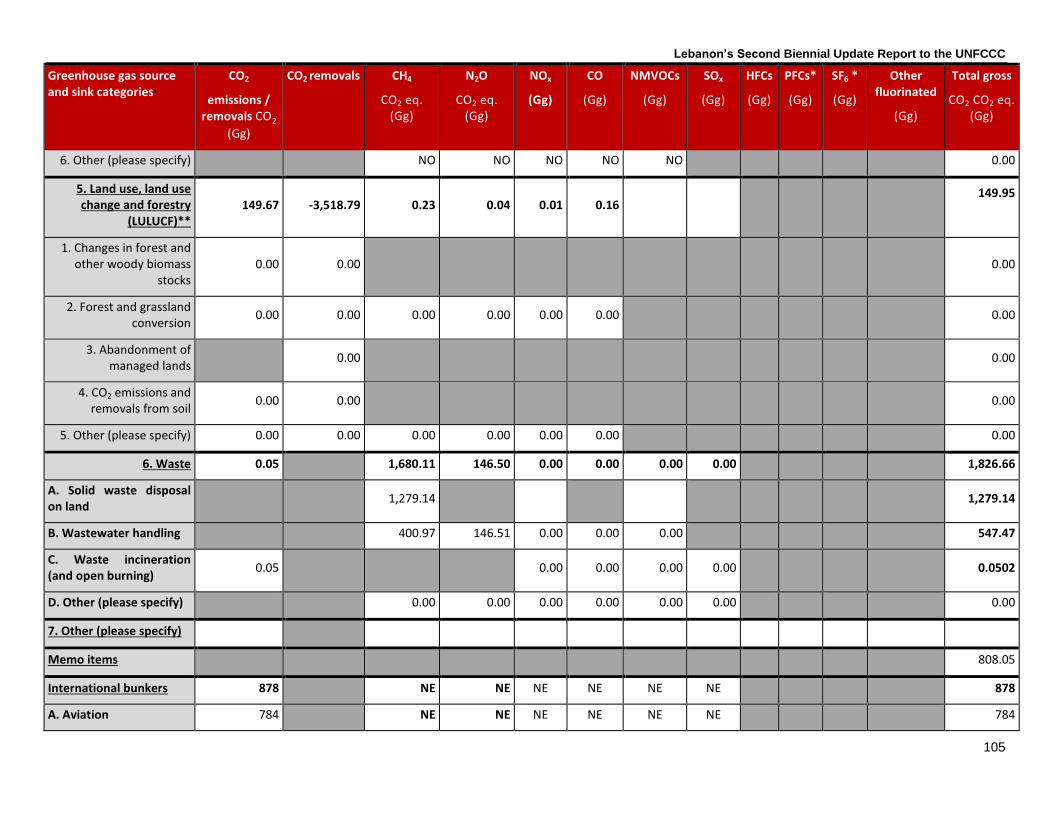
Lebanon’s Second Biennial Update Report to the UNFCCC
105
Greenhouse gas source and sink categories
CO2
emissions / removals CO2
(Gg)
CO2 removals CH4
CO2 eq. (Gg)
N2O
CO2 eq. (Gg)
NOx
(Gg)
CO
(Gg)
NMVOCs
(Gg)
SOx
(Gg)
HFCs
(Gg)
PFCs*
(Gg)
SF6 *
(Gg)
Other fluorinated
(Gg)
Total gross
CO2 CO2 eq. (Gg)
6. Other (please specify) NO NO NO NO NO 0.00
5. Land use, land use change and forestry
(LULUCF)** 149.67 -3,518.79 0.23 0.04 0.01 0.16
149.95
1. Changes in forest and other woody biomass
stocks 0.00 0.00 0.00
2. Forest and grassland conversion
0.00 0.00 0.00 0.00 0.00 0.00 0.00
3. Abandonment of managed lands
0.00 0.00
4. CO2 emissions and removals from soil
0.00 0.00 0.00
5. Other (please specify) 0.00 0.00 0.00 0.00 0.00 0.00 0.00
6. Waste 0.05 1,680.11 146.50 0.00 0.00 0.00 0.00 1,826.66
A. Solid waste disposal on land
1,279.14
1,279.14
B. Wastewater handling 400.97 146.51 0.00 0.00 0.00 547.47
C. Waste incineration (and open burning)
0.05
0.00 0.00 0.00 0.00 0.0502
D. Other (please specify) 0.00 0.00 0.00 0.00 0.00 0.00 0.00
7. Other (please specify)
Memo items 808.05
International bunkers 878 NE NE NE NE NE NE 878
A. Aviation 784 NE NE NE NE NE NE 784

Lebanon’s Second Biennial Update Report to the UNFCCC
106
Greenhouse gas source and sink categories
CO2
emissions / removals CO2
(Gg)
CO2 removals CH4
CO2 eq. (Gg)
N2O
CO2 eq. (Gg)
NOx
(Gg)
CO
(Gg)
NMVOCs
(Gg)
SOx
(Gg)
HFCs
(Gg)
PFCs*
(Gg)
SF6 *
(Gg)
Other fluorinated
(Gg)
Total gross
CO2 CO2 eq. (Gg)
B. Marine 94 NE NE NE NE NE NE 94
Multilateral operations NO
CO2 emissions from biomass
16
16
CO2 captured NO
Long-term storage of CO2 in waste disposal sites
NO
Notes: * Optional for Level 1 and Level 2 reporting
** Results reflect calculations of emissions from LULUCF based on 2003 GPG for LULUCF. Details of the calculation are presented in
Table 52.
N.B.: Shaded cells are not applicable. Source: Table 1 and Table 2 in the annex to UNFCCC decision 17/CP.8 and Table A.15

Lebanon’s Second Biennial Update Report to the UNFCCC
107
Annex II. Activity data and emission factor - indirect gases in industrial processes
Summary of data sources used in the GHG inventory for the industrial processes sector
Reporting category Activity data needed Source used in BUR II
Production and use of miscellaneous mineral products
Asphalt for road paving Lebanese customs through Ministry of Economy and Trade. HS code: 27.15.00.10
Asphalt for roofing – blowing process
This activity data is calculated using the following equation*: quantity of asphalt blown = bitumen import – asphalt for road paving. Lebanese customs through Ministry of Economy and Trade for asphalt for road paving except values for the period 2010-2013 which were extrapolated due to inconsistencies with numbers of imported bitumen. HS code: 27.15.00.10 Ministry of Energy and Water for bitumen import.
Food and drink
Wine production Union Vinicole du Liban
Beer production The only beer producing company during the period covered by the inventory.
Fish production Nader et.al, 2014 up to the year 2011. Personal communication with Dr. Shadi Indari for the years 2012 and 2013.
Meat production Ministry of Agriculture (for locally produced meat). Extrapolation was performed for the year 2013 due to unavailability of data.
Poultry production Ministry of Agriculture (for locally produced poultry).
Bread production Estimated from wheat import (Lebanese customs through Ministry of Economy and Trade, except from 2013 values which retrieved directly from customs website. HS codes: 10.01.90.00 and 11.02.20.00) and production (Ministry of Agriculture). It is estimated that 50% of wheat is used for bread production, and 50% for cakes and biscuits. The amount of wheat used for bread making was multiplied by a factor of 0.92 based on the fact that each tonne of wheat produces 920 kg of bread.
Cakes and biscuits production
Estimated from wheat import (Lebanese customs through Ministry of Economy and Trade, except from 2013 values which retrieved directly from customs website. HS codes: 10.01.90.00 and 11.02.20.00) and production (Ministry of Agriculture). It is estimated that 50% of wheat is used for bread production, and 50% for cakes and biscuits. The amount of wheat used for cakes and biscuits production was multiplied by a factor of 4 based on the fact that each tonne of wheat produces 4 tonnes of cakes/biscuits.
*The annual weight of asphalt binder (cutback) used in road paving is required to prepare estimates of maximum likely emissions of NMVOCs from this source. This amount is derived from asphalt cement consumption according to the following formulas:
Weight of Cutback Asphalt = Weight of Asphalt Cement + Weight of Diluent Weight of Diluent = Volume of Diluent x Density of Diluent (0.7 kg/l)
Volume of Diluent = Volume of Cutback Asphalt x 0.45 (45% of diluent in Cutback Asphalt)
Volume of Cutback Asphalt = Volume of Asphalt Cement / 0.55 (55% Asphalt Cement in Cutback Asphalt) Volume of Asphalt Cement = Weight of Asphalt Cement / Density of Asphalt Cement (1.1 kg/l)

Lebanon’s Second Biennial Update Report to the UNFCCC
108
Activity data for industrial processes in Lebanon for selected years
Year 1994 2000 2006 2011 2013
Quantity of asphalt roofing produced (t) - blowing process 2,550 18,084 20,222 16,205 14,492
Quantity of road paving material used (t) 844,035 111,987.57 35,940.83 89,124.88 81,527.20661
Quantity of beer produced (hl) 8,612 132,888 158,740 211,587 215,110
Quantity of wine produced (hl) 20,417 33,187 43,356 70,000 62,000
Activity data for food production in Lebanon for selected years
Year 1994 2000 2006 2011 2013
Quantity of meat produced (t) NA 19,348 18,916 51,401
Quantity of fish produced (t) NA 8,640 8,090 8,072* 8,822*
Quantity of poultry produced (t) NA 107,200 129,999 32,099,986 33,419,717
Quantity of bread produced (t) NA 187,083 177,758 263,733.6 334,303
Quantity of cakes and biscuits produced (t) NA 813,404 772,862 1,146,668 1,453,491
*Numbers of fish catch provided for North Lebanon coast only, they constitue 40% of total national fish catch according to personal communication with Shadi el Indari. The numbers in the table are the adjusted numbers by calculation.

Lebanon’s Second Biennial Update Report to the UNFCCC
109
Calculation of weight of asphalt binder (cutback) used in road paving
A B C D E F G
Weight imported road paving material (kg)
Weight imported road paving material (t)
Volume of imported road paving material
Volume of cutback asphalt
Volume of diluent Weight of diluent Weight of cutback asphalt (activity data in tonnes)
B = A / 1,000
C = B / 1.1
D = C / 0.55
E = D x 0.45
F = E x 0.7
G = B + F
53,613,000 53,613 48,739.09 88,616.53 39,877.44 27,914.21 81,527.21
The annual weight of asphalt binder (cutback) used in road paving is required to prepare estimates of maximum likely emissions of NMVOCs from this source. This amount is derived from asphalt cement consumption according to the following formulas: Weight of Cutback Asphalt = Weight of Asphalt Cement + Weight of Diluent Weight of Diluent = Volume of Diluent x Density of Diluent (0.7 kg/l) Volume of Diluent = Volume of Cutback Asphalt x 0.45 (45% of diluent in Cutback Asphalt) Volume of Cutback Asphalt = Volume of Asphalt Cement / 0.55 (55% Asphalt Cement in Cutback Asphalt) Volume of Asphalt Cement = Weight of Asphalt Cement / Density of Asphalt Cement (1.1 kg/l)
Emission factors and other parameters adopted in the national greenhouse gas inventory
Reporting categories Emission factor and other parameters Source of emission factor
Cement production 0.51 t CO2/t clinker produced Nationally developed emission factor, SNC (MoE/UNDP/GEF, 2011)*
Correction factor for cement kiln dust (CKD): 1.02* IPCC Good Practice Guidance and Uncertainty Management, p.3.12
0.3 kg SO2/t cement produced Revised 1996 IPCC guidelines, reference manual, p.2.7
Lime production 0.79 t CO2/t quicklime produced Revised 1996 IPCC guidelines, reference manual, p.2.9
Soda ash use
415 kg CO2/t soda ash used Revised 1996 IPCC guidelines, reference manual, p.2.13
320 kg NMVOCs/t road paving material used Revised 1996 IPCC guidelines, reference manual, p.2.14
Production and use of miscellaneous mineral products 2.4 kg NMVOCs/t asphalt roofing produced Revised 1996 IPCC guidelines, reporting instructions, p.2.9
0.095 kg CO/t asphalt roofing produced Revised 1996 IPCC guidelines, reference manual, p.2.13
0.035 kg NMVOCs/hl beer produced Revised 1996 IPCC guidelines, reference manual, p.2.41
0.3 kg NMVOCs/t fish processed Revised 1996 IPCC guidelines, reference manual, p.2.42
0.3 kg NMVOCs/t meat processed Revised 1996 IPCC guidelines, reference manual, p.2.42
0.3 kg NMVOCs/t poultry processed Revised 1996 IPCC guidelines, reference manual, p.2.42
8 kg NMVOCs/t bread processed Revised 1996 IPCC guidelines, reference manual, p.2.42
8 kg NMVOCs/t bread processed Revised 1996 IPCC guidelines, reference manual, p.2.42
1 kg NMVOCs/t cakes and biscuits processed Revised 1996 IPCC guidelines, reference manual, p.2.42

Lebanon’s Second Biennial Update Report to the UNFCCC
110
Annex III. Activity data for the agriculture sector
Detailed poultry calculation for the year 2013
Year Laying Hens (used for meat) Broilers Traditional chicken TOTAL Broilers adjusted to 60 days alive Total adjusted to days alive
2013 2,500,000 56,000,000 1,000,000 59,500
,000 9,205,479 12,705,479
Calculation of FBN for 2013
Crop Fresh weight (tonnes)
DM Factor FracNCRBF FBN
Beans, dry 426 1 2 0.03 25.56
Beans, green 24,439 0.85 2 0.03 1,246.39
Broad beans, horse beans, dry
150 1 2 0.03 9.00
Chick peas 2,435 1 2 0.03 146.10
Alfalfa 20,000 0.5 1 0.03 300.00
Lentils 1,471 1 2 0.03 88.26
Lupins 115 1 2 0.03 6.90
Peas, dry 2,495 1 2 0.03 149.70
Peas, green 4,090 0.85 2 0.03 208.59
Vetches 825 0.9 1 0.03 22.28
Total 2,202.77
Annex IV. Land-use classification, definitions and disaggregation
Definition according to IPCC GPG for LULUCF
Definition according to the national classification system
Disaggregation adopted according to the national classification system (land use map of 1998)
Disaggregation as per the IPCC GPG for LULUCF recommendations
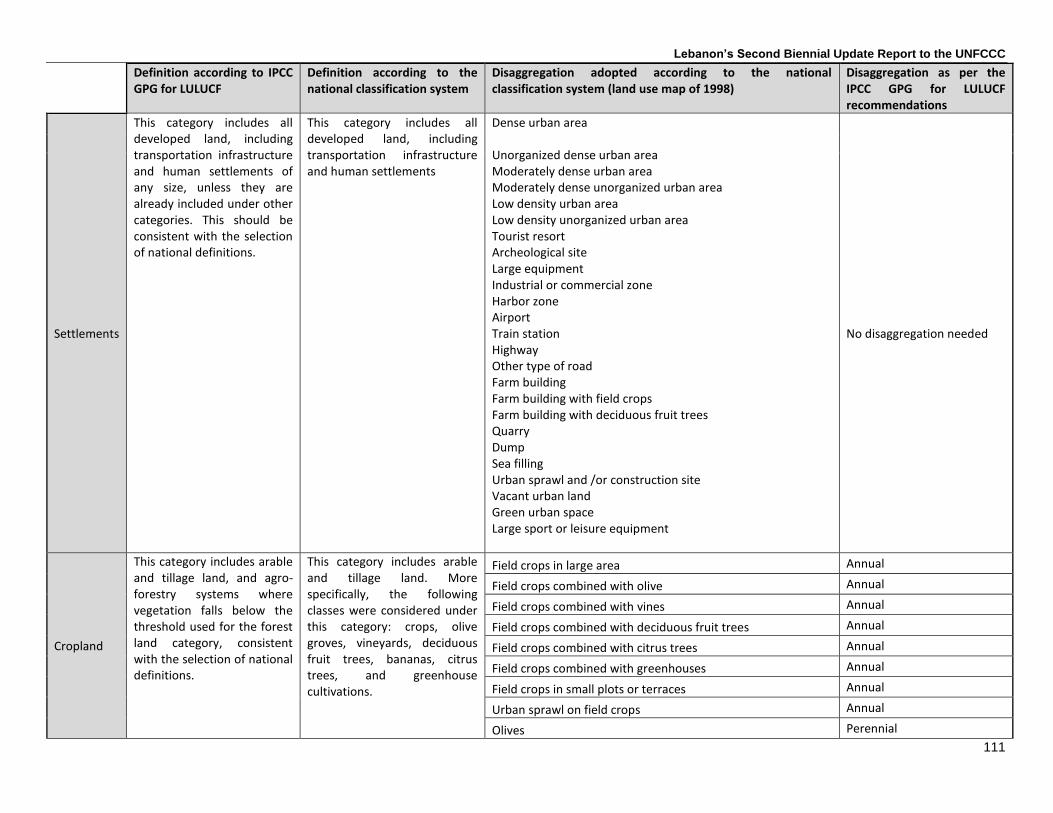
Lebanon’s Second Biennial Update Report to the UNFCCC
111
Definition according to IPCC GPG for LULUCF
Definition according to the national classification system
Disaggregation adopted according to the national classification system (land use map of 1998)
Disaggregation as per the IPCC GPG for LULUCF recommendations
Settlements
This category includes all developed land, including transportation infrastructure and human settlements of any size, unless they are already included under other categories. This should be consistent with the selection of national definitions.
This category includes all developed land, including transportation infrastructure and human settlements
Dense urban area Unorganized dense urban area Moderately dense urban area Moderately dense unorganized urban area Low density urban area Low density unorganized urban area Tourist resort Archeological site Large equipment Industrial or commercial zone Harbor zone Airport Train station Highway Other type of road Farm building Farm building with field crops Farm building with deciduous fruit trees Quarry Dump Sea filling Urban sprawl and /or construction site Vacant urban land Green urban space Large sport or leisure equipment
No disaggregation needed
Cropland
This category includes arable and tillage land, and agro-forestry systems where vegetation falls below the threshold used for the forest land category, consistent with the selection of national definitions.
This category includes arable and tillage land. More specifically, the following classes were considered under this category: crops, olive groves, vineyards, deciduous fruit trees, bananas, citrus trees, and greenhouse cultivations.
Field crops in large area Annual
Field crops combined with olive Annual
Field crops combined with vines Annual
Field crops combined with deciduous fruit trees Annual
Field crops combined with citrus trees Annual
Field crops combined with greenhouses Annual
Field crops in small plots or terraces Annual
Urban sprawl on field crops Annual
Olives Perennial

Lebanon’s Second Biennial Update Report to the UNFCCC
112
Definition according to IPCC GPG for LULUCF
Definition according to the national classification system
Disaggregation adopted according to the national classification system (land use map of 1998)
Disaggregation as per the IPCC GPG for LULUCF recommendations
Olives combined with field crops Perennial
Olives combined with vines Perennial
Olives combined with deciduous fruit trees Perennial
Olives combined with citrus trees Perennial
Olives combined with intensive field crops Perennial
Olives combined with greenhouses Perennial
Vineyards Perennial
Vineyards combined with field crops Perennial
Vineyards combined with olives Perennial
Vineyards combined with deciduous fruit trees Perennial
Vineyards combined with intensive field crops Perennial
Vineyards combined with greenhouses Perennial
Deciduous fruit trees Perennial
Deciduous fruit trees combined with field crops Perennial
Deciduous fruit trees combined with olives Perennial
Deciduous fruit trees combined with vines Perennial
Deciduous fruit trees combined with citrus trees Perennial
Deciduous fruit trees combined with banana trees Perennial
Deciduous fruit trees combined with intensive field crops Perennial
Deciduous fruit trees combined with greenhouses Perennial
Citrus trees Perennial
Citrus trees combined with field crops Perennial
Citrus trees combined with olives Perennial
Citrus trees combined with deciduous fruit trees Perennial
Citrus trees combined with banana trees Perennial
Citrus trees combined with intensive field crops Perennial
Citrus trees combined with greenhouses Perennial
Banana trees Perennial
Banana trees combined with deciduous fruit trees Perennial
Banana trees combined with citrus trees Perennial

Lebanon’s Second Biennial Update Report to the UNFCCC
113
Definition according to IPCC GPG for LULUCF
Definition according to the national classification system
Disaggregation adopted according to the national classification system (land use map of 1998)
Disaggregation as per the IPCC GPG for LULUCF recommendations
Banana trees combined with intensive field crops Perennial
Banana trees combined with greenhouses Perennial
Urban sprawl on orchard Perennial
Intensive filed crops Annual
Intensive filed crops combined with olives Annual
Intensive filed crops combined with deciduous fruit trees Annual
Intensive filed crops combined with citrus trees Annual
Intensive filed crops combined with greenhouses Annual
Greenhouses Annual
Greenhouses combined with field crops Annual
Greenhouses combined with vines Annual
Greenhouses combined with deciduous fruit trees Annual
Greenhouses combined with citrus trees Annual
Greenhouses combined with banana trees Annual
Greenhouses combined with intensive field crops Annual
Urban sprawl on greenhouses Annual
Forest land
Forest: This category includes all land with woody vegetation consistent with thresholds used to define forest land in the national GHG inventory, sub-divided at the national level into managed and unmanaged and also by ecosystem type as specified in the IPCC Guidelines.6 It also includes systems with vegetation that currently falls below, but is expected to exceed, the threshold of the forest land category. Managed forest: All forests
This category included the following:
Dense pine forests (mainly Pinus brutia and Pinus pinea) Coniferous
Dense cedre forests (Cedrus libani) Coniferous
Dense fir forests (Abies Cilicia) Coniferous
Dense cypress forests (Cupressus ssp.) Coniferous
Dense oak forests (Quercus ssp.) Broadleaf
Dense broadleaves forests (Platanus, Populus, Salix) Broadleaf
Mixed dense forests Mixed
Urban sprawl on dense forest Mixed
Low density pine forests (Pinus brutia and Pinus pinea) Coniferous
Low density cedre forests (Cedrus libani) Coniferous
Low density Juniper forests (Juniperus ssp.) Coniferous
Low density fir forests (Abies, Cilicia) Coniferous
Low density cypress forests (Cupressus ssp.) Coniferous
Low density oak forests (Quercus ssp.) Broadleaf
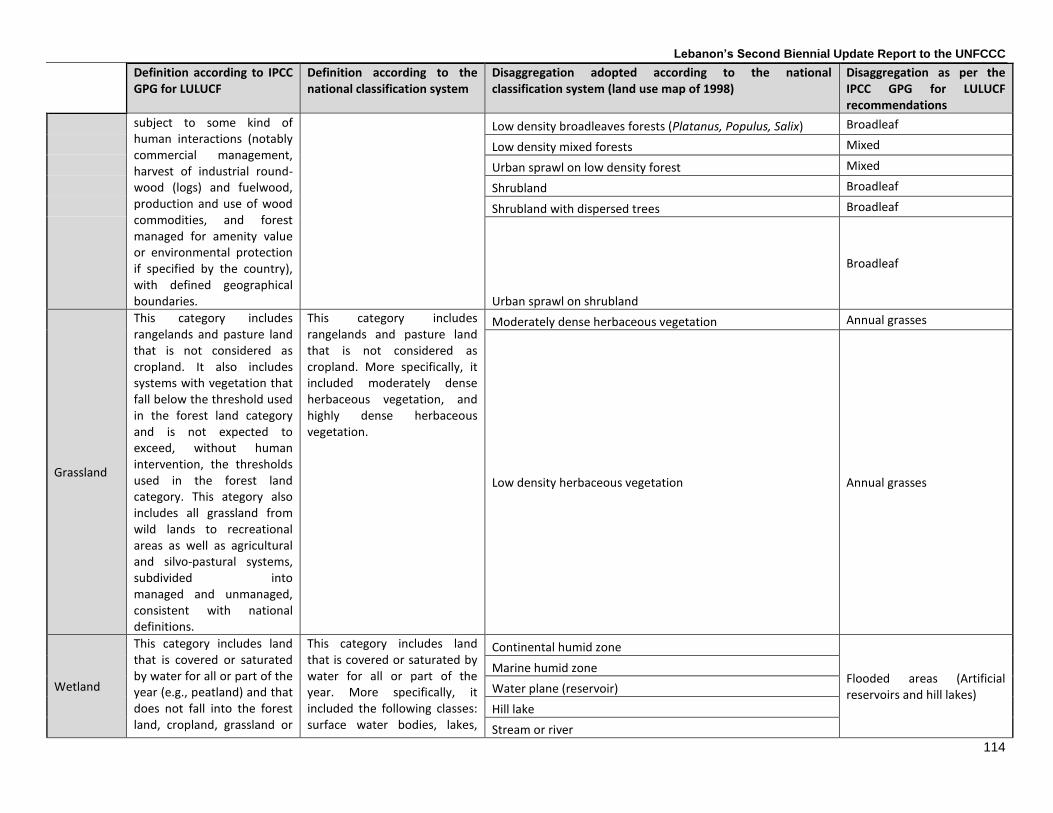
Lebanon’s Second Biennial Update Report to the UNFCCC
114
Definition according to IPCC GPG for LULUCF
Definition according to the national classification system
Disaggregation adopted according to the national classification system (land use map of 1998)
Disaggregation as per the IPCC GPG for LULUCF recommendations
subject to some kind of human interactions (notably commercial management, harvest of industrial round-wood (logs) and fuelwood, production and use of wood commodities, and forest managed for amenity value or environmental protection if specified by the country), with defined geographical boundaries.
Low density broadleaves forests (Platanus, Populus, Salix) Broadleaf
Low density mixed forests Mixed
Urban sprawl on low density forest Mixed
Shrubland Broadleaf
Shrubland with dispersed trees Broadleaf
Urban sprawl on shrubland
Broadleaf
Grassland
This category includes rangelands and pasture land that is not considered as cropland. It also includes systems with vegetation that fall below the threshold used in the forest land category and is not expected to exceed, without human intervention, the thresholds used in the forest land category. This ategory also includes all grassland from wild lands to recreational areas as well as agricultural and silvo-pastural systems, subdivided into managed and unmanaged, consistent with national definitions.
This category includes rangelands and pasture land that is not considered as cropland. More specifically, it included moderately dense herbaceous vegetation, and highly dense herbaceous vegetation.
Moderately dense herbaceous vegetation Annual grasses
Low density herbaceous vegetation Annual grasses
Wetland
This category includes land that is covered or saturated by water for all or part of the year (e.g., peatland) and that does not fall into the forest land, cropland, grassland or
This category includes land that is covered or saturated by water for all or part of the year. More specifically, it included the following classes: surface water bodies, lakes,
Continental humid zone
Flooded areas (Artificial reservoirs and hill lakes)
Marine humid zone
Water plane (reservoir)
Hill lake
Stream or river

Lebanon’s Second Biennial Update Report to the UNFCCC
115
Definition according to IPCC GPG for LULUCF
Definition according to the national classification system
Disaggregation adopted according to the national classification system (land use map of 1998)
Disaggregation as per the IPCC GPG for LULUCF recommendations
settlements categories. This category can be subdivided into managed and unmanaged according to national definitions. It includes reservoirs as a managed sub-division and natural rivers and lakes as unmanaged sub-divisions.
rivers, and reservoirs.
Harbor basin
Other land
This category includes bare soil, rock, ice, and all unmanaged land areas that do not fall into any of the other five categories. It allows the total of identified land areas to match the national area, where data are available.
This category included bare soil, rock, ice, and recently burned forested lands
Bare rock
No need for disaggregation
Urban sprawl on bare rock
Bare soil
Beach
Sand dune
Burned area

Lebanon’s Second Biennial Update Report to the UNFCCC
116
List of activity data
only for calc. purposes Extrapolation Baseline
Interpolation
Interpolation
1993 1994 1995 1996 1997 1998 1999 2000 2001 2002 2003 2004 2005 2006 2007 2008 2009 2010 2011 2012 2013
FF-Total 258646.65 258475.9
5 258304.3
4 258131.7
3 257957.9
8 257890.0
0 257628.1
3 257172.0
0 257142.81 257113.6
3 257059.1
9 256905.9
4 256543.9
4 256236.6
3 256088.2
5 255775.0
0 255575.03 255375.0
6 254771.1
3 254463.1
3 254106.1
9
Coniferous 35274.24 35257.05 35239.76 35222.37 35204.87 35216.00 35187.56 35121.00 35116.50 35112.00 35102.81 35083.69 35063.13 35028.06 35022.31 34977.44 34960.44 34943.44 34887.56 34871.06 34822.44
Broadleaf 196658.18 196517.5
8 196376.2
3 196234.0
6 196090.9
5 196008.0
0 195792.4
4 195451.7
5 195431.06 195410.3
8 195366.6
9 195244.7
5 194924.1
9 194682.3
1 194544.0
6 194300.3
8 194131.47 193962.5
6 193467.0
6 193184.1
3 192925.3
8
Mixed 26714.23 26701.32 26688.35 26675.30 26662.16 26666.00 26648.13 26599.25 26595.25 26591.25 26589.69 26577.50 26556.63 26526.25 26521.88 26497.19 26483.13 26469.06 26416.50 26407.94 26358.38
GG-Total 318130.90 318023.2
9 317915.1
1 317806.2
8 317696.7
5 317600.0
0 317497.1
3 317237.1
3 317212.41 317187.6
9 317158.0
0 317018.8
8 316755.5
6 316573.9
4 316558.2
5 316314.6
9 316180.03 316045.3
7 315697.1
2 315518.0
6 315180.6
2
CC-Total 333242.83 333069.8
0 332895.8
7 332720.9
0 332544.7
9 332364.0
0 332082.1
3 331856.6
9 331819.22 331781.7
5 331669.5
6 331279.9
4 331167.2
5 330804.0
6 330776.7
5 330505.0
6 330081.53 329658.0
0 329415.1
2 328959.3
1 328364.6
9
Perennial 160701.36 160646.4
9 160591.3
3 160535.8
4 160479.9
8 160354.0
0 160287.7
5 160243.2
5 160230.06 160216.8
8 160185.5
6 160126.5
6 160100.6
3 160047.5
0 160041.0
0 159937.6
9 159719.69 159501.6
9 159376.0
6 159235.2
5 158970.0
0
Annual 172541.46 172423.3
2 172304.5
4 172185.0
7 172064.8
1 172010.0
0 171794.3
8 171613.4
4 171589.16 171564.8
8 171484.0
0 171153.3
8 171066.6
3 170756.5
6 170735.7
5 170567.3
8 170361.84 170156.3
1 170039.0
6 169724.0
6 169394.6
9
FF-Burned NE NE NE NE 0.00 1048.63 330.00 73.19 73.19 304.00 62.50 423.69 1197.00 708.00 25.81 427.72 427.72 161.13 603.00 127.56
Coniferous NE NE NE NE 0.00 122.88 54.25 6.47 6.47 31.25 5.31 37.44 126.56 83.44 6.56 59.97 59.97 14.63 37.69 4.75
Broadleaf NE NE NE NE 0.00 870.00 217.06 53.66 53.66 251.88 53.31 347.56 1012.63 568.38 16.56 311.59 311.59 133.56 548.31 44.25
Mixed NE NE NE NE 0.00 55.75 58.69 13.06 13.06 20.88 3.88 38.69 57.81 56.19 2.69 56.16 56.16 12.94 17.00 78.5625
FF-Burned NE NE NE NE 0.00 1048.63 330.00 73.19 73.19 304.00 62.50 423.69 1197.00 708.00 25.81 427.72 427.72 161.13 603.00 127.56
Fuel Type 3 NE NE NE NE 0.00 280.50 98.63 5.94 5.94 204.81 34.44 163.69 631.69 157.81 13.69 184.59 184.59 58.06 262.31 78.5625
Fuel Type 4 NE NE NE NE 0.00 482.69 97.63 31.38 31.38 59.69 17.06 134.56 379.81 213.00 8.00 155.59 155.59 53.06 185.13 44.25
Fuel Type 5 NE NE NE NE 0.00 6.94 14.75 5.34 5.34 12.75 4.19 1.81 32.56 24.56 0.00 7.00 7.00 2.88 10.25 0
Fuel Types 6&7 NE NE NE NE 0.00 278.50 119.00 30.53 30.53 26.75 6.81 123.63 152.94 312.63 4.13 80.53 80.53 47.13 145.31 4.75
GG-Burned NE NE NE NE 0.00 198.38 125.50 148.47 148.47 492.19 96.44 95.94 815.06 42.75 12.56 271.00 271.00 182.38 242.75 37.88
Fuel Type 1 NE NE NE NE 0.00 148.13 78.50 76.44 76.44 287.44 50.06 74.69 638.69 28.19 6.13 206.72 206.72 109.06 184.88 37.875
Fuel Type 2 NE NE NE NE 0.00 50.25 47.00 72.03 72.03 204.75 46.38 21.25 176.38 14.56 6.44 64.28 64.28 73.31 57.88 0
CC-Burned NE NE NE NE 0.00 493.56 501.75 250.94 250.94 528.50 222.69 344.06 334.44 274.81 542.00 675.09 675.09 585.19 1305.81 9.5625
LS-Total 451.34 453.73 456.40 459.40 0.00 646.62 941.56 91.38 91.38 196.31 682.00 738.00 852.13 191.38 828.50 758.16 758.16 1195.06 942.88 1248.25
FS 170.70 171.60 172.61 173.75 261.87 456.13 29.19 29.19 54.44 153.25 362.00 307.31 148.38 313.25 199.97 199.97 603.94 308.00 356.94
Coniferous 17.19 17.28 17.39 17.50 0.00 28.44 66.56 4.50 4.50 9.19 19.13 20.56 35.06 5.75 44.88 17.00 17.00 55.88 16.50 48.625

Lebanon’s Second Biennial Update Report to the UNFCCC
117
Broadleaf 140.60 141.34 142.18 143.11 0.00 215.56 340.69 20.69 20.69 43.69 121.94 320.56 241.88 138.25 243.69 168.91 168.91 495.50 282.94 258.75
Mixed 12.91 12.98 13.05 13.14 0.00 17.88 48.88 4.00 4.00 1.56 12.19 20.88 30.38 4.38 24.69 14.06 14.06 52.56 8.56 49.5625
GS 107.61 108.18 108.82 109.54 0.00 102.88 260.00 24.72 24.72 29.69 139.13 263.31 181.63 15.69 243.56 134.66 134.66 348.25 179.06 296.6875
CS 173.02 173.94 174.96 176.11 0.00 281.88 225.44 37.47 37.47 112.19 389.63 112.69 363.19 27.31 271.69 423.53 423.53 242.88 455.81 594.63
Perennial 54.87 55.16 55.49 55.85 0.00 66.25 44.50 13.19 13.19 31.31 59.00 25.94 53.13 6.50 103.31 218.00 218.00 125.63 140.81 265.25
Annual 118.15 118.77 119.47 120.26 0.00 215.63 180.94 24.28 24.28 80.88 330.63 86.75 310.06 20.81 168.38 205.53 205.53 117.25 315.00 329.375
LF-Total NE NE NE NE 0.00 305.00 305.00 305.00 305.00 278.00 278.00 278.00 278.00 278.00 52.00 52.00 147.73 52.00 381.21 302.62
FAO, 2010 & MOE, 2013 NE NE NE NE 0.00 305.00 305.00 305.00 305.00 278.00 278.00 278.00 278.00 278.00 0.00 0.00 95.73 0.00 95.73
AFDC NO NO NO NO 0.00 0.00 0.00 0.00 0.00 0.00 0.00 0.00 0.00 0.00 52.00 52.00 52.00 52.00 52.00
LRI NO NO NO NO 0.00 0.00 0.00 0.00 0.00 0.00 0.00 0.00 0.00 0.00 0.00 0.00 0.00 0.00 233.48
LW-Total NE NE NE NE 0.00 NE NE NE NE NE NE NE NE NE 37 NE NE NE NE 3597.56
OW NE NE NE NE 0.00 NE NE NE NE NE NE NE NE NE 37 NE NE NE NE 3.75
LC NE NE NE NE 0.00 NE NE NE NE NE NE NE NE NE NE NE NE NE NE NE
LG NE NE NE NE 0.00 NE NE NE NE NE NE NE NE NE NE NE NE NE NE NE
LO NE NE NE NE 0.00 NE NE NE NE NE NE NE NE NE NE NE NE NE NE NE NE: Not Estimated (No activity data available) - NO: Not Occuring
FF = forest land remaining forest land
GG = grassland remaining grassland
CC = cropland remaining cropland
WW = wetlands remaining wetlands
SS = settlements remaining settlements
OO = other land remaining other land
LF = lands converted to forest land
LG = lands converted to grassland
LC = lands converted to cropland
LW = lands converted to wetlands
LS = lands converted to settlements
LO = lands converted to other land

Lebanon’s Second Biennial Update Report to the UNFCCC
118
List of E/R factors
Emission Factor Symbol Page in GPG Land use Category
/Sheet name Value(s) used Source of Value Notes
Average annual net increment in volume suitable for industrial
processing IV 3.26 FF/ FL-1a_1of4 0 IR
not needed anymore since a default for GW is used
Basic wood density D 3.26 FF/ FL-1a_1of4 0 IR not needed anymore since a
default for GW is used
Biomass Expansion factor for conversion of annual net
increment (including bark) to above ground tree biomass
increment
BEF1 3.26 FF/ FL-1a_1of4 0 IR not needed anymore since a
default for GW is used
Average annual aboveground biomass increment
GW
3.26 FF/ FL-1a_1of4 3 (Coniferous), 4
(Broadleaved), 3.5 (Mixed)
IPCC GPG Default Table 3A.1.5
3.26 LF/ FL-2a_1of1 5.725 (Coniferous) IPCC GPG Default Table
3A.1.6, experts' surveys (E. Chneis)
Root-shoot ratio appropriate to increments
R 3.26 FF/ FL-1a_1of4
0.27 FAO 2005 3.26 LF/ FL-2a_1of1
Carbon fraction of dry matter CF
3.25 FF/ FL-1a_2of4
0.5 IPCC GPG Default
3.33 FF/ FL-1b_1of3
3.25 LF/ FL-2a_1of1
3.57 LF/ FL-2b_2of2
3.107 GG/GL-1a_2of2
3.140 WL-2a2_1of1
Annually extracted volume of roundwood
H 3.27 FF/ FL-1a_2of4 0 experts' surveys (E. Chneis, J.
Stephan)
Biomass density D 3.27 FF/ FL-1a_2of4 0.5001
(Coniferous), 0.58 (Broadleaved), 0.54 (Mixed)
FAO 2005, IPCC GPG Table 3A.1.9, (Altaş et al., 2007),
(Aksu et al., 2001)

Lebanon’s Second Biennial Update Report to the UNFCCC
119
Emission Factor Symbol Page in GPG Land use Category
/Sheet name Value(s) used Source of Value Notes
FF/ FL-1a_3of4
Biomass expansion factor for converting volumes of extracted
roundwood to total aboveground biomass (including bark)
BEF2 3.27
FF/ FL-1a_2of4 1.3 (Coniferous),
1.4 (Broadleaved), 1.35 (Mixed)
IPCC GPG Default Table 3A.1.10
FF/ FL-1a_3of4
Fraction of biomass left to decay in forest due to commercial
roundwood gathering FBL 3.27 FF/ FL-1a_2of4 0.15
IPCC GPG Default Table 3A.1.11
Annual volume of fuelwood gathering
FG 3.27 FF/ FL-1a_3of4
Year Non-
coniferous (m
3)
Coniferous
C (m3)
1994 14628 3853
1995 14652 3952
1996 14676 4045
1997 14700 4114
1998 14725 4089
1999 14000 4081
2000 15000 4074
2001 15000 4063
2002 15000 4051
2003 15000 4040
2004 15000 4028
2005 15000 4017
2006 15000 3896
2007 15000 3900
2008 15000 3900
2009 15000 3900
2010 15000 3866
2011 15000 3833
FAOSTAT 2017
NC volumes for the years 1994-1998 and 2012 are generated by extrapolation of the trend from
the years 1999-2011
C volume for the year is generated by extrapolation of the trend from the years 1994-2011

Lebanon’s Second Biennial Update Report to the UNFCCC
120
Emission Factor Symbol Page in GPG Land use Category
/Sheet name Value(s) used Source of Value Notes
2012 14725 4064
2013 15000 3769
Average biomass stock of forest areas
BW 3.28 FF/ FL-1a_3of4 134 (Coniferous),
122 (Broadleaved), 128 (Mixed)
IPCC GPG Default Table 3A.1.2
Fraction of biomass left to decay in forest due to disturbance
Fbl 3.28 FF/ FL-1a_4of4 0.415 IPCC GPG Default Table
3A.1.12
Annual transfer into dead wood Binto 3.33 FF/FL-1b_1of3 0 NA Tier 1 assumes no change
Annual transfer out of dead wood
Bout 3.33 FF/FL-1b_1of3 0 NA Tier 1 assumes no change

Lebanon’s Second Biennial Update Report to the UNFCCC
121
Emission Factor Symbol Page in GPG Land use Category
/Sheet name Value(s) used Source of Value Notes
Reference stock of litter under native, unmanaged forest corresponding to state i
LTref (i) 3.35 FF/FL-1b_1of3 0 NA Tier 1 assumes no change
Adjustment factor reflecting the effect of management intensity or practices on LTref(i) in state i
fmgt
intensity(i) 3.35 FF/FL-1b_2of3 0 NA Tier 1 assumes no change
Adjustment factor reflecting a change in the disturbance regime
on LTref (i) in state i
fdist
regime(i) 3.35 FF/FL-1b_2of3 0 NA Tier 1 assumes no change
Reference stock of litter under previous state j
LTref (j) 3.35 FF/FL-1b_2of3 0 NA Tier 1 assumes no change
Adjustment factor reflecting the effect of management intensity
or practices on LTref (j)
fmgt
intensity(j) 3.35 FF/FL-1b_2of3 0 NA Tier 1 assumes no change
Adjustment factor reflecting a change in the disturbance regime
on LTref (j)
fdist
regime(j) 3.35 FF/FL-1b_2of3 0 NA Tier 1 assumes no change
Time period of the transition from state i to j
Tij 3.35 FF/ FL-1b_3of3
20 IPCC GPG Default
3.40 FF/ FL-1c1_1of2
Reference carbon stock SOCREF
3.40 FF/FL-1c1_1of2 38 (forest soils) IPCC GPG Default Table 3.2.4
3.63 LF/FL-2c1_1of1
3.75 CC/CL-1c1_1of2 38 (cropland soils) IPCC GPG Default Table 3.3.3
3.112 GG/GL-1c1_1of2 38 (grassland soils) IPCC GPG Default Table 3.4.4

Lebanon’s Second Biennial Update Report to the UNFCCC
122
Emission Factor Symbol Page in GPG Land use Category
/Sheet name Value(s) used Source of Value Notes
Adjustment factor reflecting the effect of a change from the
native forest to the forest type in state i
fforest type
i 3.40 FF/FL-1c1_1of2 0 NA Tier 1 assumes no change
Adjustment factor reflecting the effect of management intensity or practices on forest in state i
fman
intensity i 3.40 FF/FL-1c1_1of2 0 NA Tier 1 assumes no change
Adjustment factor reflecting the effect of a change in the
disturbance regime to state i with respect to the native forest
fdist regime
i 3.40 FF/FL-1c1_1of2 0 NA Tier 1 assumes no change
Adjustment factor reflecting the effect of a change from the
native forest to the forest type in state j
fforest type
j 3.40 FF/FL-1c1_2of2 0 NA Tier 1 assumes no change
Adjustment factor reflecting the effect of management intensity or practices on forest in state j
fman
intensity j 3.40 FF/FL-1c1_2of2 0 NA Tier 1 assumes no change
Adjustment factor reflecting the effect of a change in the
disturbance regime to state j with respect to the native forest
fdist regime
j 3.40 FF/FL-1c1_2of2 0 NA Tier 1 assumes no change

Lebanon’s Second Biennial Update Report to the UNFCCC
123
Emission Factor Symbol Page in GPG Land use Category
/Sheet name Value(s) used Source of Value Notes
Emission factor for CO2 from drained organic forest soils
EFDrainage
3.42 FF/FL-1c2_1of1
0 IR No organic soils (Expert's surveys,
T. Darwish) 3.63 LF/FL-2c1_1of1
Mass of available fuel B 3.49 FF/FL-1d_1of1
12,500 (fuel type 3), 30,000 (fuel
type 4), 9,500 (fuel type 5), 12,500 (fuel type 6, 7)
(TRAGSA, 2012)
Combustion efficiency or fraction of biomass combusted
C
3.49 FF/FL-1d_1of1
0.5 IPCC GPG Default Table
3.120 GG/GL-1d_1of1
CH4 Emission factor D 3.49 FF/FL-1d_1of1 9 IPCC GPG Default Table
3A.1.16
CO Emission factor F 3.49 FF/FL-1d_1of1 130 IPCC GPG Default Table
3A.1.16
N2O Emission factor H 3.49 FF/FL-1d_1of1 0.11 IPCC GPG Default Table
3A.1.16
NOx Emission factor J 3.49 FF/FL-1d_1of1 0.7 IPCC GPG Default Table
3A.1.16
Standing biomass stock in terms of carbon in naturally
regenerated forest
Bstanding
NatR 3.57 LF/FL-2b_1of2 0 IR No data on natural regeneration
Mortality rate in naturally regenerated forest
MNatR 3.57 LF/FL-2b_1of2 0 IR No data on natural regeneration

Lebanon’s Second Biennial Update Report to the UNFCCC
124
Emission Factor Symbol Page in GPG Land use Category
/Sheet name Value(s) used Source of Value Notes
Annual transfer out of dead wood for naturally regenerated
forest area Bout NatR 3.57 LF/FL-2b_1of2 0 IR No data on natural regeneration
Standing biomass stock in terms of carbon in artificially
regenerated forest
Bstanding
ArtR 3.57 LF/FL-2b_1of2 0 NA Tier 1 assumes no change
Mortality rate in artificially regenerated forest
MArtR 3.57 LF/FL-2b_1of2 0 NA Tier 1 assumes no change
Annual transfer out of dead wood for artificially regenerated
forest area Bout ArtR 3.57 LF/FL-2b_2of2 0 NA Tier 1 assumes no change
Annual change in litter carbon for naturally regenerated forest
DCNatR 3.57 LF/FL-2b_2of2 0 IR No data on natural regeneration
Annual change in litter carbon for artificially regenerated forest
DCArtR 3.57 LF/FL-2b_2of2 1 IPCC GPG Default Table 3.2.1,
experts' surveys (E. Chneis)
Stable soil organic carbon on previous land use, either
cropland or grassland, SOCNon-forest Land
SOCNon-
forest_land 3.63 LF/FL-2c1_1of1 0 IPCC GPG Default
Duration of the transition from SOCNon-forest Land to SOCref
TAFF 3.63 LF/FL-2c1_1of1 20 IPCC GPG Default
Annual growth rate of perennial woody biomass
G 3.71 CC/CL-1a_1of1 2.1 (unburned
perennial woody crops)
IPCC GPG Default Table 3.3.2

Lebanon’s Second Biennial Update Report to the UNFCCC
125
Emission Factor Symbol Page in GPG Land use Category
/Sheet name Value(s) used Source of Value Notes
Annual carbon stock in biomass removed
L 3.71 CC/CL-1a_1of1 63 (burned
perennial woody crops)
IPCC GPG Default Table 3.3.2
Inventory time period T
3.75 CC/CL-1c1_1of2
20 IPCC GPG Default
3.112 GG/GL-1c1_1of2
Stock change factor for land use or land-use change type in the
beginning of inventory year FLU(0-T) 3.75 CC/CL-1c1_1of2 0.82
IPCC GPG Default Table 3.3.4, experts' surveys (J. Stephan)
Stock change factor for management regime in the beginning of inventory year
FMG(0-T) 3.75 CC/CL-1c1_1of2 1 IPCC GPG Default Table 3.3.4, experts' surveys (J. Stephan)
Stock change factor for input of organic matter in the beginning
of inventory year FI(0-T) 3.75 CC/CL-1c1_1of2 1
IPCC GPG Default Table 3.3.4, experts' surveys (J. Stephan)
Stock change factor for land use or land-use change type in
current inventory year FLU(0) 3.75 CC/CL-1c1_2of2 0.82
IPCC GPG Default Table 3.3.4, experts' surveys (J. Stephan)
Stock change factor for management regime in current
inventory year FMG(0) 3.75 CC/CL-1c1_2of2 1
IPCC GPG Default Table 3.3.4, experts' surveys (J. Stephan)
Stock change factor for input of organic matter in current
inventory year FI(0) 3.75 CC/CL-1c1_2of2 1
IPCC GPG Default Table 3.3.4, experts' surveys (J. Stephan)
Emission factor for climate type c EF 3.79 CC/CL-1c2_1of1 0 IR No organic soils (Expert's surveys,
T. Darwish)

Lebanon’s Second Biennial Update Report to the UNFCCC
126
Emission Factor Symbol Page in GPG Land use Category
/Sheet name Value(s) used Source of Value Notes
3.114 GG/GL-1c2_1of1
Type of lime type
3.80 CC/CL-1c3_1of1
0 IR No lime applied (experts' surveys,
J. Stephan) 3.115 GG/GL-1c3_1of1
Total Annual amount of lime applied
amount
3.80 CC/CL-1c3_1of1
0 Experts' surveys (J. Stephan) No lime applied
3.115 GG/GL-1c3_1of1
Emission Factor (carbonate carbon contents of the materials)
EF
3.80 CC/CL-1c3_1of1
0 IR No lime applied
3.115 GG/GL-1c3_1of1
Average annual biomass growth of perennial woody biomass
Gperennial 3.107 GG/GL-1a_1of2 0 IR No grasslands covered with perennial woody biomass
Average annual biomass loss of perennial woody biomass
Lperennial 3.107 GG/GL-1a_1of2 0 IR No grasslands covered with perennial woody biomass
Average annual biomass growth of grasses
Ggrasses 3.107 GG/GL-1a_2of2 0 NA Tier 1 assumes no change
Average annual biomass loss of grasses
Lgrasses 3.107 GG/GL-1a_2of2 0 NA Tier 1 assumes no change
Stock change factor for land use or land-use change type in the
beginning of inventory year FLU(0-T) 3.112 GG/GL-1c1_1of2 1 IPCC GPG Default Table 3.4.5

Lebanon’s Second Biennial Update Report to the UNFCCC
127
Emission Factor Symbol Page in GPG Land use Category
/Sheet name Value(s) used Source of Value Notes
Stock change factor for management regime in the beginning of inventory year
FMG(0-T) 3.112 GG/GL-1c1_1of2 0.95 IPCC GPG Default Table 3.4.5,
Darwish & Faour (2008)
Stock change factor for input of organic matter in the beginning
of inventory year FI(0-T) 3.112 GG/GL-1c1_1of2 1
IPCC GPG Default Table 3.4.5, experts' surveys (J. Stephan)
Stock change factor for land use or land-use change type in
current inventory year FLU(0) 3.112 GG/GL-1c1_2of2 1 IPCC GPG Default Table 3.4.5
Stock change factor for management regime in current
inventory year FMG(0) 3.112 GG/GL-1c1_2of2 0.95
IPCC GPG Default Table 3.4.5, Darwish & Faour (2008)
Stock change factor for input of organic matter in current
inventory year FI(0) 3.112 GG/GL-1c1_2of2 1
IPCC GPG Default Table 3.4.5, experts' surveys (J. Stephan)
Mass of available fuel B 3.120 GG/GL-1d_1of1 5,000 (fuel type 1), 6,500 (fuel type 2)
(TRAGSA, 2012)
CH4 Emission factor D 3.120 GG/GL-1d_1of1 3 IPCC GPG Default Table
3A.1.16
CO Emission factor F 3.120 GG/GL-1d_1of1 97 IPCC GPG Default Table
3A.1.16
N2O Emission factor H 3.120 GG/GL-1d_1of1 0.11 IPCC GPG Default Table
3A.1.16
NOx Emission factor J 3.120 GG/GL-1d_1of1 7 IPCC GPG Default Table
3A.1.16
Living biomass immediately following conversion to flooded
land BAfter 3.140 WL-2a2_1of1 0 IPCC GPG Default

Lebanon’s Second Biennial Update Report to the UNFCCC
128
Emission Factor Symbol Page in GPG Land use Category
/Sheet name Value(s) used Source of Value Notes
Living biomass in land immediately before conversion
to flooded land BBefore 3.140 WL-2a2_1of1 6.08
IPCC GPG Default Tables 3.4.2, 3.4.3
Carbon stock in living biomass immediately following
conversion to settlements CAfter 3.143 LS/ SL-2a_1of1 0 IPCC GPG Default
Carbon stock in living biomass in forest immediately before conversion to settlements
CBefore 3.143 LS/ SL-2a_1of1
5 (Annual crops), 63 (Perennial
woody crops), 0.8 (Grasslands), 67
(Coniferous forests), 61
(Broadleaved forests), 64 (Mixed
forests)
IPCC GPG Default Tables 3.4.8, 3.3.2, 3.4.2, 3A.1.2
IR: Irrelevant NA: Not Available

Lebanon’s Second Biennial Update Report to the UNFCCC
129
Annex V. Recalculations
Sector Recalculated categories
Parameter changed Reasons for recalculation Years of recalculations Impact of recalculation
Energy Residential Change in Biomass New data on charcoal production added to biomass use in energy
Inclusion of emission factors of non-CO2 gases
1994-2012
Industrial processes
Production of Lime
Quantity of lime produced Revision of data provided by the lime plant 2004 - 2012 An average 11% yearly decrease in CO2 emissions over the period 2004 - 2012
Agriculture Domestic livestock: enteric fermentation and manure management
Dairy cows Revision of numbers by MoA 2008 – 2011 - 2012 An average of 3.3% yearly decrease of CH4 emissions over the period 2005 – 2012. An average of 1.9% yearly decrease of N2O emissions over the period 2005 -2012.
Other cattle The source in previous inventory was FAO and Syndicate of beef importers. This inventory adopted a long-term approach of collecting data from the MoA, which does not include beef import in their statistics.
1998 - 2012
Sheep Revision of numbers by MoA 2008 – 2011 - 2012
Goats Revision of numbers by MoA 2008 – 2011 - 2012
Camels Revision of numbers by FAOSTAT 2011 - 2012
Poultry Revision of numbers by MoA 1998 – 2012 except 2004 and 2007
Agricultural soils
Dry beans, broad beans and horse beans, chick peas, lentils, dry peas, green peas, oats, carrot and turnips, garlic, onions
Revision of numbers by FAOSTAT 2010 - 2012 An average of 4.5% yearly decrease of N2O emissions over the period 2005 -2012.
Green beans Revision of numbers by FAOSTAT 2012
lupins, barley, maize, potatoes Revision of numbers by FAOSTAT 2010
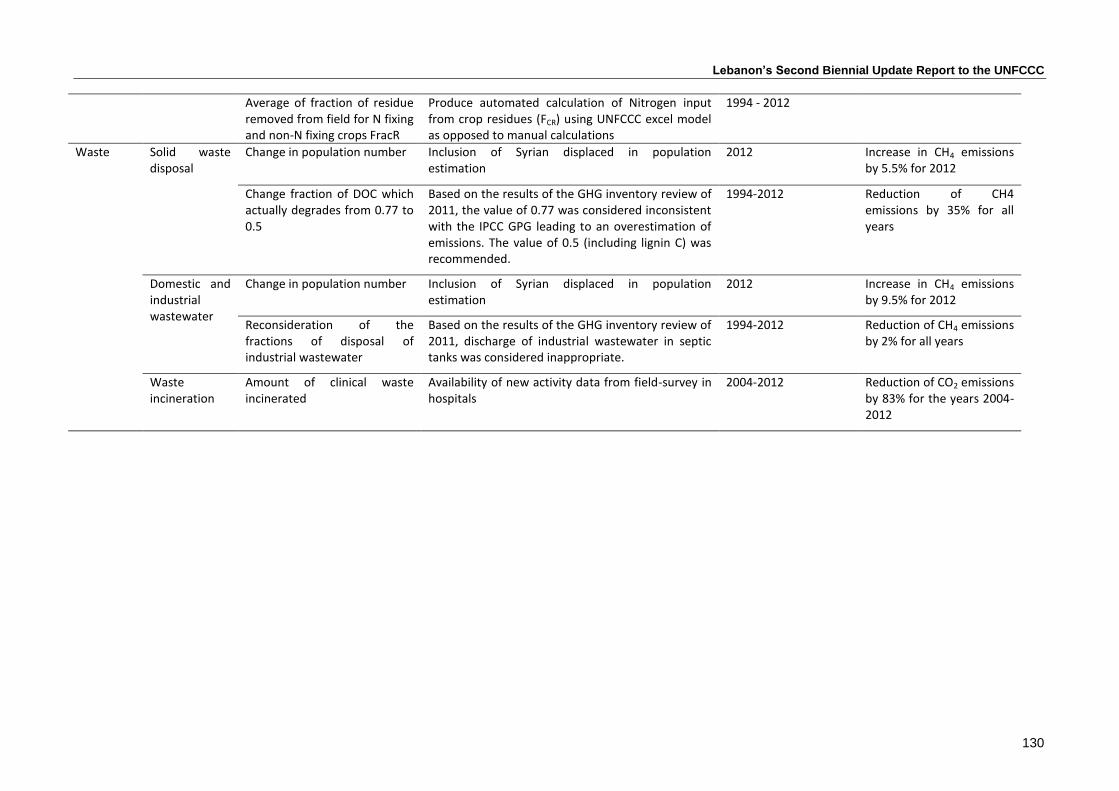
Lebanon’s Second Biennial Update Report to the UNFCCC
130
Average of fraction of residue removed from field for N fixing and non-N fixing crops FracR
Produce automated calculation of Nitrogen input from crop residues (FCR) using UNFCCC excel model as opposed to manual calculations
1994 - 2012
Waste Solid waste disposal
Change in population number Inclusion of Syrian displaced in population estimation
2012 Increase in CH4 emissions by 5.5% for 2012
Change fraction of DOC which actually degrades from 0.77 to 0.5
Based on the results of the GHG inventory review of 2011, the value of 0.77 was considered inconsistent with the IPCC GPG leading to an overestimation of emissions. The value of 0.5 (including lignin C) was recommended.
1994-2012 Reduction of CH4 emissions by 35% for all years
Domestic and industrial wastewater
Change in population number Inclusion of Syrian displaced in population estimation
2012 Increase in CH4 emissions by 9.5% for 2012
Reconsideration of the fractions of disposal of industrial wastewater
Based on the results of the GHG inventory review of 2011, discharge of industrial wastewater in septic tanks was considered inappropriate.
1994-2012 Reduction of CH4 emissions by 2% for all years
Waste incineration
Amount of clinical waste incinerated
Availability of new activity data from field-survey in hospitals
2004-2012 Reduction of CO2 emissions by 83% for the years 2004-2012

Lebanon’s Second Biennial Update Report to the UNFCCC
131
Annex VI. Mitigation actions of energy sector
1. Data collection
Data has been collected per sub-category and split by year, using official publications and references from governmental authorities, in addition to personal interviews and online questionnaires submitted to implementing agencies and local suppliers. The references used and stakeholders consulted provide a comprehensive overview of the energy mitigation initiatives undertaken during the period 2012-2013. The collected information has then been merged to report progress by year, and by initiative-leader (private sector, donor or government). Cumulative energy savings and GHG emission reductions are then presented for two milestone years, 2013 and 2030: The first for energy and GHG savings and the second for energy and GHG avoided.
Data collection for Mitigation actions in the energy sector
Category Data Collection Calculation Reference
1 Decentralized PV Installations
MoEW/UNDP/GEF, 2016 CEDRO, 2017 LCEC, 2016
MoE, 2017c Jordan and Kurtz, 2012 Expert judgement
2 Solar Water Pumping
MoEW/UNDP/GEF, 2016 UNDP, 2015 LCEC, 2016
MoE, 2017c Jordan and Kurtz, 2012 Expert judgement
3 Solar Street Lighting
MoEW, 2015 MoEW/LCEC, 2011 CEDRO, 2017 CEDRO, 2015
MoE, 2017c Jordan and Kurtz, 2012 Expert judgement
4 Efficient Street Lighting
MoEW, 2015 MoEW/LCEC, 2011 CEDRO, 2017 CEDRO, 2015
MoE, 2017c LCEC, 2017a
5 Solar Water Heating
UNEP, 2016 CEDRO, 2017
MoE, 2017c
6 Certified Green Buildings
USGBC, 2017 BREEAM, 2017
MoE, 2017c ASHRAE, 2009 Expert judgment
7 Energy Conservation Measures
CEDRO, 2017 LCEC, 2017b Shehadeh, 2017 Bsaibes, 2017 Diab, 2017
MoE, 2017c Expert judgment
8 Biomass Space Heating
CEDRO, 2017 Sfeir, 2017
MoE, 2017c Expert judgment
9 Other Renewables
CEDRO, 2017
MoE, 2017c Expert judgment Jordan and Kurtz, 2012
10 Other Energy Efficiency Measures MoE, 2017a MoE, 2017a
11 Power plants MoEW, 2015 MoEW, 2015

Lebanon’s Second Biennial Update Report to the UNFCCC
132
2. Assumptions and calculation methodology
Emission factor
Quantification of greenhouse gas emission reductions is done using national grid emission factors as calculated by the Ministry of Environment. The emission factors are provided for the years 2011 to 2013, split into three sources as presented in the following table. GHG reductions are calculated on yearly basis with the relevant emission factors per year, and the source of power used for the affected systems. For example, GHG emission reductions for street lighting use the EDL grid emission factor, while that for decentralized PV generation uses the EDL and Private Generation grid emission factor. Grid Emission Factor (Tons CO2 eq/KWh)
2011 2012 2013
EDL 0.667096 0.667096 0.667096
Private Generation 0.710861 0.710861 0.710861
EDL + Private Generation 0.682 0.682 0.682
Budget calculation
In most cases, budgets are provided by the implementing agency, the donor, or the supplier. In case this data is not made available, the following assumptions are used: Category Assumptions References
PV The average yearly system budget as reported in the 2015 Solar PV Status Report for Lebanon (MoEW/UNDP/GEF, 2017) is used. This is provided in USD/kWp for years prior to 2010, where no cost per kWp is available, the 2010 average is used.
MoEW/UNDP/GEF, 2017 MoE, 2017
PV Public Street Lights
For some installations, average pole price for the installation year is used
UNEP, 2016
Certified Green Buildings
Green building energy measures are not presented with budgets. The implementation cost is estimated using average payback period of 10 years and average energy cost of 12 USC/kWh.
ASHRAE, 2009
Energy Conservation Measures
When energy efficiency measures are not presented with budgets, the implementation cost is estimated using average payback period of 5 years and average energy cost of 12 USC/kWh. This value is a result of more than 200 energy efficiency measures studies and financial feasibility analysis.
CEDRO, 2017
Capacity and energy efficiency factors Energy generation potential for renewable energy sources is dependent on the deployed technology and the available resources in the country. In order to quantify the generated energy, capacity factors (kWh/kW) rates are used for the different technologies. These factors are collected from national and international reports and publications. The capacity factor is only used when there is no reported energy savings for the undertaken initiative.

Lebanon’s Second Biennial Update Report to the UNFCCC
133
Capacity factors of RE systems
Category kWh/kW Reference
PV 1,500 MoEW/UNDP/GEF, 2017
Wind 1,727 CEDRO, 2017
SWH 1,006 UNEP, 2016
PVPSL 2,920 LCEC, 2017a
PV Pumping 1,350 MoEW/UNDP/GEF, 2017
PV-Wind 1,433 CEDRO, 2017
Hydro 3,000 Expert judgment
Biomass 2,000 Expert judgment
In order to calculate savings energy efficiency factors, lifespan, degradation and other parameters
are estimated as per the following assumptions:
Assumptions for calculating savings from energy efficiency
Category Assumptions References
Energy Efficient Street Lighting
Photosensor and timers installed on a public street lighting pole save an average of 74.47 kWh/year. This value is reported by LCEC in the NEEAP
MoEW/LCEC, 2016
Certified Green Buildings
Quantification of energy savings is done collecting the following information:
- Building size in m2 (from company website or USGBC database)
- Business as usual consumption based on ASHRAE standards (Ref #6)
- Energy consumption reduction is based on the EAC1 score, which identifies the % of energy consumption reduction compared to BAU"
ASHRAE, 2009
Energy Conservation Measures
Green roofs save an average of 5.26 kWh/m2
per year. This value is a result of an energy modeling performed to a conditioned last roof floor.
CEDRO, 2017
Assumptions for calculating lifespan and degradation
Category Lifespan Degradation Market Characteristics
Solar PV Panels Lifespan of PV panels is considered 25 years (MoEW/UNDP/GEF, 2017; MoE, 2017)
Efficiency degradation of 0.4% per year for PV panels (MoEW/UNDP/GEF, 2017; MoE, 2017)
Solar Public Street Lighting
The lifespan used is only four years. Although these systems live longer, but it has been observed that systems are no longer in operation after 4 years, due to the need for new batteries that cannot be afforded by municipalities (UNEP, 2016)
Data available is related to number of poles but not power capacity. In order to quantify the power capacity

Lebanon’s Second Biennial Update Report to the UNFCCC
134
of the system, averages of 120 W/pole and 240 W/pole are used (UNEP, 2016)
Energy Efficient Street Lighting
LED Lamps live for around 50,000 hours. With an average of 10 hrs of operation a day (MoEW, 2015)
Solar Water Heaters
Lifespan of SWH systems is considered 25 years (MoEW/LCEC, 2011)
Efficiency degradation of 0.25% per year for solar thermal panels (MoEW/LCEC, 2011)
Average system cost: $370/m
2
Average system collection area: 4.12 m
2
kW capacity per m2: 0.7 kW/m
2
Energy saving potential: 704 kWh/m
2
(MoEW/LCEC, 2011)
Biomass Boilers Lifespan of stoves is considered 25 years (Jordan and Kurtz, 2012)
Other Renewable Energy
The installed micro-hydro system worked for 2 years only and then stopped operation (expert judgment)
For installations taking place before 2012, and in order to quantify the energy saving potential, cumulative installed capacity is assumed to be installed in the middle of the timeframe of the initiative. Collected data is provided on yearly basis not monthly basis, so there is no exact reference of the period of initiative implementation (beginning of year or end of year). An assumption that it is being implemented on the 1st of July, thus multiplying kWh and GHG emissions by 0.5. 3. Individual Factsheets on energy mitigation actions
Decentralized Solar PV Installations
Solar PV installations in residences, commercial institutions, and industrial facilities for power generation.
Source of funding Private NEEREA Donor Government
Implementing agency Private Companies LCEC-BDL CEDRO-UNDP -
Geographic Coverage Lebanon Lebanon Lebanon -
Budget (USD) $14,648,293 $12,342,796 $12,955,338 $0
Capacity (kW) 4,092 3,758 611 0
kWh Saving/yr 6,524,468 5,651,280 963,975 0
Gg CO2 Reduction/yr 4.462 3.862 0.925 0.000
kWh Avoided/yr 0 0 0 0
Gg CO2 Avoided/yr 0.000 0.000 0.000 0.000

Lebanon’s Second Biennial Update Report to the UNFCCC
135
Timeframe 2000 - 2016
Goals
Reduction of GHG emissions by EDL and private generation
Spread of decentralized power generation
Promotion of renewable energy as an alternative source of power to diesel generators
Cum. Energy Savings
(kWh) Cum. CO2 Reduction
(Gg of CO2 eq.)
Cum. Energy Avoided (kWh)
Cum. CO2 Avoided (Gg of CO2 eq.)
2013 3,897,184 2.811 0 0.000
2030 213,880,900 150.595 0 0.000
Methodology & Assumptions
Initiative budget is calculated using yearly system budget (USD/kWp) as reported in Ref #1
Cost rate for years prior to 2010 are not available, thus 2010 average is used for earlier years.
Lifespan of PV panels is considered 25 years (according to market data)
Efficiency degradation of 0.4% per year for PV panels as reported by NREL (Ref #8)
Average capacity factor for PV generators is considered 1500 kWh/kW
Emission factor used for EDL with private generation, varying by year based on the energy mix in that year (Ref #2)
Collected data is provided on yearly basis not monthly basis, so there is no exact reference of the period of initiative implementation (beginning of year or end of year). An assumption that it is being implemented on the 1st of July, thus multiplying kWh and GHG emissions by 0.5
For installations taking place before 2012, and in order to quantify the energy saving potential, cumulative installed capacity is assumed to be installed in the middle of the timeframe of the initiative
Gaps & Constraints
Installations before 2012 are available in cumulative numbers. Thus the average emission factor and budget estimate for the year 2010 and 2011 are used
Data collected for PV installations are supposed to be covering the whole Lebanese market, yet the survey performed does not cover 100% of the suppliers in Lebanon
Donor funded projects include CEDRO implementations only. Other donor-funded installations that might have taken place are within the privately-installed cumulative values
Solar-Powered Water Pumping
Solar PV installations for agricultural applications and water pumping
Source of funding Private NEEREA Donor Government
Implementing agency Private Companies LCEC-BDL USAID-OTI & UNDP -
Geographic Coverage Lebanon Lebanon Bekaa -
Budget (USD) $1,251,915 $10,478,096 $151,000 $0
Capacity (kW) 507 1,220 91 0
kWh Saving/yr 684,450 1,647,000 122,850 0
Gg CO2 Reduction/yr 0.475 0.844 0.087 0.000
kWh Avoided/yr 0 0 0 0

Lebanon’s Second Biennial Update Report to the UNFCCC
136
Gg CO2 Avoided/yr 0.000 0.000 0.000 0.000
Timeframe 2000 - 2016
Goals Reduction of GHG emissions by EDL and private generation
Promotion of solar pumping as an alternative solution to onsite diesel generators
Cum. Energy Savings
(kWh) Cum. CO2 Reduction
(Gg of CO2 eq.)
Cum. Energy Avoided (kWh)
Cum. CO2 Avoided (Gg of CO2 eq.)
2013 91,433 0.062 0 0.000
2030 39,061,975 22.214 0 0.000
Methodology & Assumptions
Initiative budget is calculated using yearly system budget (USD/kWp) as reported in Ref #1
Lifespan of PV panels is considered 25 years (according to market data)
Efficiency degradation of 0.4% per year for PV panels as reported by NREL (Ref #8)
Average capacity factor for PV generators is considered 1350 kWh/kW
Emission factor used for EDL with private generation, varying by year based on the energy mix in that year (Ref #2)
Collected data is provided on yearly basis not monthly basis, so there is no exact reference of the period of initiative implementation (beginning of year or end of year). An assumption that it is being implemented on the 1st of July, thus multiplying kWh and GHG emissions by 0.5
For installations taking place before 2012, and in order to quantify the energy saving potential, cumulative installed capacity is assumed to be installed in the middle of the timeframe of the initiative
Gaps & Constraints
Data collected for PV installations are supposed to be covering the whole Lebanese market, yet the survey performed does not cover 100% of the suppliers in Lebanon
Donor funded projects include USAID and UNDP implementations only. Other donor-funded installations that might have taken place are within the privately-installed cumulative values
Solar-Powered Public Street Lighting
Solar PV for public streetlights. Includes addition of new poles and replacement of existing poles
Source of funding Private NEEREA Donor Government
Implementing agency - - UNDP, UNIFIL MPW, MEW
Geographic Coverage - - Lebanon Lebanon
Budget (USD) $0 $0 $2,807,000 $4,853,533
Capacity (kW) 0 0 354 433
kWh Saving/yr 0 0 0 1,264,360
Gg CO2 Reduction/yr 0.000 0.000 0.000 0.864
kWh Avoided/yr 0 0 1,032,979 0
Gg CO2 Avoided/yr 0.000 0.000 0.625 0.000

Lebanon’s Second Biennial Update Report to the UNFCCC
137
Timeframe 2012 - 2016
Goals
Reduction of GHG emissions by EDL and private generation
Improving safety and enhancing security levels in rural areas
Promotion of decentralized street lighting solutions
Cum. Energy Savings
(kWh) Cum. CO2 Reduction
(Gg of CO2 eq.)
Cum. Energy Avoided (kWh)
Cum. CO2 Avoided (Gg of CO2 eq.)
2013 471,148 0.314 79,223 0.025
2030 21,043,149 14.369 4,629,813 2.802
Methodology & Assumptions
Budget data are collected from publications when available. If not available, average pole price for the year is used
Data available is related to number of poles but not power capacity. In order to quantify the power capacity of the system, averages of 120 W/pole and 240 W/pole are used
Lifespan of 4 years is used. Although these systems live longer, but it has been observed that systems are no longer in operation after 4 years, due to the need for new batteries that cannot be afforded by municipalities
Efficiency degradation of 0.4% per year for PV panels as reported by NREL (Ref #8)
Average capacity factor for PV street lights is considered 2920 kWh/kW
Emission factor used for EDL, varying by year based on the energy mix in that year (Ref #2)
Collected data is provided on yearly basis not monthly basis, so there is no exact reference of the period of initiative implementation (beginning of year or end of year). An assumption that it is being implemented on the 1st of July, thus multiplying kWh and GHG emissions by 0.5
Data about installed systems are collected from UNDP, MEW, Newspapers, and the PSL report
For installations taking place before 2012, and in order to quantify the energy saving potential, cumulative installed capacity is assumed to be installed in the middle of the timeframe of the initiative
Gaps & Constraints
Installations before 2012 are available in cumulative numbers. Thus the average emission factor and budget estimate for the year 2010 and 2011 are used
There is no national report that provides accurate numbers about installations
Donor funded projects include CEDRO, UNIFIL, and Live Lebanon implementations only. Other donor-funded installations that might have taken place are within the privately-installed cumulative values
Energy-Efficient Public Street Lighting
Replacement of existing HPS and LPS street lamps with LED street lamps and the use of photocells and timers
Source of funding Private NEEREA Donor Government
Implementing agency - - CEDRO-UNDP -
Geographic Coverage - - Lebanon -
Budget (USD) $0 $0 $242,000 $64,345
Capacity (kW) 0 0 44 0
kWh Saving/yr 0 0 127,195 109,843

Lebanon’s Second Biennial Update Report to the UNFCCC
138
Gg CO2 Reduction/yr 0.000 0.000 0.085 0.073
kWh Avoided/yr 0 0 0 0
Gg CO2 Avoided/yr 0.000 0.000 0.000 0.000
Timeframe 2012 - 2013
Goals
Reduction of GHG emissions by EDL and private generation
Improving safety and enhancing security levels in rural areas
Reduction of wasted energy and programming street lights to operate when needed only
Cum. Energy Savings
(kWh) Cum. CO2 Reduction
(Gg of CO2 eq.)
Cum. Energy Avoided (kWh)
Cum. CO2 Avoided (Gg of CO2 eq.)
2013 245,714 0.164 0 0.000
2030 3,508,568 2.341 0 0.000
Methodology & Assumptions
Emission factor used for EDL with private generation, varying by year based on the energy mix in that year (Ref #2)
LED Lamps live for around 50,000 hours. With an average of 10 hrs of operation a day
Collected data is provided on yearly basis not monthly basis, so there is no exact reference of the period of initiative implementation (beginning of year or end of year). An assumption that it is being implemented on the 1st of July, thus multiplying kWh and GHG emissions by 0.5
According to MEW and NEEAP, Photosensor and timers save 74.47 kWh/yr
For installations taking place before 2012, and in order to quantify the energy saving potential, cumulative installed capacity is assumed to be installed in the middle of the timeframe of the initiative
Gaps & Constraints Savings are calculated assuming all photosensor and timers are installed immediately and
properly maintained. In fact some were installed at a later stage, and others are not properly maintained, which reduces their performance and saving potential
Solar Water Heating
solar water heating systems in residential, commercial, industrial, and public institutions
Source of funding Private NEEREA Donor Government
Implementing agency Private Companies LCEC-BDL CEDRO, SIDA, Ital
Coop -
Geographic Coverage Lebanon Lebanon Lebanon -
Budget (USD) $104,833,196 $6,666,304 $2,298,108 $0
Capacity (kW) 404,761 25,739 5,012 0
kWh Saving/yr 310,885,189 20,211,011 5,776,572 0
Gg CO2 Reduction/yr 167.362 13.990 4.017 0.000
kWh Avoided/yr 0 0 0 0
Gg CO2 Avoided/yr 0.000 0.000 0.000 0.000
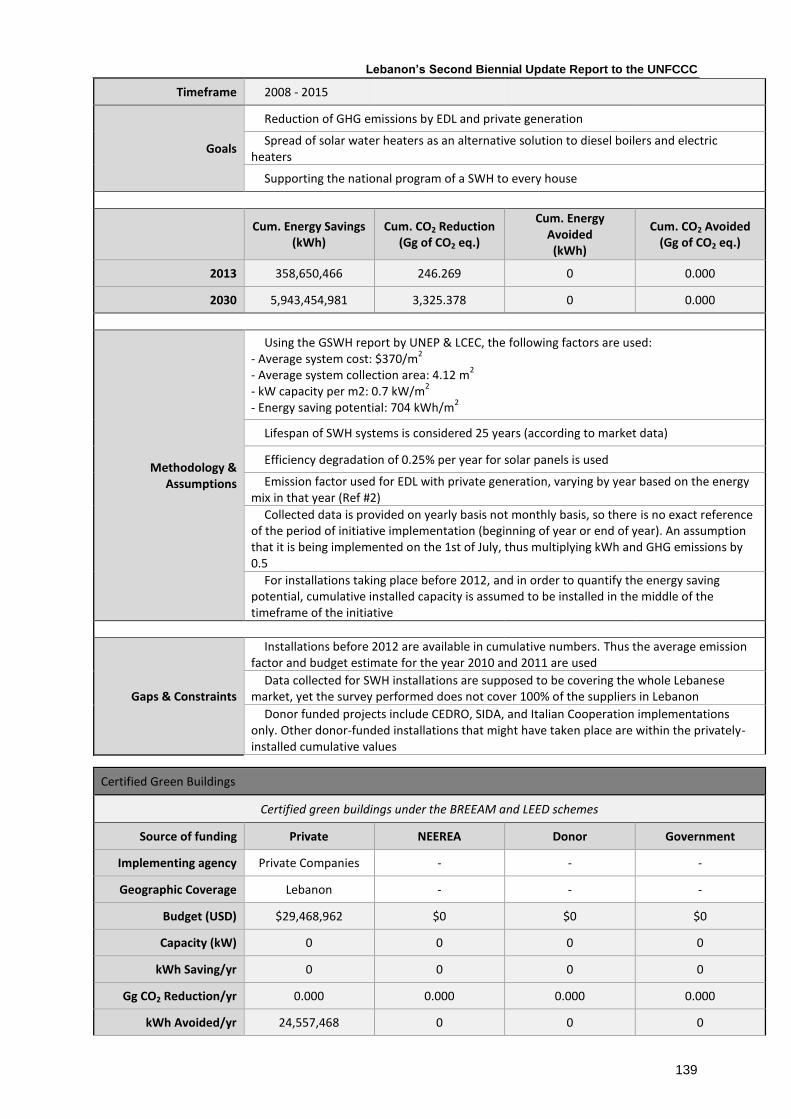
Lebanon’s Second Biennial Update Report to the UNFCCC
139
Timeframe 2008 - 2015
Goals
Reduction of GHG emissions by EDL and private generation
Spread of solar water heaters as an alternative solution to diesel boilers and electric heaters
Supporting the national program of a SWH to every house
Cum. Energy Savings
(kWh) Cum. CO2 Reduction
(Gg of CO2 eq.)
Cum. Energy Avoided (kWh)
Cum. CO2 Avoided (Gg of CO2 eq.)
2013 358,650,466 246.269 0 0.000
2030 5,943,454,981 3,325.378 0 0.000
Methodology & Assumptions
Using the GSWH report by UNEP & LCEC, the following factors are used: - Average system cost: $370/m
2
- Average system collection area: 4.12 m2
- kW capacity per m2: 0.7 kW/m2
- Energy saving potential: 704 kWh/m2
Lifespan of SWH systems is considered 25 years (according to market data)
Efficiency degradation of 0.25% per year for solar panels is used
Emission factor used for EDL with private generation, varying by year based on the energy mix in that year (Ref #2)
Collected data is provided on yearly basis not monthly basis, so there is no exact reference of the period of initiative implementation (beginning of year or end of year). An assumption that it is being implemented on the 1st of July, thus multiplying kWh and GHG emissions by 0.5
For installations taking place before 2012, and in order to quantify the energy saving potential, cumulative installed capacity is assumed to be installed in the middle of the timeframe of the initiative
Gaps & Constraints
Installations before 2012 are available in cumulative numbers. Thus the average emission factor and budget estimate for the year 2010 and 2011 are used
Data collected for SWH installations are supposed to be covering the whole Lebanese market, yet the survey performed does not cover 100% of the suppliers in Lebanon
Donor funded projects include CEDRO, SIDA, and Italian Cooperation implementations only. Other donor-funded installations that might have taken place are within the privately-installed cumulative values
Certified Green Buildings
Certified green buildings under the BREEAM and LEED schemes
Source of funding Private NEEREA Donor Government
Implementing agency Private Companies - - -
Geographic Coverage Lebanon - - -
Budget (USD) $29,468,962 $0 $0 $0
Capacity (kW) 0 0 0 0
kWh Saving/yr 0 0 0 0
Gg CO2 Reduction/yr 0.000 0.000 0.000 0.000
kWh Avoided/yr 24,557,468 0 0 0

Lebanon’s Second Biennial Update Report to the UNFCCC
140
Gg CO2 Avoided/yr 16.752 0.000 0.000 0.000
Timeframe 2012 - 2016
Goals Reduction of GHG emissions by EDL and private generation
Promoting green building concepts in new constructions
Cum. Energy Savings
(kWh) Cum. CO2 Reduction
(Gg of CO2 eq.)
Cum. Energy Avoided (kWh)
Cum. CO2 Avoided (Gg of CO2 eq.)
2013 0 0.000 1,326,310 0.905
2030 0 0.000 378,226,515 258.011
Methodology & Assumptions
Data about certified buildings is collected from USGBC and BREEAM database (Ref #12, Ref #13)
Quantification of energy savings is done collecting the following information: - Building size in m
2 (from company website or USGBC database)
- Business as usual consumption based on ASHRAE standards (Ref #6) - Energy consumption reduction is based on the EAC1 score, which identifies the % of energy consumption reduction compared to BAU
Budget is estimated using average payback period of 10 years and average kWh cost of 12 USC
Emission factor used for EDL with private generation, varying by year based on the energy mix in that year (Ref #2)
Collected data is provided on yearly basis not monthly basis, so there is no exact reference of the period of initiative implementation (beginning of year or end of year). An assumption that it is being implemented on the 1st of July, thus multiplying kWh and GHG emissions by 0.5
Gaps & Constraints Budget related to energy saving measures cannot be made available
Energy Conservation Measures
Implemented energy conservation measures by energy audit companies and ESCOS, including measures related to lighting, cooling, heating, etc.
Source of funding Private NEEREA Donor Government
Implementing agency Private Companies LCEC-BDL - -
Geographic Coverage Lebanon Lebanon - -
Budget (USD) $669,000 $0 $350,000 $0
Capacity (kW) 0 0 0 0
kWh Saving/yr 1,150,000 0 4,268 0
Gg CO2 Reduction/yr 0.802 0.000 0.003 0.000
kWh Avoided/yr 0 0 0 0
Gg CO2 Avoided/yr 0.000 0.000 0.000 0.000
Timeframe 2000 - 2015
Goals Reduction of GHG emissions by EDL and private generation
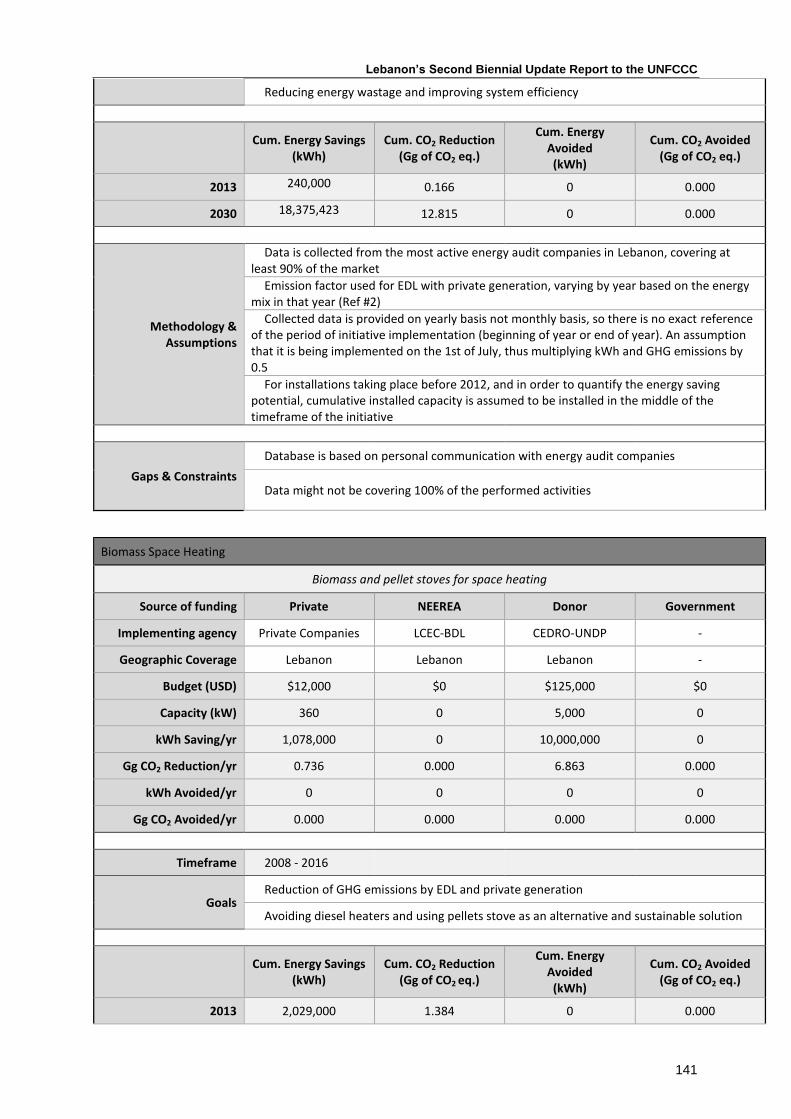
Lebanon’s Second Biennial Update Report to the UNFCCC
141
Reducing energy wastage and improving system efficiency
Cum. Energy Savings
(kWh) Cum. CO2 Reduction
(Gg of CO2 eq.)
Cum. Energy Avoided (kWh)
Cum. CO2 Avoided (Gg of CO2 eq.)
2013 240,000 0.166 0 0.000
2030 18,375,423 12.815 0 0.000
Methodology & Assumptions
Data is collected from the most active energy audit companies in Lebanon, covering at least 90% of the market
Emission factor used for EDL with private generation, varying by year based on the energy mix in that year (Ref #2)
Collected data is provided on yearly basis not monthly basis, so there is no exact reference of the period of initiative implementation (beginning of year or end of year). An assumption that it is being implemented on the 1st of July, thus multiplying kWh and GHG emissions by 0.5
For installations taking place before 2012, and in order to quantify the energy saving potential, cumulative installed capacity is assumed to be installed in the middle of the timeframe of the initiative
Gaps & Constraints
Database is based on personal communication with energy audit companies
Data might not be covering 100% of the performed activities
Biomass Space Heating
Biomass and pellet stoves for space heating
Source of funding Private NEEREA Donor Government
Implementing agency Private Companies LCEC-BDL CEDRO-UNDP -
Geographic Coverage Lebanon Lebanon Lebanon -
Budget (USD) $12,000 $0 $125,000 $0
Capacity (kW) 360 0 5,000 0
kWh Saving/yr 1,078,000 0 10,000,000 0
Gg CO2 Reduction/yr 0.736 0.000 6.863 0.000
kWh Avoided/yr 0 0 0 0
Gg CO2 Avoided/yr 0.000 0.000 0.000 0.000
Timeframe 2008 - 2016
Goals Reduction of GHG emissions by EDL and private generation
Avoiding diesel heaters and using pellets stove as an alternative and sustainable solution
Cum. Energy Savings
(kWh) Cum. CO2 Reduction
(Gg of CO2 eq.)
Cum. Energy Avoided (kWh)
Cum. CO2 Avoided (Gg of CO2 eq.)
2013 2,029,000 1.384 0 0.000

Lebanon’s Second Biennial Update Report to the UNFCCC
142
2030 185,205,000 127.032 0 0.000
Methodology & Assumptions
Data is collected from suppliers directly
Budgets and prices are collected from suppliers and implementing agencies
Lifespan of stoves is considered 25 years (according to market data)
Average capacity factor for pellet stoves is considered 2000 kWh/kW
Emission factor used for EDL with private generation, varying by year based on the energy mix in that year (Ref #2)
Collected data is provided on yearly basis not monthly basis, so there is no exact reference of the period of initiative implementation (beginning of year or end of year). An assumption that it is being implemented on the 1st of July, thus multiplying kWh and GHG emissions by 0.5
For installations taking place before 2012, and in order to quantify the energy saving potential, cumulative installed capacity is assumed to be installed in the middle of the timeframe of the initiative
Gaps & Constraints
The major supplier of biomass pellets only is involved in this activity. There were no other major initiatives undertaken during the reporting period
It is not clear what these stoves are replacing, thus the emission factor used is for EDL and private generators. In some cases, these stoves might be replacing diesel heaters.
The average saving of 2000 kWh per installed kW is a rough estimate based on international market data. No similar data is available for these systems in Lebanon.
Other Renewables
Other renewable technologies including wind, hydro, geothermal, and others
Source of funding Private NEEREA Donor Government
Implementing agency - - CEDRO-UNDP -
Geographic Coverage - - Lebanon -
Budget (USD) $0 $0 $420,000 $0
Capacity (kW) 0 0 87 0
kWh Saving/yr 0 0 104,681 0
Gg CO2 Reduction/yr 0.000 0.000 0.072 0.000
kWh Avoided/yr 0 0 0 0
Gg CO2 Avoided/yr 0.000 0.000 0.000 0.000
Timeframe 2013 - 2014
Goals
Reduction of GHG emissions by EDL and private generation
Spread of decentralized power generation
Promotion of renewable energy as an alternative source of power to diesel generators
Cum. Energy Savings
(kWh) Cum. CO2 Reduction
(Gg of CO2 eq.)
Cum. Energy Avoided (kWh)
Cum. CO2 Avoided (Gg of CO2 eq.)
2013 28,823 0.020 0 0.000

Lebanon’s Second Biennial Update Report to the UNFCCC
143
2030 1,289,297 0.886 0 0.000
Methodology & Assumptions
Data is collected from CEDRO-UNDP regarding implemented pilot projects
Lifespan of PV panels is considered 25 years (according to market data)
Efficiency degradation of 0.4% per year for PV panels as reported by NREL (Ref #8)
Average capacity factor for PV generators is considered 1500 kWh/kW
Average capacity factor for wind generators is considered 1433 kWh/kW
Average capacity factor for hydro generators is considered 3000 kWh/kW
Emission factor used for EDL with private generation, varying by year based on the energy mix in that year (Ref #2)
Collected data is provided on yearly basis not monthly basis, so there is no exact reference of the period of initiative implementation (beginning of year or end of year). An assumption that it is being implemented on the 1st of July, thus multiplying kWh and GHG emissions by 0.5
The installed micro-hydro system worked for 2 years only and then stopped operation
Gaps & Constraints Installations done by private sector could not be quantified. Yet they are expected to have
minor effect on the cumulative values
Other Energy Efficiency Measures
Energy efficiency measures undertaken by the public and private sector including energy efficient lighting, equipment, and others
Source of funding Private NEEREA Donor Government
Implementing agency - - - MEW
Geographic Coverage - - - Lebanon
Budget (USD) $0 $0 $0 $7,000,000
Capacity (kW) 0 0 0 0
kWh Saving/yr 0 0 0 255,052,875
Gg CO2 Reduction/yr 0.000 0.000 0.000 173.962
kWh Avoided/yr 0 0 0 0
Gg CO2 Avoided/yr 0.000 0.000 0.000 0.000
Timeframe 2011 - 2012
Goals Reduction of GHG emissions by EDL and private generation
Spread of decentralized power generation
Cum. Energy Savings
(kWh) Cum. CO2 Reduction
(Gg of CO2 eq.)
Cum. Energy Avoided (kWh)
Cum. CO2 Avoided (Gg of CO2 eq.)
2013 382,579,313 260.943 0 0.000
2030 2,456,776,437 1,675.676 0 0.000

Lebanon’s Second Biennial Update Report to the UNFCCC
144
Methodology & Assumptions
Data is collected from MEW's NEEAP
Lifespan of CFLs is considered 10,000 hours (according to market data)
Average working hours per day is considered 3 hours (according to LCEC)
Emission factor used for EDL with private generation, varying by year based on the energy mix in that year (Ref #2)
Collected data is provided on yearly basis not monthly basis, so there is no exact reference of the period of initiative implementation (beginning of year or end of year). An assumption that it is being implemented on the 1
st of July, thus multiplying kWh and GHG emissions by
0.5
23W CFLs are distributed, to be replacing 100W lamps
Gaps & Constraints
Installations done by private sector could not be quantified. Yet they are expected to have minor effect on the cumulative values
The 23W lamps might be replacing incandescent lamps with less than 100W, or maybe installed as new lamps. There is no accurate data about the replace lamps.
Zouk ICE 194 MW (HFO)
General Information: A base load power plant based on ten (10) units of four-stroke medium speed diesel engines, type 18V48/60B is under construction at Zouk site. The engines are of the well-known family of medium speed diesel engines designed and supplied by MAN Diesel & Turbo SE, which has a longstanding experience in providing diesel engines for reliable base load operation. The selected engines will provide dependable power production and high availability ensuring optimal plant performance versus investment cost. The plant design utilizes the energy in the exhaust gases and the hot cooling water from the engines in order to improve the efficiency of the plant by installation of exhaust heat recovery boilers and steam turbine generator.
Zouk (Plant Heat Rate for 10 engines operation at 100% load running on HFO)
With STG: NHR = 7,603 kJ/kWh / Without STG: NHR = 8,067 kJ/kW
Implementing Agency Ministry of Energy & Water
Geographical Coverage Zouk
Budget 185,247,000 €
Timeframe 2013-2015
Source of Funding Danish Export Bank - EKF, Via HSBC, Through MoF
Goals
Increase Generation Capacity Replace Private Generators with more efficient alternative Reduce Emissions
Achievements or Progress Construction in Progress since 2013. Capacity: 194 MW Net Output: 1,580,479 MWh/Year HFO Consumption: 178.95 g/kWh or 282,827 tonnes HFO/Year
GHG Emission Reduction 2013: No emission reductions yet By 2030: 250,032 tonnes of CO2e/year
Methodology & Assumptions GHG emission reduction is calculated from the difference of using Private Generation to produce the same amount of Energy produced by the 4 Reciprocating Engine Plant. PG would need 352,409 tonnes DO/Year to produce the same energy.

Lebanon’s Second Biennial Update Report to the UNFCCC
145
Jiyeh ICE 78.2 MW (HFO)
General Information: A base load power plant based on four (4) units of four-stroke medium speed diesel engines, type 18V48/60B is under construction at Jiyeh site. The engines are of the well-known family of medium speed diesel engines designed and supplied by MAN Diesel & Turbo SE, which has a longstanding experience in providing diesel engines for reliable base load operation. The selected engines will provide dependable power production and high availability ensuring optimal plant performance versus investment cost. The plant design utilizes the energy in the exhaust gases and the hot cooling water from the engines in order to improve the efficiency of the plant by installation of exhaust heat recovery boilers and steam turbine generator. Jiyeh (Plant Heat Rate for 4 engines operation at 100% load running on HFO) With STG: NHR = 7,629 kJ/kWh / Without STG: NHR = 8,188 kJ/kWh
Implementing Agency Ministry of Energy & Water
Geographical Coverage Jiyeh
Budget 83,978,000 €
Timeframe 2013-2015
Source of Funding Danish Export Bank - EKF, Via HSBC, Through MoF
Goals Increase Generation Capacity Replace Private Generators with more efficient alternative Reduce Emissions
Achievements or Progress Construction in Progress since 2013. Capacity: 78.2 MW Net Output: 637,080 MWh/Year HFO Consumption: 179.56 g/kWh or 114,005 tonnes HFO/Year
GHG Emission Reduction Expected 2013: No emission reductions yet By 2030: 100,788 tonnes of CO2e/year
Methodology & Assumptions GHG emission reduction is calculated from the difference of using Private Generation to produce the same amount of Energy produced by the four stroke Reciprocating Engine Plant. PG would use 142,054 tonnes DO/Year to produce the same amount of Energy.
DACCPP II 539.2 MW (HFO)
General Information: A complete indoor gas turbine plant is under construction at Deir Ammar site, comprising 3 Gas Turbines suitable for combined cycle operation burning Natural Gas fuel and also liquid fuels (Light Fuel Oil and Heavy Fuel Oil) with Nox control system (water/steam injection as e.g.). The plant is also equipped with a mini Hydro unit at the condenser outlet to improve the efficiency. DACCPP II (Plant Heat Rate at 100% load running on HFO) With STG & HYDRO: NHR = 7,209 kJ/kWh / NPO=539.2 MW DACCPP II (Plant Heat Rate at 100% load running on NG) With STG & HYDRO: NHR = 7,126.5 kJ/kWh / NPO=569.4 MW
Implementing Agency Ministry of Energy & Water
Geographical Coverage Deir Ammar
Budget 360,966,000 €
Timeframe 2013-2016
Source of Funding GoL
Goals
Increase Generation Capacity Replace Private Generators with more efficient alternative Reduce Emissions
Achievements or Progress Construction in Progress since 2013. Capacity: 539.2 MW Net Output: 3,679,200 MWh/Year HFO Consumption: 177.56 g/kWh or 653,278 tonnes/year

Lebanon’s Second Biennial Update Report to the UNFCCC
146
GHG Emission Reduction 2013: No emission reductions yet By 2030: 597,849 tonnes of CO2e/year
Methodology & Assumptions GHG emission reduction is calculated from the difference of using Private Generation to produce the same amount of Energy produced by the four stroke Reciprocating Engine Plant. PG would use 820,373 tonnes DO/year to produce the same amount of Energy.
ZCCPP 33.5MW Upgrade (DO)
General Information: The CMF+ upgrade applies the latest design Controlled Diffusion Airfoil (CDA) compressor blades to the V94.2 Gas Turbine. This allows a significant increase in compressor mass flow by approximately 3,5%, augmenting the power output of the GT and the subsequent Steam Turbine (ST) in combined cycle operation. The Si3D upgrade superior design, material and coatings leads to a substantial improvement in turbine performance, and increases the overall power output and efficiency of the gas turbine. ZCCPP (At 100% load BEFORE the Upgrade) With STG: NPO=435 MW ZCCPP (At 100% load AFTER the Upgrade) With STG: NPO=468.5 MW
Implementing Agency EDL
Geographical Coverage Zahrani
Budget Upgrade cost around 27,500,000 $
Timeframe 2013-2014
Source of Funding GoL
Goals
Increase the Power Output Improve the Plant Efficiency
Achievements or Progress Capacity Increase: 33.5 MW Net Output: 249,441MWh/year DO Consumption for Additional Capacity: ZERO tonne/Year
GHG Emission Reduction By 2013: No emission reductions yet By 2030: 177,315 tonnes of CO2e/year
Methodology & Assumptions GHG emission reduction is calculated from the PG power generation that have been displaced by the additional capacity.
DACCPP I 29.5MW Upgrade (DO)
General Information: The CMF+ upgrade applies the latest design Controlled Diffusion Airfoil (CDA) compressor blades to the V94.2 Gas Turbine. This allows a significant increase in compressor mass flow by approximately 3,5%, augmenting the power output of the GT and the subsequent Steam Turbine (ST) in combined cycle operation. The Si3D upgrade superior design, material and coatings leads to a substantial improvement in turbine performance, and increases the overall power output and efficiency of the gas turbine. DACCPP I (At 100% load BEFORE the Upgrade) With STG: NPO=435 MW DACCPP I (At 100% load AFTER the Upgrade) With STG: NPO=464.5 MW
Implementing Agency EDL
Geographical Coverage Deir Ammar
Budget Upgrade cost around 27,500,000 $
Timeframe 2013-2014
Source of Funding GoL
Goals Increase the Power Output

Lebanon’s Second Biennial Update Report to the UNFCCC
147
Improve the Plant Efficiency
Achievements or Progress Capacity Increase: 29.5 MW Net Output: 219,657MWh/year DO Consumption for Additional Capacity: ZERO tonnes/Year
GHG Emission Reduction By 2013: No emission reductions yet By 2030: 156,143 tonnes of CO2e/year
Methodology & Assumptions GHG emission reduction is calculated from the PG power generation that have been displaced by the additional capacity.
HFO Conditioning Zouk Power Plant
General Information: The improvement of the quality of HFO before boiler furnace combustion has a significant effect on the emissions as well as the combustion efficiency. Preheating, water washing for salt removal and vanadium inhibitor addition (magnesium additive) as fuel oil clean up measures are typical. An HFO conditioning solution has been implemented at Zouk Thermal Power Plant with the following results:
Item Parameter Baseline Value Average Achieved Values
with HFO Conditioning (normalized to 3% O2)
Achieved Reduction / Amelioration Values
(normalized to 3% O2)
1 Particulate
matter (PM) 331 (mg/Nm
3) 71.26 (mg/Nm
3) 78.5 (%)
2 SO3 4.81 (mg/Nm3) 0.428 (mg/Nm
3) 91 (%)
3 CO 1,049 (mg/Nm3) 77.50 (mg/Nm
3) 92.6 (%)
4 NOx 682.60 (mg/Nm3) 481.00 (mg/Nm
3) 29.5 (%)
5 Fouling Significant Substantial Reduction Substantial Reduction
6 Efficiency 91.71 (%) 92.92 (%) + 1.21 (%)
7 Acidity Effect
(pH) Significant 3.5 - 4.5 > 3.5
Implementing Agency EDL
Geographical Coverage Zouk
Budget 3,000,000 $ / Year
Timeframe 2013-2014
Source of Funding GoL
Goals
Improve Combustion Efficiency Reduce Fouling and Increase Unit Availability Reduce Emissions Saving in Operating Costs
Achievements or Progress HFO saving per year around 9,680 tonnes HFO/year
GHG Emission Reduction Expected By 2013: No emission reductions yet By 2030: 29,895 tonnes of CO2e/year
Methodology & Assumptions GHG emission reduction is calculated from the saving in HFO consumption to produce the same amount of Energy.

Lebanon’s Second Biennial Update Report to the UNFCCC
148
PV Beirut River Snake Project
General Information: BRSS is a 1 MWp solar PV farm built on the top of a river to generate an estimated 1,665 MWh/year.
Implementing Agency LCEC
Geographical Coverage Beirut
Budget 3,100,000 USD
Timeframe 2013-2015
Source of Funding GoL
Goals
Various capacity building and awareness raising on the technology
Benefit various public institutions with this technology
Achievements or Progress Capacity 1.08 MWp (Peak)
Annual saving is around 1,655 MWh/year
GHG Emission Reduction 2013: no emission reductions yet
By 2030: 974 tonnes of CO2e/year
Methodology & Assumptions GHG emission reduction is calculated from reduction of EDL usage and diesel electricity generation.

Lebanon’s Second Biennial Update Report to the UNFCCC
149
Annex VII. Mitigation actions of LULUCF
1. Calculation methods of GHG emissions/removals from mitigation actions
The CO2 removals in reforestation/afforestation projects are summarized in the following equation (in reference to IPCC GPG for LULUCF 2003 p. 3.51).
The calculation of annual change in carbon stocks in living biomass in Land converted to Forest land followed the following equation:
Plantations were assumed to take place on “Other Land”. The values for AEXT_MAN were taken from publications and personal communications conducted within the framework of the National Inventory of GHG emissions/removals from the LULUCF sector.
ANNUAL CHANGE IN CARBON STOCKS IN LAND CONVERTED TO FOREST LAND ΔCLF = ΔCLFLB
+ ΔCLFDOM + ΔCLFSoils
Where:
ΔCLF = annual change in carbon stocks in Land converted to Forest land, tonnes C yr-1 ΔCLFLB
= annual change in carbon stocks in living biomass (includes above- and belowground
biomass) in Land converted to Forest land; tonnes C yr-1 ΔCLFDOM
= annual change in carbon stocks in dead organic matter (includes dead wood and
litter) in Land converted to Forest land; tonnes C yr-1 ΔCLFSoils
= annual change in carbon stocks in soils in Land converted to Forest land; tonnes C
yr-1
ANNUAL INCREASE IN CARBON STOCKS IN LIVING BIOMASS IN LAND CONVERTED TO FOREST LAND
ΔCLFGROWTH = [Σ
kAINT_MANk
● GTotal INT_MANk + Σ
mAEXT_MANm
● GTotal EXT_MANm] ● CF
Where:
ΔCLFGROWTH = annual increase in carbon stocks in living biomass due to growth in “Land
converted to Forest land, tonnes C yr-1 AINT_MANk
= area of “Land converted to intensively managed forest in condition k (including
plantations), ha GTotal INT_MANk
= annual growth rate of biomass in intensively managed forest in condition k
(including plantations), tonnes d.m. ha-1 yr-1 AEXT_MANm
= area of “Land converted to extensively managed forest in condition m, ha
GTotal EXT_MANm = annual growth rate of biomass in extensively managed forest in condition m,
tonnes dm ha-1 yr-1 (includes natural regeneration) k, m = represent the different conditions in which intensively and extensively managed
forests are growing CF = carbon fraction of dry matter (default = 0.5), tonnes C (tonne d.m.)-1
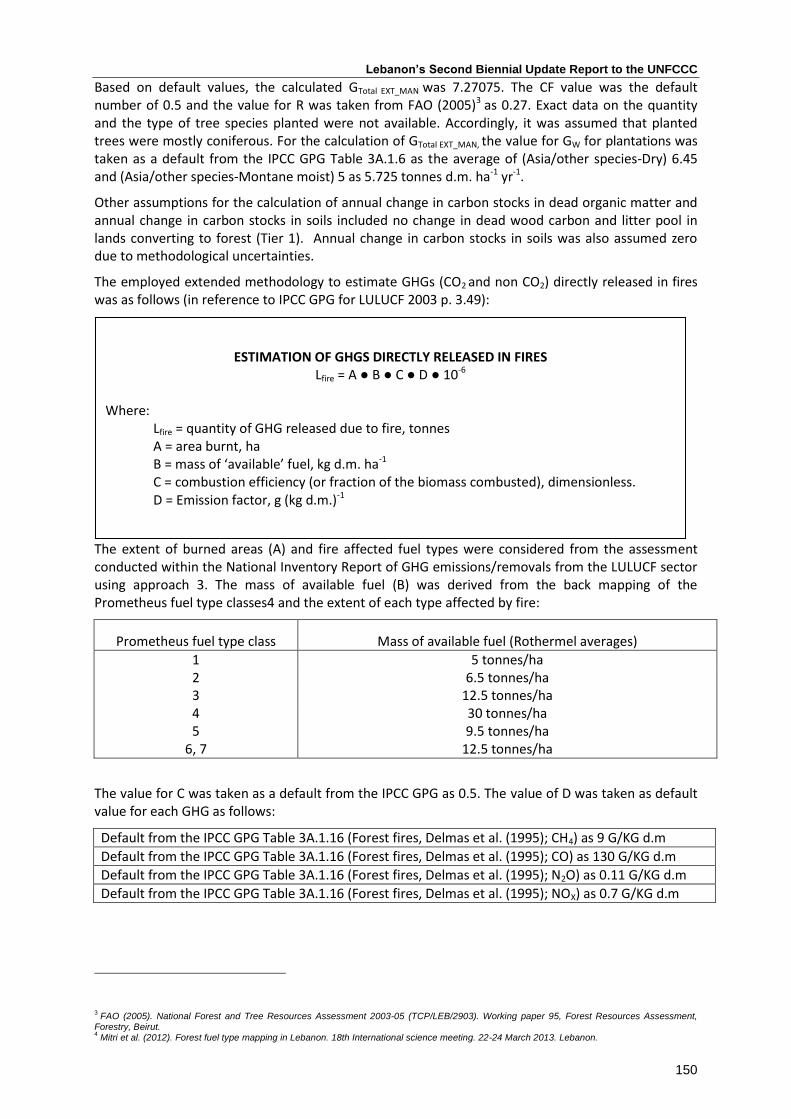
Lebanon’s Second Biennial Update Report to the UNFCCC
150
Based on default values, the calculated GTotal EXT_MAN was 7.27075. The CF value was the default
number of 0.5 and the value for R was taken from FAO (2005)3 as 0.27. Exact data on the quantity and the type of tree species planted were not available. Accordingly, it was assumed that planted trees were mostly coniferous. For the calculation of GTotal EXT_MAN, the value for GW for plantations was taken as a default from the IPCC GPG Table 3A.1.6 as the average of (Asia/other species-Dry) 6.45 and (Asia/other species-Montane moist) 5 as 5.725 tonnes d.m. ha-1 yr-1.
Other assumptions for the calculation of annual change in carbon stocks in dead organic matter and annual change in carbon stocks in soils included no change in dead wood carbon and litter pool in lands converting to forest (Tier 1). Annual change in carbon stocks in soils was also assumed zero due to methodological uncertainties.
The employed extended methodology to estimate GHGs (CO2 and non CO2) directly released in fires was as follows (in reference to IPCC GPG for LULUCF 2003 p. 3.49):
The extent of burned areas (A) and fire affected fuel types were considered from the assessment conducted within the National Inventory Report of GHG emissions/removals from the LULUCF sector using approach 3. The mass of available fuel (B) was derived from the back mapping of the Prometheus fuel type classes4 and the extent of each type affected by fire:
Prometheus fuel type class Mass of available fuel (Rothermel averages)
1 5 tonnes/ha 2 6.5 tonnes/ha 3 12.5 tonnes/ha 4 30 tonnes/ha 5 9.5 tonnes/ha
6, 7 12.5 tonnes/ha
The value for C was taken as a default from the IPCC GPG as 0.5. The value of D was taken as default value for each GHG as follows:
Default from the IPCC GPG Table 3A.1.16 (Forest fires, Delmas et al. (1995); CH4) as 9 G/KG d.m
Default from the IPCC GPG Table 3A.1.16 (Forest fires, Delmas et al. (1995); CO) as 130 G/KG d.m
Default from the IPCC GPG Table 3A.1.16 (Forest fires, Delmas et al. (1995); N2O) as 0.11 G/KG d.m
Default from the IPCC GPG Table 3A.1.16 (Forest fires, Delmas et al. (1995); NOX) as 0.7 G/KG d.m
3 FAO (2005). National Forest and Tree Resources Assessment 2003-05 (TCP/LEB/2903). Working paper 95, Forest Resources Assessment,
Forestry, Beirut. 4 Mitri et al. (2012). Forest fuel type mapping in Lebanon. 18th International science meeting. 22-24 March 2013. Lebanon.
ESTIMATION OF GHGS DIRECTLY RELEASED IN FIRES Lfire = A ● B ● C ● D ● 10-6
Where:
Lfire = quantity of GHG released due to fire, tonnes A = area burnt, ha B = mass of ‘available’ fuel, kg d.m. ha-1 C = combustion efficiency (or fraction of the biomass combusted), dimensionless. D = Emission factor, g (kg d.m.)-1

Lebanon’s Second Biennial Update Report to the UNFCCC
151
Individual Factsheets on LULUCF mitigation actions
Development and implementation of pilot landscape restoration plans
Development and implementation of pilot landscape restoration plans
General information: Reforestation and afforestation projects are conducted in the Shouf Biosphere Reserve to build resilience to climate change through adaptive forest landscape restoration. One of these projects is implemented within the framework of the 40 million trees programme, while the others are implemented with private sponsorships.
Implementing agency Al Shouf Cedar Society
Geographical coverage Barouk and the Municipalities of Barouk, Maasser el Shouf, Mristi (Mount Lebanon) and Saghbine (Beqaa)
Budget N.A.
Timeframe 2013-2015
Source of funding MM1, Byblos bank, HSBC bank, European Commission (through MoA), Middle East Airlines, and the private sector.
Goals Increase resilience to climate change in an altitudinal and continental gradient, from the inner Bekaa Valley to the Mount Lebanon western range, connecting forest patches.
Achievements or progress by 2013
48.5 Ha Removal of 0.646491 Gg of CO2 eq.
Methodology IPCC GPG for LULUCF 2003
Assumptions Assuming that each ha of planted land comprised 700 seedlings. Also, assuming that the seedlings were successfully planted and maintained over a total cumulative area of 125.5 ha by 2015.
AFDC afforestation/reforestation projects
General information: various restoration and afforestation activities
Implementing agency Association for Forests, Development and Conservation (AFDC)
Geographical coverage Jesr El Kadi, Deir Aamar, Ashash, Btater, Shartoun, Anjar, Rashaya, Bqerzala, and Kfar Qouk.
Budget N.A.
Timeframe 2013-2016
Source of funding Various sources including private sponsorships
Goals Restore degraded land and increase forest cover in Lebanon
Achievements or progress by 2013
16 ha removal 0.213275 Gg of CO2 eq.
Methodology IPCC GPG for LULUCF 2003
Assumptions Assuming that each ha of planted land comprised 700 seedlings. Also, assuming that the seedlings were successfully planted and maintained over a total area of 24.5 ha by 2015 and a total cumulative area of 82.5 ha by 2016.

Lebanon’s Second Biennial Update Report to the UNFCCC
152
The Reforestation Initiative of the Ministry of Environment of Lebanon
General information: MoE has executed from 2002 till 2014 reforestation activities in all Lebanese regions within the context of the National Reforestation Plan. These activities were achieved through two consecutive phases and have covered the reforestation of approximately 834 hectares of forest lands in all the Lebanese Governorates with contributions in some place from NGOs.
Implementing agency MoE
Geographical coverage All Lebanese territories
Budget In 2001, the Lebanese government allocated in the national budget 25 billion Lebanese Pounds fund (approximately 16.67 million USD) scheduled over five years for the execution of reforestation projects at the national level.
Timeframe 2002-2014
Source of funding Government of Lebanon
Goals Restore the country’s green cover loss throughout the years Achievements or progress
by 2013 The reforestation of 834 hectares of forest lands fairly distributed in the five Muhafazat, as follows: Mount Lebanon: 60 ha: Faraya and Barouk - 45 ha: Hammana, Damour, Ehmej North Lebanon: 60 ha: Akkar el Atiqa, Ehden, Bcharri, Tannourine - 54 ha: Kousba, Tannourine, Akkar el Atiqa Bekaa: 80 ha: Lala-Baaloul, Khirbet-Anafar, Qaa el Reem, Ras Baalbeck, Chaat, Hermel, Rachaya, Jdita - 104 ha: Tajammoh Baladiyat El –Sahl*, Bouday, Chmestar, Al-Qaa, Al-fakeha-El Jadida, Baalbeck, Rachaya El-Wadi, El-Hermel, Sehmor South Lebanon: 50 ha: Jezzine, Al Qraye, Abbassie, Majdelzoun Nabatieh: 55 ha: Kfar Rummane, Rmeich, Ebel el Saki, Marjeyoun, Hasbaya - 75 ha: Al-Rihan, Zawtar Esharkieh, El-Merwanieh, Kherbit Selem, Markaba Other reforestation activities for a total of 251 ha involved NGOs. Some of which involved large scale air seeding operations in coordination with the Lebanese Army and some NGOs. Airplane seeding of pine and oak seeds over a total area of 80 hectares in the regions of Jran, Jrabta, Kfifan, Rechmaya, Karm Saddeh, Kobeyat, Deir El-Kamar and Andkit was performed. Based on the promising initial results obtained, this operation was followed with similar applications in the regions of Dahr El-Ahmar, Karaoun and Bkifa over another area of 80 hectares.
Achievements or progress by 2013
9.72 Gg of CO2 eq.
Methodology IPCC GPG for LULUCF 2003
Assumptions Assuming that each ha of planted land comprised 700 seedlings. Also, assuming an annual average area of 104.25 ha was successfully planted and maintained from 2005 throughout 2014.

Lebanon’s Second Biennial Update Report to the UNFCCC
153
Jouzour Loubnan’s reforestation and afforestation activities
General information: Reforestation/afforestation activities were conducted between 2008 and 2013. Local community groups were involved in reforestation activities which involved the use of native tree species.
Implementing agency Jouzour Loubnan
Geographical coverage Chabrouh, Ehmej, Ainata, Harf Shlifa and Btedi in the Bekaa valley, Ibl Es Saki, Ehden, and Kfardebiane.
Budget 946,659 USD (assuming an average cost of 7 USD per seedling for plantation and maintenance)
Timeframe 2008-2014
Source of funding Different sources of funding including the EU, the private sector, and United States Agency for International Development (USAID) through Lebanon Reforestation Initiative
Goals: 1) Intervene mainly in arid mountainous regions as, on one hand, they are very often dismissed in forestation programs and, on the other hand, the benefits of such forestation are tremendous, and 2) empower local communities, and 3) to promote environmental awareness
Achievements or progress by 2013
Year Area (ha) Yearly CO2 removal (Gg of CO2 eq.)
2008-2011 56.67 0.755395
2012 46.22 0.616099
2013 55.93 0.745531
Total 158.82 2.117025
Total GHG removal by completion of action in 2014
2.575 Gg of CO2 eq.
Methodology IPCC GPG for LULUCF 2003
Assumptions Assuming that 1) the seedlings were successfully planted and maintained, 2) each ha of planted land comprised 700 seedlings, and 3) the cumulative area of plantations consisted of 158.82 ha by 2013 distributed as 185 seedlings (in 2008), 5,680 seedlings (in 2010), 11,795 seedlings (in 2010), 22,009 seedlings in (2011), 32,358 seedlings (in 2012), and 39,155 seedlings (i.e., 55.93 ha in 2013)

Lebanon’s Second Biennial Update Report to the UNFCCC
154
Lebanon Reforestation Initiative
General information: The Lebanon Reforestation Initiative, funded by USAID and implemented by the United States Forest Service (USFS), works towards providing a successful framework for longer-term technical and financial assistance to expand and protect Lebanon’s forests for a sustainable future. The project favors a decentralized approach to engaging communities at the municipal level and focuses on 1) assisting native tree nurseries with technical improvements and enhanced business planning, 2) developing comprehensive forest mapping, 3) promoting the importance of reforestation and biodiversity through community-led activities that foster local ownership and forest sustainability, 4) supporting the planting of quality native seedlings, and 5) strengthening capacities to prevent respond to wildfires.
Implementing agency Lebanon Reforestation Initiative in partnership with local community groups
Geographical coverage Tannourine, Bcharreh, Kfarzabad, Aanjar, Rashaya, El Qlaiaa, Ainata, Rmadyeh, and Maqne
Budget 3,192,000 USD by 2015 (assuming an average cost of 7 USD per seedling for plantation and maintenance)
Timeframe 2011-2018
Source of funding USAID
Goals: The Lebanon Reforestation Initiative aims to restore Lebanon's native forests and to install commitment to reforestation and wildfire prevention and response, through capacity building of local communities and organizations.
Achievements or progress Year Area (ha) Yearly CO2 removal (Gg of CO2 eq.)
2011 108.69 1.448806
2012 182.19 2.42854
2013 182.19 2.42854
Total 473.07 6.305886
Total GHG removal by completion of action in 2018
8.683353 Gg of CO2 eq.
Methodology IPCC GPG for LULUCF 2003
Assumptions Assuming that 1) the seedlings were successfully planted and maintained, 2) each ha of planted land comprised 700 seedlings, and 3) the cumulative plantations consisted of a total area of 473.07 ha by 2013 distributed as 76,087 seedlings (i.e., 108.69) in 2011, a total of 127,536 seedlings (i.e., 182.19) in 2012, and a total of 127,536 seedlings (i.e., 182.19 ha) in 2013.

Lebanon’s Second Biennial Update Report to the UNFCCC
155
Annex VIII: Gaps and constraints
In order to fulfill Lebanon’s obligations to the UNFCCC in submitting national GHG inventories in line with the IPCC guidelines, further support is needed to continue to develop and consolidate existing technical and institutional capacities. Many challenges still exist since the preparation of the country’s first GHG inventory in 1994 and they are mainly related to unavailability, inaccessibility and inconsistency of activity data and emission factors. Below is a series of tables presenting the gaps and constraints that were encountered during data collection for the preparation of the inventory of each sector and the proposed measures to address these constraints in the future.
Table A3- 1 Gaps and needs identified in the calculation of GHG emissions from the energy sector
Gaps and constraints Proposed measures for improvement
Underdeveloped data collection for the inventory - Lack of institutional arrangement for data
monitoring and reporting - Absence of an energy balance - Absence of disaggregation of fuel use per
subcategory - Missing of activity data on some fuel used - Need to improve the uncertainty calculation
methodologies in the QA/QC procedure
- Create a national institutional arrangement for the preparation of the GHG inventory, empowering the CAS, the relevant ministries and concerned public authorities to develop monitoring indicators (such as the mobility monitoring indicator), in charge of collection, measuring, reporting and verifying of energy activity data.
- Establish a mobility monitoring indicator platform that should include all activity data needed to estimate Lebanon’s energy sector GHG emissions using tiers 2 and 3 of the IPCC guidelines.
- Activity data should be reported with uncertainty assessments in order to have statistically acceptable data.
- Standardize/centralize data reporting and develop protocols for data accessibility.
Unavailable and/or unshared specific data for tiers 2 and 3 calculations - Missing road transport activity data on annual
fuel consumption per type of fuel and yearly average vehicle mileage per category
- Activity data of off-road vehicles not considered - Unshared activity data between public/private
institutions due to lack of coordination and/or confidentiality
Use of IPCC default emissions factors since there are no fuel-specific emission factors elaborated for Lebanon.
- Develop Lebanon’s fuel-specific emission factors and methodologies.
- Conduct measurement campaigns in order to elaborate specific emission factors representative of the Lebanese used fuel and transportation fleet.
- Develop GHG emissions estimation models with local research institutes to create Lebanon-specific methodologies using advanced bottom-up approaches for inventory preparation.

Lebanon’s Second Biennial Update Report to the UNFCCC
156
Table A3- 2 Gaps and needs identified in the calculation of GHG emissions from industrial processes
Gaps and constraints Proposed measures for improvement
Activity data organization - Scattered data on fish, meat,
chicken, lime, soda ash, asphalt, wine (customs, factories, ministries).
- Lack of uniformity in data between different official sources (i.e. meat and poultry production).
- Lack of sufficient documentation on data sources in both the Second National Communication (SNC) and Initial National Communication (INC).
For current inventory: - Collection of numbers and figures from various sources and
research on detailed description of categories considered in each number. Most comprehensive data were adopted for the inventory.
- Validation of available data through expert judgment. - Detailed archiving on sources of data. Suggestions for future inventories: - Centralization of data compilation management:
cooperation initiated with Ministry of Industry in order to update industrial database and launch systematic data collection process from industries.
Activity data availability - Lack of data on bread, cakes and
biscuits, and coffee beans. - Lack of data on halocarbons (HFCs
and PFCs). - Lack of data for refining inventory
to higher tier levels (except for cement).
For current inventory: - Wheat production is used to estimate production of bread,
cakes and biscuits (based on ratios given by bakeries). - Emissions from HFCs and coffee beans were not estimated. Higher tiers for categories other than cement were not used.
Activity data accessibility - Lack of institutional arrangements
for data sharing. - Time delays in accessing and
compiling data.
Suggestions for future inventories: - Establish protocols and effective networking with data providers (Memorandums of Understanding already signed with various institutions, including the Ministry of Industry).
Activity data compilation Emissions from poultry, meat, fish, bread and cakes and biscuits were calculated using only national production. Emissions from processing of imported poultry, meat fish and wheat were not included (as well as subtraction of exported production).
For current inventory: - Consider import and export in final activity data
compilation for cakes and biscuits and bread. - Imported poultry and meat was not added to national
production since important discrepancies were noted in national production figures of SNC and TNC. Adding import numbers would increase this discrepancy. It is noteworthy that since NMVOCs emitted from the food sector are not included in GHG trend analysis, this discrepancy is not projected to the final figures of the inventory.
National circumstances - Lack of sufficient, updated and
homogeneous literature on the industrial sector in Lebanon.
- Lack of academics and researchers in the industrial field.
For current inventory: - Reliance on personal communications with practitioners
and ministry employees.
Suggestions for future inventories: - Nationwide survey has been launched on a sample of 180
industries from each category in order to capture the general situation of the industrial sector in Lebanon.
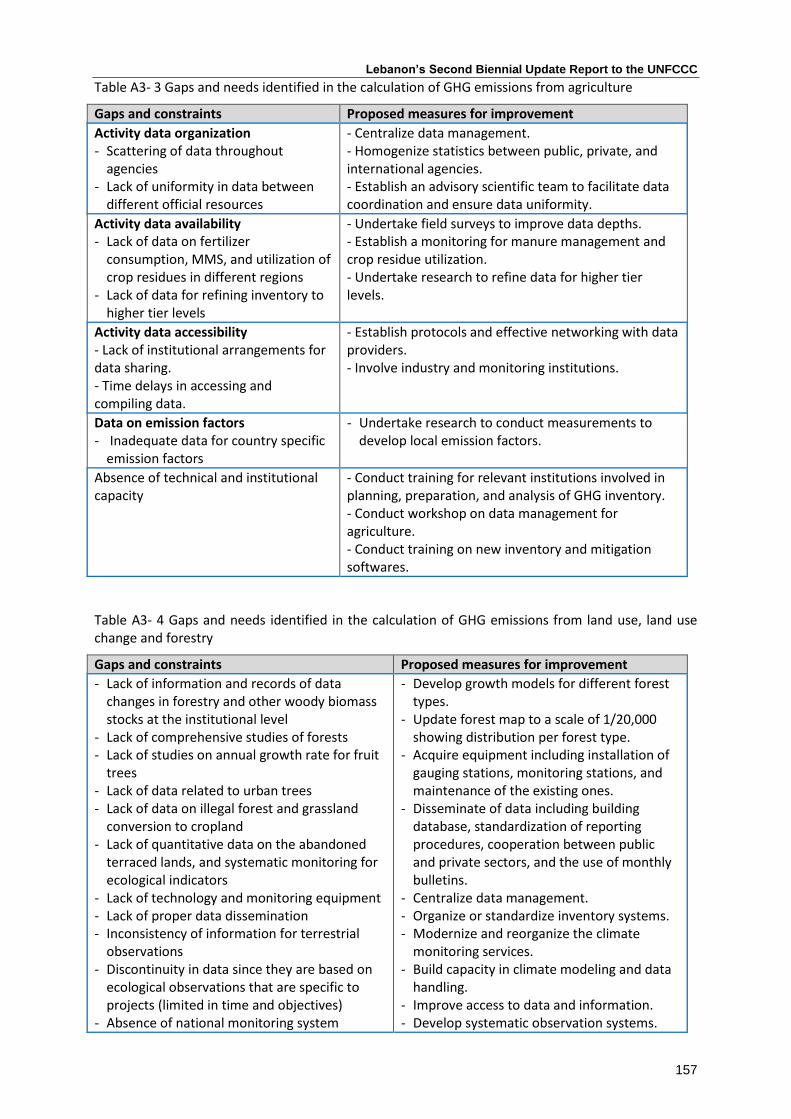
Lebanon’s Second Biennial Update Report to the UNFCCC
157
Table A3- 3 Gaps and needs identified in the calculation of GHG emissions from agriculture
Gaps and constraints Proposed measures for improvement
Activity data organization - Scattering of data throughout
agencies - Lack of uniformity in data between
different official resources
- Centralize data management. - Homogenize statistics between public, private, and international agencies. - Establish an advisory scientific team to facilitate data coordination and ensure data uniformity.
Activity data availability - Lack of data on fertilizer
consumption, MMS, and utilization of crop residues in different regions
- Lack of data for refining inventory to higher tier levels
- Undertake field surveys to improve data depths. - Establish a monitoring for manure management and crop residue utilization. - Undertake research to refine data for higher tier levels.
Activity data accessibility - Lack of institutional arrangements for data sharing. - Time delays in accessing and compiling data.
- Establish protocols and effective networking with data providers. - Involve industry and monitoring institutions.
Data on emission factors - Inadequate data for country specific
emission factors
- Undertake research to conduct measurements to develop local emission factors.
Absence of technical and institutional capacity
- Conduct training for relevant institutions involved in planning, preparation, and analysis of GHG inventory. - Conduct workshop on data management for agriculture. - Conduct training on new inventory and mitigation softwares.
Table A3- 4 Gaps and needs identified in the calculation of GHG emissions from land use, land use change and forestry
Gaps and constraints Proposed measures for improvement
- Lack of information and records of data changes in forestry and other woody biomass stocks at the institutional level
- Lack of comprehensive studies of forests - Lack of studies on annual growth rate for fruit
trees - Lack of data related to urban trees - Lack of data on illegal forest and grassland
conversion to cropland - Lack of quantitative data on the abandoned
terraced lands, and systematic monitoring for ecological indicators
- Lack of technology and monitoring equipment - Lack of proper data dissemination - Inconsistency of information for terrestrial
observations - Discontinuity in data since they are based on
ecological observations that are specific to projects (limited in time and objectives)
- Absence of national monitoring system
- Develop growth models for different forest types.
- Update forest map to a scale of 1/20,000 showing distribution per forest type.
- Acquire equipment including installation of gauging stations, monitoring stations, and maintenance of the existing ones.
- Disseminate of data including building database, standardization of reporting procedures, cooperation between public and private sectors, and the use of monthly bulletins.
- Centralize data management. - Organize or standardize inventory systems. - Modernize and reorganize the climate
monitoring services. - Build capacity in climate modeling and data
handling. - Improve access to data and information. - Develop systematic observation systems.
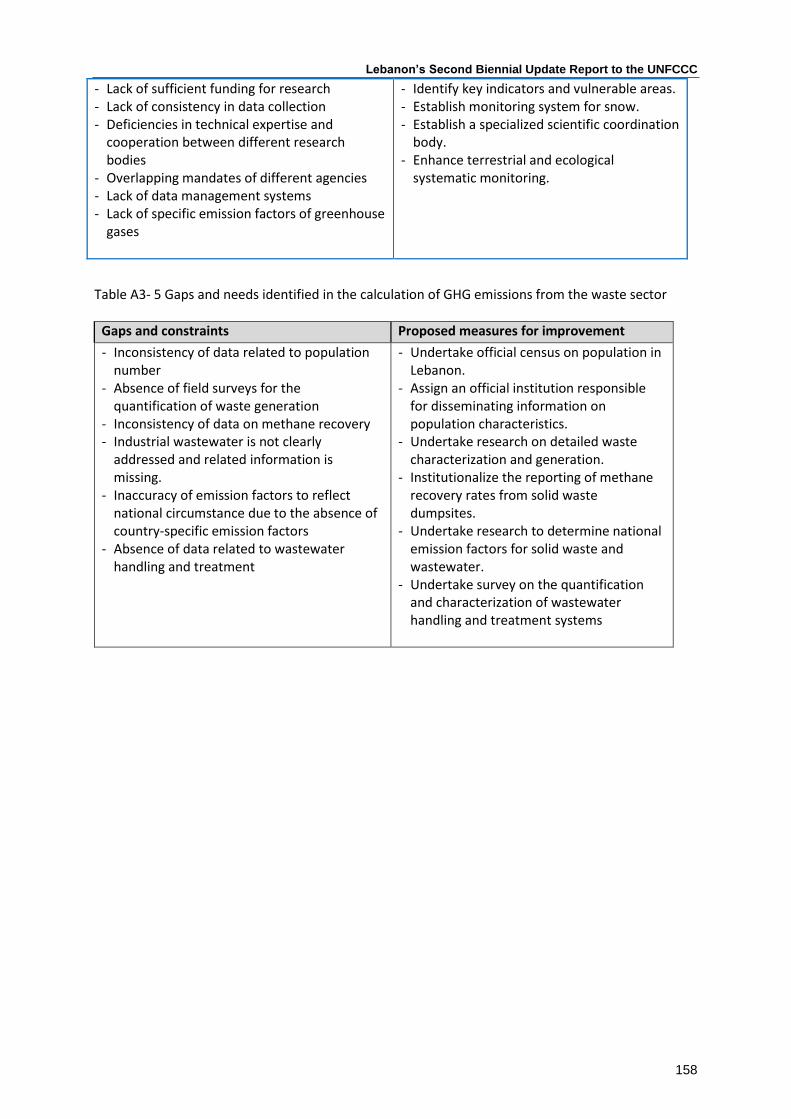
Lebanon’s Second Biennial Update Report to the UNFCCC
158
- Lack of sufficient funding for research - Lack of consistency in data collection - Deficiencies in technical expertise and
cooperation between different research bodies
- Overlapping mandates of different agencies - Lack of data management systems - Lack of specific emission factors of greenhouse
gases
- Identify key indicators and vulnerable areas. - Establish monitoring system for snow. - Establish a specialized scientific coordination
body. - Enhance terrestrial and ecological
systematic monitoring.
Table A3- 5 Gaps and needs identified in the calculation of GHG emissions from the waste sector
Gaps and constraints Proposed measures for improvement
- Inconsistency of data related to population number
- Absence of field surveys for the quantification of waste generation
- Inconsistency of data on methane recovery - Industrial wastewater is not clearly
addressed and related information is missing.
- Inaccuracy of emission factors to reflect national circumstance due to the absence of country-specific emission factors
- Absence of data related to wastewater handling and treatment
- Undertake official census on population in Lebanon.
- Assign an official institution responsible for disseminating information on population characteristics.
- Undertake research on detailed waste characterization and generation.
- Institutionalize the reporting of methane recovery rates from solid waste dumpsites.
- Undertake research to determine national emission factors for solid waste and wastewater.
- Undertake survey on the quantification and characterization of wastewater handling and treatment systems