second biennial report of hungary under the united nations...
TRANSCRIPT

Second Biennial Report of Hungary
Under the United Nations Framework Convention on Climate Change
2015

UNFCCC 2nd Biennial Report of Hungary
2
EXECUTIVE SUMMARY ................................................................................................................... 4
1 INTRODUCTION .......................................................................................................................... 5
2 INFORMATION ON GHG EMISSIONS AND TRENDS ......................................................... 6
2.1 SUMMARY OF NATIONAL EMISSIONS AND REMOVAL RELATED TRENDS .................................6
2.2 OVERVIEW OF SOURCE AND SINK CATEGORY EMISSION ESTIMATES AND TRENDS .................7
2.3 NATIONAL INVENTORY ARRANGEMENTS ..................................................................................9
3 QUANTIFIED ECONOMY-WIDE EMISSION REDUCTION TARGETS (QEWER) ...... 11
4 PROGRESS IN ACHIEVEMENT OF QEWER TARGET .................................................... 14
4.1 MITIGATION ACTIONS AND THEIR EFFECTS .............................................................................15
4.1.1 European framework ....................................................................................................... 15
4.1.2 General legal background ............................................................................................... 16
4.1.3 Policy making process ..................................................................................................... 16
4.2 SECTORAL POLICIES AND MEASURES ......................................................................................19
4.2.1 Cross-cutting policies and measures ............................................................................... 19
4.2.2 Energy .............................................................................................................................. 26
4.2.3 Transport ......................................................................................................................... 28
4.2.4 Agriculture, Land use, land-use change and forestry ...................................................... 29
4.2.5 Waste ............................................................................................................................... 31
5 PROJECTIONS ........................................................................................................................... 34
5.1 ENERGY ....................................................................................................................................35
5.1.1 Fuel Combustion.............................................................................................................. 35
5.1.2 Fugitive emissions from fuels .......................................................................................... 54
5.2 TRANSPORT ..............................................................................................................................55
5.3 INDUSTRIAL PROCESSES ..........................................................................................................57
5.3.1 Mineral industry .............................................................................................................. 57
5.3.2 Chemical Industry............................................................................................................ 58
5.3.3 Metal industry .................................................................................................................. 59
5.3.4 Non-energy products from fuels and solvent use ............................................................. 60
5.3.5 Product uses as substitutes for ODS ................................................................................ 61
5.3.6 Other product manufacture and use ................................................................................ 62
5.4 AGRICULTURE ..........................................................................................................................63
5.5 LAND USE, LAND-USE CHANGE AND FORESTRY (LULUCF) ..................................................63
5.6 WASTE .....................................................................................................................................64
5.6.1 Solid waste disposal......................................................................................................... 64
5.6.2 Biological Treatment of Solid Waste ............................................................................... 65
5.6.3 Incineration and Open Burning of Waste ........................................................................ 66
5.6.4 Wastewater Treatment and discharge ............................................................................. 66
5.7 MEMO ITEMS ............................................................................................................................68

UNFCCC 2nd Biennial Report of Hungary
3
5.7.1 International bunkers ...................................................................................................... 68
6 PROVISION OF FINANCIAL, TECHNOLOGICAL AND CAPACITY-BUILDING
SUPPORT TO DEVELOPING COUNTRY PARTIES .................................................................. 68
6.1 FINANCE ...................................................................................................................................69
6.2 TECHNOLOGY DEVELOPMENT AND TRANSFER ........................................................................71

UNFCCC 2nd Biennial Report of Hungary
4
Executive summary
Information on GHG emissions and trends
Our data provided about national GHG emissions and trends were based on the National Inventory Report and Inventory for 1985-2013 of Hungary (2015). In 2013, total emissions of greenhouse gases in Hungary were 57.4 million tonnes carbon dioxide equivalents (excluding the LULUCF sector) which is the lowest value in the whole time series (1985-2013) and a 47.7% reduction compared to the average level of base years 1985-1987. Energy sector (71.6 %), agriculture (11%), industrial processes (9.8%) and waste sector (7.5%) were identified as the sectors most responsible for Hungarian emissions in 2013. Emissions from energy, agriculture and industry decreased significantly (-50–60%), while emissions of the waste sector (+14.3%) increased compared to the base level. The most important greenhouse gas is carbon dioxide (CO2) accounting for 76.4% of total GHG emissions. The main source of CO2 emissions is burning of fossil fuels for energy purposes, including transport. CO2 emissions have decreased by 48.4% since the middle of the 1980’s. Methane (-41%) and nitrous oxide emissions (-60.9%) also show a downward trend. The total emissions of fluorinated gases amount to 2.4%, but their steadily growing tendency seems to level off since 2008. However, special attention is still needed as their applications in the cooling industry and the use of SF6 in electrical equipment, first of all in switchgears for insulation and arc quenching are still popular.
Quantified Economy-wide Emission Reduction Targets (QEWER)
Hungary’s emission reduction target for the years 2013-2020 is part of the joint target of the European Union, implemented through the EU Climate and Energy Package. Under the Package the EU is
committed to a quantified economy‐ wide GHG emission reduction target of 20% by 2020, compared to the 1990 levels.1 (This reduction objective is divided between two sub-targets, equivalent to a split of the reduction effort between ETS and non-ETS sectors. For ETS emissions the reduction target is -21% compared to 2005 levels, for non ETS emissions annual national targets were determined by the European Commission, resulting in an assessed 10% of emission reduction compared to 2005). For Hungary this target is coupled with a renewable penetration rate of 14.65% and an energy efficiency improvement of 20% by 2020. Beyond 2020, the EU’s climate and energy policy framework for 2030 sets a reduction target of at least 40% compared to 1990, at least 27% share for renewable energy and energy savings by 2030. For 2050, the EU has committed to reducing progressively its GHG emissions by 80 to 95% compared to 1990 levels.
Progress in achievement of QEWER target
GHG emissions of Hungary are part of EU-28 emissions with a percentage of 1.28 in the year 2013. The development of GHG emissions in 2013 of Hungary is a 36% reduction compared to 1990, and a 47.7% decline compared to the average level of the years 1985-1987l. In the year 2013 verified emission of stationary installations covered under the EU-ETS, (responsible for 33% of total national emissions), in Hungary summed up to 19.2 Mt CO2 equivalent, which is a 27% emission reduction compared to 2005, as base year. Emissions of non-ETS sectors, responsible for 67% of total domestic emissions in 2013, have decreased with 23.1% since 2005. The use of flexible mechanisms – use of CERs and ERUs – under the ESD cannot be quantified in the moment, as the compliance assessment for the first year 2013 under the ESD will only take place in 2016).
Projections
Our projections are applicable to the years 2015, 2020, 2025 and 2030 and were based on the National Inventory Report and Inventory for 1985-2013 of Hungary (2015). The projections follow two – WEM (With existing measures)2 and WAM (With additional measures)3 – scenarios and cover the following gases: CO2, CH4, N2O, HFCs, PFCs and SO2. Currently our emissions of greenhouse gases are at a low
1 With a conditional offer to move to a 30% reduction, provided that other developed countries commit
themselves to comparable emission reductions and developing countries contribute adequately according to
their responsibilities and respective capabilities. 2 Referring to the national measures already adopted and/or legally binding. 3 Referring to planned, but not yet adopted national measures.

UNFCCC 2nd Biennial Report of Hungary
5
level, mainly due to the decline of the industrial production after 2008. A potential recovery of the industrial production will likely result in the increase of process emissions. The largest decrease is expected in emissions from fuel use in buildings and HFC gases. Cumulatively, according to the WEM scenario, emissions (measured in CO2 equivalents, excluding LULUCF) are going to increase slightly until 2020 (57.151 kt) compared the 2013 levels (53.990 kt), and then decreasing slightly until 2030 (56.124 kt). According to the WAM scenario, emissions are going to decrease slightly both until 2020 (54.004 kt) and until 2030 (50.024 kt).
Provision of financial, technological and capacity-building support to developing country Parties
Hungary does not belong to the Annex II of the UNFCCC and is fundamentally not obliged to provide financial resources to developing countries, however, as member of the European Union and the Organization for Economic Co-operation and Development (OECD) we have made commitments to contribute to the European and the international development aid system, in which the role of climate finance is remarkable. The national framework of our development cooperation policy is characterized by the government resolution (2014) on the International Development Cooperation Strategy (2014-2020) and the Strategic Concept for International Humanitarian Aid of Hungary 2014-2020. In 2014, Hungary’s official development assistance (ODA) to developing countries was 144 million USD (0.11% of our GNI). 80% of total aid was delivered to the beneficiaries through multilateral, 20% through bilateral arrangements.
A significant share (11.5%) of our aid is dedicated to climate finance. In 2015 the Hungarian Government decided to allocate up to 2 billion HUF to participate in international climate finance efforts related to the climate policy negotiations. According to this decision, in the summer of 2015 Hungary made of pledge of 1 billion HUF (approx. USD eq. 4 million)4 to the Green Climate Fund (GCF), which is expected to increase the share of climate policy funding at our multilateral aid area by 30% in the year 2016. The remaining 1 billion HUF contribution to international climate finance, as announced during the COP21 in Paris, shall be provided through bilateral and multilateral channels and is likely to increase the share of climate contributions on the bilateral field as well.
In addition to climate finance we also provide technological and capacity-building support to developing countries and economies in transition. Main beneficiaries of these activities currently are Serbia, Bosnia and Herzegovina, Ukraine, Montenegro and Macedonia.
1 Introduction
Hungary as a Member State of the European Union and as a Party to the Kyoto Protocol considers efforts against climate change to be one of the most important challenges. Implementing, adopting and planning measures and policies to tackle climate change related threats, designing mechanisms and plans to adapt to climate change and pursuing scientific activities to assess, monitor and decrease climate change vulnerability was and is in the focus of the Hungarian Government and the experts.
Hungary’s second Biennial Report provides information on greenhouse gas emissions and trends, the quantified emission reduction targets, and the progress towards their accomplishment, gives an overview of emissions projections and financial and technical support provided to developing countries and countries in transition.
4 United States dollars equivalent (USD eq.) based on the reference exchanges rates established for GCF's
High-Level Pledging Conference (GCF/BM-2015/Inf.01), using the Reference Period average (July 1, 2014
- September 9, 2014).

UNFCCC 2nd Biennial Report of Hungary
6
2 Information on GHG emissions and trends5
2.1 Summary of National Emissions and Removal Related Trends
In 2013, total emissions of greenhouse gases in Hungary were 57.4 million tonnes carbon dioxide equivalents (excluding the LULUCF sector) which is the lowest value in the whole time series (1985-2013). Taking into account also the mostly carbon absorbing processes in the LULUCF sector, the net emissions of Hungary were 54.0 million tons CO2 eq. in 2013. Being about 6 tons, the Hungarian per capita emissions are below the European average.
Now, our emissions are 47.7% lower than in the base year (average of 1985-87). For the most part, this significant reduction was mainly a consequence of the regime change in Hungary (1989-90) which brought in its train radical decline in the output of the national economy. The production decreased in almost every economic sector including also the GHG relevant sectors like energy, industry and agriculture. Then, between 2005 and 2013, after a period of about 14 years of relatively stagnant emission level (1992-2005), GHG emissions fell again quite significantly by 24.4 %.
The global financial and economic crises exerted a major impact on the output of the Hungarian economy, consequently on the level of GHG emissions as well. After a quite significant drop of 8.8% between 2008 and 2009, our emissions in the following five years (2009-13) remained not just the lowest in the entire time series but decreased further by 11.7%. In contrast, the decline in economic output stopped in the first quarter of 2010, and although Hungary has not yet reached the GDP level of 2008, our economy shows a slightly growing trend.
From 2012 to 2013, total emissions have decreased by 4.3% corresponding to 2.6 megatons in CO2-eq. The decrease was dominated by the energy sector. Emissions from power and heat production alone dropped no less than 2.6 Mt CO2-eq due to significantly lower electricity production from fossil fuels.
The most important greenhouse gas is carbon dioxide accounting for 76.4% of total GHG emissions.
The main source of CO2 emissions is burning of fossil fuels for energy purposes, including transport.
CO2 emissions have decreased by 48.4% since the middle of the 80’s. Methane represents 13.6% in the
GHG inventory. Methane is generated mainly at waste disposal sites and in animal farms, but the
fugitive emissions of natural gas are also important sources. CH4 emissions are by 41.0% lower than in
the base year. Nitrous oxide contributes 7.5% to the total GHG emissions. Its main sources are
agricultural soils, and manure management. N2O emissions are 60.9% lower compared to base year.
The total emissions of fluorinated gases amount to 2.4% but their steadily growing tendency seems to
level off since 2008. However, special attention is still needed as their applications in the cooling
industry and the use of SF6 in electrical equipment, first of all in switchgears for insulation and arc
quenching are still popular.
Table 1 Trend of emissions by GHGs, excluding LULUCF (Gg CO2 eq)
BY 1990 1995 2000 2005 2008 2010 2011 2012 2013
CO2 85 041 72 984 61 238 58 218 60 223 57 233 52 079 50 402 46 732 43 888
CH4 13 235 12 525 9 379 9 346 8 762 8 540 8 253 8 018 7 992 7 814
N2O 11 060 8 327 4 801 5 445 5 786 4 261 3 837 4 032 3 957 4 322
HFCs NO NO 42 273 804 1 164 1 223 1 345 1 184 1 279
PFCs 371 376 223 283 281 5 2 2 2 2
SF6 6 11 52 84 94 108 99 107 120 123
Total 109 713 94 222 75 734 73 650 75 949 71 310 65 493 63 906 59 986 57 428
5 Based on the National Inventory Report 1985-2013 of Hungary, 2015

UNFCCC 2nd Biennial Report of Hungary
7
Note: Base year (BY) = average of 1985-87
2.2 Overview of Source and Sink Category Emission Estimates and Trends
By far, the biggest emitting sector was the energy sector contributing 71.6% to the total GHG emission in 2013. Agriculture was the second largest sector with 11.0% while emissions from industrial processes and product use accounted for 9.8% and the waste sector contributed 7.5%. Compared to the base year, emissions were significantly reduced in the energy (-47.8%), agriculture (-48.0%), and industrial processes and product use (-62.3%) sectors. In contrast, emissions in the waste sector have increased since 1985 (+14.3%). The land use, land-use change and forestry (LULUCF) sector shows fluctuating behaviour. Looking at the most recent trends since 2005, emissions have significantly decreased in the energy and industrial processes sectors by 26.5% and 38.7%, respectively. The agriculture sector seems to have recovered and is at the same level as in 2005 (+1.1%). The previous growing trend turned back in the waste sector (-8.5%).
The energy sector was responsible for 71.6% of total GHG emissions in 2013. Carbon dioxide from fossil fuels was the largest item among greenhouse gas emissions contributing 96.4% to the sectoral emission. Looking at fuel combustion only, the share of CO2 emissions was even higher (98.1%). Considering fuel use in combustion processes, gases had the highest proportion (48.1%), liquids and solids represented 27.3% and 13.2%, respectively. It is worth mentioning that the share of biomass in fuel combustion grew to 10.5%. The most important subsector was energy industries with a proportion of 34.3% within the energy sector, followed by other sectors (28.7%) and transport (24.5%). Fugitive emissions from fuels played only a small role with 2.0% out of which 54.6% originate from natural gas production, processing, transmission and distribution.
The significant reduction in emissions between the base year and 1995 was mainly due to the economic transformation which caused sudden decrease in energy demand. (In this respect it is perhaps worth mentioning that the decrease in fuel consumption after 2005 was even higher!) In addition, on-going changes in fuel-structure, i.e. gradual replacement of solid fuel by natural gas, led to further decrease of total emissions.
Overall emissions from the energy sector have decreased by 5.2% or 2.3 million tons between 2012 and 2013 (after a 7.4% decrease previous year). The biggest change occurred in energy industries (-15.7% or -2.6 million tons). Gross electricity production fell back by 12.5% (after a drop of 3.9% in 2012). Moreover, the decrease in natural gas based electricity production was quite drastic (-41.1%), whereas the share of CO2 neutral nuclear fuel has steadily grown in the last few years, and wind energy utilization showed a steep increase. Currently, 50.8% of gross electricity production stems from nuclear energy and only 39.6% from classic fossil fuels. As electricity consumption was quite stable in recent years, and production dropped altogether by 24.4% since 2008, electricity import needed to grow significantly to its current level of 28%.
Table 2 Trend of emissions and removals by sector (including LULUCF, Gg CO2 eq)
BY 1990 1995 2000 2005 2008 2010 2011 2012 2013
Energy 78 808 68 069 57 002 54 420 55 769 52 966 48 685 46 875 43 392 41 141
Industry 14 937 11 596 8 169 8 166 9 196 7 382 6 496 6 629 6 166 5 635
Agriculture 12 187 10 254 6 055 6 350 6 262 6 196 5 733 5 939 5 941 6 333
LULUCF -2 762 -3 309 -5 907 -862 -5 588 -5 127 -4 024 -3 686 -4 305 -3 438
Waste 3 780 4 303 4 509 4 714 4 722 4 766 4 579 4 463 4 488 4 320
Total 106 951 90 913 69 828 72 787 70 361 66 183 61 469 60 220 55 681 53 990
Note: Base year (BY) = average of 1985-87
As in every year since 2008, emissions from transport continued to decrease (-5.5%). The current level of emissions corresponds to the one 10 years ago. Transport related emissions almost doubled between

UNFCCC 2nd Biennial Report of Hungary
8
1994 and 2007, since then, however, a decrease of 22.1% could be observed. Motor gasoline use has reached its lowest level since 1985 and also road diesel consumption fell back further (-5.5%). Natural gas consumption decreased further in the residential sector (by 6.8% in 2013) where we have not seen such a low consumption level since the early 90’s. In contrast, energy consumption of manufacturing industries increased quite significantly but remained still below the level of 2008, i.e. before the economic crisis.
In 2013, agriculture was the second largest source of greenhouse gas emissions in Hungary. Emissions from agriculture include CH4 and N2O gases: 76.3 % of total N2O emissions were generated in agriculture in 2013. Emissions from agriculture have decreased by 48.0% over the period of 1985-2013. The bulk of this reduction occurred in the years between 1985 and 1995, when agricultural production fell by more than 30 %, and livestock numbers underwent a drastic decline. The contribution of agriculture to total emissions was 11.0% in 2013 near to the level of 11.1% in the BY.
Between 1996 and 2008, agricultural emissions had stagnated around 6.3 Mt with fluctuations up to 4%. Behind this trend there were compensatory processes. While the number of livestock decreased further leading to lower emission, the use of fertilizers increased by 67.5% until 2007 which caused growing nitrous-oxide emissions from agricultural soils. In 2008 the significantly rising fertilizer prices led to lower fertilizer use, which resulted in some reduction in the emission levels.
Agricultural emissions decreased both in 2009 and 2010. A major reduction in emissions occurred in 2009, when 11 % decline in swine population also contributed to the downward trend. Agricultural emissions hit the lowest point in 2010. A slight increase started in 2011, due to the higher N-fertilizer use, and higher emissions from crop residues resulting from greater crop production, then in 2012 emissions remained on the level of 2011. In 2013 the further rising fertilizer use, and relatively higher crop production resulted in growing emission levels again.
The industrial processes sector was the third largest sector, contributing 9.8% to total GHG emissions in 2013. The most important greenhouse gas was CO2, contributing 68.2% to total sectoral GHG emissions, followed by F-gases with 24.9%. In 2013, 39.5% of the emissions came from chemical industry, followed by 22.7% from consumption of F-gases and 17.1% from mineral products. The contribution of iron and steel industry and other (SF6 and N2O containing) product uses is 12.9% and 7.6% respectively. Process related industrial emissions decreased by 62.3% between base year and 2013, and by 38.7% between 2005 and 2013.
Although emissions of F-gases represent only 2.4% of the total GHG emissions, their trend requires special attention. As these gases are harmless for the ozone layer, the use of HFCs in the refrigeration and air conditioning industry got widespread thus their emission steeply increased until 2008.
The trend in GHG emissions from industrial processes sector is still decreasing, as emission fell again by 8.6% (531 Gg) between 2012 and 2013. There is an 8% increase in consumption of F-gases and 5.9% in other (SF6 and N2O containing) product uses. Emissions are quite similar (+0.5%) in chemical industry and there is a decrease in all the other sectors.
The waste sector was responsible for 7.5% of total national GHG emissions in 2013. The largest category was solid waste disposal on land, representing 77.5% in 2013, followed by wastewater treatment and discharge (14.3%), incineration of waste (4.6%), and biological treatment of solid waste (3.6%). In contrast with other sectors, emissions from the waste sector are by 14.3% higher now than in the base year. However, the growth in emissions had stopped in the last decade, and a reduction of 8.5% could be observed between 2005 and 2013. The degradation process in solid waste disposal sites is quite slow which means that waste that were disposed many years earlier have still an influence on current emission levels. However, the amount of disposed waste had decreased so significantly since 2005 (-49.1%), that methane emissions started to decrease as well. GHG emissions from wastewater handling have a pronounced decreasing trend due to a growing number of dwellings connected to the public sewerage network.
The Land Use Land-Use Change and Forestry sector is a sink of carbon because of the huge amount of carbon uptake of forests, due to continuous afforestation efforts and sustainable forest management. The complex dynamics of the land use and land-use changes leads to highly fluctuating estimates of sectoral removals. Our estimates indicate an average annual 3.6 million tons removal, CO2-eq. net

UNFCCC 2nd Biennial Report of Hungary
9
removals range from 0.9 million tonnes in 2000 to 6.1 million tonnes CO2 in 1994. In 2013 the LULUCF sector accounted for 3.4 million tonnes carbon-dioxide removals. The net removals of forests amounted to 3.2 million tonnes CO2.
Note: BY=average of 1985-87 but 1995 for F-gases
Figure 1 Change in greenhouse gas emissions from base year (1985-2013)
2.3 National Inventory Arrangements
The minister responsible for the environment has overall responsibility for the Hungarian Greenhouse Gas Inventory and the Hungarian National System for Climate Reporting. He is responsible for the institutional, legal and procedural arrangements for the national system and the strategic development of the national inventory. The structure and duties of the ministries changed somewhat after the elections in 2014, and the Ministry of Rural Development turned to Ministry of Agriculture which nevertheless has the same responsibilities regards environmental matters. Therefore, the designated single national entity is now the Ministry of Agriculture.
Contact details of the single national entity are as follows:
Ministry of Agriculture
Head office: 1055 Budapest, Kossuth Lajos tér 11.
Postal address: 1860 Budapest
Phone: +36-1-795-2000
Fax: +36-1-795-0200
E-mail: [email protected], [email protected]
Sándor Fazekas, Dr. Minister of Agriculture
Postal address: 1055 Budapest, Kossuth L. tér 11.
Phone: +36-1-795-3723
Fax: +36-1-795-0072
E-mail: [email protected]

UNFCCC 2nd Biennial Report of Hungary
10
See also at: http://www.kormany.hu/en/ministry-of-agriculture/contacts
The national system has to be operated by the minister responsible for the environment but, as prescribed by legislation, in consent and cooperation with the ministers responsible for energy policy, forest management, agricultural policy, and national budget. The Ministry of National Development (MoND; which is headed by the minister responsible for energy policy) has a Climate Policy Department that plays a coordinating and supervisory role in the national system. The head of this Department serves as UNFCCC Focal Point.
At the end of 2006, a Greenhouse Gas Inventory Division (GHG division) was established in the Hungarian Meteorological Service (OMSZ) for the preparation and development of the inventory. This division is responsible for most inventory related tasks, compiles the greenhouse gas inventories and other reports with the involvement of external institutions and experts on a contractual basis and supervises the maintenance of the system.
At the very end of 2009, a new government decree 345/2009 (XII.30.) on data provision relating to GHG emissions was put into force. This decree confirmed the designation of the Hungarian Meteorological Service as the inventory compiler institute. As a new element, the participation of the Forestry Directorate of the National Food Chain Safety Office (NFCSO, Forestry Directorate) together with the National Agricultural Research and Innovation Centre (hereafter referred to as NARIC) Forest Research Institute was formalized by this decree. These two institutes were responsible for the forestry part of the LULUCF sector and for the supplementary reporting on LULUCF activities under Articles 3.3 and 3.4 of the Kyoto Protocol by making recommendations to HMS of the content of the inventory. The govt. decree had to be revised according to the changing EU regulations and reporting needs, therefore Govt. Decree 345/2009 (XII.30) was replaced by Govt. Decree 528/2013 (XII.30.).
1st January 2015, a new government decree 278/2014. (XI. 14) entered into force in Hungary designating the National Food Chain Safety Office (NFCSO) Plant Protection and Soil Conservation Directorate, together with the Agricultural and Rural Development Agency (ARDA) and the Hungarian Chamber of Agriculture, responsible for the development of the GHG inventory of the non-forest sectors. (This is a change from the previous system, in which the Hungarian Meteorological Service was responsible for the non-forest sectors. In order to facilitate this change, and in order to ensure a smooth transition to the application of the IPCC 2006 Guidelines, a new estimation system has been recently developed for, and together with, the NFCSO by an external expert.)
The Hungarian Meteorological Service is a central office under the control of the Ministry of Agriculture. The duties of the Service are specified in a Government Decree 277/2005. (XII.20.). The financial background of operation is determined in the Finances Act. OMSZ has introduced the quality management system ISO 9001:2000 for the whole range of its activities in 2002 to fulfil its tasks more reliably and for the better satisfaction of its partners. The GHG Inventory Division functions as part of the Climate and Atmospheric Environment Department. The GHG division of the Hungarian Meteorological Service coordinates the work with other involved ministries, government agencies, consultants, universities and companies in order to be able to draw up the yearly inventory report and other reports to the UNFCCC and the European Commission. The GHG division can be regarded as a core expert team of four people. The division of labour and the sectoral responsibilities within the team are laid down in the QA/QC plan and other official documents of OMSZ. The Head of Division coordinates the teamwork and organizes the cooperation with other institutions involved in inventory preparations. He is responsible for the compilation of CRF tables and NIR. Within the team the experts are responsible for different sectors. Besides, a QA/QC coordinator and an archive manager have been nominated.
Most parts of the inventory (energy, industrial processes and product use, agriculture, and waste) are prepared by the experts of the GHG division themselves. The whole LULUCF sector is compiled by the institutes listed in the above mentioned government decree. As before, and also complying with the decree mentioned above, the Forestry Directorate of the NFCSO is responsible for the GHG inventory of the forestry sector. Quality control for the forestry sector is provided by the NARIC Forest Research Institute. The role of the Agricultural and Rural Development Agency and the Hungarian Chamber of Agriculture in the inventory preparation is not clarified yet. Data for the estimation of non-forest related
UNFCCC 2nd Biennial Report of Hungary
11
emissions is also provided by the Central Statistical Office, the Hungarian Mining Authority and National Directorate General for Disaster Management.
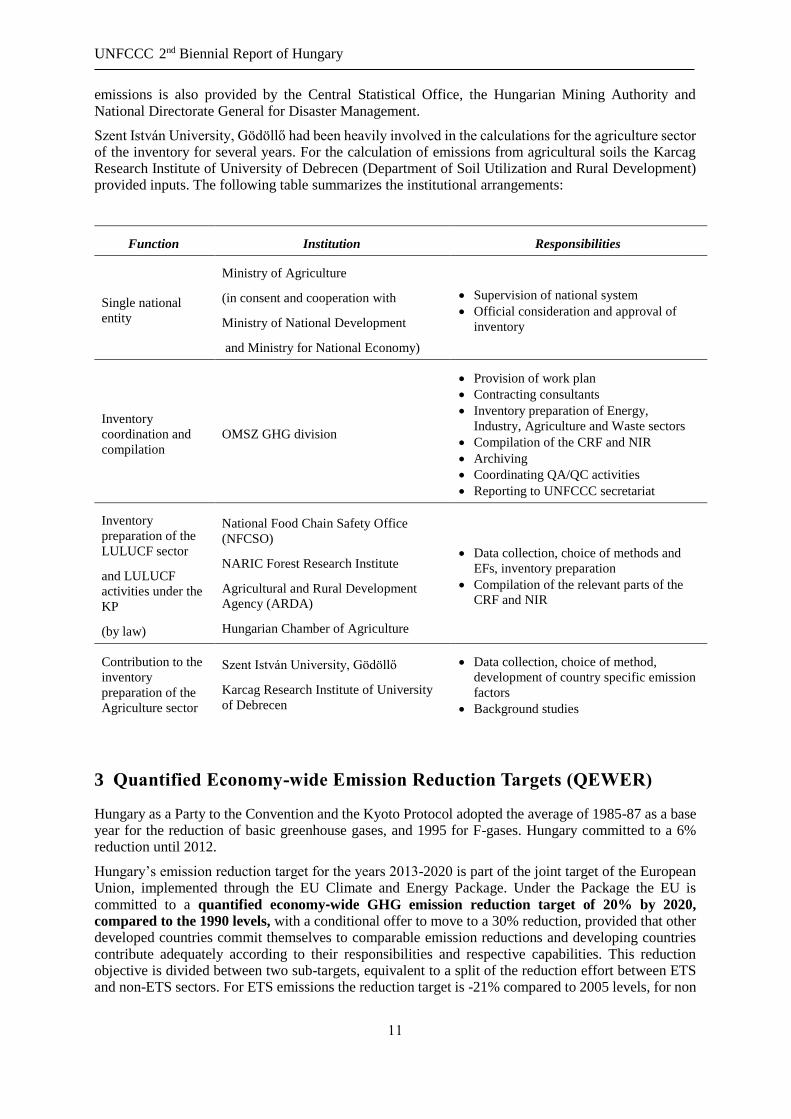
Szent István University, Gödöllő had been heavily involved in the calculations for the agriculture sector of the inventory for several years. For the calculation of emissions from agricultural soils the Karcag Research Institute of University of Debrecen (Department of Soil Utilization and Rural Development) provided inputs. The following table summarizes the institutional arrangements:
Function Institution Responsibilities
Single national
entity
Ministry of Agriculture
(in consent and cooperation with
Ministry of National Development
and Ministry for National Economy)
Supervision of national system
Official consideration and approval of
inventory
Inventory
coordination and
compilation
OMSZ GHG division
Provision of work plan
Contracting consultants
Inventory preparation of Energy,
Industry, Agriculture and Waste sectors
Compilation of the CRF and NIR
Archiving
Coordinating QA/QC activities
Reporting to UNFCCC secretariat
Inventory
preparation of the
LULUCF sector
and LULUCF
activities under the
KP
(by law)
National Food Chain Safety Office
(NFCSO)
NARIC Forest Research Institute
Agricultural and Rural Development
Agency (ARDA)
Hungarian Chamber of Agriculture
Data collection, choice of methods and
EFs, inventory preparation
Compilation of the relevant parts of the
CRF and NIR
Contribution to the
inventory
preparation of the
Agriculture sector
Szent István University, Gödöllő
Karcag Research Institute of University
of Debrecen
Data collection, choice of method,
development of country specific emission
factors
Background studies
3 Quantified Economy-wide Emission Reduction Targets (QEWER)
Hungary as a Party to the Convention and the Kyoto Protocol adopted the average of 1985-87 as a base year for the reduction of basic greenhouse gases, and 1995 for F-gases. Hungary committed to a 6% reduction until 2012.
Hungary’s emission reduction target for the years 2013-2020 is part of the joint target of the European Union, implemented through the EU Climate and Energy Package. Under the Package the EU is
committed to a quantified economy‐wide GHG emission reduction target of 20% by 2020,
compared to the 1990 levels, with a conditional offer to move to a 30% reduction, provided that other developed countries commit themselves to comparable emission reductions and developing countries contribute adequately according to their responsibilities and respective capabilities. This reduction objective is divided between two sub-targets, equivalent to a split of the reduction effort between ETS and non-ETS sectors. For ETS emissions the reduction target is -21% compared to 2005 levels, for non

UNFCCC 2nd Biennial Report of Hungary
12
ETS emissions annual national targets were determined by the European Commission, resulting in an assessed 10% of emission reduction compared to 2005.
Table 3 Key facts of the convention target of the EU-28
Parameters Target
Base Year 1990
Target Year 2020
Emission Reduction Target -20% in 2020 compared to 1990
Gases Covered CO2, CH4, N2O, HFCs, PFCs, SF6
Global Warming Potential AR4
Sectors Covered
All IPCC sources and sectors, as measured by the full
annual inventory and international aviation to the extent it
is included in the EU ETS.
Land-Use, Land-Use Change and Forestry
(LULUCF)
Accounted under KP, reported in EU inventories under the
UNFCCC. Assumed to produce net removals.
Use of International Credits (JI and CDM) Possible subject to quantitative and qualitative limits.
Other
Conditional offer to move to a 30% reduction by 2020
compared to 1990 levels as part of a global and
comprehensive agreement for the period beyond 2012,
provided that other developed countries commit themselves
to comparable emission reductions and that developing
countries contribute adequately according to their
responsibilities and respective capabilities.
Source: European Commission
This means that Hungary committed herself to a reduction of 20% of the 96 961.78 kt CO2 equivalent emissions of 1990 (incl. LULUCF), the target to be achieved is 77 568.8 kt by 2020. (This target is coupled with a renewable penetration rate of 14.65% for Hungary and an energy efficiency improvement of 20%). GHG emissions of Hungary are part of EU-28 emissions with a percentage of 1.28% in the year 2013. The development of GHG emissions in Hungary is reported in the Table below.
Table 4 Total GHG emissions (including and excluding LULUCF, kilotonnes of CO2 eq)
Table 4 BY 1990 1995 2000 2005 2008 2010 2011 2012 2013
Total (incl. LULUCF)
106 951 90 913 69 828 72 787 70 361 66 183 61 469 60 220 55 681 53 990
Total (excl. LULUCF)
109 713 94 222 75 734 73 650 75 949 71 310 65 493 63 906 59 986 57 428
BY= average of 1985-87 (1995 for F-gases) as fixed in 2007 Source: National Inventory Report 1985-2013 of Hungary, 2015
Hungary is also influenced by the second commitment period target of the Kyoto Protocol of the EU. The EU has also committed to reduce its emissions by 20% under the KP2, which runs from 2013 to 2020. Despite their identical nature this commitment differs in several important respects from the EU's unilateral 2020 commitment:
The Kyoto commitment is measured against base years, not 1990.
LULUCF: the LULUCF sector in the EU is not included in the 20 % target under the Climate and Energy package, but is accounted for under the KP according to the relevant decisions made in Durban.
Inclusion of nitrogen trifluoride (NF3): NF3 is not included in the Climate and Energy Package, whereas the scope of the second commitment period has been extended to include the additional gas. The impact of NF3 on aggregate EU emissions is insignificant.
It requires the EU to keep its emissions at an average of 20% below base‐year levels over the whole period, not only in 2020;

UNFCCC 2nd Biennial Report of Hungary
13
It differs in scope (for instance, it does not cover emissions from international aviation since these are outside the scope of the Protocol, but does cover emissions and their removals from land use, land use change and forestry, which the unilateral commitment does not).
The EU will meet its Kyoto commitment jointly with Iceland.
Targets in ETS Sectors
Sectors under the EU ETS are forecasted to provide a basis of GHG emissions savings until
2025. Beginning with 2013, from the third trading period onwards, a single EU‐wide cap determines the amount of emissions allowed to be emitted by the EU ETS sectors. Furthermore, from 2013 onwards,
a linear reduction factor of ‐1.74 % per annum applies to achieve a total of 21% of reduction in the ETS sectors. For further information on the EU ETS and for information on the use of flexible mechanisms in the EU ETS see 2nd Biennial Report of the European Union (EU-BR2), Chapter 4.2.2.
With total GHG emissions of 57.4 Mt CO2 equivalent (without LULUCF) the share of ETS emissions is 33%. In the year 2013 verified emission of stationary installations covered under the EU-ETS in Hungary summed up to 19.2 Mt CO2 equivalent.
Targets under the ESD
Under the joint Effort Sharing Decision (ESD) of the EU, Hungary took the commitment of a maximum
10% increase of the non‐ETS sectors greenhouse gas emissions compared to their 2005 levels by 2020. These changes have been transferred into binding quantified annual reduction targets for the period from 2013 to 2020, expressed in Annual Emission Allocations (AEAs). The quantified annual reduction targets 2013-2020 of Hungary start from 49.29 million AEAs in 2013 and increase to 56.97 million AEAs in 2020.
Table 5 Member States Annual Emissions Allocation for the year 2013 to 2020 calculated applying
global warming potential values from the second IPCC assessment report
Country Annual Emission Allocation
(tonnes of carbon dioxide equivalent)
Hungary 2013 2014 2015 2016 2017 2018 2019 2020
50 398 977 51 516 636 52 634 296 53 751 955 54 869 615 55 987 274 57 104 934 58 222 593
Source: European Commission6
The use of flexible mechanisms under the ESD cannot be quantified in the moment: As the compliance assessment for the first year 2013 under the ESD will only take place in 2016, any potential use of units for the first year will only take place in 2016. Thus, use of CER and ERU cannot be quantified at the time of reporting.
Beyond 2020
EU leaders recently agreed a domestic 2030 greenhouse gas reduction target of at least 40%
compared to 1990. The climate and energy policy framework for 2030 also sets a target of at least 27% for renewable energy and energy savings by 2030. For 2050, the EU has committed to reducing progressively its GHG emissions by 80 to 95% compared to 1990 levels.
6 Commission decision of 26 March 2013 on determining Member States' annual emission allocations for the
period from 2013 to 2020 pursuant to Decision No 406/2009/EC of the European Parliament and of the Council
(2013/162/EU).

UNFCCC 2nd Biennial Report of Hungary
14
4 Progress in achievement of QEWER target
GHG emissions of Hungary are part of EU-28 emissions with a percentage of 1.28% in the year 2013. The development of GHG emissions in Hungary is reported in the Table below.
Table 6 Total GHG emissions (excluding LULUCF) - (kilotonnes of carbon dioxide equivalent)7
Table 4 BY 1990 1995 2000 2005 2008 2010 2011 2012 2013
Total (excl.
LULUCF)8 109 713 94 222 75 734 73 650 75 949 71 310 65 493 63 906 59 986 57 428
BY= average of 1985-87 (1995 for F-gases) as fixed in 2007.
With total GHG emissions of 57.4 Mt CO2 equivalent (without LULUCF) the share of ETS emissions is 33%. In the year 2013 verified emission of stationary installations covered under the EU-ETS in Hungary summed up to 19.2 Mt CO2 equivalent, which is a 27% emission reduction compared to 2005, as base year. Emissions of non-ETS sectors, responsible for 67% of total domestic emissions in 2013, have decreased by 23.1% since 2005.
Table 7 GHG emissions from ETS and non-ETS sectors (kilotonnes of carbon dioxide equivalent)9
2005 2006 2007 2008 2009 2010 2011 2012 2013
Total
GHG
emissions
(excl.
LULUCF)
75 949.27 74 909.99 73 128.98 71 310.43 65 016.89 65 493.05 63 906.33 59 986.38 57 428.46
Emissions
from ETS
sectors
26 161.64 25 843.72 26 836.76 27 236.61 22 401.26 22 991.71 22 469.98 22 430.41 20 230.54
Emissions
from non-
ETS
sectors
49 787.63 49 066.27 46 292.22 44 073.82 42 615.64 42 501.34 41 436.35 37 555.97 37 197.93
ETS (%) 34.45% 34.50% 36.70% 38.19% 34.45% 35.11% 35.16% 37.39% 35.23%
non-ETS
(%) 65.55% 65.50% 63.30% 61.81% 65.55% 6489% 64.84% 62.61% 64.77%
The use of flexible mechanisms under the ESD cannot be quantified in the moment: As the compliance assessment for the first year 2013 under the ESD will only take place in 2016, any potential use of units for the first year will only take place in 2016. Thus, use of CER and ERU cannot be quantified at the time of reporting.
7 Source: National Inventory Report and Inventory for 1985-2013 of Hungary (2015) 8 Numbers for LULUCF are not reported because this sector is not included under the Convention target. 9 Sources: National Inspectorate for Environmental Protection and Natural Protection, National Inventory
Report and Inventory for 1985-2013 of Hungary (2015).

UNFCCC 2nd Biennial Report of Hungary
15
4.1 Mitigation actions and their effects
4.1.1 European framework
Hungary’s mitigation actions, as member state of the European Union, are characterized by the European
community law material on climate change. For further details on EU climate legislation see the 2nd
Biennial Report of the European Union (EU-BR2).
Table 8 EU framework policies
Domain Name of mitigation action
Cross-cutting
measures
Directive 2009/29/EC and 2003/87/EC EU-Emission trading system
Directive 2009/29/EC Effort Sharing Decision
European Energy Security Strategy
Directive 2009/28/EC on the promotion of the use of energy from renewable sources
Energy Supply 2020 Climate & Energy Package (COM(2008) 30 final)
Biomass Action Plan
Renewable Energy Directive 2009/28/EC
2030 Framework for Climate and Energy framework (COM(2014) 15 final)
Energy Union Strategy (COM(2015) 80 final)
Directive on the geological storage of CO2 (CCS Directive)
Energy demand Directive 2012/27/EU on energy efficiency
Directive 2010/31/EU on the energy performance of buildings
Directive 2009/125/EC establishing a framework for the setting of eco-design
requirements for energy-related products
Directive 2010/30/EU on energy labeling
Eco-design requirements
Transport CO2 and Cars Regulation (EC) No 443/2009
CO2 and Vans Regulation (EU) No 510/2011
Directive 2009/30/EC on Fuel Quality
Directive 2009/28/EC on the promotion of the use of energy from renewable sources
Regulation (EC) No 1222/2009 on the labeling of tires
Clean vehicles Directive (2009/33/EC)
Directive 1999/94/EC on Car Labeling
White Paper: “Roadmap to a Single European Transport Area (COM(2011) 144 final
Industry & non
CO2 gases
F-Gas Regulation (EU) No 517/2014
Industrial Emissions Directive 2010/75/EU (IED)
Agriculture /
Forestry
Common Agricultural Policy (CAP)
Regulation (EU) No 1305/2013 on support for rural development by the European
Agricultural Fund for Rural Development
Nitrates Directive (91/676/EEC)
LULUCF accounting (LULUCF Decision 529/2013/EU)
Waste Landfill Directive 1999/31/EC
Waste Framework Directive 2008/98/EC
Management of biodegradable waste (COM/2008/0811 final)
Urban Waste Water Treatment Directive 91/271/EEC

UNFCCC 2nd Biennial Report of Hungary
16
4.1.2 General legal background
The general legal background of all GHG mitigation policies is provided by:
Act LXXXVI of 2007 on electric power;
Act XL of 2008 on natural gas;
Act LIII of 1995 on the General Rules for the Protection of the Environment;
Act LX of 2007 on the implementation framework for the United Nations Framework
Convention on Climate Change and its Kyoto Protocol;
Act LIX of 2015 on the Doha Amendments of the Kyoto Protocol adopted by the 18th session
of the Conference of the Parties to the UNFCCC;
Act CCXVII of 2012 on the participation in the European Union emission trading system and
in the implementation of effort sharing decision;
Act XXXVII of 2009 on forests, forest protection and forest management;
Act CLXXXV in 2012 on waste.
and their implementation decrees.
The major role of these pieces of legislation is to ensure the legal base for emission reduction measures. All this legislation is still in place and their major GHG related stipulations that serve this purpose were discussed in the previous NC. Minor changes and amendments of the legislation, however are constantly made, but these have not affected the legal base of the GHG mitigation so far. Stipulations of the legislation with specific GHG policy relevance are explained in the description of the individual policies later in this report.
4.1.3 Policy making process
4.1.3.1 The Programme of National Cooperation
Although the Programme of National Cooperation is not focused on the GHG mitigation, the implementation of the Programme includes several such elements, and the Programme itself has some priorities that serve this purpose. These are briefly summarized here:
In reviving the economy, the construction industry has an important role. It is stated in the
programme that one means to boost the construction industry is to promote the European
initiative to employ “green” technologies and to develop the energy efficiency of buildings and
the construction materials.
A large scale energy efficiency program is to be launched with components such as deep
reconstruction of pre‐fab buildings (reduce consumption by 80%), thermal insulation projects
of other buildings, reconstruction of public buildings etc.
Investments in renewable energy have to be encouraged.
Environmental considerations shall be integrated in the national development policy.
Environmental protection shall be taken into consideration in the public procurement
procedures.
In order to boost the economy, new take‐off points need to be found. Green economy and the
utilisation of renewable energies are among the possible take‐off points.
4.1.3.2 National Climate Change Strategy
The National Climate Change Strategy 2008‐2025 (NCCS) was adopted by the Parliament unanimously in the early 2008 (Parliamentary resolution 29/2008. (III. 20.) OGY). It has not been changed since then,

UNFCCC 2nd Biennial Report of Hungary
17
although its review is currently underway. The NCCS was presented in detail in the previous National Communication. Only its key points are summarized here:
The GHG emission reduction target is 16‐25% of the 1990 levels by 2025.
The responsibility of the government is to create the necessary regulatory‐legal framework; to
review and adjust the subsidy systems; to raise the awareness of the society by giving priority
to sustainability and providing good example.
The residential sector is a key field of change: peoples’ lifestyle needs to be changed; a large
scale reduction of demands for energy and materials must be achieved (by subsidized energy
efficiency projects, among others);
Industry and other enterprises also need to reduce their energy consumption, adopt emission
reduction measures, to "green" their profile, products, services.
NGOs, civil organizations shall have increased role in the dissemination of information,
awareness raising and civil control.
Main areas of intervention are:
o Energy efficiency in buildings
o Renewable energy utilization
o Transport (road tolls, other economic incentives, modal split change)
o Afforestation
4.1.3.3 National Sustainable Development (Framework) Strategy
As the new EU Sustainable Development Strategy adopted by the European Council on 15/16 June 2006 requires, Hungary prepared the country’s first National Sustainable Development Strategy (NSDS) and submitted to the Council in 2007. The EU strategy requires that the Member States would revise their National Strategies regularly, subsequent to the revision of the EU SDS, in order to ensure consistency, coherence and mutual supportiveness. In 2009 the Commission adopted the 2009 Review of EU SDS, and in the light of this document the revision of the Hungarian NSDS has been carried out. The new NSDS has been adopted by the Hungarian Parliament in 2013.
4.1.3.4 National Environmental Protection Programme 2015-2020
Beginning from 1995, a regularly (every six year) revised and updated National Environmental Programme (NEP) is prepared. The Programme is the comprehensive strategic plan of environmental issues in Hungary to be used as a framework for every environmental strategy, programme or plan. The Programme is closely linked to the National Framework Strategy on Sustainable Development approved by the Hungarian Parliament, the latter one considered as a long term concept, being particularly relevant for the objectives and measures related to natural resources from the four basic resources. As environmental issues are rather complex, the Programme is not specialized at any given field, but has a horizontal approach covering society and economy in their entirety.
The recent National Environmental Programme 2015‐2020 (NEP‐IV) was adopted by the Parliament in 2015 (Resolution of the Parliament 27/2015 (VI 17) OGY). Similarly to the previous programmes, the
NEP‐IV identifies general objectives, which are the following:
Improving the quality of life and the environmental conditions of human health.
Protection of natural values and resources and their sustainable use.
Improving resource efficiency and making steps toward a green economy.
The elaboration of the strategic objectives of the NEP-IV is facilitated by the strategic areas specified according to environmental elements, systems and sectors. Some strategic areas contribute to the achievement of several strategic objectives. The strategic areas of the Programme build on the progress made by the implementation of the NEP-III.
All the strategic objectives are related to improving our ability to adapt to the climate change. From
the strategic areas the following has relevance from the aspect of the climate-related challenges:

UNFCCC 2nd Biennial Report of Hungary
18
Reduction of greenhouse gas emissions, preparing for the impacts of climate change
By way of transitioning to a low carbon economy, the decrease of greenhouse gases and the
strengthening of natural absorption-capacities (the decrease of GHG emission level by at least
20% compared to the level measured in 1990 in conformity with the internal EU regulations
during the period 2013-2020 as prescribed in the Kyoto Protocol)
Successful implementation of adaptation to climate change in order to preserve the reserves and
the quality of national resources (natural, human, social and economic).
Increasing knowledge about climate change, promoting awareness about prevention and
adaptation measures.
The NEP-IV draws attention to the fact that climate protection interventions, however, should not lead to further sustainability problems, creating more burdens in other elements of the environment or geographical areas. For example, the use of agricultural-based energy sources – in addition to the climate protection benefits – may lead in some cases to retroaction in food prices, and the ecosystem services; other problems may arise in relation to sustainability during the application of flood protection solutions and the application of nuclear energy.
4.1.3.5 The New Széchenyi Plan
The New Széchenyi Plan (NSZP) is the economic development programme of the Hungarian
government. This programme translates the economy‐related objectives of the Programme of National Cooperation into a concrete plan. The main objectives of the New Széchenyi Plan starting on the 15th of January, 2011 are to improve the competitiveness of Hungary and to create one million new jobs over
the next ten years with the help of seven take‐off points. As of today the six take‐off points of the New Széchenyi Plan are:
Healing in Hungary – Health industry
Renewal of Hungary – Development of green economy
Transport – Transit Economy
Network economy – Development of business environment
Knowledge economy – Science – Innovation – Growth
Employment
The New Széchenyi Plan is also a tool to provide financing for the implementation of all strategic goals. The operative programmes are financed through the New Széchenyi Plan, and in this regard it is an important “umbrella” policy for all other relevant strategies including the Energy Strategy, Transport Strategy, Energy Efficiency Action Plan, etc. In this regard it is important to review the key programmes and principles of the NSZP – being the latest decisive strategy document – as it indicates the actual priorities of the government.
The programmes in the period of 2014‐2020 of the NSZP concerning GHG mitigation are as follows:
1. Energy policy:
Energy policy is to serve economic growth and job creation, together with security of supply,
resource diversification, and the reduction of import dependence.
Production and utilization of renewable energies is to be encouraged. The following measures
are planned to stimulate the utilization of renewable energies through domestic support funds:
o Revision of discounts on fossil fuels (e.g. discounts on gas consumption, carbon tax,
etc.);
o Restructuring of the actual support system (revision of investment support, preference
of domestic added value, introduction of a green certificate);
o Modification of the support mechanism to promote the renewal/adaptation of heating
systems;
o Facilitation of renewable energy producers’ network connection.

UNFCCC 2nd Biennial Report of Hungary
19
o The Plan regards projects affecting the climate change and projects of mitigation and
adaptation in connection with the energy sector as of supreme priority. These include
reduction of greenhouse gases emissions, promotion of climate‐friendly investments,
as well as projects increasing social acceptance and awareness of environmental
protection issues. To this end, the Plan works out and implements measures and
development projects to support the National Climate Change Strategy.
o Nuclear energy is given high priority due to its favuorable impact on the security of
supply and GHG mitigation.
2. Transport
Creating the financial resources necessary for a sustainable transport system.
Encouraging intermodal transports.
Enforcing environmental and climate policy considerations
4.2 Sectoral Policies and Measures
4.2.1 Cross-cutting policies and measures
4.2.1.1 National Energy Strategy
The current National Energy Strategy was adopted by the Parliament in October, 2011 by 77/2011. (X.14.) Decree of the Parliament and the final document was published in 2012. Compared to the previous strategy document the basic priorities and strategic goals have not changed. In line with the European strategy they are still threefold: safety of supply, competitiveness and sustainability. Thus the strategy relies on the following pillars:
Security of energy supply: The most efficient and effective way, also viable in the short term, of increasing the security of supply is to reduce consumption and to treat energy savings and energy efficiency as priorities. However, the securing of natural gas supply from diverse sources and along alternative routes and the continuous maintenance of the existing infrastructure must also be continued. Further contributors to the security of supply: the still significant hydrocarbon, coal and lignite reserves, the Paks Nuclear Power Plant accounting for 42%of the Hungarian electricity production, the significant renewable energy potential and Hungary’s commercial and strategic natural gas storage capacities.
Increasing competitiveness: the energy sector can promote the long‐term competitiveness of the Hungarian economy by integration into the single internal energy market of the European Union and its prevailing prices; the development of new industries in relation to renewable energy use and sources, the improvement of energy efficiency and the related research and development activities; the appropriate management of domestic supplies and resources (utilisation of geothermal resources, afforestation and energy crop programmes)
Sustainability: sustainable energy management must strike a balance between environmental
(resource‐efficient, climate‐neutral), social (secure, accessible, not harmful to health) and
economic (cost‐effective) considerations. It is based on the reducing of energy consumption and the production and transmission of the required energy in the most efficient manner possible, preferably from 6th National Communication of Hungary to the UNFCCC 78 renewable sources, under strict conditions. Its implementation also requires a critical review of
consumption patterns and their changing through awareness‐raising. The development of sustainable energy management is facilitated by the quantification of the externalities related to the modes of energy production, particularly the use of fossil fuels (e.g. the trading of GHG emissions).
Energy efficiency and energy conservation: The most efficient ways of maintaining or even
reducing the level of energy consumption are the minimisation of losses and the non‐consumption of energy. Energy efficiency can be improved at the lowest cost, while achieving the highest social and climate protection benefit, through energy renewal projects in the construction industry. The implementation of an energy efficiency programme encompassing

UNFCCC 2nd Biennial Report of Hungary
20
an entire supply chain enables the reduction of increasing demand, particularly for heat energy, and the simultaneous reduction of the expenses of citizens.
Renewable energy sources. In European comparison, Hungary has a relatively good renewable energy potential in the fields of the utilisation of biomass, biogas, geothermal and solar energy. Reserve capacities also exist in the fields of hydro energy and waste to energy utilisation. In terms of utilisation, decentralised practices must be distributed and the required incentives must be provided, which should result in the increase of the share of renewable energy at least to the extent required by Hungary’s international commitments.
Nuclear energy. The use of nuclear energy makes a substantial contribution to the maintenance of the security of supply and, through its low operation cost, to the competitiveness of the national economy. The need for the replacement and the potential expansion of the existing capacity by new units is underpinned by the need to replace the existing obsolete power stations,
the expected average 1.5‐% annual increase of demand for electricity, the meeting of the increasing electricity demand as a result of the desired electrification of transport and heating/cooling and the shrinking of import.
Regional infrastructure platform. Cooperation with the neighboring countries (particularly in
the framework of the North‐South High‐Level Group, the V4 and V4+) aims at ensuring price stability, the diversification of resources, the security of supply and the increasing of regulatory network capacities. The integration of the networks, market and trading systems of neighboring countries enables the establishment of a regional infrastructure platform and the resulting price competition.
New system of the government’s energy institutions and tools. A system of institutions ensuring the predictability of the investor environment must be established. Permitting processes should be predictable, transparent and simple for the investors. It is of crucial importance that the stability and credibility of the system of the government’s energy institutions should be ensured in the long term in order that it should be able to put the Energy Strategy into practice and to monitor its implementation on an ongoing basis.
In terms of means to achieve the strategic goals, the key elements of the energy strategy from the aspect of GHG emission mitigation are the following:
Limitation of the increase in energy demand until 2030 and the simultaneous reduction of GHG emissions. With the aid of energy efficiency programs, the country’s primary energy use should be limited to 1,150 PJ/year by 2030, and growth rate of electricity consumption should be limited to 1.5% annually.
According to the most realistic scenario of the strategy, heat demand could be reduced by 111 PJ compared to ‘Sitting and waiting’ or BAU scenarios through a building refurbishment program.
Modernisation of electric power stations and the grid: by replacing the current low‐efficiency power stations by 2030, 78 PJ primary energy can be saved as compared to the current situation.
With particular regard to the fact that financing sources are currently very limited, cost‐effectiveness is one of the critical factors during the first half of the period up to 2020, while the depth of retrofit will have to be steadily increased after 2020. During the initial period, the average depth of retrofit is 50%. From 2020, it will reach 70%and even 85%in certain cases by the end of the 2030 timeframe. 6th National Communication of Hungary to the UNFCCC 79
The improvement of the energy efficiency of industrial and other economic stakeholders will make a great contribution to the achievement of energy efficiency targets. According to
research, the most cost‐effective solution is the application of energy management systems and regular energy audits. More specifically, the commitment of industrial stakeholders to energy
saving is increased by their long‐term agreements (LTA) with the government.
Agriculture also has a significant potential in terms of increasing energy efficiency. First, there are significant differences in the energy demand of various agricultural technologies, as the different operational structures and cultivation intensities represent different consumption structures of mostly fossil fuels. On the other hand, the preference of local production and consumption may help cut back on transportation costs and energy as well as reduce emissions.
Apart from technological development and the use of economic incentives, awareness‐raising and personal involvement are also important. (Smart metering, transparent billing.)

UNFCCC 2nd Biennial Report of Hungary
21
The share of renewable energy in primary energy use will increase from the present 7% to the neighborhood of 20% by 2030. The system of incentives concerning the utilisation of renewable
energy sources should be developed in a way that co‐generating biogas and biomass power
plants are given priority in the case of the co‐generation of heat and electricity and that geothermal energy, also of primary importance, should primarily, but not exclusively, be used for heat generation. In accordance with and in compliance with the criteria of sustainability and
energy efficiency, the local energy utilisation of the by‐products of agriculture (e.g. straw and maize stalk) and sewage water and sludge in biomass power and biogas plants, among other options, are treated as a priority.
Reduction of carbon intensity of the energy sector from 370 g CO2/kWh to below 200 g CO2/kWh, depending on scenario, by 2030 through.
o Nuclear power generation, o Renewables in cogeneration plants, o Shutting down old, inefficient capacities.
Increasing the share of district heating within heat supply along with the modernisation of the district heating systems and much larger utilisation of renewable energies.
Strong increase of the share of renewables in individual heat supply.
Reduction of residential heat demands by some 30% through (building) energy efficiency programmes.
Improvement of the energy efficiency of transport o by promoting railway cargo transport and o by converting public transport to locally produced, sustainable fuels.
Promoting decentralised power generation.
Reliance on regional cooperation in diversifying sources, increasing the network buffer capacities.
4.2.1.1 National Energy Efficiency Action Plan
Article 24 (2) of the Energy Efficiency Directive (2012/27/EU) of the European Parliament and Council requires EU Member States to prepare National Energy Efficiency Action Plans in every 3 years and submit them to the European Commission. The III. National Energy Efficiency Action Plan of Hungary was adopted by the Governmental Decision 1601 /2015. (IX.8.). The energy efficiency targets of the III. National Energy Efficiency Action Plan (hereinafter referred to as NEAP) had been created by calculating with the national energy data of 2012, the current energy trends and GDP forecasts, as well as taking into account the planned energy efficiency measures and by the Governmental Decree 1160/2015, dealing with national energy consumption forecasts.
The 2020 target for primary energy consumption is 1009 PJ (according to the "joint effort" plan). The target for final energy consumption (primary energy consumption minus losses caused by transformation, conversion, distribution of energy, as well as non-energy uses) is 693 PJ. The scenarios entitled „Ölbe tett kéz / Idly Hands” and „Közös erőfeszítés / Joint Effort” of the National Energy Strategy 2030 are calculating with primer energy use difference of 92 PJ, while the difference of final energy use is 73 PJ until 2020.
In order to fulfill the energy efficiency targets, on the basis of the Climate- and Energy Consciousness Action Plan, the District heating Development Action Plan, National Building Energy Strategy, as well as the planned Transportation Energy Efficiency Action Plan, the NEAP describe the planned energy efficiency measures for each economic sector. The NEAP also describes in detail the issues of implementation of practical applications and measures of the EU Directive on Energy Efficiency 2012/27/EU, as well as the supporting programs for better energy efficiency. Measures related to better energy efficiency of buildings, including new buildings with low energy consumption levels, as well as reconstruction of existing buildings, are having the most significant effects on fulfilling the energy efficiency targets. On this basis, the National Building Energy Strategy (Gov. Decree 1073/2015. (II.25)) is part of the NEAP.
Within the National Building Energy Strategy, the detailed examination of the domestic building stock had been performed. Not only the domestic buildings had been examined, but also the public buildings were evaluated by the function of the building, year of construction, types of building structures and

UNFCCC 2nd Biennial Report of Hungary
22
building technology in use, as well as specific energy consumption. According to the evaluation, family houses built before 1980 are having the highest specific energy consumption rates. In case of public buildings, 42 different types had been identified. Altogether 2230 buildings had been evaluated. The energy use of health care related buildings were the highest, while the energy consumption of schools, kindergartens and other buildings with outdated building structures are also higher than the average. According to the calculations, 55% reduction of energy consumption can be reached by energy efficiency reconstructions in case of most public buildings. The list of governmental buildings, affected by the compulsory reconstruction regulated by Article 5 of the EU Directive 2012/27/EU and the related national regulation (Act LVII of 2015, 8 §), as well as the National Plan for the Construction of Zero Energy Buildings (Article 9 of EU Directive 2010/31/EU) are both the parts of the National Building Energy Strategy.
In order to reach the energy efficiency targets of 2020, the implementation of several national policies have been started. For example:
Fostering the energy efficient reconstruction of governmental buildings:
In order to reduce the fossil based energy consumption, according to the Governmental Decree 232/2015. (VIII.20.) about solar energy power plant operation regulation, a new 7 MW solar power plant, is to be built until 30 November 2015. Solar energy originated from this power plant is to be distributed in 2016 by appointing energy users, while from 2017, final users will need to apply. Sums originated from energy savings at the governmental buildings must be used for further energy efficiency measures (LED lights, energy efficient machines, etc.), which measures can result in 0,0252 PJ annual energy saving.
Energy audits of larger companies
According to the Act LVII of 2015, companies not qualified as small- or medium sized enterprises, must complete an energy audit of their activities until 05. December 2015, as well as are required to perform the same energy audit in every 4 years. Companies required to perform the energy audits in coherence with Act LVII of 2015, are regulated by the Act XXXIV of 2004. According to this regulation, enterprises with more than 250 employees and an annual turnover of more than EUR 50 million and / or balance sheet total of EUR 43 million are counted as large companies. As well as in order to determine if an enterprise should be listed as large company, the previously mentioned business data of related or foregoing partner enterprises should be added to the business data of the enterprise to be determined. However, several companies, which are not required by the regulation to perform an energy audit, do prepare their own energy audits on voluntary basis. Companies with ISO 50001 certificates do fulfill the requirements of the energy audit, as they perform examination for possible energy losses, which fulfills the requirements of an energy audit. The obligation for the preparation of energy audits, data collection and the monitoring of the preparation of an energy audit are regulated by the Act LVII of 2015. Implementation rules are set by MoND Decree 122/2015 (V.26.), as well as by MoND Decree 26/2015 (V.26.).
4.2.1.1 National Renewable Energy Action Plan
The Renewable Energy Action Plan (the official title is: Hungary’s Action Plan for the Utilisation of
Renewable Energies 2010‐2020, in the context of this document: NREAP, for short) was published early 2011. The key points and targets are the followings. The NREAP reconfirms Hungary’s overall target for the share of renewable energies and identifies the key areas of intervention, stating individual quantitative targets. It sets more ambitious targets than originally set by the European Union in order to support the overall economic objectives (job creation, improving competitiveness, reducing energy import dependency) through boosting “green” economy. While the RED Directive (2009/28/EC) of the EU set the renewable target for Hungary as minimum 13% of the total gross final energy consumption, the objective defined by the NREAP is 14.65%.
4.2.1.2 Economy Greening Scheme (EGS)
The Economy Greening Scheme (EGS) is a separated scheme operated by the Ministry for National Economy. The funding of this scheme is partly financed by the auction revenues of EUA and EUAA

UNFCCC 2nd Biennial Report of Hungary
23
allowances (as ruled by the amended Act CCXVII of 2012) and partly by the incomes from the trading of allowances under the Kyoto Protocol (when applicable; as ruled by the amended Act LX of 2007).
As the rules of what the revenues from emission trading can be used for is strongly restricted by the international, EU-wide and national law, similar rules have to be applied as in the Green Investment Scheme (GIS) and Green Development Scheme, in accordance with the goals of the National Climate Change Strategy. As ruled by the Minister for National Economy in the Ministerial Order 16/2015 (V. 29.) NGM, the scheme can offer funding for the following purposes:
a) research, innovation and demonstration projects in the field of emission reduction and adaptation for the consequences of climate change;
b) energy production from renewable energy sources and the improvement of energy efficiency;
c) support of transition for low emission transport and public transport ;
d) to fund the 50% of the national contribution to the Green Climate Fund;
e) costs of the operation of the scheme.
In 2015, the scheme was focusing on the support of electro-mobility through the Ányos Jedlik Plan.
4.2.1.3 Green Investment Scheme (GIS)
The GIS is aimed to foster green economic development in Hungary by implementing environmental
programs related to energy efficiency and renewable energy sources using revenues from selling the
country’s Kyoto Units.
The continuous functioning of the GIS is assured by funding from the sale of emission units (credits)
under the Kyoto Protocol. Hungary, represented by the Ministry for National Development, has signed
several contracts for the sale of CO2 allocation units (AAUs) since the launch of the quota trade regime.
The basic idea of the Green Investment System is that only projects with direct effects on greenhouse
gas emissions and energy efficiency can be supported. In order to ensure the proper implementation of
the GIS, the emission reduction realized by the funded projects is accountable towards the partners
purchasing the Kyoto units. Monitoring and Implementation Reports of the GIS and its programs are
prepared each year, which verify and quantify the amount of direct greenhouse gas emission reduction
realized through each program. No projects can be implemented from the financial support of GIS, if
the emission reduction and energy efficiency aspects of the projects are not verifiable and quantifiable.
Reduction of CO2 is the main benefit of the GIS Programs. The other benefits include direct
environmental benefits of lower emissions and use of less energy, lower energy costs, heat savings in
district heating, increased renewable heat production and reduced pollution by dust particles. The GIS
Programs are also expected to create new job opportunities and foster green economic development.
Besides the environmental benefits of the reduction of CO2 emissions and fostering the use of renewable
energy sources, the GIS programs also aim to help green economic development and to benefit the
related industries and economic sectors by creating new job opportunities.
The GIS and its programs have been primary focused on increasing energy-efficiency and use of
renewable energy sources in the building energy sector, as well as reducing greenhouse gas emissions.
This is because emissions related to buildings account for 30% of total national CO2 emissions. Over
three-fourths of total quota revenues collected so far have been allocated to the funding of energy
efficient buildings. For this reason, the main emphasis of the previous and current GIS Programs is
energy efficient reconstruction of private apartments and apartment complexes, namely reconstruction
or replacement of old heating systems, use of renewable energy sources, heat insulation of buildings,
replacement of old windows and doors, installations of low-emission biomass-fired sources or efficient
heat pumps, furthermore to support the use of renewable energy sources, as heat pumps or solar
collectors.

UNFCCC 2nd Biennial Report of Hungary
24
The Hungarian GIS was regulated by the Act LX of2007, while detailed aims could be found in the
323/2007. (XII. 11.) Governmental Decree. However, since 2014, the Green Economy Financing
Scheme had been established, in order to replace the GIS and its subprograms. Therefore the legislation
of the GIS had changed and the same Decree is regulating the use of support for both green schemes,
which is the Decree of the MoND 28/2015. (VI.3.). According to the Decree, support from the GIS can
be used for the following purposes:
a) improvement of building energy efficiency;
b) increasing the utilization of renewable energies;
c) improvement of efficiency of district heating systems;
d) promotion of the construction of low‐energy consumption buildings;
e) energy efficient modernization of indoor and outdoor lighting systems;
f) promotion of creating carbon sinks;
g) emission reduction in the transport sector;
h) replacement of old inefficient household appliances and electronic devices with new certified
low energy consumption equipment;
i) other emission reduction purposes.
Besides the above mentioned supports, it is possible to provide interest rate subsidy for applicants of
GIS projects, in order to cover the cost of credits or loans aimed to realize GIS project. The interest rate
subsidy could be up to 100%.
Also, maximum 5% of the GIS revenues can be used for administrative support and monitoring purposes
of the GIS Subprograms.
4.2.1.4 Green Economy Financing Scheme (GEFS)
The Green Economy Financing Scheme (GEFS), financed from AAU and ETS quota revenues, is an
important nationally funded program, which is to replace the Green Investment Scheme (GIS). No new
GIS programs will be started and existing GIS programs will be ended when disbursements will be
finished.
The 1st GEFS Subprogram had been launched in September 2014. Direct and accountable energy
consumption- and emission reduction is the governing idea behind the GEFS subprograms, similarly to
the GIS.
In case of the GEFS, according to Act C of 2015, Article 8 paragraph (3), 50% of the income originated
from CO2 quota revenues is to be spent on greening activities and the other 50% is to support the state’s
budget, instead of all revenues aimed at greening activities as of the GIS. Also the 50% of the revenues,
to be spent on greening activities, is divided equally between the Ministry of Economics and the MoND.
Therefore 25% of the income originated from CO2 quota revenues is to be spent on the implementation
of GEFS subprograms, by the MoND, while the other 25% is spent by the Ministry of Economics for
other programs.
The Annex 1 of the Decree of the MoND, 28/2015. (VI. 3.), regulates the main aims and possible uses
of GEFS Subprograms. According to the regulation, support from the GEFS can be used for reduction
of GHG gases, for the creation of GHG sinks, or for measures aimed to reduce the effects of climate
change in case of international cooperation.
I. On international levels or within international cooperation, GEFS support can be used for the
following purposes:
a) contributions for the Global Energy Efficiency and Renewable Energy Fund;
b) contributions to the European Globalisation Adjustment Fund (EGF), launched at the Poznan
Climate Change Conference (COP 4 and COP/MOP 4);
c) measures to avoid deforestation and help afforestation and reforestation in developing countries,
which have ratified the international agreement on climate change;

UNFCCC 2nd Biennial Report of Hungary
25
d) transfer of technologies and to help adaptation to climate change in developing countries, which
have ratified the international agreement on climate change;
e) safe capture and geological storage of CO2 originated from solid fossil fuel power plants or
industrial activities in developing countries.
II. For developments realized within the European Union, GEFS Supports can be used for the following
purposes:
a) development of energy production from renewable energy sources;
b) measures aimed to help energy efficiency;
c) measures or investments to reduce GHG emissions;
d) capture of CO2 through reforestation;
e) support for the participation in the initiatives of the European Strategic Energy
Technology Plan and the European Technology Platforms;
f) safe capture and geological storage of CO2, originated from solid fossil based power
plants or industrial activities;
g) measures to help the shift to low-GHG-emission transportation methods and to
encourage the use low GHG emission public transportation methods and tools;
h) support for research and development related to energy efficiency and clean
technologies, in case of industries, which need permissions for emitting GHG gases and
mentioned in the GHG Emission Act. (LX of 2007);
i) research and development aimed at the adaptation to climate change and GHG emission
reduction, as well as implementation of demonstration projects;
j) support for the development of new technologies aimed to help the shift to low carbon
economy;
k) financial support for social measures of lower and middle income households to help
their energy efficiency.
III. According to the Article 13/F paragraph (4) of Act LX of 2007 about the implementation of the UN
Framework Convention on Climate Change and its Kyoto Protocol, the international climate finance
commitments of Hungary are to be financed from the revenues of the CO2 quota allowances. Support
can be used for the following:
a) pledges to the Green Climate Fund (GCF);
b) support for participating in the initiatives of the institutions for international climate finance,
such as the Global Green Growth Institute (GGGI) and Climate Technology Centre and
Network (CTCN)
c) support for the realization of Hungarian climate change related developments and investments
in foreign markets.
IV. Also 7% of the GEFS revenues can be used for administrative purposes instead of 5% of the GIS.
4.2.1.5 Environment and Energy Efficiency Programme (EEEOP)
The general aim of the EEEOP is that the economic growth based on high value added production and the rising of employment should be realised along with the protection of human lives and the environment.
The priorities of the EEEOP:
Adaptation to the effects of climate change
Development of municipal sewerage systems and waste water treatment facilities
Developments related to waste management
Developments related to the protection of nature
Energy efficiency improvements, application of renewables
Some of the programmes planned for 2014-2020:
UNFCCC 2nd Biennial Report of Hungary
26
Promoting the generation of green electricity based on distributed energy resources, not linked
buildings in distribution networks
Energy modernisation of buildings through the combination of renewable energy sources
Energy development and renewable conversion of district heating and heat supply systems
Awareness raising programs
4.2.2 Energy
4.2.2.1 Promotion of renewables
The basic objective of promoting the renewables is to reduce GHG emissions, but also to decrease the energy import dependence of the country. As discussed in several points of this document, various policies with the aim of promoting the utilisation of renewable energies are already in place, and others are planned in order to meet the goals of the various strategy documents. The general framework and main components of such policies are set in the NREAP, described in the previous chapter.
Until 1 January 2016 renewable energy producers can apply for subsidies under the framework of the compulsory takeover system. According to the European Commission’s 2014 Guideline on environmental and energetic public subsidies placed the support system on a new basis: producers must sell the produced electricity directly on the market, operational support is available as an addition to the market reference price premium paid, and a competitive bidding process is introduced to win the premium subsidies. Regulations of the Guideline are applicable from 1 January 2016, therefore, a new renewable energy support scheme („METÁR-system”) shall be developed. The legislation required for the new system is expected to be completed in the first half of 2016.
4.2.2.2 “Warmth of Home” Programme
The programme was launched in September 2014 from domestic budgetary resources by the MoND in order to further reduce the households’ energy costs. Under the programme, projects could be submitted targeting the replacement of outdated household machines (refrigerator and washing machine), boilers, doors and windows and complex energy renovation of apartment houses during the years 2014 and 2015. The programme affects more than 4.600 Hungarian households.

UNFCCC 2nd Biennial Report of Hungary
27
Table 9 Sub-programs of the Warmth of Home Programme in 2015
Sub-programmes of the “Warmth of
Home” Programme
Number of households
affected
Estimated CO2-savings
(tons/year)
Replacement of large household appliances (refrigerators)
22445 8795.49
Doors and windows replacement 2217 1961.64
Heating modernization (boilers replacement)
2399 4663.70
Modernization and renovation of apartment houses
13984 20291.67
Replacement of large household appliances (washing machines)
42344 3017.56
Total: 83389 38730.06
4.2.2.3 Extension and enlargement of Paks Nuclear Power Plant
The two main components of the policy are:
the extension of the technical lifetime of the existing nuclear capacities in the Paks facility (already accomplished) and
capacity enlargement of the Paks nuclear plant.
As a result of the lifetime extension the availability of the existing nuclear units will be the following:
Table 10 Lifetime extension
Start of unit’s
operation
End of original
lifetime
500 MW capacity
on-line
End of extended
lifetime
Unit 1 14 Dec. 1982 2012 19 Jul. 2007 2032
Unit 2 26 Aug. 1984 2014 05 Dec. 2008 2034
Unit 3 15 Sep. 1986 2016 13 Nov. 2009 2036
Unit 4 09 Aug. 1987 2017 28 Sep. 2006 2037
In accordance with the National Energy Strategy, it is assumed that two new units of approximately 1,000 MW each will be put into operation by 2030, i.e. the 4 Paks units currently in operation (2,000 MW) and the two new units (2,000 MW) will be operating parallel between 2032 and 2037 (the four current Paks units will be decommissioned by 2037). The National Energy Strategy foresees the availability of the nuclear capacities as follows:
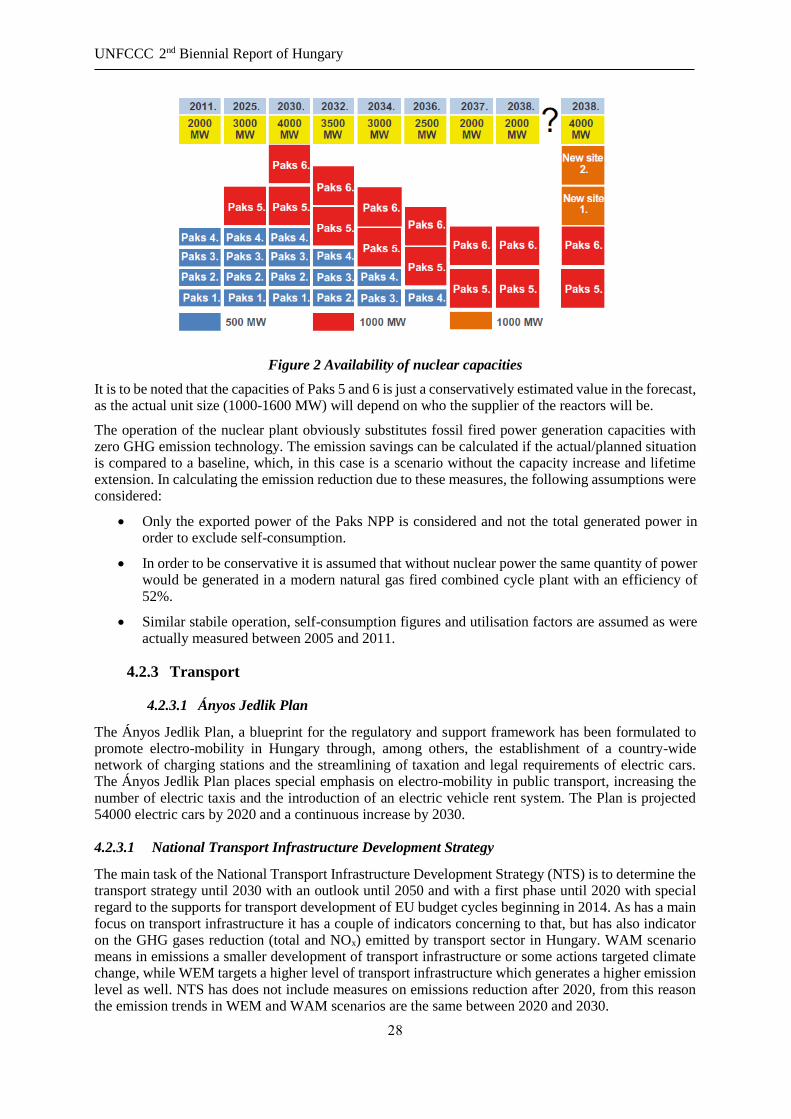
UNFCCC 2nd Biennial Report of Hungary
28
Figure 2 Availability of nuclear capacities
It is to be noted that the capacities of Paks 5 and 6 is just a conservatively estimated value in the forecast, as the actual unit size (1000-1600 MW) will depend on who the supplier of the reactors will be.
The operation of the nuclear plant obviously substitutes fossil fired power generation capacities with zero GHG emission technology. The emission savings can be calculated if the actual/planned situation is compared to a baseline, which, in this case is a scenario without the capacity increase and lifetime extension. In calculating the emission reduction due to these measures, the following assumptions were considered:
Only the exported power of the Paks NPP is considered and not the total generated power in order to exclude self-consumption.
In order to be conservative it is assumed that without nuclear power the same quantity of power would be generated in a modern natural gas fired combined cycle plant with an efficiency of 52%.
Similar stabile operation, self-consumption figures and utilisation factors are assumed as were actually measured between 2005 and 2011.
4.2.3 Transport
4.2.3.1 Ányos Jedlik Plan
The Ányos Jedlik Plan, a blueprint for the regulatory and support framework has been formulated to promote electro-mobility in Hungary through, among others, the establishment of a country-wide network of charging stations and the streamlining of taxation and legal requirements of electric cars. The Ányos Jedlik Plan places special emphasis on electro-mobility in public transport, increasing the number of electric taxis and the introduction of an electric vehicle rent system. The Plan is projected 54000 electric cars by 2020 and a continuous increase by 2030.
4.2.3.1 National Transport Infrastructure Development Strategy
The main task of the National Transport Infrastructure Development Strategy (NTS) is to determine the transport strategy until 2030 with an outlook until 2050 and with a first phase until 2020 with special regard to the supports for transport development of EU budget cycles beginning in 2014. As has a main focus on transport infrastructure it has a couple of indicators concerning to that, but has also indicator on the GHG gases reduction (total and NOx) emitted by transport sector in Hungary. WAM scenario means in emissions a smaller development of transport infrastructure or some actions targeted climate change, while WEM targets a higher level of transport infrastructure which generates a higher emission level as well. NTS has does not include measures on emissions reduction after 2020, from this reason the emission trends in WEM and WAM scenarios are the same between 2020 and 2030.

UNFCCC 2nd Biennial Report of Hungary
29
4.2.3.2 Transport Energy-Efficiency Improving Action Plan
Transport Energy-Efficiency Improving Action Plan purposes is the determination of energetic targets to be enforced in the National Transport Strategy (NTS) and the means of their achievement, or the working out of the short and medium term energy efficiency action plan of transport based on which the tasks formulated in Government Decree 1374/2011. (XI. 8.) on „II. National Energy Action Plan of Hungary until 2016 with an outlook to 2020” will be completed. Regarding the meanwhile implementation of 3rd National Energy Action Plan this strategy will be updated
4.2.3.3 National Intelligent Transport Systems Strategy
The task of the intelligent transport systems (ITS) is to increase the efficiency of the transport system (e.g. capacity exploitation, energy efficiency, transportation safety and security) by integrating information technology. The improved efficiency contributes to maintenance and enhancement of the appropriate level of passenger and freight mobility as well as to the predictable transportation processes. The exploitation of the potential offered by the intelligent transport system is strategically important for a resource-efficiently functioning economy. As a Member of the European Union, Hungary is determined to play an active role in the creation of the Single European Transport Area while responds to the challenges of the coming centuries. The National ITS Strategy is a vital tool in the transportation infrastructure capacity and in the exploitation of opportunities and reserves in the technological development. Concerning climate policy, the aim is to efficiently use our natural, built, social and economic environment resources and cease negative external effects. The strategy is currently under planning; its effects on GHG emissions are not known.
4.2.4 Agriculture, Land use, land-use change and forestry
4.2.4.1 National Forest Programme 2006–2015 / 2015-2030
The National Forest Programme 2006–2015 sets the following strategy objectives: maintaining the current level of forestation but preferably increasing it. Neither the quantity nor the quality and value of the forests must deteriorate. Use of wood in the society, as an environmentally friendly resource should be encouraged. Forest management has to ensure that the increased demands for wood would be met, without endangering sustainability. Knowledge and information on forests shall be increased in the society. The key elements of implementing the strategic goals are the followings:
Protection of forests, of natural processes in the forests. Perseverance of biological and genetic
values. Natural forest management.
Utilisation of forests. The competitiveness of forestry products shall be increased. Utilisation
areas may be widened, with respect to industrial and energy-purpose utilisation of wood.
Development. Increase of forests with respect, however, to biodiversity, landscape, and erosion
protection.
The National Forest Strategy 2015-2030 is currently under planning, but its main goal is to continue the track on reaching goals of 2050 and earlier National Forest Program 2006-2015. Its main goal is to reach at least 27% forest coverage in Hungary in 2050, which creates a need of around yearly 15 thousand ha afforestation. The Strategy is referring to climate change mitigation by promoting forest biomass and protection of forests, through them it directly affects CO2 emission reduction targets.
4.2.4.2 Darányi Ignác Plan – National Rural Strategy 2013-2020
The objective of the Plan is to remove obstacles that hinder farmers and producers through the amendment of legislation and regulations. The first pillar aims at removing obstacles that hinder farmers and producers through the amendment of legislation and regulations. The second plans to reduce bureaucracy through the setting up of customer-friendly offices and by reducing administrative requirements. The third pillar focuses on changing people's way of thinking and on providing training courses. The fourth pillar will support rural areas in Hungary by launching jointly financed European Union and Hungarian tenders for rural development projects. The fifth and final pillar includes the

UNFCCC 2nd Biennial Report of Hungary
30
preparation, launching and running of national programmes, including for example the Farmstead Programme and the Demographic Land Programme.
4.2.4.3 New Nitrate Action Programme
The earlier Government Decision No. 27/2006. (II. 7.) on protection against the nitrate contamination of waters from agricultural sources (Nitrate Decree for short) referred to in the previous report was replaced and partly superseded by Government Decree 171/2013. (V. 29.). The new decree identifies the nitrate sensitive areas, contains an extended list of settlements in these areas, states the general rules of protection against nitrate pollution and prescribes an overall, coherent, nation-wide action plan. The decree also extends some of the earlier deadlines such that for the isolation of manure storages.
4.2.4.4 Agro-environmental and agricultural payments of European Agricultural Fund for
Rural Development (EAFRD) and Common Agricultural Policy (CAP)
The agriculture sector has the specialty that it is mainly driven by one policy, the Common Agricultural Policy (CAP), which determines a common way for all Member States of the European Union. For the period 2014 – 2020, three strategic objectives for rural development in the EU have been set in line with the Europe 2020 Strategy (COM(2010) 2020 final):
fostering the competitiveness of agriculture;
ensuring the sustainable management of natural resources, and climate action; and
achieving a balanced territorial development of rural economies and communities including the
creation and maintenance of employment.
The 2013 reform leaves in place many of the key features of rural development policy from 2007-2013. Regulation (EU) No 1305/2013 on support for rural development by the European Agricultural Fund for Rural Development (EAFRD) foresees that Member States draw up and co-finance multiannual rural development programmes (RDPs), at national or regional level. These programmes have to meet the three strategic objectives for 2014 – 2020, including sustainability and climate action.
The Common Agricultural Policy (CAP) has identified three priority areas for action to protect and enhance the EU's rural heritage:
Biodiversity and the preservation and development of 'natural' farming and forestry systems,
and traditional agricultural landscapes;
water management and use;
dealing with climate change.
The CAP ensures that its rules are compatible with environmental requirements and that CAP measures promote the development of agricultural practices preserving the environment and safeguarding the countryside. Farmers are encouraged to continue playing a positive role in the maintenance of the countryside and the environment. This is achieved by targeting aid at rural development measures promoting environmentally sustainable farming practices, like agri-environment schemes; and enhancing compliance with environmental laws by sanctioning the non-respect for these laws by farmers through a reduction in support payments from the CAP.
4.2.4.5 Hungary's Rural Development Programme for 2014-2020
RDP of Hungary was formally adopted by the European Commission on 10 August 2015, outlining the Hungarian priorities for using the EUR 4.2 billion of public money that is available for the 7-year period 2014-2020 (EUR 3.4 billion from the EU budget and EUR 740 million of national co-funding). Agriculture and forestry sectors are integral part of the rural development; support for sustainable and climate-friendly land use should encompass forest area development and sustainable management of forests. The Rural Development Programme (RDP) currently has no direct actions linked to LULUCF sector.

UNFCCC 2nd Biennial Report of Hungary
31
Hungary's RDP puts particular emphasis on actions related to restoring, preserving and enhancing ecosystems, promoting social inclusion, poverty reduction and economic development in rural areas and promoting food chain organisations and risk management in agriculture. Provisions on measures for manure manipulation, processing in enteric fermentation and new animal feeding policy, efficient use and appropriate timing of nitrogen inputs from mineral fertilizers. Almost 538 000 ha agricultural land is expected to come under management contracts supporting biodiversity, better water management and soil management. In addition, 132 000 ha of forests will come under management contracts mainly for protecting biodiversity. Altogether 2 600 investment projects will receive support to increase energy efficiency in the agricultural and food processing sector.
The objective of the measures regarding forestry is to create and ensure the ecological basis of sustainable forest management, contributing to the maintenance and increase of biodiversity, as well as to the protection of waters and soil. The aim is the use of forest management practice most adapting to the land conditions in order to enforce the multi-purpose functions of the forests simultaneously, the propagation of the environmentally aware forest management practice. Beside these the aim is to promote the establishment of rural workplaces and employment, to introduce forest management methods ensuring the balance of the ecological-economic conditions of sustainability.
4.2.5 Waste
4.2.5.1 National Waste Law
In the focused period adopted, the basis of Hungary’s waste management policy is –– the Act on Waste (Act No. CLXXXV in 2012) and its implementing regulations. This Act implements the Waste Framework Directive (2008/98/EC) of the European Union and it entered into force on 1 January, 2013. The Act contains the following targets – partly declared already in the National Environmental
Protection Program 2009‐2014:
reduction of biodegradable residual wastes landfilled under a maximum 820 thousand tons by
2016
preparation for reuse and recycling of 50% of papers, glass, metals and plastic by 2020
preparation for reuse and recycling of 70% of construction and demolition wastes by 2020.
To achieve these goals, the following measurements were taken:
introduction of landfill tax, yearly decreasing till 2016 (as shown in Table 4.26.)
compulsory door to door separate household waste collection for household paper, plastics and
metal wastes by January 1st , 2015
prescription of National Waste Prevention Plan
furthermore the Act declares principles of waste treatment:
o waste should be through operations recovered providing the best overall environmental
outcome in respect of the waste to be recovered
o waste incinerators or co‐incinerators shall be permitted where they are related to
produce electricity, heat energy, cement, brick, or construction tile or ceramics
o in-waste incinerators or co‐incinerators only non‐recyclable wastes should be
incinerated or co‐incinerated
o hazardous waste can be burned only in hazardous waste incinerators.
On the operative way of implementing EU‐waste management – especially recycling – targets, basic
steps have been the EU Cohesion Fund co‐financed establishment of regional waste management systems. These projects contain elements of the following instructions:
separate collection of household biowaste, packaging wastes and paper – partly door to door;
establishment of waste yards for hazardous household wastes, biowaste, waste electric and
electronic equipment, household construction wastes and separate collected packaging waste

UNFCCC 2nd Biennial Report of Hungary
32
household composting
transfer stations for residual waste
facilities for sorting, separation and press to balls
recycling/composting separate collected waste
mechanical‐biological treatment of household wastes
refuse‐derived fuel production, co‐incineration in cement factories
post‐collection waste separation for recycling
closing and recultivation of former used unmanaged waste dumps
building new, fully managed and isolated landfills
landfill gas collection and energy recovery.
Through the diversion of household biowastes, packaging wastes and paper from landfilling and the increased optimization of transport demands, these projects have been the main influence for greenhouse gas emissions changes coming from waste management in the focused period. In this time and the years before there was ca. 10% yearly decrease in the landfilled household waste compared to the previous period. Only the setting up of door to door separate collection for household paper, plastic and metal wastes in Budapest diverts ca. 50 thousand tons of waste per year in a longer period – with a biodegradable part of about 30%.
4.2.5.2 National Waste Management Plan (2014-2020)
The National Waste Management Plan (hereinafter referred to as NWMP) contains the main waste management objectives of the 2014-2020 period. The NWMP has been approved by Government Resolution No. 2055/2013 (XII. 31.). The NWMP defines the general and specific actions for each waste flow and, in addition to the objectives, also identifies the areas of intervention in waste management, the future tasks, measures and the funds required for their implementation. The targets of NWMP are set in accordance with the EU waste targets. Sustainable development is one of the basic elements of the NWMP and the main principle is to follow the waste hierarchy. Waste legislation and policy of the EU Member States shall apply the waste hierarchy as a priority: prevention, preparing for re-use, recycling, other recovery, disposal.
The NWMP lists the activities in order to focus on the achievement of the overall objectives:
- Increase recovery and recycling rates
- Reduce waste
- Decrease landfilling
- Design and develop separate collection (the necessary infrastructure must be established for all the households)
- Separate reusable components of waste products to enable preparation for reuse
The NWMP states that the role of the State and municipality in public service has to be strengthened. The NWMP contains the National Prevention Programme (hereinafter referred to as NPP), which helps reduce the amount of waste.
The NPP covers the sectors Agriculture, Construction and infrastructures, Manufacturing, Sale, retail, transport, Households and Public services. The waste types are covered Food/organic, C&D waste, Hazardous waste, Household/municipal waste, Packaging waste, WEEE/batteries and other.
The NPP defines the intervention areas in five sets of measures (prevention of construction and demolition waste generation; reuse; green public procurement; environmentally friendly production and business operation; raising awareness) that need to be addressed as priorities in the 2014-2020 period.
4.2.5.3 National Implementation Programme on Waste Water Collection and Treatment
National Implementation Programme on Waste Water Collection and Treatment fulfills the requirements of the 91/271/EEC Directive and it includes the data of waste water agglomerations above 2000 P.E in Hungary.

UNFCCC 2nd Biennial Report of Hungary
33
The connection rate in Hungary of the reference date 31December, 2013 was 75%.
The ratio of households that were not connected to an accessible sewer was 6,9% in 2013.
In 2013, 100% of waste water collected with public utility sewage systems was treated at least biological, of which 0.2% was only mechanically treatment and 99.8% was treated biological treatment of which 77% was also treated with tertial treatment.
According to 2012 and 2015 (planned) the number of agglomerations and the wastewater load are the following:
Table 11 The number of agglomerations and the wastewater load in 2012
Agglomerations
limits
Number of
agglomerations
Total wastewater load
31st December 2012
(Thousand PE)
2.000-10.000 P.E 386 1594.1
10.000-15.000 P.E 60 729.0
15.000-150.000 P.E 110 4153.3
Above 150.000 P.E 10 4291.3
Total: 566 10767.7
Table 12 The number of agglomerations and wastewater load in 2015 (planned)
Agglomeration
limits
Number of
agglomerations
Total wastewater load
31st December 2015
Planned
(Thousand PE)
2.000-10.000 PE 394 1725.2
10.000-15.000 PE 68 782.0
15.000-150.000 PE 125 4621.8
Above 150.000 PE 10 4555.9
Total: 597 11684.9
Sewage sludge:
Due to the Gov. Degree 25/2002. (II.27.) about the National Implementation Programme on Waste Water Collection and Treatment 162,989 t / year of sludge generated according to reference date 31st December 2012 with 55% of agriculture - 4.1% of other recovery (e.g using of treated sludge in areas removed from tillage, natural landscape reclamation or for areas for purification), 14.7% placed in landfills, 4,1% incinerated, 22.1% is placed in other type of disposal.
The main statements of the Sewage Sludge Strategy:
The energetic utilization of sewage sludge is in early stage in Hungary. A significant incineration capacity-development will be needed in a long term. The amount of sewage sludge is being increased to 237,000 ton DS/year in 2023, and then to 250,000 ton DS in 2027. In case of the agricultural use, the estimated energetic use is growing, sludge incineration will be expected 49,000 ton DS/year by 2023 then 95,000 ton DS/year by 2027. The development of anaerobic digestion with the increase of energy recovery, the amount of the greenhouse gases emerging in the atmosphere from sewage sludge is expected to decrease. The application of sewage sludge digestion and biogas utilization on plants with less PE capacity is regarded as a trend in the near future. On the affected sewage treatment plants will

UNFCCC 2nd Biennial Report of Hungary
34
create about 980,000 PE new digesting capacity, 650,000 PE new sludge-dewatering capacity, 250,000 PE sludge composting capacity and 120,000 PE sludge drying capacity for the proposed result of the development in the Strategy by 2023.
4.2.5.4 Jenő Kvassay Plan
The “Jenő Kvassay Plan” – National Water Strategy – includes the implementation of the Sewage Sludge Treatment and Recovery Programme, sludge treatment options and the development of the regional advanced sewage sludge processing.
5 Projections
The projections presented herewith are developed for the years 2015, 2020 and 2025, 2030. The covered GHG gases are CO2, CH4, N2O, HFCs, PFCs and SF6. The latest available data from Hungary’s National Inventory Report 2015 was used as the basis of the projections. The same global warming potentials were used as in the inventory report.
Throughout the development of the projections the impacts of EU and national regulations, specific domestic policies and EU and national level targets were considered (e.g. Renewable Energy Directive, EU ETS). The projections were not performed with a comprehensive model, different methods were used in every sector. The used methods and assumptions are described in detail for each sector. Emissions in each section are presented in kt CO2 equivalent. In the energy sector in most cases future emissions were calculated using the current fuel mix, thus in this cases emissions are most likely overestimated.
Currently Hungary’s emissions of greenhouse gases are at a low level, mainly due to the decline of the industrial production after 2008. A potential recovery of the industrial production will likely result in the increase of process emissions. The largest decrease is expected in emissions from fuel use in buildings and HFC gases. Cumulatively, according to the WEM scenario, emissions (measured in CO2 equivalents, excluding LULUCF) are going to increase slightly until 2020 (59953.8 kt) compared to the 2013 levels (53990.3 kt), and then decreasing slightly until 2030 (56590.2 kt). According to the WAM scenario, emissions are going to decrease slightly both until 2020 (54595.6 kt) and until 2030 (50024 kt).
Table 13 Total emissions in the WEM and WAM scenarios (kt CO2 eq)
2013 2015 2020 2025 2030
With existing measures 57428.5 58597 59922.5 60559.9 59368
WEM including LULUCF 53990.3 55908.8 57112.5 57764.8 56580
With additional measures 57428.5 58109.5 57920.3 57627.7 54586.4
WAM including LULUCF 53990.3 54821.3 54564.2 54203.7 51094.8

UNFCCC 2nd Biennial Report of Hungary
35
14. Table Main assumptions 2014-2020
2014 2015 2016 2017 2018 2019 2020
GDP growth (%)10
3,67 2,80 2,45 3,07 2,89 2,95 2,67
Population (%)11 -0,32 -0,22 -1,18 -0,51 -0,51 -0,51 -0,51
15. Table Main assumptions 2021-2030
2021 2022 2023 2024 2025 2026 2027 2028 2029 2030
2,60 2,54 2,48 2,43 2,38 2,34 2,31 2,27 2,24 2,21
-0,51 -0,51 -0,53 -0,53 -0,53 -0,53 -0,54 -0,54 -0,54 -0,55
5.1 Energy
5.1.1 Fuel Combustion
5.1.1.1 Energy Industries
5.1.1.1.1 Public electricity and heat production
Emissions from electricity and heat production gave 22% of all emissions in Hungary in 2013.
To determine the amount of fuel combusted to produce electricity and heat first the demand for electricity and district heating was determined. Demand was determined by using projected amount of fuel in the manufacturing industries, transportation and other sectors. It was assumed that the weight of district heating won’t change. In the WEM and WAM scenarios 1.5% and 1% of growth in electricity demand was assumed respectively. Network losses has been decreasing constantly, we expect that this trend will continue. To determine the weight of each fuel type in the production of electricity, scenarios from the National Energy Strategy 2030 were used. The WEM scenario includes construction of new nuclear units at the Paks site and the extension of the renewable utilization path set out in the National Renewable Action Plan. WAM scenario includes the same assumption on nuclear power, but calculates with a more ambitious renewable utilization path.
10 2014,2015: actual data; 2016-2019: based on 2015 spring Convergence Programme; 2020-2030: technical projections;
source: Minsitry of National Economy
11 Source: Hungarian Statistical Office
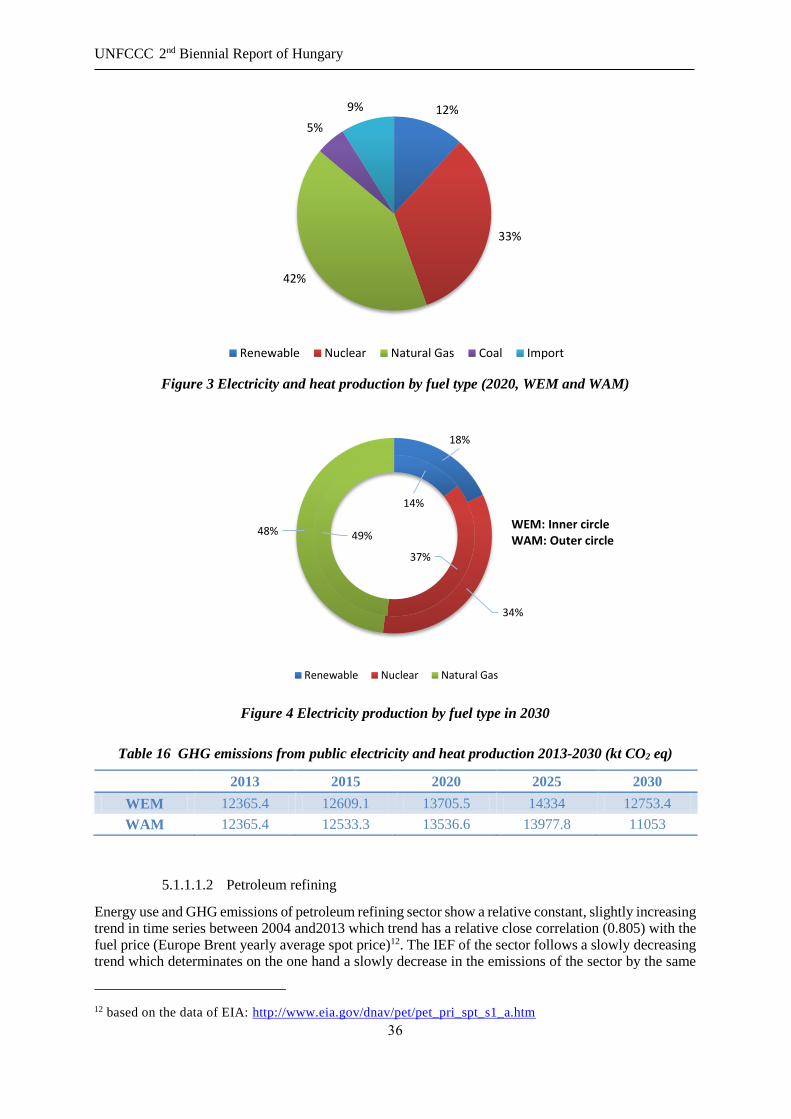
UNFCCC 2nd Biennial Report of Hungary
36
Figure 3 Electricity and heat production by fuel type (2020, WEM and WAM)
Figure 4 Electricity production by fuel type in 2030
Table 16 GHG emissions from public electricity and heat production 2013-2030 (kt CO2 eq)
2013 2015 2020 2025 2030
WEM 12365.4 12609.1 13705.5 14334 12753.4
WAM 12365.4 12533.3 13536.6 13977.8 11053
5.1.1.1.2 Petroleum refining
Energy use and GHG emissions of petroleum refining sector show a relative constant, slightly increasing trend in time series between 2004 and2013 which trend has a relative close correlation (0.805) with the fuel price (Europe Brent yearly average spot price)12. The IEF of the sector follows a slowly decreasing trend which determinates on the one hand a slowly decrease in the emissions of the sector by the same
12 based on the data of EIA: http://www.eia.gov/dnav/pet/pet_pri_spt_s1_a.htm
12%
33%
42%
5%
9%
Renewable Nuclear Natural Gas Coal Import
14%
37%
49%
18%
34%
48%WEM: Inner circleWAM: Outer circle
Renewable Nuclear Natural Gas

UNFCCC 2nd Biennial Report of Hungary
37
energy use, while a slightly increasing trend of energy needs led by the increasing fuel price (from 2015) can be projected in the future on the other hand. It is also estimated to have a yearly 0.1% increase in the energy efficiency of the sector. Regarding the described trends of the petroleum refining sector, the energy needs of the sector will follow a slightly decreasing trend (by -0.78%/a in average) while the GHG emissions will decrease by -0.82% annually in average.
Figure 5 Fuel combusted in the petroleum refining sector (2005-2030)
Figure 6 GHG emissions in the petroleum refining sector (2005-2030)
Table 17 GHG emissions in the petroleum refining sector 2013-2030(kt CO2 eq)
2013 2015 2020 2025 2030
WEM 1 314.0 1 277.1 1 259.0 1 214.9 1 168.7
0
5,000
10,000
15,000
20,000
25,000
2005 2010 2015 2,020 2025 2,030
FUEL
CO
MB
UST
ED (
TJ)
0
200
400
600
800
1,000
1,200
1,400
1,600
2005 2010 2015 2,020 2025 2,030
GH
G E
MIS
SIO
NS
(KT
CO
2-E
Q)

UNFCCC 2nd Biennial Report of Hungary
38
5.1.1.1.3 Manufacture of solid fuels and other energy industries
Based on the national GHG inventory data the energy use and GHG emissions of manufacture of solid fuels and other energy industries sector showed a relative constant, slowly increasing trend in time series between 2003 and2013. The IEF of the sector follows a decreasing trend which is predominantly caused by increase energy use generated from biomass (which has no emission effect). On the one hand, an increase of annually 0.5% in average can be projected in the energy use of the sector which creates barely any increase in GHG emissions driven by the increasing biomass use of the sector.
Figure 7 Fuel combusted in the manufacture of solid fuels and other energy industries sector
(2005-2030)
Figure 8 GHG emissions in the manufacture of solid fuels and other energy industries sector
(2005-2030)
Table 18 GHG emissions in the manufacture of solid fuels and other energy industries sector 2013-
2030 (kt CO2 eq)
0
1,000
2,000
3,000
4,000
5,000
6,000
7,000
8,000
9,000
10,000
2005 2010 2015 2020 2025 2030
FUEL
CO
MB
UST
ED (
TJ)
0
50
100
150
200
250
300
350
400
450
500
2005 2010 2015 2020 2025 2030
GH
G E
MIS
SIO
NS
(KT
CO
2-E
Q)
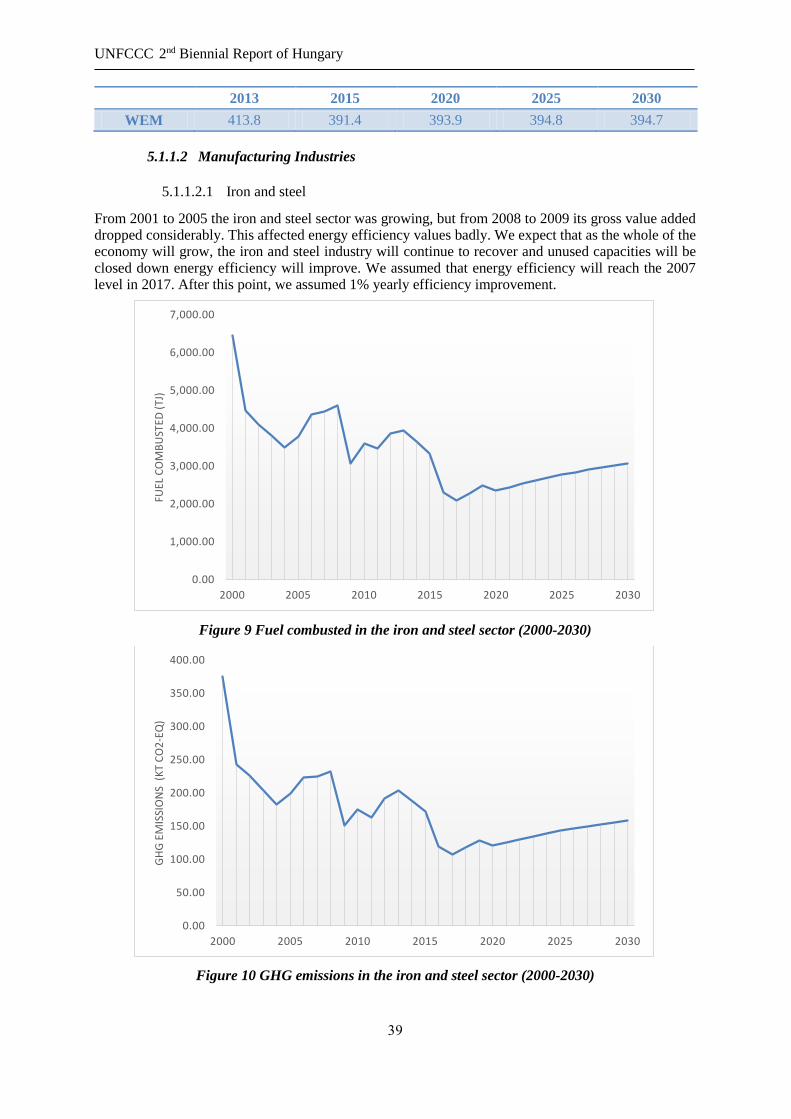
UNFCCC 2nd Biennial Report of Hungary
39
2013 2015 2020 2025 2030
WEM 413.8 391.4 393.9 394.8 394.7
5.1.1.2 Manufacturing Industries
5.1.1.2.1 Iron and steel
From 2001 to 2005 the iron and steel sector was growing, but from 2008 to 2009 its gross value added dropped considerably. This affected energy efficiency values badly. We expect that as the whole of the economy will grow, the iron and steel industry will continue to recover and unused capacities will be closed down energy efficiency will improve. We assumed that energy efficiency will reach the 2007 level in 2017. After this point, we assumed 1% yearly efficiency improvement.
Figure 9 Fuel combusted in the iron and steel sector (2000-2030)
Figure 10 GHG emissions in the iron and steel sector (2000-2030)
0.00
1,000.00
2,000.00
3,000.00
4,000.00
5,000.00
6,000.00
7,000.00
2000 2005 2010 2015 2020 2025 2030
FUEL
CO
MB
UST
ED (
TJ)
0.00
50.00
100.00
150.00
200.00
250.00
300.00
350.00
400.00
2000 2005 2010 2015 2020 2025 2030
GH
G E
MIS
SIO
NS
(K
T C
O2
-EQ
)

UNFCCC 2nd Biennial Report of Hungary
40
Table 19 GHG emissions in the iron and steel sector 2013-2030(kt CO2 eq)
2013 2015 2020 2025 2030
WEM 202.9 171.5 121.4 142.9 158.7
5.1.1.2.2 Non-ferrous metals
Gross value added of the sector was projected using gross value added of the whole manufacturing industry. The sector’s GVA went through a sharp drop in 2009 that affected energy efficiency negatively (Fuel combusted/GVA) and it is yet to recover. We assume that energy efficiency ratio will improve sharply in the coming years and when it reaches its pre-crisis level, it will improve by 1% yearly. Emission factors were kept constant.
Figure 11 Fuel combusted in the non-ferrous metals industry (2000-2030)
Figure 12 GHG emissions in the non-ferrous metals industry
0
1000
2000
3000
4000
5000
6000
2000 2005 2010 2015 2020 2025 2030
FUEL
CO
MB
UST
ED (
TJ)
0
50
100
150
200
250
300
2000 2005 2010 2015 2020 2025 2030
GH
G E
MIS
SIO
NS
(KT
CO
2-E
Q)

UNFCCC 2nd Biennial Report of Hungary
41
Table 20 GHG emissions in the non-ferrous metals industry 2013-2030(kt CO2 eq)
2013 2015 2020 2025 2030
WEM 172.2 169.2 111.6 131.2 149.3
5.1.1.2.3 Chemicals
From 2001, chemicals industry in Hungary had been declining until 2007 when it experienced a short upturn. From 2008, its GVA fell by a great amount and kept falling until 2013, but it started to recover in 2014. We assume that the sector will continue to recover in the following years, but when it reaches its pre-crisis level, the former declining trend will continue. An additional 1% energy efficiency improvement rate has been applied. 2013 emission factors were kept.
Figure 13 Fuel combusted in the chemicals sector (2000-2030)
Figure 14 GHG emissions in the chemicals sector (2000-2030)
0
2000
4000
6000
8000
10000
12000
2000 2005 2010 2015 2020 2025 2030
FUEL
CO
MB
UST
ED (
TJ)
0
100
200
300
400
500
600
2000 2005 2010 2015 2020 2025 2030
GH
G E
MIS
SIO
NS
(KT
CO
2-E
Q)
AXIS TITLE

UNFCCC 2nd Biennial Report of Hungary
42
Table 21 GHG emissions in the chemicals industry 2013-2030(kt CO2 eq)
2013 2015 2020 2025 2030
WEM 557.3 237.2 251.3 242.9 234.6
5.1.1.2.4 Pulp, paper and print
The pulp, paper and print industry had been growing until 2007, but experienced two large drops in 2008 and 2011-2012. We expect that as the whole of economy will grow, the pulp, paper and print industry will recover. Expected industrial growth was used to project the future gross value added of the sector. A 1 % yearly energy efficiency improvement rate was assumed. 2013 emission factors were used for the future years.
Figure 15 Fuel combusted in the pulp paper and print industry (2000-2030)
Figure 16 GHG emissions of the pulp, paper and print industry (2000-2030)
0.00
1,000.00
2,000.00
3,000.00
4,000.00
5,000.00
6,000.00
2000 2005 2010 2015 2020 2025 2030
FUEL
CO
MB
UST
ED (
TJ)
0.00
50.00
100.00
150.00
200.00
250.00
300.00
2000 2005 2010 2015 2020 2025 2030
GH
G E
MIS
SIO
NS
(KT
CO
2-E
Q)

UNFCCC 2nd Biennial Report of Hungary
43
Table 22 GHG emissions in the pulp paper and print industries 2013-2030(kt CO2 eq)
2013 2015 2020 2025 2030
WEM 193.1 223.3 236.4 246.1 254.8
5.1.1.2.5 Food processing, beverages and tobacco
The sector has been experiencing a decreasing trend since 2002. Along with that the amount of fuels combusted in the sector has also been decreasing. We expect that this trend will continue in a slowing manner. Emission efficiency has been fluctuating in the sector, but showed an almost stagnating tendency. We expect mild improvements, but most of the emission reduction will come from the use of less energy. CH4 and NO2 emissions are insignificant and were kept on their 2013 levels.
Figure 17 Fuel combusted in the food processing sector (2000-2030)
Figure 18 Projected GHG emissions in the food processing, beverages and tobacco sector (2000-
2030)
0.00
2,000.00
4,000.00
6,000.00
8,000.00
10,000.00
12,000.00
14,000.00
16,000.00
18,000.00
20,000.00
2000 2005 2010 2015 2020 2025 2030
FUEL
CO
MB
UST
ED (
TJ)
0
200
400
600
800
1000
1200
2000 2005 2010 2015 2020 2025 2030
GH
G E
MIS
SIO
NS
(KT
CO
2-E
Q)
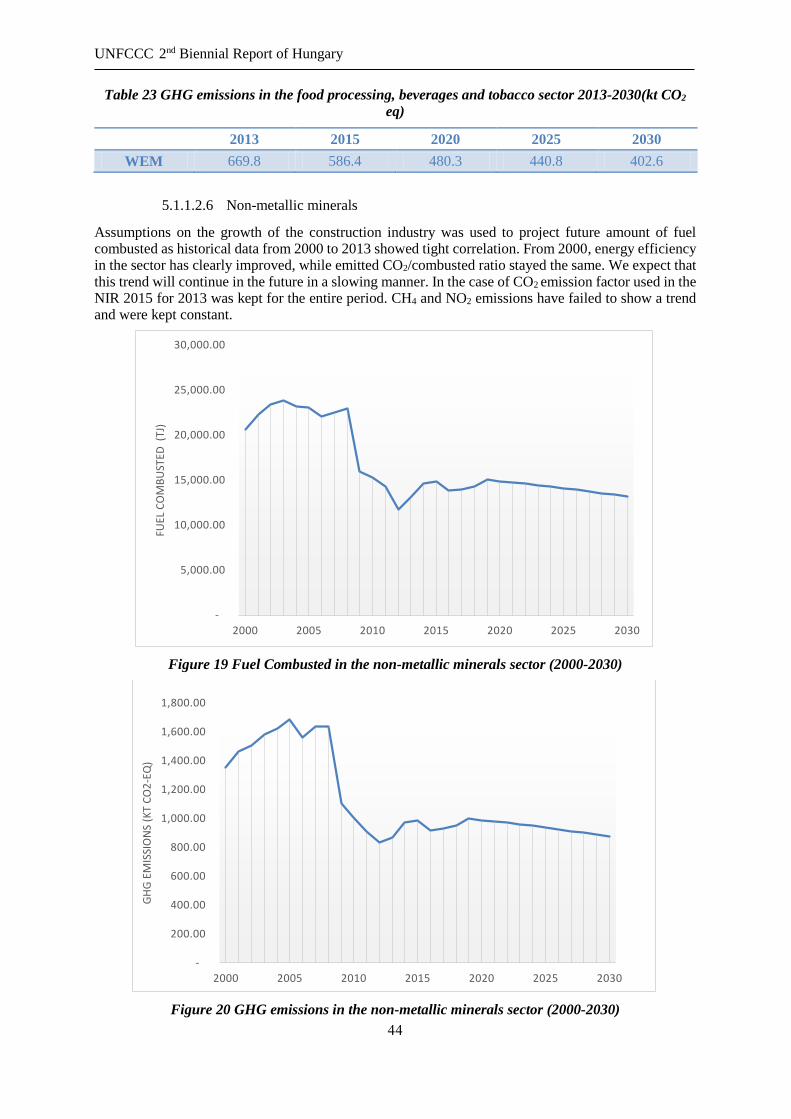
UNFCCC 2nd Biennial Report of Hungary
44
Table 23 GHG emissions in the food processing, beverages and tobacco sector 2013-2030(kt CO2
eq)
2013 2015 2020 2025 2030
WEM 669.8 586.4 480.3 440.8 402.6
5.1.1.2.6 Non-metallic minerals
Assumptions on the growth of the construction industry was used to project future amount of fuel combusted as historical data from 2000 to 2013 showed tight correlation. From 2000, energy efficiency in the sector has clearly improved, while emitted CO2/combusted ratio stayed the same. We expect that this trend will continue in the future in a slowing manner. In the case of CO2 emission factor used in the NIR 2015 for 2013 was kept for the entire period. CH4 and NO2 emissions have failed to show a trend and were kept constant.
Figure 19 Fuel Combusted in the non-metallic minerals sector (2000-2030)
Figure 20 GHG emissions in the non-metallic minerals sector (2000-2030)
-
5,000.00
10,000.00
15,000.00
20,000.00
25,000.00
30,000.00
2000 2005 2010 2015 2020 2025 2030
FUEL
CO
MB
UST
ED (
TJ)
-
200.00
400.00
600.00
800.00
1,000.00
1,200.00
1,400.00
1,600.00
1,800.00
2000 2005 2010 2015 2020 2025 2030
GH
G E
MIS
SIO
NS
(KT
CO
2-E
Q)

UNFCCC 2nd Biennial Report of Hungary
45
Table 24 GHG emissions in the non-metallic minerals sector 2013-2030(kt CO2 eq)
2013 2015 2020 2025 2030
WEM 870.9 982.9 989.2 937.0 873.9
5.1.1.2.7 Other
For projecting both the amount of fuel combusted by off-road vehicles and stationary combustion gross value added of the construction sector was used. Emission factors were kept constant.
Figure 21 Fuel combusted in other industrial sectors (2000-2030)
Figure 22 GHG emissions in other industrial sectors (2000-2030)
Table 25 GHG emissions in other industrial sectors 2013-2030(kt CO2 eq)
0
5000
10000
15000
20000
25000
30000
35000
2000 2005 2010 2015 2020 2025 2030
0
200
400
600
800
1000
1200
1400
1600
1800
2000
2000 2005 2010 2015 2020 2025 2030
GH
G E
MIS
SIO
NS
(KT
CO
2-E
Q)

UNFCCC 2nd Biennial Report of Hungary
46
2013 2015 2020 2025 2030
WEM 1 650.5 1 439.6 1 613.8 1 740.2 1 859.0
5.1.1.3 Other sectors
5.1.1.3.1 Commercial Institutional
Examining the historical data on energy consumption of the sector we couldn’t identify any trends on the activity of the sector, thus when projecting energy use in the sector we only applied policies and measures as a factor that result in reduction.
According to the survey made in in the framework of Hungary’s National Building Energy Efficiency Strategy, the average primary energy use of public building is Hungary is 219 kwh/m2a and through refurbishments in line with the regulations of the Energy Performance of Buildings Directive 55% of this can be saved for buildings refurbished after 2015, 63% for buildings refurbished after 2019. Newly built building shall comply with the requirements of this directive from the respective year
For the WEM scenario we made the conservative assumption that 1% of the total floor area of the sector is refurbished, and 0.5 % of the stock is built newly and also 0.5% decommissioned every year. For the WAM scenario we assumed that 2% of the total floor area is refurbished every year while 1% of the stock is built newly and 1% is decommissioned every year.
Figure 23 Projected fuel combusted in the commercial/institutional sector (2013-2030)
0.00
10,000.00
20,000.00
30,000.00
40,000.00
50,000.00
60,000.00
70,000.00
80,000.00
90,000.00
100,000.00
2015 2020 2025 2030
FUEL
CO
MB
UST
ED (
TJ)
WEM WAM

UNFCCC 2nd Biennial Report of Hungary
47
Figure 23 Projected GHG emissions in the commercial/institutional sector (2013-2030)
Table 26 GHG emissions in the commercial/institutional sector 2013-2030(kt CO2 eq)
2013 2015 2020 2025 2030
WEM 3 456.6 3 380.6 3 198.6 3 026.9 2 864.1
WAM 3 456.6 3 343.5 3 076.6 2 831 2 605.4
5.1.1.3.2 Residential
GHG projections for the residential sector were made according to the following steps:
1. building stock modelling (annual stock change) 2. application of retrofit assumptions 3. application of policies and measures 4. application of GHG emission factors
The stock description was taken from the National Building Energy Strategy. It consists of 15 types of buildings that are the most characteristic in Hungary, plus 2 building types that is envisaged to be characteristic in the future. The building stock consists of family houses and multi-apartment buildings. The other main characteristics of the different types are the number of flats contained in the building, the walls, and the year of construction.
The main statistical characteristics of the 15 currently existing building types are summarized in the following table.
0
500
1000
1500
2000
2500
3000
3500
4000
2015 2020 2025 2030
GH
G E
MIS
SIO
NS
(KT
CO
2-E
Q)
WEM WAM

UNFCCC 2nd Biennial Report of Hungary
48
Table 27 The main statistical data of residential building types13
Building type
Year of
constructi
on
Walls
Floor
area
(m2)
Number
of
buildings
Numbe
r of
apartm
ents
Propor
tion
(%)
Total floor
area (m2)
Floor
area/buildi
ng (m2)
Number of
apartments/
building
Family houses
below 80 m2 -1945
below 80 m2
274097 275559 6.3 15918875 58 1.0
Family houses
above 80 m2 -1945
80 m2
or more
272150 310990 7.1 29610378 109 1.1
Family houses
below 80 m2 1946-1980
below 80 m2
422421 423211 9.7 25746455 61 1.0
Family houses
above 80 m2 1946-1980
80 m2 or
more
807792 844137 19.3 83997263 104 1.0
Family houses 1981-1990 379810 387822 8.9 39914396 105 1.0
Family houses 1991-2000 213527 219188 5.0 23667465 111 1.0
Family or
terraced
houses (1 to 3
apartments)
After 2001 215755 227648 5.2 24466147 113 1.1
multi-
apartment
buildings (4 to
9 apartments)
-2000 46843 279143 6.4 17471243 373 6.0
multi-
apartment
buildings (4 to
9 apartments)
After 2001 7763 43249 1.0 2929898 377 5.6
multi-
apartment
buildings (10
or more
apartments)
-1945 10226 242287 5.6 14066410 1376 23.7
multi-
apartment
buildings (10
or more
apartments)
1946-2000 brick,
other 12596 191179 4.4 10260214 815 15.2
multi-
apartment
buildings (10
or more
apartments)
mid-size
or large blocks,
cast
concrete
8345 185256 4.2 11346937 1360 22.2
multi-
apartment
buildings (10
or more
apartments)
1946-1980 panels 14881 330094 7.6 16174606 1087 22.2
multi-
apartment
buildings (10
or more
apartments)
1981- panels 7271 187428 4.3 9877417 1358 25.7
multi-
apartment
buildings (10+)
After 2001 8706 216563 5.0 11392046 1309 24.9
13 A typology of buildings for modelling the energy performance of the domestic residential building stock
(Study for the National Building Energy Performance Strategy)
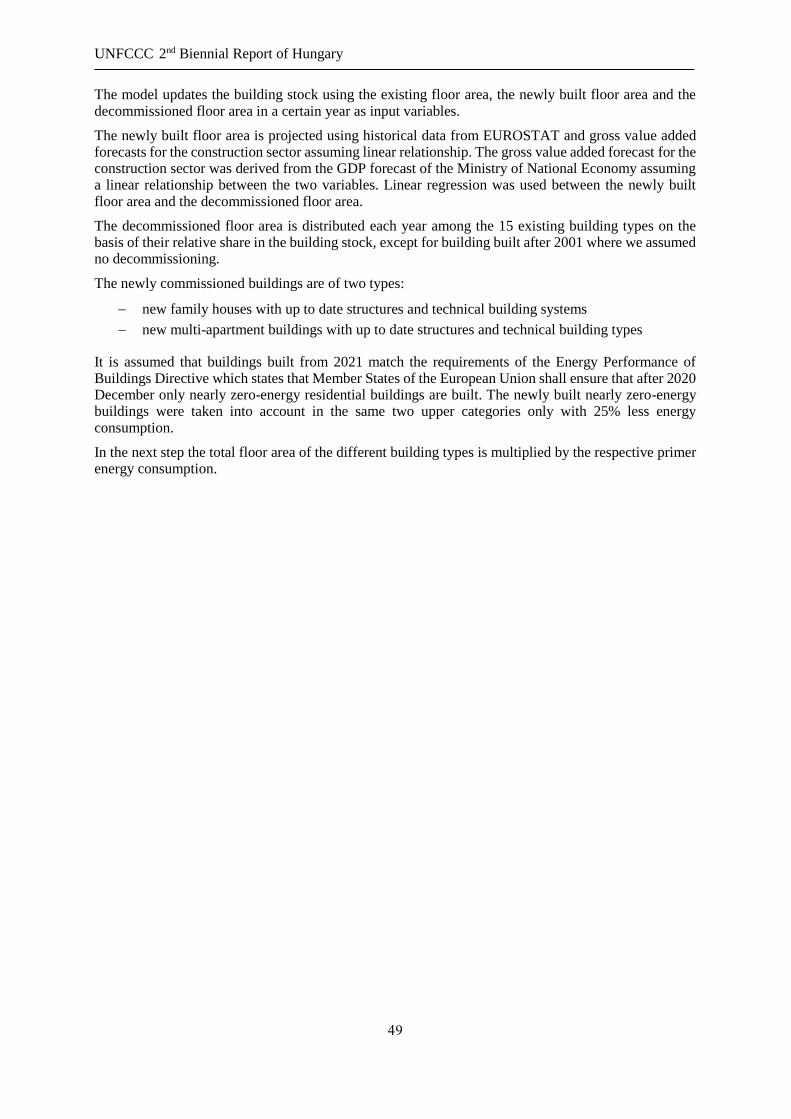
UNFCCC 2nd Biennial Report of Hungary
49
The model updates the building stock using the existing floor area, the newly built floor area and the decommissioned floor area in a certain year as input variables.
The newly built floor area is projected using historical data from EUROSTAT and gross value added forecasts for the construction sector assuming linear relationship. The gross value added forecast for the construction sector was derived from the GDP forecast of the Ministry of National Economy assuming a linear relationship between the two variables. Linear regression was used between the newly built floor area and the decommissioned floor area.
The decommissioned floor area is distributed each year among the 15 existing building types on the basis of their relative share in the building stock, except for building built after 2001 where we assumed no decommissioning.
The newly commissioned buildings are of two types:
new family houses with up to date structures and technical building systems
new multi-apartment buildings with up to date structures and technical building types
It is assumed that buildings built from 2021 match the requirements of the Energy Performance of Buildings Directive which states that Member States of the European Union shall ensure that after 2020 December only nearly zero-energy residential buildings are built. The newly built nearly zero-energy buildings were taken into account in the same two upper categories only with 25% less energy consumption.
In the next step the total floor area of the different building types is multiplied by the respective primer energy consumption.

UNFCCC 2nd Biennial Report of Hungary
50
Table 28 Table Primary energy consumption in current state and after TNM refurbishment14
No. Building type Year of
construction Walls
Primary energy
consumption in
current state
(kWh/m2a)
Primary energy
consumption after
cost-optimal
renovation
(kWh/m2a)
Type 1 family houses below 80 m2 -1945 551 140
Type 2 family houses above 80 m2 -1945 408 128
Type 3 family houses below 80 m2 1946-1980 517 139
Type 4 family houses above 80 m2 1946-1980 405 135
Type 5 family houses 1981-1990 336 109
Type 6 family houses 1991-2000 227 114
Type 7 family or terraced houses (1 to 3
apartments) After 2001 173 123
Type 8 multi-apartment buildings (4 to 9
apartments) -2000 312 111
Type 9 multi-apartment buildings (4 to 9
apartments) After 2001 125 99
Type 10 multi-apartment buildings (10 or
more apartments) -1945 344 99
Type 11 multi-apartment buildings (10 or
more apartments) 1946-2000 brick, other 299 95
Type 12 multi-apartment buildings (10 or
more apartments)
mid-size or large blocks, cast
concrete
244 85
Type 13 multi-apartment buildings (10 or
more apartments) 1946-1980
prefabricated panels
218 84
Type 14 multi-apartment buildings (10 or
more apartments) From 1981
prefabricated panels
200 80
Type 15 multi-apartment buildings (10 or
more apartments) After 2001 100 80
Type 16 NEW BUILDING (1 or 2
apartments) From 2013 category C/B 143 no renovation
Type 17 NEW BUILDING (12 apartments
on average) From 2013 category C/B 112 no renovation
Our model uses two retrofit levels. In the first one, after the refurbishment the building complies with the cost-optimal level of energy performance requirements introduced by the Energy Performance Characteristics Decree (TNM). The second refurbishment level assumes that the refurbishment results in a nearly zero-energy building. The assumptions on the rate of refurbishment are based on expert estimates used in Hungary’s First Biennial Report.
Table 29 Assumed rates of refurbishment
Before 2021 After 2021
TNM level refurbishment (% of total stock)
1.5 0
Nearly zero-energy level refurbishment (% of total stock
0.5 2
14 Source: Study for the National Building Energy Performance Strategy.

UNFCCC 2nd Biennial Report of Hungary
51
As the upper values of primary energy consumption per net floor area include district heating and auxiliary electricity used for the operation of heating, cooling and hot water devices and there is no direct data on the weight of these in case of the residential sector a correction was made using the fuel consumption of the residential sector as presented in the National Inventory Report to comply with the requirements of the IPCC 2006 guidelines which require that only emissions from the combustion in household should be reported under this (1.A.4.b) category.
After this, the impact of the government programs was added.
The WAM scenario is based on the targets on final energy consumption in the National Energy Action Plan. It states that 20 PJ and 40 PJ of energy should be saved in the residential sector from 2012 to 2016 and 2020 respectively. We expect that this would result in approximately in 14.3 PJ and 28.7 PJ respectively in the amount of fuel combusted. For the period beyond 2020 the trend of the WEM scenario was applied. The 2013 emission factors were kept. No government programs were considered in the WEM scenario after 2015.
Figure 24 Fuel combusted in the residential sector (2013-2030)
0
20000
40000
60000
80000
100000
120000
140000
160000
2013 2015 2020 2025 2030
FUEL
CO
MB
UST
ED (
TJ)
WEM WAM

UNFCCC 2nd Biennial Report of Hungary
52
Figure 25 GHG emissions in the residential sector (2013-2030)
Table 30 GHG emissions in the residential sector 2013-2030(kt CO2 eq)
2013 2015 2020 2025 2030
WEM 7005,6 6771,2 6423,0 6105,3 5850,4
WAM 7005,6 6771,2 6182,2 5725,7 5312,7
5.1.1.3.3 Agriculture/Forestry/Fishing
The energy use and GHG emissions in agriculture/forestry/fishing sector shows a relative fluctuating trend over time which is predominantly affected by the use of the off-road vehicles and other machinery. On the one hand a decreasing trend in stationary energy use with a decreasing GHG emission trend (parallel to a slowly decreasing IEF) can be projected, while on the other hand the energy needs and GHG emissions of off-road vehicles and other machineries follows an increasing trend with a higher and relative constant IEF. These counter-moving trends extinguish each other and it is projected to make the total GHG emission trend of fuel combustion in agriculture/forestry/fishing sector essentially constant in the following period.
Fishing has a very small contribution to the total energy demand and GHG emissions of the sub-category, although, it is estimated to increase the energy needs of the sub-sector by 10% yearly up to 2020 (resulted by the willingness and financial supports of European Structural and Investment Funds to develop this sector) and by 5% afterwards.
0
1000
2000
3000
4000
5000
6000
7000
8000
2013 2015 2020 2025 2030
GH
G e
mis
sio
ns
(kt-
CO
2-e
q)
WEM WAM

UNFCCC 2nd Biennial Report of Hungary
53
Figure 26 Fuel Combusted in the agriculture/forestry/fishing sector (2005-2030)
Figure 27 GHG emissions from fuel combustion in the agriculture/forestry/fishing sector
(2005-2030)
Table 31 GHG emissions from fuel combustion in the agriculture/forestry/fishing sector
2013-2030 (kt CO2 eq)
2013 2015 2020 2025 2030
WEM 1 365.8 1 165.6 1 166.7 1 168.6 1 172.6
0
5,000
10,000
15,000
20,000
25,000
2005 2010 2015 2020 2025 2030
FUEL
CO
MB
UST
ED (
TJ)
Total Stationary Off-road vehicles and other machinery Fishing
0
200
400
600
800
1,000
1,200
1,400
1,600
2005 2010 2015 2020 2025 2030
GH
G E
MIS
SIO
NS
(KT
CO
2-E
Q)
Total Stationary Off-road vehicles and other machinery Fishing

UNFCCC 2nd Biennial Report of Hungary
54
5.1.2 Fugitive emissions from fuels
5.1.2.1 Solid fuels
In 2015, the last underground coal mine was closed. According to the National Inventory Report 2015 no emissions occur from surface mining, thus we considered fugitive emissions from solid fuels
to be zero, except for a small amount of CH4 emitted by abandoned underground mines.
Table 32 Fugitive emissions from solid fuels 2013-2030 (kt CO2 eq)
2013 2015 2020 2025 2030
WEM 66.5 56 56 56 56
5.1.2.2 Oil and natural gas and other emissions from energy production
Fugitive emissions arise during production, transportation and refining of oil and natural gas, and also emissions from venting and flaring activities connected to these occur under this section. Emissions from activities related to oil are declining in Hungary, and emissions from activities related to natural gas too, but with a slower pace. A small stagnating amount of CO2 from CO2 mining and CH4 from thermal water extraction is emitted. We expect that these trends will continue.
Figure 28Fugitive emissions from oil, natural gas and other emissions from energy production
(2000-2030)
Table 33 Fugitive emissions from oil, gas and other emissions from energy production
2013-2030 (kt CO2 eq)
2013 2015 2020 2025 2030
WEM 773.7 855.9 772.1 699.4 636.1
0
200
400
600
800
1000
1200
2000 2005 2010 2015 2020 2025 2030
GH
G E
MIS
SIO
NS
(KT
CO
2-E
Q)

UNFCCC 2nd Biennial Report of Hungary
55
5.2 Transport
Transport sector is hardly influenced by the economic activity of a country that creates a relative close regression between the increase in transport and the economic growth (determined by GDP values). The emissions of transport sector followed an increasing trend up to 2008, after that the economic and financial crisis affected on the sector by decreasing the emissions.
The decreasing trend is estimated to turn again into increase based on the increasing demand on transport influenced by the continuously economic growth after 2013. Despite a linear improvement in energy efficiency and GHG emission efficiency (emitted GHGs on the given energy demand of the sector), there can be estimated a slowly increase in the energy demand of transport sector in WEM scenario. Based on the projections of the Ministry for National Economy for economic growth and the estimates of the National Energy Strategy and National Energy Efficiency Action Plan, the energy demand of transport is intended to increase to 161 PJ till 2020 and 173 PJ up to 2030. Based on the increasing energy demand of the sector and the decreasing emissions (included indicators of National Transport Infrastructure Development Strategy) GHG emissions will continue a slowly increasing track in the future in spite of the fact of any reduction efforts in WEM scenario.
WAM scenario of National Energy Efficiency Action Plan estimates a radical decrease on energy demand of transport considering WEM scenario: 147 PJ in 2020 and 151 PJ in 2030.
Figure 29 Projected fuel combusted in the transport sector
0
50,000
100,000
150,000
200,000
250,000
2,005 2,010 2015 2020 2025 2030
FUEL
CO
MB
UST
ED (
TJ)
WEM WAM

UNFCCC 2nd Biennial Report of Hungary
56
Figure 30GHG emissions in the transport sector (2013-2030)
Table 34 GHG emissions in the transport sector 2013-2030(kt CO2 eq)
2013 2015 2020 2025 2030
WEM 10 062.3 10 121.9 10 455.8 10 801.0 11 157.7
WAM 10 062.3 9 731.3 9 499.3 9 590.6 9 694. 9
0
2,000
4,000
6,000
8,000
10,000
12,000
14,000
2,005 2,010 2015 2020 2025 2030
GH
G E
MIS
SIO
NS
(KT
CO
2-E
Q)
WEM WAM

UNFCCC 2nd Biennial Report of Hungary
57
5.3 Industrial Processes
5.3.1 Mineral industry
In this sector only CO2 emissions occurred. In case of cement, ceramics and carbonates used for waste gas scrubbing future production values has been projected using historical data and assumptions on the performance of the construction industry, while production values of lime and other uses of soda ash were projected using their correlation with cement production. Glass production fluctuated constantly in the examined period without a clear trend, thus the average value of the period was used as the basis of emission calculation. Emissions factors were kept as of 2013. Production of cement, ceramics and lime fell sharply in the years after 2008, as a consequence emissions in the base year are quite low. We expect that emissions under this section will exceed their 2006 level in 2020.
Figure 31 GHG emissions in the mineral industry (2000-2030)
Table 35 GHG emissions in the mineral industry 2013-2030(kt CO2 eq)
2013 2015 2020 2025 2030
WEM 966.0 1 789.9 2 345.4 2 731.5 3 118.7
-
500.00
1,000.00
1,500.00
2,000.00
2,500.00
3,000.00
3,500.00
2000 2005 2010 2015 2020 2025 2030
GH
G E
MIS
SIO
NS
(KT
CO
2-E
Q)

UNFCCC 2nd Biennial Report of Hungary
58
5.3.2 Chemical Industry
Most of the process emissions under this section come from the production of ammonia and ethylene. GDP assumptions were used to project future production data in case of ethylene. Ethylene dichloride and vinyl chloride monomer production was projected from energy use. The production of other products under this section was projected using their correlation with the former ones. Emission factors were kept constant.
Figure 32 GHG emissions in the chemical industry (2000-2030)
Table 36 GHG emissions in the chemical industry 2013-2030(kt CO2 eq)
2013 2015 2020 2025 2030
WEM 2 224.5 2 426.2 2 671.2 2 866.1 3 109.5
0.00
500.00
1,000.00
1,500.00
2,000.00
2,500.00
3,000.00
3,500.00
2000 2005 2010 2015 2020 2025 2030
GH
G E
MIS
SIO
NS
(KT
CO
2-E
Q)
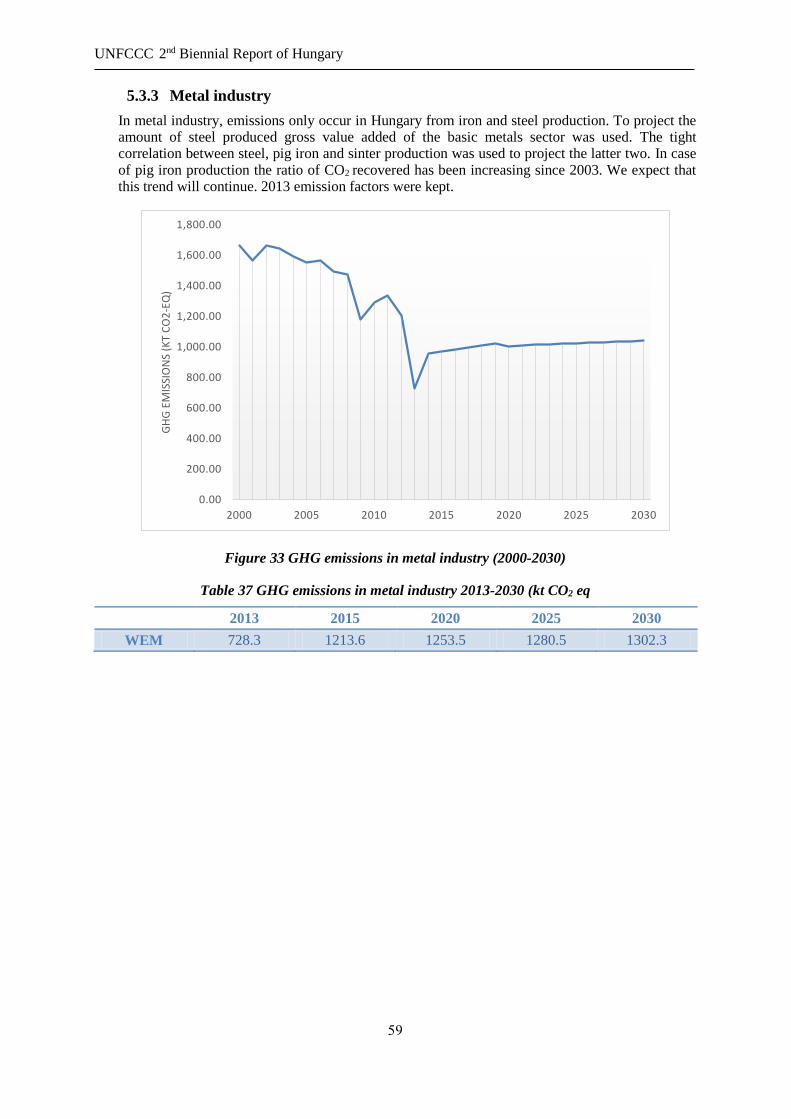
UNFCCC 2nd Biennial Report of Hungary
59
5.3.3 Metal industry
In metal industry, emissions only occur in Hungary from iron and steel production. To project the amount of steel produced gross value added of the basic metals sector was used. The tight correlation between steel, pig iron and sinter production was used to project the latter two. In case of pig iron production the ratio of CO2 recovered has been increasing since 2003. We expect that this trend will continue. 2013 emission factors were kept.
Figure 33 GHG emissions in metal industry (2000-2030)
Table 37 GHG emissions in metal industry 2013-2030 (kt CO2 eq
2013 2015 2020 2025 2030
WEM 728.3 1213.6 1253.5 1280.5 1302.3
0.00
200.00
400.00
600.00
800.00
1,000.00
1,200.00
1,400.00
1,600.00
1,800.00
2000 2005 2010 2015 2020 2025 2030
GH
G E
MIS
SIO
NS
(KT
CO
2-E
Q)

UNFCCC 2nd Biennial Report of Hungary
60
5.3.4 Non-energy products from fuels and solvent use
Only a very small amount of CO2 emissions occurred under this section. A small growth is expected based on the increase of emissions from urea based catalysts in the previous years.
Figure 34 GHG emissions from non-energy products from fuels and solvent use (2000-2030)
Table 38 GHG emissions from non-energy products from fuels and solvent use 2013-2030(kt CO2
eq)
2013 2015 2020 2025 2030
WEM 8.6 8.8 9.6 10.5 11.3
0
20
40
60
80
100
120
140
160
2000 2005 2010 2015 2020 2025 2030
GH
G e
mis
sio
ns
(kt
CO
2 e
q)

UNFCCC 2nd Biennial Report of Hungary
61
5.3.5 Product uses as substitutes for ODS
HFC emission first appeared in Hungary in 1992. Apart from a drop in 2012, emissions of HFCs have
been rising since then. The EU F-Gas regulation (No 517/2014 repealing Regulation (EC) No 842/2006)
will compel a large-scale conversion to climate-friendly technologies in new equipment and products
by 2030. It will progressively reduce the emission of HFCs measured in CO2 equivalent. From 2015
onward, the total sum of HFC quotas allocated to producers and importers cannot exceed the maximum
quantity calculated for the calendar year. The maximum quantity is determined for the whole of the EU.
We assumed that emissions of HFCs will remain on the same level until 2015 and then it will be reduced
following the same trend drawn by the EU level cap.
Table 39 HFC Phase-Down Schedule (2015-2030)
Years HFC Phase-Down Schedule
2015 100%
2016-2017 93%
2018-2020 63%
2021-2023 45%
2024-2026 31%
2027-2029 24%
2030 21%
In the case of PFCs we couldn’t identify any trends, thus we kept the 2013 emission level constant.
Figure 35 GHG emissions from product uses as substitutes for ODS
Table 40 GHG emissions from product uses as substitutes for ODS 2013-2030(kt CO2 eq)
2013 2015 2020 2025 2030
WEM 1 281.1 1 281.1 654.2 368.5 270.4
0
200
400
600
800
1000
1200
1400
1600
2000 2005 2010 2015 2020 2025 2030
GH
G E
MIS
SIO
NS
(KT
CO
2-E
Q)

UNFCCC 2nd Biennial Report of Hungary
62
5.3.6 Other product manufacture and use
Under this section, emission of N2O and SF6 from product manufacture and use is reported. In Hungary the two main sources of N2O emissions under this section are bulk N2O use as an anaesthetic gas and the use of whipped cream cartridges. Emissions from the former and more important one kept rising until 2005, but after that point it stagnated with a small fluctuation. We assume that this stagnation will continue. Emissions from the latter kept falling from 2000, and if it follows this trend it will reach zero in 2026. SF6 emissions come from electrical equipment and from other applications. For electrical equipment, projections were made using gross value added of the industrial sector. For other appliances the continuation of the current trend was assumed.
Figure 36 GHG emissions from other product manufacture and use (2000-2030)
Table 41 GHG emissions from other product manufacture and use 2013-2030 (kt CO2 eq)
2013 2015 2020 2025 2030
WEM 426.9 433.2 470 505.2 541.5
0
100
200
300
400
500
600
2000 2005 2010 2015 2020 2025 2030
GH
G E
MIS
SIO
NS
(CO
2-E
Q)

UNFCCC 2nd Biennial Report of Hungary
63
5.4 Agriculture
Despite the small fluctuating data of agricultural emissions in the last decade, it can be seen that after the decrease by GHG emissions caused by the economic and financial crisis in 2008, the earlier slowly decreasing trend seems to be continued in 2013. Based on the GHG inventory data of Hungary, a decreasing trend of emissions can be observed, which is projected to continue in the next decades. The base year of the projections is 2013 and the trends have been forecasted from the emission trends of sub-categories between 2003 and 2013.
The National Swine Strategy has a decisive effect on enteric fermentation and manure management which is estimated to be trimmed by actions under EAFRD of WAM scenario up to 2020 and 2030. Based on the missing inputs of planned measures after 2020, the emission trends of sub-categories are the same as up to 2020.
Figure 37 GHG emissions in the agriculture sector (2005-2030)
Table 42 GHG emissions in the agriculture sector 2013-2030(kt CO2 eq)
2013 2015 2020 2025 2030
WEM 6 332.9 6 345.9 6 664.9 6 583.0 6 520.4
WAM 6 332.9 6 171.4 6 054.1 5 972.3 5 909.6
5.5 Land use, Land-use Change and Forestry (LULUCF)
Based on the fluctuating emission data of LULUCF sector in GHG inventory of Hungary a very slowly decreasing trend of (negative) emissions can be observed which is originated mostly from the land use change. The base year of the projections is 2013. The emission trends of the following years have been forecasted from the emission trends of sub-categories between 2003 and 2013. Based on the missing inputs of planned measures after 2020, the emission trends of sub-categories are the same as up to 2020.
The WEM and WAM trends show differences which are based on the land use change. WEM scenario does not calculate with the new National Forest Strategy after 2015 and has slower changing rates in
0
1,000
2,000
3,000
4,000
5,000
6,000
7,000
8,000
2005 2010 2015 2020 2025 2030
GH
G E
MIS
SIO
NS
(KT
CO
2-E
Q)
WEM WAM
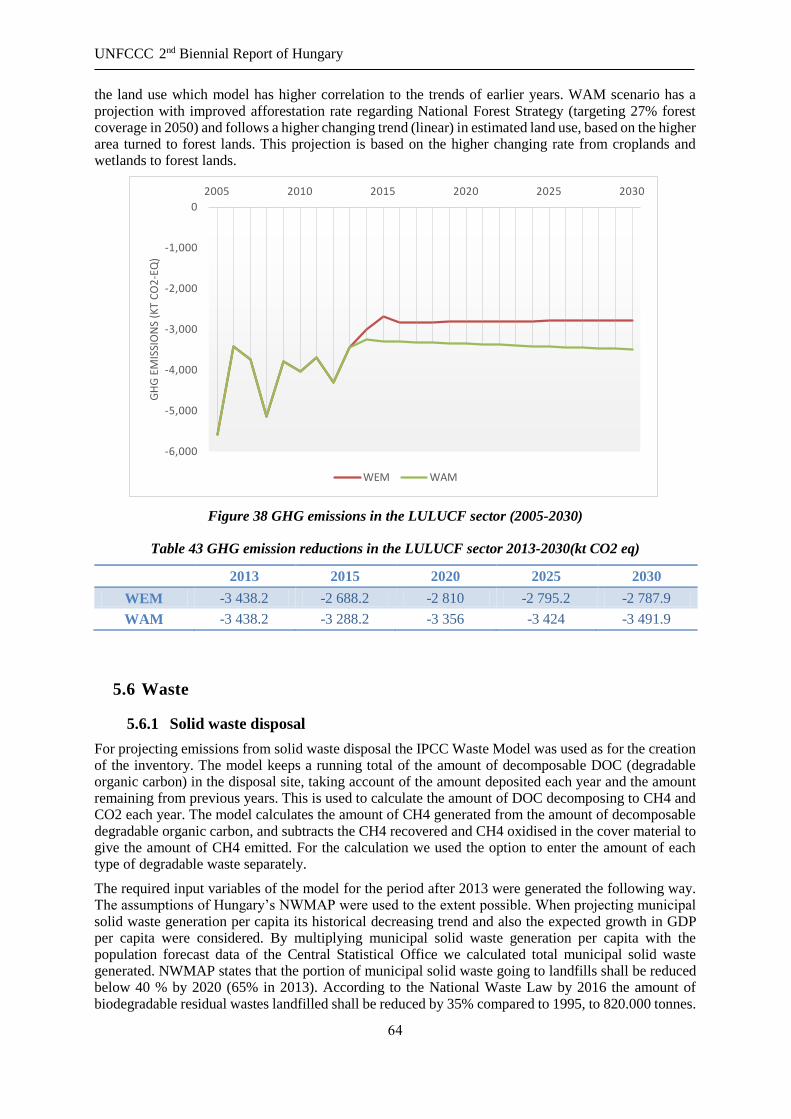
UNFCCC 2nd Biennial Report of Hungary
64
the land use which model has higher correlation to the trends of earlier years. WAM scenario has a projection with improved afforestation rate regarding National Forest Strategy (targeting 27% forest coverage in 2050) and follows a higher changing trend (linear) in estimated land use, based on the higher area turned to forest lands. This projection is based on the higher changing rate from croplands and wetlands to forest lands.
Figure 38 GHG emissions in the LULUCF sector (2005-2030)
Table 43 GHG emission reductions in the LULUCF sector 2013-2030(kt CO2 eq)
2013 2015 2020 2025 2030
WEM -3 438.2 -2 688.2 -2 810 -2 795.2 -2 787.9
WAM -3 438.2 -3 288.2 -3 356 -3 424 -3 491.9
5.6 Waste
5.6.1 Solid waste disposal
For projecting emissions from solid waste disposal the IPCC Waste Model was used as for the creation of the inventory. The model keeps a running total of the amount of decomposable DOC (degradable organic carbon) in the disposal site, taking account of the amount deposited each year and the amount remaining from previous years. This is used to calculate the amount of DOC decomposing to CH4 and CO2 each year. The model calculates the amount of CH4 generated from the amount of decomposable degradable organic carbon, and subtracts the CH4 recovered and CH4 oxidised in the cover material to give the amount of CH4 emitted. For the calculation we used the option to enter the amount of each type of degradable waste separately.
The required input variables of the model for the period after 2013 were generated the following way. The assumptions of Hungary’s NWMAP were used to the extent possible. When projecting municipal solid waste generation per capita its historical decreasing trend and also the expected growth in GDP per capita were considered. By multiplying municipal solid waste generation per capita with the population forecast data of the Central Statistical Office we calculated total municipal solid waste generated. NWMAP states that the portion of municipal solid waste going to landfills shall be reduced below 40 % by 2020 (65% in 2013). According to the National Waste Law by 2016 the amount of biodegradable residual wastes landfilled shall be reduced by 35% compared to 1995, to 820.000 tonnes.
-6,000
-5,000
-4,000
-3,000
-2,000
-1,000
0
2005 2010 2015 2020 2025 2030
GH
G E
MIS
SIO
NS
(KT
CO
2-E
Q)
WEM WAM
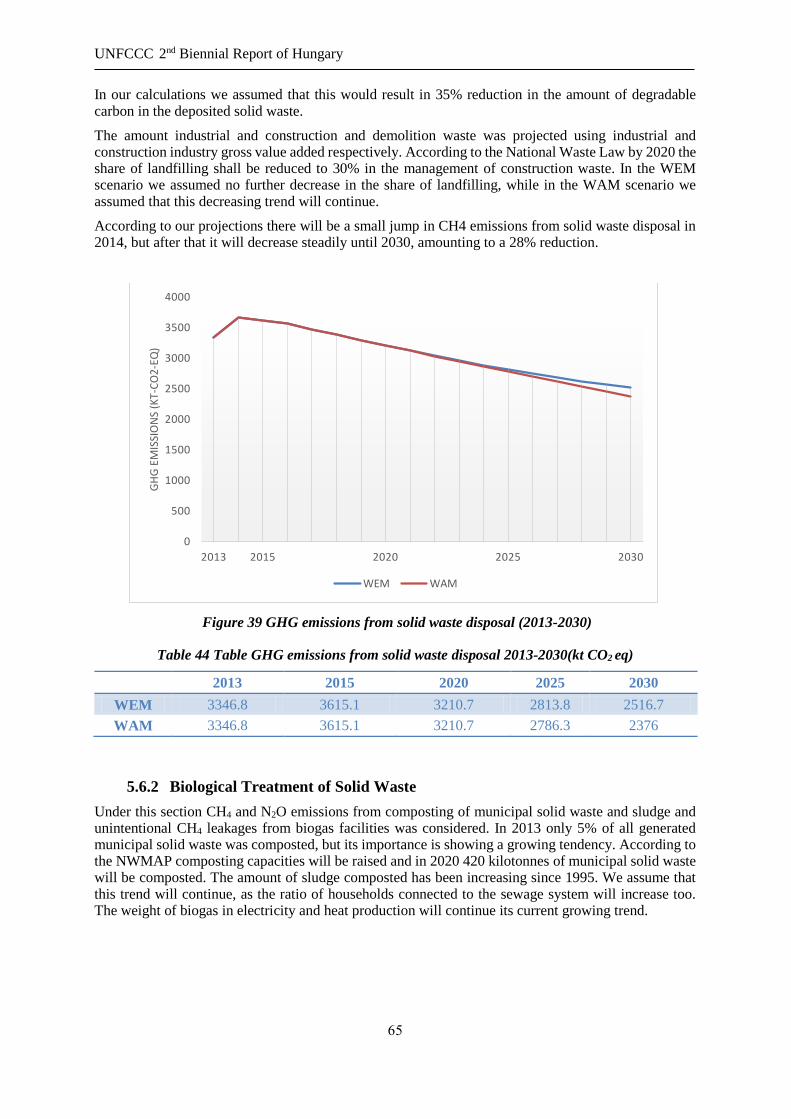
UNFCCC 2nd Biennial Report of Hungary
65
In our calculations we assumed that this would result in 35% reduction in the amount of degradable carbon in the deposited solid waste.
The amount industrial and construction and demolition waste was projected using industrial and construction industry gross value added respectively. According to the National Waste Law by 2020 the share of landfilling shall be reduced to 30% in the management of construction waste. In the WEM scenario we assumed no further decrease in the share of landfilling, while in the WAM scenario we assumed that this decreasing trend will continue.
According to our projections there will be a small jump in CH4 emissions from solid waste disposal in 2014, but after that it will decrease steadily until 2030, amounting to a 28% reduction.
Figure 39 GHG emissions from solid waste disposal (2013-2030)
Table 44 Table GHG emissions from solid waste disposal 2013-2030(kt CO2 eq)
2013 2015 2020 2025 2030
WEM 3346.8 3615.1 3210.7 2813.8 2516.7
WAM 3346.8 3615.1 3210.7 2786.3 2376
5.6.2 Biological Treatment of Solid Waste
Under this section CH4 and N2O emissions from composting of municipal solid waste and sludge and unintentional CH4 leakages from biogas facilities was considered. In 2013 only 5% of all generated municipal solid waste was composted, but its importance is showing a growing tendency. According to the NWMAP composting capacities will be raised and in 2020 420 kilotonnes of municipal solid waste will be composted. The amount of sludge composted has been increasing since 1995. We assume that this trend will continue, as the ratio of households connected to the sewage system will increase too. The weight of biogas in electricity and heat production will continue its current growing trend.
0
500
1000
1500
2000
2500
3000
3500
4000
2013 2015 2020 2025 2030
GH
G E
MIS
SIO
NS
(KT
-CO
2-E
Q)
WEM WAM

UNFCCC 2nd Biennial Report of Hungary
66
Figure 40 GHG emissions from biological treatment of solid waste (2000-2030)
Table 45 GHG emissions from biological treatment of solid waste 2013-2030(kt CO2 eq)
2013 2015 2020 2025 2030
WEM 156.1 172.6 234.4 275.5 316.7
5.6.3 Incineration and Open Burning of Waste
This subsector covers only emissions from thermal waste treatment without energy recovery Emissions from waste incineration for energy purposes are allocated to the energy sector.
According to the inventory data emissions from open burning of waste is insignificant in Hungary and we do not expect any change in that in the future.
Incineration has also little share in the emissions of the waste sector. WMAP states that incinerating waste is only recommended when recycling is not feasible and only after that the components are removed that if combusted would have serious harmful effects on the environment. Considering this and that incineration has little significance in Hungary in our projection we assumed that incineration capacities will stay the same. In Hungary waste incinerated without energy recovery consist of clinical waste, industrial waste and hazardous waste, of which the later adds up for approximately 90%. As it cannot be expected that there will be significant changes in the amount of the former waste streams the emissions from incineration were kept constant for the projected period.
Table 46 GHG emissions from incineratio of waste 2013-2030 (kt Co2 eq)
2013 2015 2020 2025 2030
WEM 199.6 199.6 199.6 199.6 199.6
5.6.4 Wastewater Treatment and discharge
The subsector of wastewater treatment and discharge covers CH4 and N2O emissions predominantly from domestic and in a very small part (cca. 5-6%) from industrial wastewater treatment without energy recovery. According to the inventory data emissions of this subsector has been the following a dynamic linear decreasing trend in Hungary since 1990 and based on the EU framework and the policies we don’t
0
50
100
150
200
250
300
350
2000 2005 2010 2015 2020 2025 2030
GH
G E
MIS
SIO
NS
(KT
CO
2-E
Q)

UNFCCC 2nd Biennial Report of Hungary
67
expect any change in that in the future. The emissions have a very close correlation (0.984) to the ratio of households connected to the sewage system and treatment which also has a continuously increasing trend nearing to 100% on the future. According to policies we estimates this ratio will reach around 95% up to 2030 parallel to this increase the GHG emissions of the subsector is going to converge to the zero in the long term future and will decrease to 102.6 Mt in 2030.
Figure 41 Ratio of households connected to the sewerage system sector (%; 2005-2030)
Figure 42 GHG emissions from wastewater treatment and discharge sector (2005-2030)
Table 47 GHG emissions from wastewater treatment and discharge sector 2013-2030(kt CO2 eq)
2013 2015 2020 2025 2030
WEM 617.5 538.5 393.2 247.9 102.7
0
10
20
30
40
50
60
70
80
90
100
2005 2010 2015 2020 2025 2030
RA
TIO
OF
HO
USE
HO
LDS
CO
NN
ECTE
D T
O T
HE
SEW
ER S
YSTE
M (
%)
0
100
200
300
400
500
600
700
800
900
1,000
2005 2010 2015 2020 2025 2030
GH
G E
MIS
SIO
NS
(KT
CO
2 E
Q)

UNFCCC 2nd Biennial Report of Hungary
68
5.7 Memo items
5.7.1 International bunkers
5.7.1.1 International aviation
Based on the data of international aviation emissions in national inventory from 1993 to 2007 an increasing trend can be observed determined by the increasing number of movements (with a correlation coefficient of 0,907) parallel to the increasing passenger transport. There were two decisive breaks in the time series of the GHG emissions which were caused on the first time by the financial and economic crisis and on the second time by the breakdown of the Hungarian national aviation company (by dropping passenger number in both cases). The breakdown opened new door for the cheap flights which represent higher emission efficiency of the passenger transport in the sector (through increased utilisation of the movements). Based on the dynamic increase of the passenger number and movements estimated by the aviation companies, a moderate increasing trend of GHG emissions can be projected retracted by the counter-effect of slowly increasing emission efficiency.
Figure 43 GHG emissions from international aviation (2005-2030)
Table 48 GHG emissions from international aviation 2013-2030 (kt CO2 eq)
2013 2015 2020 2025 2030
WEM 493.7 603.7 702.5 760.8 819.9
6 Provision of financial, technological and capacity-building support to
developing country Parties
Hungary does not belong to the Annex II of the UNFCCC and is fundamentally not obliged to provide financial resources to developing countries, and as a transition economy is not subject to the acquirement thereof. However as an EU member Hungary together with the 10 new EU member states (NMS) have made a commitment to contribute to the EU Development Co-operation Policy (EDCP), and in particular to meet specific targets of official development assistance (ODA) as a percentage of their gross national income (GNI).
0
100
200
300
400
500
600
700
800
900
2005 2010 2015 2020 2025 2030
GH
G E
MIS
SIO
NS
(KT
CO
2-E
Q)

UNFCCC 2nd Biennial Report of Hungary
69
Besides the international obligation to allocate aid Hungary has also pledged to work towards the fulfilment of the United Nations Millennium Development Goals (MDGs) and align their national strategies with key points from the Accra Agenda for Action. Hungary took an active part in the international efforts to prepare the Post-2015 Agenda. As a Co-Chair of the UN General Assembly’s Open Working Group (OWG) Hungary advocated the elaboration of an universally accepted and applicable set of goals (the Sustainable Development Goals), integrating all three (economic, social and environmental) aspects of sustainability and horizontal aspects such as good governance, the rule of law, accountability, transparency, human rights, peace and security that should also be part of the new framework.
Hungarian Development Policy does attempt to comply with all regulative measures obliged by the acquis communautaire, including its normative contributions to the European Development Fund (EDF), to act upon the commitments to the Millennium Development Goals (MDGs), adhere to the principles of the 2002 Monterrey Consensus and the 2008 follow-up in Doha. To comply with OECD measures, Hungary’s ODA contribution needs to reach 0.33% of GNI.
In 2014 a government resolution was adopted on International Development Cooperation Strategy and Strategic Concept for International Humanitarian Aid of Hungary 2014-2020. The Strategy identifies priority sectors and themes for Hungary’s international development cooperation, which are institutional development, green growth, environmental and climate protection and human development. In 2014 the Hungarian Parliament adopted the Act XC of 2014 on International Development Cooperation and International Humanitarian Assistance which entered into force on 1 July 2015. The Act aims to improve bilateral cooperation with partner countries and increasing the effectiveness of implementation.
Development aid and assistance to developing countries is however not the primary focus of Hungary’s foreign affairs, climate change related subsidies and support to developing countries is particularly rare. In the followings a short overview is given of financial, technological and capacity building transfers.
6.1 Finance
In 2014, Hungary’s net ODA amounted to USD 144 million, the ratio of ODA as a share of GNI remained stable at 0.11%. The Hungarian ODA/GNI ratio and ODA volume between 2008 and 2014 were as follows:
Table 49 The Hungarian ODA/GNI ratio and ODA volume between 2008-2014
2008 2009 2010 2011 2012 2013 2014
ODA volume
(in USD Million) 106.9 116.9 114.3 139.6 119 120.4
144.0
ODA/GNI
(%) 0.075 0.095 0.093 0.11 0.1 0.1
0.11
Majority of Hungarian development assistance is allocated through multilateral channels (80% of the total ODA) in the form of core and voluntary contributions to international organizations and funds. Cooperation with international partners, like the World Bank, IMF and UN has continued.
Hungary’s bilateral ODA related to climate finance – which accounts for 11,5 % of the total (core and climate specific) contribution – is expected to remain at a similar level in the coming years. However, climate-related ODA provided through multilateral channels will increase substantially in 2016 as the Hungarian Government hasdecided to allocate up to 2 billion HUF to participate in international climate finance efforts related to the climate policy negotiations. According to this decision, in the summer of

UNFCCC 2nd Biennial Report of Hungary
70
2015 Hungary made of pledge of 1 billion HUF (approx. USD eq. 4 million)15 to the Green Climate Fund (GCF), which is expected to increase the share of climate policy funding at our multilateral aid area by 30% in the year 2016. The remaining 1 billion HUF contribution to international climate finance, as announced during the COP21 in Paris, shall be provided through bilateral and multilateral channels and is likely to increase the share of climate contributions on the bilateral field as well.
The main recipients of our bilateral assistance in previous years were Serbia, Moldova, Ukraine, Vietnam and Kenya. Most of our bilateral projects take the form of technical assistance, aimed at sharing knowledge and experience. Projects were implemented in areas where Hungary has a comparative advantage, such as sharing the experiences gained during political and economic transition processes, institutional capacity building, strengthening of civil society, education, public health, water management and sanitation. Civil society organizations and public administration bodies play a pivotal role in the implementation of the Hungarian development cooperation.
Ministries have bilateral international activities related to their mandates, where they provide specific financial and technical assistance to partner countries, in the form of scholarships, financing trainings, facilitating technical cooperation or small projects, etc. Their role in relation to ODA is merely to provide statistical data based on these activities. Hungary’s ODA contributions are financed from a central budget. The Minister of Finance proposes a budget for development assistance in the annual Budget Bill. The ministries’ budgets and activities are not earmarked as international development, despite that fact that they actually support international development goals which leaves the exact relation between international development and ODA somewhat vague. The Department of International Development and Humanitarian Aid provides an annual statistical analysis of Hungary’s ODA for the OECD. It collects information from line ministries on those items that can be accountable as ODA but it would be fair to say that line ministries are not generally sensitized to international development activities.
Human capacity building scholarship programmes play a predominant role in international development policy and the joint programmes with FAO are especially relevant in developing countries. Hungarian private sector actors can contribute significantly to international projects mainly in the investment and manufacturing fields, especially when the latter is related to agriculture. Private involvement is smaller in the educational and healthcare sectors where state-ownership is dominant and where non-governmental development organisations play a particularly important role.
The Hungarian private sector has so far made a rather moderate contribution to the international development policy goals of Hungary. One of the principal reasons is that the Hungarian business environment has been on the verge of recession since 2006. Secondly, micro-and small companies dominate the corporate landscape and the vast majority is incapable of taking part in international development projects. The few large companies are mostly multinational and they are embedded in the international development network of their owner’s country. SMEs are very interested in participating in international development projects although they lack relevant capacities and only a few provide significant technological added value in international markets. They cannot finance the investment needs of larger-scale projects and capacity problems are additionally aggravated by human resource problems.
Hungary’s main contribution to the financial development in certain DAC countries is through the activities of two specialized state-owned financial institutions, the EXIMBANK (Hungarian Export-Import Bank Private Limited Company) and the MEHIB (the Hungarian Export Credit Insurance Private Limited Company). Their primary role is to facilitate the sale of Hungarian goods and services to international markets.
EXIMBANK and MEHIB are technically supporting Hungarian companies in countries considered as more uncertain markets. Concerning their role in international development, the most important is the provision of tied aid credits and they contribute to international development funds.
15 United States dollars equivalent (USD eq.) based on the reference exchanges rates established for GCF's
High-Level Pledging Conference (GCF/BM-2015/Inf.01), using the Reference Period average (July 1, 2014
- September 9, 2014).
UNFCCC 2nd Biennial Report of Hungary
71
Tied aid loans
The practice of tied aid plays a specific role in Hungarian international development policy. Tied aid has a strong domestic legitimacy not only within the private sector and intermediary organizations but also with most relevant government agencies. Under the present economic and social conditions the domestic legitimacy of international aid can hardly be based solely on altruism; it requires additional tangible results that may raise public awareness and support. Tied aid loan is considered as a form of international aid that also supports the export market and thereby indirectly promotes the well-being of Hungarian citizens as well.
6.2 Technology development and transfer
Hungary’s main participation in development assistance is providing scholarships, training programs, trainer exchange programs, and language acquisition. Hungary also provides know- how, capacity building and transfer of good practices in democratic transition and institutional development. These projects are generally focusing on neighbouring countries such as Bosnia and Herzegovina, Serbia, Montenegro, Macedonia and Ukraine.
The transfer of know-how, technology and good practices are particularly important in agriculture and related manufacturing industry sectors; this includes non-traditional production methods of foods and beverages, but also latest technologies in viticulture and environmentally sustainable animal husbandry. Human capacity building scholarship programmes play a predominant role in international development policy, and the joint programmes with FAO are especially relevant in developing countries.
General capacity problems can be partly overcome through cluster development and a successful example is a water related cluster that started in January 2008. This cluster brought together different areas of the water industry and by 2013, it had 10 active members in construction, public utility (water and drainage systems) operation, potable water purification, communal and industrial wastewater treatment and environmental services (e.g. flood prevention). This is a good example in providing motivation and capacity to international development projects.