norway’s second biennial report -...
TRANSCRIPT
1
Norway’s second Biennial Report
Under the Framework Convention on Climate Change
Submitted to the UNFCC the 18th of December 2015 by the Norwegian Ministry of Climate
and Environment.
This report will be resubmitted in January 2016 with updated format and layout.

2
Contents
1 INTRODUCTION .............................................................................................................. 4
2 INFORMATION ON GREENHOUSE GAS EMISSIONS AND TRENDS .................... 4
2.1 Emission trends for aggregated greenhouse gas emissions ..................................... 4
2.2 National inventory arrangements and changes ........................................................ 7
Current national inventory arrangements ............................................................... 7
Changes in the national inventory arrangements reported in the 2015 NIR .......... 8
Changes in the national inventory arrangements reported in the 2014 NIR .......... 8
3 QUANTIFIED ECONOMY-WIDE EMISSION REDUCTION TARGET ...................... 9
4 PROGRESS IN ACHIEVEMENT OF QUANTIFIED ECONOMY-WIDE EMISSION
REDUCTION TARGETS AND RELEVANT INFORMATION ........................................... 14
4.1 Mitigation actions and their effects ....................................................................... 14
General overview on mitigation actions and their effects .................................... 14
Information on specific areas of mitigation actions ............................................. 21
4.2 Changes in domestic institutional arrangements ................................................... 27
4.3 Assessment of economic and social consequences of response measures ............ 27
4.4 Estimates of emission reductions and removals and the use of units from the
market-based mechanisms and land use, land-use change and forestry activities ............... 29
General Information ............................................................................................. 29
The Kyoto Protocol’s first commitment period (2008-2012) .............................. 29
The Kyoto Protocol’s second commitment period (2013-2020) .......................... 35
5 Projections ........................................................................................................................ 36
5.1 Methodology ......................................................................................................... 36
5.2 The baseline scenario ............................................................................................ 36
6 PROVISION OF FINANCIAL, TECHNOLOGICAL AND CAPACITY-BUILDING
SUPPORT TO DEVELOPING COUNTRY PARTIES .......................................................... 42
6.1 Introduction ........................................................................................................... 42
6.2 Norwegian contributions and support in main areas and other actions ................. 45
Norway’s International Climate and Forest Initiative .......................................... 45
Norwegian assistance to Clean Energy ................................................................ 45
Norwegian assistance to Climate Adaptation ....................................................... 46
Other Actions ....................................................................................................... 46
6.3 Core support to multilateral institutions ................................................................ 47
6.4 National approach to tracking and reporting provision of support ....................... 59
3
6.5 Private Finance ...................................................................................................... 60
6.6 Technology Transfer ............................................................................................. 61
6.7 Capacity building .................................................................................................. 70
7 OTHER REPORTING MATTERS ................................................................................. 76
7.1 Process of self-assessment ..................................................................................... 76
7.2 National rules for taking local action against domestic non-compliance .............. 76
7.3 Other matters ......................................................................................................... 76
List of acronyms ....................................................................................................................... 77
References ................................................................................................................................ 81
Annex 1. SEF table 4 produced after Norway’s true up .......................................................... 82
Annex 2. Information table on accounting for activities under Articles 3.3 and 3.4 of the
Kyoto Protocol ......................................................................................................................... 83
Annex 3 Follow-up to ERT recommendations ........................................................................ 84
4
1 INTRODUCTION
Norway’s second Biennial Report (BR2) uses the “UNFCCC biennial reporting guidelines for
developed country Parties” as contained in annex 1 to decision 2/CP.17 for the preparation of
this report. The common tabular format (CTF) tables have been prepared to be in accordance
with the common tabular format for “UNFCCC biennial reporting guidelines for developed
country Parties" as specified in decision 19/CP.18.
Norway’ first Biennial Report (BR1) was submitted in conjunction with Norway’s sixth
National Communication (NC6). The BR2 is a stand-alone-report, but will in some cases refer
to information previously reported such as in the NC6 or Norway’s National Inventory Report.
The expert review team (ERT) of Norway’s BR1 found that the reporting was mostly in
adherence with the UNFCCC reporting guidelines on BRs as per decision 2/CP.17. In the
review report1, the ERT had eight recommendations for improving the timeliness, completeness
and transparency of the reporting. We have strived to adhere with the reporting guidelines to
the extent possible and our follow-up to the various recommendations are summarized below.
See annex 3 for a list of the follow- up to the ERT’s –recommendations.
The preparation of the BR2 also draws on the questions formulated and answers provided prior
to the multilateral assessment and the multilateral assessment itself.2
2 INFORMATION ON GREENHOUSE GAS EMISSIONS AND TRENDS
2.1 Emission trends for aggregated greenhouse gas emissions
The Norwegian inventory has been prepared in accordance with the revised UNFCCC
Reporting Guidelines on Annual Inventories (decision 24/CP.19). The latest inventory
containing the National Inventory Report (NIR) and Common Reporting Format (CRF)
covering the years 1990-2013 was submitted to the UNFCCC Secretariat on November 13th
2015. Due to delays in the availability of the CRF reporter software, the NIR and CRF tables
were submitted after the regular deadline of April 15th, but this is in accordance with decision
13/CP.20.
Errors in the CRF tables for land use, land-use change and forestry (LULUCF) under the Kyoto
Protocol (KP) due to a not fully functional CRF reporter software did however prevent Norway
from reporting under the Kyoto Protocol. This inventory submission in 2015 was therefore
reported only under the Convention and not under the Kyoto Protocol.
1 http://unfccc.int/resource/docs/2015/trr/nor01.pdf
2 http://unfccc.int/national_reports/biennial_reports_and_iar/items/8829.php for more information.

5
Chapter 2 of Norway’s 2015 NIR provides detailed information on the greenhouse gas
emissions and removals trends for gases and sectors. Therefore, only a short summary of the
GHG emissions and removals trends for the years 1990-2013 is included here in BR2.
As required by the revised reporting guidelines, Norway’s greenhouse gas inventory includes
four different national totals. This includes total GHG emissions expressed in CO2 equivalent
with and without LULUCF. Both with and without indirect CO2.In the following chapters, if
not specified otherwise, emission figures include indirect CO2 emissions but not LULUCF.
In 2013, total greenhouse gas (GHG) emissions in Norway were 53.7 million tonnes of carbon
dioxide equivalents, which is a slight decrease of 0.15 million tonnes compared to 2012.
Preliminary figures for 2014 indicate the same emissions level (53.2 Mt).
Over the last two decades total emissions have been relatively stable. Total greenhouse gas
emissions were approximately 1.7 million tonnes CO2- equivalent, or 3,3 per cent, higher in
2013 than in 1990. Emissions have decreased by almost 6 per cent since they peaked at 57.0
million tonnes in 2007. The net greenhouse gas emissions, including all sources and sinks, were
27.6 million tonnes of CO2 equivalents in 2013 as compared to 41.5 Mt in 1990. The total
emissions distribution among the main CRF categories from 1990 to 2013 is illustrated in figure
1.
Figure 1. Total emissions of greenhouse gases by sources and removals from LULUCF in Norway 1990-
2013 (Mtons CO2 equivalents). Source: Statistics Norway/Norwegian Environment Agency/ Norwegian
Institute of Bioeconomy Research.

6
Table 1 presents the total emissions including indirect CO2 emissions and its distribution among
the main CRF categories from 1990 to 2013. The total indirect CO2 emissions are also presented
in this table.
Table 1. Total emissions of greenhouse gases by sources and removals from LULUCF in Norway 1990-
2013. Emissions are given in million tonnes of CO2 equivalents.
Energy
Industrial
processes
and
product
use
Agriculture LULUCF Waste
Total
without
LULUCF
Total
with
LULUCF
Indirect
CO2
emissions
1990 30.1 14.5 5.2 -10.6 2.3 52.0 41.5 0.5
1995 32.6 11.6 5.1 -13.7 2.2 51.5 37.8 0.7
2000 35.9 12.1 5.0 -23.6 1.9 54.9 31.3 0.8
2004 38.7 10.9 4.9 -26.7 1.7 56.3 29.5 0.6
2005 38.2 10.6 4.9 -24.7 1.6 55.4 30.7 0.5
2006 39.0 9.7 4.8 -25.9 1.7 55.1 29.3 0.4
2007 40.8 9.8 4.8 -25.8 1.6 57.0 31.2 0.4
2008 39.5 9.7 4.7 -26.4 1.6 55.5 29.1 0.3
2009 39.2 7.4 4.5 -28.5 1.6 52.7 24.3 0.3
2010 41.1 8.2 4.5 -25.4 1.6 55.3 29.9 0.3
2011 40.2 8.2 4.5 -26.8 1.6 54.4 27.5 0.3
2012 39.7 8.2 4.4 -25.4 1.5 53.9 28.4 0.3
2013 39.5 8.3 4.5 -26.1 1.5 53.7 27.6 0.3
Source: Statistics Norway/Norwegian Environment Agency/Norwegian Institute of Bioeconomy
Research.
Norway has experienced about 80 percent growth in GDP since 1990, while overall emissions
are only 3 – 4 percent higher in 2013 than in 1990. In particular the offshore petroleum sector
has expanded significantly over the past 20 years. Energy industries offshore and transport
explains most of the growth in CO2 emissions from energy use. However, the growth in CO2
has been almost fully offset by reductions in other gases and sectors.
In 2013, the net sequestration in the LULUCF sector was 26.1 million tonnes CO2 equivalents,
which corresponds to around half of the total greenhouse gas emissions in Norway that year.
The average annual net sequestration from the LULUCF sector was equivalent to 21.94 million
tons CO2 per year for the period 1990–2013. The calculated changes in carbon removals depend
upon several factors such as growing conditions, harvest levels, and land use changes.
Variations in annual harvest and age class effects will directly influence the variations in
changes in carbon stocks and dead organic matter.
CTF table 1 with the trends for the gases is reported through the CTF application.

7
2.2 National inventory arrangements and changes
Current national inventory arrangements
The Norwegian Environment Agency, Statistics Norway and the Norwegian Institute of
Bioeconomy Research3 (NIBIO) are the core institutions in the national greenhouse gas
inventory system in Norway. Statistics Norway is responsible for the official statistics on
emissions to air. Norwegian Institute of Bioeconomy Research is responsible for the
calculations of emission and removals from Land Use, Land Use Change and Forestry
(LULUCF).
The Norwegian Environment Agency has been appointed by the Ministry of Climate and
Environment as the national entity through the budget proposition to the Norwegian parliament
(Stortinget) for 2006.
The three core institutions work together to fulfil the requirements for the national system. An
overview of institutional responsibilities and cooperation is shown in Figure 2.
Figure 2. Overview of institutional responsibilities and cooperation
Statistics Norway and Norwegian Institute of Bioeconomy Research have signed agreements
with Norwegian Environment Agency as the national entity, outlining their responsibilities.
Through these agreements, the institutions are committed to implementing the QA/QC and
archiving procedures, providing documentation, making information available for review, and
3 The Norwegian Forest and Landscape Institute was merged with Norwegian Institute for Agricultural and
Environmental Research and the Norwegian Agricultural Economics Research Institute to form NIBIO -
Norwegian Institute of Bioeconomy Research on July 1st 2015. This new organization is owned by the Ministry of
Agriculture and Food as an administrative agency with special authorization and its own board. NIBIO (previously
the Norwegian Forest and Landscape Institute) is one of three core institutions in Norway’s National System.

8
delivering data and information in a timely manner to meet the deadline for reporting to the
UNFCCC.
The UNFCCC biennial reporting guidelines calls for Parties to provide summary information
on the changes to the national inventory arrangements since their last national communication
or biennial report. Each year, Norway reports the changes in the national system in chapter 13
of the NIR. For BR2, Norway therefore includes the changes reported in the NIRs for 2014 and
2015. Comprehensive information regarding the national system is reported annually in Annex
V of the NIR.
Changes in the national inventory arrangements reported in the 2015
NIR
Comprehensive information regarding the national greenhouse gas inventory system in Norway
can be found in Annex V of the 2015 NIR. The new CRF reporting tool has introduced a need
for revision of the production plan of the Norwegian emission inventory, and of the timeline
for cooperation between the institutions of the national system. The new routines will be further
elaborated in the 2016 NIR, based on experiences gathered through the implementation of the
new reporting tool in 2015.
Annex V of the 2015 NIR reflects that the Norwegian Forest and Landscape Institute was
merged with Norwegian Institute for Agricultural and Environmental Research and the
Norwegian Agricultural Economics Research Institute to form NIBIO - Norwegian Institute of
Bioeconomy Research on July 1st 2015. This new organization is owned by the Ministry of
Agriculture and Food as an administrative agency with special authorization and its own
board. NIBIO (previously the Norwegian Forest and Landscape Institute) is one of three core
institutions in Norway’s National System.
Also, since the last submission, and in accordance with the decision on Article 5.1 of the Kyoto
Protocol, new formalized agreements between the Norwegian Environment Agency and
Statistics Norway, as well as between the Norwegian Environment Agency and the Norwegian
Institute of Bioeconomy Research (NIBIO), were signed in December 2014. The agreements
ensure the continuation of the national system or greenhouse gas inventories and reporting in
Norway for the period from 2015 – 2022.
Changes in the national inventory arrangements reported in the 2014
NIR
The QA/QC report for Norwegian Forest and Landscape Institute (NFLI)4 has been revised and
there has been a revision of the description of the general annual QC procedures in Annex V to
better reflect the QC checks performed by the three institutions.
4 Now Norwegian Institute of Bioeconomy (NIBIO)
9
A new formalized agreement has been made in 2013 between the Norwegian Environment
Agency and Statistics Norway, which regulates details about the cooperation with the national
air emission inventory in Norway.
3 QUANTIFIED ECONOMY-WIDE EMISSION REDUCTION TARGET
Norway’s climate policy is founded on the objective of the Convention on Climate Change and
the Kyoto Protocol and the scientific understanding of the greenhouse effect set out in the
reports from IPCC. Thus, the policies and measures reported are seen as modifying long-term
trends in anthropogenic greenhouse gas emissions and removals. Section 4.1 of Norway’s sixth
National Communication describes inter alia the Norwegian policy-making process, the broad
political agreement on climate policy and the policy instruments.
Norwegian climate policy is based on a broad agreement between the majorities of the political
parties in the Storting5 from June 2012 (Meld.St. 21 (2011-2012) and Innst.390 S (2011-2012)),
and the white paper outlining the Norwegian Intended Nationally Determined Contribution
from February 2015 (Meld.St. 13 (2014-2015 and Innst. 211 S (2014-2015)).
The political agreement on climate of 2012 states the following emission targets:
Norway will overachieve the Kyoto commitment for the first Kyoto Protocol
commitment period by 10 percentage points.
During the period up to 2020, Norway will commit to cutting global emissions of
greenhouse gases equivalent to 30 per cent of Norway’s emissions in 1990. Following
the political agreement on climate, Norway has made a commitment under the second
commitment period of the Kyoto Protocol (KP 2). Under KP 2, Norway is committed
to an emission reduction that corresponds to average annual emissions over the period
2013-2020 at 84 per cent of the 1990 emission level. The commitment under KP 2 is
consistent with the Norwegian target of 30 per cent reduction of emissions by 2020,
compared with 1990.
Norway will be carbon neutral in 2050.
As part of an ambitious global climate agreement where other developed nations also
undertake ambitious commitments, Norway will adopt a binding goal of carbon
neutrality no later than 2030. This means that Norway will commit to achieving
emission reductions abroad equivalent to Norwegian emissions by 2030.
It is also a long-term objective for Norway to become a low-emission society by 2050.
In February 2015 the government put forward a White paper outlining the new emission
commitment for Norway for 2030 – towards joint fulfilment with the EU (Meld. St. 13 (2014-
5 The Norwegian Parliament

10
2015)). Norway's Intended Nationally Determined Contribution (INDC) to the UNFCCC6
would include the following elements:
Norway will conditionally undertake a commitment to reduce emissions by at least
40 % by 2030 compared with the 1990 level.
Norway will enter into a dialogue on joint fulfilment of its climate commitment
together with the EU, with an emission reduction target of at least 40 % in 2030
compared with the 1990 level. In the period up to the Paris conference, Norway will
work towards a letter of intent with the EU on joint fulfilment of this commitment.
Accordingly, Norway's INDC says that Norway is committed to a target of an at least 40%
reduction of greenhouse gas emissions by 2030 compared to 1990 levels. Norway intends to
fulfil this commitment jointly with the EU and its Member States. In the event that there is no
agreement on a joint fulfilment with the EU, Norway will comply individually. The ambition
level of at least 40% emission reduction by 2030 compared to 1990 still stands. In this situation
Norway assumes that we will have access to flexible mechanisms as in the case with collective
delivery with EU. Table 2.1 in the INDC provides information to facilitate clarity, transparency
and understanding.
In this BR2, Norway reports on the target for the period through 2020. By 2020, Norway is
committed to reduce global emissions of greenhouse gases equivalent by 30 % relative to
Norway’s emission level in 1990. The target was set by the Government in 2007, agreed by the
Parliament (Storting) and sets the overall ambition level. It was reported pursuant to the
Copenhagen Accords. In 2012, this target was made operational through the legally binding
commitment for 2013-2020 under the Kyoto Protocol where average emissions in 2013-2020
shall not exceed 84 % of the 1990 level. Norway ratified the Doha amendments 12 June 2014.
Thus, compliance with the commitment under KP will also imply that the 30% target for 2020
is achieved. Norway explained the relation between the target and a quantified emissions
reduction commitment for an 8 years period in its submission under the KP the 8th of May 20127
and in the subsequent presentation to the AWG KP on the 16th of May8.
Norway has not yet submitted its report to facilitate the calculation of its assigned amount
pursuant to Article 3, paragraphs 7bis, 8 and 8bis, of the Kyoto Protocol for the second
commitment period and to demonstrate its capacity to account for its emissions and assigned
amount (hereinafter referred to as the report) to facilitate the calculation of the assigned amount.
Since the report to facilitate the calculation of the assigned amount is closely linked to the
inventory under the Kyoto Protocol, it will be submitted at a later stage.
6 http://www4.unfccc.int/submissions/indc/Submission%20Pages/submissions.aspx 7 FCCC/KP/AWG/2012/MISC.1 at http://unfccc.int/resource/docs/2012/awg17/eng/misc01.pdf 8 http://unfccc.int/files/meetings/ad_hoc_working_groups/kp/application/pdf/awgkp_norway_ppt.pdf

11
In the report to facilitate the calculation of the assigned amount, Norway will formally decide
on certain choices with regards to our implementation of the Kyoto Protocol’s second
commitment period. CTF table 2 describes relevant information for Norway’s implementation
of its KP 2 commitment and the most important aspects are summarized here in textual form.
Norway will report and account for all the seven mandatory gases or groups of gases. 1990 will
be used as the base year, with the exception of NF3, for which Norway has not yet decided on.
All mandatory sectors will be included and the global warming potential values from the Fourth
Assessment Report of the IPCC will be used. An activity-based approach will be used for the
LULUCF sector. Norway works towards comprehensive inclusion and reporting of the land
sector under the Kyoto Protocol, and will, in the report to facilitate the calculation of the
assigned amount formally decide on certain choices with regards to our implementation of the
Kyoto Protocol’s second commitment period. Formal choices of which activities that will be
included for reporting under the Kyoto Protocol depends on where our methodological
approaches are sufficiently well developed. All currently available mechanisms under the
Convention may be used to meet the target. Future mechanisms will be considered, but a
decision on this must first be taken by the COP, and if applicable, by the CMP.
The information provided in CTF table 2 does not prejudge Norway’s post-2020 approach.
CTF table 2a. Description of quantified economy-wide emission reduction target: base year a
NORWAY
Base year/base period 1990
Emission reduction target % of base year: 30%c % of 1990b: 30%
Period for reaching target 2020c
a Reporting by a developed country Party on the information specified in the common tabular format does not
prejudge the position of other Parties with regard to the treatment of units from market-based mechanisms under
the Convention or other market-based mechanisms towards achievement of quantified economy-wide emission
reduction targets.
b Optional.
C The commitment for 2013-2020 under the Kyoto Protocol is consistent with the 2020 target, and the 2020 target
is operationalized through this commitment. The accounting rules under the Kyoto Protocol, including for
LULUCF, applies both to the 2020 target and the commitment under the Protocol. See chapter 3 in the BR2 for
further details.

12
CTF table 2b. Description of quantified economy-wide emission reduction target: gases and sectors covered a
Gases covered Base year for each gas (year):
CO2 1990
CH4 1990
N2O 1990
HFCs 1990
PFCs 1990
SF6 1990
NF3 Not yet decided
Other gases NA
Sectors covered b Energy Yes
Transport c Yes
Industrial processes d Yes
Agriculture Yes
LULUCF Yes
Waste Yes
Other (specify) NA
Abbreviations: LULUCF = land use, land-use change and forestry.
a Reporting by a developed country Party on the information specified in the common tabular format does not
prejudge the position of other Parties with regard to the treatment of units from market-based mechanisms under
the Convention or other market-based mechanisms towards achievement of quantified economy-wide emission
reduction targets.
b More than one selection will be allowed. If Parties use sectors other than those indicated above, the explanation
of how these sectors relate to the sectors defined by the IPCC should be provided.
c Transport is reported as a subsector of the energy sector.
d Industrial processes refer to the industrial processes and solvent and other product use sectors.
CTF table 2c. Description of quantified economy-wide emission reduction target: global warming potential
values (GWP) a
Gases GWP values b
CO2 Fourth Assessment Report of the IPCC
CH4 Fourth Assessment Report of the IPCC
N2O Fourth Assessment Report of the IPCC
HFCs Fourth Assessment Report of the IPCC
PFCs Fourth Assessment Report of the IPCC
SF6 Fourth Assessment Report of the IPCC
NF3 Fourth Assessment Report of the IPCC
Other gases NA
Abbreviation: GWP = global warming potential
a Reporting by a developed country Party on the information specified in the common tabular format does not
prejudge the position of other Parties with regard to the treatment of units from market-based mechanisms under
the Convention or other market-based mechanisms towards achievement of quantified economy-wide emission
reduction targets.
b Please specify the reference for the GWP: Second Assessment Report of the Intergovernmental Panel on Climate
Change (IPCC) or the Fourth Assessment Report of the IPCC.

13
CTF table 2d. Description of quantified economy-wide emission reduction target: approach to counting
emissions and removals from the LULUCF sector a
Role of LULUCF LULUCF in base year level and target Included in target year b
Contribution of LULUCF is calculated using Activity-based approach with
accounting rules as applied under
the Kyoto Protocol
Abbreviation: LULUCF = land use, land-use change and forestry.
a Reporting by a developed country Party on the information specified in the common tabular format does not
prejudge the position of other Parties with regard to the treatment of units from market-based mechanisms under
the Convention or other market-based mechanisms towards achievement of quantified economy-wide emission
reduction targets.
CTF table 2(e)I. Description of quantified economy-wide emission reduction target: market-based
mechanisms under the Convention a
Possible scale of contributions
CERs All available mechanisms that can be used for
compliance under the Kyoto Protocol may be used to
meet the target. The net contribution of units through
the mechanisms could be about 90 million tonnes for
the whole 2013-2020 period.
ERUs
AAUs b
Carry-over units c
Other mechanism units under the Convention
(specify) d
Abbreviations: AAU = assigned amount unit, CER = certified emission reduction, ERU = emission reduction unit.
a Reporting by a developed country Party on the information specified in the common tabular format does not
prejudge the position of other Parties with regard to the treatment of units from market-based mechanisms under
the Convention or other market-based mechanisms towards achievement of quantified economy-wide emission
reduction targets.
b AAUs issued to or purchased by a Party.
c Units carried over from the first to the second commitment periods of the Kyoto Protocol, as described in decision
13/CMP.1 and consistent with decision XX /CMP.8.
d As indicated in paragraph 5(e) of the guidelines contained in annex I of decision 2/CP.17.
CTF table 2(e)II. Description of quantified economy-wide emission reduction target: other market-based
mechanisms a
Possible scale of contributions
NA Norway will not use other market mechanisms than
those eligible for meeting Norway’s commitment
under KP2.
Abbreviations: AAU = assigned amount unit, CER = certified emission reduction, ERU = emission reduction unit.
a Reporting by a developed country Party on the information specified in the common tabular format does not prejudge the
position of other Parties with regard to the treatment of units from market-based mechanisms under the Convention or other
market-based mechanisms towards achievement of quantified economy-wide emission reduction targets

14
4 PROGRESS IN ACHIEVEMENT OF QUANTIFIED ECONOMY-
WIDE EMISSION REDUCTION TARGETS AND RELEVANT
INFORMATION
4.1 Mitigation actions and their effects
General overview on mitigation actions and their effects
The polluter pays principle is a cornerstone of the Norwegian policy framework on climate
change. The policy should be designed to yield the greatest possible emission reductions
relative to effort, and should result in emission reductions both in Norway and abroad.
General policy instruments are key elements of domestic climate policy. Cross-sectoral
economic policy instruments (e.g. CO2 tax) form the basis for decentralised, cost-effective and
informed actions, where the polluter pays. In areas subject to general policy instruments,
additional regulation should as a main rule be avoided. At the same time, the possibility of
employing other policy instruments in addition to emission trading and taxes is to be continued,
also in these sectors. For example, development of new technology in Norway might help bring
about a faster transition to use of more climate friendly technologies.
In accordance with the broad political agreement on climate of 2012, Norway will particularly
focus on measures that are cost-effective in the light of expectations of rising carbon prices over
the lifetime of the investments, and which are not necessarily triggered by current policy
instruments. This applies particularly to measures that promote technological development and
to measures that mobilize earlier adoption by the population of consumer patterns that yield
lower emissions.
More than 80 per cent of domestic greenhouse gas emissions are from 2013 either covered by
the emissions trading scheme, subject to a CO2 tax, or other taxes directed to reduce greenhouse
gas emissions, or both. Certain sources of emissions may be difficult to incorporate into the
emissions trading scheme or to make subject to a CO2 tax. In such cases, other instruments to
reduce greenhouse gas emissions may be more appropriate.
In addition to demand-side instruments like emission trading and taxes, support to research on
and innovation of climate-friendly technologies should provide complementary support where
markets do not provide the solutions.
Norway has over the years introduced several policies and measures that have reduced the GHG
emissions. Chapter 4 and section 5.3 of Norway’s sixth National Communication describe these
policies and measures and estimate the effect these have had on the historical and projected
emissions. According to the estimates, the GHG emissions in 2010 would have been 12.6-15.2
million tonnes of CO2 equivalents higher than observed, if these policies and measures had not
been implemented. GHG emissions would be 17.1-20.1 million tonnes higher in 2020 and 17.8-
20.5 million tonnes higher in 2030. The estimates prepared for the NC6 are illustrated in figure
3 below.

15
Figure 3. Emissions with and without measures (million tonnes CO2 equivalents). Sources: Statistics
Norway, Norwegian Environment Agency and Ministry of Finance.
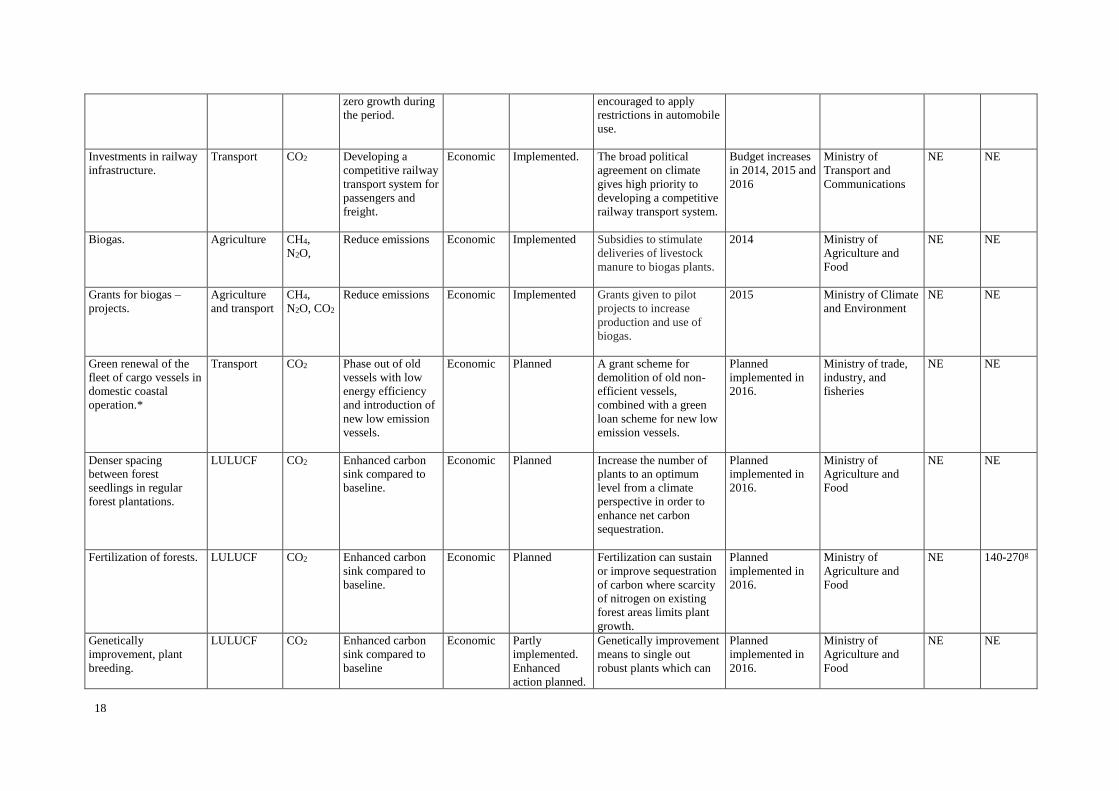
The UNFCCC biennial reporting guidelines call for information on mitigation actions,
including the policies and measures that have been implemented or are planned to be
implemented since the last national communication or biennial report. In CTF table 3, Norway
therefore identifies important policies and measures that are new or changed since Norway
reported its sixth National Communication and first Biennial Report in 2014. For the policies
and measures included in CTF table 3, and for which the mitigation effect have been quantified,
the total effect in 2020 is estimated to be between 270 and 370 kilotons of CO2 equivalents.
The policies and measures are further described below.
For some of the policies and measures in CTF table 3 the impact in terms of GHG reductions
have not been estimated (NE). There are good reasons for this. Firstly, the CTF table 3 should
include effects of new or changed policies and measures since 2014, and for many there are
methodological difficulties in isolating the mitigation effect of a change or adjustment.
Secondly, as for the policies and measures reported in the NC6, there are methodological
difficulties in isolating the mitigation effect from one policy and measure to another, or from
other factors that may influence emissions.
Thus, although the notation key NE (not estimated) is used, the various policies and measures
are likely to have an impact in terms of GHG reductions. We believe it useful to display the
range that have been adopted or are to be implemented even if the impact of the action has not
been quantified.

16
CTF table 3. Progress in achievement of the quantified economy-wide emission reduction target: information on mitigation actions and
their effects
Name of mitigation
action. a
(* = included in with
measures in the GHG
projection scenario)
Sector(s)
affected b
GHG(s)
affected
Objective and/or
activity affected
Type of
instrument c
Status of
implementation d
Brief description e Start year of
implementation
Implementing
entity or entities
Estimate of
mitigation impact
(not cumulative, in
ktons CO2 eq.)
2020 2030 f
Base tax on mineral
oils.*
Energy CO2 Reduce energy
consumption
Economic Implemented Increase in base tax on
mineral oils of NOK 200
per tonne of CO2 in 2014.
2000. Increase in
2014.
Ministry of Finance 50−100 50−100
CO2 tax on mineral
products.*
Energy CO2 Reduce emissions Economic Implemented Increased tax rates, see
footnote.j
1991. Increases
in 2014-2015
Ministry of Finance 100−150 100−150
Tax on HFCs and PFCs
in products.*
Mainly
refrigeration,
heat-pump
and air-
conditioning
(incl.
passenger
cars) sector.
HFCs
PGCs
Reduce emissions Economic Implemented Tax rate increased (in
real terms) by NOK 100
per tonne of CO2
equivalents in 2014 and
by NOK 17 in 2015. The
tax will be increased to
383 NOK in 2016.
2003. Increases
in tax rate in
2014, 2015 and
2016.
Ministry of Finance NE NE
The Norwegian Energy
fund, Enova.*
Multiple
sectors, e.g.
transport,
energy and
industry,
services, and
household.
All GHG
gases.
Contribution to an
environmentally
friendly change in
the consumption
and production of
energy and the
development of
energy and climate
technologies.
Economic Implemented. Expanded in 2015 to
include transport.
Increased budget.
2002, extended in
2012. Transport
included in 2015.
Enova SF NE NE
The Fund for Climate
Mitigation measures,
Renewable Energy and
Energy Transition.*
Multiple
sectors,
including
energy,
All GHG
gases
Provides finance
for other climate
and energy
initiatives, mainly
the Energy fund.
Economic Implemented The capital has been
increased yearly since
2012.
2002, extended
scope from 2012.
The fund
increased its
Ministry of
Petroleum and
Energy
NE NE

17
transport,
industry.
capital in 2014
and 2015.
Energy requirements in
the building code
(TEK)
Buildings CO2 Reduce use of
fossil fuels and
energy
demand in new
buildings.
Regulatory Implemented Requirements
strengthened to "passive
house level" in 2015,
including ban on fossil
fuels in new buildings.
2007 (energy
supply).
Ministry of Local
Government and
Modernisation
NE NE
The Environmental
technology scheme.*
Multiple
sectors
All GHG-
gases
Green
competitiveness,
reduced emissions,
green growth.
Economic Implemented Support to pilot and
demonstration projects
environmental
technology.
2010. Increased
funding in 2016
to NOK 505
million from
NOK 173 and
330 million in
2014 and 2015,
respectively.
Ministry of trade,
industry, and
fisheries
NE NE
Lower vehicle- taxes
for low and zero
emission vehicles.*
Transport CO2 Reduce emissions
from new cars.
Economic Implemented In both years since BR1
more weight has been
added on CO2 emissions
in the registration tax.
2007. Adjusted
annually 2009-
2015.
Ministry of Finance NE NE
Mandatory biofuels
sales in road transport.
Transport CO2 Reduce emissions Regulatory Implemented In order to increase the
use of biofuels, a
mandatory turnover is in
place.
2009 (2.5%),
increased in 2010
(3.5%) and 2015
(5.5%).
Ministry of Climate
and Environment
120 90
Stimulate walking and
the use of bicycles.*
Transport CO2 Increase cycling
and walking.
Economic Implemented The scheme provides
grants for local
governments to invest in
cycling infrastructure.
2014. Ministry of
Transport and
Communications/N
orwegian Public
Roads
Administration
NE NE
Reward scheme for
public transport.*
Transport CO2 Increasing shares of
public transport at
the same time as
managing traffic
with private cars by
including a goal of
Economic Implemented Reward scheme for the
largest cities. Makes
grants available to local
governments for
increased level of service
for public transport.
Local governments are
2004, budget
increase in 2015.
Ministry of
Transport and
Communications
NE NE
18
zero growth during
the period.
encouraged to apply
restrictions in automobile
use.
Investments in railway
infrastructure.
Transport CO2 Developing a
competitive railway
transport system for
passengers and
freight.
Economic Implemented. The broad political
agreement on climate
gives high priority to
developing a competitive
railway transport system.
Budget increases
in 2014, 2015 and
2016
Ministry of
Transport and
Communications
NE NE
Biogas. Agriculture CH4,
N2O,
Reduce emissions Economic Implemented Subsidies to stimulate
deliveries of livestock
manure to biogas plants.
2014 Ministry of
Agriculture and
Food
NE NE
Grants for biogas –
projects.
Agriculture
and transport
CH4,
N2O, CO2
Reduce emissions Economic Implemented Grants given to pilot
projects to increase
production and use of
biogas.
2015 Ministry of Climate
and Environment
NE NE
Green renewal of the
fleet of cargo vessels in
domestic coastal
operation.*
Transport CO2 Phase out of old
vessels with low
energy efficiency
and introduction of
new low emission
vessels.
Economic Planned A grant scheme for
demolition of old non-
efficient vessels,
combined with a green
loan scheme for new low
emission vessels.
Planned
implemented in
2016.
Ministry of trade,
industry, and
fisheries
NE NE
Denser spacing
between forest
seedlings in regular
forest plantations.
LULUCF CO2 Enhanced carbon
sink compared to
baseline.
Economic
Planned
Increase the number of
plants to an optimum
level from a climate
perspective in order to
enhance net carbon
sequestration.
Planned
implemented in
2016.
Ministry of
Agriculture and
Food
NE
NE
Fertilization of forests. LULUCF CO2 Enhanced carbon
sink compared to
baseline.
Economic
Planned
Fertilization can sustain
or improve sequestration
of carbon where scarcity
of nitrogen on existing
forest areas limits plant
growth.
Planned
implemented in
2016.
Ministry of
Agriculture and
Food
NE
140-270g
Genetically
improvement, plant
breeding.
LULUCF CO2 Enhanced carbon
sink compared to
baseline
Economic
Partly
implemented.
Enhanced
action planned.
Genetically improvement
means to single out
robust plants which can
Planned
implemented in
2016.
Ministry of
Agriculture and
Food
NE
NE
19
improve the forest stand
increment and quality.
Increased afforestation
to enhance carbon
stock and
sequestration.
LULUCF CO2 Increase forest
carbon stock and
net CO2
sequestration.
Economic Implemented Planting trees on areas in
early successional stages
and/or areas without
existing forests will
expand forested areas and
increase carbon
sequestration.
2015. (pilot
project)
Ministry of Climate
and Environment
and Ministry of
Agriculture and
Food
NE
NE
Restoration of organic
soils.
LULUCF
Agriculture
CO2,
CH4, N20
Reduce soil carbon
emissions from
peatlands, increase
net sequestration.
Economic Implemented Emissions from drained
organic soils can be
reduced by restoring
trenches made for
drainage on peatlands.
2015 (Pilot
study). Planned
extension in
2016.
Ministry of Climate
and Environment
NE NE
Note: The two final columns specify the year identified by the Party for estimating impacts (based on the status of the measure and whether an ex post or ex ante estimation is
available).
Abbreviations: GHG = greenhouse gas; LULUCF = land use, land-use change and forestry.
a Parties should use an asterisk (*) to indicate that a mitigation action is included in the ‘with measures’ projection.
b To the extent possible, the following sectors should be used: energy, transport, industry/industrial processes, agriculture, forestry/LULUCF, waste management/waste, other
sectors, cross-cutting, as appropriate.
c To the extent possible, the following types of instrument should be used: economic, fiscal, voluntary agreement, regulatory, information, education, research, other.
d To the extent possible, the following descriptive terms should be used to report on the status of implementation: implemented, adopted, planned.
e Additional information may be provided on the cost of the mitigation actions and the relevant timescale.
f Optional year or years deemed relevant by the Party.
g Provided that the economic incentives will increase the level of forest fertilization (150 kg nitrogen per ha) to 5000 - 10 000 ha annually in 10 years
h In a review of the taxation scheme for cars, presented in the revised budget for 2015, the Government presented policy for putting more weight on emissions in the registration
tax in the future.

20
j The estimate includes the following:
Increase in the general CO2 tax on mineral oil of NOK 100 per tonne of CO2 in 2014
Increase in the CO2 tax on mineral oil used for fishing and catching in inshore waters of NOK 50 in 2014
Increase in the general CO2 tax on natural gas and LPG of NOK 50 in 2014 and NOK 75 in 2015.
Increase in the CO2 tax on domestic aviation covered by the EU ETS of NOK 50 in 2014 and NOK 190 in 2015
Increase in the CO2 tax on other domestic aviation by NOK 50 in 2014 and NOK 75 in 2015.

21
Information on specific areas of mitigation actions
4.1.2.1 Base tax on mineral oils
Base tax on mineral oils was increased 50 percent in 2014. The tax was introduced in 2000 to
avoid substitution of electricity and district heating when electricity tax was raised.
Subsequently the base tax was raised to the same level as the electricity tax measured by the
heat content of the fuel. Since 2014 energy taxation of mineral oils exceeds that of electricity.
The base tax applies to use onshore also when CO2-emissions require quotas, while use of
mineral oils offshore is exempted the base tax. The mitigation effect of the increase in the base
tax on mineral products in 2014 is estimated to 50-100 kt. CO2-eq in 2020 and 2030.
4.1.2.2 CO2 tax on mineral products
The mitigation effect of increased CO2 tax rates on mineral products in 2014 and 2015 is
estimated to 100-150 kt. CO2-eq in 2020 and 2030. The estimate includes an increase in the
general CO2 tax on mineral oil as well as in the CO2 tax rates for mineral oil used for fishing
and catching in inshore waters and domestic aviation, respectively, and an increase in the
general CO2 tax on natural gas and LPG. The estimate is inter alia based on assumptions of the
price elasticity of demand.
4.1.2.3 Tax on HFCs and PFCs in products
The growth trend in HFC and PFC emissions from product use was slowed following
introduction of a tax on import and production of HFCs and PFCs in 2003. From the 1st of
January 2014, the tax increased by about 100 NOK to NOK 330 (approximately EUR 40) per
tonne of CO2 equivalents and was increased further to 354 NOK in 2015, and will be increased
further to 383 NOK in 2016. It is assumed that the tax has reduced the growth in emissions, but
we have not estimated the reduced emissions from the tax increases in 2014 and 2015.
4.1.2.4 Fund for Climate Mitigation Measures, Renewable Energy and
Energy Transition
The Fund for Climate Mitigation Measures, Renewable Energy, and Energy Transition is a
capital fund of which the return is used to finance climate mitigation and energy conversion
measures through Enova and other climate initiatives. By 2015 the fund has a capital of NOK
53 500 millions. The capital has been increased by NOK, 9 250 million in 2014 and NOK 9
250 million in 2015. In 2016 the government will increase the capital by another 14 250
million. In 2015 the return from the fund was NOK 1 418 million which was transferred to the
Energy Fund (see chapter 4.1.2.5).

22
4.1.2.5 The Norwegian Energy fund, Enova
The Energy Fund is a policy instrument to ensure a long-term, predictable and stable source of
finance to promote an environmentally friendly change in the consumption and production of
energy, and the development of energy and climate technologies. The activity should contribute
to enhanced security of supply and reduced emissions of greenhouse gases. The Energy Fund
is a government fund owned by the Ministry of Petroleum and Energy. The state enterprise
Enova manages the Energy Fund. Enova's obligations are specified in an agreement between
the Ministry and Enova. The current agreement runs from 2012 until 31 December 2016. The
Energy Fund is financed by means of a levy on the electricity grid tariff, as well as through the
annual returns from the Fund for Climate Mitigation Measures, Renewable Energy, and Energy
Transition. The Energy Fund also generates interest which contributes to the Energy Fund's
budget. The government body Transnova was established in 2009 to reduce GHG-emissions
from the transport sector. 1st of January 2015 Transnova's tasks were transferred to Enova and
Enova's mandate was expanded to include reduced GHG-emissions from the transport sector.
The transfers to the Energy Fund increased from NOK 1.9 billion in 2014 to NOK 2.2 billion
in 2015. This includes transport which was formerly financed through Transnova which had a
budget of NOK 100 million in 2014. The government will further increase the transfers to the
Energy Fund to NOK 2.3 billion in 2016. The increases are financed from increased returns
from the fund for Climate Mitigation Measures, Renewable Energy and Energy Transition and
from direct transfers in the state budget.
The effect on national emissions from Enova’s activities is the calculated reduction of annual
CO2 emissions as a result of the reduced oil consumption estimated from Enova’s energy
results. Other measures, such as taxes and regulations, also have an impact on projects
supported by Enova. For this BR2, it has not been possible to estimate an effect for 2020 or
2030 from the changes since 2014.
4.1.2.6 Energy requirements in the building code
The Norwegian technical building regulation code under the Planning and Building Act
contains specific energy demand requirements for all new buildings. It is also required that
energy supply solutions ensure an environmentally friendly energy supply. Through the broad
political agreement on climate of 2012, the Storting has requested the change of the energy
requirements in the building code to "passive house level" by 2015 and "nearly zero energy
level" by 2020. In November 2015, new energy requirements were adopted by the Ministry of
Local Government and Modernization. This entails more stringent energy efficiency
requirements applicable to new buildings, predicted to between 20 and 25 percent compared to
current levels. The new requirements also prohibit installation of new fossil energy solutions in
all new buildings. The requirements to energy supply solutions are simplified and opens for
more use of electricity for heating. These new requirements will enter into force on the first of
January 2016. There will be a transition period until the first of January 2017.

23
4.1.2.7 The Environmental Technology Scheme – Innovation Norway
The environmental technology scheme was established in 2010. The overall target of the
scheme is to encourage the Norwegian industry to bring the results from more projects on
environmental technology to the marked, see Norway's sixth National communication chapter
4.3.2.8 for more information. During the period 2013 to 2015 NOK 781 million was provided
to 222 projects. The funding to the scheme will increase from NOK 173 and NOK 330 million
in 2014 and 2015, respectively, to NOK 505 million in 2016.
4.1.2.8 Green renewal of the fleet of cargo vessels in domestic coastal
operation
Norway gives priority to development of more environmentally friendly shipping. To increase
the efficiency of the vessels engaged in domestic transportation of cargo, the government has
established a mechanism for renewal of the fleet. The mechanism which will be available in
2016 contains a grant scheme for demolition of old ships combined with a loan scheme which
will be available for newbuilds of low emissions cargo vessels to be engaged in domestic traffic.
4.1.2.9 Lower vehicle- taxes for low and zero emission vehicles
The average CO2 emissions from new cars have been reduced from an average of 177 g/km in
2006 to 110 g/km in 2014. The first eleven months of 2015 the average CO2 emissions from
new cars have been 99 g/km. There are several reasons for this reduction. Firstly, the motor
vehicle registration tax rewards vehicles with low CO2 emissions and penalises vehicles with
high emissions. Secondly, electric vehicles have a high market share of new cars sold in
Norway, due to strong tax and user subsidies. In addition, hybrid vehicles have a significantly
lower registration tax and it can be assumed this has led to a higher market share than we see
in other countries. In addition to the vehicle taxes and the subsidies for electric vehicles, EU
emission standards for motor vehicles have contributed to the reduction in emissions. The
registration tax on cars depends on the weight, engine power, and CO2 and NOX emissions of
the car. The CO2 element was introduced in 2007 and gives strong economic incentives to
choose cars with low CO2 emissions. The CO2 element has been adjusted several times after
the introduction in 2007.
The broad agreement on climate policy from 2012 (Innst.390 S (2011-2012)) adopted a target
where the average emissions from new passenger cars in 2020 shall not exceed an average of
85 grams CO2/km. In a review of the taxation scheme for cars, presented in the revised budget
for 2015, the Government decided to prolong the subsidies for electric vehicles and to put more
weight on emissions in the registration tax in the future. For 2016 the registration tax will again
be changed by putting more weight on emissions of CO2- and NOX.
4.1.2.10 Mandatory biofuels sales in road transport
In order to increase the use of biofuels, there is a mandatory biofuels sales in Norway. A sales
obligation was introduced in 2009, committing the economic operators to sell at least 2.5 per

24
cent biofuels as a share of fuels sold for road transport, measured in volume (litres). Since April
2010, 3.5 per cent of the total yearly amount of fuel sold for road transport must be biofuels and
the requirement was increased to 5.5 per cent from the 1st of October 2015.
As of 1 January 2014, sustainability criteria must be met by all biofuels and bio liquids included
in renewable energy targets of government support schemes and used for fulfilment of the sales
obligation. The sustainability criteria are the EU criteria implemented in the Fuel Quality
Directive and the Renewable Energy Directive. Since 1 January 2014, to promote biofuels with
better climate effects, biofuels produced from wastes, residues, non-food cellulosic material,
and ligno-cellulosic material count as twice the actual amount when calculating fulfilment of
the sales obligation. Norway also aims to promote development of the value chain for second
generation biofuels.
Norway imposes CO2 tax on mineral products. This entails that petrol and diesel are subject to
CO2 tax, whereas bio ethanol, biodiesel and hydrogen are not. Since October 1st 2015 only
biofuels reported under the sales obligation is subject to the road usage tax. Biofuels reported
under the sales obligation is subject to a road usage tax corresponding to its fossil alternative.
Biofuels not used in the fulfilment of the sales obligation are not subject to the road usage tax.
The use of biofuels, blended or pure, has led to reduced CO2 emissions from road vehicles as
the content of bio fuels in petrol and auto diesel has increased since 2006. The isolated effect
of increasing the requirement from 3.5 per cent to 5.5 percent will be to reduce CO2 emissions
by 160 kilotons. However, since the content of bio fuels in the projections is higher than the 3.5
per cent requirement, the added effect in 2020 and 2030 is lower. The additional effect of the
new requirement is therefore estimated to about 120 kilotons CO2 in 2020 and 90 kilotons in
2030. The possible additional effect on the use of biofuels from the tax changes in 2015 is
uncertain.
4.1.2.11 Stimulate walking and the use of bicycles
Through the broad political agreement on climate of 2012 the Storting has adopted a goal of
absorbing the growth in passenger transport in major urban areas through public transport,
cycling and walking. For 2016 there is a funding of 625 million NOK to walking and cycling
through the Norwegian Public Roads Administration. In addition to this funding, in 2014, a
grant scheme for bicycle paths was established to make grants available for local governments
to invest in cycling infrastructure. The scheme was granted NOK 10 million in 2014 and NOK
95 million in 2015. The government will grant 162.5 million NOK to the scheme in 2016. It is
not possible to estimate the effect on CO2 from this policy and measure since it will depend on
how the grants are spent, and that is not yet evident. For the cycling/walking paths it is up to
the municipalities to apply for funding, and therefore it is not clear where the paths will be
established, and hence not clear what effect it can be expected to have on traffic.
4.1.2.12 Reward scheme for public transport
The reward scheme for the largest cities was originally established in 2004 to make grants
available to local governments that achieve positive results increasing shares of public transport

25
at the same time as managing traffic with private cars. The grant should be spent on increased
level of service for public transport (higher frequency, improved travel speeds, etc.), and the
local governments are encouraged to apply restrictions in automobile use (congestion charges,
local fuel taxes, reduced parking, building regulations, etc.). In 2014 the scheme was granted
NOK 1 010.3 million, a gross increase of more than NOK 300 million compared to the 2013
budget. In 2015, the scheme granted NOK 1.3 billion. For 2016, the government will grant
NOK 1.4 billion. It is not possible to estimate the effect on CO2 from this policy and measure
as such since it will depend on how the grants are spent, which is not yet evident. For the reward
scheme for public transport the effect on emissions will depend on the outcome of negotiations
between the state and the municipalities applying for funds.
4.1.2.13 Investments in railway infrastructure
The broad political agreement on climate gives high priority to developing a competitive
railway transport system for passengers and freight. Emphasis is placed on improving the
passenger rail network around the big cities and improving capacity for freight transport. There
have been substantial increases in funding for investment in new railways maintenance of
existing railways. The railway sector was granted NOK 19.4 billion in 2014, a gross increase
of 4.5 billion NOK compared to 2013, when the sector was granted NOK 14.9 billion. In 2015,
the sector has been granted NOK 21.5 billion. The government will grant 21. billion in 2016.
Chapter 4.3.5.9 in Norway's NC6 gives an overview of the plans for the railway sector in
Norway and the expected reductions in CO2 emissions of these plans. It has not been possible
to estimate an effect in terms of reduced GHG emissions from the increased investments since
2014.
4.1.2.14 Biogas
The Ministry of Climate and Environment launched a national cross-sectoral biogas strategy in
2014. Biogas, when replacing the use of diesel, is a mitigation measure that also can reduce
local air pollution and noise. In 2015, the government introduced a 10 million NOK grant to
support biogas pilot projects. The grant will be increased to 20 million NOK in 2016. The pilot
plants will aim to test technology for biogas produced from e.g. livestock manure, and
contribute to future cost reductions and increase future emission reductions in the agricultural
sector. The government has also introduced a monetary support scheme to stimulate deliveries
of livestock manure to biogas plants. Other existing general measures to support investment in
renewable energy and bioenergy are relevant, and have been strengthened. No effect of the
measures has been estimated.
4.1.2.15 Carbon capture and storage
The government has made CCS one of its five prioritised areas of enhanced national climate
policy. The Government aims to realise at least one large-scale project by 2020, and grants
approximately 70 mill. NOK through the 2016 state budget for further studies on relevant
projects in Norway. Norway has also increased funds for research programs through CLIMIT,
granted funding for future investments at Technology Centre Mongstad, and has committed to

26
provide significant funds internationally, including towards the realization of a European CCS-
project through an ERA-NET Cofund.
4.1.2.16 Mitigation actions in Norwegian forestry
Norway has an active forest policy, aiming to increase carbon- sequestration and the forest
carbon stock. Forests represent an important source of renewable energy, and contributes to
production of wooden materials that can replace materials with a stronger carbon footprint. The
broad political climate agreement in the Storting from June 2012 states that an active,
sustainable forestry policy will support the overall climate policy. Through the political climate
agreement from 2012, the Storting calls for several actions to contribute to increasing the CO2
uptake and carbon stocks in the forestry sector. Several of these mitigation actions are
included in the National Budget for 2016. The government will spend NOK 33 million to
increasing plant density, forest fertilization and to reinforcing efforts in forest plant breeding.
It is difficult to quantify the mitigation effects of slow growing boreal forests in a short
timescale (2020-2030). Fertilization of forests is the only mitigation action where the
contribution to increased removals is quantified by 2030. The Ministry of Agriculture and Food
has estimated that the suggested increased support in 2016 will increase the level of forest
fertilization (150 kg nitrogen per ha) to between 5000 and 10 000 hectares (ha) annually in 10
years as expected. The mitigation impact is estimated to be in the range of 140-270 kilotons
CO2 equivalents in 2030.
On a longer timescale (100 years), mitigation actions in the LULUCF sector can contribute
significantly to increasing the removals of greenhouse gases and thereby stabilizing the
concentration of greenhouse gases in the atmosphere at a lower level.
4.1.2.17 Increased afforestation to enhance carbon stock and
sequestration
The Norwegian Ministry of Climate and Environment and the Ministry of Agriculture and Food
implemented in 2015 a pilot project with the objective to increase the CO2 sequestration and
forest carbon stock by planting forest on areas in early successional stages and/or areas without
existing forests. The pilot has a budget on NOK 15 million in 2016. Planting on such areas will
increase CO2 sequestration in Norwegian forests on a long-term scale due to the long rotational
cycles of boreal forests. The effect of the pilot project is likely to be low in 2020 and 2030 due
to the long rotational cycles of boreal forests.
4.1.2.18 Restoration of organic soils
In addition to mitigation efforts within forestry, efforts to reduce emissions from other sources
in the LULUCF sector are also in place. A pilot study to reduce emissions from soil carbon
stored in peatlands by restoration of drained organic soils was executed in 2015. In 2016, the
government will use 13 mill. NOK on restoration of peatlands. The government will also draw

27
up a plan to restore peatlands in the period 2016-2020. Restoration of peatlands is a long term
mitigation effort, and the emission effect until 2020 and 2030 is uncertain.
4.2 Changes in domestic institutional arrangements
The UNFCCC biennial reporting guidelines encourage Parties to provide information on
changes in its domestic institutional arrangements, including institutional, legal, administrative
and procedural arrangements used for domestic compliance, monitoring, reporting, archiving
of information and evaluation of the progress towards its economy-wide emission reduction
target.
Chapters 4.2 and 4.3 of Norway’s sixth National Communication describes the current domestic
institutional arrangements. Norway has several legislative arrangements in place in order to
help reduce emissions of greenhouse gases, such as the Pollution Control Act, the Greenhouse
Gas Emissions Trading Act, the CO2 Tax Act, and the Petroleum Act, as well as requirements
under the Planning and Building Act. There have not been any changes to these arrangements
since Norway reported its sixth National Communication.
4.3 Assessment of economic and social consequences of response measures
The UNFCCC biennial reporting guidelines encourage Parties to provide, to the extent possible,
detailed information on the assessment of the economic and social consequences of response
measures. Norway’s approach to minimization of adverse impacts of mitigation actions in
accordance with Articles 2.3 and 3.14 of the Kyoto Protocol is described in chapter 4.1.6 in the
NC6. The information is summarized below and further information is found in the NC6.
Norway has strived to follow a comprehensive approach to climate change mitigation from
policy development started around 1990, addressing all sources as well as sinks. One of the
concerns behind this policy is to minimize adverse effects of climate policies and measures.
In the environmental, as well as the economic and energy policy development, Norway strives
to base the policy on the polluter pays principle and to have a market-based approach where
prices reflect costs including externalities. As regards emissions of greenhouse gases, costs of
externalities are reflected by levies and by participation in the European Emissions Trading
Scheme (EU ETS). These instruments place a charge on emissions of greenhouse gases.
Norway believes that the best way to reduce emissions on a global scale, in line with the two
degree target, is to put a global price on carbon. Putting a global price on carbon is the most
efficient way to ensure cost-effectiveness of mitigation actions between different countries and
regions, and secure equal treatment of all emitters and all countries. This will help minimize
adverse impacts of mitigation.
Norway has given priority to development of carbon capture and storage (CCS) as a mitigation
option. The national CCS projects in operation are in the petroleum sector, and Norway strives
to disseminate information and lessons learned, both through international fora, and through
bilateral cooperation with developing and developed countries.

28
Norway has also initiated cooperation with developing countries related to fossil fuels: Oil for
Development (OfD).9 This initiative aims at responding to requests for assistance from
developing countries, in their efforts to manage petroleum resources in a way that generates
economic growth and promotes the welfare of the whole population in an environmentally
sound way.
Furthermore, Norway is involved in several initiatives fostering technology transfer and
capacity building in developing countries in shifting the energy mix away from fossil fuels to
more renewable energy systems, including the Clean Energy for Development Initiative and
the International Energy and Climate Initiative (“Energy+”).
Norway has issued Instructions for Official Studies and Reports (Utredningsinstruksen), laid
down by Royal Decree. These Instructions deal with consequence assessments, submissions
and review procedures in connection with official studies, regulations, propositions and reports
to the Storting. The Instructions are intended for use by ministries and their subordinate
agencies. The Instructions form part of the Government’s internal provisions and deviation may
only be allowed pursuant to a special resolution. The provisions make it mandatory to study
and clarify financial, administrative and other significant consequences in advance.
In addition, Norway has a legal framework that deals specifically with environmental impact
assessments. The purpose is to promote sustainable development for the benefit of the
individual, society and future generations. Transparency, predictability and participation for all
interest groups and authorities involved are key aims, and it is intended that long-term solutions
and awareness of effects on society and the environment will be promoted.
9 http://www.norad.no/en/thematic-areas/energy/oil-for-development

29
4.4 Estimates of emission reductions and removals and the use of units from
the market-based mechanisms and land use, land-use change and
forestry activities
General Information
Chapters 4 and 5.3 of Norway’s sixth National Communication and chapter 4.1 of this BR2
describe policies and measures that have reduced or will reduce Norway’s national emissions.
Chapter 5.4 of Norway’s sixth National Communication explains Norway’s accounting under
the Kyoto Protocol for both commitment periods. The information in the NC6 is updated for
this BR2 to explain the roles of market-based mechanisms and the LULUCF sector.
The Kyoto Protocol’s first commitment period (2008-2012)
Norway’s Assigned Amount under the Kyoto Protocol’s first commitment period (2008-2012)
of 1 per cent above the 1990-level, totalled about 250.6 million assigned amount units (AAU).
Through the review of the inventory submitted in 2014, Norway’s total emissions from Annex
A sources in the years 2008-2012 were finalised to about 266.8 million tonnes CO2
equivalents.j The annual emissions for the years 2008-2012 are shown in CTF table 4.
Norway voluntarily chose to over achieve the Kyoto commitment for 2008-2012 by 10 per cent,
which is equivalent to about 5 million tonnes per year. In addition Norway has purchased Kyoto
units to compensate for emissions caused by governmental employees’ international air travel
in the years 2008-2011, and their travels in and out of the EEA during 2012, as well as emissions
related to the CCS test centre at Mongstad.
A governmental procurement programme for Kyoto units was established under the Ministry
of Finance in 2007. About 30 Mt Kyoto units, mostly CERs, have been contracted in respect of
the first commitment period. By end December 2013 22 million units were delivered, which is
above the expected delivery volume and more than sufficient to realise the overachievement,
for which 21.5 Mt is seen as needed. The total expenditure for the 2008-2012 portfolio is
estimated at NOK 1,447 million (EUR 175 mill). The procurement strategy for the period 2008-
2012 emphasised the acquisition of units from UN-approved projects at market prices.
Furthermore, a diversification of the portfolio to mitigate different risk-components was
implemented. This implied inter alia the acquisition of some units from LDCs. Following the
change of government in autumn 2013, the administration of the procurement programme was
moved to the Ministry of Climate and Environment.
j See review report document FCCC/ARR/2014/NOR, http://unfccc.int/resource/docs/2015/arr/nor.pdf

30
The review report of the 2014 inventory also contains the final accounting quantities for
activities under Article 3.3 and Article 3.4. Based on the information in the review report,
Norway issued 2 614 190 removal units (RMUs) in our national registry for the activity
afforestation and reforestation, issued 16 491 128 RMUs in our national registry for the activity
forest management and cancelled a total of 11 771 985 units in our national registry for the
activity deforestation. Norway had intended to use only RMUs for the net source cancellation
for deforestation, but since the net source cancellation technically in the registry had to occur
early in the process, 1 824 462 AAUs were cancelled together with 9 947 523 RMUs.
The deadline for the true up for the Kyoto Protocol’s first commitment period was the 18th of
November 2015. By 16 November 2015, Norway had transferred a sufficient number of units
to the retirement account to meet the commitment under Article 3.1, cancelled units
corresponding to the 10 per cent over achievement and cancelled units for emissions caused by
governmental employees’ international air travel in the years 2008-2011, and their travels in
and out of the EEA during 2012, as well as emissions related to the CCS test centre at Mongstad.
In addition to this, a total of 7 333 333 RMUs from forest management were cancelled in our
national registry. The total overachievement is thus 13 per cent. The details for this was reported
in Norway’s true up period report which can be found on the UNFCCCs webpagesk. Annex 1
shows information from Standard Electronic Format (SEF) table 4 produced after Norway’s
true up.
Norway stated in its “Initial report” in 2006 that RMUs issued by Norway from Article 3.4 will
not be used to meet the commitment under Article 3.1. But since the registry’s technically
sequencing was different from what was foreseen, 1 824 462 RMUs (equal to the number of
AAUs used for net source cancellation) were used in Norway’s true up for the Kyoto Protocol’s
first commitment period. In CTF table 4, the actual contribution from LULUCF to meet the
commitment under Article 3.1 for the first commitment period is 0.
Although the actual contribution from LULUCF for the Kyoto Protocol’s first commitment
period in CTF table 4 is 0, Norway has reported under the accounting approach under the Kyoto
Protocol for afforestation/reforestation and deforestation under article 3.3 of the Kyoto Protocol
and on forest management under article 3.4 of the Kyoto Protocol.
As stated in chapter 2.1, errors in the KP-LULUCF tables due to a not fully functional CRF
reporter software prevented Norway from reporting under the Kyoto Protocol in 2015. For this
reason, it was not possible to report CTF table 4(a)II for the Kyoto Protocol’s second
commitment period. The CTF tables have been updated and it is no longer possible to report
CTF table 4(a)II for the Kyoto Protocol’s first commitment period. For these reasons, it has not
been possible to report CTF table 4(a)II through the BR CTF application. However, Norway’s
LULUCF accounting quantities for the years 2008-2012 is included as reported in the CRF in
a table in Annex 2.
CTF table 4(a)I is not relevant for Norway since an activity-based approach is used.
k http://unfccc.int/kyoto_protocol/reporting/true-up_period_reports_under_the_kyoto_protocol/items/9049.php
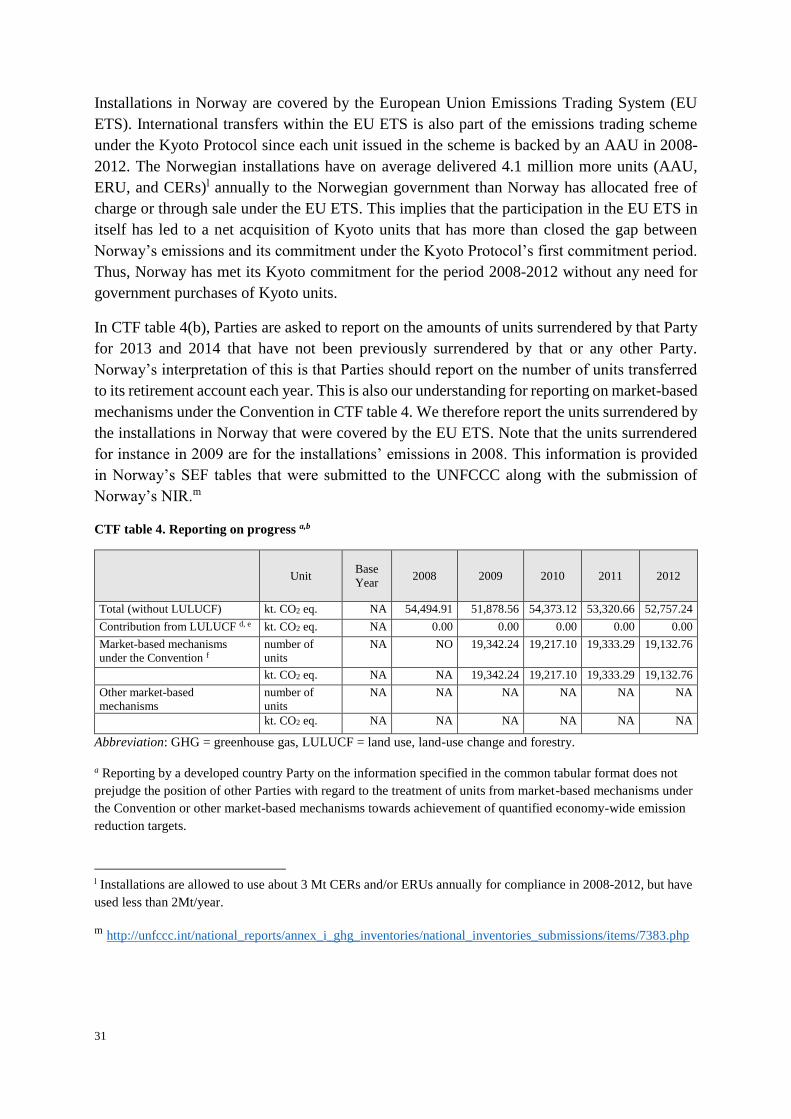
31
Installations in Norway are covered by the European Union Emissions Trading System (EU
ETS). International transfers within the EU ETS is also part of the emissions trading scheme
under the Kyoto Protocol since each unit issued in the scheme is backed by an AAU in 2008-
2012. The Norwegian installations have on average delivered 4.1 million more units (AAU,
ERU, and CERs)l annually to the Norwegian government than Norway has allocated free of
charge or through sale under the EU ETS. This implies that the participation in the EU ETS in
itself has led to a net acquisition of Kyoto units that has more than closed the gap between
Norway’s emissions and its commitment under the Kyoto Protocol’s first commitment period.
Thus, Norway has met its Kyoto commitment for the period 2008-2012 without any need for
government purchases of Kyoto units.
In CTF table 4(b), Parties are asked to report on the amounts of units surrendered by that Party
for 2013 and 2014 that have not been previously surrendered by that or any other Party.
Norway’s interpretation of this is that Parties should report on the number of units transferred
to its retirement account each year. This is also our understanding for reporting on market-based
mechanisms under the Convention in CTF table 4. We therefore report the units surrendered by
the installations in Norway that were covered by the EU ETS. Note that the units surrendered
for instance in 2009 are for the installations’ emissions in 2008. This information is provided
in Norway’s SEF tables that were submitted to the UNFCCC along with the submission of
Norway’s NIR.m
CTF table 4. Reporting on progress a,b
Unit Base
Year 2008 2009 2010 2011 2012
Total (without LULUCF) kt. CO2 eq. NA 54,494.91 51,878.56 54,373.12 53,320.66 52,757.24
Contribution from LULUCF d, e kt. CO2 eq. NA 0.00 0.00 0.00 0.00 0.00
Market-based mechanisms
under the Convention f
number of
units
NA NO 19,342.24 19,217.10 19,333.29 19,132.76
kt. CO2 eq. NA NA 19,342.24 19,217.10 19,333.29 19,132.76
Other market-based
mechanisms
number of
units
NA NA NA NA NA NA
kt. CO2 eq. NA NA NA NA NA NA
Abbreviation: GHG = greenhouse gas, LULUCF = land use, land-use change and forestry.
a Reporting by a developed country Party on the information specified in the common tabular format does not
prejudge the position of other Parties with regard to the treatment of units from market-based mechanisms under
the Convention or other market-based mechanisms towards achievement of quantified economy-wide emission
reduction targets.
l Installations are allowed to use about 3 Mt CERs and/or ERUs annually for compliance in 2008-2012, but have
used less than 2Mt/year.
m http://unfccc.int/national_reports/annex_i_ghg_inventories/national_inventories_submissions/items/7383.php

32
b For the base year, information reported on the emission reduction target shall include the following: (a) total
GHG emissions, excluding emissions and removals from the LULUCF sector; (b) emissions and/or removals
from the LULUCF sector based on the accounting approach applied taking into consideration any relevant
decisions of the Conference of the Parties and the activities and/or land that will be accounted for; (c) total GHG
emissions, including emissions and removals from the LULUCF sector. For each reported year, information
reported on progress made towards the emission reduction targets shall include, in addition to the information
noted in paragraphs 9(a–c) of the UNFCCC biennial reporting guidelines for developed country Parties,
information on the use of units from market-based mechanisms.
c Parties may add additional rows for years other than those specified below.
d Information in this column should be consistent with the information reported in table 4(a)I or 4(a)II, as
appropriate. The Parties for which all relevant information on the LULUCF contribution is reported in table 1 of
this common tabular format can refer to table 1.
e RMUs issued by Norway have not been used to meet the commitment under Article 3.1.
f Units from marked-based mechanisms correspond to the units surrendered by the installations in Norway that
are covered by the EU ETS.

33
Table 4(b)
Reporting on progressa, b, c
Units of market based mechanisms
Year
2013 2014
Kyoto Protocol unitsd
Kyoto Protocol units (number of units) NO NO
(kt CO2 eq) 0.00 0.00
AAUs (number of units) NO NO
(kt CO2 eq) 0.00 0.00
ERUs (number of units) NO NO
(kt CO2 eq) 0.00 0.00
CERs (number of units) NO NO
(kt CO2 eq) 0.00 0.00
tCERs (number of units) NO NO
(kt CO2 eq) 0.00 0.00
lCERs (number of units) NO NO
(kt CO2 eq) 0.00 0.00
Other units d,e
Units from market-based
mechanisms under the Convention
(number of units)
(kt CO2 eq)
Units from other market-based
mechanisms
(number of units)
(kt CO2 eq)
Total (number of units) NO NO
(kt CO2 eq) 0.00 0.00
Abbreviations: AAUs = assigned amount units, CERs = certified emission reductions, ERUs = emission reduction units, lCERs =
long-term certified emission reductions, tCERs = temporary certified emission reductions.
Note: 2011 is the latest reporting year.

34
a Reporting by a developed country Party on the information specified in the common tabular format does not prejudge the position of other Parties with regard to the treatment of units from
market-based mechanisms under the Convention or other market-based mechanisms towards achievement of quantified economy-wide emission reduction targets.
b For each reported year, information reported on progress made towards the emission reduction target shall include, in addition to the information noted in paragraphs 9(a-c) of the reporting
guidelines, on the use of units from market-based mechanisms.
c Parties may include this information, as appropriate and if relevant to their target.
d Units surrendered by that Party for that year that have not been previously surrendered by that or any other Party.
e Additional rows for each market-based mechanism should be added, if applicable.
35
The Kyoto Protocol’s second commitment period (2013-2020)
Norway’s commitment implies that average annual emissions of greenhouse gases in the period
2013-2020 are to be limited to 84 per cent of emissions in 1990. As explained in chapter 3, this
is in line with the target of reducing emissions by 30 per cent by 2020.
The exact number of assigned amount units (AAUs) Norway can issue for the period 2013-
2020 pursuant to the commitment under Article 3.1 will in due time be set through a review
process. But according to our estimates, the number of AAUs could be about 349.6 million
AAUs in total for the period 2013-2020, or in average 43.7 million AAUs annually. Chapter 5
shows that Norway’s emissions in the with measures scenario are likely to be higher than the
expected issuance of AAUs to Norway. It is therefore important to understand the role of the
LULUCF sector, how policies and measures can continue to reduce emissions and the role of
carbon markets.
For the second commitment period of the Kyoto Protocol, Norway will use an activity-based
approach for the LULUCF sector. The net changes in greenhouse gas emissions by sources and
removals by sinks resulting from land-use change under Article 3.3 (afforestation, reforestation
and deforestation), measured as verifiable changes in carbon stocks in the commitment period,
are accounted for in their entirety. It is uncertain whether this contribution will amount to a net
reduction or a net emission. Norway expects to be eligible to issue RMUs corresponding to 3.5
per cent of total greenhouse gas emissions in 1990 from forest management (Article 3.4), or
about 14 Mt for the entire period. Norway has not yet decided whether or which emissions and
removals from other voluntary activities under Article 3.4 will be included in our accounting
for the second commitment period of the Kyoto Protocol.
It is uncertain how and to what extent the participation in the EU ETS will contribute to the
fulfilment of the commitments for 2013-2020.
Policies and measures that will ensure compliance with the commitment for the second
commitment period under the Kyoto Protocol will, to a large extent, represent a continuation of
an established system, which is well integrated into Norwegian climate policy. The current
guidelines for the procurement programme for Kyoto units will continue during the period
2013-2020. The programme will only acquire UN-approved credits and contribute to the
development of a global carbon market.
The carbon market is currently characterized by low demand which has led to excess supply
and low prices, both in the primary and secondary market. An implication of this is that a
number of registered projects are not issuing credits, and the number of new projects submitted
for registration is low. Owing to the changes in the carbon market, Norway will only acquire
units from projects facing a risk of discontinuing their operations, or from new, as yet
unregistered projects. Norway will, as in the restrictions in the EU ETS, refrain from purchasing
units from so-called industrial HFC projects. Furthermore, Norway will not purchase units from
coal-based energy production without carbon capture and storage. A small part of the portfolio
will be procured from the UN Adaptation Fund.

36
Norway has allocated funds for acquisitions and has also contracted the Nordic Environment
Facility Cooperation (NEFCO) to acquire 30 million tons on its behalf, and is currently in
process of acquiring a further 30 million CERs through a purchase program run directly by the
Ministry of Climate and Environment. Currently, Norway is targeting delivery of 60 million
CERs for the period 2013-2020.
5 PROJECTIONS
5.1 Methodology
Since the BR1 was reported, the Norwegian inventory has been prepared in accordance with
the revised UNFCCC Reporting Guidelines on Annual Inventories (decision 24/CP.19). This
includes using the Global Warming Potential (GWP) for greenhouse gas emissions from the
IPCC’s fourth assessment report, new emissions sources and new methods/emission factors for
calculating some emission sources. The most important change is due to the new GWP values.
The projections are updated to be consistent with historical data. The update makes it more
difficult to compare the projections with what was reported in BR1/NC6.
There have been no other changes in the methods or models used to project emissions.
5.2 The baseline scenarion
Total greenhouse gas emissions excluding LULUCF are projected to remain relatively stable
during the period up to 2020, before declining somewhat by 2030, (see CTF 6(a)). This
projection profile reflects that emissions from the petroleum industry are expected to rise for
some years to come before declining towards 2030. According to Statistics Norway’s
population projections (mean projection) the high immigration over the past years is assumed
to continue, leaving the population in 2030 to be 17 per cent higher than in 2013. Despite
continued strong economic growth and population growth, emissions from the mainland
economy (excluding oil and gas extraction) are projected to stay at approximately the same
level as in the past couple of years. Emissions per capita are thus projected to fall by 17 per cent
by 2030 compared with 2013, both in the total and mainland economy. In the years since 1990,
emissions per capita have been reduced by 14 per cent (in the mainland economy the reduction
has been close to 25 per cent).
In 2013, the LULUCF sector contributed with net removals of 26.1 million tonnes of CO2
equivalents. As shown by the historical data in CTF table 6a, the carbon stock in living biomass
in the LULUCF-sector has increased steadily during the last decades. The increase in living
biomass reflects that there has been an active forest management policy in Norway over the last
60–70 years. In the period after the Second World War (1955-1992), more than 60 million trees,
in average, were planted each year. Trees planted in this period now contribute greatly to the
n The national projections were presented in the National budget 2015 (Meld.St. 1 (2014-2015) Nasjonalbudsjettet 2015). In
this report these projections are adjusted in accordance with the revised UNFCCC Reporting Guidelines on Annual
Inventories. The projections are based on policies as of the 3rd quarter of 2014.

37
high net CO2 sequestration in Norwegian forests. In addition, annual drain levels are much
lower than the annual increments. This causes an accumulation of tree biomass, which hence
increases the sequestration from forests.
Net CO2 sequestration is however expected to decline in the coming century. This is due to a
combination of an assumed increase in logging, aging of the Norwegian forests and a reduction
in the number of seedlings that were planted annually in the last decades. Projections show that
the contribution to net CO2 sequestration from the LULUCF sector in 2030 will decrease to
about 21.3 million tons CO2 (CTF table 6a). Despite this development, sequestration in forest
and other land areas are projected to equal about two-fifths of the aggregate greenhouse gas
emissions from Norwegian territory in 2030.
Emissions of greenhouse gases other than CO2 have been reduced by 43 per cent from 1990 to
2013. Only a slight further decrease is projected for the next two decades, see CTF 6(a).
However, during the period up to 2020, the projections show that lower emissions of methane
and nitrous oxide will to some extent be offset by higher emissions of HFC gases owing to the
increased use of cooling appliances containing HFCs.
The development in emission from oil and gas extraction is based on the expected production
profile of oil and gas. In 2030, emissions from the petroleum sector are projected to be 11 per
cent lower than in 2020. Compared with the 6th national communication/1st Biennial Report,
emissions in 2020 are projected at the same level while emission in 2030 is revised upwards by
0.5 million tonnes. The production of oil and gas is projected to decrease by more than
emissions from 2020 to 2030. The energy needed, and thus emissions, to produce oil and gas
on a field are more or less constant as long as the field produces and not necessarily correlated
with the amount produced.
The emissions projections for the mainland economy are revised down by almost 1 million
tonnes in 2020 and 1.4 million tonnes in 2030 compared to in the previous Biennial Report
(BR1). Emissions from road transport are projected to stay at today’s level in the years to come.
Thus, compared to BR1, emissions from transport are projected lower in both 2020 and 2030.
The emissions are adjusted downwards i.a. because the growth in transportation per person has
come to a halt the past couple of years. In line with this the use of transportation is projected to
follow the population growth. In comparison, the previous projections (presented in BR1), was
based on the assumption of continuously growth in driven kilometres per person. Stronger
environmental regulation through higher taxes on fuels and higher emission standards for cars
in several countries has contributed to the development of more emission efficient cars. Norway
does not produce cars, but have benefited from this development by giving incentives to
motorists through the use of strong economic policy instruments. This has contributed to
reduced emissions per kilometre from passenger cars. Continued strong incentives to choose
emission efficient cars are partly the reason why the emission intensity in cars is estimated to
fall by 1.5 per cent annually going forward.
It is assumed that energy-intensive manufacturing industries will consume approximately the
same amount of electricity as in 2013. However, as a result of increased productivity,
production levels in energy-intensive industries will rise somewhat over time while emissions

38
remain stable. Thus, the emissions per produced unit will continue to fall. The emissions from
industry are projected at approximately the same level as in BR1.
Electricity generation in Norway is almost entirely based on hydro. Emissions from this sector
are projected to remain at a low level in the decades to come. As opposed to other countries,
Norway does not have the opportunity to reduce emissions from electricity generation by
developing more renewable energy.
As in the previous projections (presented in BR1) consumption of heating oil in households is
assumed to be decrease significantly by 2020 and 2030, due to continues strong incentives
through high taxes and generous subsidies for phasing out boilers in household. Thus, use of
heating oil in households is projected to be phased out by 2030.

39
CTF table 5. Summary of key variables and assumptions used in the projections analysis a
Historical b Projected
Key underlying assumptions 1990 2000 2012 2020c 2030d
Billion NOK. Fixed 2012-prices
Gross domestic product 1 705 2 448 2 965 3 447 4 227
- Petroleum activities and ocean transport 480 884 670 670 611
- Mainland Norway 1 215 1 670 2 295 2 777 3 512
Consumption 597 829 1 176 1 514 2 266
Gross fixed capital formation 301 436 660 799 825
- Petroleum activities and ocean transport 84 117 182 2111 167
- Mainland Norway 214 319 478 591 673
Population in 1000 4 250 4 503 5 051 5 503 5 991
Number of persons employed in 1000 2 059 2 320 2 684 2 908 2 999
Oil price (2011-NOK) 265 350 685 545 545
a Parties should include key underlying assumptions as appropriate.
b Parties should include historical data used to develop the greenhouse gas projections reported.
c, d For the assumptions on GDP, consumption and gross fixed capital formation, the estimates for 2020 and 2030 are based on annual growth rates.

40
CTF table 6(a). Information on updated greenhouse gas projections under a ‘with measures’ scenario a
GHG emissions and removals (kt CO2 eq)b
Base year
each gas
(year) 1990 1995 2000 2005 2010 2011 2012 2013 2020 2030
Sector d,e
Energy 19 797 19 797 21 469 24 076 25 592 27 606 26 732 26 320 26 225 27 555 25 446
Transport 10 277 10 277 11 110 11 851 12 652 13 473 13 426 13 398 13 286 13 262 13 404
Industry/industrial processes 14 493 14 493 11 620 12 075 10 609 8 197 8 192 8 196 8 274 8 581 8 446
Agriculture 5 159 5 159 5 118 5 009 4 874 4 480 4 460 4 443 4 463 4 443 4 453
Forestry/LULUCF -10 552 -10 552 -13 674 -23 562 -24 692 -25 429 -26 842 -25 448 -26 134 -23 466 -21 271
Waste management/waste 2 301 2 301 2 186 1 880 1 630 1 578 1 561 1 515 1 476 1 012 740
Other (specify)
Gas
CO2 emissions including net
CO2 from LULUCF 24 594 24 594 24 171 17 939 18 265 19 853 17 588 18 591 17 778 22 080 22 624
CO2 emissions excluding net
CO2 from LULUCF 35 600 35 600 38 322 41 996 43 469 45 811 44 958 44 567 44 441 45 546 43 895
CH4 emissions including CH4
from LULUCF 6 417 6 417 6 566 6 363 6 056 5 785 5 633 5 555 5 574 NE NE
CH4 emissions excluding CH4
from LULUCF 6 273 6 273 6 421 6 215 5 906 5 636 5 486 5 408 5 428 5 325 5 003
N2O emissions including N2O
from LULUCF 4 470 4 470 4 106 4 233 4 477 2 892 2 883 2 880 2 840 NE NE
N2O emissions excluding N2O
from LULUCF 4 160 4 160 3 773 3 886 4 114 2 512 2 502 2 498 2 457 2 475 2 451
HFCs 0 0 92 383 614 1 065 1 106 1 141 1 155 1 218 830
PFCs 3 895 3 895 2 314, 1 519 955, 238 263 201 182 217 231
SF6 2 099 2 099 580 891 298 72 58 58 61 71 78
Other (specify, e.g. NF3)
Total with LULUCFf 41 474 41 474 37 828 31 329 30 665 29 904 27 530 28 424 27 590 31 387 31 218
Total without LULUCF 52 026 52 027 51 503 54 891 55 356 55 334 54 372 53 872 53 724 54 853 52 489
41
Abbreviations: GHG = greenhouse gas, LULUCF = land use, land-use change and forestry.
a In accordance with the “Guidelines for the preparation of national communications by Parties included in Annex I to the Convention, Part II: UNFCCC reporting guidelines on national
communications”, at a minimum Parties shall report a ‘with measures’ scenario, and may report ‘without measures’ and ‘with additional measures’ scenarios. If a Party chooses to report
‘without measures’ and/or ‘with additional measures’ scenarios they are to use tables 6(b) and/or 6(c), respectively. If a Party does not choose to report ‘without measures’ or ‘with additional
measures’ scenarios then it should not include tables 6(b) or 6(c) in the biennial report.
b Emissions and removals reported in these columns should be as reported in the latest GHG inventory and consistent with the emissions and removals reported in the table on GHG emissions
and trends provided in this biennial report. Where the sectoral breakdown differs from that reported in the GHG inventory Parties should explain in their biennial report how the inventory sectors
relate to the sectors reported in this table.
d In accordance with paragraph 34 of the “Guidelines for the preparation of national communications by Parties included in Annex I to the Convention, Part II: UNFCCC reporting guidelines on
national communications”, projections shall be presented on a sectoral basis, to the extent possible, using the same sectoral categories used in the policies and measures section. This table should
follow, to the extent possible, the same sectoral categories as those listed in paragraph 17 of those guidelines, namely, to the extent appropriate, the following sectors should be considered:
energy, transport, industry, agriculture, forestry and waste management.
e To the extent possible, the following sectors should be used: energy, transport, industry/industrial processes, agriculture, forestry/LULUCF, waste management/waste, other sectors (i.e. cross-
cutting), as appropriate.
f Parties may choose to report total emissions with or without LULUCF, as appropriate.
Norway does not report projections under a "without measures" scenario or under a “with additional measures” scenario.

42
6 PROVISION OF FINANCIAL, TECHNOLOGICAL AND CAPACITY-
BUILDING SUPPORT TO DEVELOPING COUNTRY PARTIES
6.1 Introduction
Norway provides a wide range of financial, technological and capacity-building support to
developing country Parties in order to build their capacity to reduce carbon emissions and to
take action against the negative effects of climate change. Norwegian mitigation and adaptation
support to developing countries has increased strongly over the past 10 years.
The Norwegian government uses a broad range of instruments and institutions for its
international cooperation activities in the field of climate and development:
Bilateral cooperation,
Multilateral cooperation such as the Climate Investment Funds, the Kyoto Protocol's
Adaptation Fund, the Global Environment Facility, the Forest Carbon Partnership
Facility, and UN organizations and multilateral development banks.
Our public finance is directed as investments and projects on the ground, capacity building,
technical assistance and project demonstration.
Norwegian climate finance is concentrated in three main areas; reducing emissions from
deforestation and forest degradation, clean energy and climate adaptation. Norway has also
introduced a program for “climate proofing” of all bilateral development assistance. Through
examination of development activities by Norwegian embassies, the aim is to make sure that
all assistance takes account of climate change. These examinations are carried out on the basis
of OECD`s guidelines for integration of climate change adaptation into development assistance.
Norway’s financial contribution will be elaborated in tables 7 (a-b) below, with a concise
summary in table 7. Table 7(a) provides information on public financial support through
multilateral channels. Table 7(b) provides information on public financial support through
bilateral, regional and other channels. Contributions in the area of capacity building and
technology transfer are elaborated in tables 8 and 9 in a qualitative tabular format.
Tables 7 below shows that the total Norwegian finance directed at climate change in 2014 to be
USD 967,2 million, compared to USD 1 269,6 million in 2013. The comparative decline in
2014 can be explained by the fact that remaining funds set aside for the Amazon Fund in the
Fast Start reporting period, amounting to USD 130 million in 2010 and USD 178 million in
2011, together with funding from 2012 amounting to USD 172 million, was transferred to
BNDES in 2013 and hence counted according to the OECD/DAC reporting system. The
Norwegian climate finance in 2014 is closer to the normal, but still contains a substantial
relative increase compared to 2012 and 2013.
In chapter 6.2 follows a description of Norwegian contributions and support in our three main
areas, as well as a listing of other actions.

43
Table 7: Provision of public financial support: summary information in 2013a
Year - 2013
Allocation channels Domestic currency (NOK mill)
USD (mill.)b
Core/generalc Climate-specificd Core/generalc Climate-specificd
Mitigation Adaptation Cross-
cuttinge Otherf
Mitigation Adaptation Cross-
cuttinge Otherf
Total contributions through multilateral channels: 2 755,2 365,0 25,0 1 041,3 468,7 62,1 4,3 177,2
Multilateral climate change fundsg 195,9
15,0
33,3
2,6
Of which: Other multilateral climate change fundsh 33,5
5,7
Multilateral financial institutions, including regional development banks 1 729,4 98,5 10,0 421,3 294,2 16,8 1,7 71,7
Specialized United Nations bodies 830,0 266,5
350,4 141,2 45,3
59,6
Other multilateral channels*
269,6
45,9
Total contributions through bilateral, regional and other channels
109,7 15,4 5 906,4
18,7 2,6 1 004,8
Total 2 755,2 474,7 40,4 6 947,7 468,7 80,8 6,9 1 182,0
* Other multilateral channels is added to this table by the Statistics Section of Norad. For online reporting to the UNFCCC, figures are included under Specialized United
Nations bodies due to the rigidity of the reporting system.
Abbreviation USD = United States Dollars
a Parties should fill in a separate table for each year, namely 20XX-3 and 20XX-2, where 20XX is the reporting year. b Parties should provide an explanation on methodology used for currency exchange for the information provided in table 7, 7(a), 7 (b) in the box below. c This refers to support to multilateral institutions that Parties cannot specify as being climate specific. d Parties should explain in their biennial reports how they define funds as being climate specific. e This refers to funding for activities which are cross-cutting across mitigation and adaptation. f Please specify. g Multilateral climate change funds listed in paragraph 17(a) of the «UNFCCC biennial reporting guidelines for developing country Parties” in decision 2/CP.17. h Other multilateral climate change funds as referred to in paragraph 17(b) of the « UNFCCC biennial reporting guidelines for developing country Parties” in decision 2/CP.17.
Each Party shall provide an indication of what new and additional financial resources they have provided, and clarify how they have determined that such resources are new and additional. Please provide this
information in relation to table 7(a) and 7 (b)
Documentation box: New and additional funding is drawn from the growing aid program and does not divert funds from existing development priorities or programs

44
Table 7: Provision of public financial support: summary information in 2014a
Year - 2014
Allocation channels Domestic currency (NOK mill)
USD (mill.)b
Core/generalc Climate-specificd Core/generalc Climate-specificd
Mitigatio
n Adaptation
Cross-
cuttinge Otherf
Mitigatio
n Adaptation
Cross-
cuttinge Otherf
Total contributions through multilateral channels: 2 695,6 425,9 0,0 2 352,4 427,7 67,6 - 373,3
Multilateral climate change fundsg 193,8 2,0 0,0 0,0 30,7 0,3 - -
Of which: Other multilateral climate change fundsh 35,7 0,0 0,0 0,0 5,7 - - -
Multilateral financial institutions, including regional development banks 1 721,8 182,9 0,0 1 490,0 273,2 29,0 - 236,4
Specialized United Nations bodies 780,0 241,0 0,0 262,6 123,8 38,2 - 41,7
Other multilateral channels*
599,7
95,2
Total contributions through bilateral, regional and other channels
-172,2 20,9 3 468,3
-27,3 3,3 550,4
Total 2 695,6 253,7 20,9 5 820,7 427,7 40,3 3,3 923,6
* Other multilateral channels is added to this table by the Statistics Section of Norad. For online reporting to the UNFCCC, figures are included under Specialized
United Nations bodies due to the rigidity of the reporting system.
Abbreviation USD = United States Dollars a Parties should fill in a separate table for each year, namely 20XX-3 and 20XX-2, where 20XX is the reporting year. b Parties should provide an explanation on methodology used for currency exchange for the information provided in table 7, 7(a), 7 (b) in the box below. c This refers to support to multilateral institutions that Parties cannot specify as being climate specific. d Parties should explain in their biennial reports how they define funds as being climate specific. e This refers to funding for activities which are cross-cutting across mitigation and adaptation. f Please specify. g Multilateral climate change funds listed in paragraph 17(a) of the «UNFCCC biennial reporting guidelines for developing country Parties” in decision 2/CP.17. h Other multilateral climate change funds as referred to in paragraph 17(b) of the « UNFCCC biennial reporting guidelines for developing country Parties” in decision 2/CP.17.
Each Party shall provide an indication of what new and additional financial resources they have provided, and clarify how they have determined that such resources are new and additional. Please provide this
information in relation to table 7(a) and 7 (b)
Documentation box: New and additional funding is drawn from the growing aid program and does not divert funds from existing development priorities or programs

45
6.2 Norwegian contributions and support in main areas and other actions
Norway’s International Climate and Forest Initiative
The Climate and Forest Initiative is Norway’s largest contribution to international climate
action. From the start in 2008 and up to the end of 2014, Norway has made payments totaling
about NOK 14 billion to projects under the initiative for the reductions in emissions from
deforestation and peat degradation. The Climate and Forest Initiative became part of Norway’s
climate policy after negotiations on the first cross-party agreement on climate policy, and was
launched at the Bali climate conference in 2007.
The budget for the Climate and Forest Initiative is NOK 3 billion annually. The funds are being
distributed through bilateral partnerships and multilateral collaborations and support to civil
society.
It has previously been decided that the funding as a minimum will be maintained at the current
level until 2020. At COP21 in Paris we announced that we will continue to provide finance for
REDD+ until 2030. The exact level of our contribution will depend on a number of things,
including the level of results achieved and the contributions of others – both forest countries
and their partner countries
The initiative, its goals and strategy, and activities that are in progress are further described in
the Ministry of Climate and Environment’s budget proposal for 2015 (Prop. 1 S (2014–2015)).
A comprehensive evaluation of the initiative was published in 2014, and concluded that
Norway’s work in this field has given satisfactory results in a number of areas. Good progress
has been made in reducing deforestation in several important forest countries, and the initiative
has also resulted in important (sustainable) development benefits.
REDD+ was included as a standalone article, Article 5, in the final Paris- agreement, mandating
all countries to conserve and enhance sinks and reservoirs of greenhouse gases, including
forests.
Norwegian assistance to Clean Energy
Norway has been supporting clean energy projects in developing countries for many years. In
2013 and 2014, Norway allocated approximately NOK 1.1 and 1.3 billion respectively to
renewable energy projects in developing countries through bilateral and multilateral channels.
In addition, Norfundo invest in the order of NOK 314 and 419 million in renewable energy
projects in 2013 and 2014 respectively, thus encouraging the mobilization of private capital.
o Norwegian Investment Fund for Developing Countries (Norfund) is the development finance institution that
serves as the commercial investment instrument of Norway’s development policy. Through investment in
46
Most of the funding was managed by Norwegian Embassies, the Ministry of Foreign Affairs,
Norfund and Norad. Norfund aims to promote renewable energy production as a basis for
economic growth and enhanced quality of life in developing countries. This is best done by
investing in equity, mobilizing other capital and combining this investment with expertise and
insight into the sector. Norfund’s collaboration with Norwegian energy producers such as
Statkraft, TrønderEnergi and BKK are examples of this.
Norwegian assistance to Climate Adaptation
Norwegian assistance to climate change adaptation has been scaled up in recent years, both
looking at activities for adaptation only, and when looking at activities targeting both adaptation
and mitigation. The bulk of Norway’s support for adaptation activities in developing countries
is mainly channelled through the general contributions to multilateral development institutions,
including through the UNDP and international financing institutions. Support is given to the
following main thematic areas: disaster risk reduction, food security, climate services and
agriculture.
Africa received the largest share of this support, more than 40 % of the total adaptation
expenditures in 2013 and 2014. Among countries, Ethiopia, Zambia and Malawi received the
highest amount of funding for climate change adaptation.
Other Actions
6.2.4.1 Green Climate Fund
Norway played a part in establishing the Green Climate Fund (GCF), which was formally
launched in 2011. By the beginning of 2015, the Fund had received total pledges of USD 10.2
billion, and has thus become established as the key institution for multilateral climate finance.
Norway pledged in 2014 NOK 1.6 billion in funding for the period 2015–18 and finalized the
contribution agreement with GCF in 2015. Norway co-chaired the board of GCF in 2015.
6.2.4.2 Short- lived pollutants
Norway is a partner in the Climate and Clean Air Coalition to Reduce Short-Lived Climate
Pollutants (CCAC), an international organization focusing particularly on black carbon (soot),
methane and hydrofluorocarbons (HFCs). Reducing emissions of these substances can yield a
rapid climate response and slow down global warming, thus improving the prospects of
achieving the two-degree target.
The CCAC’s aim is to promote rapid reductions in emissions through a range of initiatives,
for example targeting waste management, HFCs in products, methane emissions from oil and
gas production and black carbon emissions from heavy freight transport.
profitable companies and the transfer of knowledge and technology, it contributes to reducing poverty and to
economic progress in poor countries.

47
Since autumn 2014, Norway and Chile have been the co-chairs of the coalition. Norway
allocated NOK 27.3 million to the CCAC in 2014. Norway is also working at national level to
reduce emissions of these substances, and the Norwegian Environment Agency has published
a proposed action plan for reducing emissions of short-lived climate pollutants in Norway. On
Norway’s initiative, the Arctic Council is seeking to increase knowledge of the effects of
emissions of short-lived climate pollutants such as methane and black carbon on temperatures
in the Arctic. Norway will continue to play a leading role in promoting closer cooperation
between the Arctic countries to reduce emissions of these climate pollutants in the Arctic.
6.2.4.3 Global Environment Facility
The Norwegian government`s contribution to the Global Environment Facility (GEF) for the
GEF- 5 period was approximately USD 62.7 million and our contribution to GEF-6 is USD
87,5 million. Both in GEF-5 and GEF-6, the climate change focal area receives roughly 30 %
of GEF resources. In addition, a fast growing number of multi focal area projects and programs
are being introduced, mainly involving the focal areas of climate change, biodiversity and land
degradation. Norwegian contributions to the GEF was USD 17.72 and 21.87 million for the
years 2013 and 2014 respectively.
In the same period, contributions to the Least Developed Countries Fund (LDCF) and the
Special Climate Change Funds (SCCF), were USD 7.23 and 4.93 respectively.
Tables 7 (a) provides a summary of Norwegian financial support through multilateral channels
in the years 2013 and 2014.
6.3 Core support to multilateral institutions
Core Support to selected multilateral institutions partly or fully targeting climate change in 2013
- 2014 is presented in table 7 (a) below, but without estimates on the share of these grants
targeted for climate change in general, and to adaptation and mitigation in particular. For some,
estimates are more accurate than for others. For example, the climate change focal area of the
GEF receives around 30 % of total resources in a given GEF period. The activities of the GEF
climate funds` (LDCF and SCCF) and the UNFCCC Secretariat are specifically directed
towards climate change. It is much more difficult to estimate the exact climate share of core
support to, for example, the UNDP or the WFP.
It is also very difficult to report accurately on the percentages of core funding to multilateral
organizations devoted to mitigation and adaptation respectively. For the purpose of this report,
we have therefore decided to simply present the overall core support to those multilateral
organizations that we classify as climate relevant, in the sense that core support can be assigned
to climate change activities.

48
Table 7(a): Provision of public financial support: contribution through multilateral channels in 2013a
Total Amount
Core/generald Climate-specifice
Donor funding NOK
Million USD Million NOK Million USD Million Status
b
Fundingf
source
Financial
instrumentf Type of supportf Sectorc
2013
Multilateral climate change funds 195,9 33,3 15,0 2,6
1. Global Environment Facility 106,3 18,1 Provided ODA Grant Other Other
2. Least Developed Countries Fund 22,0 3,7 Provided ODA Grant Other Other
3. Special Climate Change Fund 15,0 2,6 Provided ODA Grant Other Other
4. Adaptation Fund 15,0 2,6 Provided ODA Grant Adaptation Other
5. Green Climate Fund
6. UNFCCC Trust Fund for Supplementary
Activities
19,0 3,2 Provided ODA Grant Other Not applicable
7. Other multilateral climate change funds 33,5 5,7
other Provided ODA Grant Cross-cutting Cross-cutting
Nordic Development Fund 33,5 5,7 Provided ODA Grant Other Not applicable
Multilateral financial institutions, including
regional development banks
1 729,4 294,2 529,8 90,1
1. World Bank 1 101,7 187,4 420,0 71,5 Provided ODA Grant Cross-cutting Cross-cutting
2. International Finance Corporation 10,0 1,7 Provided ODA Grant Adaptation Industry
3. African Development Bank 532,2 90,5 Provided ODA Grant Other Other
4. Asian Development Bank 76,7 13,0 83,0 14,1 Provided ODA Grant Mitigation Energy
5. European Bank for Reconstruction and
Development
15,2 2,6 15,5 2,6 Provided ODA Grant Mitigation Energy
6. Inter-American Development Bank 3,6 0,6 1,3 0,2 Provided ODA Grant Cross-cutting Other
7. Other
49
Specialized United Nations bodies 830,0 141,2 886,5 150,8
1. United Nations Development Programme 730,0 124,2 158,6 27,0
UNDP 730,0 124,2 158,6 27,0 Provided ODA Grant Cross-cutting Cross-cutting
2. United Nations Environment Programme 100,0 17,0 458,3 78,0
UNEP 100,0 17,0 191,8 32,6 Provided ODA Grant Cross-cutting Cross-cutting
UN-REDD 266,5 45,3 Provided ODA Grant Mitigation Other
3. Other 269,6 45,9
other 269,6 45,9 Provided ODA Grant Cross-cutting Cross-cutting
Total 2 755,2 468,7 1 431,3 243,5
Abbreviations: ODA = official development assistance, OOF = other official flows
a Parties should fill in a separate table for each year, namely 20XX-3 and 20XX-2, where 20XX is the reporting year.
b Parties should explain, in their biennial reports, the methodologies used to specify the funds as provided, committed and/or pledged. Parties will provide the information for as many status categories as possible as
appropriate in the following order of priority; provided, committed, pledged.
c Parties may select several applicable sectors. Parties may report sectoral distribution, as applicable under “Other”. Sector can be either energy, transport, industry, agriculture, forestry, water and sanitation, cross-cutting,
other or the category not applicable.
d This refers to support to multilateral institutions that Parties cannot specify as climate-specific.
e Parties should explain in their biennial reports how they define funds as being climate-specific.
f Funding source can either be ODA, OOF or Other. Financial instrument can be either Grant, Concessional loan, Non-concessional loan, Equity or Other. Type of support can be either mitigation, adaptation, cross-cutting
or other. Cross cutting refers to funding for activities which are cross-cutting across mitigation and adaptation.
50
Table 7(a): Provision of public financial support: contribution through multilateral channels in 2014a
Total Amount
Core/generald Climate-specifice
Donor funding NOK
Million USD Million NOK Million USD Million Statusb
Funding
sourcef
Financial
instrumentf Type of supportf Sectorc
2014
Multilateral climate change funds g 193,8 30,7 2,0 0,3
1. Global Environment Facility 108,0 17,1 Provided ODA Grant Other Other (other)
2. Least Developed Countries Fund 22,0 3,5 Provided ODA Grant Other Other (other)
3. Special Climate Change Fund 15,0 2,4 Provided ODA Grant Other Other (other)
4. Adaptation Fund
5. Green Climate Fund
6. UNFCCC Trust Fund for Supplementary
Activities
13,1 2,1 2,0 0,3 Provided ODA Grant Mitigation Other (General
environmental protection)
7. Other multilateral climate change funds 35,7 5,7
Nordic Development Fund 35,7 5,7 Provided ODA Grant Other Not applicable
Multilateral financial institutions, including
regional development banks
1 721,8 273,2 1 672,9 265,5
1. World Bank 1 009,6 160,2 926,8 147,1 Provided ODA Grant Cross-cutting Cross-cutting
2. International Finance Corporation 102,4 16,2 Provided ODA Grant Mitigation Energy
3. African Development Bank 624,6 99,1 Provided ODA Grant Other Not applicable
4. Asian Development Bank 83,7 13,3 80,5 12,8 Provided ODA Grant Mitigation Energy
5. European Bank for Reconstruction and Development
Provided ODA Grant Other Not applicable
6. Inter-American Development Bank 3,9 0,6 563,3 89,4 Provided ODA Grant Cross-cutting Other (General
environmental
protection)
7. Other
Specialized United Nations bodies 780,0 123,8 1 103,4 175,1
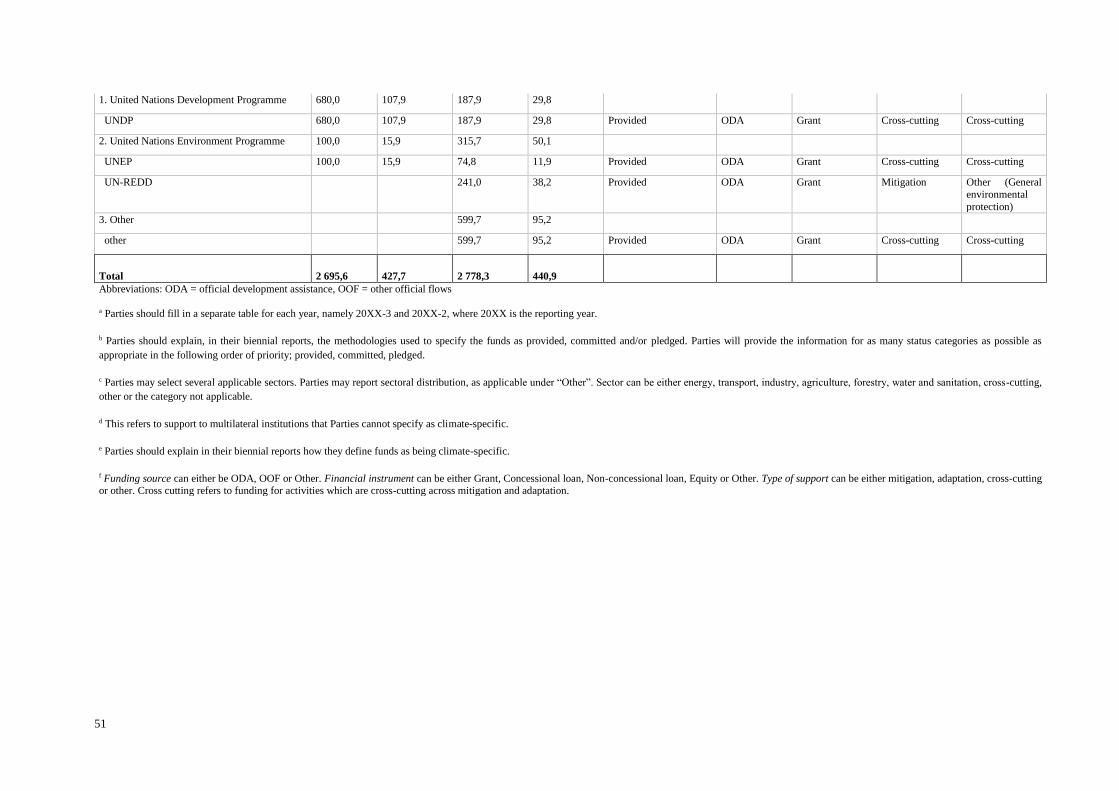
51
1. United Nations Development Programme 680,0 107,9 187,9 29,8
UNDP 680,0 107,9 187,9 29,8 Provided ODA Grant Cross-cutting Cross-cutting
2. United Nations Environment Programme 100,0 15,9 315,7 50,1
UNEP 100,0 15,9 74,8 11,9 Provided ODA Grant Cross-cutting Cross-cutting
UN-REDD 241,0 38,2 Provided ODA Grant Mitigation Other (General
environmental
protection)
3. Other 599,7 95,2
other 599,7 95,2 Provided ODA Grant Cross-cutting Cross-cutting
Total 2 695,6 427,7 2 778,3 440,9
Abbreviations: ODA = official development assistance, OOF = other official flows a Parties should fill in a separate table for each year, namely 20XX-3 and 20XX-2, where 20XX is the reporting year.
b Parties should explain, in their biennial reports, the methodologies used to specify the funds as provided, committed and/or pledged. Parties will provide the information for as many status categories as possible as
appropriate in the following order of priority; provided, committed, pledged.
c Parties may select several applicable sectors. Parties may report sectoral distribution, as applicable under “Other”. Sector can be either energy, transport, industry, agriculture, forestry, water and sanitation, cross-cutting,
other or the category not applicable.
d This refers to support to multilateral institutions that Parties cannot specify as climate-specific.
e Parties should explain in their biennial reports how they define funds as being climate-specific.
f Funding source can either be ODA, OOF or Other. Financial instrument can be either Grant, Concessional loan, Non-concessional loan, Equity or Other. Type of support can be either mitigation, adaptation, cross-cutting or other. Cross cutting refers to funding for activities which are cross-cutting across mitigation and adaptation.
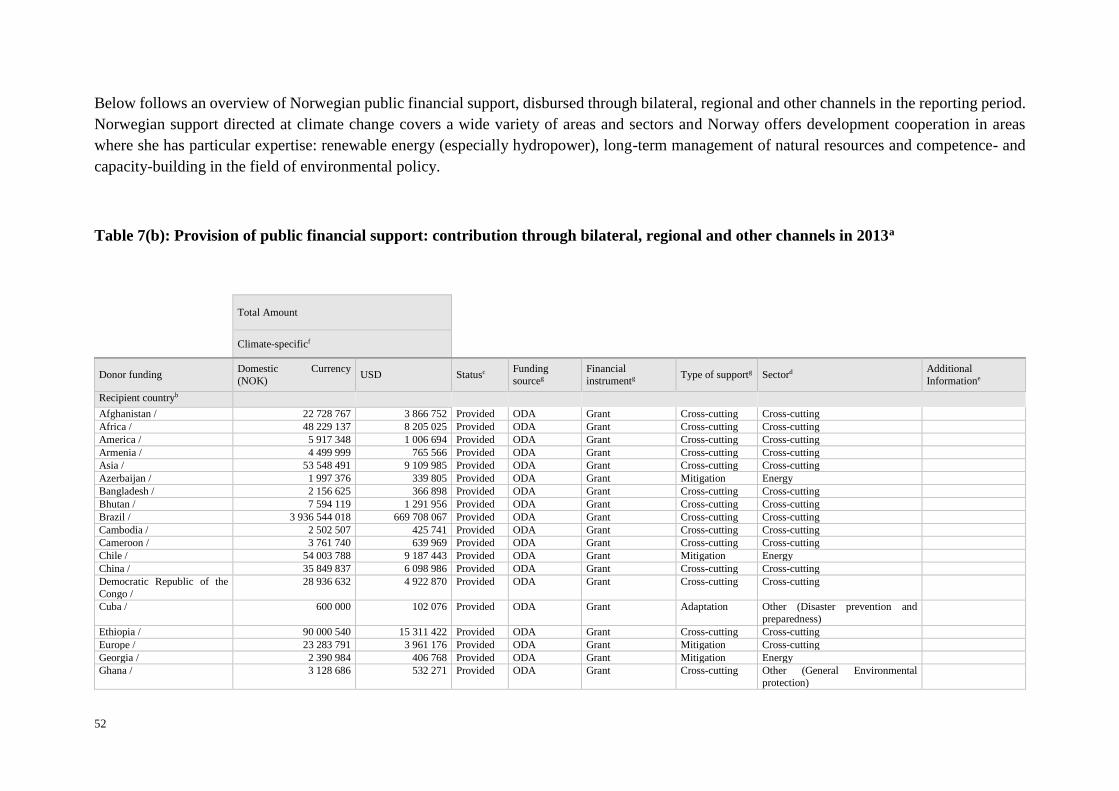
52
Below follows an overview of Norwegian public financial support, disbursed through bilateral, regional and other channels in the reporting period.
Norwegian support directed at climate change covers a wide variety of areas and sectors and Norway offers development cooperation in areas
where she has particular expertise: renewable energy (especially hydropower), long-term management of natural resources and competence- and
capacity-building in the field of environmental policy.
Table 7(b): Provision of public financial support: contribution through bilateral, regional and other channels in 2013a
Total Amount
Climate-specificf
Donor funding Domestic Currency
(NOK) USD Statusc
Funding
sourceg
Financial
instrumentg Type of supportg Sectord Additional
Informatione
Recipient countryb
Afghanistan / 22 728 767 3 866 752 Provided ODA Grant Cross-cutting Cross-cutting
Africa / 48 229 137 8 205 025 Provided ODA Grant Cross-cutting Cross-cutting
America / 5 917 348 1 006 694 Provided ODA Grant Cross-cutting Cross-cutting
Armenia / 4 499 999 765 566 Provided ODA Grant Cross-cutting Cross-cutting
Asia / 53 548 491 9 109 985 Provided ODA Grant Cross-cutting Cross-cutting
Azerbaijan / 1 997 376 339 805 Provided ODA Grant Mitigation Energy
Bangladesh / 2 156 625 366 898 Provided ODA Grant Cross-cutting Cross-cutting
Bhutan / 7 594 119 1 291 956 Provided ODA Grant Cross-cutting Cross-cutting
Brazil / 3 936 544 018 669 708 067 Provided ODA Grant Cross-cutting Cross-cutting
Cambodia / 2 502 507 425 741 Provided ODA Grant Cross-cutting Cross-cutting
Cameroon / 3 761 740 639 969 Provided ODA Grant Cross-cutting Cross-cutting
Chile / 54 003 788 9 187 443 Provided ODA Grant Mitigation Energy
China / 35 849 837 6 098 986 Provided ODA Grant Cross-cutting Cross-cutting
Democratic Republic of the
Congo /
28 936 632 4 922 870 Provided ODA Grant Cross-cutting Cross-cutting
Cuba / 600 000 102 076 Provided ODA Grant Adaptation Other (Disaster prevention and
preparedness)
Ethiopia / 90 000 540 15 311 422 Provided ODA Grant Cross-cutting Cross-cutting
Europe / 23 283 791 3 961 176 Provided ODA Grant Mitigation Cross-cutting
Georgia / 2 390 984 406 768 Provided ODA Grant Mitigation Energy
Ghana / 3 128 686 532 271 Provided ODA Grant Cross-cutting Other (General Environmental
protection)

53
Global / 500 284 297 85 111 313 Provided ODA Grant Cross-cutting Cross-cutting
Guatemala / 13 228 446 2 250 501 Provided ODA Grant Cross-cutting Cross-cutting
Guyana / 956 325 162 69 Provided ODA Grant Mitigation Other (General Environmental
protection)
Haiti / 755 826 128 586 Provided ODA Grant Adaptation Water and sanitation
India / 94 241 118 16 032 854 Provided ODA Grant Cross-cutting Cross-cutting
Indonesia / 58 766 196 9 997 652 Provided ODA Grant Cross-cutting Cross-cutting
Kazakhstan / 5 452 000 927 526 Provided ODA Grant Mitigation Cross-cutting
Kenya / 26 530 480 4 513 522 Provided ODA Grant Cross-cutting Cross-cutting
Lao People's Democratic
Republic /
2 179 312 370 757 Provided ODA Grant Cross-cutting Cross-cutting
Liberia / 134 678 611 22 912 319 Provided ODA Grant Cross-cutting Cross-cutting
Macedonia (Fyrom) / 4 258 998 724 566 Provided ODA Grant Mitigation Cross-cutting
Madagascar / 18 670 662 3 176 363 Provided ODA Grant Cross-cutting Cross-cutting
Malawi / 75 248 070 12 801 645 Provided ODA Grant Cross-cutting Cross-cutting
Malaysia / 1 982 711 337 310 Provided ODA Grant Cross-cutting Cross-cutting
Mali / 17 639 576 3 000 949 Provided ODA Grant Cross-cutting Cross-cutting
Mozambique / 73 358 397 12 480 163 Provided ODA Grant Cross-cutting Cross-cutting
Myanmar / 7 874 185 1 339 603 Provided ODA Grant Cross-cutting Not applicable
Nepal / 30 418 445 5 174 965 Provided ODA Grant Cross-cutting Cross-cutting
Nicaragua / 16 689 754 2 839 359 Provided ODA Grant Cross-cutting Cross-cutting
Niger / 8 371 236 1 424 164 Provided ODA Grant Adaptation Other (Government and civil
society)
Nigeria / 2 151 243 365 982 Provided ODA Grant Cross-cutting Cross-cutting
Pakistan / 9 203 901 1 565 822 Provided ODA Grant Cross-cutting Other (Disaster prevention and
preparedness)
Palestine / 785 903 133 702 Provided ODA Grant Adaptation Other (Disaster prevention and
preparedness)
Panama / 11 678 008 1 986 732 Provided ODA Grant Mitigation Energy
Papua New Guinea / 677 420 115 247 Provided ODA Grant Mitigation Energy
Peru / 9 598 688 1 632 985 Provided ODA Grant Cross-cutting Other (General Environmental protection)
Philippines / -5 297 405 -901 226 Provided ODA Grant Cross-cutting Cross-cutting
Serbia / 1 002 540 170 558 Provided ODA Grant Cross-cutting Cross-cutting
South Africa / 68 378 822 11 633 008 Provided ODA Grant Cross-cutting Cross-cutting
South of Sahara / 78 791 140 13 404 413 Provided ODA Grant Cross-cutting Cross-cutting
South Sudan / 30 933 333 5 262 561 Provided ODA Grant Cross-cutting Cross-cutting
Sri Lanka / 5 305 800 902 654 Provided ODA Grant Cross-cutting Cross-cutting
Tajikistan / 238 515 40 578 Provided ODA Grant Mitigation Energy
United Republic of Tanzania / 91 149 211 15 506 841 Provided ODA Grant Cross-cutting Cross-cutting
Thailand / 657 532 111 863 Provided ODA Grant Adaptation Cross-cutting
Togo / 1 558 516 265 144 Provided ODA Grant Mitigation Energy
Uganda / 146 319 532 24 892 741 Provided ODA Grant Cross-cutting Cross-cutting
Ukraine / 770 000 130 997 Provided ODA Grant Cross-cutting Other (General Environmental
protection)
Viet Nam / 7 751 461 1 318 724 Provided ODA Grant Cross-cutting Cross-cutting
Zambia / 96 307 465 16 384 394 Provided ODA Grant Cross-cutting Cross-cutting
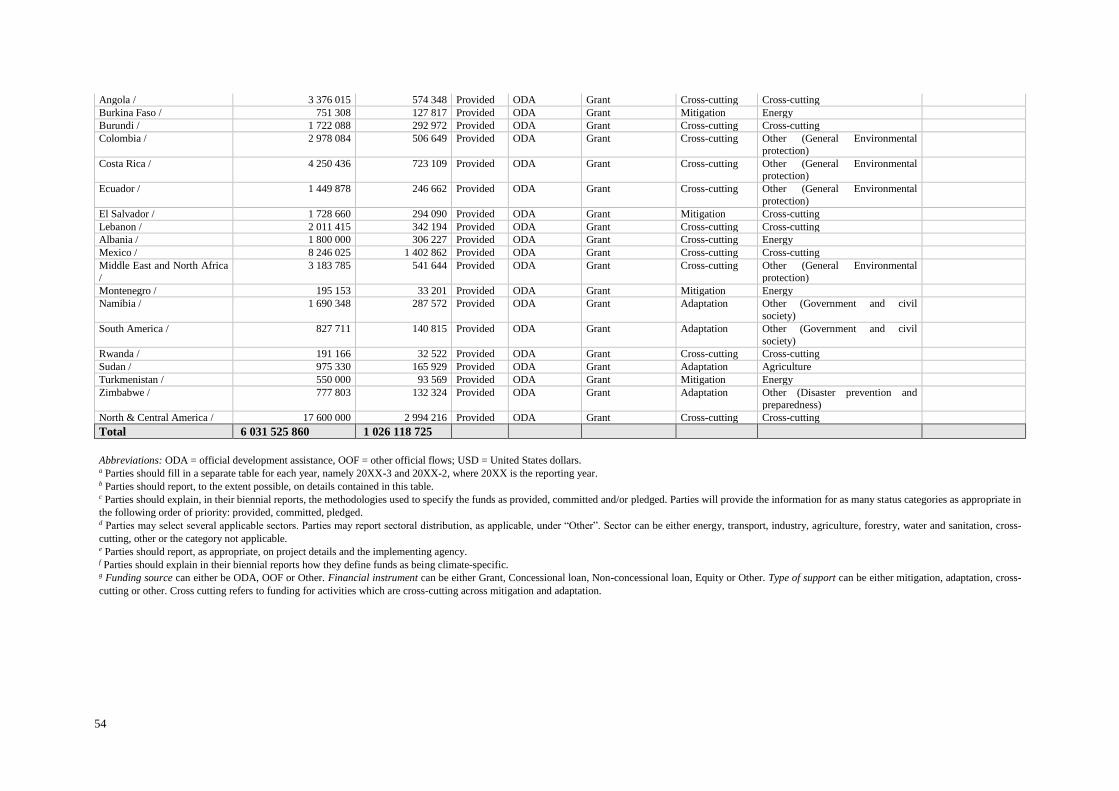
54
Angola / 3 376 015 574 348 Provided ODA Grant Cross-cutting Cross-cutting
Burkina Faso / 751 308 127 817 Provided ODA Grant Mitigation Energy
Burundi / 1 722 088 292 972 Provided ODA Grant Cross-cutting Cross-cutting
Colombia / 2 978 084 506 649 Provided ODA Grant Cross-cutting Other (General Environmental
protection)
Costa Rica / 4 250 436 723 109 Provided ODA Grant Cross-cutting Other (General Environmental protection)
Ecuador / 1 449 878 246 662 Provided ODA Grant Cross-cutting Other (General Environmental
protection)
El Salvador / 1 728 660 294 090 Provided ODA Grant Mitigation Cross-cutting
Lebanon / 2 011 415 342 194 Provided ODA Grant Cross-cutting Cross-cutting
Albania / 1 800 000 306 227 Provided ODA Grant Cross-cutting Energy
Mexico / 8 246 025 1 402 862 Provided ODA Grant Cross-cutting Cross-cutting
Middle East and North Africa
/
3 183 785 541 644 Provided ODA Grant Cross-cutting Other (General Environmental
protection)
Montenegro / 195 153 33 201 Provided ODA Grant Mitigation Energy
Namibia / 1 690 348 287 572 Provided ODA Grant Adaptation Other (Government and civil
society)
South America / 827 711 140 815 Provided ODA Grant Adaptation Other (Government and civil
society)
Rwanda / 191 166 32 522 Provided ODA Grant Cross-cutting Cross-cutting
Sudan / 975 330 165 929 Provided ODA Grant Adaptation Agriculture
Turkmenistan / 550 000 93 569 Provided ODA Grant Mitigation Energy
Zimbabwe / 777 803 132 324 Provided ODA Grant Adaptation Other (Disaster prevention and
preparedness)
North & Central America / 17 600 000 2 994 216 Provided ODA Grant Cross-cutting Cross-cutting
Total 6 031 525 860 1 026 118 725
Abbreviations: ODA = official development assistance, OOF = other official flows; USD = United States dollars. a Parties should fill in a separate table for each year, namely 20XX-3 and 20XX-2, where 20XX is the reporting year. b Parties should report, to the extent possible, on details contained in this table. c Parties should explain, in their biennial reports, the methodologies used to specify the funds as provided, committed and/or pledged. Parties will provide the information for as many status categories as appropriate in
the following order of priority: provided, committed, pledged. d Parties may select several applicable sectors. Parties may report sectoral distribution, as applicable, under “Other”. Sector can be either energy, transport, industry, agriculture, forestry, water and sanitation, cross-
cutting, other or the category not applicable. e Parties should report, as appropriate, on project details and the implementing agency. f Parties should explain in their biennial reports how they define funds as being climate-specific. g Funding source can either be ODA, OOF or Other. Financial instrument can be either Grant, Concessional loan, Non-concessional loan, Equity or Other. Type of support can be either mitigation, adaptation, cross-
cutting or other. Cross cutting refers to funding for activities which are cross-cutting across mitigation and adaptation.
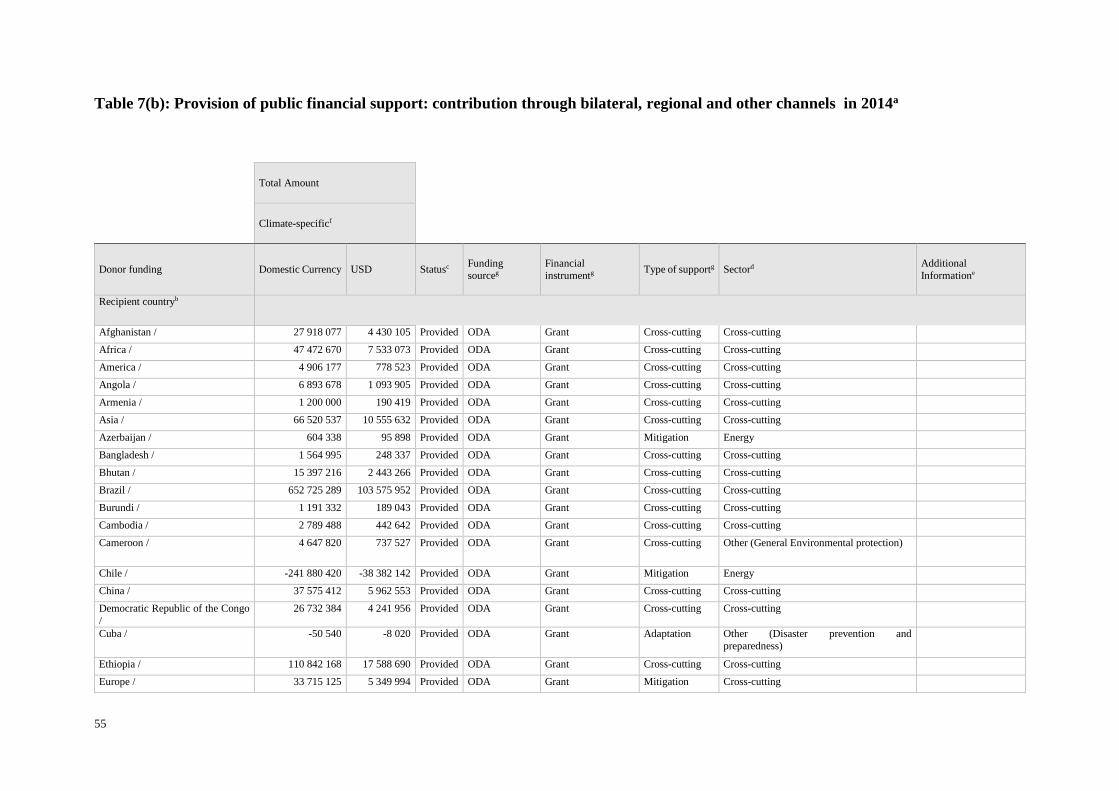
55
Table 7(b): Provision of public financial support: contribution through bilateral, regional and other channels in 2014a
Total Amount
Climate-specificf
Donor funding Domestic Currency USD Statusc Funding
sourceg
Financial
instrumentg Type of supportg Sectord Additional
Informatione
Recipient countryb
Afghanistan / 27 918 077 4 430 105 Provided ODA Grant Cross-cutting Cross-cutting
Africa / 47 472 670 7 533 073 Provided ODA Grant Cross-cutting Cross-cutting
America / 4 906 177 778 523 Provided ODA Grant Cross-cutting Cross-cutting
Angola / 6 893 678 1 093 905 Provided ODA Grant Cross-cutting Cross-cutting
Armenia / 1 200 000 190 419 Provided ODA Grant Cross-cutting Cross-cutting
Asia / 66 520 537 10 555 632 Provided ODA Grant Cross-cutting Cross-cutting
Azerbaijan / 604 338 95 898 Provided ODA Grant Mitigation Energy
Bangladesh / 1 564 995 248 337 Provided ODA Grant Cross-cutting Cross-cutting
Bhutan / 15 397 216 2 443 266 Provided ODA Grant Cross-cutting Cross-cutting
Brazil / 652 725 289 103 575 952 Provided ODA Grant Cross-cutting Cross-cutting
Burundi / 1 191 332 189 043 Provided ODA Grant Cross-cutting Cross-cutting
Cambodia / 2 789 488 442 642 Provided ODA Grant Cross-cutting Cross-cutting
Cameroon / 4 647 820 737 527 Provided ODA Grant Cross-cutting Other (General Environmental protection)
Chile / -241 880 420 -38 382 142 Provided ODA Grant Mitigation Energy
China / 37 575 412 5 962 553 Provided ODA Grant Cross-cutting Cross-cutting
Democratic Republic of the Congo
/
26 732 384 4 241 956 Provided ODA Grant Cross-cutting Cross-cutting
Cuba / -50 540 -8 020 Provided ODA Grant Adaptation Other (Disaster prevention and
preparedness)
Ethiopia / 110 842 168 17 588 690 Provided ODA Grant Cross-cutting Cross-cutting
Europe / 33 715 125 5 349 994 Provided ODA Grant Mitigation Cross-cutting

56
Georgia / 1 200 000 190 419 Provided ODA Grant Mitigation Energy
Ghana / 1 261 993 200 256 Provided ODA Grant Cross-cutting Other (General Environmental protection)
Global / 464 462 464 73 701 973 Provided ODA Grant Cross-cutting Cross-cutting
Guatemala / 40 821 796 6 477 697 Provided ODA Grant Cross-cutting Cross-cutting
Guyana / 19 962 431 3 167 685 Provided ODA Grant Cross-cutting Other (General Environmental protection)
Haiti / 4 138 889 656 768 Provided ODA Grant Cross-cutting Cross-cutting
India / 30 700 278 4 871 591 Provided ODA Grant Cross-cutting Cross-cutting
Indonesia / 62 769 622 9 960 428 Provided ODA Grant Cross-cutting Cross-cutting
Kazakhstan / 3 500 000 555 388 Provided ODA Grant Mitigation Energy
Kenya / 91 957 616 14 592 046 Provided ODA Grant Cross-cutting Cross-cutting
Lao People's Democratic Republic
/
526 984 905 83 623 178 Provided ODA Grant Cross-cutting Cross-cutting
Liberia / 193 466 544 30 699 717 Provided ODA Grant Cross-cutting Cross-cutting
Macedonia (Fyrom) / 1 974 094 313 254 Provided ODA Grant Mitigation Other (General Environmental protection)
Madagascar / 18 606 752 2 952 562 Provided ODA Grant Cross-cutting Cross-cutting
Malawi / 110 750 188 17 574 095 Provided ODA Grant Cross-cutting Cross-cutting
Malaysia / 430 431 68 302 Provided ODA Grant Cross-cutting Other (General Environmental protection)
Mali / 19 506 372 3 095 316 Provided ODA Grant Cross-cutting Cross-cutting
Mozambique / 108 883 087 17 277 819 Provided ODA Grant Cross-cutting Cross-cutting
Myanmar / 23 045 388 3 656 895 Provided ODA Grant Cross-cutting Cross-cutting
Namibia / 1 964 835 311 785 Provided ODA Grant Adaptation Other (Government and civil society)
Nepal / 14 756 320 2 341 567 Provided ODA Grant Cross-cutting Cross-cutting
Nicaragua / 13 815 770 2 192 318 Provided ODA Grant Cross-cutting Cross-cutting
Niger / 451 680 71 674 Provided ODA Grant Cross-cutting Agriculture
Nigeria / 1 989 705 315 731 Provided ODA Grant Cross-cutting Cross-cutting
North & Central America / 16 750 000 2 657 929 Provided ODA Grant Cross-cutting Cross-cutting
Pakistan / 10 372 534 1 645 938 Provided ODA Grant Cross-cutting Cross-cutting
Palestine / 1 032 745 163 878 Provided ODA Grant Adaptation Other (Government and civil society)
Panama / 22 533 720 3 575 703 Provided ODA Grant Mitigation Energy
Papua New Guinea / 854 472 135 590 Provided ODA Grant Mitigation Energy

57
Peru / -213 787 204 -33 924 246 Provided ODA Grant Cross-cutting Cross-cutting
Philippines / 341 516 453 54 192 617 Provided ODA Grant Cross-cutting Cross-cutting
Serbia / 1 157 001 183 596 Provided ODA Grant Cross-cutting Cross-cutting
Somalia / 14 240 425 2 259 703 Provided ODA Grant Adaptation Cross-cutting
South Africa / 35 812 918 5 682 876 Provided ODA Grant Cross-cutting Cross-cutting
South of Sahara / 62 840 286 9 971 641 Provided ODA Grant Cross-cutting Cross-cutting
South Sudan / 14 670 602 2 327 965 Provided ODA Grant Cross-cutting Cross-cutting
Sri Lanka / 2 619 663 415 694 Provided ODA Grant Cross-cutting Cross-cutting
Sudan / 901 707 143 085 Provided ODA Grant Adaptation Agriculture
Tajikistan / 91 525 14 523 Provided ODA Grant Cross-cutting Other (General Environmental protection)
United Republic of Tanzania / 130 249 225 20 668 247 Provided ODA Grant Cross-cutting Cross-cutting
Thailand / 1 261 364 200 156 Provided ODA Grant Cross-cutting Cross-cutting
Togo / 1 070 000 169 790 Provided ODA Grant Mitigation Energy
Uganda / 174 037 364 27 616 650 Provided ODA Grant Cross-cutting Cross-cutting
Ukraine / 3 144 198 498 929 Provided ODA Grant Mitigation Energy
Viet Nam / 12 245 838 1 943 198 Provided ODA Grant Cross-cutting Cross-cutting
Zambia / 67 188 573 10 661 637 Provided ODA Grant Cross-cutting Cross-cutting
Colombia / 5 285 452 838 708 Provided ODA Grant Cross-cutting Other (General Environmental protection)
Costa Rica / 4 227 395 670 813 Provided ODA Grant Cross-cutting Other (General Environmental protection)
Ecuador / 2 610 045 414 168 Provided ODA Grant Cross-cutting Other (General Environmental protection)
El Salvador / 1 400 648 222 258 Provided ODA Grant Cross-cutting Agriculture
Honduras / 705 166 111 897 Provided ODA Grant Cross-cutting Agriculture
Lebanon / 2 309 677 366 505 Provided ODA Grant Cross-cutting Other (Disaster prevention and
preparedness)
Mexico / 9 506 484 1 508 511 Provided ODA Grant Cross-cutting Cross-cutting
Middle East and North Africa / 3 388 079 537 628 Provided ODA Grant Cross-cutting Other (General Environmental protection)
Montenegro / 1 000 000 158 682 Provided ODA Grant Cross-cutting Cross-cutting
South America / 756 500 120 043 Provided ODA Grant Adaptation Other (Government and civil society)
Rwanda / 23 718 078 3 763 639 Provided ODA Grant Cross-cutting Cross-cutting

58
Zimbabwe / 1 810 475 287 290 Provided ODA Grant Adaptation Other (Disaster prevention and preparedness)
Lesotho / 241 707 38 355 Provided ODA Grant Mitigation Water and sanitation
Maldives / 38 300 6 078 Provided ODA Grant Adaptation Other (General Environmental protection)
Senegal / 853 000 135 356 Provided ODA Grant Mitigation Energy
Uruguay / 170 000 26 976 Provided ODA Grant Adaptation Agriculture
Total 3 316 991 321 526 347 823
Abbreviations: ODA = official development assistance, OOF = other official flows; USD = United States dollars. a Parties should fill in a separate table for each year, namely 20XX-3 and 20XX-2, where 20XX is the reporting year. b Parties should report, to the extent possible, on details contained in this table. c Parties should explain, in their biennial reports, the methodologies used to specify the funds as provided, committed and/or pledged. Parties will provide the information for as many status categories as appropriate in
the following order of priority: provided, committed, pledged. d Parties may select several applicable sectors. Parties may report sectoral distribution, as applicable, under “Other”. Sector can be either energy, transport, industry, agriculture, forestry, water and sanitation, cross-cutting, other or the category not applicable. e Parties should report, as appropriate, on project details and the implementing agency. f Parties should explain in their biennial reports how they define funds as being climate-specific. g Funding source can either be ODA, OOF or Other. Financial instrument can be either Grant, Concessional loan, Non-concessional loan, Equity or Other. Type of support can be either mitigation, adaptation, cross-
cutting or other. Cross cutting refers to funding for activities which are cross-cutting across mitigation and adaptation.
59
6.4 National approach to tracking and reporting provision of support
The main goal of Norway’s ODA is poverty reduction, equitable distribution of social and
economic goods and sustainable development. The strong inter-linkages between climate
change and development has been emphasized, and the budget for climate change adaptation
and mitigation has increased strongly over recent years. In 2006 the share of climate finance in
the overall Official Development Assistance (ODA) budget was around 2.2 per cent, which by
2014 had increased to 19 per cent. During the same period, the total ODA budget also increased
from an already high level.
Norwegian total ODA has not only exceeded 0.7 % of Gross National Income (GNI) for many
years, but oscillated around 1 % in the last few years. All our climate finance can be counted
beyond the 0.7 % threshold. Moreover, we have steadily increased the volume of our ODA
budget, as the economy has been growing, meaning that the increase in climate finance has not
reduced other ODA.
Pursuant to the UNFCCC ‘Developed country Parties shall provide new and additional financial
resources to meet the agreed full costs incurred by developing country Parties in complying
with their obligations’. ‘New and additional resources’ is a term used in many multilateral
contexts. However, there is no internationally agreed definition of what constitutes “new and
additional” resources under Article 4.3 of the Convention. One frequently used definition,
supported by many countries, is that climate financing should be additional to the international
development aid goal of 0.7% of gross national income (GNI). According to this definition,
Norway’s climate finance could be viewed as new and additional, since Norway’s ODA for
many years has exceeded the 0.7% target. Furthermore, as was underlined in the Addis Abeba
accord and the Sustainable development goals, we acknowledge the importance of taking into
account the three dimensions of sustainable development. Well-designed actions can produce
multiple local and global benefits, including those related to climate change.
Norway’s climate change finance is tracked by The Norwegian Agency for Development
Cooperation (Norad), using Norwegian Aid Statistics. The report covers our bilateral and
multilateral support for climate change action in developing countries. It should be noted that
the information is based on the OECD/DAC reporting system, which uses markers for climate
change mitigation and adaptation. The markers indicate degree of relevance only.
Consequently, the figures should be interpreted with some caution.
As there is no room for distinction between the two values main objective and significant
objective, this reporting treats them as equal. This can lead to an overestimate of climate change
funding. Hence, the figures should be interpreted as “total value of projects that fully, or to a
certain degree, target climate change mitigation and adaptation”. Despite this inherent
weakness, the methodology is applied because the policy markers are well established parts of
the international reporting system which ensures comparable information among countries, and
because it is well incorporated into the Norwegian reporting system.
It should also be noted that the term “bilateral” includes assistance through public and private
sector, as well as non-governmental organizations. The figures applied under core-support to

60
multilateral channels, refer to all un-earmarked support to the organization, regardless of its
climate change relevance.
All items in the tables are specified as provided. This means that the amounts are disbursed
during the year reported for. All numbers in this report are ODA net disbursements; non-ODA
contributions to various climate change activities are not included. The reporting period in
this Biennial Report covers the years 2013 and 2014. Funds are, as required, reported in NOK
and USD. Figures are based on an average exchange rate of (NOK- 1 USD): 2013: 5.8780 and
2014: 6.3019.
Furthermore, the predefined tables below do not give the complete picture when it comes to
distinguishing between support to climate change adaptation and mitigation. As the predefined
tables allows for one category only for each row, any contribution that could be divided between
mitigation and adaptation are reported as cross-cutting, independent of the ratio between the
two. E.g. if 90 per cent of the contributions through a multilateral organization aims at
mitigation, and the remaining 10 per cent at adaptation, the total amount is reported as cross-
cutting. Another issue should be noted regarding the bilateral support, viz. the tables below do
not reflect the total climate change support to the recipient country, as they do not include the
support through multilateral channels. This is to avoid double-counting as these contributions
are already included in the table for multilateral reporting.
While a large part of our total climate finance is allocated to REDD+ and renewable energy
programs, both of which are classified as mitigation, several REDD projects may have strong
adaptation components, since forest conservation in many cases will increase climate change
resilience. Also, renewable energy projects may promote climate change adaptation. In these
cases, both markers have been used. This has been part of a conscious effort to ensure more
consistent use of especially the adaptation marker.
It should be noted that efforts are being made, where relevant, to integrate climate change
concerns into all development efforts. This is not altogether captured in the report or in the
numbers. It is sometimes difficult to single out assistance for adaptation from more general
development assistance, which often also contributes to improving resilience to climate change.
6.5 Private Finance
Norway acknowledges that major financial investments – from both public and private sources
and guided by smart and equitable policies – are required to transition the world’s economy to
a low-carbon path, reduce greenhouse gas concentrations to safe levels, and build the resilience
of vulnerable countries to climate change. The dominant global capital flows are private, and
to be able to manage climate change it is of the utmost importance to link these flows to efforts
both to tackle climate change and to adapt to its negative effects.
Many of the efforts undertaken by Norway in the field of climate change are directed at
strengthening technical and institutional capacity to support private sector investment. The
objective being to support institutional capacity-building, the implementation of policy and

61
legal reforms and the establishment of monitoring and reporting systems, which will promote
regulatory regimes that provide incentives for commercial investment.
In addition, The Norwegian MFA, Norad and other government actors play an important
catalytic role by creating meeting places for an exchange of experience and information, for the
development of skills and expertise and also with the aim of preparing for further investment
by providing catalytic contributions.
Nevertheless, tracking private climate finance is not a straight forward undertaking. Through
the OECD Research Collaborative on Tracking Private Climate Finance, Norway, other
developed countries and several organizations have partnered to try to fill the knowledge gaps
both on the overall architecture and measurement of private climate finance flows to, between
and in developing countries, as well as on determining how developed country public
interventions mobilize private finance. The results of this endeavor might in the future help
track and attribute finance flows mobilized by public investments.
6.6 Technology Transfer
Transfer of technology and know-how in order to promote development, availability and
efficiency of energy constitutes an important element of Norwegian Official Development
Assistance (ODA) and has significant environmental co-benefits that are consistent with the
promotion of the Framework Convention on Climate Change. In addition Norway supports a
wide range of technology transfer and capacity building efforts.
Norway has been the major donor and supporter of the Climate and Technology Centre and
Network (CTCN) under the Technology mechanism of UNFCCC since the start in 2013. The
Norwegian agreement with UNEP, the host of CTCN, has now been prolonged until the end of
2017.
Norway is a member of institutions and initiatives that have the exchange of research results
and transfer of technology as a main target, e. g. the International Energy Agency and the
Climate Technology Initiative. Bilateral assistance projects are another important means for
technology transfer, often even if technology transfer is not the main target.
From a development point of view, the issue of technology is more than the act of transferring
hardware and software; it is just as much a matter of building capacity in developing countries
to receive, use and develop technology. It is therefore very much related to capacity building
as described in chapter 6.7 below.
Development cooperation has an important role to play in this context, and Norway undertakes
technology and research cooperation with significant elements of capacity development with a
number of partner countries. This integrated approach is crucial if developing countries are to
benefit from, and themselves contribute to, the development of sustainable technological
solutions adapted to their specific circumstances.

62
It is challenging to track and distinguish specific technology transfer and/or capacity- building
contributions. However, elaborate information on a selection of measures to support technology
transfer and access, supported by Norway, can be found in table 8 below.

63
Table 8: Provision of technology development and transfer support a, b
Recipient
country and
region
Targeted area Measures and activities related to
technology transfer
Sector c Source of
the funding
for
technology
transfer
Activities
undertaken
by
Status Additional
Informationd
Mitigation
Adaptation
Mitigation and
adaptation
Energy
Transport
Industry
Agriculture
Water and
sanitation
Other
Private
Public
Private and
public
Private
Public
Private and
public
Implemented
Planned
Kenya,
Bhutan,
Liberia,
Ethiopia,
Nepal, Mali,
Grenada,
Mozambique
Mitigation and
adaptation
Energy+ supports development of low-
carbon and energy sector strategies,
establish reference levels, and strengthen
technical and institutional capacity to
support private sector investment in
developing countries. In this regard it
will support the implementation of policy
and legal reforms and the establishment
of monitoring and reporting systems, and
will promote regulatory regimes that
provide incentives for commercial
investments.
Renewable
energy
Energy
efficiency
Energy access
Public Private and
public
Implemented Integrated into the
Norwegian Clean
Energy for
Development
Initiative

64
Angola,
Bhutan,
Ethiopia,
India, Liberia,
Mozambique,
Myanmar,
Nepal, South
Sudan,
Tanzania and
Uganda
Mitigation and
adaptation
The Norwegian Clean Energy for
Development Initiative contributes to
the international transfer of energy-
related technology by supporting
investment in infrastructure and clean
energy production capacity in the energy
sector of developing countries. Such
investment support is frequently
supplemented by institutional and human
resource development measures that
improve the technological expertise of
the recipient country (e.g. support to
HydroLab in Nepal).
Renewable
energy
Energy
efficiency
Energy access
Public Private and
public
Implemented
Focus on non-
Annex 1
countries
Mitigation and
adaptation
Norfund – Renewable Energy.Norfund
is the development finance institution
that serves as the commercial investment
instrument of Norway’s development
policy. Through investment in profitable
companies and the transfer of knowledge
and technology, it contributes to
reducing poverty and to economic
progress in poor countries.
Renewable
energy
Energy
efficiency
Energy access
Industry
Transport
Private and
public
Private and
public
Implemented
Focus on non-
Annex 1
countries
Mitigation Norway is one of the contributors to the
partnership Energising Development
(EnDev). EnDev - is an impact-oriented
initiative between the Netherlands,
Germany, Norway, Australia, the United
Kingdom and Switzerland. EnDev
promotes the supply of modern energy
Renewable
energy
Energy
efficiency
Public Private and
public
Implemented Norway’s
contribution to
EnDev is NOK 228
million in the period
2011-2015.
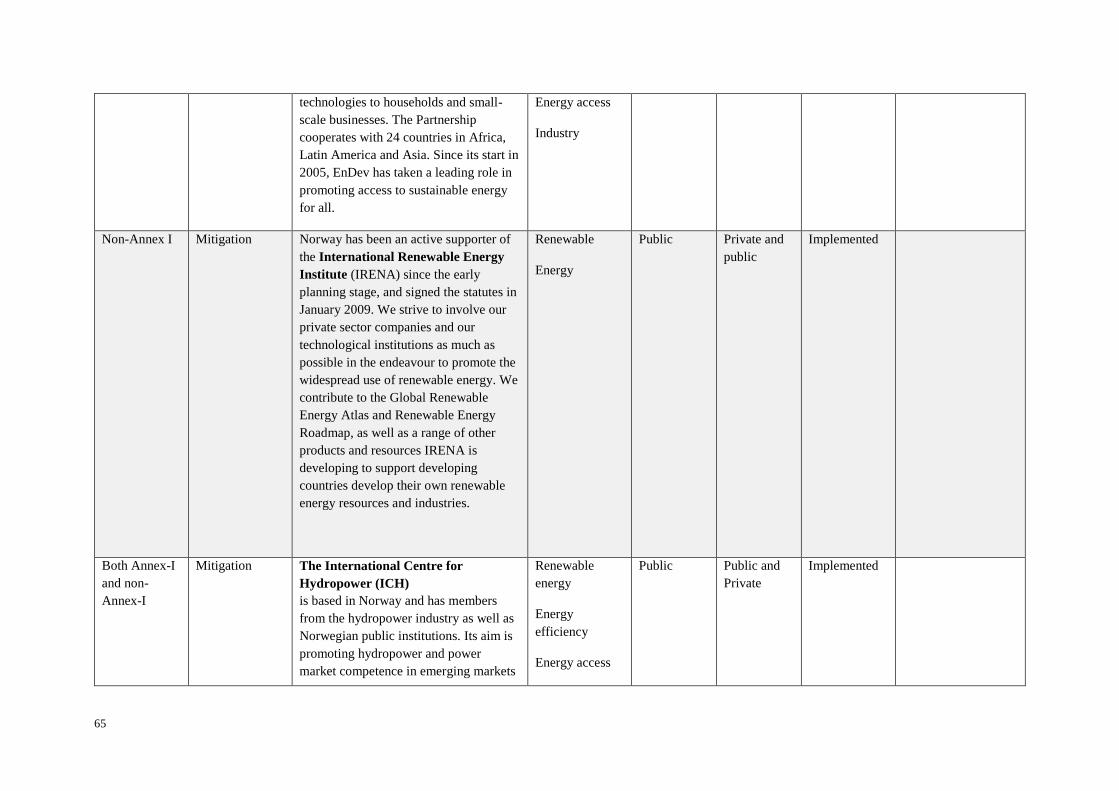
65
technologies to households and small-
scale businesses. The Partnership
cooperates with 24 countries in Africa,
Latin America and Asia. Since its start in
2005, EnDev has taken a leading role in
promoting access to sustainable energy
for all.
Energy access
Industry
Non-Annex I Mitigation Norway has been an active supporter of
the International Renewable Energy
Institute (IRENA) since the early
planning stage, and signed the statutes in
January 2009. We strive to involve our
private sector companies and our
technological institutions as much as
possible in the endeavour to promote the
widespread use of renewable energy. We
contribute to the Global Renewable
Energy Atlas and Renewable Energy
Roadmap, as well as a range of other
products and resources IRENA is
developing to support developing
countries develop their own renewable
energy resources and industries.
Renewable
Energy
Public Private and
public
Implemented
Both Annex-I
and non-
Annex-I
Mitigation The International Centre for
Hydropower (ICH)
is based in Norway and has members
from the hydropower industry as well as
Norwegian public institutions. Its aim is
promoting hydropower and power
market competence in emerging markets
Renewable
energy
Energy
efficiency
Energy access
Public Public and
Private
Implemented

66
and developing countries. Institutional
frameworks and capacity building as
well as technological transfer are central
in ICH’s programmes.
Both Annex-I
and non-
Annex-I
Mitigation Norway is a member of the Clean
Energy Ministerial (CEM). CEM is a
high-level global forum to promote
policies and programs that advance clean
energy technology, to share lessons
learned and best practices, and to
encourage the transition to a global clean
energy economy. Initiatives are based on
areas of common interest among
participating governments and other
stakeholders.
Renewable
energy
Energy
efficiency
Energy access
Public Public and
Private
Implemented The CEM is focused
on three global
climate and energy
policy goals:
Improve energy
efficiency
worldwide
Enhance clean
energy supply
Expand clean
energy access
Improving policies
and enhanced
deployment of clean
energy technologies
is the main objective.
non Annex-I Mitigation and
adaptation
The Climate Technology Initiative:
(CTI) is a multilateral cooperative
activity that supports implementation of
the UNFCCC by fostering international
cooperation for accelerated development
and diffusion of climate-friendly
technologies and practices. CTI was
originally established at the first
Conference of the Parties to the
UNFCCC in 1995. Since July 2003, CTI
Renewable
energy
Energy
efficiency
Energy access
Private and
Public
Private and
public
Implemented
Through a variety of
capacity-building
activities, CTI has
promoted technology
transfer to and
among developing
and transition
countries. In addition
to their current and
future environmental

67
has been operating under an
implementing agreement of the
International Energy Agency.
benefits, these efforts
are promoting near-
and long-term global
economic and social
stability.
Botswana,
South Africa,
China,
Kosovo,
Indonesia,
Egypt, Jordan,
Maghreb, and
Mexico
Mitigation The World Bank CCS Capacity
Building Trust Fund for developing
countries: In 2009, Norway was the
largest donor to the establishment of the
World Bank CCS Capacity Building
Trust Fund. The Fund’s purpose is to
strengthen the opportunities of
developing countries to promote
economic growth with low CO2
emissions through technology
cooperation that promotes the use of CO2
capture and storage technologies in
industry and the energy sector.
Energy
Industry
Public Public and
private
Implemented The support of NOK
113.5 million during
2009-15 (primarily
development
assistance funds),
will help to
strengthen
technology
cooperation between
industrialised
countries and
developing countries.
All Mitigation The technology centre for CO2 capture
at Mongstad: Established with the aim
of creating an arena for targeted
development, testing and qualification of
CO2 capture technologies. This in
addition to international dissemination of
the centre’s experiences and results is
important to reduce the costs and risks
associated with large-scale CO2 capture.
Energy
Industry
Private and
Public
Private and
public
Implemented
Non Annex I Mitigation The Renewable Energy and Energy
Efficiency Partnership (REEEP) is a
market catalyst for clean energy in
developing countries and emerging
Renewable
energy
Public Private and
public
Implemented Norway has been
the2nd largest donor
to the Renewable
Energy and Energy

68
markets. In this role, it acts as a funder,
information provider and connector for
up-scaling clean energy business models.
Energy
efficiency
Efficiency
Partnership (REEEP)
since 2006, and has
supported with a
total of NOK 61,5
million. REEEP has
supported 185
projects in 65
different countries.
Non Annex I Mitigation GEEREF is an innovative fund that
aims to mobilise private sector finance.
By providing new risk-sharing and
contributing to co-financing options,
GEEREF plays a role in increasing the
uptake of renewables and energy
efficiency in developing countries. The
approach is demand-driven in markets
that need more risk capital to evolve.
GEEREF's support to regional sub-funds
tailored to regional needs and conditions
stimulates these markets.
Renewable
energy
Energy
efficiency
Public Private and
public
Implemented Norway participated
in the establishment
of the Global Energy
Efficiency and
Renewable Energy
Fund (GEEREF) in
2008 together with
the European
Commission and
Germany. We have
supported GEEREF
over a period of four
years with totally
NOK 110 million.
Tanzania,
Malawi
Adaptation Global framework for climate services
adaptation in Africa. Weather services
and seasonal forecasts downscaled to
district level
Agriculture,
Health
Public Public Implemented The project is
administered by the
GFCS secretariat
located at WMO in
Geneva. NOK
60 million for the
period 2013-2016

69
Regional
Africa
Adaptation Global framework for climate services
– Adaptation and disaster risk
reduction in Africa. Building capacity
for the prediction of severe weather in
Africa. Support to meteorological
services.
Agriculture,
fisheries
Public Public Implemented Support through
WMO to regional
meteorological
offices and to the
GFCS secretariat in
Geneve.
NOK 56,8 million
for the period 2011-
2015
Regional
Africa
Adaptation Strengthening the capacity of climate
services through expert deployment
Agriculture,
fisheries, health
Public Public Implemented Support through
Norwegian Refugee
Council. Supported
by WMO and GFCS.
NOK 24, 2 mill
2015-2017
1 To be reported to the extent possible
1 The tables should include measures and activities since the last national communication or biennial report
1 Parties may report sectoral disaggregation, as appropriate.
1 Additional information may include, for example funding for technology development and transfer provided, a short description of the measure or activity and co-financing
arrangements.

70
6.7 Capacity building
Countries face a range of challenges in responding to climate change. Capacity development is
a critical factor in enabling developing countries to face up to climate change. Capacity is
required to receive financial and technology-related support for adaptation and mitigation and
to ensure that such support is sustainable.
National expertise and know-how on climate change and its effects is significant, as well as
strengthening institutions so that the countries in the longer term will themselves be able to
integrate climate change into their planning process and pursue a national climate change
policy.
The best results are achieved when capacity development is based on countries’ own needs and
priorities and is a joint learning process owned and operated nationally but taking place in
partnership. Capacity building is primarily an integral part of the programmes and projects
supported by the Norwegian MFA and Norad. The integrated approach is of key significance
as capacity cannot develop in a vacuum and is always linked to the relevant activity.
Elaborate information on a selection of capacity-building measures, supported by Norway, can
be found in table 9 below.
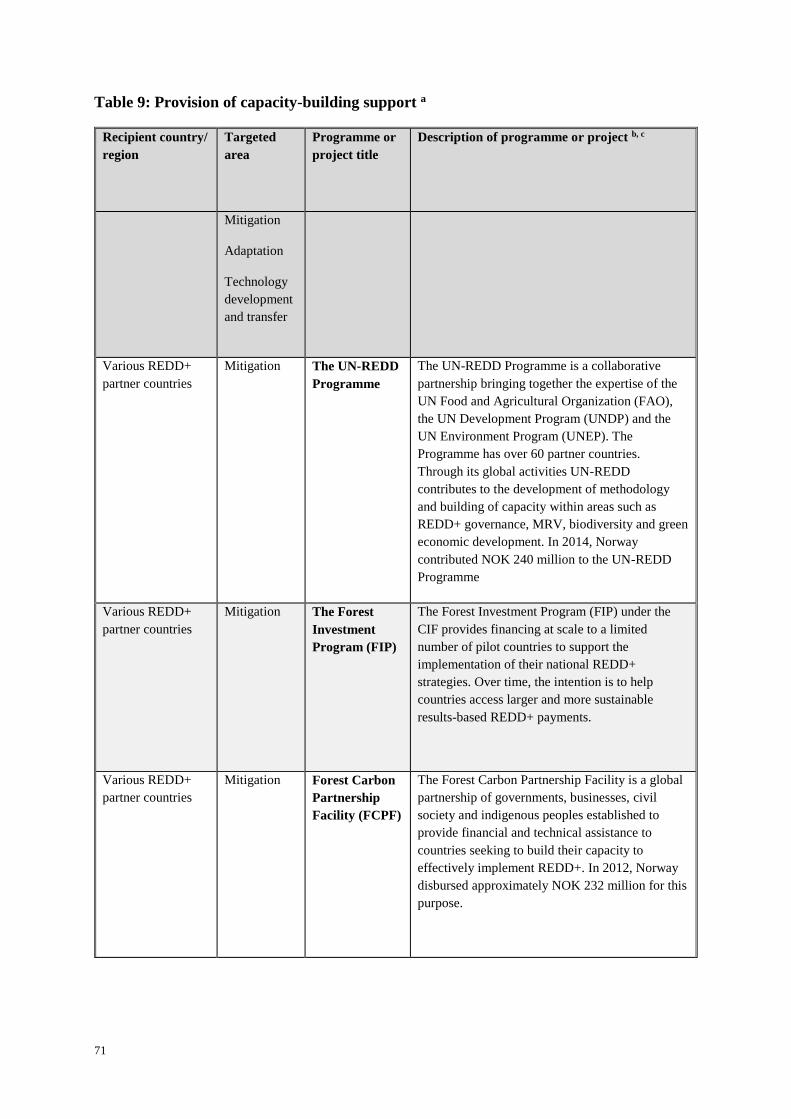
71
Table 9: Provision of capacity-building support a
Recipient country/
region
Targeted
area
Programme or
project title
Description of programme or project b, c
Mitigation
Adaptation
Technology
development
and transfer
Various REDD+
partner countries
Mitigation The UN-REDD
Programme
The UN-REDD Programme is a collaborative
partnership bringing together the expertise of the
UN Food and Agricultural Organization (FAO),
the UN Development Program (UNDP) and the
UN Environment Program (UNEP). The
Programme has over 60 partner countries.
Through its global activities UN-REDD
contributes to the development of methodology
and building of capacity within areas such as
REDD+ governance, MRV, biodiversity and green
economic development. In 2014, Norway
contributed NOK 240 million to the UN-REDD
Programme
Various REDD+
partner countries
Mitigation The Forest
Investment
Program (FIP)
The Forest Investment Program (FIP) under the
CIF provides financing at scale to a limited
number of pilot countries to support the
implementation of their national REDD+
strategies. Over time, the intention is to help
countries access larger and more sustainable
results-based REDD+ payments.
Various REDD+
partner countries
Mitigation Forest Carbon
Partnership
Facility (FCPF)
The Forest Carbon Partnership Facility is a global
partnership of governments, businesses, civil
society and indigenous peoples established to
provide financial and technical assistance to
countries seeking to build their capacity to
effectively implement REDD+. In 2012, Norway
disbursed approximately NOK 232 million for this
purpose.

72
Developing country
partners
Mitigation Partnership for
Market
Readiness
Norway is one of the contributing participants in
the World Bank Partnership for Market Readiness
(PMR). The PMR brings together most of the
world’s major market players, and consists of 28
developing and developed countries and the
European Commission. The PMR is made up of
Contributing Participants who provide financial
support to the PMR trust fund and Implementing
Country Participants who receive PMR funding.
Together, the participants have created a global
platform for discussions on new market
instruments and how best to create and build
market solutions for GHG mitigation.
Kenya, Bhutan,
Liberia, Ethiopia
and Nepal,
Mitigation
Adaptation
Technology
development
and transfer
Energy+ Energy+ will support development of low-carbon
and energy sector strategies, establish reference
levels, and strengthen technical and institutional
capacity to support private sector investment in
developing countries. In this regard it will support
the implementation of policy and legal reforms
and the establishment of monitoring and reporting
systems, and will promote regulatory regimes that
provide incentives for commercial investments.
Angola, Bhutan,
Ethiopia, Liberia,
Mozambique,
Myanmar, Nepal,
South Sudan,
Tanzania and
Uganda
Mitigation
Adaptation
The Norwegian
Clean Energy
for
Development
Initiative
The Norwegian Clean Energy for Development
Initiative contributes to the international transfer
of energy-related technology by supporting
investment in infrastructure and clean energy
production capacity in the energy sector of
developing countries. Such investment support is
frequently supplemented by institutional and
human resource development measures that
improve the technological expertise of the
recipient country.
Turkey, Georgia,
Ghana, Angola and
Mozambique
Mitigation INTPOW
(Norwegian
Renewable
Energy
Partners)
INTPOW is a public-private partnership between
three Government Ministries and Norwegian
renewable energy companies. The aim is to
promote Norwegian renewable energy competence
in international markets. INTPOW has held
capacity building activities in several countries.
Both Annex-I and
non-Annex-I
Mitigation
Adaptation
The
International
Centre for
Hydropower
The International Centre for Hydropower
(ICH)
is based in Norway and has members from the
hydropower industry as well as Norwegian public
institutions. Its aim is promoting hydropower and
power market competence in emerging markets

73
Technology
development
and transfer
(ICH)
and developing countries. Institutional frameworks
and capacity building as well as technological
transfer are central in ICH’s programmes.
Both Annex-I and
non-Annex-I
Mitigation
Technology
development
and transfer
The Clean
Energy
Ministerial
(CEM)
CEM is a high-level global forum to promote
policies and programs that advance clean energy
technology, to share lessons learned and best
practices, and to encourage the transition to a
global clean energy economy. Initiatives are based
on areas of common interest among participating
governments and other stakeholders.
The CEM is focused on three global climate and
energy policy goals:
Improve energy efficiency worldwide
Enhance clean energy supply
Expand clean energy access
Improving policies and enhanced deployment of
clean energy technologies is the main objective.
Both Annex-I and
non-Annex-I
Mitigation
Technology
development
and transfer
The Carbon
Sequestration
Leadership
Forum
The Carbon Sequestration Leadership Forum
(CSLF) has 23 member states including China,
India, South Africa, Mexico, The Republic of
Korea, Brazil, Saudi Arabia, and United Arab
Emirates; and is today one of the most important
arenas for promoting CO2 capture and storage.
The CLSF has a policy group and a technical
group.
The CSLF has established a capacity building
Fund. Norway has contributed with NOK 5
million to this Fund.
Botswana, South
Africa, China,
Kosovo, Indonesia,
Egypt, Jordan,
Maghreb, and
Mexico
Mitigation
Technology
development
and transfer
World Bank
Trust Fund on
Capacity
Building on
Carbon
Capture and
Storage in
Developing
Countries.
Norway initiated in 2009 the establishment of the
World Bank Trust Fund on Capacity Building on
Carbon Capture and Storage in Developing
Countries. Since then Norway has contributed
with NOK 113.5 million up to 2015 and has been
one of the two greatest financial contributors to
now. The trust fund has undertaken capacity
building activities in about 10 countries and
demonstration projects in two of them.

74
Both Annex-I and
non-Annex-I
Mitigation
Adaptation
Sustainable
Energy for All
(SE4All)
Norway has supported the SE4All initiative since
its launch in Oslo in 2011. Since then Norway has
contributed with NOK 30 million as well as
advisory support to the SE4All Secretariat.
Norway has recently announced additional support
to the initiative of NOK 30 million from 2016 to
2018-
Developing
countries in Africa
Mitigation Renewable
Energy
Performance
Platform
(REPP)
Norway has supported UNEP and the European
Investment Bank (EIB) in the conceptual
development of the Renewable Energy
Performance Platform (REPP). The platform aims
to mobilize support to help governments and
private actors in Africa to overcome investment
hurdles for first mover projects operating in newly
supportive policy environment.
Coastal developing
countries south of
Sahara through
FAO
Adaptation
EAF Nansen
Project
The aim of the project is to acquire knowledge
about the marine ecosystems surrounding Africa
and to assist developing countries in implementing
responsible fisheries management based on
ecosystem principles. Information about the
marine resources and environment has been
collected on a regular basis since the mid-1980-ies
for some areas. Analyses of long time series of
data provide information about variability and
effects of climate change on the marine
environment, which is useful in fisheries
management.
TAP Tanzania Adaptation Agriculture The overall Project goal is the establishment of a
public-private sector platform that provides
commercial and developmental support to
sustainable and profitable small-holder agriculture
in Tanzania.
MAP Malawi Adaptation Agriculture The overall Project goal is the establishment of a
public-private sector platform that provides
commercial and developmental support to
sustainable and profitable small-holder agriculture
in Malawi.
Comesa, EAC,
SADC Climate
Change
Adaptation,
Mitigation
Agriculture Support to scaling up climate change mitigation
and adaptation programs (Conservation
Agriculture) in agriculture in the COMESA
(Common Market for Eastern and Southern
Africa), SADC (Southern African Development
Community) and EAC (East African Community)
region. Multi donor financing program.
CFU –
Conservation
Adaptation,
Food
Agriculture Linked to the COMESA Programme on Climate
Change Mitigation and Adaptation in the ESA

75
Agricultural
Regional Program
Security,
Capacity
Building
(COMESA-EAC-SADC) Region. Focus on the
establishment of early actions in scaling up
conservation agriculture in Uganda, Malawi,
Kenya and possibly in Tanzania.
CFU Adaptation,
Food
Security,
Capacity
Building
Agriculture Support to the CFU Zambia programme to scale
up conservation agriculture in Zambia. The
programme is implemented in collaboration with
the Ministry of Agriculture
CGIAR -
Consultative Group
on International
Agricultural
Research
Adaptation,
Mitigation,
Technology
development
and transfer,
Capacity
Building
Agriculture,
Fisheries
CGIAR, research is dedicated to reducing rural
poverty, increasing food security, improving
human health and nutrition, and ensuring more
sustainable management of natural resources. It is
carried out by 15 Centers. The 15 Research
Centers generate and disseminate knowledge,
technologies, and policies for agricultural
development through 15 large development
Programs.
Global Crop
Diversity Trust –
Crop Wild
Relatives Project
(CWR)
Adaptation,
Mitigation,
Technology
development
and transfer,
Capacity
Building
Agriculture CWR- work with the wild relatives of 29 major
food crops.
The project collect CWR from the wild; evaluate
them for the useful traits; make the resulting
information widely available; provide them to
genebanks for conservation; and prepare them
(‘pre-breeding’) for use in breeding crops for new
climates. Pre-bred material is fed into ongoing,
active breeding initiatives in developing countries.
FAO
Adaptation
Climate
Change,
Fisheries and
Aquaculture
The project aims at testing methods for
vulnerability analyses related to climate, and
adaptation strategies within fisheries and fish
farming in various regions.
a To be reported to the extent possible
b Each party included in Annex II to the Convention shall provide information, to the extent possible on how it has provided capacity building
support that responds to the existing and emergency capacity-building needs identified by Parties not included in Annex I to the Convention
in the areas of mitigation, adaptation and technology development transfer.
c Additional information may be provided on, for example, the measure of activity and co-financing arrangements
76
7 OTHER REPORTING MATTERS
7.1 Process of self-assessment
The UNFCCC biennial reporting guidelines encourages Parties to report to the extent possible,
on the domestic arrangements established for the process of the self-assessment of compliance
with emission reductions in comparison with emission reduction commitments or the level of
emission reduction that is required by science.
Norway has had a quantitative emission reduction commitment for the Kyoto Protocol's first
commitment period and now has a quantitative emission reduction commitment for the Kyoto
Protocol's second commitment period. Through its annual submissions of its GHG inventory
and the review of these inventories, Norway has a sound knowledge of its emissions and
removals. Chapter 4 of our sixth National Communication shows that Norway has implemented
several policies and measures that have reduced emissions and chapter 4.1 of this BR2 presents
some of the mitigation actions implemented or planned to be implemented since 2014.
Moreover, chapter 4.4 of the BR2 explains how we have used the Kyoto mechanisms to fulfil
our commitment for the first commitment period (2008-2012) and how we plan to fulfil our
commitment for the second commitment period (2013-2020). Norway has through its
submission of the SEF tables reported the number of units transferred to its retirement account
each year.
7.2 National rules for taking local action against domestic non-compliance
The UNFCCC biennial reporting guidelines encourages Parties to report, to the extent possible,
on the progress made in the establishment of national rules for taking local action against
domestic non-compliance with emission reduction targets. In Norway’s environmental
legislation, there are provisions for enforcement of different obligations and decisions made in
accordance with the law. For more information about the Pollution Control Act and the
Greenhouse Gas Emissions Trading Act, see chapter 4.3 of NC6.
7.3 Other matters
The UNFCCC biennial reporting guidelines encourages Parties to report any other information
that the Party considers relevant to the achievement of the objective of the Convention and
suitable for inclusion in its biennial report. Norway does not have any other information to
report on this matter in its BR2.

77
LIST OF ACRONYMS
AAU Assigned Amount Unit
ASAP Automated Shipboard Aerological Programme
AWG Ad-hoc Working Group
BAT Best Available Techniques
BR Biennial Report
BRA Available area
CAEP Civil Aviation Environment Programme
CASTOR CO2 from Capture to Storage
CCAP Center for Clean Air Policy
CCS Carbon Capture and Storage
CDM Clean Development Mechanism
CER Certified Emission Reduction
CICERO Centre for International Climate and Environmental Research
CRF Common Reporting Format
CSEUR Consolidated System of European Union Registries
CTF Common Tabular Format
CTCN Climate and Technology Centre and Network
DDR Disaster Risk Reduction
DES Data Exchange Standards
ECAC European Civil Aviation Conference
ECAS European Commission Authentication Service
EEA European Economic Area
ERT Expert Review Team
ERU Emission Reduction Unit
EU European Union
EU ETS European Union Emission Trading System
EUR Euros

78
GAW Global Atmosphere Watch of WMO
GCIAR Consultative Group on International Agricultural Research
GCOS Global Climate Observing System
GDP Gross Domestic Product
GEF Global Environment Facility
GHG Greenhouse gases
GIS Gas-insulated switchgear
GNI Gross National Income
GTOS Global Terrestrial Observation System
GWP Global Warming Potential
HFC Hydrofluorcarbon
ICAO International Civil Aviation Organization
ICSU International Council for Science
IEA International Energy Agency
IEF Implied Emission Factor
IGBP International Geosphere-Biosphere Programme
IMO International Maritime Organisation
INDC Intended Nationally Determined Contribution
IPCC Intergovernmental Panel on Climate Change
ITL International Transaction Log
JCOMM Joint Technical Commission for Oceanography and Marine Meteorology
JI Joint Implementation
KP Kyoto Protocol
LDC Least Developed Countries
LDCF Least Developed Country Fund
LPG Liquefied Petroleum Gas
LULUCF Land Use and Land Use Change and Forestry
MW Megawatt
NC National Communication

79
NE Not Estimated
NEFCO Nordic Environment Finance Corporation
NFI National Forest Inventory
NFLI Norwegian Forest and Landscape Institute
NGL Natural Gas Liquids
NIBIO Norwegian Institute of Bioeconomy Research
NILU Norwegian Institute for Air Research
NIR National Inventory Report
NMVOC Non-methane Volatile Organic Compound
NOK Norwegian Kroner
NORAD Norwegian Agency for Development Cooperation
NORKLIMA Climate Change and Impacts in Norway
NOU Official Norwegian Report
NSDS National Strategy for Sustainable Development
NTP National Transport Plan
ODA Official Development Assistance
OECD Organisation for Economic Cooperation and Development
PaM Policies and Measures
PCF Prototype Carbon Fund
PDO Plans for Development and Operation
PFC Perfluorcarbon
PPCR Pilot Program for Climate Resilience
QA/QC Quality Assurance/Quality Control
REDD Reducing emissions from deforestation and forest degradation
RegClim Regional Climate Development under Global Warming
RMU Removal Unit
SCCF Special Climate Change Fund
SEF Standard Electronic Format
SD Sustainable Development

80
SPF Specific Fan Power
SWDS Solid Waste Disposal Sites
TEK Technical building regulation code
TWh Terawatt hour
UN United Nations
UNDP United Nations Development Programme
UNEP United Nations Environment Programme
UNESCO United Nations Educational, Scientific and Cultural Organization
UNFCCC United Nations Framework Convention on Climate Change
USD US Dollar
VAT Value Added Tax
VRU Vapour Recovery Unit
WCRP World Climate Research Programme
WMO World Meteorological Organization
WRI World Resources Institute

81
REFERENCES
Innst. 390 S (2011-2012). Innstilling fra energi- og miljøkomiteen om norsk klimapolitikk
Meld. St. 21 (2011-2012). White paper on Norwegian Climate Policy.
Meld. St. 13 (2014–2015) Report to the Storting (white paper). New emission commitment for
Norway for 2030 – towards joint fulfilment with the EU
Innst. 211 S (2014-2015). Innstilling fra energi- og miljøkomiteen om ny utslippsforpliktelse
for 2030 – en felles løsning med EU
Meld. St. 1 (2014-2015) Nasjonalbudsjettet 2015

82
ANNEX 1. SEF TABLE 4 PRODUCED AFTER NORWAY’S TRUE UP
Party Norway
Submission Year 2015
Reported Year 2015
Commitment Period 1
Account type
AAUs ERUs RMUs CERs tCERs lCERs
Party holding accounts 5 984 774 738 305 NO 2 249 869 NO NO
Entity holding accounts 2 590 611 6 077 656 NO 1 330 545 17 712 NO
Article 3.3/3.4 net source cancellation accounts 1 824 462 NO 9 947 523 NO
Non-compliance cancellation account NO NO NO NO
Other cancellation accounts 5 928 507 480 480 7 333 333 19 698 979 17 712 NO
Retirement account 253 134 092 2 605 670 1 824 462 9 260 279 NO NO
tCER replacement account for expiry NO NO NO NO NO
lCER replacement account for expiry NO NO NO NO
lCER replacement account for reversal of storage NO NO NO NO NO
lCER replacement account for non-submission of certification report NO NO NO NO NO
Total 269 462 446 9 902 111 19 105 318 32 539 672 35 424 NO
Table 4. Total quantities of Kyoto Protocol units by account type at end of reported year
Unit type
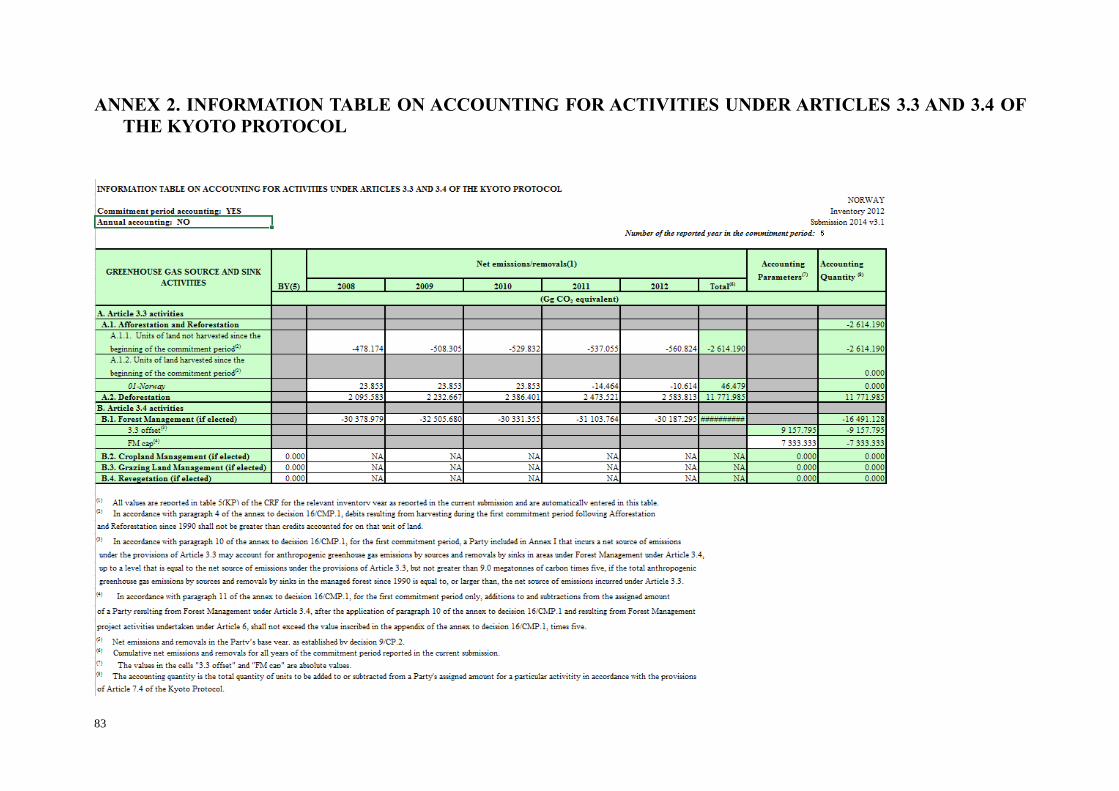
83
ANNEX 2. INFORMATION TABLE ON ACCOUNTING FOR ACTIVITIES UNDER ARTICLES 3.3 AND 3.4 OF
THE KYOTO PROTOCOL
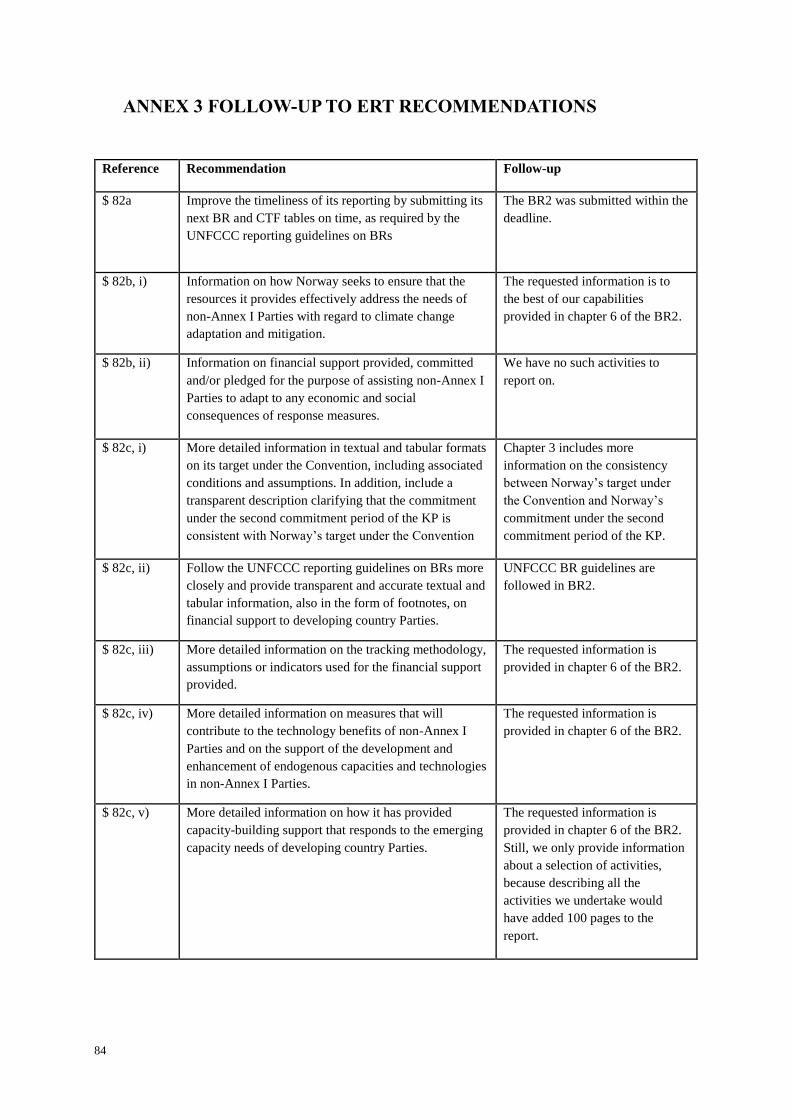
84
ANNEX 3 FOLLOW-UP TO ERT RECOMMENDATIONS
Reference Recommendation Follow-up
$ 82a Improve the timeliness of its reporting by submitting its
next BR and CTF tables on time, as required by the
UNFCCC reporting guidelines on BRs
The BR2 was submitted within the
deadline.
$ 82b, i) Information on how Norway seeks to ensure that the
resources it provides effectively address the needs of
non-Annex I Parties with regard to climate change
adaptation and mitigation.
The requested information is to
the best of our capabilities
provided in chapter 6 of the BR2.
$ 82b, ii) Information on financial support provided, committed
and/or pledged for the purpose of assisting non-Annex I
Parties to adapt to any economic and social
consequences of response measures.
We have no such activities to
report on.
$ 82c, i) More detailed information in textual and tabular formats
on its target under the Convention, including associated
conditions and assumptions. In addition, include a
transparent description clarifying that the commitment
under the second commitment period of the KP is
consistent with Norway’s target under the Convention
Chapter 3 includes more
information on the consistency
between Norway’s target under
the Convention and Norway’s
commitment under the second
commitment period of the KP.
$ 82c, ii) Follow the UNFCCC reporting guidelines on BRs more
closely and provide transparent and accurate textual and
tabular information, also in the form of footnotes, on
financial support to developing country Parties.
UNFCCC BR guidelines are
followed in BR2.
$ 82c, iii) More detailed information on the tracking methodology,
assumptions or indicators used for the financial support
provided.
The requested information is
provided in chapter 6 of the BR2.
$ 82c, iv) More detailed information on measures that will
contribute to the technology benefits of non-Annex I
Parties and on the support of the development and
enhancement of endogenous capacities and technologies
in non-Annex I Parties.
The requested information is
provided in chapter 6 of the BR2.
$ 82c, v) More detailed information on how it has provided
capacity-building support that responds to the emerging
capacity needs of developing country Parties.
The requested information is
provided in chapter 6 of the BR2.
Still, we only provide information
about a selection of activities,
because describing all the
activities we undertake would
have added 100 pages to the
report.