techne - ateneo graduate school of...
TRANSCRIPT

Cover
MANAGING THROUGH NUMBERS
Techne
ATENEO STUDENT BUSINESS REVIEW, Vol. 2, No. 1

1
ATE
NEO
STU
DEN
T B
USI
NES
S R
EVIE
W
2
ATE
NEO
STU
DEN
T B
USI
NES
S R
EVIE
W
Congratulations to the Operations Cluster for successfully publishing TECHNE II.
More than just another publication, this second edition gives us hope that
publishing quality student papers can be sustained by the Operations
Cluster on a long-term basis. I therefore would like to extend my thanks to
the students and their professors for ensuring a steady pipeline of articles
worth publishing in the TECHNE editions. Once more our students and their
professors have proven the universal application of the quantitative methods
taught in our MBA program. Regardless of the business or management
setting (musical production, BPO, relief operations, buying toys, management
of a watershed, piggery farming, or kidney donation program), these
quantitative methods are useful in arriving at efficient and effective decisions.
The applicability of these quantitative tools in different business settings
can only be matched by the variety of student-decision makers (production
assistant, CFO, doctor, electrical engineer, brand manager and others) who
have demonstrated their usefulness. Please refer to the list of contributors
on the last page of TECHNE II. These article contributors represent the varying
work experiences of students enrolled in our MBA program. They represent
the richness, depth, and cross-functional perspective in the classroom
discussions, and the group and individual work required in our MBA program.
While the curriculum, the methodology, the professors, and the classroom
environment are important elements in the learning process, the most
important are the students in our different programs. The articles written by
our students in the two TECHNE editions have highlighted this fact.
Congratulations again and more power to the Operations Cluster.
Alberto L. Buenviaje
Dean
Ateneo Graduate School of Business
Once more our students
and their professors have
proven the universal
application of the
quantitative methods
taught in our MBA
program.
Message from the Dean
Table ofContents
1 Message from the Dean
2 Message from the Operations Cluster Head
3 Message from the Editor
4 Corporate Social Responsibility at MusicArtes, Inc.
9 Workforce Scheduling at Fourier Philippines
17 Task Force Ondoy
21 An Ideal Christmas Catalog
29 Saving the Environment One Tree at a Time: Applying Quantitative Techniques to the Management of La Mesa Watershed
40 Material Requirements Planning Schedule for Argao Piggery Farms
52 Improving the Efficiency of a Kidney Donation Program in the Philippines
58 Solver Template Primer
59 Contributors

3
ATE
NEO
STU
DEN
T B
USI
NES
S R
EVIE
W
2
ATE
NEO
STU
DEN
T B
USI
NES
S R
EVIE
W
Although the articles
stretch from the mundane
to the sublime, they all
have a common thread:
a keen way of interpreting
the real world and
translating it into
mathematical models.
That’s stuff for left brains.
We are excited about this issue. Not only are we putting together excellent articles
written by our students, we see a growing appreciation for the tools learned
within the realm of Operations Management and their applications not only to
business but to professional and personal situations as well. We were introduced
to these tools in the first issue of Techne. Remember the articles then dealt with
running trains, a fast food outlet, a fitness center, a dental clinic, optimizing oil
sourcing, and planning a medical mission. Now let us give you a glimpse of what
we have chosen for this issue:
- Determining the best strategy for buying toys for Christmas with limited funds
- Finding out the least number of people to hire for a call center
- Engaging in corporate responsibility using the musical theater to raise funds
- Getting the most out of volunteerism for disaster situations such as Ondoy
- Determining our individual carbon emission level and offsetting this directly or
indirectly through tree planting
- Increasing the life expectancy of kidney patients by expanding the source for
kidney transplants beyond living donors
- Applying Material Requirements Planning at a livestock farm
Although the articles stretch from the mundane to the sublime, they all have
a common thread: a keen way of interpreting the real world and translating it
into mathematical models. That’s stuff for left brains. There is also a process
that was applied in almost all of the articles: getting the most out of something.
Management Science has a term for this — optimization.
In the midst of publishing this journal, the editorship transitioned from Joseph
(Neo) Gonzales to me. Credit ought to be given to Neo for this issue. I came in only
when the finishing touches were being done. Neo was responsible for the general
and copy edits of the journal articles. We also wish to thank Danny Barrenechea for
the photos he provided and Ivy Rose Tabangcura - Ramos for revising the content
of the article, “Material Requirements Planning at a Piggery Farm.”
Ed Legaspi
Editor
Techne: Managing through Numbers
Ateneo Graduate School of Business
Message from the Editor
Our goals in teaching
Management Science have
always been to make our
students become effective
decision makers and
for them to successfully
implement quantitative
tools and techniques in
their work and in their
daily lives.
On behalf of the Operations cluster, I am pleased to welcome our readers and
friends to the launching of this second issue of Techne!
Our goals in teaching Management Science have always been to make our
students become effective decision makers and for them to successfully
implement quantitative tools and techniques in their work and in their daily
lives.
As in the first issue, we are publishing the best projects done by our current
MBA students in the field of Management Science. These are examples of
incremental improvements in the workplace, which we expect to eventually
contribute to the overall objective of nation-building.
An additional article in this issue is an application of management techniques
in the field of Operations Management. Introducing something new and
exciting provides further stimulus to our students to do better. We believe
that the inclusion of this article in this journal will further inspire our students
to create more projects not only in Management Science but also in the field
of Operations Management.
In closing, I would like to convey my congratulations and my heartfelt
gratitude to the management and my colleagues in the Ateneo Graduate
School of Business, with very special mention of the members of our
Operations cluster, for their great efforts and fierce determination in the
publication of this journal.
Thank you again and happy reading!
Ralph Ante
Professor and
Operations Cluster Chair
Ateneo Graduate School of Business
Message from the Operations Cluster Head

5
ATE
NEO
STU
DEN
T B
USI
NES
S R
EVIE
W
4
ATE
NEO
STU
DEN
T B
USI
NES
S R
EVIE
W
MusicArtes, Inc.,1 is a privately owned production company dedicated to staging artistic and musical theater performances. Its repertoire includes concerts, dance recitals, and special concept shows for private corporate events as well as holiday festivities open to the general public. Musical genres that are featured range from Broadway to Jazz, Pop to Opera, Filipino Folk to Flamenco and World Music, Classical pieces to Contemporary collaborations. Performers are comprised of veteran stage actors, seasoned and internationally recognized classical or pop singers, a diverse array of dancers and orchestra musicians, and even young student chorales. MusicArtes, Inc. prides itself on promoting both domestic Filipino talent and global artists visiting the Philippines in wide-reaching performances that aim to encourage the appreciation of performing arts and culture by our music-loving people.
CORPORATE SOCIAL
RESPONSIBILITY AT MUSICARTES, INC.
Jolina V. Glorioso
To enjoy and appreciate art is a privilege. In an effort to boost the corporate social responsibility programs of the company and to raise social awareness within the community of artists and art patrons, the MusicArtes Board of Directors decided that the company should initiate a project that allows a percentage of its profits to be donated to several charitable institutions.
MusicArtes annually produces private shows for corporate events, and public concerts for shopping malls, especially on special holidays. In addition, the company is considering whether it would be lucrative to enter the buy-and-sell business of ticketing. The company plans to buy a block of tickets in advance for a series of Broadway musical shows scheduled for performance within the next six months. In order to sell the tickets and raise money for charity, the company intends to organize a fundraising event together with a school, NGO, or Rotary club. The program will continue every year, wherein a different charitable institution will be assisted each time. The program will be entitled “Music for Lost Angels: Help [Name of Charity].”
For the program launch, MusicArtes chose as its beneficiary Cottolengo Filipino: Bahay Para Sa May Kapansanan.
Cottolengo Filipino is a non-stock, non-profit religious and non-government organization licensed and accredited by the Department of Social Welfare and Development (DSWD). It is owned and managed by the Sons of Divine Providence Congregation founded by Saint Luigi Orione, an apostle of charity and father of the poor. Its aim is to serve the most poor, abandoned, neglected, surrendered persons with disabilities. Our mission and goal is to give our special children a home to live [in] and the possibility to be rehabilitated. To date, we are helping 85 children in two groups: 40 orphans[,] abandoned disabled children with multiple disabilities (physical and/or
mental) who live in the center. We also assist 45 poor disabled children from the nearby community who come daily to our institution to receive free special education in our SPED center and also basic medical assistance and physiotherapy. Visit Cottolengo Filipino online and see how you can help. www.cottolengofilipino.org2
The event “Music for Lost Angels: Help Cottolengo” will run for six months, so that each month a resident theater (e.g., RCBC Carlos P. Romulo Auditorium, Meralco Theater, or Onstage Greenbelt Theater) will show a different performance. The program will provide entertainment variety to the audience, similar to how cinemas feature a new movie every week. Sponsoring one night per month of any or all of these popular shows will advertise the company’s name and might generate opportunities for new business collaborations in the future via word of mouth. If the fundraiser is successful, this venture into promoting ticket sales for productions besides those of
7
ATE
NEO
STU
DEN
T B
USI
NES
S R
EVIE
W
6
ATE
NEO
STU
DEN
T B
USI
NES
S R
EVIE
W
the company will not only generate a profit but will also have an impact on the less fortunate members of society. Thirty percent of the event’s proceeds will be given to the target charity.
Project DetailsThere are five Broadway shows offering advanced block selling, each of which may be chosen for the company’s fundraiser event. The company is thinking of purchasing tickets for all the shows in order to promote a diverse entertainment selection to its audience. MusicArtes has a budget of PhP60,000.00 for the fundraiser event.
Listed is information on the shows:
Ticket Prices (PhP)
Into the Woods 1,000.00
Fame 900.00
Sweeney Todd 1,200.00
Shout 700.00
Alice in Wonderland 800.00
Show Dates
Into the Woods December 2009
Fame January 2010
Sweeney Todd February 2010
Shout March 2010
Alice in Wonderland April 2010
Number of Tickets/Seats Available (per block)
Into the Woods 60
Fame 50
Sweeney Todd 70
Shout 80
Alice in Wonderland 100
Discounts are available for block purchases or for members of Club TicketUno, a secondary market ticket exchange company similar to Ticketworld.com:
Discounts for Block Purchases/Club TicketUno Members
Into the Woods 25% (net PhP750.00)
Fame 10% (net PhP810.00)
Sweeney Todd 30% (net PhP840.00)
Shout 10% (net PhP630.00)
Alice in Wonderland 20% (net PhP640.00)
Payment Schedules
Into the Woods – full discounted amount applies if payment is made in November
Fame – 25% of original amount in November, 65% in December
Sweeney Todd – full discounted amount in December
Shout – 20% of discounted amount in January, 80% in February (20% * 90% of original amount = 18% of original amount, 80% * 90% of original amount = 72% of original amount)
Alice in Wonderland – 50% of discounted amount in February, 50% in March. (50% * 80% of original amount = 40% of original amount, 50% * 80% of original amount = 40% of original amount)
Expected Sales Schedule
Into the Woods All tickets sold by December
Fame All tickets sold by January
Sweeney Todd 60% of tickets sold in January, 40% in February
Shout 25% of tickets sold in February, 75% in March
Alice in Wonderland 50% of tickets sold in March, 50% in April
Pooled Financial Schedule
Show Nov Dec Jan Feb Mar Apr
A –0.75 * 1000 +1 * 1000
B –0.25 * 900 –0.65 * 900 +1 * 900
C –0.7 * 1200 +0.6 * 1200 +0.4 * 1200
D –0.18 * 700 (–0.72 + 0.25) * 700
+0.75 * 700
E –0.4 * 800 (+0.5 – 0.4) * 800
+0.5 * 800
A Into the Woods B Fame C Sweeney Todd D Shout E Alice in Wonderland
Resulting Equations
Let M = money
November60,000 – 750A – 225B = M1 (money available at the end of November)
December M1 + 1000A – 585B – 840C = M2 (money available at the end of December)
January M2 + 900B + 720C – 126D = M3 (money available at the end of January)
FebruaryM3 + 480C – 329D – 320E = M4 (money available at the end of February)
MarchM4 + 525D + 80E = M5 (money available at the end of March)
AprilM5 + 400E = M6 (money available at the end of April)
Tickets Available Constraints
A <= 60, B <= 50, C <= 70, D <= 80, E <= 100
The objective is to maximize M6 = cash on hand at the end of April.
SolutionThis case simplifies the typical show-buying season. The time frame has been scaled down to six months when it can very well last up to a year or more.
Solver is the appropriate tool to solve this problem. When Microsoft Excel’s Solver solves a linear model, it uses a very efficient algorithm, the simplex method, to perfom the optimization. To use Solver, one must build a model that specifies: (1) the resources to be used, equated to decision variables; (2) the limits on resource usage, called constraints; and (3) the measure to optimize, known as the objective. Solver will find values for the decision variables that satisfy the constraints while optimizing (maximizing or minimizing) the objective.
Linear programming (LP) is one of the most widely applied O.R. techniques and owes its popularity principally to George Danzig’s simplex method (Danzig 1963) and the revolution in computing. It is a very powerful technique for solving allocation problems and has become a standard tool for many businesses and organisations. Although Danzig’s simplex method allows solutions to be generated by hand, the iterative nature of producing solutions is so tedious that had the computer never been invented then linear programming would have remained an interesting academic idea, relegated to the mathematics classroom. Fortunately, computers were invented and as they have become so powerful for so little cost, linear programming has become possibly one of the most widespread uses for a personal PC.
There are of course numerous software packages which are dedicated to solving linear programs (and other types of mathematical program), of which possibly LINDO, GAMS and XPRESS-MP are the most popular. All these packages tend to be DOS based and are intended for a specialist market which requires tools dedicated to solving LPs. In recent years, however, several standard business packages, such as

9
ATE
NEO
STU
DEN
T B
USI
NES
S R
EVIE
W
8
ATE
NEO
STU
DEN
T B
USI
NES
S R
EVIE
W
To obtain maximum cash of PhP123,600.00 at the end of April, Solver recommends that the following number of tickets should be purchased per show.
Conclusion and RecommendationsFull blocks should be purchased for Into the Woods, Sweeney Todd, Shout, and Alice in Wonderland. Instead of a full block, 20 out of 50 available tickets should be purchased for Fame. Because MusicArtes, Inc. is a member of Club TicketUno, ticket purchase discounts will apply.
Because 20 tickets is insufficient to advertise as a full block of a show, MusicArtes should perhaps sell Fame tickets to a smaller audience or directly to individuals who would be interested, e.g., company employees, friends, or family who would like to watch Fame during its second season.
MusicArtes will donate 30 percent of all sales proceeds to its chosen beneficiary, Cottolengo Filipino. n
ShowNo. of Tickets to Purchase
Total Tickets Available for
Sale (per block)
Into the Woods 60 60
Fame 20 50
Sweeney Todd 70 70
Shout 80 80
Alice in Wonderland
100 100
NOTES
1. While the company featured herein is a bona fide corporation, the Broadway show titles, show dates, ticket prices, and financial budgets are not reflective of real business plans. Club TicketUno is also a fictional ticket exchange company created for the purpose of demonstrating a management science problem and solution. Cottolengo Filipino is a bona fide organization but bears no corporate ties to MusicArtes, Inc. as of present.
2. CosmEPIC, “Cottolengo Filipino – St. Luigi Orione,” Sight, August 21, 2010. http://www.health-accessories.com/cottolengo-filipino-st-luigi-orione/ (accessed August 31, 2010).
3. Ziggy MacDonald, “Teaching Linear Programming using Microsoft Excel Solver,” Cheer: Computers in Higher Education Economics Review 9 (1995): 3. www.economicsnetwork.ac.uk/cheer/ch9_3/ch9_3p07.htm (accessed August 31, 2010).
WORKFORCE SCHEDULING AT FOURIER PHILIPPINESCerissa Camelle C. Obillos
spreadsheets, have started to include an LP solving option, and Microsoft Excel is no exception. The inclusion of an LP solving capability into applications such as Excel is attractive for at least two reasons. Firstly, Excel is perhaps the most popular spreadsheet used both in business and in universities and as such is very accessible. Second to this, the spreadsheet offers very convenient data entry and editing features which allows the student to gain a greater understanding of how to construct linear programs.3
We are trying to determine quantitatively the best possible numerical combination of tickets that should be purchased from five shows (that is, purchased at a discount then resold with profit)—an optimal combination that will maximize the initial investment of PhP60,000.00 by the end of six months. Because fractions of a ticket, for example, ½ a ticket, cannot be purchased, all the variables should be integer.
Solver generates the following results:
End of Month Money Available
November PhP 10,500.00
December PhP 0.00
January PhP 58,320.00
February PhP 33,600.00
March PhP 83,600.00
April PhP123,600.00
REFERENCES
CosmEPIC. “Cottolengo Filipino – St. Luigi Orione.” In Sight, August 21, 2010. http://www.health-accessories.com/cottolengo-filipino-st-luigi-orione/ (accessed August 31, 2010).
MacDonald, Ziggy. “Teaching Linear Programming using Microsoft Excel Solver.” In Cheer: Computers in Higher Education Economics Review 9 (1995): 3. www.economicsnetwork.ac.uk/cheer/ch9_3/ch9_3p07.htm (accessed August 31, 2010).
11
ATE
NEO
STU
DEN
T B
USI
NES
S R
EVIE
W
10
ATE
NEO
STU
DEN
T B
USI
NES
S R
EVIE
W
Fourier1 is a Fortune 500 company and has more than 75,000 employees spread out in its 85 contact centers worldwide. With so many employees, Fourier needs to properly allocate its employees per day, so as to avoid being understaffed, which will hurt their service level, and to avoid being overstaffed, which will unnecessarily increase their salary cost, and decrease profits.
Fourier Corporation has helped many Filipinos by outsourcing its operations to the Philippines. It has generated jobs for thousands of Filipinos, giving them a steady source of income and allowing them to support their families, and on the macro level contributed to a healthier Philippine economy.
By outsourcing some of the jobs to Third World countries such as India and the Philippines, Fourier not only lowers its salaries and operations expenses, but on some level it also employs the Mulat Diwa culture. “Mulat Diwa is a program that attempts to install a culture that connects business to a higher purpose, thereby giving life into our value proposition: ‘The purpose of business is not only for profits but also for nation building’” (AGSB’s Mission,
n.d.). By generating jobs where they are badly needed, Fourier Corporation has contributed to the growth of the Philippine economy. The company has also contributed to the training and development of our labor force, and to the development of our infrastructure and technologies.
Fourier Corporation has given jobs to those who would normally be rejected by other companies—the disabled, the
elderly, and high school dropouts. Fourier has given them a chance to support themselves or augment their family income, and to grow and develop their skills.
Furthermore, Fourier in each of its locations is involved in different charitable and community building programs. For example, Fourier in the Philippines shares its best practices in English proficiency and training with public school teachers, administrators, and supervisors. Since 2006, the company has trained 950 teachers and has helped improve the quality of education that the teachers impart to their students.
Fourier Corporation has numerous contact centers in the Philippines, such as in Alabang, Makati, Ortigas, Laguna, and Iloilo. We will focus on Fourier Iloilo and determine its minimum required manpower per day.
ProblemFourier Iloilo needs a specific number of full-time agents to answer inbound calls every day.
There are three shifts per day: A (12:00 a.m. to 8:00 a.m.), B (8:00 a.m. to 4:00 p.m.), and C (4:00 p.m. to 12:00 a.m.). Agents are assigned to a particular shift for three months and then are rotated to a different shift. Each employee must work eight hours a day for five days. They have two days off a week, which can be inconsecutive.
We will compute for the minimum number of employees needed for the first quarter 2010.
Fourier Iloilo can’t be understaffed because it needs to maintain a certain service level. If there are more than 20 calls waiting, the center incurs a penalty of $100.00 per minute.
However, Fourier doesn’t want to put more employees on the floor than it needs in order to save on salaries expenses.
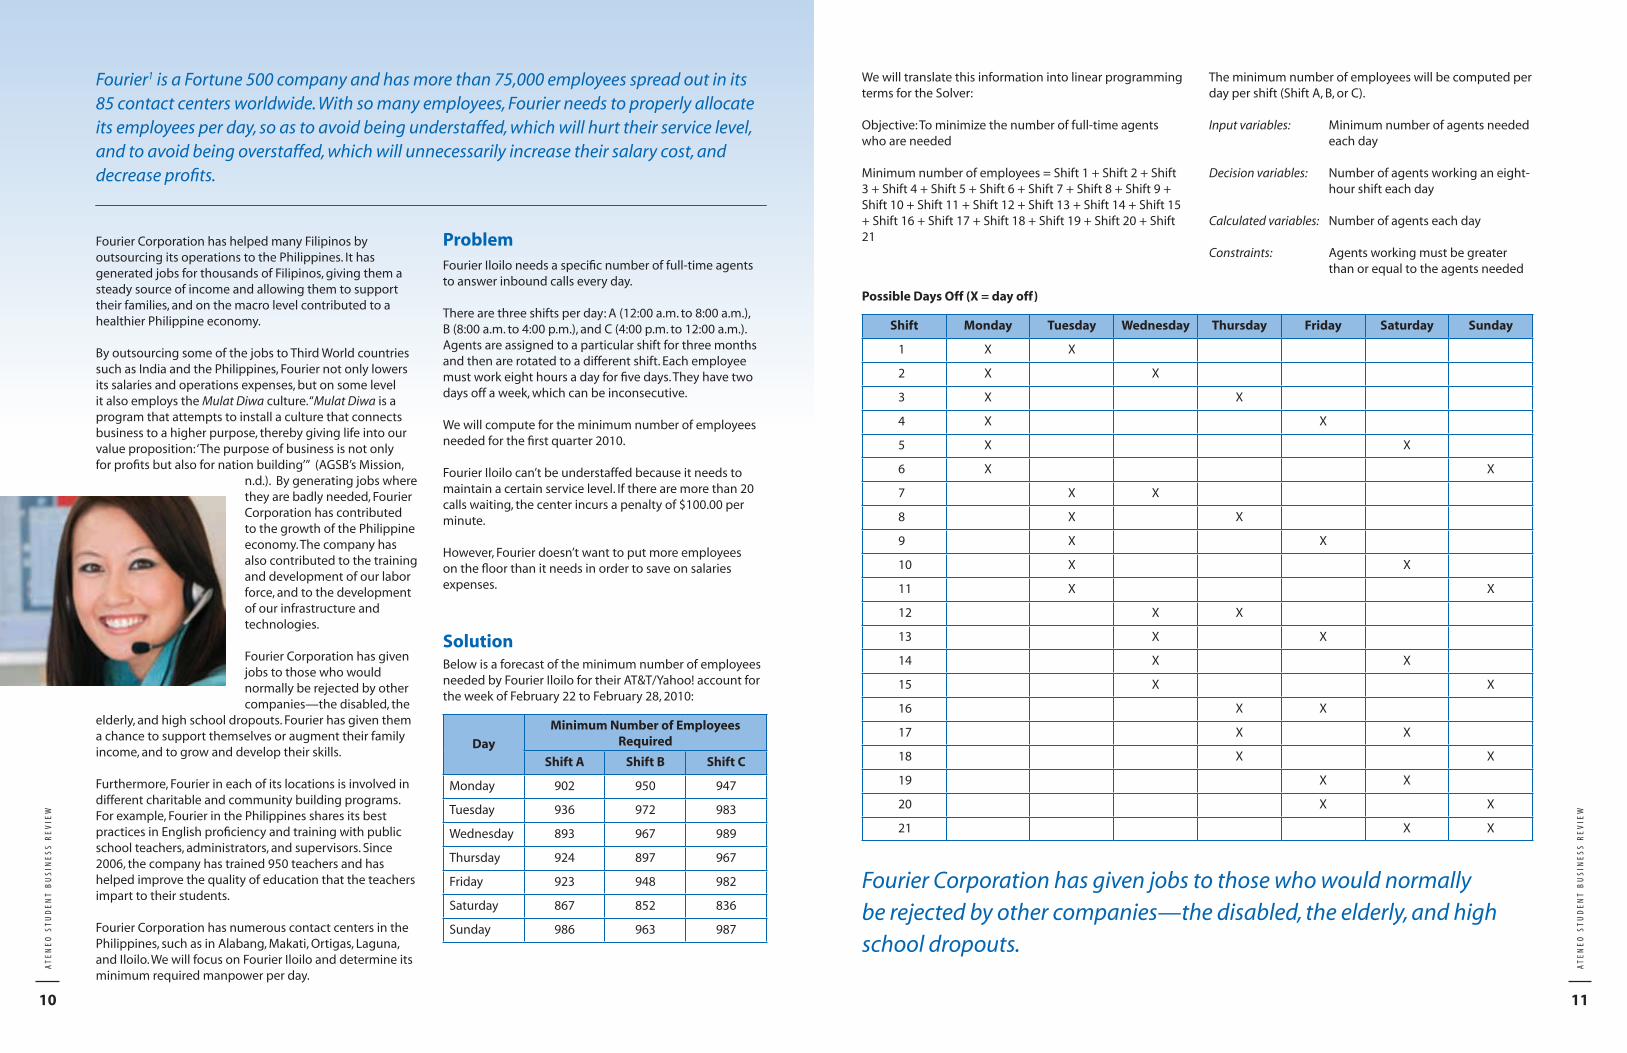
SolutionBelow is a forecast of the minimum number of employees needed by Fourier Iloilo for their AT&T/Yahoo! account for the week of February 22 to February 28, 2010:
Day
Minimum Number of Employees Required
Shift A Shift B Shift C
Monday 902 950 947
Tuesday 936 972 983
Wednesday 893 967 989
Thursday 924 897 967
Friday 923 948 982
Saturday 867 852 836
Sunday 986 963 987
Possible Days Off (X = day off)
Shift Monday Tuesday Wednesday Thursday Friday Saturday Sunday
1 X X
2 X X
3 X X
4 X X
5 X X
6 X X
7 X X
8 X X
9 X X
10 X X
11 X X
12 X X
13 X X
14 X X
15 X X
16 X X
17 X X
18 X X
19 X X
20 X X
21 X X
We will translate this information into linear programming terms for the Solver:
Objective: To minimize the number of full-time agents who are needed
Minimum number of employees = Shift 1 + Shift 2 + Shift 3 + Shift 4 + Shift 5 + Shift 6 + Shift 7 + Shift 8 + Shift 9 + Shift 10 + Shift 11 + Shift 12 + Shift 13 + Shift 14 + Shift 15 + Shift 16 + Shift 17 + Shift 18 + Shift 19 + Shift 20 + Shift 21
The minimum number of employees will be computed per day per shift (Shift A, B, or C).
Input variables: Minimum number of agents needed each day
Decision variables: Number of agents working an eight- hour shift each day
Calculated variables: Number of agents each day
Constraints: Agents working must be greater than or equal to the agents needed
Fourier Corporation has given jobs to those who would normally be rejected by other companies—the disabled, the elderly, and high school dropouts.

13
ATE
NEO
STU
DEN
T B
USI
NES
S R
EVIE
W
12
ATE
NEO
STU
DEN
T B
USI
NES
S R
EVIE
W
Shift A (12:00 a.m. to 8:00 a.m.)
Day Shifts working during the dayMinimum number of employees
Monday 7+8+9+10+11+12+13+14+15+16+17+18+19+20+21 ≥ 902
Tuesday 2+3+4+5+6+12+13+14+15+16+17+18+19+20+21 ≥ 936
Wednesday 1+3+4+5+6+8+9+10+11+16+17+18+19+20+21 ≥ 893
Thursday 1+2+4+5+6+7+9+10+11+13+14+15+19+20+21 ≥ 924
Friday 1+2+3+5+6+7+8+10+11+12+15+17+18+21 ≥ 923
Saturday 1+2+3+4+6+7+8+9+11+12+13+15+16+18+20 ≥ 867
Sunday 1+2+3+4+5+7+8+9+10+12+13+14+16+17+19 ≥ 986
Shift B (8:00 a.m. to 4:00 p.m.)
Day Shifts working during the dayMinimum number of employees
Monday 7+8+9+10+11+12+13+14+15+16+17+18+19+20+21 ≥ 950
Tuesday 2+3+4+5+6+12+13+14+15+16+17+18+19+20+21 ≥ 972
Wednesday 1+3+4+5+6+8+9+10+11+16+17+18+19+20+21 ≥ 967
Thursday 1+2+4+5+6+7+9+10+11+13+14+15+19+20+21 ≥ 897
Friday 1+2+3+5+6+7+8+10+11+12+15+17+18+21 ≥ 948
Saturday 1+2+3+4+6+7+8+9+11+12+13+15+16+18+20 ≥ 852
Sunday 1+2+3+4+5+7+8+9+10+12+13+14+16+17+19 ≥ 963
Shift C (4:00 p.m. to 12:00 a.m.)
Day Shifts working during the dayMinimum number of employees
Monday 7+8+9+10+11+12+13+14+15+16+17+18+19+20+21 ≥ 947
Tuesday 2+3+4+5+6+12+13+14+15+16+17+18+19+20+21 ≥ 983
Wednesday 1+3+4+5+6+8+9+10+11+16+17+18+19+20+21 ≥ 989
Thursday 1+2+4+5+6+7+9+10+11+13+14+15+19+20+21 ≥ 967
Friday 1+2+3+5+6+7+8+10+11+12+15+17+18+21 ≥ 982
Saturday 1+2+3+4+6+7+8+9+11+12+13+15+16+18+20 ≥ 836
Sunday 1+2+3+4+5+7+8+9+10+12+13+14+16+17+19 ≥ 987
We used Solver to determine the minimum number of employees needed per shift. We assume that they have inconsecutive days off.
For the A shift (12:00 a.m. to 8:00 a.m.), we need 1,286 employees per week:
ShiftNumber of employees
Days off
1 0 Monday, Tuesday
2 0 Monday, Wednesday
3 14 Monday, Thursday
4 0 Monday, Friday
5 70 Monday, Saturday
6 300 Monday, Sunday
7 190 Tuesday, Wednesday
8 0 Tuesday, Thursday
9 160 Tuesday, Friday
10 0 Tuesday, Saturday
11 0 Tuesday, Sunday
12 0 Wednesday, Thursday
13 203 Wednesday, Friday
14 0 Wednesday, Saturday
15 0 Wednesday, Sunday
16 0 Thursday, Friday
17 349 Thursday, Saturday
18 0 Thursday, Sunday
19 0 Friday, Saturday
20 0 Friday, Sunday
21 0 Saturday, Sunday
Total 1286
For the B shift (8:00 a.m. to 4:00 p.m.), we need 1,310 employees per week:
Shift Number of employees
Days off
1 0 Monday, Tuesday
2 0 Monday, Wednesday
3 331 Monday, Thursday
4 0 Monday, Friday
5 29 Monday, Saturday
6 0 Monday, Sunday
7 160 Tuesday, Wednesday
8 0 Tuesday, Thursday
9 178 Tuesday, Friday
10 0 Tuesday, Saturday
11 0 Tuesday, Sunday
12 0 Wednesday, Thursday
13 183 Wednesday, Friday
14 0 Wednesday, Saturday
15 0 Wednesday, Sunday
16 0 Thursday, Friday
17 82 Thursday, Saturday
18 0 Thursday, Sunday
19 0 Friday, Saturday
20 0 Friday, Sunday
21 347 Saturday, Sunday
Total 1310

15
ATE
NEO
STU
DEN
T B
USI
NES
S R
EVIE
W
14
ATE
NEO
STU
DEN
T B
USI
NES
S R
EVIE
W
Possible Days Off (X = day off)
Shift Monday Tuesday Wednesday Thursday Friday Saturday Sunday
1 X X
2 X X
3 X X
4 X X
5 X X
6 X X
7 X X
However, because agents don’t like having inconsecutive days off, management would like to know if they can grant their agents two consecutive days off without incurring additional costs. Management would like to find out the minimum number of agents needed per day, given the constraints that agents have two consecutive days off and the center meets the same manpower requirement.
Day Minimum Number of Employees
Shift A Shift B Shift C
Monday 902 950 947
Tuesday 936 972 983
Wednesday 893 967 989
Thursday 924 897 967
Friday 923 948 982
Saturday 867 852 836
Sunday 986 963 987
We express the problem in linear programming terms for the Solver:
Objective: To minimize the number of full-time agents who will come in.
Minimum number of employees = Shift 1 + Shift 2 + Shift 3 + Shift 4 + Shift 5 + Shift 6 + Shift 7
The minimum number of employees will be computed per day per shift (Shift A, B, or C).
Input variables: Minimum number of agents needed each day
Decision variables: Number of agents working an eight- hour shift each day
Calculated variables: Number of agents each day
Constraints: Agents working must be greater than or equal to the agents needed
For the C shift (4:00 p.m. to 12:00 a.m.), we need 1,338 employees per week:
Shift Number of employees
Days off
1 0 Monday, Tuesday
2 333 Monday, Wednesday
3 0 Monday, Thursday
4 0 Monday, Friday
5 0 Monday, Saturday
6 58 Monday, Sunday
7 0 Tuesday, Wednesday
8 355 Tuesday, Thursday
9 0 Tuesday, Friday
10 0 Tuesday, Saturday
11 0 Tuesday, Sunday
12 16 Wednesday, Thursday
13 0 Wednesday, Friday
14 0 Wednesday, Saturday
15 0 Wednesday, Sunday
16 0 Thursday, Friday
17 0 Thursday, Saturday
18 0 Thursday, Sunday
19 283 Friday, Saturday
20 74 Friday, Sunday
21 220 Saturday, Sunday
Total 1338
Shift A (12:00 a.m. to 8:00 a.m.)
Day Shifts working during the day
Minimum number of employees
Monday 2+3+4+5+6 ≥ 902
Tuesday 3+4+5+6+7 ≥ 936
Wednesday 1+4+5+6+7 ≥ 893
Thursday 1+2+5+6+7 ≥ 924
Friday 1+2+3+6+7 ≥ 923
Saturday 1+2+3+4+7 ≥ 867
Sunday 1+2+3+4+5 ≥ 986
Shift B (8:00 a.m. to 4:00 p.m.)
Day Shifts working during the day
Minimum number of employees
Monday 2+3+4+5+6 ≥ 950
Tuesday 3+4+5+6+7 ≥ 972
Wednesday 1+4+5+6+7 ≥ 967
Thursday 1+2+5+6+7 ≥ 897
Friday 1+2+3+6+7 ≥ 948
Saturday 1+2+3+4+7 ≥ 852
Sunday 1+2+3+4+5 ≥ 963
Shift C (4:00 p.m. to 12:00 a.m.)
Day Shifts working during the day
Minimum number of employees
Monday 2+3+4+5+6 ≥ 947
Tuesday 3+4+5+6+7 ≥ 983
Wednesday 1+4+5+6+7 ≥ 989
Thursday 1+2+5+6+7 ≥ 967
Friday 1+2+3+6+7 ≥ 982
Saturday 1+2+3+4+7 ≥ 836
Sunday 1+2+3+4+5 ≥ 987
Since 2006, the company has trained 950 teachers and has helped
improve the quality of education that the teachers impart to their
students.

17
ATE
NEO
STU
DEN
T B
USI
NES
S R
EVIE
W
16
ATE
NEO
STU
DEN
T B
USI
NES
S R
EVIE
W
We used Solver to determine the minimum number of employees needed per shift, given the constraint that they have two consecutive days off.
For the A shift (12:00 a.m. to 8:00 a.m.), we need 1,285 employees per week:
Shift Number of Employees
Days off
1 229 Monday, Tuesday
2 120 Tuesday, Wednesday
3 273 Wednesday, Thursday
4 90 Thursday, Friday
5 273 Friday, Saturday
6 144 Saturday, Sunday
7 156 Sunday, Monday
Total 1285
For the B shift (8:00 a.m. to 4:00 p.m.), we need 1,309 employees per week:
Shift Number of employees
Days off
1 258 Monday, Tuesday
2 79 Tuesday, Wednesday
3 264 Wednesday, Thursday
4 150 Thursday, Friday
5 211 Friday, Saturday
6 244 Saturday, Sunday
7 103 Sunday, Monday
Total 1309
For the C shift (4:00 p.m. to 12:00 a.m.), we need 1,337 employees per week:
Shift Number of employees
Days off
1 280 Monday, Tuesday
2 74 Tuesday, Wednesday
3 275 Wednesday, Thursday
4 97 Thursday, Friday
5 260 Friday, Saturday
6 239 Saturday, Sunday
7 112 Sunday, Monday
Total 1337
Suppose that the salary of a call center agent at Fourier Iloilo is PhP20,000.00 a month or PhP5,000.00 a week. If the center allows its employees to have two consecutive days off and no inconsecutive days off, it will reduce its employee headcount by one person per shift. As a result it will save PhP5,000.00 per shift per week (A, B, and C) or a total of PhP15,000.00 per week.
Inconsecutive days off can take a physical toll, especially on those who work at night. When employees are granted two consecutive days off, they have more time to rest and recover, which reduces sick leaves, absences, and tardiness. Allowing employees to have two consecutive days off improves their morale, productivity, and loyalty. n
TASK FORCE ONDOYNikki Rose M. Lee
Allowing employees to have two consecutive days off improves their morale, productivity, and loyalty
NOTES
1. Name has been disguised.
REFERENCES
AGSB’s Mission & Identity, (n.d.). In Ateneo Graduate School ofBusiness website. http://gsb.ateneo.edu/index.php?p=464(accessed March 13, 2010).

19
ATE
NEO
STU
DEN
T B
USI
NES
S R
EVIE
W
18
ATE
NEO
STU
DEN
T B
USI
NES
S R
EVIE
W
Typhoon Ondoy (international code name Ketsana) made its landfall in the Philippines on September 26, 2009, releasing 34.1 centimeters of rain—a month’s worth—within a span of just six hours. The heavy rain triggered the worst flooding the Philippines had seen in over four decades, submerging most of Metro Manila, Rizal, and Laguna, killing approximately 246 people, and displacing thousands more. Although the water had receded three days after the calamity, it left behind lost lives and ruined homes. Since the scale of damage exceeded expectations, rescue organizations had difficulty coping with the challenges. Resources for rescue operations were insufficient or unavailable. For a country that is visited by almost 40 typhoons a year, the lack of disaster-preparedness was revealed. However, if there’s anything positive that surfaced from the calamity, it was the spirit of volunteerism among Filipinos.
Volunteerism is working on behalf of others without being motivated by financial or material gain. Volunteerism is generally considered an altruistic activity intended to promote good or improve quality of life. Many volunteers are trained in specific areas while others volunteer on an as-needed basis.1
As Typhoon Ondoy spared no one, rich and poor alike, it also brought out the altruistic spirit in everyone, regardless of status, age, gender, or other demographics. Filipinos from all walks of life volunteered their time, skills, money, and experience to help out those in need.
Volunteerism may be equated to the Filipino’s sense of bayanihan, defined as “a spirit of communal unity or effort to achieve a particular objective.”2 Bayanihan is related to the word, bayani, which means hero. Typhoon Ondoy elicited the desire of Filipinos to be heroes to one another.
It was volunteerism and bayanihan that motivated several organizations to put together relief operations to help the victims of Typhoon Ondoy. One such organization was Sanggunian, the student council of the Ateneo de Manila University. Aided by some Jesuit organizations, Sanggunian launched “Task Force Ondoy.” The relief center of Task Force Ondoy was located in the college covered courts at the Ateneo de Manila Loyola Heights campus.
Task Force Ondoy witnessed thousands of donations in cash and kind pour in. Hundreds of volunteers—students and non-students alike—signed up to help in the relief operations.
ProblemTask Force Ondoy’s relief operations accepted volunteers to pack relief goods. Operations ran from 9:00 a.m. to 9:00 p.m. daily.
It took approximately three minutes for a single volunteer to put together a relief package. Based on historical data, this amount of time did not only involve packing but all related activities, such as unloading delivery trucks, unpacking boxes, segregating goods, and loading trucks, among others.
Therefore, the estimated work rate was three minutes per package per person or 20 packages per person per hour.
The total number of packages completed in an hour was 20 multiplied by the total number of volunteers working.
Every hour a truck arrived to deliver unsorted relief goods and to leave immediately with all the relief packages.
Based on availability of resources, the ideal quotas per hour were as follows:
Shift Quota
9:00 – 10:00 a.m. 300
10:00 – 11:00 a.m. 450
11:00 – 12:00 p.m. 600
12:00 – 1:00 p.m. 900
1:00 – 2:00 p.m. 1000
2:00 – 3:00 p.m. 1050
3:00 – 4:00 p.m. 1100
4:00 – 5:00 p.m. 950
5:00 – 6:00 p.m. 1000
6:00 – 7:00 p.m. 1100
7:00 – 8:00 p.m. 1000
8:00 – 9:00 p.m. 600
All packages in excess of the quotas were picked up by the truck so that no packages were left after every hour.
Volunteers, mostly students, would arrive by 9:00 a.m. Because they had to be briefed, they could start working by 10:00 a.m. only.
Paid workers were also available, borrowed from a local barangay. They worked from 9:00 a.m. to 5:00 p.m. with a lunch break from 12:00 p.m. to 1:00 p.m. They were paid PhP385.00 per day, the minimum wage.
Volunteers worked for only three hours at a time. They did not get a lunch break and could work until 9:00 p.m.
They were given food depending on the time they started working. They were allowed to claim their food packs after the volunteer shifts.
Volunteers who started at 10:00 a.m. or 11:00 a.m. got a packed lunch costing not more than PhP85.00. Volunteers who started at 4:00 p.m., 5:00 p.m., or 6:00 p.m. got a packed dinner costing not more than PhP95.00. Volunteers who started at 12:00 p.m., 1:00 p.m., 2:00 p.m., or 3:00 p.m. got snacks costing PhP30.00.
The last three-hour shift of the day started at 6:00 p.m. and lasted until 9:00 p.m. The last two shifts, 7:00 p.m. and 8:00 p.m., took two hours and one hour each, respectively. The shift schedule is shown in the table below.
Shift 1 9:00 a.m. – 5:00 p.m.
Shift 2 10:00 a.m. – 1:00 p.m.
Shift 3 11:00 a.m. – 2:00 p.m.
Shift 4 12:00 a.m. – 3:00 p.m.
Shift 5 1:00 p.m. – 4:00 p.m.
Shift 6 2:00 p.m. – 5:00 p.m.
Shift 7 3:00 p.m. – 6:00 p.m.
Shift 8 4:00 p.m. – 7:00 p.m.
Shift 9 5:00 p.m. – 8:00 p.m.
Shift 10 6:00 p.m. – 9:00 p.m.
Shift 11 7:00 p.m. – 9:00 p.m.
Shift 12 8:00 p.m. – 9:00 p.m.
21
ATE
NEO
STU
DEN
T B
USI
NES
S R
EVIE
W
20
ATE
NEO
STU
DEN
T B
USI
NES
S R
EVIE
W
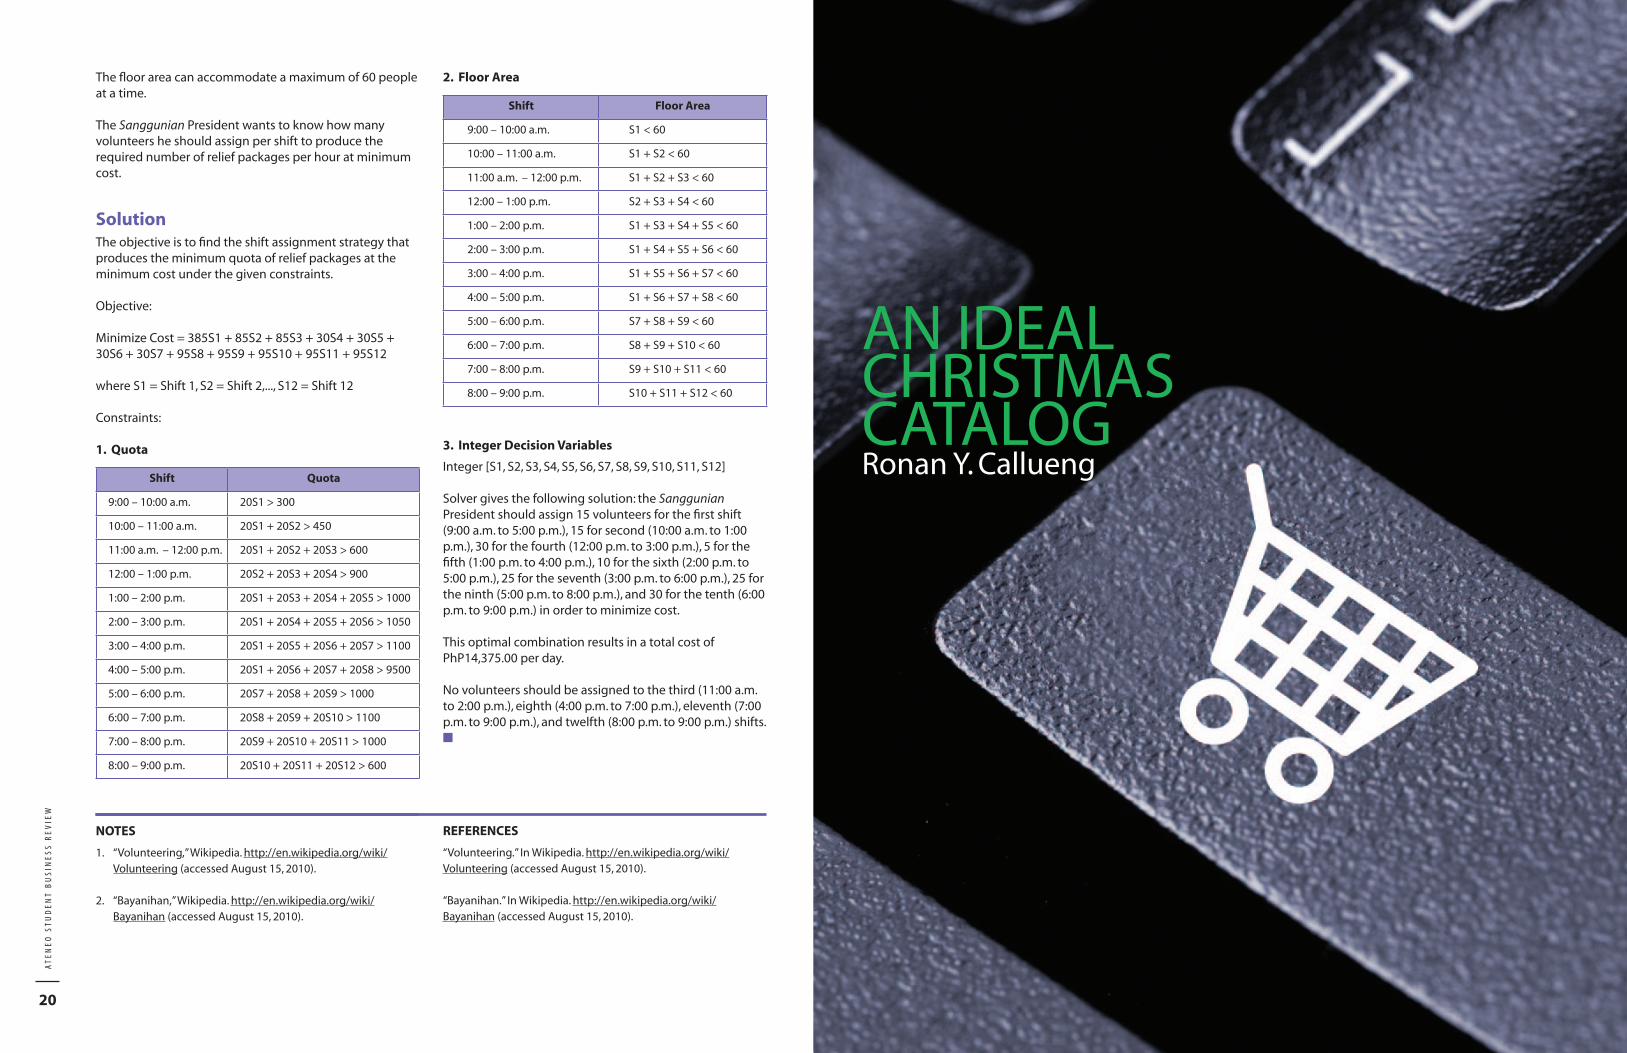
The floor area can accommodate a maximum of 60 people at a time.
The Sanggunian President wants to know how many volunteers he should assign per shift to produce the required number of relief packages per hour at minimum cost.
SolutionThe objective is to find the shift assignment strategy that produces the minimum quota of relief packages at the minimum cost under the given constraints.
Objective:
Minimize Cost = 385S1 + 85S2 + 85S3 + 30S4 + 30S5 + 30S6 + 30S7 + 95S8 + 95S9 + 95S10 + 95S11 + 95S12
where S1 = Shift 1, S2 = Shift 2,..., S12 = Shift 12 Constraints:
1. Quota
Shift Quota
9:00 – 10:00 a.m. 20S1 > 300
10:00 – 11:00 a.m. 20S1 + 20S2 > 450
11:00 a.m. – 12:00 p.m. 20S1 + 20S2 + 20S3 > 600
12:00 – 1:00 p.m. 20S2 + 20S3 + 20S4 > 900
1:00 – 2:00 p.m. 20S1 + 20S3 + 20S4 + 20S5 > 1000
2:00 – 3:00 p.m. 20S1 + 20S4 + 20S5 + 20S6 > 1050
3:00 – 4:00 p.m. 20S1 + 20S5 + 20S6 + 20S7 > 1100
4:00 – 5:00 p.m. 20S1 + 20S6 + 20S7 + 20S8 > 9500
5:00 – 6:00 p.m. 20S7 + 20S8 + 20S9 > 1000
6:00 – 7:00 p.m. 20S8 + 20S9 + 20S10 > 1100
7:00 – 8:00 p.m. 20S9 + 20S10 + 20S11 > 1000
8:00 – 9:00 p.m. 20S10 + 20S11 + 20S12 > 600
2. Floor Area
Shift Floor Area
9:00 – 10:00 a.m. S1 < 60
10:00 – 11:00 a.m. S1 + S2 < 60
11:00 a.m. – 12:00 p.m. S1 + S2 + S3 < 60
12:00 – 1:00 p.m. S2 + S3 + S4 < 60
1:00 – 2:00 p.m. S1 + S3 + S4 + S5 < 60
2:00 – 3:00 p.m. S1 + S4 + S5 + S6 < 60
3:00 – 4:00 p.m. S1 + S5 + S6 + S7 < 60
4:00 – 5:00 p.m. S1 + S6 + S7 + S8 < 60
5:00 – 6:00 p.m. S7 + S8 + S9 < 60
6:00 – 7:00 p.m. S8 + S9 + S10 < 60
7:00 – 8:00 p.m. S9 + S10 + S11 < 60
8:00 – 9:00 p.m. S10 + S11 + S12 < 60
3. Integer Decision Variables
Integer [S1, S2, S3, S4, S5, S6, S7, S8, S9, S10, S11, S12]
Solver gives the following solution: the Sanggunian President should assign 15 volunteers for the first shift (9:00 a.m. to 5:00 p.m.), 15 for second (10:00 a.m. to 1:00 p.m.), 30 for the fourth (12:00 p.m. to 3:00 p.m.), 5 for the fifth (1:00 p.m. to 4:00 p.m.), 10 for the sixth (2:00 p.m. to 5:00 p.m.), 25 for the seventh (3:00 p.m. to 6:00 p.m.), 25 for the ninth (5:00 p.m. to 8:00 p.m.), and 30 for the tenth (6:00 p.m. to 9:00 p.m.) in order to minimize cost.
This optimal combination results in a total cost of PhP14,375.00 per day.
No volunteers should be assigned to the third (11:00 a.m. to 2:00 p.m.), eighth (4:00 p.m. to 7:00 p.m.), eleventh (7:00 p.m. to 9:00 p.m.), and twelfth (8:00 p.m. to 9:00 p.m.) shifts. n
NOTES
1. “Volunteering,” Wikipedia. http://en.wikipedia.org/wiki/Volunteering (accessed August 15, 2010).
2. “Bayanihan,” Wikipedia. http://en.wikipedia.org/wiki/
Bayanihan (accessed August 15, 2010).
AN IDEAL CHRISTMAS CATALOGRonan Y. Callueng
REFERENCES
“Volunteering.” In Wikipedia. http://en.wikipedia.org/wiki/Volunteering (accessed August 15, 2010). “Bayanihan.” In Wikipedia. http://en.wikipedia.org/wiki/Bayanihan (accessed August 15, 2010).
23
ATE
NEO
STU
DEN
T B
USI
NES
S R
EVIE
W
22
ATE
NEO
STU
DEN
T B
USI
NES
S R
EVIE
W
The interesting thing about linear programming is the seemingly endless range of opportunities in which it can be applied. Starting with models that involve practical business applications and logically putting them together can result in varied permutations that may be understood as expanded versions of these models. The logic upon which these linear programming models are built is indeed powerful.
It is all too easy perhaps to take these models and find suitable applications in real-world business settings. For example, our family has dealt in wholesale plywood, and it would be easy for us to use a transportation model, for instance, to optimize the dealings between our three warehouses. In such a case, it would only be a matter of changing the given data for a transportation model. For another example, seeing that currently, we have around 20 to 30 active stock-keeping units, it would be possible for us to find an optimal product mix, with an eye toward maximizing profits.
The above scenarios may prove somewhat too common. Linear programming is quite a robust decision making tool so that it is not difficult to find applications as mundane as deciding on the best place to eat dinner tonight (i.e., maximum satisfaction given a budget) or on which godchildren get to have Christmas gifts come December—perhaps we might generate a binary variable for “naughty or nice”?
In an effort to prove that linear programming can be used to serve the purposes of adults in a pitiful state of arrested development, I shall attempt to come up with a personal integer programming model for buying toys.
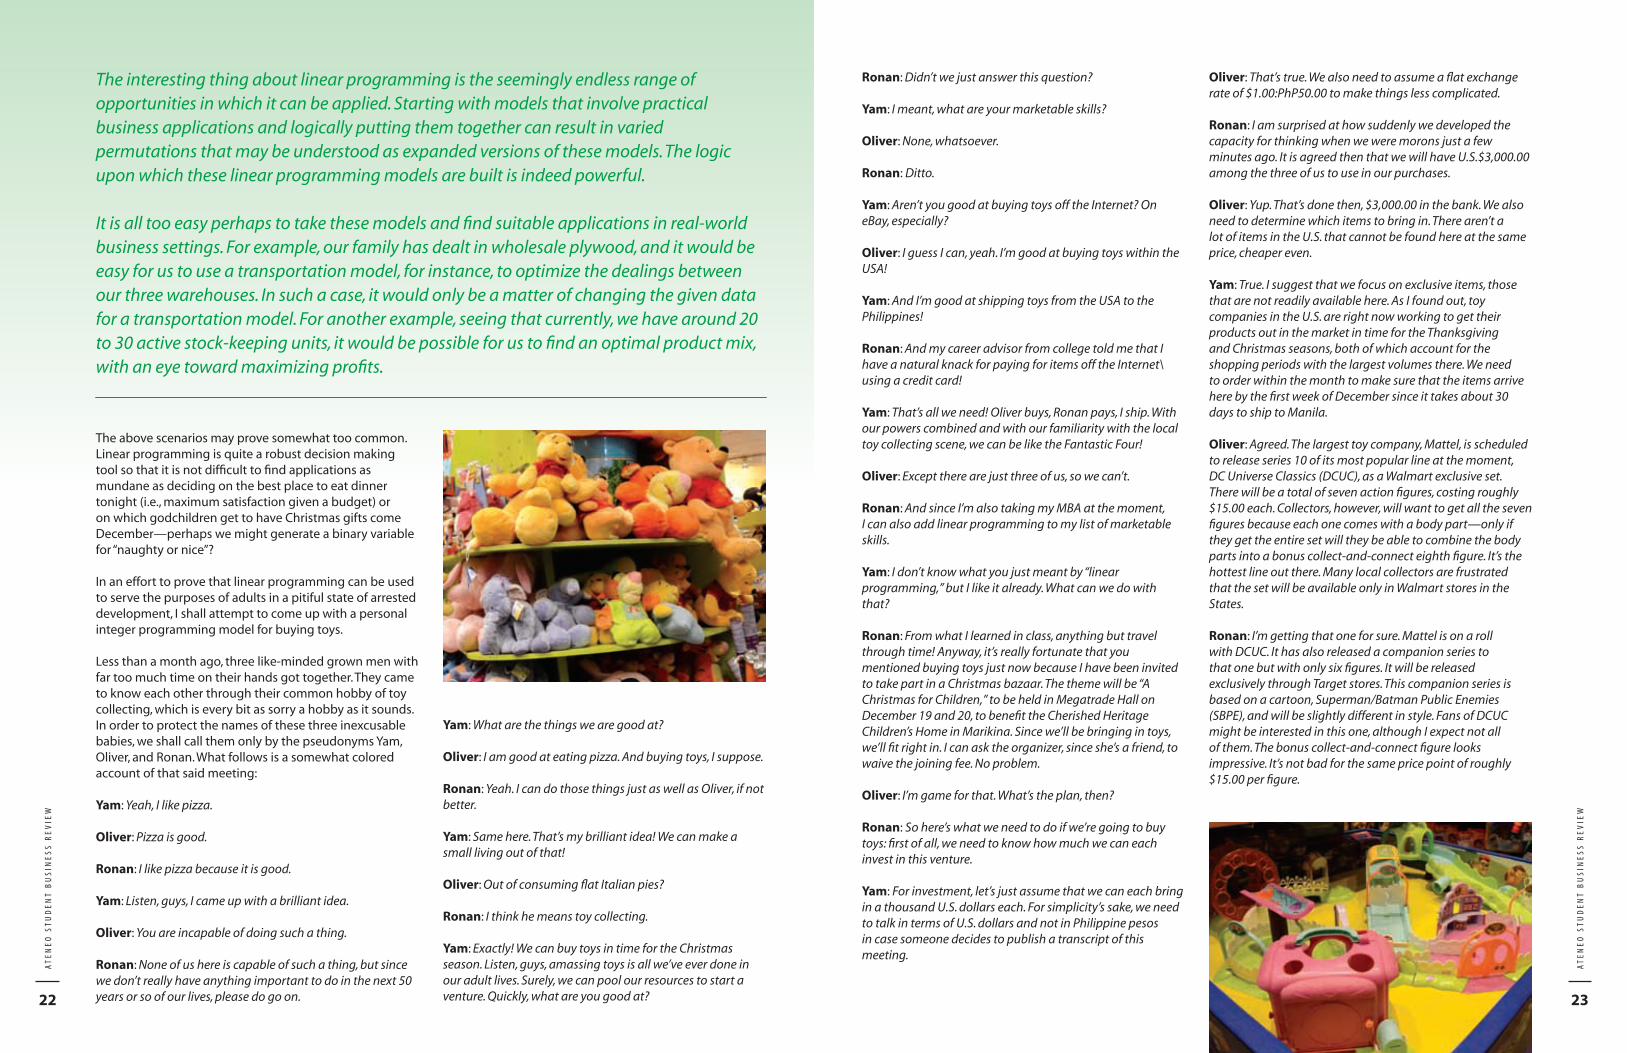
Less than a month ago, three like-minded grown men with far too much time on their hands got together. They came to know each other through their common hobby of toy collecting, which is every bit as sorry a hobby as it sounds. In order to protect the names of these three inexcusable babies, we shall call them only by the pseudonyms Yam, Oliver, and Ronan. What follows is a somewhat colored account of that said meeting:
Yam: Yeah, I like pizza.
Oliver: Pizza is good.
Ronan: I like pizza because it is good.
Yam: Listen, guys, I came up with a brilliant idea.
Oliver: You are incapable of doing such a thing.
Ronan: None of us here is capable of such a thing, but sincewe don’t really have anything important to do in the next 50years or so of our lives, please do go on.
Yam: What are the things we are good at?
Oliver: I am good at eating pizza. And buying toys, I suppose.
Ronan: Yeah. I can do those things just as well as Oliver, if notbetter.
Yam: Same here. That’s my brilliant idea! We can make asmall living out of that!
Oliver: Out of consuming flat Italian pies?
Ronan: I think he means toy collecting.
Yam: Exactly! We can buy toys in time for the Christmasseason. Listen, guys, amassing toys is all we’ve ever done inour adult lives. Surely, we can pool our resources to start aventure. Quickly, what are you good at?
Ronan: Didn’t we just answer this question?
Yam: I meant, what are your marketable skills?
Oliver: None, whatsoever.
Ronan: Ditto.
Yam: Aren’t you good at buying toys off the Internet? OneBay, especially?
Oliver: I guess I can, yeah. I’m good at buying toys within theUSA!
Yam: And I’m good at shipping toys from the USA to thePhilippines!
Ronan: And my career advisor from college told me that Ihave a natural knack for paying for items off the Internet\using a credit card!
Yam: That’s all we need! Oliver buys, Ronan pays, I ship. Withour powers combined and with our familiarity with the localtoy collecting scene, we can be like the Fantastic Four!
Oliver: Except there are just three of us, so we can’t.
Ronan: And since I’m also taking my MBA at the moment,I can also add linear programming to my list of marketableskills.
Yam: I don’t know what you just meant by “linearprogramming,” but I like it already. What can we do withthat?
Ronan: From what I learned in class, anything but travelthrough time! Anyway, it’s really fortunate that youmentioned buying toys just now because I have been invitedto take part in a Christmas bazaar. The theme will be “AChristmas for Children,” to be held in Megatrade Hall onDecember 19 and 20, to benefit the Cherished HeritageChildren’s Home in Marikina. Since we’ll be bringing in toys,we’ll fit right in. I can ask the organizer, since she’s a friend, towaive the joining fee. No problem.
Oliver: I’m game for that. What’s the plan, then?
Ronan: So here’s what we need to do if we’re going to buytoys: first of all, we need to know how much we can eachinvest in this venture.
Yam: For investment, let’s just assume that we can each bringin a thousand U.S. dollars each. For simplicity’s sake, we needto talk in terms of U.S. dollars and not in Philippine pesosin case someone decides to publish a transcript of thismeeting.
Oliver: That’s true. We also need to assume a flat exchangerate of $1.00:PhP50.00 to make things less complicated.
Ronan: I am surprised at how suddenly we developed thecapacity for thinking when we were morons just a fewminutes ago. It is agreed then that we will have U.S.$3,000.00among the three of us to use in our purchases.
Oliver: Yup. That’s done then, $3,000.00 in the bank. We alsoneed to determine which items to bring in. There aren’t alot of items in the U.S. that cannot be found here at the sameprice, cheaper even.
Yam: True. I suggest that we focus on exclusive items, thosethat are not readily available here. As I found out, toycompanies in the U.S. are right now working to get theirproducts out in the market in time for the Thanksgivingand Christmas seasons, both of which account for theshopping periods with the largest volumes there. We needto order within the month to make sure that the items arrivehere by the first week of December since it takes about 30days to ship to Manila.
Oliver: Agreed. The largest toy company, Mattel, is scheduledto release series 10 of its most popular line at the moment,DC Universe Classics (DCUC), as a Walmart exclusive set.There will be a total of seven action figures, costing roughly$15.00 each. Collectors, however, will want to get all the sevenfigures because each one comes with a body part—only ifthey get the entire set will they be able to combine the bodyparts into a bonus collect-and-connect eighth figure. It’s thehottest line out there. Many local collectors are frustratedthat the set will be available only in Walmart stores in theStates.
Ronan: I’m getting that one for sure. Mattel is on a rollwith DCUC. It has also released a companion series tothat one but with only six figures. It will be releasedexclusively through Target stores. This companion series isbased on a cartoon, Superman/Batman Public Enemies(SBPE), and will be slightly different in style. Fans of DCUCmight be interested in this one, although I expect not allof them. The bonus collect-and-connect figure looksimpressive. It’s not bad for the same price point of roughly$15.00 per figure.
25
ATE
NEO
STU
DEN
T B
USI
NES
S R
EVIE
W
24
ATE
NEO
STU
DEN
T B
USI
NES
S R
EVIE
W
Oliver: We should get both these lines in. We can call ourfriend in San Diego, Patrick, for help with them. He’s Pinoy,so he’ll know how to ship the items to us directly viabalikbayan boxes. I expect he’ll charge a bit extra for gasfees and what not, but nothing too extravagant. I also thinkwe should buy him a Christmas gift for his trouble. I know ofa particular item worth $60.00 that he’s been eyeing of late.
Yam: We can call him for DCUC. That line is more difficult tocome by in the States because of its popularity. For SBPE,though, I can call in a favor from an American friend of minewho lives in the Anaheim area. There have been plentyof sightings there recently. My friend will charge an additional$20.00 per set—it’s a bit steep, but he’s on the level. He won’tbe able to set up a balikbayan box (I don’t think he can evenpronounce that properly), but we can arrange for a remotepickup via Filipino Forwarders for free. This can offset someof the $20.00 markup. The pickup is free as long as thelocation is within Southern California. I have an account withthem. We’ll need to pay only $10.00 one time for them toconsolidate our items and pack them into a box.
Ronan: Excellent. I’m with you both on those two lines. I alsothink we should bring in some of Mattel’s Internet-onlyexclusive line, Masters of the Universe Classics (MOTUC).Mattel releases these figures monthly but limited to only10 figures per character per order. Mattel is releasing twocharacters this month. They’re about $20.00 each plus, Iexpect, $2.00 domestic shipping per item. Since we canorder a maximum of 20 figures for MOTUC, I suggestthat we ship them to Filipino Forwarders as well forconsolidation. We pay for consolidation only once anyhow.
Oliver: Hasbro, the other major toy company, is releasingtwo boxed sets of exclusive G.I. Joe sets—one for G.I. Joeand one for their enemies, Cobra. These sets-of-seven areavailable only through Big Bad Toy Shop, an e-tailer outof Western Wisconsin. Each set costs around $34.00, inclusiveof domestic shipping. For some reason, local fans seem towant more of the Cobra set than the G.I. Joe set. I think it’sbecause the Cobra set has more nameless personnel
characters—it looks like a lot of fans want to start theirown Cobra armies. The G.I. Joe set has seven uniquecharacters with proper names. Big Bad Toy Shop knows thistoo, I believe, because you can order the Cobra set only if youorder a G.I. Joe set first, although you can order as many ofthe G.I. Joe sets as you like.
Yam: By the way, I already received pre-orders for five figureseach of the two MOTUC characters to be released this month.
Ronan: I also have pre-orders for the G.I. Joe and Cobrasets—three for Joes and four for Cobra.
Oliver: We’ll set those as our minimum orders then. I suggestwe bring in at least three for each item for product variety. Wedon’t want to be associated with a particular line. We’re not aspecialty service, after all.
Ronan: Fine with me. Yam, can you get in touch with FilipinoForwarders? Ask them to expect the SBPE and MOTUC itemssoon. How large will the balikbayan box be anyway?
Yam: The Jumbo Box is 24” x 18” x 24”. Based on myexperience, we can expect SBPE, because it uses the samepackaging as DCUC, to have dimensions of 7.5” x 3” x 10”,while MOTUC will be 7” x 3” x 10”. I’ll email my handler as soonas possible.
Oliver: It’s all good then. How much do you guys think wecan sell each item for?
Ronan: For DCUC, I reckon we can sell the set-of-seven for$180.00 minimum. The SBPE sets-of-six, on the other hand, wecan sell for around $140.00.
Yam: The boxed set of G.I. Joes can probably go for around$55.00, while the Cobra set can go for as high as $65.00. Morepeople want that.
Oliver: I guess we sell MOTUC figures at the standardrate that it has been going for locally these past fewmonths—that’s more or less $40.00 per figure. No sense inselling it lower or higher when a standard market price hasalready been set. It’s still quite profitable anyway, I think.
Ronan: Do you think we can sell everything we bring in atthose prices? Although I do believe that we will be able tosell all our items eventually, I also think that we need toaccount for possible price variations.
Yam: I think so also. What can we do about it?
Oliver: We can assign subjective probabilities for each itembased on its projected salability. The G.I. Joe set, for example,since it has been out a while, may have only a 50% chance ofselling at full price (assuming no pre-orders). The Cobra setmay rate slightly higher at 60%.
Ronan: That’s right. MOTUC figures, by my assessment, havean 80% chance of being bought at the price we stated.
Yam: Although it hasn’t come out yet, I’m confident that aset of DCUC will sell for the full price 90% of the time. Thecompanion SBPE set can go for 70% only, possibly. It’ssomewhat redundant, if you ask me…just Mattel’s way ofexploiting its DCUC cash cow.
Oliver: I suggest we tabulate these data.
Ronan: Rightly so. It’s not too difficult to figure out theinternational shipping cost of each item, since we cancalculate them based on volume. Let’s just list the items downin the table together with the other data:
Item Cost USA S/H Int’l. S/H Fixed Costs Selling Price Salability
MOTUC $20.00 $2.00 $3.00 $10.00 consolidation $40.00 80%
G.I. JOE $30.00 $4.00 $6.00 – $55.00 50%
COBRA $30.00 $4.00 $6.00 – $65.00 60%
DCUC $114.00 -- $21.00 $60.00 gift $200.00 90%
SBPE $90.00 -- $20.00 $10.00 consolidation $140.00 70%
Based on the table, a G.I. Joe set will cost us $40.00 total. The profit we make when we make a sale, therefore, is $55.00 – $40.00 = $15. However, we have to take into account salability to determine our expected profit. To do this, we simply multiply the profit, $15.00, by 50%. Thus we get an expected profit of $7.50.
Oliver: Are we now doing linear programming?
Ronan: Kind of. We want to come up with a functionthat denotes our total expected profit. We do this byexpanding on what we did just now for the G.I. Joe set:
Expected Profit: 12 MOTUC + 7.5 GIJOE + 15 COBRA + 58.5 DCUC + 21 SBPE
Yam: I’m not very good at math, which is why I was namedafter a tuber, but I do think that your function does not yettake into consideration our fixed costs, namely, theconsolidation fee and the Christmas gift we’re giving Patrick.
Ronan: You’re totally right, tuber-boy. We need to subtractthose one-off costs from the expected profit. Here’s the revisedfunction:
12 MOTUC + 7.5 GIJOE + 15 COBRA + 58.5 DCUC + 21 SBPE – 60 gift – 10 cfee
We have to specify that all the so-called decision variables be integer (we can’t buy 3.667 of an action figure, after all),
while the two fixed cost variables should be binary—they are sort of like Boolean switches: yea or nay, go or no. Technically, then, we’re doing integer programming.
Oliver: It makes a bit of sense now. We want to maximizethat, am I right?
Ronan: Exactly. That will be our objective, to maximize ourexpected profit. Following that, we need to specify theconstraints.
Yam: Limitations and restrictions?
Ronan: Something like that. First off, our most obviousconstraint is our pooled capital of $3,000.00. We can only buyitems worth that much or less.
Oliver: I feel like I’m speaking in tongues, but I think it will golike this:
25 MOTUC + 40 GIJOE + 40 COBRA + 135 DCUC + 110 SBPE + 60 gift + 10 cfee ≤ 3000
That is, we total all the cash outlays, or in our case, the total purchases plus the fixed costs, and make sure that the total is less than or equal to $3,000.00.
Yam: I’m also getting something now. We should setconstraints for the pre-orders. Like this:
27
ATE
NEO
STU
DEN
T B
USI
NES
S R
EVIE
W
26
ATE
NEO
STU
DEN
T B
USI
NES
S R
EVIE
W
Constraint Results Used Available Unused
Money Limit 500 160 160 1755 330 60 10 0 0 0 0 0 2975 3000 25
Min M 20 0 0 0 0 0 0 0 0 0 0 0 20 10 -10
Min G 0 4 0 0 0 0 0 0 0 0 0 0 4 3 -1
Min C 0 0 4 0 0 0 0 0 0 0 0 0 4 4 0
Min D 0 0 0 13 0 0 0 0 0 0 0 0 13 3 -10
Min S 0 0 0 0 3 0 0 0 0 0 0 0 3 3 0
Max M 20 0 0 0 0 0 0 0 0 0 0 0 20 20 0
G/C pair 0 4 -4 0 0 0 0 0 0 0 0 0 0 0 0
S/D demand 0 0 0 13 -6 0 0 0 0 0 0 0 7 0 -7
Balikbayan box 4000 0 0 0 4050 0 0 0 0 0 0 0 8050 10368 2318
D vs g 0 0 0 13 0 -22 0 0 0 0 0 0 -9 0 9
M vs c 20 0 0 0 0 0 -52 0 0 0 0 0 -32 0 32
S vs c 0 0 0 0 3 0 -8 0 0 0 0 0 -5 0 5
Constraint Coifficient
Money Limit 25 40 40 135 110 60 10
Min M 1
Min G 1
Min C 1
Min D 1
Min S 1
Max M 1
G/C pair 1 -1
S/D demand 1 -2
Balikbayan box 200 1350
D vs g 1 -22.222
M vs c 1 -51.84
S vs c 1 -7.68
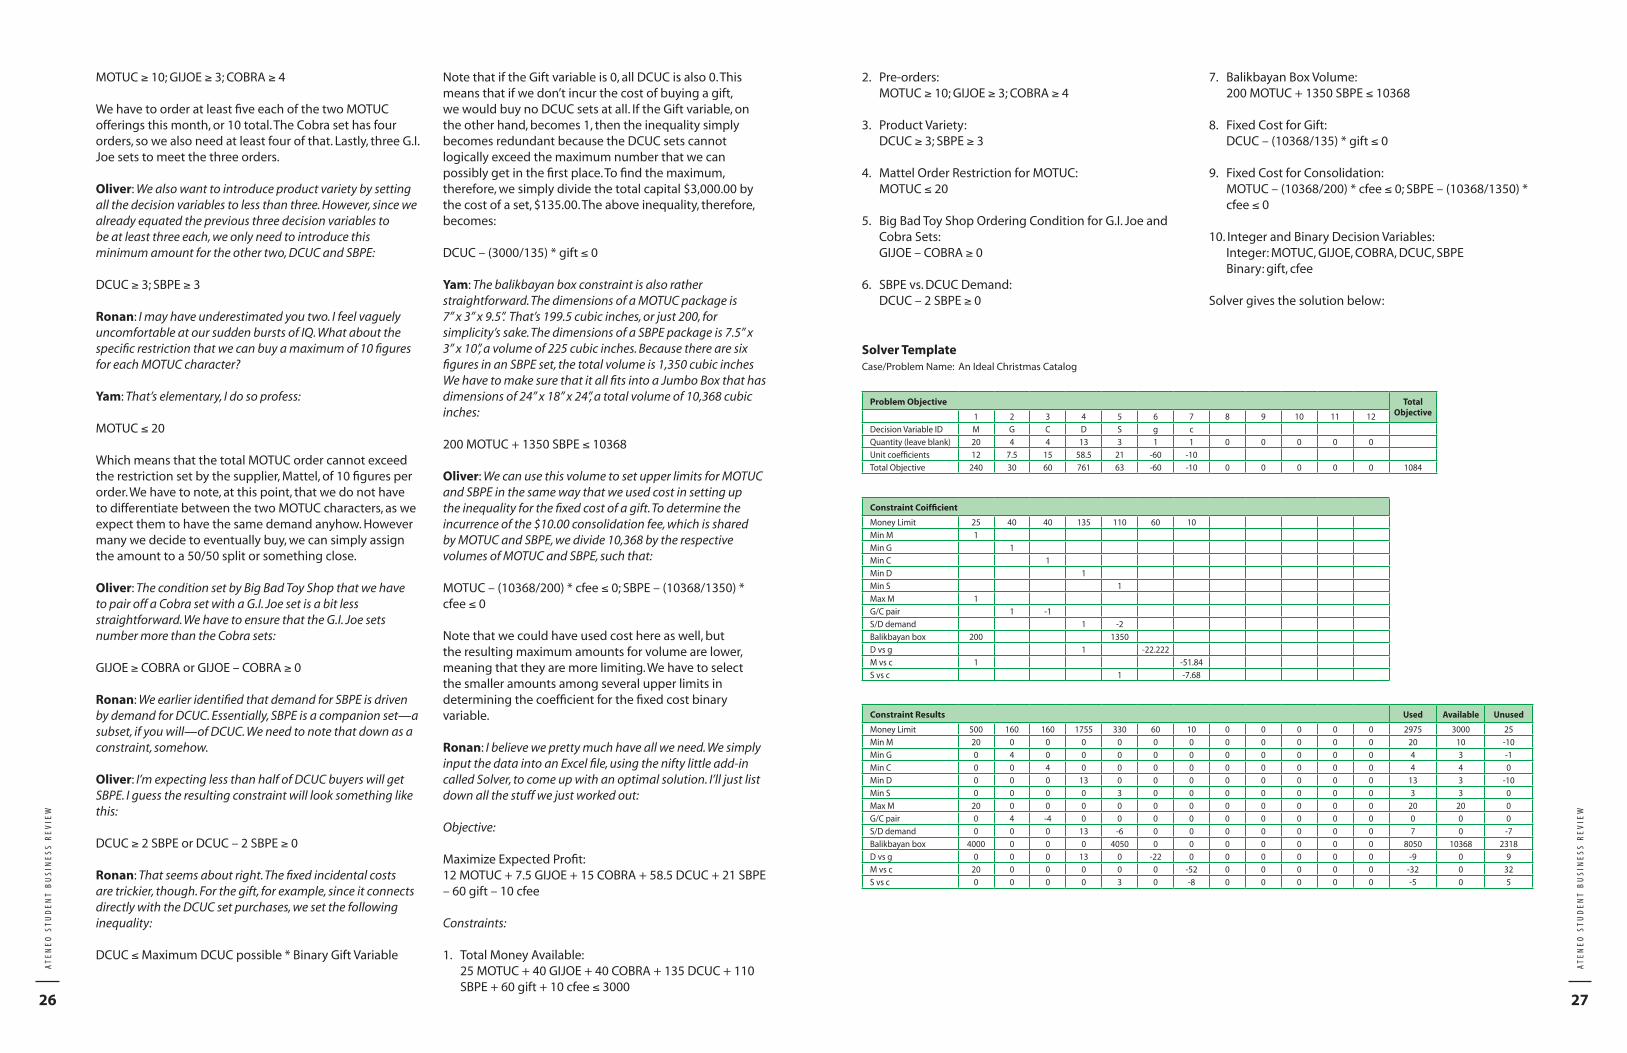
Solver TemplateCase/Problem Name: An Ideal Christmas Catalog
Problem Objective Total Objective1 2 3 4 5 6 7 8 9 10 11 12
Decision Variable ID M G C D S g c
Quantity (leave blank) 20 4 4 13 3 1 1 0 0 0 0 0
Unit coefficients 12 7.5 15 58.5 21 -60 -10
Total Objective 240 30 60 761 63 -60 -10 0 0 0 0 0 1084
MOTUC ≥ 10; GIJOE ≥ 3; COBRA ≥ 4
We have to order at least five each of the two MOTUC offerings this month, or 10 total. The Cobra set has four orders, so we also need at least four of that. Lastly, three G.I. Joe sets to meet the three orders.
Oliver: We also want to introduce product variety by settingall the decision variables to less than three. However, since wealready equated the previous three decision variables tobe at least three each, we only need to introduce thisminimum amount for the other two, DCUC and SBPE:
DCUC ≥ 3; SBPE ≥ 3
Ronan: I may have underestimated you two. I feel vaguelyuncomfortable at our sudden bursts of IQ. What about thespecific restriction that we can buy a maximum of 10 figuresfor each MOTUC character?
Yam: That’s elementary, I do so profess:
MOTUC ≤ 20
Which means that the total MOTUC order cannot exceed the restriction set by the supplier, Mattel, of 10 figures per order. We have to note, at this point, that we do not have to differentiate between the two MOTUC characters, as we expect them to have the same demand anyhow. However many we decide to eventually buy, we can simply assign the amount to a 50/50 split or something close.
Oliver: The condition set by Big Bad Toy Shop that we haveto pair off a Cobra set with a G.I. Joe set is a bit lessstraightforward. We have to ensure that the G.I. Joe setsnumber more than the Cobra sets:
GIJOE ≥ COBRA or GIJOE – COBRA ≥ 0
Ronan: We earlier identified that demand for SBPE is drivenby demand for DCUC. Essentially, SBPE is a companion set—asubset, if you will—of DCUC. We need to note that down as aconstraint, somehow.
Oliver: I’m expecting less than half of DCUC buyers will getSBPE. I guess the resulting constraint will look something likethis:
DCUC ≥ 2 SBPE or DCUC – 2 SBPE ≥ 0
Ronan: That seems about right. The fixed incidental costsare trickier, though. For the gift, for example, since it connectsdirectly with the DCUC set purchases, we set the followinginequality:
DCUC ≤ Maximum DCUC possible * Binary Gift Variable
Note that if the Gift variable is 0, all DCUC is also 0. This means that if we don’t incur the cost of buying a gift, we would buy no DCUC sets at all. If the Gift variable, on the other hand, becomes 1, then the inequality simply becomes redundant because the DCUC sets cannot logically exceed the maximum number that we can possibly get in the first place. To find the maximum, therefore, we simply divide the total capital $3,000.00 by the cost of a set, $135.00. The above inequality, therefore, becomes:
DCUC – (3000/135) * gift ≤ 0
Yam: The balikbayan box constraint is also ratherstraightforward. The dimensions of a MOTUC package is7” x 3” x 9.5”. That’s 199.5 cubic inches, or just 200, forsimplicity’s sake. The dimensions of a SBPE package is 7.5” x3” x 10”, a volume of 225 cubic inches. Because there are sixfigures in an SBPE set, the total volume is 1,350 cubic inchesWe have to make sure that it all fits into a Jumbo Box that hasdimensions of 24” x 18” x 24”, a total volume of 10,368 cubicinches:
200 MOTUC + 1350 SBPE ≤ 10368
Oliver: We can use this volume to set upper limits for MOTUCand SBPE in the same way that we used cost in setting upthe inequality for the fixed cost of a gift. To determine theincurrence of the $10.00 consolidation fee, which is sharedby MOTUC and SBPE, we divide 10,368 by the respectivevolumes of MOTUC and SBPE, such that:
MOTUC – (10368/200) * cfee ≤ 0; SBPE – (10368/1350) * cfee ≤ 0
Note that we could have used cost here as well, but the resulting maximum amounts for volume are lower, meaning that they are more limiting. We have to select the smaller amounts among several upper limits in determining the coefficient for the fixed cost binary variable.
Ronan: I believe we pretty much have all we need. We simplyinput the data into an Excel file, using the nifty little add-incalled Solver, to come up with an optimal solution. I’ll just listdown all the stuff we just worked out:
Objective:
Maximize Expected Profit:12 MOTUC + 7.5 GIJOE + 15 COBRA + 58.5 DCUC + 21 SBPE – 60 gift – 10 cfee
Constraints:
1. Total Money Available: 25 MOTUC + 40 GIJOE + 40 COBRA + 135 DCUC + 110
SBPE + 60 gift + 10 cfee ≤ 3000
2. Pre-orders: MOTUC ≥ 10; GIJOE ≥ 3; COBRA ≥ 4
3. Product Variety: DCUC ≥ 3; SBPE ≥ 3
4. Mattel Order Restriction for MOTUC: MOTUC ≤ 20
5. Big Bad Toy Shop Ordering Condition for G.I. Joe and Cobra Sets:
GIJOE – COBRA ≥ 0
6. SBPE vs. DCUC Demand: DCUC – 2 SBPE ≥ 0
7. Balikbayan Box Volume: 200 MOTUC + 1350 SBPE ≤ 10368
8. Fixed Cost for Gift: DCUC – (10368/135) * gift ≤ 0
9. Fixed Cost for Consolidation: MOTUC – (10368/200) * cfee ≤ 0; SBPE – (10368/1350) *
cfee ≤ 0
10. Integer and Binary Decision Variables: Integer: MOTUC, GIJOE, COBRA, DCUC, SBPE Binary: gift, cfee
Solver gives the solution below:

29
ATE
NEO
STU
DEN
T B
USI
NES
S R
EVIE
W
28
ATE
NEO
STU
DEN
T B
USI
NES
S R
EVIE
W
SAVING THE ENVIRONMENT ONE TREE AT A TIME:
APPLYING QUANTITATIVE TECHNIQUES TO THE MANAGEMENT OF LA MESA WATERSHEDJonimo C. BilasanoMariel V. CapistranoJojo P. JavierMaristel Abigail R. Lim Sheila M. Quintos
Ronan: Based on the Solver solution, the most advantageous products to bring in are MOTUC and DCUC. We can note that the profit rates for both these lines are well over 40%. The COBRA set has a profit rate of around 37%, but it is less desirable because every set has to be paired off with a G.I. Joe set, which has a profit rate of only 18.75%. The G.I. Joe sets pull down the appeal of the COBRA sets.
Yam: What’s surprising is the low priority of SBPE. It seems likea nice option if you look at the numbers, but it looks as ifSolver just chose the minimum number of three sets for SBPE.
Ronan: Yeah, the balikbayan box has over 20% of its totalspace left and it can very well still hold an additional SBPE set.
Oliver: It’s not that SBPE is a poor choice, you know? I think itis simply being outperformed by the impressive numbers ofMOTUC and DCUC. It’s just too bad that we can order only20 MOTUC figures at a time and that DCUC costs a lot tobring in because DCUCs are whole sets.
Ronan: Indeed. All our capital is already used up to within$25.00. Note that we incur both the fixed costs of theChristmas gift and the consolidation fee because we availedof the options that those incidental costs are associated with.
Yam: I just noticed that Solver wants us to bring in only theminimum number of COBRA sets, just enough to meet the preorders of four. As a result of Big Bad Toy Shop’s orderingcondition, we have to bring in an additional G.I. Joe set whenthere have been only three orders for that set.
Oliver: I have a suspicion that any significant increase in totalcapital will only go toward purchasing more DCUC sets.
Ronan: We can confirm that if we modify the capitalconstraint amount in Solver. Weirdly enough, SBPE willbecome attractive to Solver only when we raise our markupto $70.00, for an expected profit of $49.00. That’s just toomuch, I think.
Yam: That amount does not only need to compete with thehigh profit rates of DCUC and MOTUC, you see, it also has tocompensate for the additional balikbayan box space that itwill occupy—it displaces some of the more profitable MOTUCitems.
Ronan: I think you’re right. Anyway, it’s nice to know that wecan expect a profit of $1,084.00 for our trouble. That’s morethan a third of our initial investment, you know. We have togive a fair portion of that to the organizers. I’ll clarify theexact amount with my friend.
Yam: Wonderful! The organizers can use some of that toactually buy toys that will benefit the kids in the orphanage.
Ronan: The Cherished Heritage Children’s Home? I’ve beenthere before. We should join them when the organizers deliverthe gifts. They plan to hold a Christmas party for the kids. Wecan personally help…maybe even chip in.
Oliver: I agree. Aside from toys, we can bring them food. I’mthinking…pizza.
Yam: Yeah, I like pizza.
Oliver: Pizza is good.
Ronan: I like pizza because it is good. n

31
ATE
NEO
STU
DEN
T B
USI
NES
S R
EVIE
W
30
ATE
NEO
STU
DEN
T B
USI
NES
S R
EVIE
W
They serve as steadfast guardians of the land—stoic and immobile, gazing towards the horizon. They stand thirteen feet tall with heads three times bigger than their bodies. Their faces display wide eyes, heavy brows, elongated noses, and protruding lips. When one touches their skin, it feels like they’re made of rubble. And their complexions are darker than an eclipse. They are the Moai—the monolithic human figures of Easter Island. These imposing figures have been admired for years. Tourists flock to Easter Island to see these carvings personally. Yet amidst all the attention, a fundamental question is forgotten: “How were they moved from their place of production?”
Scientists and archeologists surmised that the early Polynesians utilized wooden sledges and rollers to move these figures from one place to another. It must have taken countless timbers to transport them. However, this hypothesis is problematic for one reason: Easter Island, in its current state, has no forest; the island is bare and barren.
Further investigation, on the other hand, has proven this hypothesis. Scientists and archeologists, through pollen analysis, have verified that Easter Island was totally forested at the time the Moai were being created. This discovery has led to a more compelling finding: the production of these stone figures ceased at almost the same time the trees were gone.
The total devastation of Easter Island forests started a chain reaction. Once the trees were gone, the island’s
The La Mesa Watershed: A Case for Environmental Advocacy
The topic of saving the environment is vast. Thus, the authors chose the La Mesa Watershed as the subject of an environmental advocacy. This article gives individuals—on a per household basis—an opportunity to contribute to this advocacy.
This article has three objectives: first, to come up with a viable project for those who want to help save the La Mesa Watershed but do not know how to do it; second, to encourage them to take up the cudgels for the La Mesa Watershed; and third, to show them how financial resources can be utilized in saving the La Mesa Watershed.
The La Mesa Ecopark can be found within the confines of Metro Manila. The watershed provides 12 million Metro Manila residents with drinking water. Moreover, the watershed forest is a carbon dioxide sink that acts as the metropolis’ lungs. If the watershed is not maintained in pristine condition, the inhabitants of Metro Manila will suffer. Preserving the watershed, however, is easier said than done.
The La Mesa Ecopark website describes the problems that the watershed faces, as follows (The La Mesa Story, 2008):
The unmanaged human activities especially squatting and croplands cultivation are causing severe watershed degradation. There is an estimated 1,000 to 1,500 hectares denuded areas inside the
watershed that causes soil erosion and silt deposition in the reservoir as a result of intensive cultivation and other types of agricultural use. If not protected, it will eventually be totally devoid of trees and be converted into a settlement area just like the adjacent Montalban Watershed.
Based on the account above, we can see that the La Mesa Watershed faces formidable challenges.
However, attempting to solve these problems at once is both impractical and foolish. The viable strategy is to start somewhere first. We propose to start with the following questions:
If someone wants to help save the environment by planting trees and thereby offset carbon emissions, what type of trees do they have to plant and how many?
And:
What is the minimum cost needed for this endeavor?
Forecasting Philippine CO2 Emissions
through Regression Analysis
Gases that trap heat in the atmosphere are called greenhouse gases (GHGs). Some GHGs occur naturally, others are byproducts of human industrial processes. Without GHGs, the earth we live in would be much colder and less livable. GHGs, like the glass walls of a
natural resources suffered immensely. The wildlife lost its ecosystem. Forests could not produce food anymore. Dwindling resources could not support a burgeoning Polynesian population. Without adequate resources, the early Polynesian civilization at Easter Island became extinct.
The above account presents a grim reminder that if people do not care for the environment, then cataclysmic consequences will happen.
Despite the lessons of Easter Island, people seem to have a short memory. They have not taken the steps necessary to preserve the world’s rain forests, which, at the current rate of deforestation, could completely vanish in a hundred years (Deforestation, n.d.).
If the watershed is not
maintained in pristine
condition, the inhabitants
of Metro Manila will suffer.

33
ATE
NEO
STU
DEN
T B
USI
NES
S R
EVIE
W
32
ATE
NEO
STU
DEN
T B
USI
NES
S R
EVIE
W
The regression analysis yielded a very good model with R-squared = 0.9008 and t values > |14|. The model equation is:
CO2 Emissions = – 4,792,653,674 + 2,432,809.154 * Year
Annual increase in CO2 output is estimated at 2,432,809
tons, so that emissions by the year 2030 are predicted to be 145,948,908 tons. This figure is more than 80% of the figure last tabulated in 2004, a substantial increase projected after a mere 26 years. Various factors affect CO
2 emissions and they cannot
be discounted—population increase, technological innovation, economic development, and environmental awareness, to name a few.
greenhouse, let in light but keep in heat, giving rise to the term, “greenhouse effect.” Although the greenhouse effect has been known since 1824, its ramifications are now commonly referred to as “global warming” or “climate change.” What used to be largely a naturally occurring process has become a cause of concern as human activities have spurred the production of GHGs. As a result, the earth’s climate is changing faster than its inhabitants’ ability to adapt.
Among GHGs of concern, CO2 is the one most closely
associated with human activity. From breathing to using common home appliances, more so from driving cars and flying planes, CO
2 is invariably a product of human beings.
To give a picture of how much the Philippines contributes to climate change, the authors of this article forecasted CO
2 emissions from the Philippines based on the United
Nation’s 2008 statistical data on the Philippines’ CO2
emissions from 1980 to 2004.
The Carbon Footprint Calculator: An Application of Monte Carlo Simulation
This carbon footprint calculator estimates a household’s annual CO
2 emissions by summing the carbon dioxide
produced by home energy use, auto transportation, and air travel.
Although it is close to impossible to calculate the exact amount of annual CO
2 emissions, we devised a series
of formulas and Monte Carlo simulations that would effectively approximate it based on a few inputs.
This calculator calculates CO2 emissions per household
regardless of how many individuals constitute this unit. A household is defined as those who dwell under the same roof and compose a family, or a social unit composed of those living together in the same dwelling.
Several carbon footprint calculators are available online, but most generate estimates based on U.S. data. We tailored our model to create a calculator based on conditions in the Philippine setting.
Home Energy Use
The carbon coefficient specific for the Philippines was derived from the latest data of the International Energy Agency (International Energy Agency, 2010). This source provides the CO
2 emissions for every kilowatt hour of
electricity generated in the Philippines. According to this source, CO
2 emissions per kWh from electricity and heat
generation in the Philippines in 2008 equals:
Carbon coefficient = 1.07 lbs of CO2 per kWh consumed
Based on this coefficient, CO2 emissions due to electricity
consumption in the Philippines can be calculated using the following formula:
Partial Screenshot of Carbon Footprint Calculator
kWh/month kWh/month Count % Lower linit Upper limit kWh/month Month RN Lookup kWh/month
Jojo Jan 720 500 0 0.00 0.00 0.00 500 1 0.152486 639 Total kWh/year 9671.067
Feb 750 501 0 0.00 0.00 0.00 501 2 0.295449 720
Mar 800 503 0 0.00 0.00 0.00 502 3 0.012809 581
Apr 890 503 0 0.00 0.00 0.00 503 4 0.753701 890
May 1070 504 0 0.00 0.00 0.00 504 5 0.431101 790
Jun 890 505 0 0.00 0.00 0.00 505 6 0.08983 595
Jul 800 506 0 0.00 0.00 0. 00 506 7 0.306219 720
Aug 830 507 0 0.00 0.00 0.00 507 8 0.226335 650
Sep 860 508 0 0.00 0.00 0.00 508 9 0.743578 890
Oct 850 509 0 0.00 0.00 0.00 509 10 0.923887 1150
Nov 870 510 0 0.00 0.00 0.00 510 11 0.824618 983
Dec 800 511 0 0.00 0.00 0.00 511 12 0.34281 720
Jonee Jan 1176 512 0 0.00 0.00 0.00 512 14 0.321388 750
Feb 983 513 0 0.00 0.00 0.00 513 15 0.028535 581
Mar 991 514 0 0.00 0.00 0.00 515 16 0.259934 690
Apr 1314 515 0 0.00 0.00 0.00 515 16 0.259934 690
May 1350 516 0 0.00 0.00 0.00 516 17 0.555691 830
June 1450 517 0 0.00 0.00 0.00 517 18 0.528566 800
Example of Monte Carlo Simulation for kWh Consumption of a Single Family Home
Year 1985 1990 1995 2000 2005 2010 2015 2020 2025 2030
160000000
140000000
120000000
100000000
80000000
60000000
40000000
20000000
0
Predicted Carbon dioxide emissions (CO2), metric tons of CO
2
Projected Philippine CO2 Emissions, 2005-2030
Carbon dioxide emissions (CO2), metric tons of CO
2
We have not included in this model, calculations for the CO
2 emissions of a student in a school or an adult in the
workplace. These emissions do not come from households but from corporations which generate carbon dioxide in the conduct of their business.
CO2 emissions (lbs) = Electricity consumed (kWh) x 1.07
lbs of CO2/kWh
Not everyone is aware of their annual electricity consumption. To help those who do not know or are unable to estimate this figure, we created a model that simulates the annual kilowatt hour consumption of a household, depending on the home type.
To create this model, Monte Carlo simulations were generated for two types of homes: single family home and condominium. These two home types are the most common for socioeconomic classes A and B, and it was assumed that individuals who are financially capable of offsetting their CO
2 emissions would come from these two
classes.
The simulations were executed using Excel. An example for a single family home is shown below.
Electricity
How much electricity in kWh do you consume per year? kWh
If you don’t know your actual usage, please select your home type Single Family home
Your simulated consumption based on your home type is: 10738 kWh
Auto Transportation
Vehicle 1
Do you know yopur annual mileage in KM? Yes - Please input KM km
If no, here is your simulated distance per year km
Carbon Footprint Calculator
From breathing to using common home appliances, more so
from driving cars and flying planes, CO2 is invariably a product
of human beings.

35
ATE
NEO
STU
DEN
T B
USI
NES
S R
EVIE
W
34
ATE
NEO
STU
DEN
T B
USI
NES
S R
EVIE
W
The Monte Carlo simulation can be adapted for different home types.
Auto Transportation
Calculating CO2 emissions due to auto transportation for
an entire household is based on the total emissions for all vehicles the household owns. The carbon footprint calculator can calculate the CO
2 emissions for up to three
vehicles.
The carbon coefficient in this case is the amount of CO
2 emissions in pounds per liter of fuel consumed.
The amount of CO2 emitted from auto transportation is
directly proportional to the amount of fuel consumed.
According to Natural Resources Canada (Personal Transportation, 2009), the consumption of one liter of gasoline releases 5.29 lbs of CO
2 into the atmosphere:
Carbon coefficient = 5.29 lbs of CO2/L
Therefore, the CO2 emitted from auto transportation is:
CO2 emissions (lbs) = Fuel consumption (L) * 5.29 lbs/L
Since it is rare that individuals keep a record of the liters of fuel they consume in a year, we can estimate this value by taking their annual mileage, which is easily accessible via the vehicle’s odometer, and dividing it by the vehicle’s fuel efficiency:
CO2 emissions (lbs) = [Annual mileage (km)/Fuel
efficiency (km/L)] * 5.29 lbs/L
Air Travel
Air travel definitions and factors were taken from the Greenhouse Gas (GHG) Protocol Mobile Combustion Tool (Calculation Tools, 2011). According to the GHG Protocol, the carbon coefficient for air travel is:
Carbon coefficient = 0.263 lbs of CO2/km
CO2 emissions due to air travel anywhere in the world can
be calculated by using the following formula:
CO2 emissions (lbs) = Distance flown (km) * 0.263 lbs of
CO2/km
It should be noted that CO2 emissions should be
calculated by adding up the kilometers flown by all individuals who are members of the household.
Total CO2 Emissions Impact
To get the total impact of CO2 emissions in pounds, simply
add up all CO2 emissions from home energy use, auto
transportation, and air travel.
The Linear Programming Model: Assumptions
The linear programming model used in this paper does not intend to replace nor augment existing local and international scientific studies on conservation and reforestation. Instead, it intends to give individuals an
Total Impact
Your total estimated CO2
emissions in lbs is =
Total CO2 Emissions Impact
The figure below shows the section of the carbon footprint calculator for auto transportation.
The Monte Carlo simulation for the distance driven per year uses the same framework as that of the simulation for the annual electricity consumption per home type.
If the user does not know their vehicle’s fuel efficiency, they may choose to use the average values published in the U.S. Bureau of Transportation Statistics: Transportation Statistics Annual Report (September 2004) or to simply select their vehicle type from the list in the carbon footprint calculator. Then the calculator will automatically enter the average value for this vehicle type.
2054.203833 per year
Interestingly, the possibility of including human respiration in the calculation of CO
2 emissions was also
explored by the authors. We performed a survey showing that an average human being will exhale 16 times per minute. Each breath will contain, according to Carbon Dioxide Information Analysis Center (Carbon Dioxide Analysis Center, n.d.), around 8.1571037 * 10-5 lbs of CO
2.
Therefore, CO2 emissions due to a single human breathing
during one year would sum up to around 141 lbs only. Thankfully, breathing is one CO
2 emitting activity that
humans can do without feeling guilty.
It is also necessary to calculate the carbon emissions based on the CO
2 emissions derived using the calculator.
This is done by dividing CO2 emissions by the factor
3.6663.
idea of how much they may need to donate to offset their individual carbon emissions and as a result to do their share, no matter how small, in saving the environment.
The assumptions for this model are as follows:
1. Maximum Diameter Class is in the 10–20 diameter breast height (dbh) range.
The carbon absorption capacity or carbon density of a tree depends on its dbh. Tree dbh is outside bark diameter at breast height. Breast height is defined as 4.5 feet above the forest floor on the uphill side of the tree.
This first assumption of the model is conservative since most trees grow to be much larger than 10–20 dbh.
2. Carbon density or absorption capacity is 50 percent of the computed biomass (Lasco, R., et al., 2005).
3. Full capacity for carbon absorption is assumed at the start of the tenth year of a tree.
Carbon absorption capacity is the tree’s capacity to absorb carbon during the span of ten years following the first ten years.
This third assumption is also conservative since other carbon offset organizations use in their models the total carbon absorbed by the tree during its entire lifespan.
4. Tree choices are limited to fast growing trees with maximum carbon absorption endemic to the watershed (Lasco, R., et al., 2004).
Model Inputs and Constraints
A summary of all inputs and constraints used in the linear programming model is shown in the following table:
Species
Cost Carbon Absorption
Capacity(lbs. of Carbon)
Maximum Trees perHectare
(no. of trees)
Area Coveredper Tree
(sq m)
BiodiversityRequirement
(% of total trees)Seedling
(Php)Maintenance(% of Seedling
Cost)
Narra (X1) 17 3 72.62 469 21.32 >= 15%
Mahogany (X2) 15 3 76.28 494 20.24 >= 9%
Ipil Ipil (X3) 10 3 41.27 304 32.89 --
Gmelina (X4) 15 3 54.48 688 14.53 >= 3%
Acacia (X5) 14 3 143.05 391 25.58 <= 14%
Benguet Pine (X6) 12 3 90.61 422 23.70 --
Carbon Footprint Calculator for Auto Transportation
Auto Transportation
Vehicle 1
Do you know your annual mileage in KM? Yes - Please input KM km = z 0 lbs
If no, here is your simulated distance per year km = z 0 lbs
What is this vehicle’s fuel efficiency Other 0 km/L = y
Averages: Ompact or smaller 10.71 km/L (z/y) x 5.29
Midsize Sedan 9.44 km/L
Large Sedan 9.01 km/L
Station Wagon 10.12 km/L
Truck or Van 7.31 km/L
Minivan 8.55 km/L
Sport Utility 7.99 km/L
Other Please enter value
Does the vehicle have an air conditioner? (Yes or No) No + 194.9 0 lbs
Yes
No
Linear Programming Model: Inputs and Constraints
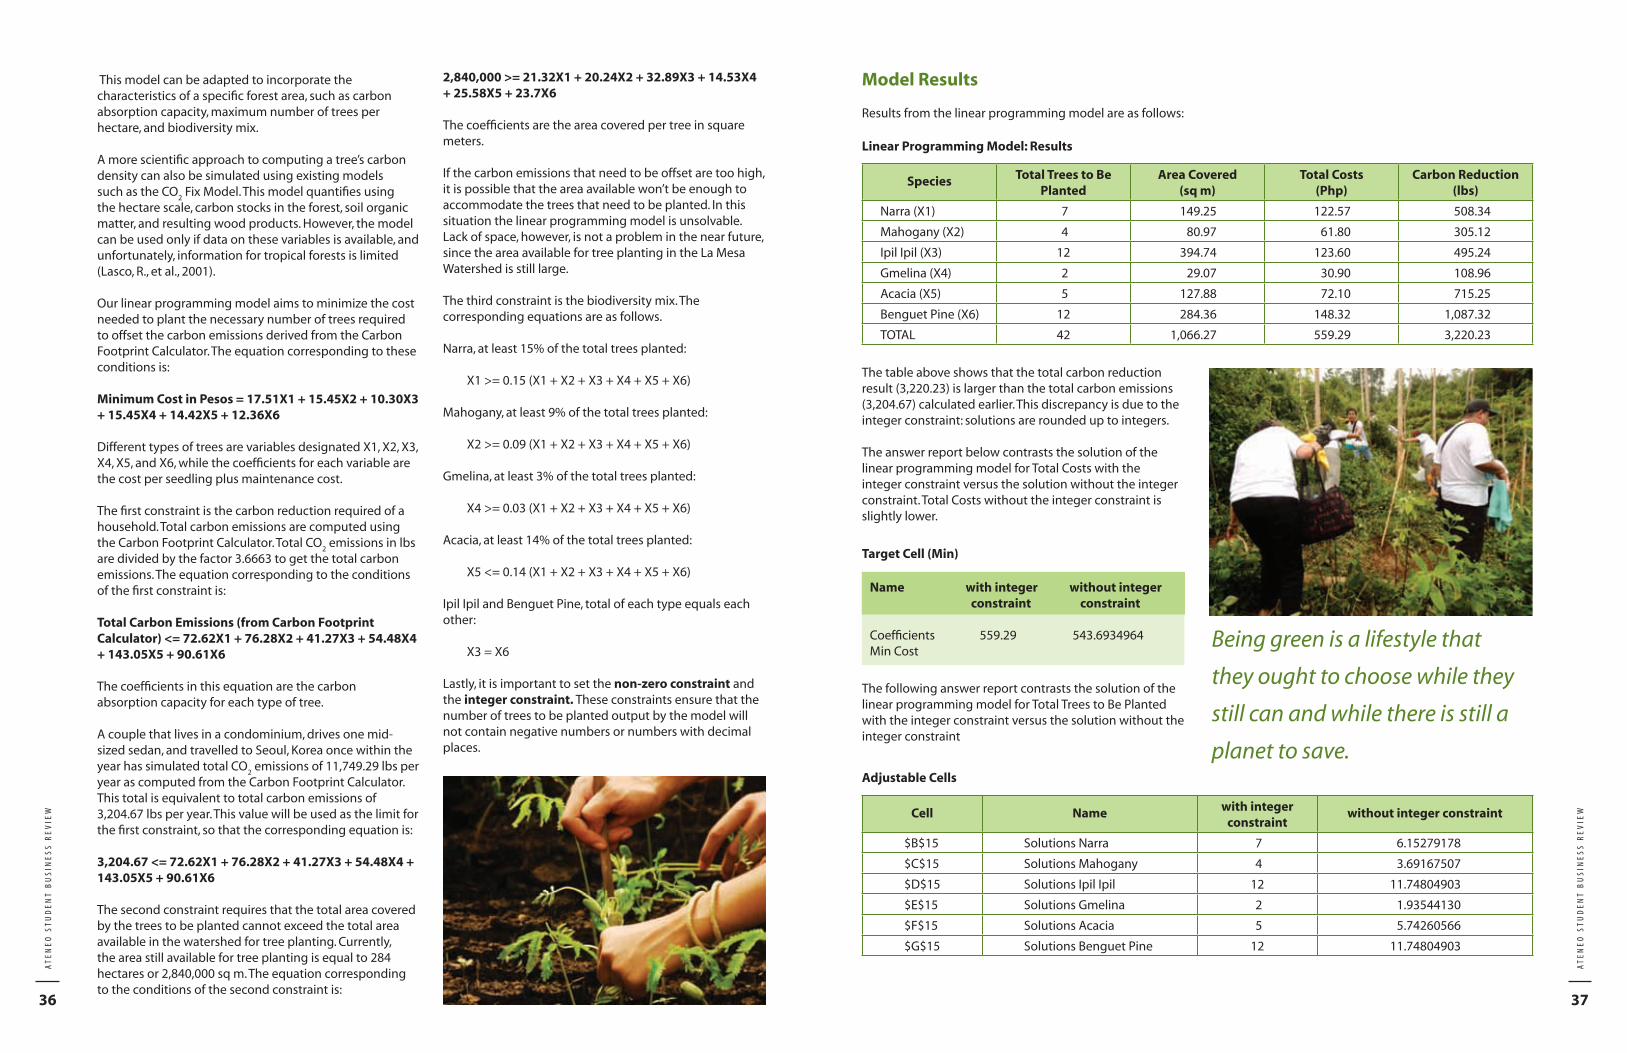
37
ATE
NEO
STU
DEN
T B
USI
NES
S R
EVIE
W
36
ATE
NEO
STU
DEN
T B
USI
NES
S R
EVIE
W
Model Results
Results from the linear programming model are as follows:
Species Total Trees to Be Planted
Area Covered (sq m)
Total Costs (Php)
Carbon Reduction (lbs)
Narra (X1) 7 149.25 122.57 508.34
Mahogany (X2) 4 80.97 61.80 305.12
Ipil Ipil (X3) 12 394.74 123.60 495.24
Gmelina (X4) 2 29.07 30.90 108.96
Acacia (X5) 5 127.88 72.10 715.25
Benguet Pine (X6) 12 284.36 148.32 1,087.32
TOTAL 42 1,066.27 559.29 3,220.23
Target Cell (Min)
Adjustable Cells
The following answer report contrasts the solution of the linear programming model for Total Trees to Be Planted with the integer constraint versus the solution without the integer constraint
Cell Name with integer constraint
without integer constraint
$B$15 Solutions Narra 7 6.15279178
$C$15 Solutions Mahogany 4 3.69167507
$D$15 Solutions Ipil Ipil 12 11.74804903
$E$15 Solutions Gmelina 2 1.93544130
$F$15 Solutions Acacia 5 5.74260566
$G$15 Solutions Benguet Pine 12 11.74804903
This model can be adapted to incorporate the characteristics of a specific forest area, such as carbon absorption capacity, maximum number of trees per hectare, and biodiversity mix.
A more scientific approach to computing a tree’s carbon density can also be simulated using existing models such as the CO
2 Fix Model. This model quantifies using
the hectare scale, carbon stocks in the forest, soil organic matter, and resulting wood products. However, the model can be used only if data on these variables is available, and unfortunately, information for tropical forests is limited (Lasco, R., et al., 2001).
Our linear programming model aims to minimize the cost needed to plant the necessary number of trees required to offset the carbon emissions derived from the Carbon Footprint Calculator. The equation corresponding to these conditions is:
Minimum Cost in Pesos = 17.51X1 + 15.45X2 + 10.30X3 + 15.45X4 + 14.42X5 + 12.36X6
Different types of trees are variables designated X1, X2, X3, X4, X5, and X6, while the coefficients for each variable are the cost per seedling plus maintenance cost.
The first constraint is the carbon reduction required of a household. Total carbon emissions are computed using the Carbon Footprint Calculator. Total CO
2 emissions in lbs
are divided by the factor 3.6663 to get the total carbon emissions. The equation corresponding to the conditions of the first constraint is:
Total Carbon Emissions (from Carbon Footprint Calculator) <= 72.62X1 + 76.28X2 + 41.27X3 + 54.48X4 + 143.05X5 + 90.61X6
The coefficients in this equation are the carbon absorption capacity for each type of tree.
A couple that lives in a condominium, drives one mid-sized sedan, and travelled to Seoul, Korea once within the year has simulated total CO
2 emissions of 11,749.29 lbs per
year as computed from the Carbon Footprint Calculator. This total is equivalent to total carbon emissions of 3,204.67 lbs per year. This value will be used as the limit for the first constraint, so that the corresponding equation is:
3,204.67 <= 72.62X1 + 76.28X2 + 41.27X3 + 54.48X4 + 143.05X5 + 90.61X6
The second constraint requires that the total area covered by the trees to be planted cannot exceed the total area available in the watershed for tree planting. Currently, the area still available for tree planting is equal to 284 hectares or 2,840,000 sq m. The equation corresponding to the conditions of the second constraint is:
The table above shows that the total carbon reduction result (3,220.23) is larger than the total carbon emissions (3,204.67) calculated earlier. This discrepancy is due to the integer constraint: solutions are rounded up to integers.
The answer report below contrasts the solution of the linear programming model for Total Costs with the integer constraint versus the solution without the integer constraint. Total Costs without the integer constraint is slightly lower.
Name with integer without integer constraint constraint
Coefficients 559.29 543.6934964Min Cost
2,840,000 >= 21.32X1 + 20.24X2 + 32.89X3 + 14.53X4 + 25.58X5 + 23.7X6
The coefficients are the area covered per tree in square meters.
If the carbon emissions that need to be offset are too high, it is possible that the area available won’t be enough to accommodate the trees that need to be planted. In this situation the linear programming model is unsolvable. Lack of space, however, is not a problem in the near future, since the area available for tree planting in the La Mesa Watershed is still large.
The third constraint is the biodiversity mix. The corresponding equations are as follows.
Narra, at least 15% of the total trees planted:
X1 >= 0.15 (X1 + X2 + X3 + X4 + X5 + X6)
Mahogany, at least 9% of the total trees planted:
X2 >= 0.09 (X1 + X2 + X3 + X4 + X5 + X6)
Gmelina, at least 3% of the total trees planted:
X4 >= 0.03 (X1 + X2 + X3 + X4 + X5 + X6)
Acacia, at least 14% of the total trees planted:
X5 <= 0.14 (X1 + X2 + X3 + X4 + X5 + X6)
Ipil Ipil and Benguet Pine, total of each type equals each other:
X3 = X6
Lastly, it is important to set the non-zero constraint and the integer constraint. These constraints ensure that the number of trees to be planted output by the model will not contain negative numbers or numbers with decimal places.
Linear Programming Model: Results
Being green is a lifestyle that
they ought to choose while they
still can and while there is still a
planet to save.
39
ATE
NEO
STU
DEN
T B
USI
NES
S R
EVIE
W
38
ATE
NEO
STU
DEN
T B
USI
NES
S R
EVIE
W
Constraints
Cell Name Cell Value Formula Status Slack
$B$26 Carbon constraint LHS 3220.23 $B$26 >= $C$26 Not Binding 15.558
$B$31 BD Acacia LHS 0.88 $B$31 >= $C$31 Not Binding 0.88
$B$27 Area constraint LHS 1066.269428 $B$27 <= $C$27 Not Binding 2838933.731
$B$28 BD Narra LHS – 0.7 $B$28 <= $C$28 Not Binding 0.7
$B$29 BD Mahogany LHS – 0.22 $B$29 <= $C$29 Not Binding 0.22
$B$32 BD Ipil Ipil & Pine LHS 0 $B$32 = $C$32 Not Binding 0
$B$30 BD Gmelina LHS – 0.02 $B$30 <= $C$30 Not Binding 0.02
Related Model
We created a closely related linear programming model based on the question:
What is total carbon reduction contribution for a certain peso donation?
This model is easily generated by interchanging the first constraint and the objective function. Thus the objective function would be:
Maximum Carbon Reduction = 72.62X1 + 76.28X2 + 41.27X3 + 54.48X4 + 143.05X5 + 90.61X6
The original objective function would be a constraint, as shown:
Cost in Pesos (User Input) >= 17.51X1 + 15.45X2 + 10.30X3 + 15.45X4 + 14.42X5 + 12.36X6
All other constraints would remain the same.
If we input the value derived from the original model, PhP 559.29, the new linear programming model would yield the following results:
Moving Forward: Corporations Must Become Involved
The table shows that the new linear programming model yields exactly the same integer values as the original linear programming model.
Species Total Trees to Be Planted
Area Covered (sq m)
Total Costs (PhP)
Carbon Reduction (lbs)
Narra (X1) 7 149.25 122.57 508.34
Mahogany (X2) 4 80.97 61.80 305.12
Ipil Ipil (X3) 12 394.74 123.60 495.24
Gmelina (X4) 2 29.07 30.90 108.96
Acacia (X5) 5 127.88 72.10 715.25
Benguet Pine (X6) 12 284.36 148.32 1,087.32
TOTAL 42 1,066.27 559.29 3,220.23
The planet’s capacity to support its inhabitants is ample but it is not boundless. The planet’s natural resources are currently dwindling at a rate that is much faster than nature’s ability to replenish.
Carbon reduction is just one of the many ways to save the environment, and it is sad that a task of this magnitude has been given attention by only a few. Environmental preservation efforts are largely the efforts of non-profit organizations.
However, the growing number of companies spearheading their own environmental campaigns under their corporate social responsibility programs is worth noting. These companies are proof that profit, productivity, and operational efficiency are not enough to be considered truly successful. Simply put, a company loses its relevance if its success is attained at the expense of the environment that sustains it.
REFERENCES
12 Simple Things to Reduce Your Carbon Footprint. (2009). In United Nations Development Programme Philippines website. http://www.undp.org.ph/?link=news&news_id=161&fa=3 (accessed April 6, 2011).
Calculation Tools. (2011). In The Greenhouse Gas Protocol Initiative website. http://www.ghgprotocol.org/calculation-tools (accessed April 6, 2011).
Carbon Dioxide Analysis Center. (n.d.). In CDIAC: Carbon Dioxide Analysis Center website. http://cdiac.ornl.gov/ (accessed April 6, 2011).
Deforestation. (n.d.). National Geographic. http://environment.nationalgeographic.com/environment/global-warming/deforestation-overview.html (accessed April 6, 2011).
Diamond, J. (2005). Collapse. New York: Penguin Books.
Global Warming. (n.d.). National Geographic. http://environment.nationalgeographic.com/environment/global-warming/gw-overview/?source=A-to-Z (accessed April 6, 2011).
HOUSE: Helping Ourselves through Sustainable Enterprises. (n.d.). In Our Project H.OU.S.E. Foundation, Inc. website. http://www.ourprojecthouse.org/Project_HOUSE/Welcome.html (accessed April 6, 2011).
International Energy Agency. (2010). CO2 Emissions from Fuel Combustion 2010 Edition. In International Energy Agency website. http://www.iea.org/co2highlights/co2highlights.pdf (accessed April 6, 2011).
Knight, M. (2010, November 26). “Case for Man-Made Warming Increased in 2010, Scientists Say.” CNN. http://articles.cnn.com/2010-11-26/world/world.warming.metoffice.report_1_man-made-warming-warming-rate-natural-variability?_s=PM:WORLD (accessed April 6, 2011).
Lasco, R., et al. (2001). Carbon Stocks Assessment of Secondary Tropical Forest in Mt. Makiling Forest Reserve, Philippines.
The constraints section of the answer report shows that the Area Constraint has a very large slack: there is still a lot of area available in the La Mesa Watershed for tree planting.
The authors believe that value creation should encompass corporate social responsibility. This concept is illustrated by Messy Bessy, a local brand, which produces a line of chemical-free household cleaners and personal care products. The products use natural ingredients that are biodegradable and not harmful to the environment. No excess fuel is used in shipping the products so that carbon emissions are reduced. The company also employs disadvantaged young adults that they educate and train (We Clean, n.d.; HOUSE, n.d.).
Individuals may not be capable of carrying on campaigns equal in scope to those of business corporations. Yet individual efforts should not be undervalued because they do make a difference.
Individuals can make a statement by living out their convictions on a daily basis through the decisions they make. Being green is a lifestyle that they ought to choose while they still can and while there is still a planet to save. n
Lasco, R., et al. (2005). Carbon Budgets: Pantabangan, Carangalan Watershed Data.
Lasco, R., F. Pulhin, and Ma. R.Banaticla. (2004). “Potential Carbon Sequestration Projects in the Philippines.” In World Agroforestry Centre website. http://www.worldagroforestrycentre.org/sea/Publications/files/paper/PP0182-06.PDF (accessed April 6, 2011).
Millennium Development Goals Database. (2008). In UNdata: A World of Information website. http://unstats.un.org/unsd/databases.htm (accessed April 6, 2011).
National Statistics Office, Republic of the Philippines. (2008). “Summary of Principal Vital Statistics in the Philippines: 1903–2005.” http://www.census.gov.ph/data/sectordata/tsvs.htm (accessed April 6, 2011).
Personal Transportation. (2009, April 20). In Natural Resources Canada website. http://www.oee.nrcan.gc.ca/Publications/transportation/fuel-guide/2005/index.cfm (accessed April 6, 2011).
Porter, M., and M. Kramer. “Creating Shared Value.” Harvard Business Review 89 (January–February, 2011): 62–77.
The La Mesa Story. (2008). In Save the La Mesa Watershed: Project Packages website. http://www.lamesawatershed.com/background.php (accessed April 6, 2011).
U.S. Department of Transportation: Bureau of Transportation Statistics. (2004). “Transportation Statistics Annual Report.” In Research and Innovative Technology Administration: Bureau of Transportation Statistics website. http://www.bts.gov/publications/transportation_statistics_annual_report/2004/pdf/entire.pdf (accessed April 6, 2011).
We Clean, We Green, We Educate. (n.d.). In Messy Bessy website. http://www.messybessy.com/Messy_Bessy/Clean,_Green,_Educate.html (accessed April 6, 2011).
New Linear Programming Model: Results

41
ATE
NEO
STU
DEN
T B
USI
NES
S R
EVIE
W
40
ATE
NEO
STU
DEN
T B
USI
NES
S R
EVIE
W
MATERIAL REQUIREMENTS
PLANNING SCHEDULE FOR ARGAO
PIGGERY FARMSMyrna L. Kho
Argao Piggery Farms is a mid-sized farm established six years ago in Argao, Cebu. It has a total swine population of 208, including 61 sows.
Due to lack of financial capital, the farm limits its piglet rearing period to only 60 days from birth. After this period, piglets are sold to generate revenue and sustain the capital and operational requirements of the farm.
The piglet rearing period requires the supply of feeds and medicines/vaccines (medvacs). Feeds are delivered by the supplier to the farm, while medvacs are bought directly from the distributor or supplier.
The feeds supplier does not require a Minimum Order Quantity (MOQ) because the supplier serves other piggeries in the area. However, the feeds supplier requires a lead time of three days for order placements.
Currently, 11 sows are expected to give birth in October. Each sow is estimated to deliver 11 piglets, yielding an estimated total of 121 piglets.
Statement of the Problem
The farm has an existing schedule that resembles Material Requirements Planning (MRP) and maintains safety stocks of feeds. However, there have been occasions wherein feeds supply was low and a new order was not placed on time. On these occasions, the owner would pick up the required feeds from the supplier. The owners would like to improve the current MRP schedule to avoid feeds shortfalls and the needless trouble of picking up feeds from the supplier.
Objectives of the Study
The study aims to design a 90-day Material Requirements Planning Table for the incoming piglets in October. The MRP Table would serve as an efficient feeds and medvacs purchase schedule system. The table would also allow the owners to estimate the capital funds required to raise the piglets before they are sold.
Significance of the Study
With proper MRP scheduling, the farm should be able to better manage their capital resources. MRP is critical in swine production because interruptions as short as one day in feeding the piglets result in stress, which affects their development. Furthermore, swine feeds are highly
perishable due to the organic nature of the feeds. They are packaged in unfumigated sacks, which do not offer protection from pests. Feeds oversupply results in loss and wastage.
Scope and Limitations of the Study
The MRP scheduled developed in this study will cover the feeds and medvacs requirements of the estimated 121 piglets that will be reared during the 60-day period after birth.
Feeds and medvacs requirements depend on the breed of the pig, prevalent swine-related disease(s) in the locality, individual health of the piglet, and the physical layout of the piggery. Based on the current mix of these factors at Argao farms, the study will prepare the feeding guide and medvacs requirements that will be used to make the MRP schedule.
Cost of these items and transportation delivery expenses are not included in the study.
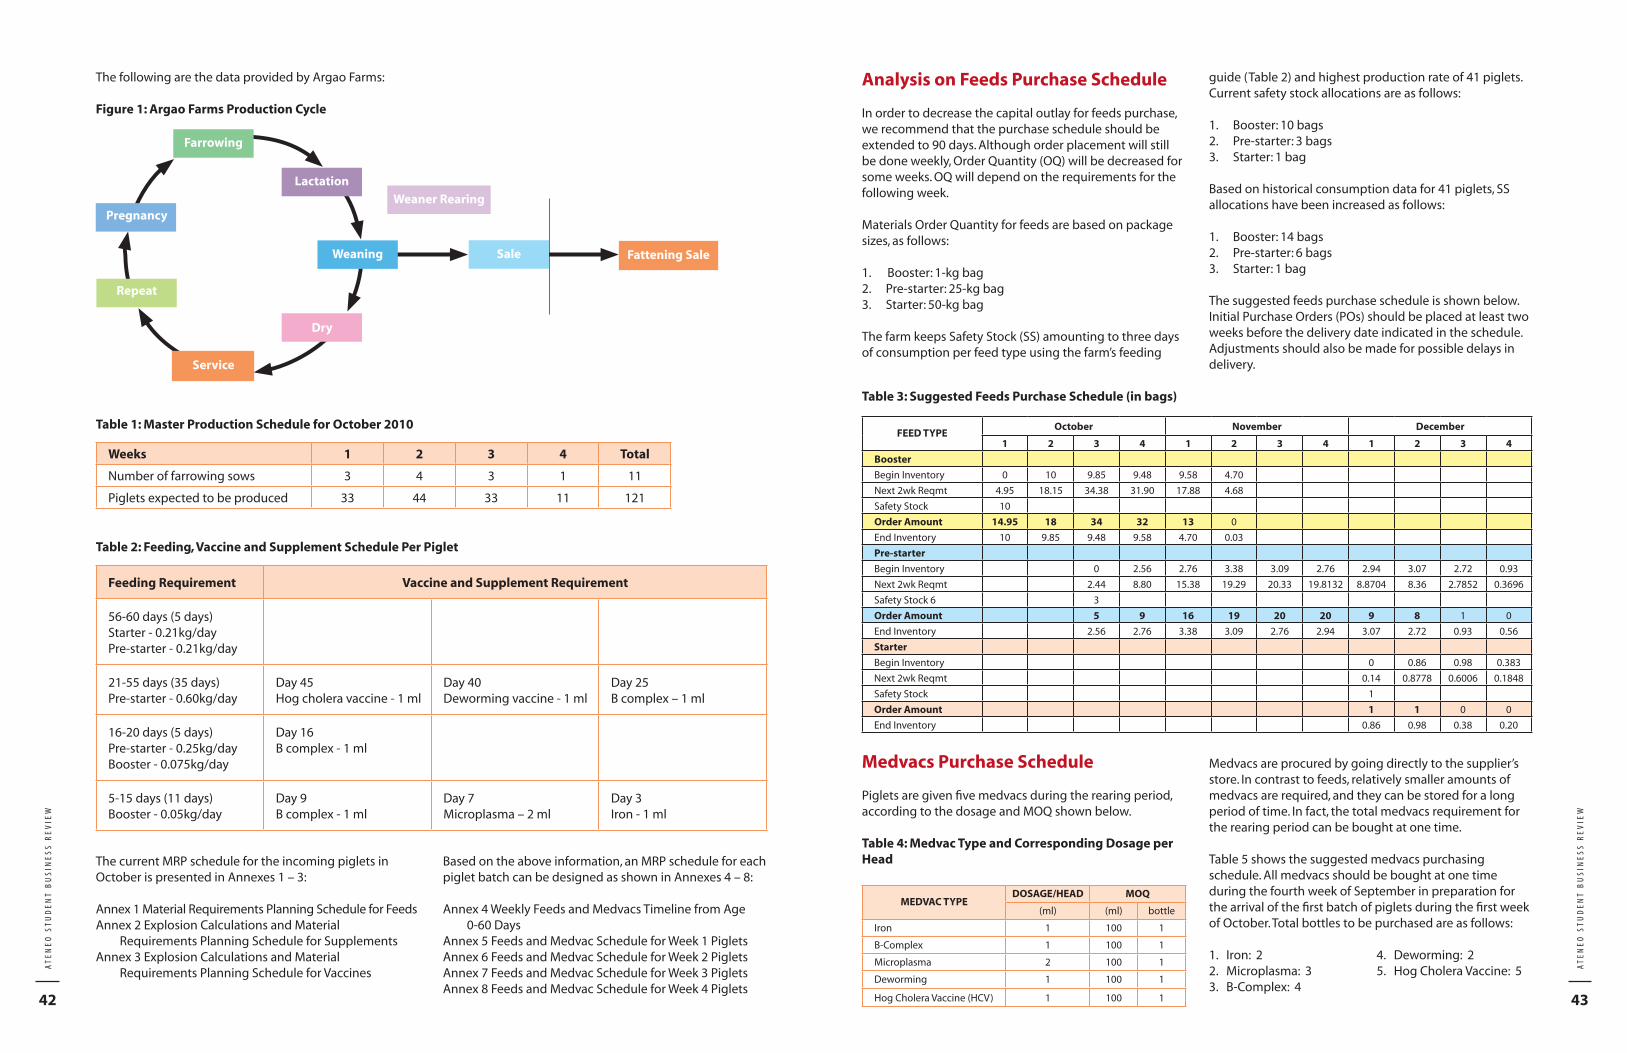
43
ATE
NEO
STU
DEN
T B
USI
NES
S R
EVIE
W
42
ATE
NEO
STU
DEN
T B
USI
NES
S R
EVIE
W
The following are the data provided by Argao Farms:
Figure 1: Argao Farms Production Cycle
Table 1: Master Production Schedule for October 2010
Weeks 1 2 3 4 Total
Number of farrowing sows 3 4 3 1 11
Piglets expected to be produced 33 44 33 11 121
Table 2: Feeding, Vaccine and Supplement Schedule Per Piglet
Feeding Requirement Vaccine and Supplement Requirement
56-60 days (5 days)Starter - 0.21kg/dayPre-starter - 0.21kg/day
21-55 days (35 days)Pre-starter - 0.60kg/day
Day 45Hog cholera vaccine - 1 ml
Day 40Deworming vaccine - 1 ml
Day 25B complex – 1 ml
16-20 days (5 days)Pre-starter - 0.25kg/dayBooster - 0.075kg/day
Day 16B complex - 1 ml
5-15 days (11 days)Booster - 0.05kg/day
Day 9B complex - 1 ml
Day 7Microplasma – 2 ml
Day 3Iron - 1 ml
The current MRP schedule for the incoming piglets in October is presented in Annexes 1 – 3:
Annex 1 Material Requirements Planning Schedule for FeedsAnnex 2 Explosion Calculations and Material
Requirements Planning Schedule for SupplementsAnnex 3 Explosion Calculations and Material
Requirements Planning Schedule for Vaccines
Based on the above information, an MRP schedule for each piglet batch can be designed as shown in Annexes 4 – 8:
Annex 4 Weekly Feeds and Medvacs Timeline from Age 0-60 Days
Annex 5 Feeds and Medvac Schedule for Week 1 PigletsAnnex 6 Feeds and Medvac Schedule for Week 2 PigletsAnnex 7 Feeds and Medvac Schedule for Week 3 PigletsAnnex 8 Feeds and Medvac Schedule for Week 4 Piglets
Analysis on Feeds Purchase Schedule
In order to decrease the capital outlay for feeds purchase, we recommend that the purchase schedule should be extended to 90 days. Although order placement will still be done weekly, Order Quantity (OQ) will be decreased for some weeks. OQ will depend on the requirements for the following week.
Materials Order Quantity for feeds are based on package sizes, as follows:
1. Booster: 1-kg bag2. Pre-starter: 25-kg bag3. Starter: 50-kg bag
The farm keeps Safety Stock (SS) amounting to three days of consumption per feed type using the farm’s feeding
Weaner Rearing
Farrowing
Service
Repeat
Weaning
Lactation
Dry
Sale Fattening Sale
guide (Table 2) and highest production rate of 41 piglets. Current safety stock allocations are as follows:
1. Booster: 10 bags 2. Pre-starter: 3 bags 3. Starter: 1 bag
Based on historical consumption data for 41 piglets, SS allocations have been increased as follows:
1. Booster: 14 bags2. Pre-starter: 6 bags3. Starter: 1 bag
The suggested feeds purchase schedule is shown below. Initial Purchase Orders (POs) should be placed at least two weeks before the delivery date indicated in the schedule. Adjustments should also be made for possible delays in delivery.
Table 3: Suggested Feeds Purchase Schedule (in bags)
Medvacs Purchase Schedule
Piglets are given five medvacs during the rearing period, according to the dosage and MOQ shown below.
Table 4: Medvac Type and Corresponding Dosage per Head
MEDVAC TYPEDOSAGE/HEAD MOQ
(ml) (ml) bottle
Iron 1 100 1
B-Complex 1 100 1
Microplasma 2 100 1
Deworming 1 100 1
Hog Cholera Vaccine (HCV) 1 100 1
Medvacs are procured by going directly to the supplier’s store. In contrast to feeds, relatively smaller amounts of medvacs are required, and they can be stored for a long period of time. In fact, the total medvacs requirement for the rearing period can be bought at one time.
Table 5 shows the suggested medvacs purchasing schedule. All medvacs should be bought at one time during the fourth week of September in preparation for the arrival of the first batch of piglets during the first week of October. Total bottles to be purchased are as follows:
1. Iron: 2 4. Deworming: 22. Microplasma: 3 5. Hog Cholera Vaccine: 53. B-Complex: 4
FEED TYPE October November December
1 2 3 4 1 2 3 4 1 2 3 4
Booster
Begin Inventory 0 10 9.85 9.48 9.58 4.70
Next 2wk Reqmt 4.95 18.15 34.38 31.90 17.88 4.68
Safety Stock 10
Order Amount 14.95 18 34 32 13 0
End Inventory 10 9.85 9.48 9.58 4.70 0.03
Pre-starter
Begin Inventory 0 2.56 2.76 3.38 3.09 2.76 2.94 3.07 2.72 0.93
Next 2wk Reqmt 2.44 8.80 15.38 19.29 20.33 19.8132 8.8704 8.36 2.7852 0.3696
Safety Stock 6 3
Order Amount 5 9 16 19 20 20 9 8 1 0
End Inventory 2.56 2.76 3.38 3.09 2.76 2.94 3.07 2.72 0.93 0.56
Starter
Begin Inventory 0 0.86 0.98 0.383
Next 2wk Reqmt 0.14 0.8778 0.6006 0.1848
Safety Stock 1
Order Amount 1 1 0 0
End Inventory 0.86 0.98 0.38 0.20
Pregnancy

45
ATE
NEO
STU
DEN
T B
USI
NES
S R
EVIE
W
44
ATE
NEO
STU
DEN
T B
USI
NES
S R
EVIE
W
Cost-Benefit Analysis (CBA)
Table 6 shows a 60-day MRP weekly schedule and costs for the rearing period. In contrast, Table 7 shows a suggested MRP schedule which has expanded the purchase period to 90 days, along with the corresponding costs.
Cost savings of 3.47% obtained from following the 90-day MRP weekly schedule is shown in Table 8.
For purposes of comparison, feeds prices used in this study are based on the prevailing Suggested Retail Price (SRP) of Universal Feed Mill Corporation in Cebu. It should not be inferred that Argao farms uses the said brand.
Table 5: Suggested Medvac Purchasing Schedule (in bottle units)
Table 6: Current 60-Day Feeds MRP Schedule and Costs
Table 7: Suggested 90-Day Feeds MRP Schedule and Costs
MEDVAC October November December
1 2 3 4 1 2 3 4 1 2 3 4
Iron
Beginning Inventory 0 1.67 1.23 0.9
Current Week Requirement 0.33 0.44 0.33 0.11
Safety Stock 1
Order Amount 2 0 0 0 – – – – – – – –
End Inventory 1.67 1.23 0.9 0.79
Microplasma
Begin Inventory 300 234 113 47
Current Week Requirement 121 66 22
Safety Stock 6 1
Order Amount 3 0 0 0 – – – – – – – –
End Inventory 2.34 1.13 0.47 0.25
B-Complex
Begin Inventory 0 3.23 2.13 1.25 0.81
Current Week Requirement 0.77 1.1 0.88 0.44 0.11
Safety Stock 1
Order Amount 4 0 0 0 0 – – – – –
End Inventory 3.23 2.13 1.25 0.81 0.7
Deworming
Begin Inventory 0 1.67 1.23 0.9
Current Week Requirement 0.33 0.44 0.33 0.11
Safety Stock 1
Order Amount 2 0 0 0
End Inventory 1.67 1.23 0.9 0.79
HCV
Begin Inventory 0 1.67 1.23 0.9
Current Week Requirement 0.33 0.44 0.33 0.11
Safety Stock 1
Order Amount 2 0 0
End Inventory 1.67 1.23 0.9 0.79
FEED TYPE PRICE PER SACK
October November TOTAL
1 2 3 4 1 2 3 4
Booster
Order/Amount 40 41 31 10 122
Cost/Bag 64
Cost/week 2,560 2,624 1,984 640 7,808
Pre-starter
Order/Amount 13 10 3 21 28 21 7 103
Cost/Bag 927
Cost/week 12,051 9,270 2,781 19,467 25,956 19,467 6,489 95,481
Starter
Order/Amount 1 1 1 3
Cost/Bag 1178
Cost/week 1,178 1,178 1,178 3,534
Feed Cost/week 14,611 11,894 4,765 20,107 27,134 20,645 7,667 106,823
FEED TYPE PRICE
PER SACK October November December
TOTAL1 2 3 4 1 2 3 4 1 2 3 4
Booster
Order/Amount 15 18 34 32 13 97
Cost/Bag 64
Cost/week 960 1,152 2,176 2,048 832 6,208
Pre-starter
Order/Amount 5 9 16 19 20 20 9 8 102
Cost/Bag 927
Cost/week 4,635 8,343 14,832 17,613 18,540 18,540 8,343 7,416 927 94,554
Starter
Order/Amount 1 1 2
Cost/Bag 1178
Cost/week 1,178 1,178 2,356
Feed Cost/week 960 1,152 6,811 10,391 15,664 17,613 18,540 18,540 9,521 8,594 927 103,118
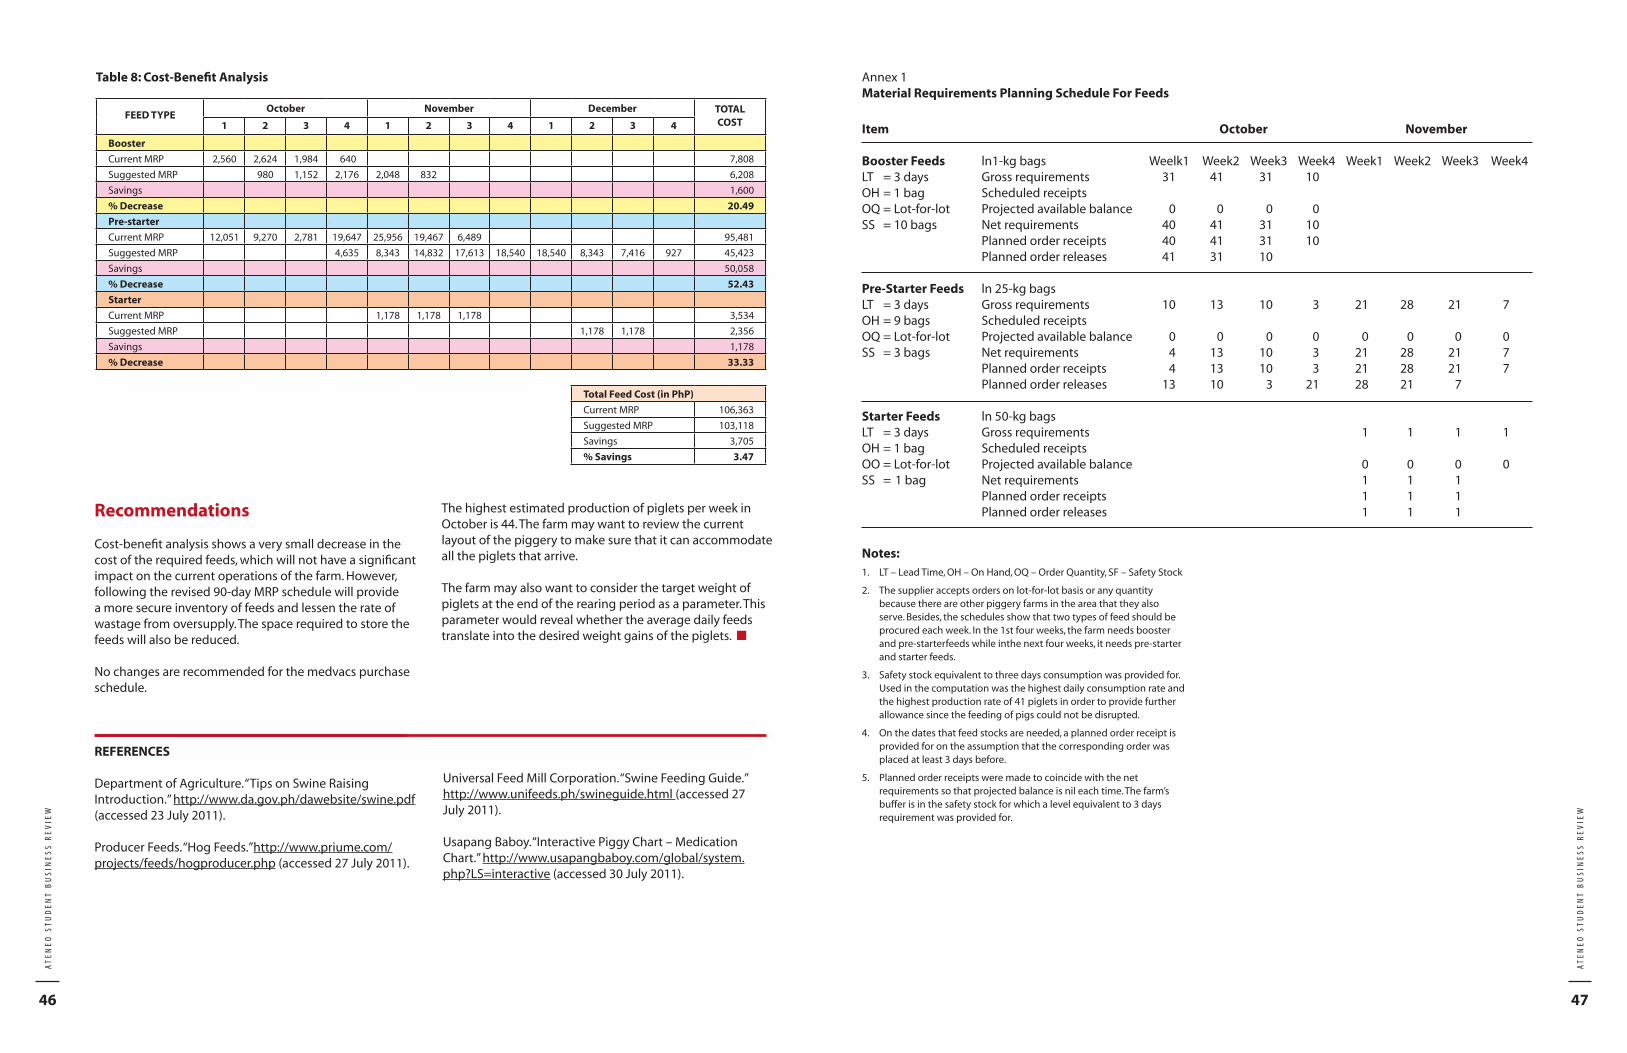
47
ATE
NEO
STU
DEN
T B
USI
NES
S R
EVIE
W
46
ATE
NEO
STU
DEN
T B
USI
NES
S R
EVIE
W
Recommendations
Cost-benefit analysis shows a very small decrease in the cost of the required feeds, which will not have a significant impact on the current operations of the farm. However, following the revised 90-day MRP schedule will provide a more secure inventory of feeds and lessen the rate of wastage from oversupply. The space required to store the feeds will also be reduced.
No changes are recommended for the medvacs purchase schedule.
The highest estimated production of piglets per week in October is 44. The farm may want to review the current layout of the piggery to make sure that it can accommodate all the piglets that arrive.
The farm may also want to consider the target weight of piglets at the end of the rearing period as a parameter. This parameter would reveal whether the average daily feeds translate into the desired weight gains of the piglets. n
Table 8: Cost-Benefit Analysis
REFERENCES
Department of Agriculture. “Tips on Swine Raising Introduction.” http://www.da.gov.ph/dawebsite/swine.pdf (accessed 23 July 2011).
Producer Feeds. “Hog Feeds.”http://www.priume.com/projects/feeds/hogproducer.php (accessed 27 July 2011).
FEED TYPE October November December TOTAL
COST1 2 3 4 1 2 3 4 1 2 3 4
Booster
Current MRP 2,560 2,624 1,984 640 7,808
Suggested MRP 980 1,152 2,176 2,048 832 6,208
Savings 1,600
% Decrease 20.49
Pre-starter
Current MRP 12,051 9,270 2,781 19,647 25,956 19,467 6,489 95,481
Suggested MRP 4,635 8,343 14,832 17,613 18,540 18,540 8,343 7,416 927 45,423
Savings 50,058
% Decrease 52.43
Starter
Current MRP 1,178 1,178 1,178 3,534
Suggested MRP 1,178 1,178 2,356
Savings 1,178
% Decrease 33.33
Annex 1Material Requirements Planning Schedule For Feeds
Item
Booster FeedsLT = 3 daysOH = 1 bagOQ = Lot-for-lotSS = 10 bags
Pre-Starter FeedsLT = 3 daysOH = 9 bagsOQ = Lot-for-lotSS = 3 bags
Starter FeedsLT = 3 daysOH = 1 bagOO = Lot-for-lotSS = 1 bag
ln1-kg bagsGross requirementsScheduled receiptsProjected available balanceNet requirementsPlanned order receiptsPlanned order releases
ln 25-kg bagsGross requirementsScheduled receiptsProjected available balanceNet requirementsPlanned order receiptsPlanned order releases
ln 50-kg bagsGross requirementsScheduled receiptsProjected available balanceNet requirementsPlanned order receiptsPlanned order releases
October November
Weelk1 Week2 Week3 Week4 Week1 Week2 Week3 Week4 31 41 31 10
0 0 0 0 40 41 31 10 40 41 31 10 41 31 10
10 13 10 3 21 28 21 7
0 0 0 0 0 0 0 0 4 13 10 3 21 28 21 7 4 13 10 3 21 28 21 7 13 10 3 21 28 21 7 1 1 1 1 0 0 0 0 1 1 1 1 1 1 1 1 1
Notes:1. LT – Lead Time, OH – On Hand, OQ – Order Quantity, SF – Safety Stock
2. The supplier accepts orders on lot-for-lot basis or any quantity because there are other piggery farms in the area that they also serve. Besides, the schedules show that two types of feed should be procured each week. In the 1st four weeks, the farm needs booster and pre-starterfeeds while inthe next four weeks, it needs pre-starter and starter feeds.
3. Safety stock equivalent to three days consumption was provided for. Used in the computation was the highest daily consumption rate and the highest production rate of 41 piglets in order to provide further allowance since the feeding of pigs could not be disrupted.
4. On the dates that feed stocks are needed, a planned order receipt is provided for on the assumption that the corresponding order was placed at least 3 days before.
5. Planned order receipts were made to coincide with the net requirements so that projected balance is nil each time. The farm’s buffer is in the safety stock for which a level equivalent to 3 days requirement was provided for.
Total Feed Cost (in PhP)
Current MRP 106,363
Suggested MRP 103,118
Savings 3,705
% Savings 3.47
Universal Feed Mill Corporation. “Swine Feeding Guide.” http://www.unifeeds.ph/swineguide.html (accessed 27 July 2011).
Usapang Baboy. “Interactive Piggy Chart – Medication Chart.” http://www.usapangbaboy.com/global/system.php?LS=interactive (accessed 30 July 2011).

49
ATE
NEO
STU
DEN
T B
USI
NES
S R
EVIE
W
48
ATE
NEO
STU
DEN
T B
USI
NES
S R
EVIE
W
Annex 2Explosion Calculations and Material Requirements Planning Schedule For Supplements
Iron
MRP ScheduleLT = 3 daysOH = 1 bottle (100ml)OQ = 1 bottle (100ml)SS = 1 bottle (100ml)
B-Complex
MRP ScheduleLT = 3 days OH = 1 bottle (100ml)OQ = 1 bottle (100ml)SS = 1 bottle (100ml)
Explosion CalculationNo. of PigletsDosage: 1ml/pigletTotal Requirement (in ml)
Gross requirements (in ml)Scheduled receiptsProjected available balanceNet requirementsPlanned order receiptsPlanned order releases
Explosion CalculationNo. of pigletsDosage: 21 ml to be given 3 timesTotal Requirement (in ml)
Gross requirements (in ml)Scheduled receiptsProjected available balanceNet requirementsPlanned order receiptsPlanned order releases
October
Weelk1 Week2 Week3 Week4 33 44 33 11 1 1 1 1 33 44 33 11
33 44 33 11 167 123 90 79 200 200
October
Weelk1 Week2 Week3 Week4 33 44 33 11 3 3 3 3 99 132 99 33
99 132 99 33 301 169 70 37
400
Note:Supplements are bought directly from the distributor or supplier rather than delivered to the farm site. Thus, it is suggested that the farm owner procure their supplement needs at the start of the rearing period to avoid frequent trips to the supplier, who is in Cebu City and not in Argao where the farm is located. The requirements are small, anyway: 2 bottles for iron and 2 bottles for B-Complex.
Annex 3Explosion Calculations and Material Requirements Planning Schedule for Vaccines
Microplasma
MRP ScheduleLT = 3 daysOH = 1 bottle (100ml)OQ = 1 bottle (100ml)SS = 1 bottle (100ml)
Deworming Vaccine
MRP ScheduleLT = 3 daysOH = 1 bottleOQ = 1 bottleSS = 1 bottle
Hog Cholera Vaccine
MRP ScheduleLT = 3 daysOH = 1 bottleOQ = 1 bottleSS = 1 bottle
Explosion CalculationNo. of PigletsDosage: 2mI/pigletTotal Requirement (in ml)
Gross requirements (in ml)Scheduled receiptsProjected available balanceNet requirementsPlanned order receiptsPlanned order releases
Explosion Calculation WeekNo. of PigletsDosage: 1m|/pigletTotal Requirement (in ml)
Gross requirements (in ml)Scheduled receiptsProjected available balanceNet requirementsPlanned order receiptsPlanned order releases
Explosion Calculation WeekNo. of PigletsDosage: 1m|/pigletTotal Requirement (in ml)
Gross requirements (in ml)Scheduled receiptsProjected available balanceNet requirementsPlanned order receiptsPlanned order releases
MicroplasmaWeelk1 Week2 Week3 Week4 33 44 33 11 2 2 2 2 66 88 66 22
66 88 66 22
234 146 80 85
300
Deworming Vaccine October NovemberWeelk1 Week2 Week3 Week4 Week1 Week2 Week3 Week4 33 44 33 11 1 1 1 1 33 44 33 11 33 44 33 11 167 123 90 79 200
Hog Cholera Vaccine October NovemberWeelk1 Week2 Week3 Week4 Week1 Week2 Week3 Week4 33 44 33 11 1 1 1 1 33 44 33 11 33 44 33 11 300 200 100 0 400
Notes:1. As with supplements, it is suggested that the vaccines be purchased
on or before the dates they are first needed to avoid frequent trips to the supplier, who is in Cebu City rather than in the farm site in Argao.
2. The deworming vaccine is given on the 40th day, while the hog cholera vaccine is given on the 45th day. The procurement could therefore be made later, i.e., at the start ofthe second month rather than during the 1st month.
3. The hog cholera vaccine has a diluent that makes it imperative for unused portions remaining in the bottle to be thrown away. Hence, the assumption that 100 ml or one bottle is used each time.

51
ATE
NEO
STU
DEN
T B
USI
NES
S R
EVIE
W
50
ATE
NEO
STU
DEN
T B
USI
NES
S R
EVIE
W
WEE
K 1
WEE
K 2
W
EEK
3 W
EEK
4W
EEK
5W
EEK
6W
EEK
7W
EEK
8
WEE
K 9
WEE
K 1
0 W
EEK
11
WEE
K 1
2
PIG
LETS
1D
ays
Reqm
tD
ays
Reqm
tD
ays
Reqm
tD
ays
Reqm
tD
ays
Reqm
tD
ays
Reqm
tD
ays
Reqm
tD
ays
Reqm
tD
ays
Reqm
tD
ays
Reqm
tD
ays
Reqm
t D
ays
Reqm
tB
oo
ster
1
31.
657
3.85
10.
55B
oo
ster
25
4.12
5Pr
e-st
arte
r 15
13.7
5Pr
e-st
arte
r 2
16.
67
46.2
746
.27
46.2
746
.26
39.6
Pre-
star
ter 3
1
2.31
49.
24St
arte
r1
2.31
49.
24Ir
on
1
11M
icro
pla
sma
122
B-C
om
ple
x
1
111
111
11D
ewo
rmin
g
111
HC
V1
11
Un
it a
mo
un
t in
kilo
s: B
oo
ster
1, B
oo
ster
2, P
re-s
tart
er 1
, Pre
-sta
rter
2, P
re-s
tart
er 3
, Sta
rter
Un
it a
mo
un
t in
mill
ilite
rs: I
ron
, Mic
rop
lasm
a, B
-Co
mp
lex,
Dew
orm
ing,
HC
V
WEE
K 1
WEE
K 2
WEE
K3
WEE
K 4
WEE
K 5
WEE
K 6
WEE
K 7
WEE
K 8
WEE
K 9
1 2
3
4
5 6
7
1 2
3
4
5 6
7
1 2
3
4
5 6
7
1 2
3
4
5 6
7
1 2
3
4
5 6
7
1 2
3
4
5 6
7
1 2
3
4
5 6
7
1 2
3
4
5 6
7
1 2
3
4
5 6
7
PIG
LETS
1
F
eed
M
edva
c
PIG
LETS
2
F
eed
M
edva
c
PIG
LETS
3
F
eed
M
edva
c
PIG
LETS
4
F
eed
M
edva
c
FEED
TY
PE
CO
NSU
MP
TIO
N /
HEA
D (
in g
) M
EDV
AC
D
OSA
GE
/ HEA
D (i
n m
l)
Bo
ost
er 1
50
Iro
n
1
B
oo
ster
2
75
M
icro
pla
sma
2
P
re-s
tart
er 1
25
0
B-c
om
ple
z 1
P
re-s
tart
er 2
60
0
Dew
orm
ing
1
P
re-s
tart
er 3
21
0
HC
V
1
St
arte
r 21
0
WEE
K 1
WEE
K 2
W
EEK
3 W
EEK
4W
EEK
5W
EEK
6W
EEK
7W
EEK
8
WEE
K 9
WEE
K 1
0 W
EEK
11
WEE
K 1
2
PIG
LETS
1D
ays
Reqm
tD
ays
Reqm
tD
ays
Reqm
tD
ays
Reqm
tD
ays
Reqm
tD
ays
Reqm
tD
ays
Reqm
tD
ays
Reqm
tD
ays
Reqm
tD
ays
Reqm
tD
ays
Reqm
t D
ays
Reqm
tB
oo
ster
13
4.9
57
11.
55 1
1.6
5B
oo
ster
2 5
12.3
75Pr
e-st
arte
r 15
14.2
5Pr
e-st
arte
r 2
119
.8
713
8.6
713
8.6
7 1
38.6
7
138.
6 6
118.
8Pr
e-st
arte
r 3
16.
934
27.7
2St
arte
r1
6.93
427
.72
Iro
n1
33M
icro
pla
sma
166
133
B-C
om
ple
x
133
1
33D
ewo
rmin
g
133
HC
V1
33
Un
it a
mo
un
t in
kilo
s: B
oo
ster
1, B
oo
ster
2, P
re-s
tart
er 1
, Pre
-sta
rter
2, P
re-s
tart
er 3
, Sta
rter
Un
it a
mo
un
t in
mill
ilite
rs: I
ron
, Mic
rop
lasm
a, B
-Co
mp
lex,
Dew
orm
ing,
HC
V
WEE
K 1
WEE
K 2
W
EEK
3 W
EEK
4W
EEK
5W
EEK
6W
EEK
7W
EEK
8
WEE
K 9
WEE
K 1
0 W
EEK
11
WEE
K 1
2
PIG
LETS
1D
ays
Reqm
tD
ays
Reqm
tD
ays
Reqm
tD
ays
Reqm
tD
ays
Reqm
tD
ays
Reqm
tD
ays
Reqm
tD
ays
Reqm
tD
ays
Reqm
tD
ays
Reqm
tD
ays
Reqm
t D
ays
Reqm
tB
oo
ster
1
36.
6 7
15.4
12.
2B
oo
ster
25
16.5
Pre-
star
ter 1
555
Pre-
star
ter 2
1
26.4
718
4.8
7
718
4.8
718
4.8
615
8.4
Pre-
star
ter 3
1
9.24
436
.96
Star
ter
19.
244
36.9
6Ir
on
1
44M
icro
pla
sma
188
B-C
om
ple
x
144
1
441
44D
ewo
rmin
g
144
HC
V1
44
Un
it a
mo
un
t in
kilo
s: B
oo
ster
1, B
oo
ster
2, P
re-s
tart
er 1
, Pre
-sta
rter
2, P
re-s
tart
er 3
, Sta
rter
Un
it a
mo
un
t in
mill
ilite
rs: I
ron
, Mic
rop
lasm
a, B
-Co
mp
lex,
Dew
orm
ing,
HC
V
WEE
K 1
WEE
K 2
W
EEK
3 W
EEK
4W
EEK
5W
EEK
6W
EEK
7W
EEK
8
WEE
K 9
WEE
K 1
0 W
EEK
11
WEE
K 1
2
PIG
LETS
1D
ays
Reqm
tD
ays
Reqm
tD
ays
Reqm
tD
ays
Reqm
tD
ays
Reqm
tD
ays
Reqm
tD
ays
Reqm
tD
ays
Reqm
tD
ays
Reqm
tD
ays
Reqm
tD
ays
Reqm
t D
ays
Reqm
tB
oo
ster
1
34.
957
11.5
51
1.65
Bo
ost
er 2
512
.375
Pre-
star
ter 1
541
.25
Pre-
star
ter 2
1
19.8
713
8.6
713
8.6
713
8.6
713
8.6
611
8.8
Pre-
star
ter 3
1
6.93
427
.72
Star
ter
16.
934
27.7
2Ir
on
1
33M
icro
pla
sma
166
B-C
om
ple
x
1
331
331
33D
ewo
rmin
g
133
HC
V1
33
Un
it a
mo
un
t in
kilo
s: B
oo
ster
1, B
oo
ster
2, P
re-s
tart
er 1
, Pre
-sta
rter
2, P
re-s
tart
er 3
, Sta
rter
Un
it a
mo
un
t in
mill
ilite
rs: I
ron
, Mic
rop
lasm
a, B
-Co
mp
lex,
Dew
orm
ing,
HC
V
An
nex
5 –
Fee
ds
and
Med
vac
Sch
edu
le fo
r Wee
k 1
Pig
lets
An
nex
6 –
Fee
ds
and
Med
vac
Sch
edu
le fo
r Wee
k 2
Pig
lets
An
nex
4 –
Wee
kly
Fee
ds
and
Med
vacs
Tim
elin
e fr
om
Ag
e 0
-60
Day
s
An
nex
8 –
Fee
ds
and
Med
vac
Sch
edu
le fo
r Wee
k 4
Pig
lets
An
nex
7 –
Fee
d a
nd
Med
vac
Sch
edu
le fo
r Wee
k 3
Pig
lets

53
ATE
NEO
STU
DEN
T B
USI
NES
S R
EVIE
W
52
ATE
NEO
STU
DEN
T B
USI
NES
S R
EVIE
W
IMPROVING THE EFFICIENCY OF A KIDNEY DONATION PROGRAMIN THE PHILIPPINESJason Pierre E. AmeAlvin G. GoAnna May B. NievaRyan G. PaladRoberto C. Tanchanco
Every year, according to Dr. Enrique Ona, National Kidney and Transplant Institute (NKTI) Executive Director, some 10,000 Filipinos develop kidney failure, mainly from diabetes and high blood pressure. Over the past five years, their numbers have been increasing annually by about 10%. The treatment of choice for irreversible kidney failure is kidney transplantation. So far this rising need has not been met: only 1 in 20 kidney failure patients receive a kidney transplant every year. In addition, the number of kidney transplants from deceased donors has not at all increased in the past 20 years.
Most kidneys come from living donors. The rate of kidney donation from deceased donors in the Philippines is very low at 0.1 per million. Compare this figure to 35 donors per million in Spain. In the Philippines, more deceased donors are needed.
Despite a limited budget, the Department of Health (DOH) has established a Deceased Donor Program (DDP) and has convened a technical working group to advance deceased organ donation in the Philippines.
Statement of the Problem
To improve the efficiency of the national deceased donation program, the technical working group of DOH must answer the following:
1. Is it less costly for an end stage renal disease patient to undergo deceased donor kidney transplantation than to be sustained on dialysis therapy? Monte Carlo Simulation will be used to address this question.
1990
1991
1992
1993
1994
1995
1996
1997
1998
1999
2000
2001
2002
2003
2004
2005
2006
2007
2008
900
800
700
600
500
400
300
200
100
0
LRD LURD DECEASED
Number of Kidney Transplants in the Philippines by Donor Source
LRD – Living related donorLURD – Living unrelated donorDeceased – Deceased donor
2. Does the current process allow the placement of deceased donor kidneys in transplant recipients within 12 to 24 hours? PERT/CPM will be used to answer this question.
Cost Analysis Using Monte Carlo Simulation
The treatment of choice for end stage renal disease (ESRD) is kidney transplantation, with better outcomes achieved from living donors compared to deceased donors. When no living donor is available, ESRD patients must stay on dialysis therapy indefinitely while waiting for a kidney transplant from a deceased donor.
Many Filipino patients—and physicians as well—are unwilling to take the risk of going through with an organ transplant from a deceased donor and would rather stay on dialysis. Deceased donor kidney transplantation is also costlier, but it is not readily clear if in fact staying on dialysis will end up being costlier in the long term. Hence, we have undertaken a Monte Carlo simulation to compare costs associated with the two options.

55
ATE
NEO
STU
DEN
T B
USI
NES
S R
EVIE
W
54
ATE
NEO
STU
DEN
T B
USI
NES
S R
EVIE
W
The initial cost of workup, hospitalization, and transplantation is PhP1 million.
Subsequently, patients incur additional costs because they need to take immunosuppressive medications to prevent organ rejection, undergo regular monitoring tests, and make follow-up visits to the transplant center.
There are four possible outcomes after transplantation: death, graft failure and return to dialysis therapy, graft rejection, and uneventful graft survival.
Risks are highest during first three months after transplantation. During this period, medications are at their highest doses and visits are the most frequent.
After the first three months, risks—and costs—decrease. However, after one year, five years, and ten years, risk of mortality and graft failure progressively increases.
Based on the United States Renal Disease System 2009 data, the risk of dying among transplant recipients at 3 months, 1 year, 5 years, and 10 years is 0.6%, 1.3%, 6.5%, and 18.4%, respectively.
Based on the United States Organ Procurement Transplant Network Scientific Registry of Transplant Recipients’ 2008 Annual Report, the risk of graft loss at 3 months, 1 year, 5 years, and 10 years is 4.7%, 8.6%, 36.1% and 71.9% respectively; and the risk of graft rejection is 33.7%, 23.6%, 46.1% and 76.9%, respectively.
Our simulation analysis divides the transplant recipient population into three age groups: 18 to 34 years old, 35 to 49 years old, and 50 to 64 years old.
Based on the United States Renal Disease System 2009 data, the risk of dying among dialysis patients at 3 months, 1 year, 5 years, and 10 years after starting dialysis is 1.9%, 6.1%, 13.2% and 37.5%, respectively, in the 18 to 34 years age group; 3.0%, 9.9%, 33.1%, and 53.5%, respectively, in the 35 to 49 years age group, and 5.2%, 14.8%, 55.0%, and 82.3%, respectively, in the 50-64 years age group. Philippine data is not available.
Costs attached to each of the four possible outcomes are as follows:
1. Death – Costs of the outcome of death is defined as lost earning capacity until the age of 65 years.
Based on the National Statistical Census Board Report of July 2008, the average monthly wage rate of time-rate workers on full-time basis in non-agricultural establishments is PhP12,525. The cost of the outcome of death was computed as this monthly wage rate multiplied by the number of months from the age at death until the age of 65 years.
For the 18 to 34 years age group, 39 years of lost income was used as the average number of years; for the 35 to 49 years age group, 23 years of lost income was used; and for the 50 to 64 years age group, eight years of lost income was used.
2. Graft Failure – Costs of the outcome of graft failure is defined as the costs incurred before going back to dialysis therapy.
For the purpose of this analysis, we used the costs associated with three months of post-transplantation therapy for those patients who went back to dialysis therapy after three months; costs associated with six months for those who went back after one year; costs associated with two-and-a-half years for those who went back after five years; and costs associated with five years for those who went back after ten years.
3. Graft Rejection – Costs of the outcome of graft rejection is defined as PhP60,000 plus the cost of maintaining the graft, which includes the costs of maintenance immunosuppressive medications, laboratory monitoring, and follow-up visits.
4. Uneventful Graft Survival – The cost of the outcome of uneventful graft survival is defined as the cost of maintaining the graft. These costs are highest during the first three months and decrease over time.
We used the costs associated with three months of post-transplantation therapy for those patients who survived for three months; costs associated with six months for those patients who survived for six months; costs associated with two-and-a-half years for those who went back after five years; and costs associated with five years for those who went back after ten years.
We input into our simulation the probabilities for death for each age group for the different time periods, based on registry data in the United States Renal Disease System 2009 Annual Report. We input the probabilities for graft failure and graft rejection, based on the 2008 Annual Report of the US Organ Procurement Transplant Network Scientific Registry of Transplant Recipients.
We conducted a risk analysis using Oracle’s Crystal Ball simulation software, comparing kidney transplantation and staying on dialysis, and determined the simulated cost difference (dialysis minus transplantation) at each time point, and in total, per age group specified. The summary of this analysis, with a total of 1,000 trials, is shown in the next page.
Age Group Time Point Mean Difference Standard Deviation Mode
18 to 34 years
3 months 4,502,127.36 1,068,057.69 4,805,928.80
1 year 4,042,484.64 1,630,319.25 4,562,940.00
5 years 2,364,791.21 2,418,937.94 4,264,648.00
10 years (213,254.36) 1,154,261.79 (900,000.00)
Total Duration 10,696,148.85 3,385,619.97 12,733,516.80
35 to 49 years
3 months 2,151,858.31 719,693.76 2,401,128.80
1 year 1,876,808.22 911,240.89 2,158,140.00
5 years 815,914.30 1,276,525.06 1,859,848.00
10 years (803,675.40) 229,334.39 (900,000.00)
Total Duration 4,040,905.43 1,764,042.32 5,519,116.80
50 to 64 years
3 months 4,036.43 240,633.21 146,628.80
1 year (140,140.08) 219,540.74 (96,360.00)
5 years (665,642.70) 297,403.19 (394,652.00)
10 years (803,439.60) 232,600.93 (900,000.00)
Total Duration (1,605,185.95) 506,675.42 (1,244,383.20)
Our analysis shows that over a ten year period, staying on dialysis will be more costly than undergoing deceased donor kidney transplantation for patients younger than 50 years old – with a mean difference of PhP10.7 million in the 18 to 34 years age group patients, and PhP4.0 million in the 35 to 49 years age group patients. In contrast, transplantation will be more costly than dialysis for the age group of 50 to 64 years, with a mean difference of PhP1.6 million.
Analysis that focuses only on cost is, of course, limited, but it is an important perspective that the patient takes into account.
PERT/CPM Analysis of Deceased Donor Kidney Placement Process
Organ procurement from deceased donors may proceed only after the declaration of brain death, and only after the donor’s family has given its consent. The shorter the duration from brain death to kidney placement in a recipient, the better the survival of the recipient. From brain death to organ retrieval, the golden period is less than 24 hours, while from organ retrieval to organ placement it is also less than 24 hours. Hence, it is important to make sure that the time spent on each step in the process of organ procurement from deceased donors is kept to a minimum.
Based on an interview with a member of the DOH technical working group, we gathered the following data
regarding the placement process for a deceased donor kidney.
Potential deceased donors are initially identified in a Referring Hospital (RH), which then alerts the nearest Transplant Center (TC). TC then alerts its affiliated Organ Procurement Center (OPC), which is equipped to determine the suitability of deceased donor organs and to obtain the organs. OPC facilitates the process of brain death certification, obtains the consent of the deceased donor’s family, and determines if the deceased donor’s organs are transplantable and do not carry any potential disease, such as an infection or cancer. OPC also does blood typing, which is used to narrow down potential recipients.
Two physicians who must not be members of the transplant team or of hospital management perform the brain death certification. They must independently assess the potential donor and determine if all the criteria for brain death are fulfilled. If they assess the donor to be brain dead, then they repeat their assessment after several hours. Most countries propose anywhere in the range of 2 to 6 hours as an interval between the two assessments. It is only after the second assessment that the potential donor is certified as brain dead and therefore eligible to be an organ donor.
When the deceased donor is found to be eligible, the OPC alerts the Philippine Network for Organ Sharing (PhilNOS). PhilNOS is the national organization created by DOH Administration Order 2010-019 to oversee organ allocation in the Philippines. It maintains a waiting list of

57
ATE
NEO
STU
DEN
T B
USI
NES
S R
EVIE
W
56
ATE
NEO
STU
DEN
T B
USI
NES
S R
EVIE
W
patients in need of organs and also determines which patient in the waiting list will receive the organs from deceased donors.
Among the criteria used to select the patient in the waiting list who will receive the deceased donor’s organs, the most important is the degree of matching between the tissue typing of the donor and the potential recipient. Tissue typing is a genetically based test that focuses on six genetic loci – when all six loci are similar, this is called a full match, and the potential for graft survival is so great that such recipients will receive the highest priority. The turnaround time for obtaining the tissue typing result is 6 hours (range of 5 to 8 hours).
After the most eligible recipients in the list are selected, blood samples from the deceased donor and the potential recipients are tested for compatibility in a process called “tissue cross-matching.” If the tissue cross-matching result
is positive, then the potential recipient’s immune system will reject the organ, and so that potential recipient is disqualified from receiving the donor’s organ. Once the first eligible recipient is contacted, organ transplantation proceeds. The turnaround time for obtaining the cross matching result is 1 hour (range is 1 to 2 hours).
The shorter the duration of time between brain death and actual placement of the donor kidney in a recipient, the better is the outcome and survival of the recipient. The “golden period,” which is the duration that best correlates with improved graft survival, is less than 24 hours from the time of brain death to the time of organ retrieval, and also less than 24 hours from the time of organ retrieval to the time of organ placement.
The process described above may be diagrammed as follows:
The possible pathways from the point of brain death are:
t i Variance
DFG 6.5 hours 0.51
DFHIJKLMN 22.5 hours 1.36
EJKLMN 5.2 hours 0.17
The critical path is DFHIJKLMN with an expected duration of 22.5 hours.
To compute for the probability that the duration from brain death to organ placement, represented by the sequence “DFHIJKLMN”, will be less than 24 hours:
• S i2 DFHIJKLMN = 1.36
• S i DFHIJKLMN = 1.17 • F[(X–μ)/σ] =F[(24hours–μDFHIJKLMN)/Si DFHIJKLMN] = F [(24 – 22.5) / 1.17)] = F(1.28) • AtZ <=1.28,probability=89.97%
Hence, there is still a 10.03% chance that the process will take longer than 24 hours. The team would like to reduce this chance to zero, if possible, so that outcomes are optimized. There are two possible options:
1. Reduce the interval between the first and second assessment for brain death from 6 hours to 2 hours. There would be no additional cost incurred.
2. Obtain an additional HLA tissue typing machine, which will cost PhP2 million.
Since the policy change to set brain death certification at 2 hours entails no capital expenditure or added cost, shortening the duration of this step was analyzed first. Setting brain death certification at 2 hours will shorten the mean duration of DFHIJKLM to 19 hours, with a standard deviation of 0.96. Hence, the probability that the duration from brain death to organ placement will be 24 hours or less will be:
• S i2 DFHIJKLMN = 0.92
• S i DFHIJKLMN = 0.96 • F[(X–μ)/σ] = F[(24hours–μDFHIJKLMN)/Si DFHIJKLMN] = F [(24 – 19) / 0.96)] = F(5.2) • AtZ <= 5.2,probability>99.99%
Since the policy change of reducing brain death certification to 2 hours will already increase the probability of achieving organ placement within 24 hours of brain death to > 99.99%, then there is really no need to obtain a new HLA typing machine to achieve the same end.
Conclusion
The Monte Carlo Simulation demonstrated that for ESRD patients less than 50 years old, it is less costly to transplant a deceased donor organ than to sustain them on dialysis therapy.
The PERT/CPM analysis demonstrated that the duration of the process of organ procurement from deceased donors can be shortened to less than 24 hours if the brain death certification process is shortened from 6 to 2 hours. n
Step a i (hrs) m i (hrs) b i (hrs) t i s i s i2
A. Referral Hospital (RH) refers donor - - -
B. Transplant Center (TC) receives referral 2 3 6 3.3 0.67 0.44
C. TC Informs Organ Procurement Center (OPC) 0.1 0.1 0.1 0.1 0.00 0.00
D. Brain Death Certification 2 6 6 5.3 0.67 0.44
E. Blood Typing 0.5 0.5 1 0.6 0.08 0.01
F. TC Obtains Consent for Donation 0.5 1 2 1.1 0.25 0.06
G. Philippine Network for Organ Sharing 0.1 0.1 0.1 0.1 0.00 0.00
H. Comprehensive Lab Exams Done 2 6 6 5.3 0.67 0.44
I. HLA Tissue Typing Done 5 6 8 6.2 0.50 0.25
J. PhilNOS Informed of Laboratory Results 0.5 0.5 1 0.6 0.08 0.01
K. Organ Allocation Done, Recipients Identified 0.25 0.5 1 0.5 0.07 0.01
L. Recipients and Donor Blood Cross-matching 1 1 2 1.2 0.17 0.03
M. Recipients Contacted 2 2 4 2.3 0.33 0.11
N. Transplantation Done - - -
a i = the shortest duration in hours that the step would take mi = the usual duration in hours that the step would takebi = the longest duration in hours that the step would take t i = the expectation in hours to complete that step s i = the standard deviation of the time to complete that step s i
2 = the variance of the time to complete that step
HStart A B C I
G
D
E J K L M N
F
End
H
Many Filipino patients—and
physicians as well—are
unwilling to take the risk of
going through with an organ
transplant from a deceased
donor and would rather stay
on dialysis.
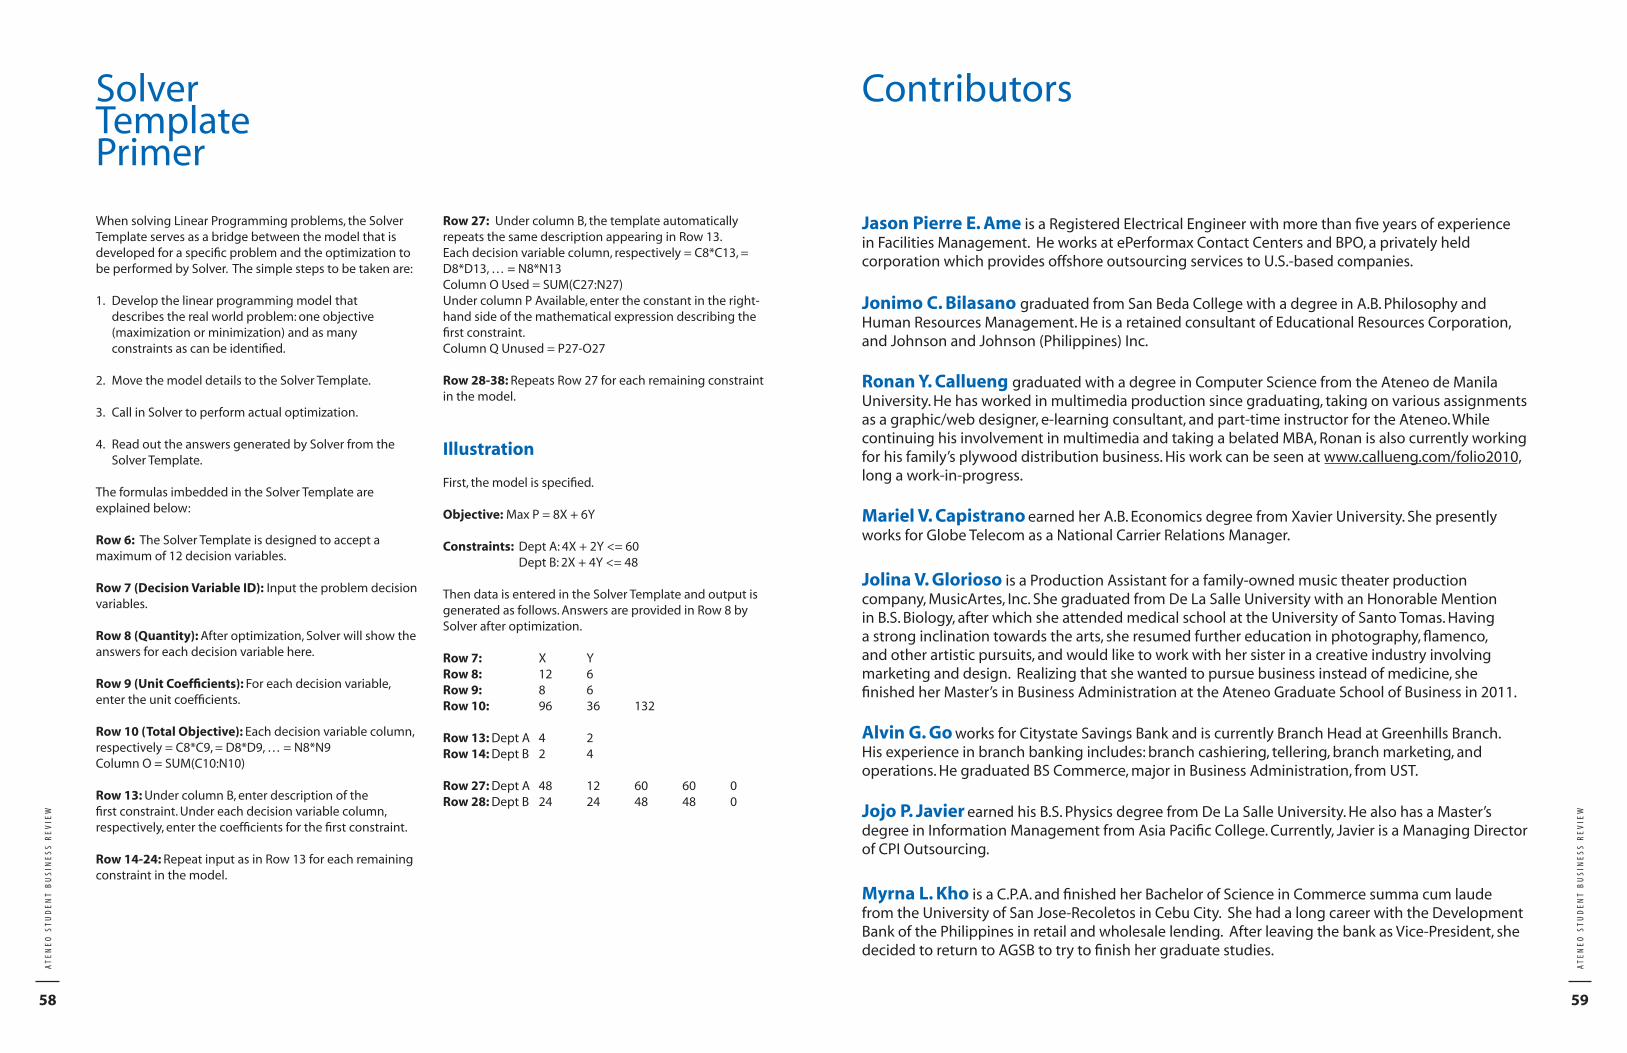
59
ATE
NEO
STU
DEN
T B
USI
NES
S R
EVIE
W
58
ATE
NEO
STU
DEN
T B
USI
NES
S R
EVIE
W
When solving Linear Programming problems, the Solver Template serves as a bridge between the model that is developed for a specific problem and the optimization to be performed by Solver. The simple steps to be taken are:
1. Develop the linear programming model that describes the real world problem: one objective (maximization or minimization) and as many constraints as can be identified.
2. Move the model details to the Solver Template.
3. Call in Solver to perform actual optimization.
4. Read out the answers generated by Solver from the Solver Template.
The formulas imbedded in the Solver Template are explained below:
Row 6: The Solver Template is designed to accept a maximum of 12 decision variables.
Row 7 (Decision Variable ID): Input the problem decision variables.
Row 8 (Quantity): After optimization, Solver will show the answers for each decision variable here.
Row 9 (Unit Coefficients): For each decision variable, enter the unit coefficients.
Row 10 (Total Objective): Each decision variable column, respectively = C8*C9, = D8*D9, … = N8*N9Column O = SUM(C10:N10)
Row 13: Under column B, enter description of the first constraint. Under each decision variable column, respectively, enter the coefficients for the first constraint.
Row 14-24: Repeat input as in Row 13 for each remaining constraint in the model.
Row 27: Under column B, the template automatically repeats the same description appearing in Row 13.Each decision variable column, respectively = C8*C13, = D8*D13, … = N8*N13Column O Used = SUM(C27:N27)Under column P Available, enter the constant in the right-hand side of the mathematical expression describing the first constraint.Column Q Unused = P27-O27
Row 28-38: Repeats Row 27 for each remaining constraint in the model.
Illustration
First, the model is specified.
Objective: Max P = 8X + 6Y
Constraints: Dept A: 4X + 2Y <= 60 Dept B: 2X + 4Y <= 48
Then data is entered in the Solver Template and output is generated as follows. Answers are provided in Row 8 by Solver after optimization.
Row 7: X YRow 8: 12 6 Row 9: 8 6Row 10: 96 36 132
Row 13: Dept A 4 2 Row 14: Dept B 2 4
Row 27: Dept A 48 12 60 60 0Row 28: Dept B 24 24 48 48 0
SolverTemplatePrimer
Contributors
Jason Pierre E. Ame is a Registered Electrical Engineer with more than five years of experience in Facilities Management. He works at ePerformax Contact Centers and BPO, a privately held corporation which provides offshore outsourcing services to U.S.-based companies.
Jonimo C. Bilasano graduated from San Beda College with a degree in A.B. Philosophy and Human Resources Management. He is a retained consultant of Educational Resources Corporation, and Johnson and Johnson (Philippines) Inc.
Ronan Y. Callueng graduated with a degree in Computer Science from the Ateneo de Manila University. He has worked in multimedia production since graduating, taking on various assignments as a graphic/web designer, e-learning consultant, and part-time instructor for the Ateneo. While continuing his involvement in multimedia and taking a belated MBA, Ronan is also currently working for his family’s plywood distribution business. His work can be seen at www.callueng.com/folio2010, long a work-in-progress.
Mariel V. Capistrano earned her A.B. Economics degree from Xavier University. She presently works for Globe Telecom as a National Carrier Relations Manager.
Jolina V. Glorioso is a Production Assistant for a family-owned music theater production company, MusicArtes, Inc. She graduated from De La Salle University with an Honorable Mention in B.S. Biology, after which she attended medical school at the University of Santo Tomas. Having a strong inclination towards the arts, she resumed further education in photography, flamenco, and other artistic pursuits, and would like to work with her sister in a creative industry involving marketing and design. Realizing that she wanted to pursue business instead of medicine, she finished her Master’s in Business Administration at the Ateneo Graduate School of Business in 2011.
Alvin G. Go works for Citystate Savings Bank and is currently Branch Head at Greenhills Branch. His experience in branch banking includes: branch cashiering, tellering, branch marketing, and operations. He graduated BS Commerce, major in Business Administration, from UST.
Jojo P. Javier earned his B.S. Physics degree from De La Salle University. He also has a Master’s degree in Information Management from Asia Pacific College. Currently, Javier is a Managing Director of CPI Outsourcing.
Myrna L. Kho is a C.P.A. and finished her Bachelor of Science in Commerce summa cum laude from the University of San Jose-Recoletos in Cebu City. She had a long career with the Development Bank of the Philippines in retail and wholesale lending. After leaving the bank as Vice-President, she decided to return to AGSB to try to finish her graduate studies.

61
ATE
NEO
STU
DEN
T B
USI
NES
S R
EVIE
W
60
ATE
NEO
STU
DEN
T B
USI
NES
S R
EVIE
W
Contributors
Nikki Rose M. Lee is the Brand Manager for the Non-Sugar Sparkling business of The Coca-Cola Export Corporation. She graduated from the University of the Philippines, Diliman, Quezon City with a Bachelor’s Degree in Business Economics.
Maristel Abigail R. Lim earned her B.S. Electronics and Communications degree from the De La Salle University. She is a licensed engineer and currently works as an Information Technology Manager at MRL Cybertec Corporation.
Anna May B. Nieva is presently the Chief Financial Officer of One Subic Power Generation Corporation and was formerly Group Head and Assistant Vice President for Corporate Banking Group - Branch Credit of the Bank of Commerce. She holds a Bachelor of Arts major in Economics from Assumption College. She is also a graduate of University of Asia and the Pacific’s Strategic Business and Economics Program.
Cerissa Camelle C. Obillos graduated from the Ateneo de Manila University with a degree in European Studies (International Relations) and a minor in Hispanic Studies. She is currently working at China Banking Corporation and will soon join the Asian Development Bank. She recently completed her Master’s degree in Business Administration at the Ateneo Graduate School of Business.
Sheila M. Quintos graduated from the Technological Institute of the Philippines with a B.S. Accountancy degree. She is a Certified Public Accountant and works as a Business Manager for Chevron Shipping (Singapore).
Ryan G. Palad is connected with Perfetti van Melle as Mentos Candies Brand Manager. In the past, he held a concurrent posting as Brand Manager for Chupa Chups, Smint, and Fruittella portfolios. Having graduated from Ateneo de Manila with a Bachelor’s degree in Management Economics, he initially joined Accenture’s Manila Solutions Office where he worked his way up as Senior Software Engineer. He then entered Universal Robina Corporation’s Branded Consumer Foods Group, where he received training in brand management work.
Roberto C. Tanchanco is a practicing physician and Consultant Director of the Kidney Transplantation Program at The Medical City. He specializes in Internal Medicine, Hypertension, Kidney Diseases, and Dialysis and Transplantation. He is also an Associate Professor of the Ateneo School of Medicine and Public Health, the only school of medicine in the Philippines, that offers a dual degree program — Doctor of Medicine and Masters in Business Administration.

ATENEO DE MANILA UNIVERSITY
Ateneo Professional Schools BuildsNo. 20 Rockwell Drive, Rockwell Center
Makati City, 1200, PhilippinesTel No. +62 02 899 7699
Telefax No. +63 02 898 5006