tax year 2008 maryland tax incidence study · this tax incidence study reports the distribution of...
TRANSCRIPT

____________________________________ State of Maryland
Tax Year 2008 Maryland Tax Incidence Study
____________________________________ An analysis of the effect of Maryland’s individual income tax, sales and use tax and excise taxes on Maryland households.
December 2011
Peter Franchot Comptroller of Maryland

80 Calvert Street � P.O. Box 466 • Annapolis, Maryland 21404-0466 • 410-260-7450 • Fax: 410-974-5221 MRS 711 (MD) or 1-800-735-2258 • TTY 410-260-7157 • [email protected]
Peter Franchot Comptroller
David Roose Director Bureau of Revenue Estimates
December 1, 2011 Honorable Martin O’Malley Governor of Maryland State House Annapolis, Maryland 21404 Honorable Thomas V. M. Miller, Jr. President of the Senate State House Annapolis, Maryland 21401 Honorable Michael E. Busch Speaker of the House State House Annapolis, Maryland 21401 Gentlemen:
In compliance with State Finance and Procurement Article 6 – 104(c), and in accordance with § 2 – 1246 of the State Government Article, the Comptroller’s Office has completed the accompanying tax incidence study, measuring the burden of all the major taxes imposed by the State and how that burden is shared among taxpayers of different income levels. This report contains detailed information on the incidence of Maryland’s individual income tax, sales and use tax and excise taxes – including the alcohol, tobacco, motor fuel and motor vehicle titling taxes – based on data collected for tax year 2008. The methodology for this study is based on previous studies of the incidence of Maryland taxes, including work completed by Professor Robert Schwab of the University of Maryland in 1989, and the Maryland Department of Fiscal Services in 1994. This study was a combined effort of members of the Bureau of Revenue Estimates, under the direction of David F. Roose, Director.

Letter to Honorable Martin O’Malley Thomas V. M. Miller Jr., and Michael E. Busch December 1, 2011 Page 2
I hope you find this report to be useful in understanding the State’s tax structure and
how the tax burden is shared among the residents of Maryland.
Sincerely,
Peter Franchot Comptroller
cc: Treasurer Nancy K. Kopp Secretary T. Eloise Foster

1
TABLE OF CONTENTS
EXECUTIVE SUMMARY ................................................................................................ 2
INTRODUCTION .............................................................................................................. 5
METHODOLOGY ............................................................................................................. 6
Definition of a Household........................................................................................... 6 Household Income ...................................................................................................... 7 INDIVIDUAL INCOME TAX................................................................................... 9 SALES AND USE TAX........................................................................................... 10 EXCISE TAXES....................................................................................................... 14
RESULTS AND ANALYSIS........................................................................................... 16
Adjusting for the Federal Tax Offset ................................................................................ 18
Adjusting for Maryland’s Refundable Credits.................................................................. 20
Comparing 2011 and 2009 Maryland Tax Incidence Studies........................................... 22
Looking Forward to 2014 Study....................................................................................... 31
Appendix I: Creation of Tax Units from SOI Data .......................................................... 32
Appendix II: Assigning of a Filing Status to CE Data ..................................................... 33
Bibliography and Further Reading ................................................................................... 35
2
EXECUTIVE SUMMARY
This tax incidence study reports the distribution of the largest sources of Maryland tax revenue – Maryland’s individual income tax, sales and use tax, and the excise taxes (alcohol, tobacco, motor fuel and motor vehicle titling taxes) – for calendar year 2008, the year for which the most recent, complete tax collection data is available. Because they are primarily levied by local governments, the local income tax and property taxes are not included in this analysis. This study consists of the following sections:
conceptual issues relating to tax incidence; methodology used and assumptions made regarding the distribution of
Maryland’s taxes; results and findings of this study for the tax types considered; separate incidence calculations that adjust for the federal tax offset and the State’s
refundable tax credits; A comparison of this study’s results and prior study’s results; A look ahead to the next study of Maryland’s tax incidence, due in 2014.
Key Results
The level of regressivity or progressivity of Maryland’s tax system is determined using a Suits index, which compares the cumulative distribution of the tax burden with the cumulative distribution of income. If the households that earned 10% of all income in the State paid 10% of the taxes, the tax would be proportional and the Suits index would be 0. If households that earned 10% of all the income in the State paid 20% of the taxes, the tax would be regressive and the Suits index would be between 0 and -1. The closer the number is to -1, the more regressive the tax. Conversely, if households earning 10% of all income in the State paid 5% of the taxes, the tax would be progressive and the Suits index would be between 0 and 1. The closer the number is to 1, the more progressive the tax.
For the tax types considered for this study, based on 2008 data, the Suits index for Maryland is -0.13, indicating that Maryland’s tax system, in terms of these three tax types, is slightly regressive. The Suits value for the individual income tax was calculated as 0.06 – slightly progressive – and the Suits values for the sales and use and excise taxes were calculated as -0.31 and -0.39, respectively. In general, these values across tax type are consistent with national trends, as well as the results of previous studies of the incidence of Maryland taxes. A summary of the Suits value, as well as the effective tax rate (ETR) – the amount of tax paid as a percentage of total income – for each tax type is included in the chart below.
3
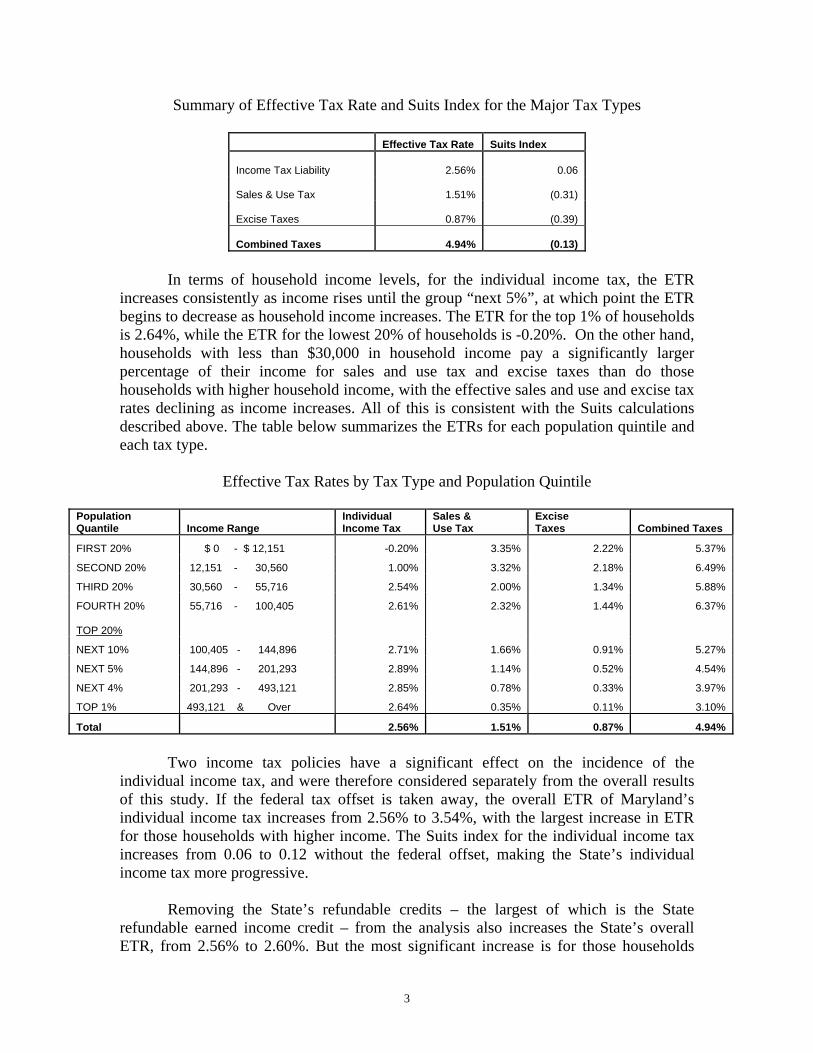
Summary of Effective Tax Rate and Suits Index for the Major Tax Types
Effective Tax Rate Suits Index
Income Tax Liability 2.56%
0.06
Sales & Use Tax 1.51%
(0.31)
Excise Taxes 0.87%
(0.39)
Combined Taxes 4.94%
(0.13)
In terms of household income levels, for the individual income tax, the ETR
increases consistently as income rises until the group “next 5%”, at which point the ETR begins to decrease as household income increases. The ETR for the top 1% of households is 2.64%, while the ETR for the lowest 20% of households is -0.20%. On the other hand, households with less than $30,000 in household income pay a significantly larger percentage of their income for sales and use tax and excise taxes than do those households with higher household income, with the effective sales and use and excise tax rates declining as income increases. All of this is consistent with the Suits calculations described above. The table below summarizes the ETRs for each population quintile and each tax type.
Effective Tax Rates by Tax Type and Population Quintile
Population Quantile Income Range
Individual Income Tax
Sales & Use Tax
Excise Taxes Combined Taxes
FIRST 20% $ 0 - $ 12,151 -0.20% 3.35% 2.22% 5.37%
SECOND 20% 12,151 - 30,560 1.00% 3.32% 2.18% 6.49%
THIRD 20% 30,560 - 55,716 2.54% 2.00% 1.34% 5.88%
FOURTH 20% 55,716 - 100,405 2.61% 2.32% 1.44% 6.37% TOP 20%
NEXT 10% 100,405 - 144,896 2.71% 1.66% 0.91% 5.27%
NEXT 5% 144,896 - 201,293 2.89% 1.14% 0.52% 4.54%
NEXT 4% 201,293 - 493,121 2.85% 0.78% 0.33% 3.97%
TOP 1% 493,121 & Over 2.64% 0.35% 0.11% 3.10%
Total 2.56% 1.51% 0.87% 4.94%
Two income tax policies have a significant effect on the incidence of the
individual income tax, and were therefore considered separately from the overall results of this study. If the federal tax offset is taken away, the overall ETR of Maryland’s individual income tax increases from 2.56% to 3.54%, with the largest increase in ETR for those households with higher income. The Suits index for the individual income tax increases from 0.06 to 0.12 without the federal offset, making the State’s individual income tax more progressive.
Removing the State’s refundable credits – the largest of which is the State refundable earned income credit – from the analysis also increases the State’s overall ETR, from 2.56% to 2.60%. But the most significant increase is for those households

4
earning between approximately $0 and $12,151 in household income; the ETR for this group would increase from -0.20% to 0.34% without the benefit of the refundable credits. Overall, the individual income tax becomes slightly less progressive, with the Suits value decreasing from 0.06 to 0.05. Comparison of law differences between this study and past study
The latest comprehensive study of the incidence of Maryland’s taxes was
completed in 2009 using 2006 tax data. The same methodology was used to create these two reports, however, changes in Maryland’s tax structure have been implemented in Maryland since 2006. State tax policy changes include the expansion of the tax brackets from a top marginal tax rate of 4.75% to a top marginal rate of 6.25%, and the alteration of the personal exemption amount. In 2006 the standard exemption amount was $2,400 per person for all eligible taxpayers. In 2008, the exemption amount was altered to begin at $3,200 for lower-income taxpayers, phased to $600 for higher-income taxpayers based on filing status and federal adjusted gross income. Both policy changes took effect for tax year 2008. In addition, in 2008 the State’s sales and use tax was increased from 5% to 6%. Furthermore, the amount of the earned income credit (EIC) that is refundable, as well as the income requirements that make one eligible for the EIC, were different in 2008 than in 2006. Finally, a number of smaller – though not insignificant – policy changes relating to the individual income tax and excise taxes have taken effect at both the State and federal level between 2006 and 2008. As the Maryland and U.S. economies were vastly different in 2008 than in 2006, it is impossible to determine the extent to which the results in the two studies differ due to tax policy changes. This study will go into further detail on these policy changes between 2006 and 2008, examining how the burden of taxation was expected to shift relative to our results.

5
INTRODUCTION
This tax incidence study reports the distribution of some of the largest sources of Maryland tax revenue – Maryland’s individual income tax, sales and use tax, and the excise taxes (alcohol, tobacco, motor fuel and motor vehicle titling taxes) – for calendar year 2008, the year for which the most recent, complete tax collection data is available. This study attempts to answer the question, “Who pays Maryland’s taxes?”
There is a difference between who is legally responsible for the payment of a tax (known as statutory incidence) and who ultimately experiences a decline in disposable income because of that tax (known as economic incidence). Tax incidence is the study of where the ultimate burden of the tax falls after any “tax shifting” has occurred. Tax shifting is the degree to which the legally liable entity shifts the burden of a tax to another entity. For example, when faced with an increase in the sales tax rate, the actual burden of the increase in tax can fall on consumers in the form of higher prices, on labor in the form of a reduction in wages, or on owners of capital by absorbing the tax increase from gross revenues – the latter could cause a decrease in the company’s dividend payout and/or lower its share price. Thus, many economists argue that taxes are imposed on people, not businesses. A more specific discussion of how tax shifting was determined for this study is presented later in this report.
While it is acceptable to define tax incidence as the amount of taxes paid as a percentage of income after any shifting has taken place, not all economists agree on the inputs used to calculate the burden of taxes (i.e. what exactly makes up “household income”), the time horizon to use (annual or lifetime income), or the methods for distributing the tax among income groups. The bibliography includes tax incidence studies completed by several different states, additional literature regarding methodologies that can be used when studying tax incidence and in-depth discussions of various issues related to the study of tax incidence and the imposition of taxes.
For tax year 2008, the state of Maryland collected approximately $5.5 billion in net individual income taxes. Comparably, in calendar year 2008, the State collected more than $3.9 billion in sales and use tax and just under $1.9 billion from the major excise taxes. Using carefully calculated household income ranges, this incidence study measures the actual burden of taxes on households as a percentage of income earned – which is defined later in this study – in calendar year 2008. This study focuses exclusively on the incidence of the tax types mentioned above. The Distribution of Taxes across Households
Comparing the average percentage of income paid for State taxes at different income levels determines whether a tax is progressive, proportional, or regressive. If the same percentage of income is paid as tax at all income levels, then the tax is proportional. If lower income taxpayers are paying a higher percentage of their income for a certain tax than are higher income taxpayers, then the tax is considered regressive. If higher income taxpayers are paying a higher percentage, then the tax is progressive. The interaction

6
between all of the tax types in any tax system is considered when calculating the overall incidence of a tax system.
Each of the three types of systems has advantages and disadvantages, and advocates and opponents. Most state tax systems are more regressive because, unlike the federal government – which relies heavily on income tax collections, which tend to be more progressive or proportional – states rely more heavily on the sales tax, which is generally found to be regressive. However, it should be noted that using lifetime income as the measure has shown to make this tax more progressive, as lower income households spend a higher proportion of their income. Because states use sales tax, income tax and other tax types as revenue sources, in the aggregate, the overall distribution in any tax system will likely lean one way or the other. Few tax systems are proportional as a whole.
Using the Suits index1, we measure the incidence of each of Maryland’s tax types, as well as its system as a whole, using both data we have collected and results that we have calculated. With a Suits index, we are comparing the cumulative distribution of the tax burden with the cumulative distribution of income. If the households that earned 10% of all income in the State paid 10% of the taxes, the tax would be proportional and the Suits index would be 0. If households that earned 10% of all the income in the State paid 20% of the taxes, the tax would be regressive and the Suits index would be between 0 and -1. The closer the number is to -1, the more regressive the tax. Conversely, if households earning 10% of all income in the State paid 5% of the taxes, the tax would be progressive and the Suits index would be between 0 and 1. The closer the number is to 1, the more progressive the tax. The Suits index as a measure of the incidence of Maryland’s taxes and its tax system will be discussed in further detail in the Results section of this report.
METHODOLOGY
Definition of a Household
This study examines aggregate household income rather than individual income, as the majority of the U.S. Census data used to analyze consumption patterns is reported by household. This requires the aggregation of some individual taxpayer information from the Bureau of Revenue Estimates’ Statistics of Income (SOI) database and data from the U.S. Census into tax units, or tax families. 2
There are situations where the economic unit determined using the SOI tax database may differ from the Census household concept, and where the consumption patterns could change based on how a household is defined; this study attempts to account for as many of these discrepancies as possible. Finally, because this study is an analysis of the tax incidence for residents of Maryland, nonresident and part-year resident 1 Suits, Daniel B., 1977, “Measurement of Tax Progressivity,” American Economic Review, 67:4, pp. 747-752. 2 A more detailed discussion regarding the creation of tax unit is provided in Appendix I.

7
returns were removed from the SOI database before combining those numbers with the Census data.
Household Income
For purposes of this study, total income in Maryland includes income earned from labor and income earned from capital sources. Labor income includes wages and salaries, IRA and other retirement distributions, unemployment benefits, taxable and nontaxable Social Security income, and the State Temporary Cash Assistance transfer.3 Labor income also includes 75 percent of the income reported on federal Schedule C, which is used to report income earned by sole proprietorships.
Total income also includes income earned from capital sources: interest and dividends, 25 percent of sole proprietorship income reported on federal Schedule C, farm income, capital gains, rents and royalties from federal Schedule E, and earnings classified as “Other Income” on the federal tax return. Capital gains and pension income are included only when realized – i.e., when reported on a tax return – not when accrued. While tax law may allow some Schedule E income to be treated as labor income, a significant portion of this income is assumed to be passive investment in rental property, and therefore is treated solely as income from capital.
For purposes of this study, an adjustment was made to income from capital sources. In an attempt to more accurately reflect the actual value of the assets held by taxpaying entities, any reported capital losses were converted to gains of the same amount. Household income was then calculated using the adjusted capital income figures. This should more accurately reflect the actual household income class of the taxpayer, both in terms of the tax incidence for these taxpayers and in consumption patterns in the Consumer Expenditures Survey, which is described later in the methodology. It must be noted the treatment of capital income will vary across different tax incidence studies, as no standard method has been developed for calculating this type of income.
Finally, the total amount of positive income was aggregated for each household. This number was used to allocate a portion of the sales and use tax burden – a concept which will be discussed in more detail later in this report.
Additional sources of non-taxable income were not included in this study due to a lack of reliable data, such as workers’ compensation payments and foreign earned income excluded from taxation, as well as non-monetary income sources – such as the employer-paid portion of insurance premiums and payroll taxes – and additional government transfer payments such as Medicare and Medicaid. 4
3 Due to the lack of reliable information regarding the income breakdown of those households receiving Food Stamps, these transfers are not included as Cash Assistance or in the calculation of household income. The exclusion of this income source does not significantly affect the overall calculation of the incidence of Maryland taxes. 4 Economists Robert Haig and Henry Simons have published several papers regarding more inclusive definitions of household income.

8
Table 1 Sources of Household Income data
Type of Income Information Source
Wages/Salaries IRA and pension distributions Unemployment benefits Non-taxable Social Security Interest & Dividends Business & Farm income Capital gains Rents and royalties Other income
Maryland 2008 SOI Database
Worker’s Compensation Government Cash Assistance Information for non-filers
U.S. Census Bureau – 2008 American Community Survey (ACS) Public Use Microdata (PUMS) files
Total Social Security Benefits Maryland 2008 SOI Database and Census ACS

9
INDIVIDUAL INCOME TAX
In order to get a complete picture of Maryland’s population, it was necessary to obtain income information for those individuals who are not required to file a tax return. This information was obtained using the Public Use Microdata (PUMS) person and housing record files for the 2008 American Community Survey (ACS), an annual national survey conducted by the U.S. Census Bureau.5 In addition, income from Veterans’ benefits – which is available neither on the tax return nor in the Census survey – was imputed into the database based on those households reporting military service on the Census survey.6 Shifting of the Individual Income Tax
It is assumed that none of the individual income tax is shifted to other taxpayers. While some sole proprietorship and S-corporation income is reported on individual income tax returns, business income makes up only a small portion of the individual income tax collected, and also accounts for much of the reported income loss. Therefore, this tax is assumed to be borne entirely by individuals. Table 1 shows the distribution of household income by the population quintiles described above.
Table 1
Household Data by Population Quintile, 2008 Data
Population Quintile
Household Income Range
Number of Households
Sum of HH Income
($ thousands)
Income Tax Liability
($ thousands) Effective Tax Rate
FIRST 20% $ 0 - 12,151 518,302 2,974,381 -5,976 -0.20%
SECOND 20% 12,151 - 30,560
518,302
12,110,394
120,619 1.00%
THIRD 20% 30,560 - 55,716
518,302
24,167,036
613,313 2.54%
FOURTH 20% 55,716 - 100,405
518,302
43,677,724
1,138,385 2.61%
TOP 20%:
NEXT 10% 100,405 - 144,896
259,151
34,480,467
934,728 2.71%
NEXT 5% 144,896 - 201,293
129,576
24,226,993
700,111 2.89%
NEXT 4% 201,293 - 493,121
103,660
32,629,602
929,579 2.85%
TOP 1% 493,121 & Over
25,916
41,319,011
1,089,226 2.64%
Total
2,591,513
215,585,608
5,519,985 2.56%
5 For more information regarding the ACS, see http://www.census.gov/acs/www/index.html. For a more detailed discussion of the methodology for adding non-filers to the data for purposes of this study, see Appendix II. 6 The aggregate Veterans’ benefit amount for Maryland was obtained from the 2008 edition of the Retired Military Handbook, published by Uniformed Services Almanac, Inc.

10
Chart 1 Average Household Income by Population Quintile, 2008 Data
-
200,000
400,000
600,000
800,000
1,000,000
1,200,000
1,400,000
1,600,000
1,800,000
FIR
ST 2
0%
SEC
ON
D 2
0%
THIR
D 2
0%
FOU
RTH
20%
NEX
T 10
%
NEX
T 5%
NEX
T 4%
TOP
1%
Tota
l
Population Quantile
Do
llars
($)
Average HH Income
SALES AND USE TAX
The Maryland sales and use tax (SUT) provides the second largest source of revenue in the State. The SUT is assessed on a variety of final-stage consumer and business purchases. Shifting of the Sales and Use Tax
As discussed in the introduction to this report, the economic incidence of the SUT falls on three groups: consumers, laborers, and owners of capital (i.e. shareholders). Within these three groups, the tax burden is also shared between residents and nonresidents of Maryland. Despite the many years of research dedicated to tax incidence, a standard model for determining how shifting to these three categories occurs has not been developed. The amount shifted to each group will depend on a number of factors, including the relative competitiveness of an industry, the dominant industries in the state, the availability and mobility of labor in the state, the tax rates of surrounding states, and the relative amount of capital ownership by residents of the state. In this study, as in previous Maryland tax incidence studies, tax exporting – whereby Maryland residents pay taxes to other states when traveling out of state – was not considered. This is primarily due to the fact that Maryland officials have no control over the level of taxation in other states, just as they cannot control the burden of federal taxes.

11
First Shift
The first step in identifying how the tax is shifted is to determine, for each sales tax category reported to the Comptroller’s office, the portion of the total sales tax collected that is paid by nonresident consumers or businesses (such as tourists, traveling businesspeople and other visitors to the state), the portion paid by Maryland consumers, and the portion paid by Maryland businesses. The amount shifted to nonresidents of the State was determined based on the industry reporting the tax. For example, taxes collected from businesses in hospitality-related industries are assumed to be paid by nonresidents to a greater extent than taxes collected from business whose customers are primarily Maryland residents. Second Shift The next step is to determine how capital expenditures and other types of purchases by Maryland businesses are shifted to Maryland taxpayers. Of the amount of sales tax paid by businesses on capital expenditures, a portion is passed on to consumers in the form of higher prices – which is added to the amount paid by consumers in the first shift – a portion is shifted to labor in the form of lower wages or benefits, and the remaining amount is absorbed by owners of the capital of the firm. Because the State does not track which businesses make purchases in each SUT category, some assumptions had to be made regarding which types of businesses would make certain purchases in each category. Based on the industry assumed to be making the purchase, an estimate was made as to how easily the business could shift its costs to the consumers of their products, their workers, or their owners of capital. Of the amount shifted to labor, Maryland residents are assumed to bear 100% of the tax. The amount of income tax lost to Maryland from individuals who work in Maryland but are a resident in a neighboring state with which Maryland has a reciprocity agreement is assumed to generally offset the income tax received by Maryland from Maryland residents who work in one of these neighboring states. While some Maryland residents work outside of the State and therefore likely pay some income tax to a state other than Maryland, it is assumed that the revenue loss because of these individuals is generally offset by those individuals who work in Maryland but live in a state other than Maryland. Third Shift
Finally, of the portion of the SUT borne by owners of capital, a percentage of the tax is paid by owners or stockholders located in Maryland, and the remaining amount is paid by nonresident owners of the capital. The apportionment of this amount between resident and nonresident owners of capital was estimated based on the industry reporting the sales tax collection – whether businesses in that industry are assumed to be owned primarily by Maryland residents (industries with primarily non-publicly traded companies) or nonresidents (industries made up of companies that are primarily publicly traded).

12
Taking all of the above factors into account, the total burden of the sales and use tax on Maryland residents is the sum of the amounts identified for each SUT category in the three steps above. The portion paid directly by the resident consumer represents the total direct burden, the amount of the business portion passed along to the Maryland consumer represents the total indirect burden, the amount shifted to labor makes up the total labor portion, and the amount borne by owners of capital living in the State makes up the total shift to owners of capital. The total passed to nonresidents is the sum of the two shifts to nonresidents shown in the chart below.
Exhibit A: Shifting of Sales and Use Tax
Purchases by non-residents (15%)
Tax passed to Labor (38%)
Tax borne by MD owners of capital (38%)
Total SUT Collections (100%)
Purchases by MD business (19%)
Tax passed to owners of capital (24%)
Purchases by MD consumers (66%)
Tax passed to MD consumers (38%)
Tax borne by nonresident owners of capital (62%)
Table 2 Distribution of Sales Tax Collections among
Consumers, Labor, Capital & Nonresidents, 2008 Data
% of total SUT collected
MD Consumers – Direct Burden 66.2 MD Consumers – Indirect Burden 6.9 MD Laborers 7.2 MD Owners of Capital 1.7 Nonresidents 18.1
After determining the amount shifted to each of the above groups, the next step is
to apportion the SUT expenditure across the previously identified household income classes. A separate distribution is done for each of the above resident groups.

13
Sales Tax Paid Directly by Maryland Consumers
In order to estimate how much each household pays in sales tax, the 2008 Consumer Expenditure Survey (CE) – conducted by the Bureau of Labor Statistics – was used to analyze consumption patterns for each household income group. While the CE was designed primarily as a measure to analyze changes in consumption in order to more accurately calculate the U.S. Consumer Price Index, it has played a central role in nearly all past incidence studies, both in Maryland and across the country. While the data is far from perfect, it is the best consumption data that is readily available for public use.7
In past Maryland incidence studies, the consumption patterns of the CE Northeast
region were used to allocate the burden of sales tax. However, despite the availability of regional data, national patterns were used in this study to allocate Maryland consumption across each household income group. There are several reasons for this: First, the national household income brackets are broken out by the CE up to an income level of $150,000, while the regional brackets are only broken out up to $70,000. Second, there were a number of sampling errors reported in the regional tables due to the smaller sample size, especially at lower income levels. Finally, for some consumption categories, Maryland consumer patterns will likely follow those of the Northeast region, but for other categories the patterns will more closely resemble those of other U.S. regions. For the sake of consistency, national consumption patterns were used.
For each Maryland-assigned SUT category, an equivalent CE expenditure category was assigned to the State category. For situations where a SUT category did not directly match a CE category, the closest possible match was used. The consumer portion of the SUT collected was then apportioned among household income classes based on the expenditure percentages for each CE category. Once the SUT amounts were apportioned across the CE household income classes, the CE-defined income classes were aggregated to roughly match the household income classes represented by the SOI data, as determined in the household income distribution step of the analysis.
While the CE will provide information regarding consumption at different income
levels over the course of the year being considered, it will not provide information on how long consumers have been, or expect to be, at a certain income level. Consumers do, in fact, make purchases based on future expected earnings and past earnings. For example, due to the availability of credit or savings amassed in past years, some consumers may spend more than what they actually earn in a given year. The ideal study of tax incidence would consider income and consumption over the lifetime of a household. However, lifetime income data is rarely available, would have to be tracked until death, and requires a number of assumptions to be made related to future income growth, future spending, variability in tax rates and tax policy, and other economic factors. Assumptions such as these are out of the scope of this analysis. It is important, however, to understand this limitation when drawing conclusions based on this study. 7 For more information on the CE, visit http://www.bls.gov/cex.

14
Sales Tax Paid by Business
The Maryland resident labor, capital and indirect consumer portions of the sales tax incidence must also be distributed across household income classes. This distribution was made according to the distribution of labor, capital and positive income established in the first step of the study. Positive income serves as a proxy for the consumer’s income available for consumption.
After all shifting has taken place, the final burden of the sales and use tax is summarized in Table 2 below.
Table 2 Sales and Use Tax Paid by Population Quintile
Population Quintile Income Range Sum of SUT Paid
($ thousands) % Total SUT
FIRST 20% $ 0 - 12,151 99,610 3.07%
SECOND 20% 12,151 - 30,560 401,843 12.37%
THIRD 20% 30,560 - 55,716 483,808 14.90%
FOURTH 20% 55,716 - 100,405 1,014,613 31.24%
TOP 20%:
NEXT 10% 100,405 - 144,896 570,932 17.58%
NEXT 5% 144,896 - 201,293 275,226 8.47%
NEXT 4% 201,293 - 493,121 256,047 7.88%
TOP 1% 493,121 & Over 145,913 4.49%
Total 3,247,991 100.00%
EXCISE TAXES
Though relatively small in terms of annual tax collections, the major excise taxes –alcohol, tobacco, motor fuel and the motor vehicle titling tax – were also included in this study due to their similarity to the sales and use tax and the availability of consumption data from the CE.
Allocation of the excise taxes across quintiles is done using aggregate
consumption numbers as reported by the CE, although there are some shortcomings to this approach. For example, alcohol is taxed by volume, with beer, wine and spirits taxed at different rates at the wholesale level before the sales tax is applied at the consumer level. Additionally, different types of motor fuels are taxed at different rates. Depending on which type of each of these products a household is purchasing, the proportion of the cost that goes towards paying the tax will vary from purchase to purchase. However, it is very difficult to determine which products households are buying using the most readily available data, which is why aggregate consumption numbers were used in this study.
15
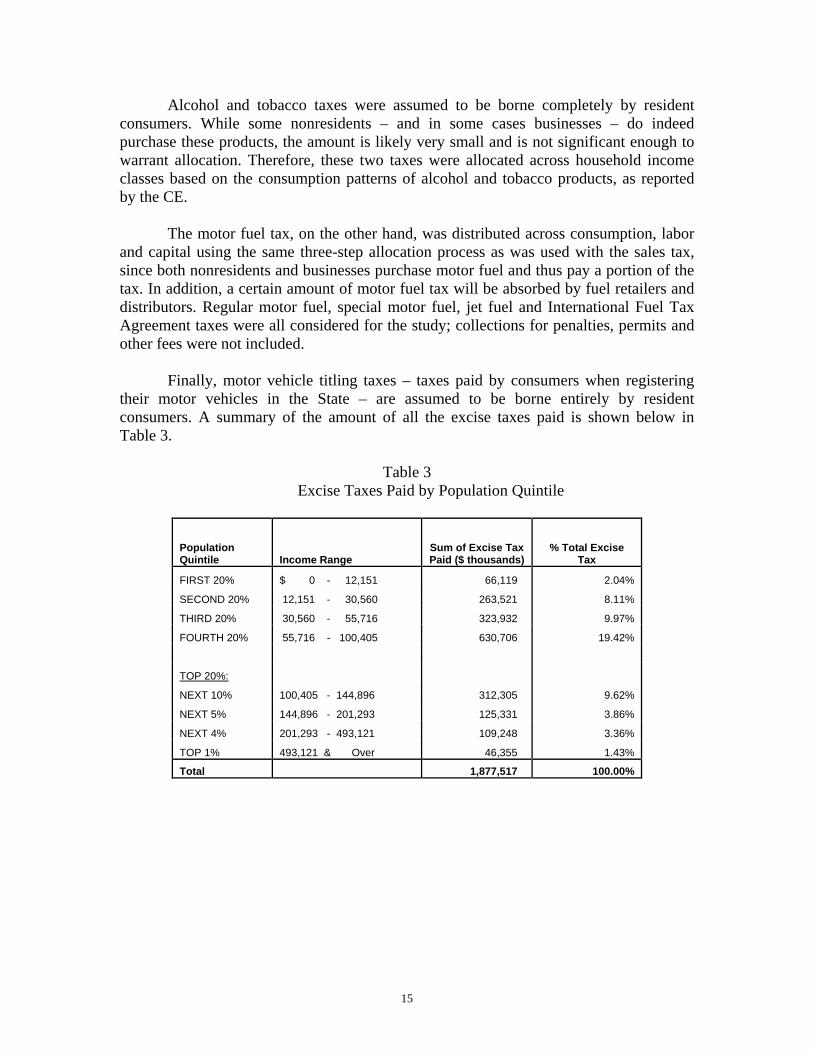
Alcohol and tobacco taxes were assumed to be borne completely by resident consumers. While some nonresidents – and in some cases businesses – do indeed purchase these products, the amount is likely very small and is not significant enough to warrant allocation. Therefore, these two taxes were allocated across household income classes based on the consumption patterns of alcohol and tobacco products, as reported by the CE.
The motor fuel tax, on the other hand, was distributed across consumption, labor
and capital using the same three-step allocation process as was used with the sales tax, since both nonresidents and businesses purchase motor fuel and thus pay a portion of the tax. In addition, a certain amount of motor fuel tax will be absorbed by fuel retailers and distributors. Regular motor fuel, special motor fuel, jet fuel and International Fuel Tax Agreement taxes were all considered for the study; collections for penalties, permits and other fees were not included.
Finally, motor vehicle titling taxes – taxes paid by consumers when registering their motor vehicles in the State – are assumed to be borne entirely by resident consumers. A summary of the amount of all the excise taxes paid is shown below in Table 3.
Table 3 Excise Taxes Paid by Population Quintile
Population Quintile Income Range
Sum of Excise Tax Paid ($ thousands)
% Total Excise Tax
FIRST 20% $ 0 - 12,151 66,119 2.04%
SECOND 20% 12,151 - 30,560 263,521 8.11%
THIRD 20% 30,560 - 55,716 323,932 9.97%
FOURTH 20% 55,716 - 100,405 630,706 19.42%
TOP 20%:
NEXT 10% 100,405 - 144,896 312,305 9.62%
NEXT 5% 144,896 - 201,293 125,331 3.86%
NEXT 4% 201,293 - 493,121 109,248 3.36%
TOP 1% 493,121 & Over 46,355 1.43%
Total 1,877,517 100.00%

16
RESULTS AND ANALYSIS Suits Index
Once the taxes have been apportioned between consumers, labor and capital, the final step is to calculate the Suits index for the individual income tax, sales tax, and excise taxes, as well as a combined Suits number based on the aggregation of all tax types considered. To reiterate: A Suits value closer to 1 indicates that a tax or tax system is more progressive, a Suits value closer to -1 indicates a more regressive tax system, and a Suits value of 0 indicates that a tax system is proportional.
The table below shows the aggregate effective tax rates and Suits Index for each
tax type. The results are similar to the results of studies of the U.S. as whole and other U.S. states. The sales and use and excise taxes are shown to be more regressive, as lower-income households generally spend a greater share of their income on consumer items that are subject to sales and excise taxes. Because Maryland exempts consumer staples such as groceries from the sales tax, the sales and use tax is less regressive overall than it would be if these items were subject to the sales tax. The individual income tax, on the other hand, is slightly progressive due to the State’s graduated tax rates, the phase-out of certain deductions and subtractions at both the State and federal level, and the availability of various credits – both refundable and nonrefundable – for low-income taxpayers.
Table 4 Effective Tax Rates and Suits Index by Tax Type, 2008 Data
Effective Tax Rate Suits Index
Income Tax Liability 2.56%
0.06
Sales & Use Tax 1.51%
(0.31)
Excise Taxes 0.87%
(0.39)
Combined Taxes 4.94%
(0.13)
Table 5, below, shows the effective tax rates by population quintile for each tax type analyzed in this report. Because the individual income tax is more progressive than regressive, households in the higher income groups generally pay a greater percentage of their household income for the individual income tax. On the other hand, as discussed earlier, the lower income households generally spend a greater portion of their income for sales and use and excise taxes.

17
Table 5 Effective Tax Rates by Population Quintile, 2008 Data
Population Quintile Income Range
Individual Income Tax
Sales & Use Tax
Excise Taxes
Combined Taxes
FIRST 20% $ 0 - 12,151 -0.20% 3.35% 2.22% 5.37%
SECOND 20% 12,151 - 30,560 1.00% 3.32% 2.18% 6.49%
THIRD 20% 30,560 - 55,716 2.54% 2.00% 1.34% 5.88%
FOURTH 20% 55,716 - 100,405 2.61% 2.32% 1.44% 6.37%
TOP 20%:
NEXT 10% 100,405 - 144,896 2.71% 1.66% 0.91% 5.27%
NEXT 5% 144,896 - 201,293 2.89% 1.14% 0.52% 4.54%
NEXT 4% 201,293 - 493,121 2.85% 0.78% 0.33% 3.97%
TOP 1% 493,121 & Over 2.64% 0.35% 0.11% 3.10%
Total 2.56% 1.51% 0.87% 4.94%
Chart 2, below, graphs the combined effective tax rates for each quintile. The rightward skew of the graph for the combined taxes supports the data that show that Maryland’s tax system is slightly regressive.
Chart 2 Effective Tax Rates, 2008 Data
-1.00%
0.00%
1.00%
2.00%
3.00%
4.00%
5.00%
6.00%
7.00%
FIRS
T 20
%
SECO
ND 2
0%
THIR
D 20
%
FOUR
TH 2
0%
NEXT
10%
NEXT
5%
NEXT
4%
TOP
1%
Population Quantile
Eff
ec
tiv
e T
ax
Ra
te
Individual Income TaxSales & Use TaxExcise TaxesCombined Taxes

18
Adjusting for the Federal Tax Offset
In the analysis of the incidence of Maryland taxes completed above, no adjustment was made for the deductibility of state and local taxes. Because individuals who itemize deductions at the federal level are allowed a deduction for state and local income taxes paid, thus paying a smaller amount of federal tax, the effect of this “federal tax offset” should be considered. By not taxing the portion of a taxpayer’s income that is used to pay state and local tax, the federal government essentially enables state governments to keep tax rates lower by absorbing some of the cost of taxes paid by a taxpayer. In this sense, a portion of Maryland’s state taxes are exported to other taxpayers across the United States (Similarly, the amount of state tax deducted by non-Maryland residents of the U.S. is imported to Maryland taxpayers).
Accounting for the federal offset generally makes state tax systems appear less
progressive, since the federal tax benefit of deductions grows as income grows. While some may argue that the federal state tax offset should not be considered in a study of state tax incidence – since the offset has a more direct effect on the federal tax burden and the federal government presumably makes up for this lost revenue with a higher tax rate – the rationale for including it is that if a state raised the same revenue through other non-deductible taxes (i.e. excise taxes), the after-tax cost to the taxpayer would be higher. Because of the differing views on the subject, the effect of the federal offset is considered separately from the rest of the study. The only results that take the federal offset into account are presented in this section.
Below is a table detailing the change in the effective tax rate for each population quintile after taking into account the federal tax offset. For each taxpayer who claimed the federal offset, an average federal marginal tax rate was calculated and the amount of the offset was multiplied by this rate. Because some amount of federal liability is being added to State liability, the ETR for all quintiles increases. The effect of the offset on each population quintile is shown in Table 5.1 below.

19
Table 5.1 Individual Income Tax Effective Tax Rates
Before and After the Federal Tax Offset, 2008 Data
Effective Tax Rate
Population Quintile Income Range
With Federal Tax Offset
Federal Tax Offset Removed
Increase in ETR with no Federal
Offset
FIRST 20% $0 - $12,151 -0.20% -0.11% 0.09% SECOND 20% $12,151 - $30,560 1.00% 1.18% 0.18%
THIRD 20% $30,560 - $55,716 2.54% 2.90% 0.36% FOURTH 20% $55,716 - $100,405 2.61% 3.27% 0.66%
TOP 20%:
NEXT 10% $100,405 - $144,896 2.71% 3.60% 0.89% NEXT 5% $144,896 - $201,293 2.89% 4.08% 1.19% NEXT 4% $201,293 - $493,121 2.85% 4.28% 1.43%
TOP 1% $493,121 & Over 2.64% 4.18% 1.54%
Overall 2.56% 3.54% .98%
Table 5.2 Suits Index Before and After the Federal Tax Offset, 2008 Data
With Offset Without Offset
Individual Income Tax 0.06 0.12
All Taxes -0.13 -0.06
As expected, those households with higher household income benefit from the
federal offset to a greater extent than those households with lower household income because high income households are paying a higher amount in state and local taxes. Therefore, their federal offset amount is greater and the resulting tax benefit at the state level, seen by a lower effective tax rate, is also greater. For example, the effective tax rate for the top 1% of households would be higher by approximately 1.54% – in terms of income tax liability – if not for the deductibility at the federal level of state and local taxes paid. In addition, the Suits index for the individual income tax would increase by 0.06, indicating that the tax becomes slightly more progressive if the federal offset is disallowed. However, because the federal offset is in place, the overall effective tax rate for Maryland residents is lower by 0.98%, and the overall progressivity of Maryland’s tax system – in terms of the taxes being considered in this study – is lower by 0.07. Naturally, in states with higher effective tax rates the effect of the federal offset will be greater.

20
Chart 3 Effective Income Tax Rate With and Without the Federal Offset, 2008 Data
-1.00%
0.00%
1.00%
2.00%
3.00%
4.00%
5.00%FI
RST
20%
SEC
ON
D 20
%
THIR
D 2
0%
FOUR
TH 2
0%
NEX
T 10
%
NEX
T 5%
NEX
T 4%
TOP
1%
Population Quantile
Eff
ec
tiv
e T
ax
Ra
te
With Federal OffsetWithout Federal Offset
Adjusting for Maryland’s Refundable Credits
The State of Maryland offers individual taxpayers several refundable income tax credits. In 2008, the refundable earned income credit (EIC) was basically 25% of the earned income tax credit claimed on the taxpayer’s federal return; the refundable Neighborhood Stabilization Tax Credit allows a credit to taxpayers who purchase a primary home in certain distressed Maryland neighborhoods; and the refundable Heritage Structure Rehabilitation Tax Credit can be claimed for the rehabilitation of certified heritage structures in the State. Pass through entities can claim two refundable business tax credits – the One Maryland Tax Credit and the Biotechnology Investment Tax Credit – that flow through to the individual tax return. As with the federal tax offset, the only results that adjust for Maryland’s refundable tax credits are the results presented in this section of the study.

21
Table 6.1 Effect of Refundable Income Tax Credits on ETRs,
2008 Data
Effective Tax Rate
Population Quintile Income Range
With Refundable
Credits Refundable
Credits Removed
Increase in ETR without
Refundable Credits
FIRST 20% $ 0 - 12,151 -0.20% 0.34% 0.54% SECOND 20% 12,151 - 30,560 1.00% 1.50% 0.50% THIRD 20% 30,560 - 55,716 2.54% 2.56% 0.02% FOURTH 20% 55,716 - 100,405 2.61% 2.61% 0.00% TOP 20%: NEXT 10% 100,405 - 144,896 2.71% 2.71% 0.00% NEXT 5% 144,896 - 201,293 2.89% 2.90% 0.01% NEXT 4% 201,293 - 493,121 2.85% 2.86% 0.01%
TOP 1% 493,121 & Over 2.64% 2.64% 0.00%
Total 2.56% 2.60% 0.04%
Table 6.2 Effect of Refundable Income Tax Credits on Suits Index,
2008 Data
With all Refundable
Credits Without Refundable
Credits
Individual Income Tax 0.06 0.05
All Taxes -0.13 -0.13
The refundable heritage structure rehabilitation credits, as well as the two refundable business credits, are generally claimed by taxpayers with higher annual income. Although the ETR for the higher income groups is not significantly increased, these higher income groups experience a higher tax liability as a result of the removal of these refundable credits. Of the State’s refundable income tax credits, the refundable EIC is claimed by the largest number of taxpayers and in the greatest aggregate amount. Because the EIC may only be claimed by individuals below certain income thresholds within a given year, the most significant impact is in the lower quintiles. Overall, in terms of the Suits index, adding the refundable credits back into tax liability decreases the progressivity of the individual income tax by 0.01. Although the individual income tax becomes slightly less progressive when the refundable tax credits are taken away, there is little to no effect on the overall incidence of Maryland’s tax system for the tax types considered in this study.

22
Chart 4 Effective Income Tax Rate with and without Refundable Tax Credits,
2008 Data
-0.50%
0.00%
0.50%
1.00%
1.50%
2.00%
2.50%
3.00%
3.50%FI
RST
20%
SEC
ON
D 2
0%
THIR
D 2
0%
FOU
RTH
20%
NEX
T 10
%
NEX
T 5%
NEX
T 4%
TOP
1%
Population Quantile
Eff
ec
tiv
e T
ax
Ra
te
With Refundable CreditsWithout Refundable Credits
Comparing 2011 and 2009 Maryland Tax Incidence Studies
Between 2006 and 2008, major changes have taken place both in Maryland’s tax
structure and the economic environment of the State. While some legislative changes between 2006 and 2008 were anticipated in our prior study to make Maryland’s tax system more progressive, others were expected to make it more regressive. A comparison of the 2006 and 2008 effective tax rates by household income groups, and the combined Suits index for the three tax types used in this study are shown below in Tables 7.1 and 7.2, respectively.
23
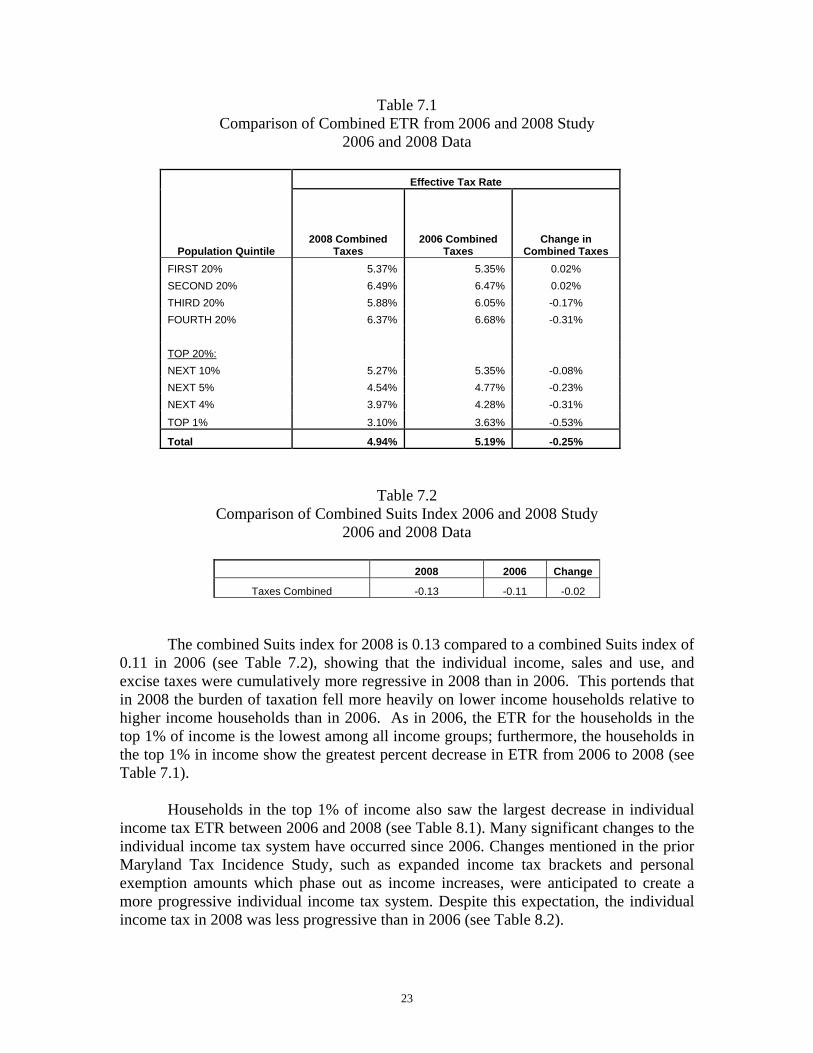
Table 7.1 Comparison of Combined ETR from 2006 and 2008 Study
2006 and 2008 Data
Effective Tax Rate
Population Quintile 2008 Combined
Taxes 2006 Combined
Taxes Change in
Combined Taxes
FIRST 20% 5.37% 5.35% 0.02% SECOND 20% 6.49% 6.47% 0.02% THIRD 20% 5.88% 6.05% -0.17% FOURTH 20% 6.37% 6.68% -0.31% TOP 20%: NEXT 10% 5.27% 5.35% -0.08% NEXT 5% 4.54% 4.77% -0.23% NEXT 4% 3.97% 4.28% -0.31%
TOP 1% 3.10% 3.63% -0.53%
Total 4.94% 5.19% -0.25%
Table 7.2 Comparison of Combined Suits Index 2006 and 2008 Study
2006 and 2008 Data
2008 2006 Change
Taxes Combined -0.13 -0.11 -0.02
The combined Suits index for 2008 is 0.13 compared to a combined Suits index of
0.11 in 2006 (see Table 7.2), showing that the individual income, sales and use, and excise taxes were cumulatively more regressive in 2008 than in 2006. This portends that in 2008 the burden of taxation fell more heavily on lower income households relative to higher income households than in 2006. As in 2006, the ETR for the households in the top 1% of income is the lowest among all income groups; furthermore, the households in the top 1% in income show the greatest percent decrease in ETR from 2006 to 2008 (see Table 7.1).
Households in the top 1% of income also saw the largest decrease in individual
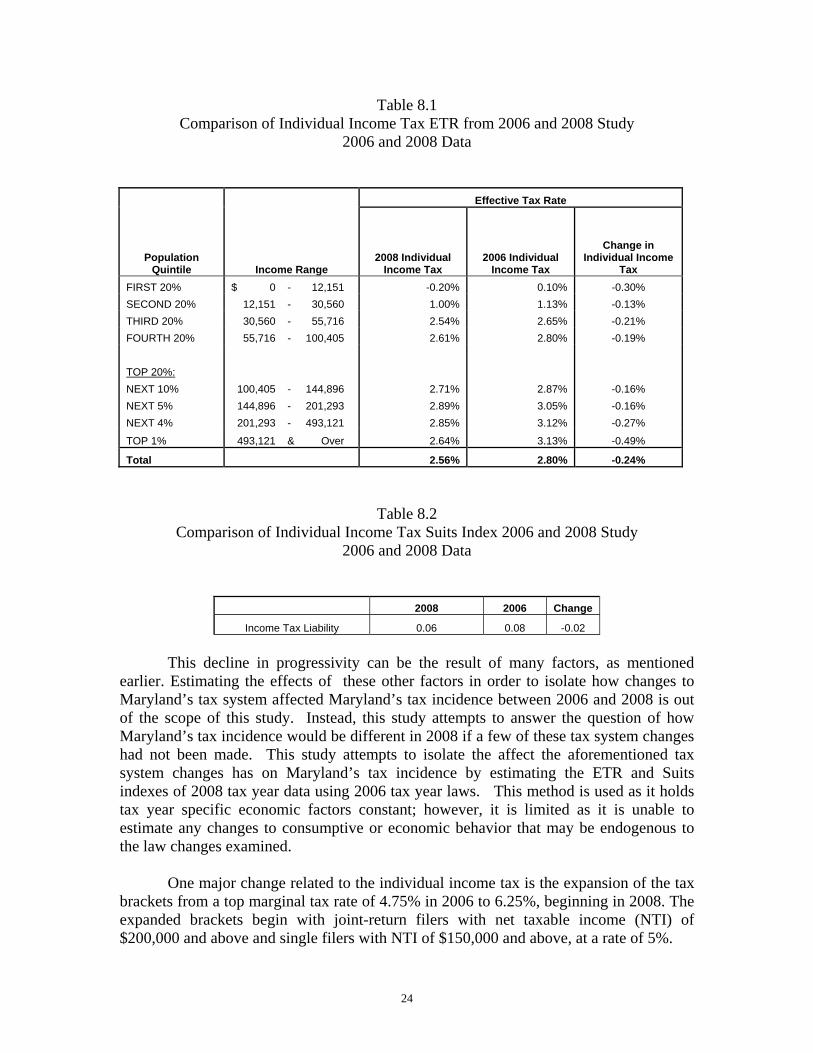
income tax ETR between 2006 and 2008 (see Table 8.1). Many significant changes to the individual income tax system have occurred since 2006. Changes mentioned in the prior Maryland Tax Incidence Study, such as expanded income tax brackets and personal exemption amounts which phase out as income increases, were anticipated to create a more progressive individual income tax system. Despite this expectation, the individual income tax in 2008 was less progressive than in 2006 (see Table 8.2).
24
Table 8.1 Comparison of Individual Income Tax ETR from 2006 and 2008 Study
2006 and 2008 Data
Effective Tax Rate
Population Quintile Income Range
2008 Individual Income Tax
2006 Individual Income Tax
Change in Individual Income
Tax
FIRST 20% $ 0 - 12,151 -0.20% 0.10% -0.30% SECOND 20% 12,151 - 30,560 1.00% 1.13% -0.13% THIRD 20% 30,560 - 55,716 2.54% 2.65% -0.21% FOURTH 20% 55,716 - 100,405 2.61% 2.80% -0.19% TOP 20%: NEXT 10% 100,405 - 144,896 2.71% 2.87% -0.16% NEXT 5% 144,896 - 201,293 2.89% 3.05% -0.16% NEXT 4% 201,293 - 493,121 2.85% 3.12% -0.27%
TOP 1% 493,121 & Over 2.64% 3.13% -0.49%
Total 2.56% 2.80% -0.24%
Table 8.2 Comparison of Individual Income Tax Suits Index 2006 and 2008 Study
2006 and 2008 Data
2008 2006 Change
Income Tax Liability 0.06 0.08 -0.02
This decline in progressivity can be the result of many factors, as mentioned
earlier. Estimating the effects of these other factors in order to isolate how changes to Maryland’s tax system affected Maryland’s tax incidence between 2006 and 2008 is out of the scope of this study. Instead, this study attempts to answer the question of how Maryland’s tax incidence would be different in 2008 if a few of these tax system changes had not been made. This study attempts to isolate the affect the aforementioned tax system changes has on Maryland’s tax incidence by estimating the ETR and Suits indexes of 2008 tax year data using 2006 tax year laws. This method is used as it holds tax year specific economic factors constant; however, it is limited as it is unable to estimate any changes to consumptive or economic behavior that may be endogenous to the law changes examined.
One major change related to the individual income tax is the expansion of the tax
brackets from a top marginal tax rate of 4.75% in 2006 to 6.25%, beginning in 2008. The expanded brackets begin with joint-return filers with net taxable income (NTI) of $200,000 and above and single filers with NTI of $150,000 and above, at a rate of 5%.

25
Table 9.1, below, shows the Effective Tax Rates of individuals broken into income tax groups, using the actual ETR’s from the 2008 data, as well as ETR’s of 2008 tax data under 2006 tax year brackets, ceteris paribus. This table shows that if the 2006 brackets were used in tax year 2008, the ETR of the lower individual income households would have been unaffected, while higher income households would have had a lower ETR, exactly as would be expected with lower tax rates at higher levels of income.
Table 9.1 Effect of 2006 Tax Brackets on ETRs,
2008 Data
Effective Tax Rate
Population Quintile Income Range
With 2008 Income
Brackets With 2006 Income
Brackets
Change in ETR If 2006 Brackets
Used
FIRST 20% $ 0 - 12,151 -0.20% -0.20% 0.00% SECOND 20% 12,151 - 30,560 1.00% 1.00% 0.00% THIRD 20% 30,560 - 55,716 2.54% 2.54% 0.00% FOURTH 20% 55,716 - 100,405 2.61% 2.61% 0.00% TOP 20%: NEXT 10% 100,405 - 144,896 2.71% 2.71% 0.00% NEXT 5% 144,896 - 201,293 2.89% 2.89% 0.00% NEXT 4% 201,293 - 493,121 2.85% 2.79% -0.06%
TOP 1% 493,121 & Over 2.64% 2.42% -0.22%
Total 2.56% 2.51% -0.05%
Table 9.2 shows the Suits index, using 2008 and 2006 income tax brackets on tax
year 2008 data. Using the 2006 income tax rates on 2008 data, the individual income tax becomes slightly less progressive, showing a Suits index of 0.05, compared to a 0.06 Suits index using 2008 tax brackets. Cumulatively, the tax system becomes more regressive, with a Suits index of -0.14 using 2006 brackets and -0.13 using 2008 brackets.
Table 9.2 Effect of 2006 Tax Brackets on Suits Index,
2008 Data
With 2008 Tax
Brackets With 2006 Tax
Brackets
Individual Income Tax 0.06 0.05
All Taxes -0.13 -0.14
Besides the bracket change, the State personal exemption amounts have also been
altered. In 2006, the standard exemption amount was $2,400 per person for all eligible

26
taxpayers. In 2008, the exemption amount was altered to begin at $3,200 for lower-income taxpayers and phased down to $600 for higher-income taxpayers, based on filing status and Federal Adjusted Gross Income. Table 10.1, below, compares ETRs, displaying actual 2008 data and the projected ETRs in 2008 using 2006 personal exemption limitations. If 2006 personal exemption amounts were used in 2008, ceteris paribus, lower income households incur a higher ETR; while, higher income households incur a lower ETR. Again, these results are exactly as expected.
Table 10.1 Effect of 2006 Personal Exemption Amounts on ETRs,
2008 Data
Effective Tax Rate
Population Quintile Income Range
With 2008 Personal Exemption Amounts
With 2006 Personal Exemption Amounts
Change in ETR If 2006 Personal Exemption
Amount Used
FIRST 20% $ 0 - 12,151 -0.20% -0.06% 0.14% SECOND 20% 12,151 - 30,560 1.00% 1.23% 0.23% THIRD 20% 30,560 - 55,716 2.54% 2.68% 0.12% FOURTH 20% 55,716 - 100,405 2.61% 2.70% 0.09% TOP 20%: NEXT 10% 100,405 - 144,896 2.71% 2.77% 0.07% NEXT 5% 144,896 - 201,293 2.89% 2.88% -0.01% NEXT 4% 201,293 - 493,121 2.85% 2.80% -0.05%
TOP 1% 493,121 & Over 2.64% 2.62% -0.02%
Total 2.56% 2.61% 0.05%
Table 10.2 compares the Suits indexes in the two scenarios. Similar to the 2008 and 2006 tax brackets, applying tax year 2006 exemption amounts to the 2008 income tax data results in a less progressive individual income tax. Unlike the 2006 brackets, however, the 2006 exemption amounts do not lead to a more regressive aggregate tax system. Although the income tax itself is more progressive, it is a slightly smaller component of a tax system that is regressive overall.
Table 10.2 Effect of 2006 Personal Exemption Amounts on Suits Index,
2008 Data
With 2008 Personal Exemption Amount
With 2006 Personal Exemption Amount
Individual Income Tax 0.06 0.04
All Taxes -0.13 -0.13

27
A change that would seemingly lead to a more regressive tax system is the increase to Maryland’s sales and use tax rate, which increased from 5% to 6% between 2006 and 2008. Though this change was expected to increase the regressivity of Maryland’s sales and use tax, the regressivity of this tax type remained unchanged between 2006 and 2008 (see Table 11.2). However, the ETR of the sales and use tax did increase between 2006 and 2008 (see Table 11.1). A comparison of the sales and use tax data from years 2006 and 2008 is shown in Tables 11.1 and 11.2, below.
Table 11.1 Comparison of Sales & Use Tax ETR from 2006 and 2008 Study
2006 and 2008 Data
Effective Tax Rate
Population Quintile Income Range
2008 Sales & Use Tax
2006 Sales & Use Tax
Change in Sales & Use Tax from 2006 to 2008
FIRST 20% $ 0 - 12,151 3.35% 3.12% 0.23% SECOND 20% 12,151 - 30,560 3.32% 3.17% 0.15% THIRD 20% 30,560 - 55,716 2.00% 1.99% 0.01% FOURTH 20% 55,716 - 100,405 2.32% 2.33% -0.01% TOP 20%: NEXT 10% 100,405 - 144,896 1.66% 1.54% 0.12% NEXT 5% 144,896 - 201,293 1.14% 1.10% 0.04% NEXT 4% 201,293 - 493,121 0.78% 0.77% 0.01%
TOP 1% 493,121 & Over 0.35% 0.37% -0.02%
Total 1.51% 1.47% 0.04%
Table 11.2 Comparison of Sales & Use Tax Suits Index 2006 and 2008 Study
2006 and 2008 Data
2008 2006 Change
Income Tax Liability -0.31 -0.31 0.00
Between tax year 2006 and 2008, the ETR increases most significantly for the
lower income households, as a higher percentage of their household income is used on taxable consumption goods relative to higher income households. While the overall difference of the ETR for the sales and use tax between 2006 and 2008 is not very large, this increase in ETR for households with lower income is significant, and contributes to a more regressive tax system in 2008 than in 2006.

28
Below in Tables 12.1 and 12.2, the ETR and Suits index are compared using sales tax rates of 5% and 6% on tax year 2008 sales tax data. If the 5% sales and use tax rate were used in 2008, the ETR of each household income groups would decrease, and total ETR would decrease from 1.51% to 1.26%. As would be expected, the ETR for lower income households would decrease by a greater amount than for higher income households.
Table 12.1
Sales & Use Tax ETR with 5% 2006 rate and 6% 2008 rate 2008 Data
Effective Tax Rate
Population Quintile Income Range
2008 Sales & Use Tax Rate
2006 Sales & Use Tax Rate
Change in Sales & Use Tax if 5%
Rate Used
FIRST 20% $ 0 - 12,151 3.35% 2.79% -0.56% SECOND 20% 12,151 - 30,560 3.32% 2.77% -0.55% THIRD 20% 30,560 - 55,716 2.00% 1.67% -0.33% FOURTH 20% 55,716 - 100,405 2.32% 1.94% -0.38% TOP 20%: NEXT 10% 100,405 - 144,896 1.66% 1.38% -0.28% NEXT 5% 144,896 - 201,293 1.14% 0.95% -0.19% NEXT 4% 201,293 - 493,121 0.78% 0.65% -0.13%
TOP 1% 493,121 & Over 0.35% 0.29% -0.06%
Total 1.51% 1.26% 0.25%
Table 12.2, below, shows that if the 2006 sales tax rate of 5% were used in year 2008, instead of the 6% rate, the Suits index for the sales and use tax would remain unchanged at (0.31). However, the Suits index for all taxes would become slightly less regressive, at (0.12) instead of the observed index for 2008 of (0.13). This may be the result of the sales and use tax, a regressive tax type, becoming a lower percentage of total cumulative taxes collected, as seen by the lower ETR at the 2006 tax rate.
Table 12.2 Sales & Use Tax Suits Index 5% 2006 rate and 6% 2008 rate
2008 Data
2008 SUT rate 2006 SUT rate Change with 2006 rates
Sales & Use Tax
-0.31
-0.31 0.00
All Taxes -0.13 -0.12 0.01

29
Finally, Tables 13.1 and 13.2 compare the excise taxes between 2006 and 2008. The excise taxes become more regressive, with a Suits index of (0.37) in 2006 compared to (0.39) in 2008; while, total ETR for this tax type also decreases, from 0.92% in 2006 to 0.87% in 2008. The ETR decreases in 2008 for all household income groups except for the bottom two quintiles.
Table 13.1
Comparison of Excise Taxes ETR from 2006 and 2008 Study 2006 and 2008 Data
Effective Tax Rate
Population Quintile Income Range
2008 Excise Taxes
2006 Excise Taxes
Change in Excise Taxes
FIRST 20% $ 0 - 12,151 2.22% 2.13% 0.09% SECOND 20% 12,151 - 30,560 2.18% 2.16% 0.02% THIRD 20% 30,560 - 55,716 1.34% 1.41% -0.07% FOURTH 20% 55,716 - 100,405 1.44% 1.55% -0.11% TOP 20%: NEXT 10% 100,405 - 144,896 0.91% 0.94% -0.03% NEXT 5% 144,896 - 201,293 0.52% 0.62% -0.10% NEXT 4% 201,293 - 493,121 0.33% 0.40% -0.07%
TOP 1% 493,121 & Over 0.11% 0.13% -0.02%
Total 0.87% 0.92% -0.05%
Table 13.2 Comparison of Excise Taxes Suits Index 2006 and 2008 Study
2006 and 2008 Data
2008 2006 Change
Excise Tax Liability -0.39 -0.37 -0.02
This increase in regressivity of the excise tax in 2008 may be due to rate
increases. Beginning in tax year 2008, the tax for cigarettes increased to $2.00 per pack from $1.00 per pack, while the motor vehicle titling tax rate increased to 6% from 5%. Below in Tables 14.1 and 14.2, the ETR and Suits index are compared using the excise tax rates from 2006 and 2008. Not surprisingly, since the excise tax is the most regressive tax type in this study, a decrease in excise tax rates leads to a greater decrease in the ETR for lower income households than higher income households. If the 2006 rates are used in 2008, both the excise tax and the total tax system become less regressive.

30
Table 14.1 Comparison of Excise Taxes ETR Using 2006 Rates and 2008 Data
Effective Tax Rate
Population Quintile Income Range
2008 Excise Tax Rate
2006 Excise Tax Rate
Change in 2008 Excise Tax Rate if 2006 Rate Used
FIRST 20% $ 0 - 12,151 2.22% 1.68% -0.54% SECOND 20% 12,151 - 30,560 2.18% 1.73% -0.45% THIRD 20% 30,560 - 55,716 1.34% 1.08% -0.26% FOURTH 20% 55,716 - 100,405 1.44% 1.21% -0.23% TOP 20%: NEXT 10% 100,405 - 144,896 0.91% 0.78% -0.13% NEXT 5% 144,896 - 201,293 0.52% 0.46% -0.06% NEXT 4% 201,293 - 493,121 0.33% 0.30% -0.03%
TOP 1% 493,121 & Over 0.11% 0.10% -0.01%
Total 0.87% 0.73% -0.10%
Table 14.2 Comparison of Excise Taxes Suits Index Using 2006 Rates and 2008 Data
2008 Rate 2006 Rate Change
Excise -0.39 -0.37 -0.02
All Taxes -0.13 -0.12 -0.01

31
Looking Forward to 2014 Study The next study of the incidence of Maryland’s taxes, scheduled to be completed in
2014 and likely using tax year 2011 data, may show significantly different results for some or all of the tax types. These differences could result from a differing national or State economic climate in 2011 than in 2008 or the revising of the federal or State tax structure. Because the Maryland income tax return begins with Federal Adjusted Gross Income (FAGI), any federal income tax law changes that effect the calculation of FAGI will generally affect Maryland’s income tax.
In 2010 the limitation on federal itemized deductions was removed, possibly
leading to higher itemized deductions on tax year 2011 Maryland returns. In addition, changes in federal excise tax rates, such as the increase in the federal tax on cigarettes enacted in April 2009, are likely to affect tobacco sales and thus excise tax collections in Maryland. Furthermore, beginning in tax year 2011 the income tax bracket for individuals with income of $1 million or greater is removed, making the highest income bracket in Maryland 5.5% instead of 6.25%. Finally, the expansion or amending of subtractions, additions and tax credits (both refundable and non-refundable), may also have a marginal effect on the incidence of the individual income tax.
Finally, because the State and national economies are vastly different in 2011 than
they were in 2008, income, spending and consumption patterns are likely to have changed dramatically during this three-year period. Depending on how Maryland consumers change their consumption patterns, the incidence of the State’s sales and use and excise taxes may be affected, especially if consumers concentrate their spending on non-taxable necessities such as groceries or reduce their spending overall.
Because of the complex interactions between all of these factors, it is difficult – if not impossible – to determine the impact of these changes on Maryland’s tax incidence in future years. While generalizations can be made about the effect on different aspects of the State’s tax system, forecasting the precise impact of these law changes is out of the scope of this study, and will be examined further in the next study of the incidence of taxes in Maryland.

32
Appendix I: Creation of Tax Units from SOI Data
Because of the various possible tax filing types, and the difference between the tax definition of a household and the U.S. Census Bureau definition of a household, it was necessary to aggregate the State’s tax data as closely as possible into comparable Census households. Single tax filers, qualified widowers, and returns with a status of married filing jointly were assumed to already exist as separate tax families; therefore, their tax returns did not need to be combined in the database. For returns with a status of married filing separately, demographic information reported on the Maryland income tax return was used, when possible, to match returns and combine the necessary tax information into one tax unit. For those returns that could not be matched, it was assumed that the individuals were living as separate households, and therefore were treated as such for purposes of this study. Finally, it was assumed that dependent taxpayers are already reporting as part of a household and do not earn a significant amount of income that will affect the results of this study. Therefore, they were removed from the data.
It is important to note that the U.S. Census considers any individuals living in the same household to be a household unit, even though they all may file a separate tax return. For example, four recent college graduates who share an apartment will likely earn separate incomes, pay most bills separately and purchase most goods and services as separate entities. In this report, assuming each of these individuals files a separate tax return, each individual is considered to be a separate tax family, or economic unit. For purposes of the U.S. Census, this group of individuals is likely to be considered one household. In other words, one U.S. Census household could be made up of more than one tax family. Therefore, the number of households reported by the U.S. Census will differ from the number of tax families reported in this study. Some further examples of unique household compositions include:
a.) Married filing separate couples that may be divorced; b.) Children living at home but economically independent; c.) Parents living with their children, either independently (e.g., renting rooms) or
dependently (e.g., for economic or health reasons); and d.) Nontraditional family arrangements or unique family customs (e.g., unrelated
elderly persons or multi-generational individuals living in the same household).
In each of the above noted cases, there are reasons why the economic unit may differ from the Census household concept, and where the consumption patterns could change based on how these households are defined.
Finally, because this study is an analysis of the tax incidence of residents of Maryland, nonresident and partial-year resident returns were removed from the SOI database before proceeding with the above steps.

33
Appendix II: Assigning of a Filing Status to CE Data
In order to accurately import data from the CE, it was necessary to infer the expected tax filing status of each household using the information provided on the PUMS file, as tax filing status is not a category on the survey. The filing status was assigned as follows:8
Non-filer – tax unit with income below the tax year 2008 Maryland income filing thresholds.
Married couple filing jointly – tax unit where both spouses are present in the household and the reported joint income amount requires them to file a Maryland tax return in tax year 2008. All married couples living together are assumed to file jointly.
Head of household – tax unit where the tax filer reports a status of unmarried or separated, resides with one or more identified dependents, and has income that requires the filing of a Maryland tax return in tax year 2008.
Married filing separately – tax unit where either: (a) the spouse is absent, or (b) the couple is separated and does not have any dependents; and where reported income requires the tax unit to file in tax year 2008
Single – unmarried tax filer without dependents and with income that that requires the filing of a Maryland tax return in tax year 2008.
Dependent – tax unit that met at least one of the following four conditions: (1) is not the reference person, is not attending school, is 24 years of age or younger, is not married; (2) is not the reference person, is attending school, is 19 years of age or younger, is not married; (3) is not the reference person, reports a relationship as son/daughter OR grandchild OR foster child; (4) is younger than 15 years of age.
In order to be consistent with the tax families identified in the SOI database, once the filing status was identified for each tax unit, dependent filers were removed from the data set. Next, records whose status was determined to be married filing jointly or married filing separately were merged into households using a two step process. First, the primary couple was merged into a tax unit. Next, for households where potentially more than one couple was living in the same household, those couples were also merged and considered to be a separate tax unit. The merged records were then re-combined with the other Census records to form a database of tax families comparable to the SOI database. For those entities that were combined, the Census Housing Weight was used as the weighting mechanism. For those records that were not combined, the Census Person Weight was used.
8 Based on the work of a Brookings Institution study, available at: http://www.brookings.edu/reports/2008/~/media/Files/rc/reports/2008/05_metro_raise_berube/metroraise_technicalappendix.pdf

34
The total income reported for the remaining records was then used to determine which tax units would be considered non-filers, based on the tax year 2006 Maryland filing thresholds. For each filing status, if the tax unit was below the required minimum filing threshold, it was considered to be a non-filing return. The income information for these tax units was then added to the SOI database to be included in the study. At the same time, those tax filing entities in the SOI database marked as “non-filers” were removed in order to avoid duplicating records in the database. An entity in the SOI database was considered to be a “non-filer” if it had $0 in taxable income and was filing principally to claim a refund of taxes paid through withholding during the tax year, and/or to take advantage of either of Maryland’s refundable income tax credits. Any credit amount claimed for these individuals was aggregated before removing them from the database, and then re-allocated among the same income quintile after merging the non-filer data with the SOI data.

35
Bibliography and Further Reading Auerbach, Alan J. “Who Bears the Corporate Tax? A Review of What We Know.”
NBER Working Paper 11686, National Bureau of Economic Research, Cambridge, MA (2005).
Besley, Timothy J., and Harvey Rosen. “Sales Tax and Prices: An Empirical Analysis.”
National Tax Journal, 52:2, pp. 157-178 (1999). Browning, Edgar K., and William R. Johnson. The Distribution of the Tax Burden.
American Enterprise Institute for Public Policy Research, Washington, D.C. (1979).
Derrick, Frederick, and Charles Scott. “Maryland’s Sales and Use Tax: Past, Present, and
Future.” Prepared for the Maryland Commission on State Taxes and Tax Structure, Loyola Institute for Business and Economic Research, Loyola College, Baltimore, MD (1989).
Ernst and Young. “Economic and Fiscal Impact Analysis of Maryland Tax Policy
Options.” Prepared by Quantitative Economics and Statistics Ernst & Young LLP (2007).
Fullerton, Don and Gilbert Metcalf. “Tax Incidence.” NBER Working Paper 8829,
National Bureau of Economic Research, Cambridge, MA (2002). Joint Committee on Taxation. “Methodology and Issues in Measuring Changes in the
Distribution of Tax Burdens.” (1993). Joint Economic Committee, United States Congress. “A Guide to Tax Policy Analysis:
Problems with Distributional Tax Tables.” (2000). Metcalf, Gilbert E. “Tax Incidence.” Tufts University Working Paper, Tufts University,
Medford, MA (2006). Minnesota Tax Research Division. “Minnesota Tax Incidence Study.” (2009). Nebraska Department of Revenue. “Nebraska Tax Burden Study.” (1999). Oregon Legislature Revenue Office. “Oregon Tax Incidence Model (OTIM).” (2001). Poterba, James M. “Retail Price Reactions to Changes in State and Local Sales Taxes.”
National Tax Journal, 49:2, pp. 165-176 (1996). Poterba, James M. “State Response to Fiscal Crises: The Effects of Budgetary
Institutions and Politics.” Journal of Political Economy, 102:4, pp. 799-821 (1994).
36
Ring, Raymond J, Jr. “Consumers’ Share and Producers’ Share of the General Sales
Tax.” National Tax Journal, 52:1, pp. 79-90 (1999). Salanie, Bernard. The Economics of Taxation. MIT Press, Cambridge, MA (2002). Schwab, Robert. “The Incidence of Maryland Property, Income, and Sales Taxes.”
Prepared for the Maryland Commission on State Taxes and Tax Structure (1990). Schwab, Robert M. “The Incidence of Maryland Taxes.” Maryland Policy Studies, Vol.
4, pp. 35-52, Bureau of Governmental Research, School of Public Affairs, University of Maryland (1991).
Suits, Daniel B. “Measurement of Tax Progressivity.” American Economic Review, 67:4,
pp. 747-752 (1977). Maryland Department of Fiscal Services. “Tax Incidence in Maryland.” (1994). Wisconsin Department of Revenue: Division of Research and Policy. “Wisconsin Tax
Incidence Study.” (2004).