tax incidence by income & location
TRANSCRIPT
March 5, 2021
Tax Incidence by Income & Location
Donna K. Ginther
Roy A. Roberts Distinguished Professor of Economics
Director, Institute for Policy & Social Research, University of Kansas
Research Associate, National Bureau of Economic Research
2 Donna K. Ginther, PhD
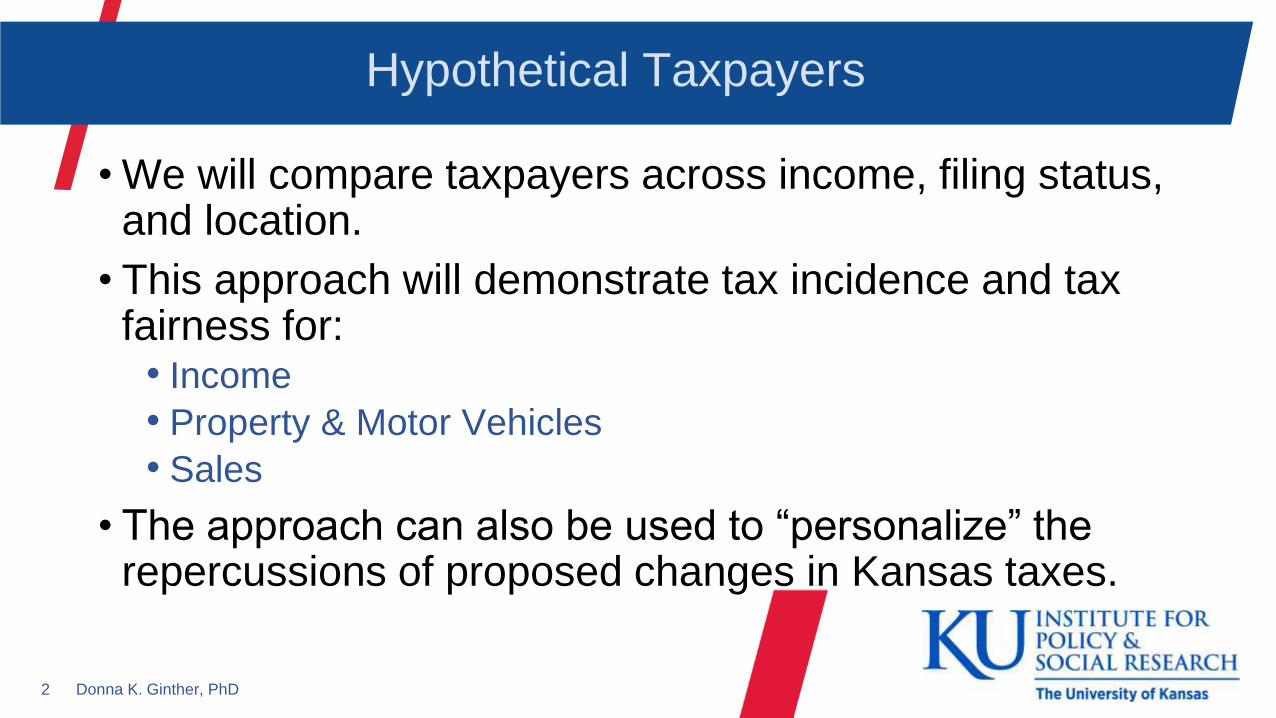
Hypothetical Taxpayers
• We will compare taxpayers across income, filing status, and location.
• This approach will demonstrate tax incidence and tax fairness for:
• Income
• Property & Motor Vehicles
• Sales
• The approach can also be used to “personalize” the repercussions of proposed changes in Kansas taxes.

3 Donna K. Ginther, PhD
Hypothetical Taxpayer Characteristics
• We constructed 9 hypothetical households to represent a range of income and family characteristics.
Taxpayer Type Dependent
s
Income Vehicles Home
value
Single 0 $23,000 1 7 yr old corolla
Head of Household 2 $28,000 1 6 yr old corolla
Head of Household 1 $32,000 1 6 yr old corolla
Married 0 $79,000 1 4 yr old camry, 1 6 yr old F150
Married 1 $85,000 1 4 yr old camry, 1 6 yr old F150
Married 2 $95,000 1 4 yr old camry, 1 6 yr old F150
Married 3 $125,000 1 3 yr old Toyota Sienna, 1 6 yr old F150
Married 1 $125,000 1 3 yr old ford edge, 1 6 yr old f150
Married 2 $150,000 1 3 yr old Lexus RX (SUV), 1 6 yr old F150
Varies
by
location
4 Donna K. Ginther, PhD
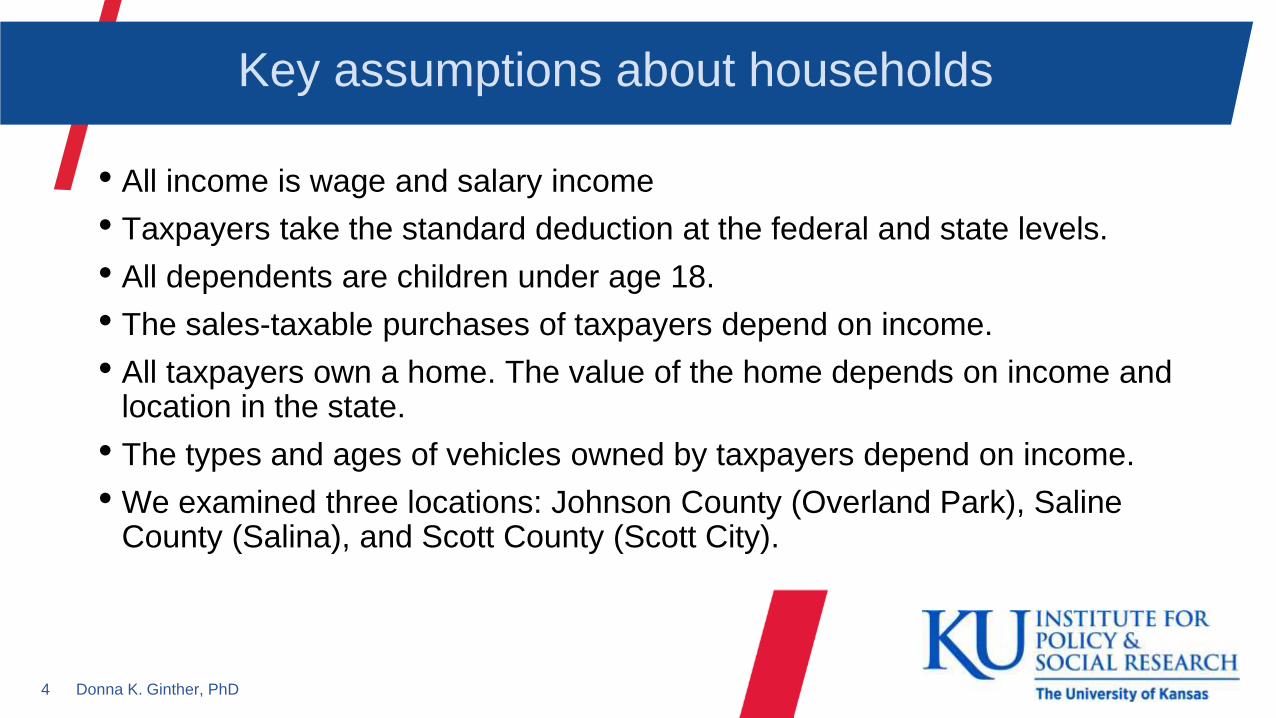
Key assumptions about households
• All income is wage and salary income
• Taxpayers take the standard deduction at the federal and state levels.
• All dependents are children under age 18.
• The sales-taxable purchases of taxpayers depend on income.
• All taxpayers own a home. The value of the home depends on income and location in the state.
• The types and ages of vehicles owned by taxpayers depend on income.
• We examined three locations: Johnson County (Overland Park), Saline County (Salina), and Scott County (Scott City).
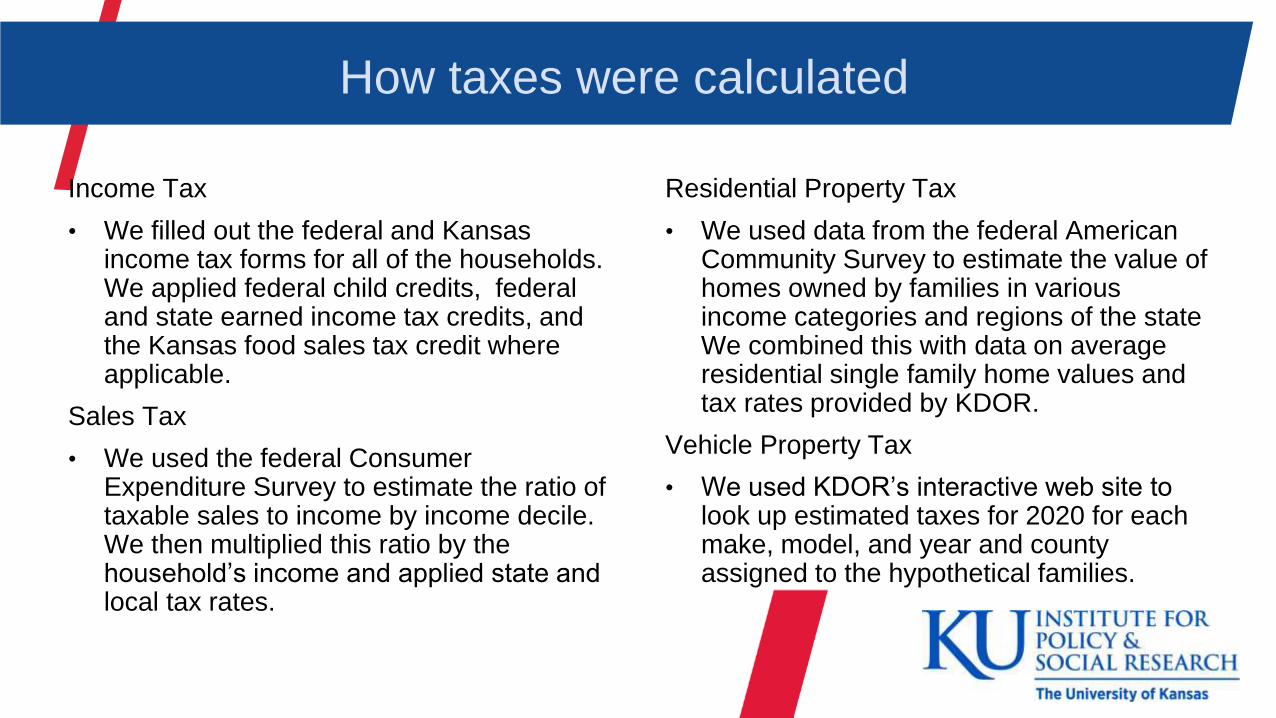
How taxes were calculated
Income Tax
• We filled out the federal and Kansas income tax forms for all of the households. We applied federal child credits, federal and state earned income tax credits, and the Kansas food sales tax credit where applicable.
Sales Tax
• We used the federal Consumer Expenditure Survey to estimate the ratio of taxable sales to income by income decile. We then multiplied this ratio by the household’s income and applied state and local tax rates.
Residential Property Tax
• We used data from the federal American Community Survey to estimate the value of homes owned by families in various income categories and regions of the state We combined this with data on average residential single family home values and tax rates provided by KDOR.
Vehicle Property Tax
• We used KDOR’s interactive web site to look up estimated taxes for 2020 for each make, model, and year and county assigned to the hypothetical families.
6 Donna K. Ginther, PhD
Tax results
• We now turn to our estimates of four taxes paid by the households:
• Kansas income
• State and local sales
• Vehicle property tax
• Residential property tax.
• With the exception of the income tax, these taxes vary by location.
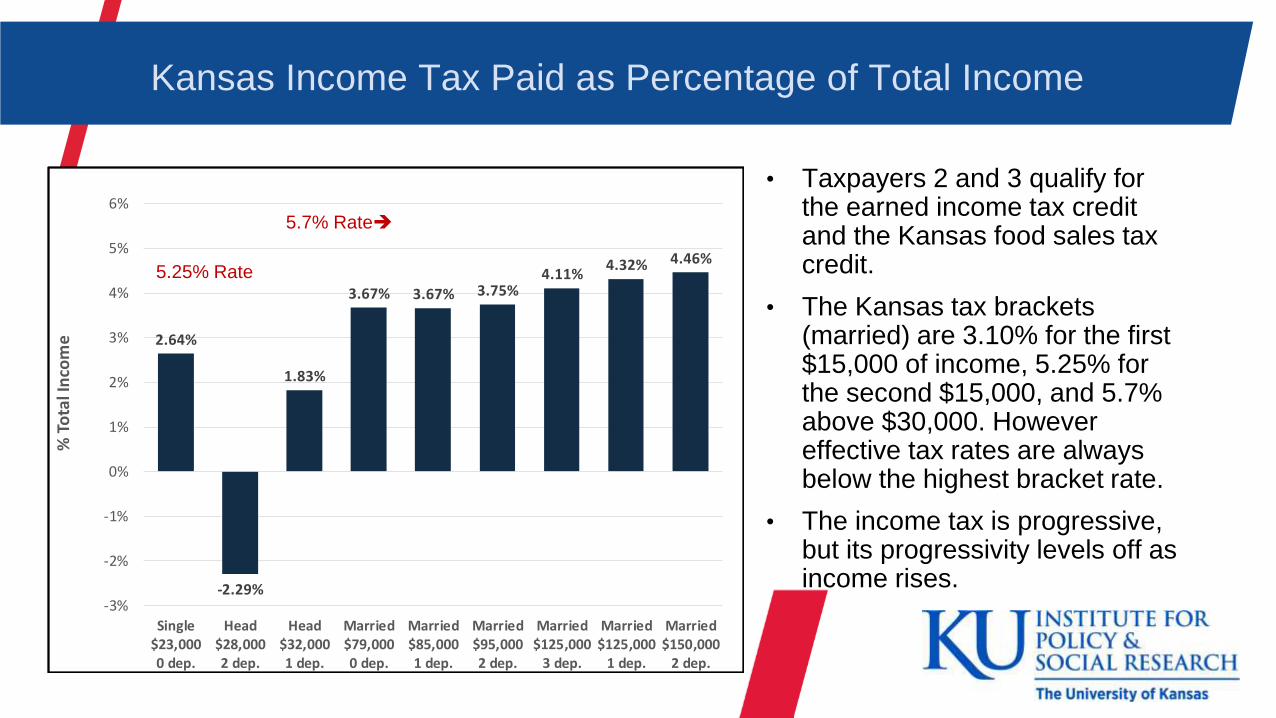
Kansas Income Tax Paid as Percentage of Total Income
• Taxpayers 2 and 3 qualify for the earned income tax credit and the Kansas food sales tax credit.
• The Kansas tax brackets (married) are 3.10% for the first $15,000 of income, 5.25% for the second $15,000, and 5.7% above $30,000. However effective tax rates are always below the highest bracket rate.
• The income tax is progressive, but its progressivity levels off as income rises.
2.64%
-2.29%
1.83%
3.67% 3.67% 3.75%4.11%
4.32% 4.46%
-3%
-2%
-1%
0%
1%
2%
3%
4%
5%
6%
Single$23,0000 dep.
Head$28,0002 dep.
Head$32,0001 dep.
Married$79,0000 dep.
Married$85,0001 dep.
Married$95,0002 dep.
Married$125,000
3 dep.
Married$125,000
1 dep.
Married$150,000
2 dep.
% T
ota
l In
com
e
5.25% Rate
5.7% Rate➔
8 Donna K. Ginther, PhD
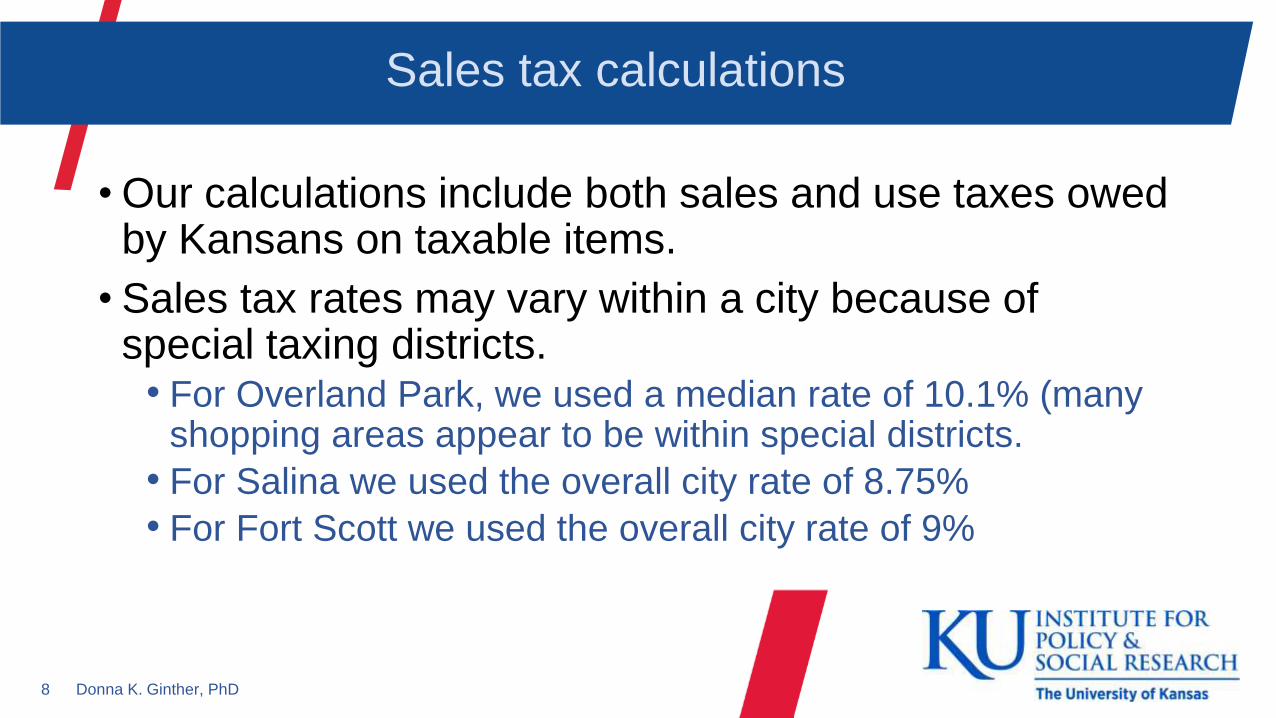
Sales tax calculations
• Our calculations include both sales and use taxes owed by Kansans on taxable items.
• Sales tax rates may vary within a city because of special taxing districts.
• For Overland Park, we used a median rate of 10.1% (many shopping areas appear to be within special districts.
• For Salina we used the overall city rate of 8.75%
• For Fort Scott we used the overall city rate of 9%
Sales Taxes as a Percentage of Total Income
• Sales taxes show a distinct regressive pattern.• Low income families
spend all of their income on consumption.
• Food is taxed at full sales tax rate.
• High income families purchase more services and many services are not taxed.
7.5%
6.3%6.1%
3.9% 3.7%3.5%
3.2% 3.2% 3.1%
0%
2%
4%
6%
8%
10%
Single$23,0000 dep.
Head$28,0002 dep.
Head$32,0001 dep.
Married$79,0000 dep.
Married$85,0001 dep.
Married$95,0002 dep.
Married$125,000
3 dep.
Married$125,000
1 dep.
Married$150,000
2 dep.
% T
ota
l In
com
e
Johnson
Saline
Scott
10 Donna K. Ginther, PhD
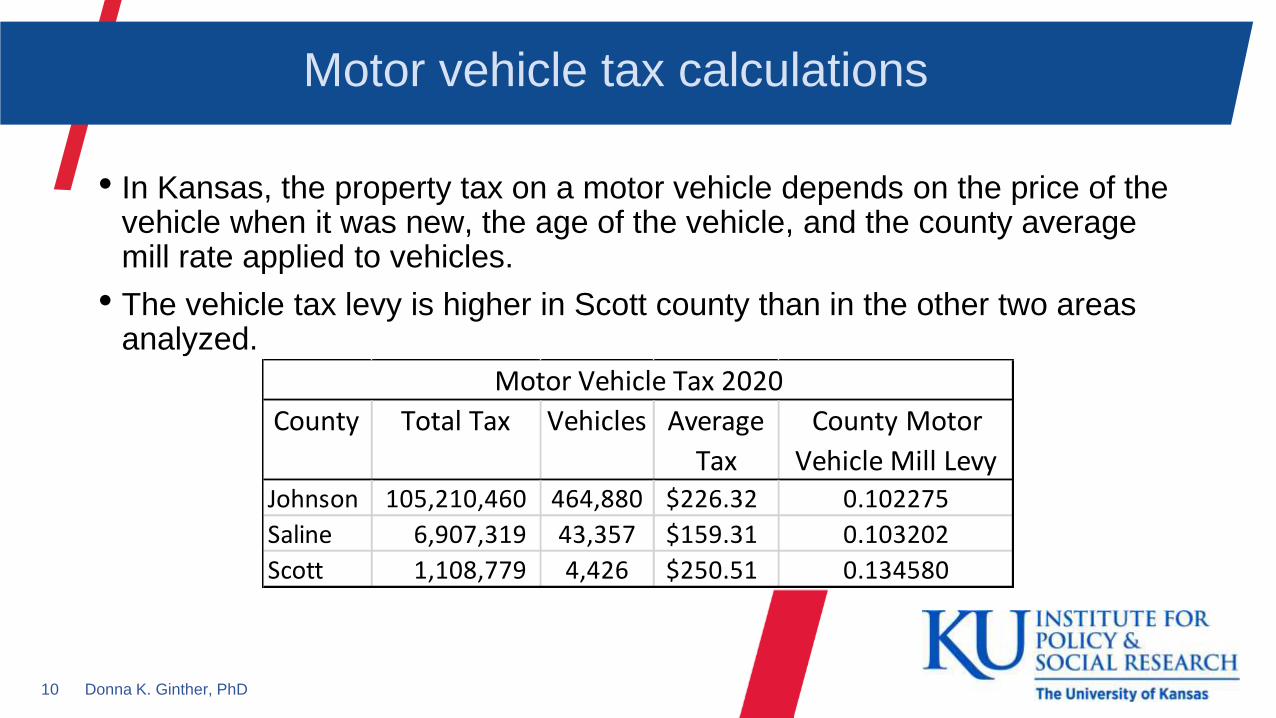
Motor vehicle tax calculations
• In Kansas, the property tax on a motor vehicle depends on the price of the vehicle when it was new, the age of the vehicle, and the county average mill rate applied to vehicles.
• The vehicle tax levy is higher in Scott county than in the other two areas analyzed.
County Total Tax Vehicles Average
Tax
County Motor
Vehicle Mill LevyJohnson 105,210,460 464,880 $226.32 0.102275
Saline 6,907,319 43,357 $159.31 0.103202
Scott 1,108,779 4,426 $250.51 0.134580
Motor Vehicle Tax 2020
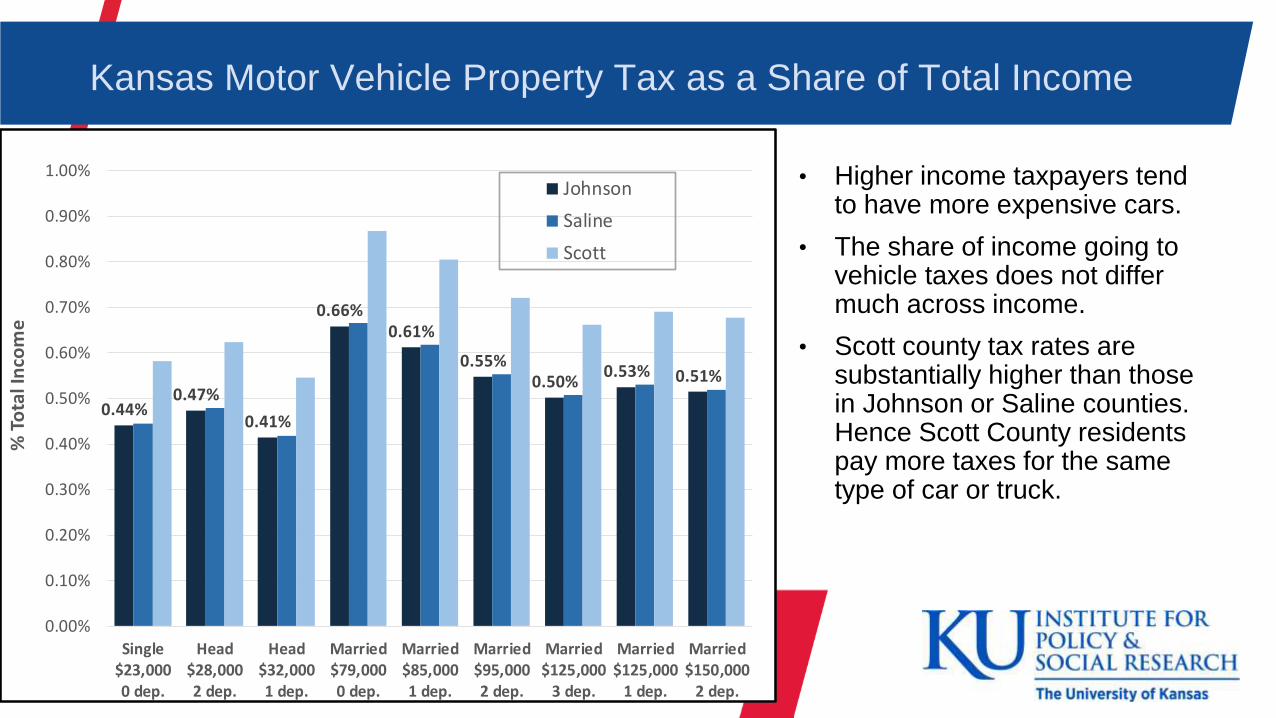
Kansas Motor Vehicle Property Tax as a Share of Total Income
• Higher income taxpayers tend to have more expensive cars.
• The share of income going to vehicle taxes does not differ much across income.
• Scott county tax rates are substantially higher than those in Johnson or Saline counties. Hence Scott County residents pay more taxes for the same type of car or truck.
0.44%0.47%
0.41%
0.66%0.61%
0.55%0.50%
0.53% 0.51%
0.00%
0.10%
0.20%
0.30%
0.40%
0.50%
0.60%
0.70%
0.80%
0.90%
1.00%
Single$23,0000 dep.
Head$28,0002 dep.
Head$32,0001 dep.
Married$79,0000 dep.
Married$85,0001 dep.
Married$95,0002 dep.
Married$125,000
3 dep.
Married$125,000
1 dep.
Married$150,000
2 dep.
% T
ota
l In
com
e
Johnson
Saline
Scott
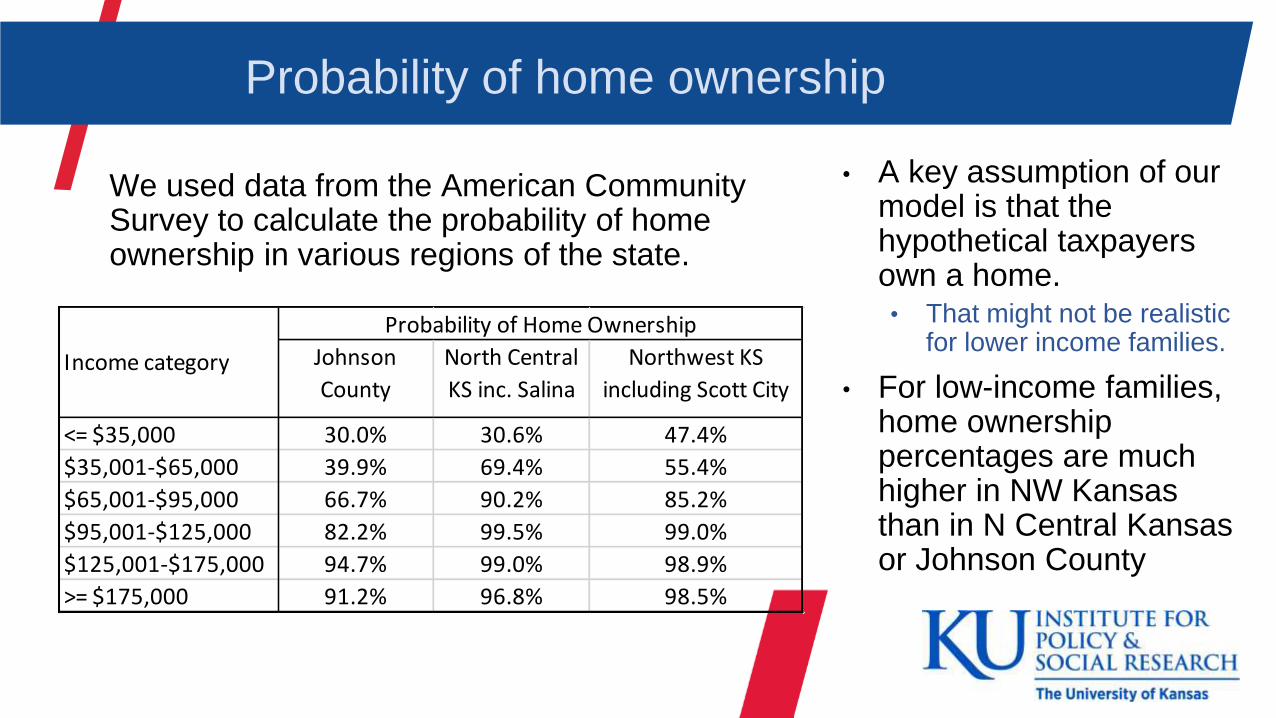
Probability of home ownership
We used data from the American Community Survey to calculate the probability of home ownership in various regions of the state.
• A key assumption of our model is that the hypothetical taxpayers own a home. • That might not be realistic
for lower income families.
• For low-income families, home ownership percentages are much higher in NW Kansas than in N Central Kansas or Johnson County
Johnson
County
North Central
KS inc. Salina
Northwest KS
including Scott City
<= $35,000 30.0% 30.6% 47.4%
$35,001-$65,000 39.9% 69.4% 55.4%
$65,001-$95,000 66.7% 90.2% 85.2%
$95,001-$125,000 82.2% 99.5% 99.0%
$125,001-$175,000 94.7% 99.0% 98.9%
>= $175,000 91.2% 96.8% 98.5%
Probability of Home Ownership
Income category

13 Donna K. Ginther, PhD
Property tax calculations
Home values and mill levies vary substantially by region.
County Total Assessed Single-Family Average Average Average Average
Residential Valuation Parcels Market Value Assessed Value Levy Tax
Johnson 6,458,096,199 162,329 345,948 39,784 0.1181 $4,698.37
Saline Urban 262,419,782 16,501 138,289 15,903 0.1383 $2,199.04
Scott Urban 18,146,580 1,558 101,281 11,647 0.1998 $2,327.35
Source: Kansas Department of Revenue
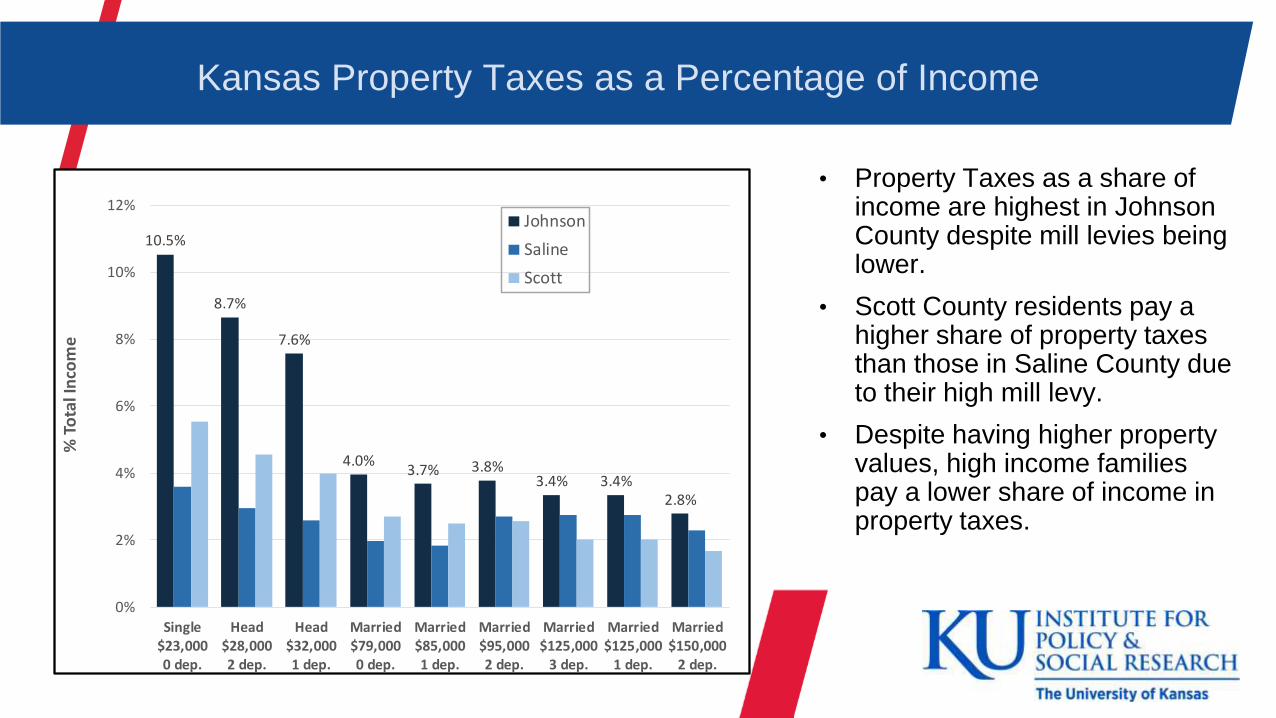
Kansas Property Taxes as a Percentage of Income
• Property Taxes as a share of income are highest in Johnson County despite mill levies being lower.
• Scott County residents pay a higher share of property taxes than those in Saline County due to their high mill levy.
• Despite having higher property values, high income families pay a lower share of income in property taxes.
10.5%
8.7%
7.6%
4.0%3.7% 3.8%
3.4% 3.4%2.8%
0%
2%
4%
6%
8%
10%
12%
Single$23,0000 dep.
Head$28,0002 dep.
Head$32,0001 dep.
Married$79,0000 dep.
Married$85,0001 dep.
Married$95,0002 dep.
Married$125,000
3 dep.
Married$125,000
1 dep.
Married$150,000
2 dep.
% T
ota
l In
com
e
Johnson
Saline
Scott

Kansas Taxes as Share of Total Income by Tax TypeJohnson County
• A Lower-Income Household with one dependent who owns a home in Johnson County would pay 16% of their income in taxes.
• Subtracting off homeownership, the lowest income household in Johnson County is paying ~10% of their income in taxes because of the regressivity of sales taxes.
21.1%
13.2% 15.9%
12.2% 11.7% 11.6% 11.2% 11.4% 10.9%
-3%
0%
3%
6%
9%
12%
15%
18%
21%
24%
Single$23,0000 dep.
Head$28,0002 dep.
Head$32,0001 dep.
Married$79,0000 dep.
Married$85,0001 dep.
Married$95,0002 dep.
Married$125,000
3 dep.
Married$125,000
1 dep.
Married$150,000
2 dep.
Pe
rce
nt
Tota
l In
com
e
Vehicle property
Residential property
Sales tax
KS Income tax
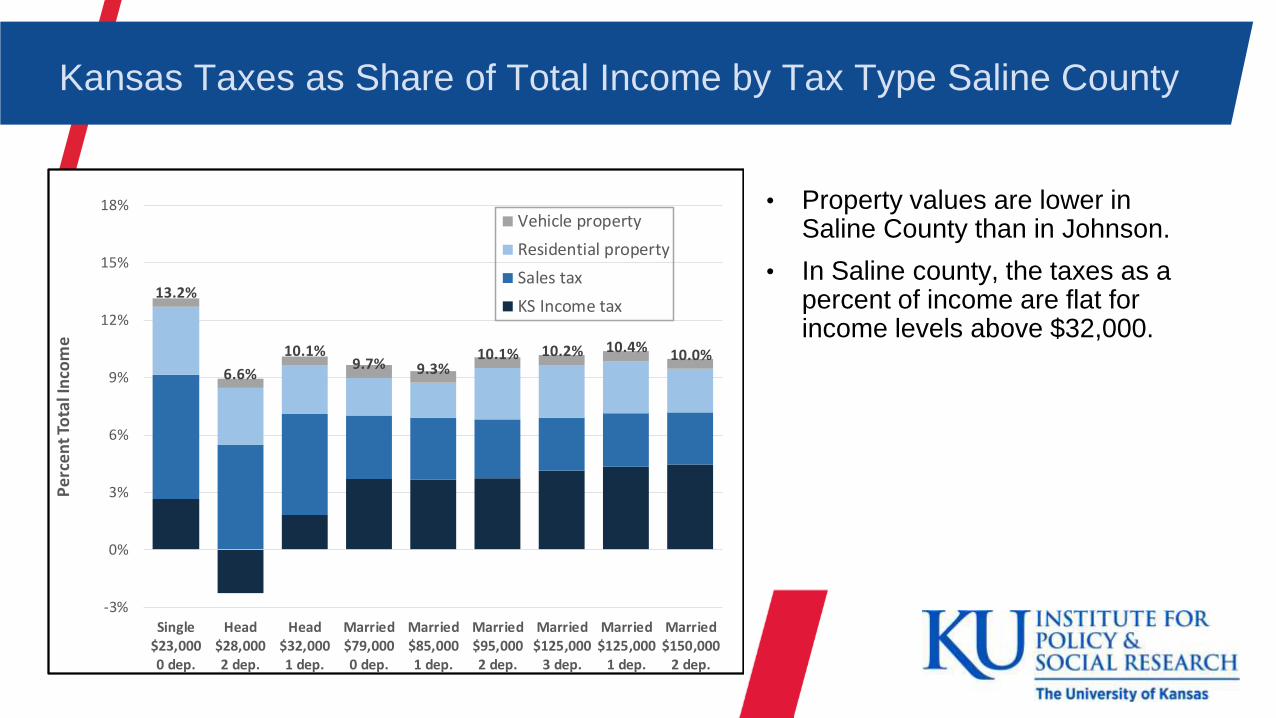
Kansas Taxes as Share of Total Income by Tax Type Saline County
• Property values are lower in Saline County than in Johnson.
• In Saline county, the taxes as a percent of income are flat for income levels above $32,000.
13.2%
6.6%
10.1%9.7% 9.3%
10.1% 10.2% 10.4% 10.0%
-3%
0%
3%
6%
9%
12%
15%
18%
Single$23,0000 dep.
Head$28,0002 dep.
Head$32,0001 dep.
Married$79,0000 dep.
Married$85,0001 dep.
Married$95,0002 dep.
Married$125,000
3 dep.
Married$125,000
1 dep.
Married$150,000
2 dep.
Pe
rce
nt
Tota
l In
com
e
Vehicle property
Residential property
Sales tax
KS Income tax
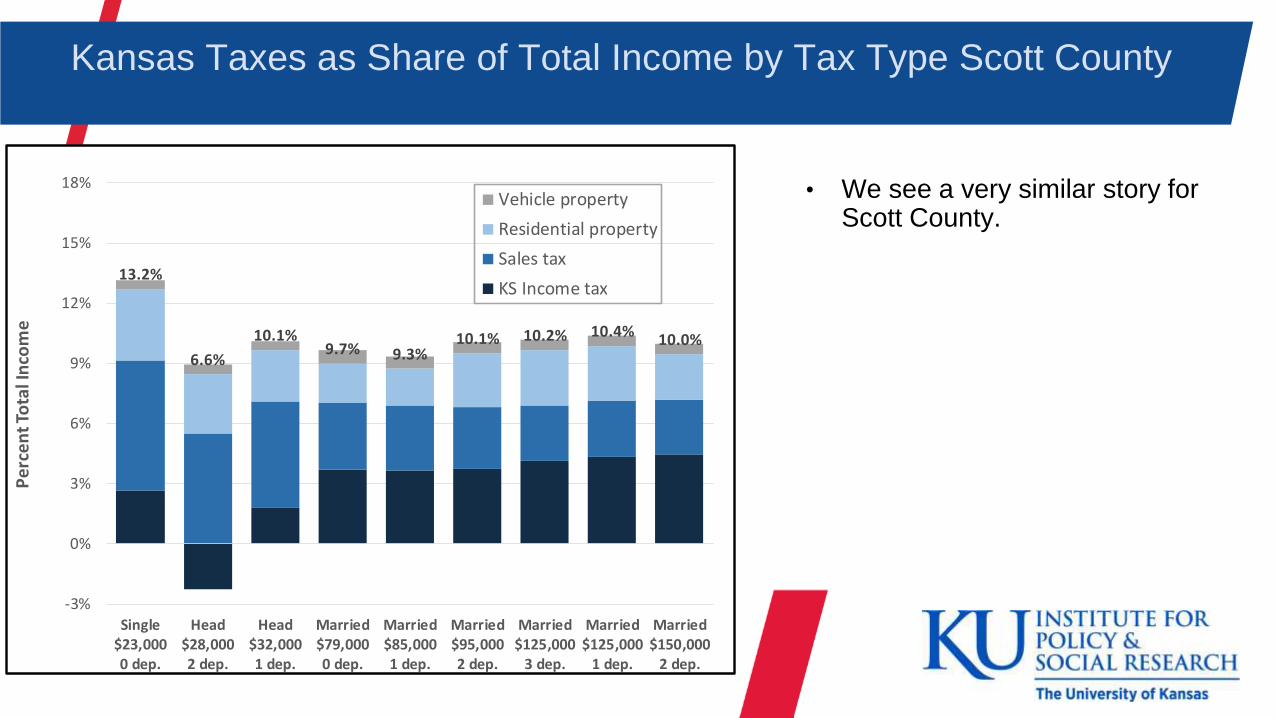
Kansas Taxes as Share of Total Income by Tax Type Scott County
13.2%
6.6%
10.1%9.7% 9.3%
10.1% 10.2% 10.4% 10.0%
-3%
0%
3%
6%
9%
12%
15%
18%
Single$23,0000 dep.
Head$28,0002 dep.
Head$32,0001 dep.
Married$79,0000 dep.
Married$85,0001 dep.
Married$95,0002 dep.
Married$125,000
3 dep.
Married$125,000
1 dep.
Married$150,000
2 dep.
Pe
rce
nt
Tota
l In
com
e
Vehicle property
Residential property
Sales tax
KS Income tax
• We see a very similar story for Scott County.
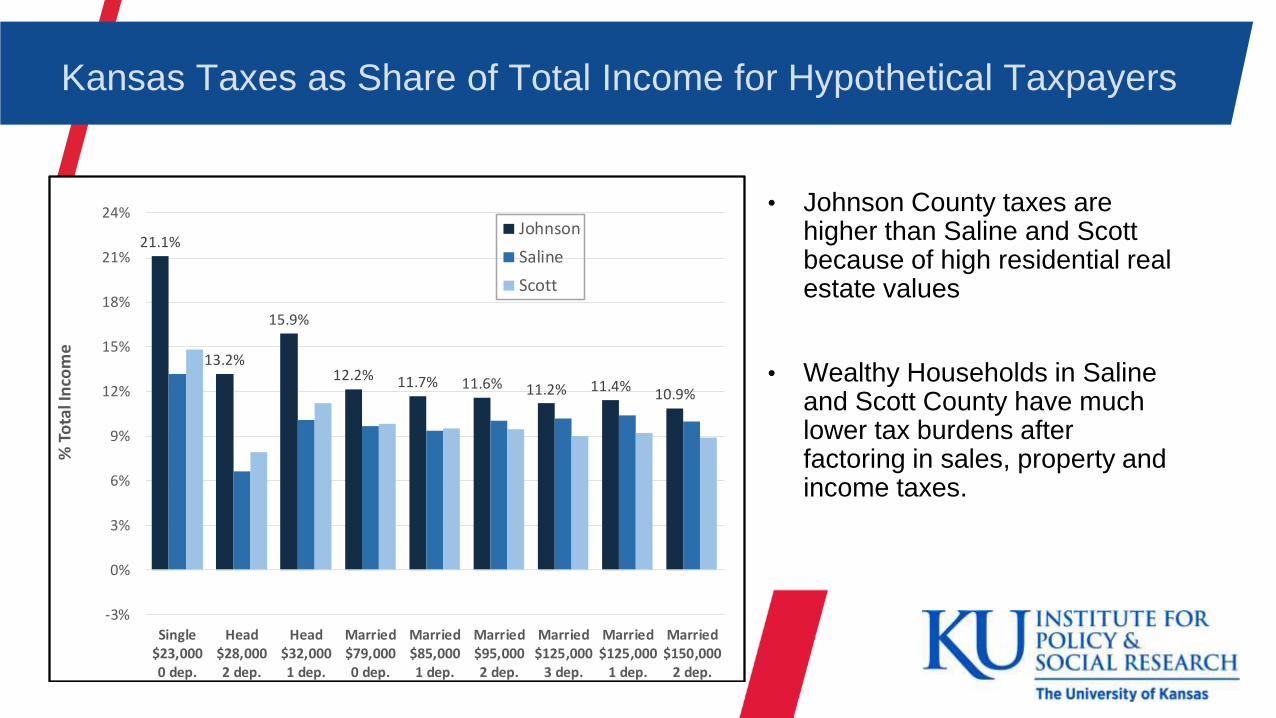
Kansas Taxes as Share of Total Income for Hypothetical Taxpayers
• Johnson County taxes are higher than Saline and Scott because of high residential real estate values
• Wealthy Households in Saline and Scott County have much lower tax burdens after factoring in sales, property and income taxes.
21.1%
13.2%
15.9%
12.2% 11.7% 11.6% 11.2% 11.4%10.9%
-3%
0%
3%
6%
9%
12%
15%
18%
21%
24%
Single$23,0000 dep.
Head$28,0002 dep.
Head$32,0001 dep.
Married$79,0000 dep.
Married$85,0001 dep.
Married$95,0002 dep.
Married$125,000
3 dep.
Married$125,000
1 dep.
Married$150,000
2 dep.
% T
ota
l In
com
e
Johnson
Saline
Scott
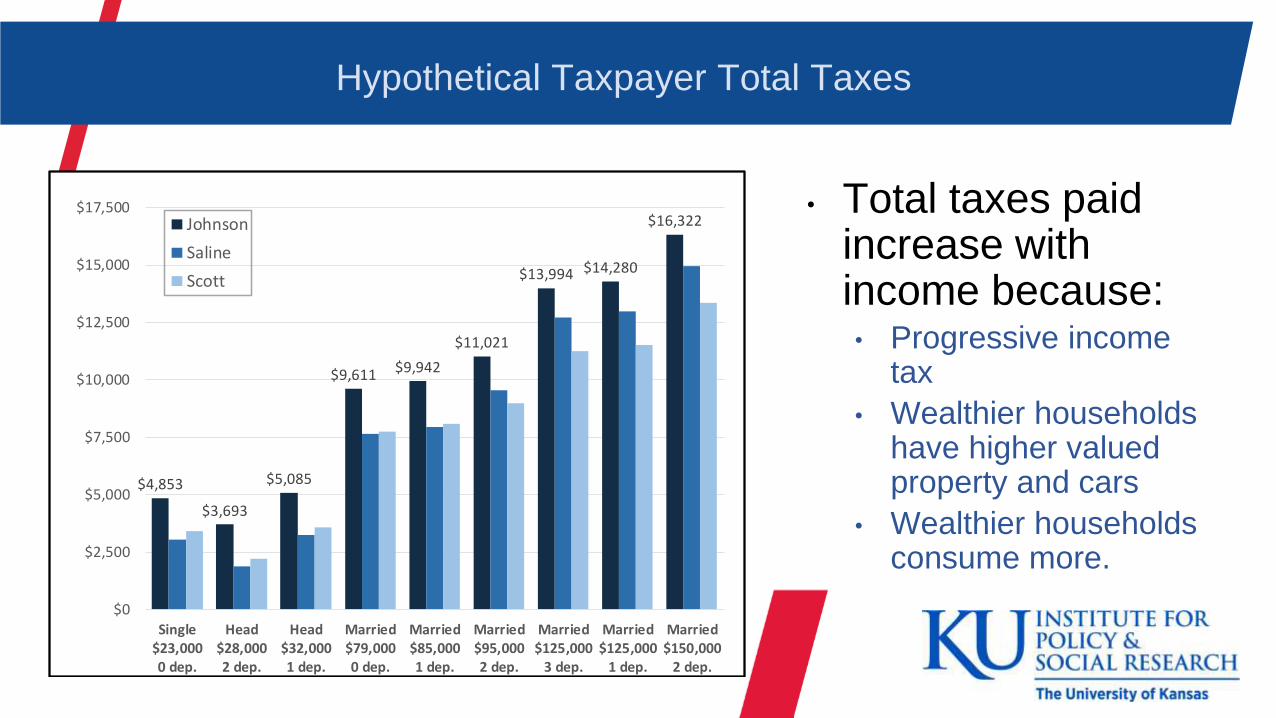
Hypothetical Taxpayer Total Taxes
• Total taxes paid increase with income because:• Progressive income
tax
• Wealthier households have higher valued property and cars
• Wealthier households consume more.
$4,853
$3,693
$5,085
$9,611 $9,942
$11,021
$13,994 $14,280
$16,322
$0
$2,500
$5,000
$7,500
$10,000
$12,500
$15,000
$17,500
Single$23,0000 dep.
Head$28,0002 dep.
Head$32,0001 dep.
Married$79,0000 dep.
Married$85,0001 dep.
Married$95,0002 dep.
Married$125,000
3 dep.
Married$125,000
1 dep.
Married$150,000
2 dep.
Johnson
Saline
Scott
20 Donna K. Ginther, PhD
Hypothetical Taxpayers Next Steps
• Do the assumptions we’ve used make sense?
• Should we consider other types of taxpayers?
• We can use the hypothetical taxpayers to model how changes in tax policy would change the tax incidence of these households.
21 Donna K. Ginther, PhD
Thank You!
Danke