tasmanian department of justice state people matter survey service 2016 benchmark report ·...
TRANSCRIPT
TASMANIANSTATESERVICE
Department of Justice
People Matter Survey2016 Benchmark Report
August 2016
State Service Management OfficeDepartment of Premier and Cabinet
IntroductionThe People Matter Survey gathers information from your employees about how they experience work in your organisation.
This report outlines the 2016 People Matter Survey results for Department of Justice.
The report also provides whole-of-service responses for comparison.
How to use the information in this reportPlease refer to the Working with your People Matter Survey Results guide.
Important information• Due to survey improvements, such as the new ‘neither agree nor disagree’ response, some results cannot be compared to previous surveys.
• All percentages are of all respondents, unless stated otherwise.
• The percentage agreement calculation is now:Agreement % = Respondents that agree or strongly agree # / All respondents #The denominator now includes ‘Don’t know’ responses which were previously excluded. This change provides truer agreement levels.
• All percentages have been rounded to whole numbers.
• Following feedback from last year's report, this year your organisation's results will only be compared to the State Service average (not other agencies).
• To protect anonymity, opinion question results for demographic groups such as gender, occupation etc. are not shown where there are fewer than 10 survey responses for the group.
Please contact [email protected] for further information or to provide feedback.
ContentsResponse rate 3What the survey measures 4Response profile 5Areas of strength, concern and uncertainty 7State service valuesResponsiveness 8Integrity 10Impartiality 12Accountability 14Respect 16Leadership 18Employment principlesMerit 20Fair and reasonable treatment 22Workforce diversity 24Avenues of redress 29Supporting measuresFeedback 31Effective promotion of policies and process 33Job satisfaction 35Engagement 37Employee engagement 39Role clarity 41Role enablers 43Intrinsic reward 45Bullying 47Career intentions 49Change management 54Leading change 56Learning and development 58Wellbeing 64
People Matter Survey 2016 PMS survey Page 2 of 71
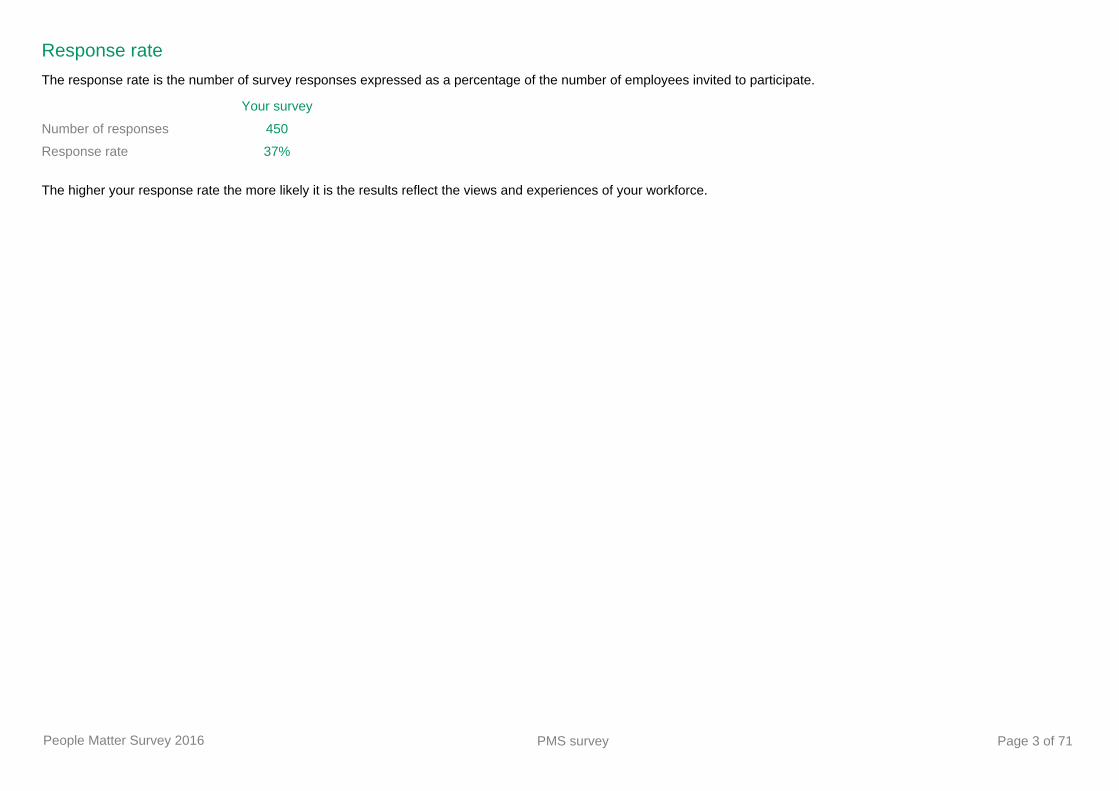
Response rate
The response rate is the number of survey responses expressed as a percentage of the number of employees invited to participate.
The higher your response rate the more likely it is the results reflect the views and experiences of your workforce.
Your survey
Number of responses 450
Response rate 37%
People Matter Survey 2016 PMS survey Page 3 of 71
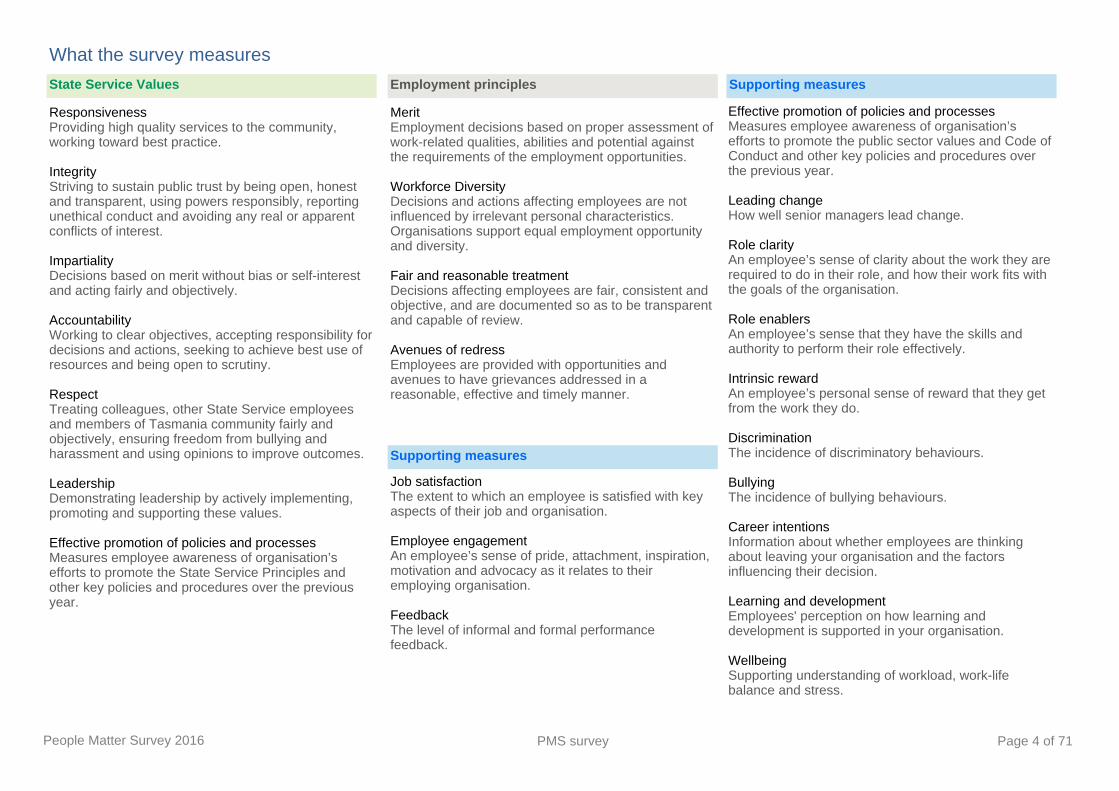
ResponsivenessProviding high quality services to the community, working toward best practice.
IntegrityStriving to sustain public trust by being open, honest and transparent, using powers responsibly, reporting unethical conduct and avoiding any real or apparent conflicts of interest.
ImpartialityDecisions based on merit without bias or self-interest and acting fairly and objectively.
AccountabilityWorking to clear objectives, accepting responsibility for decisions and actions, seeking to achieve best use of resources and being open to scrutiny.
RespectTreating colleagues, other State Service employees and members of Tasmania community fairly and objectively, ensuring freedom from bullying and harassment and using opinions to improve outcomes.
LeadershipDemonstrating leadership by actively implementing, promoting and supporting these values.
Effective promotion of policies and processesMeasures employee awareness of organisation’s efforts to promote the State Service Principles and other key policies and procedures over the previous year.
State Service Values
MeritEmployment decisions based on proper assessment of work-related qualities, abilities and potential against the requirements of the employment opportunities.
Workforce DiversityDecisions and actions affecting employees are not influenced by irrelevant personal characteristics. Organisations support equal employment opportunity and diversity.
Fair and reasonable treatmentDecisions affecting employees are fair, consistent and objective, and are documented so as to be transparent and capable of review.
Avenues of redressEmployees are provided with opportunities and avenues to have grievances addressed in a reasonable, effective and timely manner.
Effective promotion of policies and processesMeasures employee awareness of organisation’s efforts to promote the public sector values and Code of Conduct and other key policies and procedures over the previous year.
Leading changeHow well senior managers lead change.
Role clarityAn employee’s sense of clarity about the work they are required to do in their role, and how their work fits with the goals of the organisation.
Role enablersAn employee’s sense that they have the skills and authority to perform their role effectively.
Intrinsic rewardAn employee’s personal sense of reward that they get from the work they do.
DiscriminationThe incidence of discriminatory behaviours.
BullyingThe incidence of bullying behaviours.
Career intentionsInformation about whether employees are thinking about leaving your organisation and the factors influencing their decision.
Learning and developmentEmployees' perception on how learning and development is supported in your organisation.
WellbeingSupporting understanding of workload, work-life balance and stress.
What the survey measures
Employment principles Supporting measures
Supporting measures
Job satisfactionThe extent to which an employee is satisfied with key aspects of their job and organisation.
Employee engagementAn employee’s sense of pride, attachment, inspiration, motivation and advocacy as it relates to their employing organisation.
FeedbackThe level of informal and formal performance feedback.
People Matter Survey 2016 PMS survey Page 4 of 71
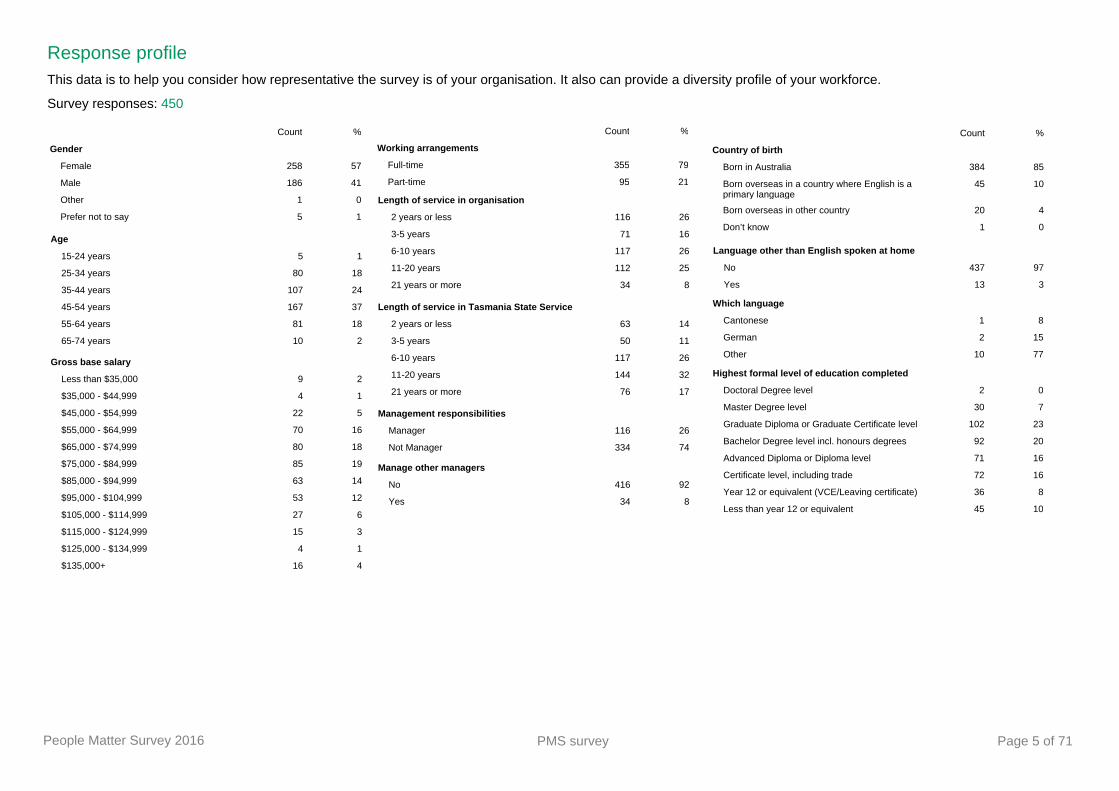
Response profileThis data is to help you consider how representative the survey is of your organisation. It also can provide a diversity profile of your workforce.
Survey responses: 450
Count %
Working arrangements
Full-time 355 79
Part-time 95 21
Length of service in Tasmania State Service
2 years or less 63 14
3-5 years 50 11
6-10 years 117 26
11-20 years 144 32
21 years or more 76 17
Length of service in organisation
2 years or less 116 26
3-5 years 71 16
6-10 years 117 26
11-20 years 112 25
21 years or more 34 8
Management responsibilities
Manager 116 26
Not Manager 334 74
Manage other managers
No 416 92
Yes 34 8
Count %
Country of birth
Born in Australia 384 85
Born overseas in a country where English is a primary language
45 10
Born overseas in other country 20 4
Don’t know 1 0
Language other than English spoken at home
No 437 97
Yes 13 3
Which language
Cantonese 1 8
German 2 15
Other 10 77
Highest formal level of education completed
Doctoral Degree level 2 0
Master Degree level 30 7
Graduate Diploma or Graduate Certificate level 102 23
Bachelor Degree level incl. honours degrees 92 20
Advanced Diploma or Diploma level 71 16
Certificate level, including trade 72 16
Year 12 or equivalent (VCE/Leaving certificate) 36 8
Less than year 12 or equivalent 45 10
Count %
Gender
Female 258 57
Male 186 41
Other 1 0
Prefer not to say 5 1
Age
15-24 years 5 1
25-34 years 80 18
35-44 years 107 24
45-54 years 167 37
55-64 years 81 18
65-74 years 10 2
Gross base salary
Less than $35,000 9 2
$35,000 - $44,999 4 1
$45,000 - $54,999 22 5
$55,000 - $64,999 70 16
$65,000 - $74,999 80 18
$75,000 - $84,999 85 19
$85,000 - $94,999 63 14
$95,000 - $104,999 53 12
$105,000 - $114,999 27 6
$115,000 - $124,999 15 3
$125,000 - $134,999 4 1
$135,000+ 16 4
People Matter Survey 2016 PMS survey Page 5 of 71
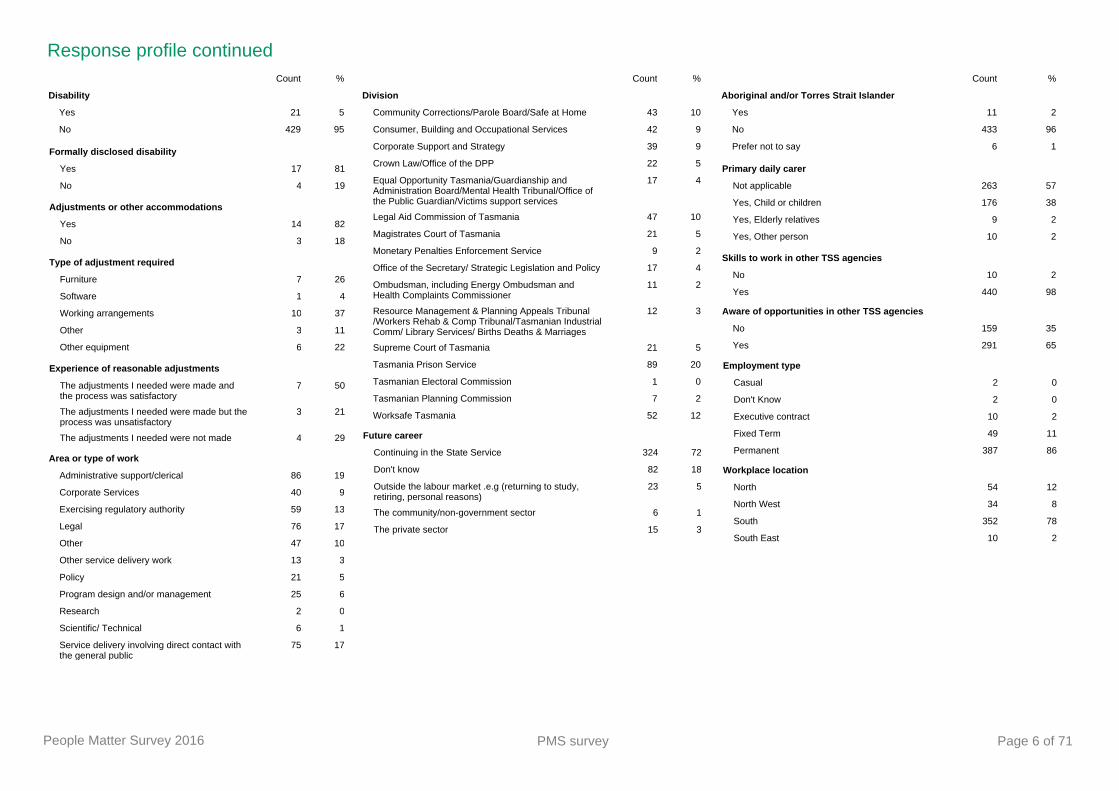
Response profile continuedCount %
Disability
Yes 21 5
No 429 95
Formally disclosed disability
Yes 17 81
No 4 19
Adjustments or other accommodations
Yes 14 82
No 3 18
Type of adjustment required
Furniture 7 26
Software 1 4
Working arrangements 10 37
Other 3 11
Other equipment 6 22
Experience of reasonable adjustments
The adjustments I needed were made and the process was satisfactory
7 50
The adjustments I needed were made but the process was unsatisfactory
3 21
The adjustments I needed were not made 4 29
Area or type of work
Administrative support/clerical 86 19
Corporate Services 40 9
Exercising regulatory authority 59 13
Legal 76 17
Other 47 10
Other service delivery work 13 3
Policy 21 5
Program design and/or management 25 6
Research 2 0
Scientific/ Technical 6 1
Service delivery involving direct contact with the general public
75 17
Count %
Division
Community Corrections/Parole Board/Safe at Home 43 10
Consumer, Building and Occupational Services 42 9
Corporate Support and Strategy 39 9
Crown Law/Office of the DPP 22 5
Equal Opportunity Tasmania/Guardianship and Administration Board/Mental Health Tribunal/Office of the Public Guardian/Victims support services
17 4
Legal Aid Commission of Tasmania 47 10
Magistrates Court of Tasmania 21 5
Monetary Penalties Enforcement Service 9 2
Office of the Secretary/ Strategic Legislation and Policy 17 4
Ombudsman, including Energy Ombudsman and Health Complaints Commissioner
11 2
Resource Management & Planning Appeals Tribunal /Workers Rehab & Comp Tribunal/Tasmanian Industrial Comm/ Library Services/ Births Deaths & Marriages
12 3
Supreme Court of Tasmania 21 5
Tasmania Prison Service 89 20
Tasmanian Electoral Commission 1 0
Tasmanian Planning Commission 7 2
Worksafe Tasmania 52 12
Future career
Continuing in the State Service 324 72
Don't know 82 18
Outside the labour market .e.g (returning to study, retiring, personal reasons)
23 5
The community/non-government sector 6 1
The private sector 15 3
Count %
Aboriginal and/or Torres Strait Islander
Yes 11 2
No 433 96
Prefer not to say 6 1
Primary daily carer
Not applicable 263 57
Yes, Child or children 176 38
Yes, Elderly relatives 9 2
Yes, Other person 10 2
Skills to work in other TSS agencies
No 10 2
Yes 440 98
Aware of opportunities in other TSS agencies
No 159 35
Yes 291 65
Employment type
Casual 2 0
Don't Know 2 0
Executive contract 10 2
Fixed Term 49 11
Permanent 387 86
Workplace location
North 54 12
North West 34 8
South 352 78
South East 10 2
People Matter Survey 2016 PMS survey Page 6 of 71
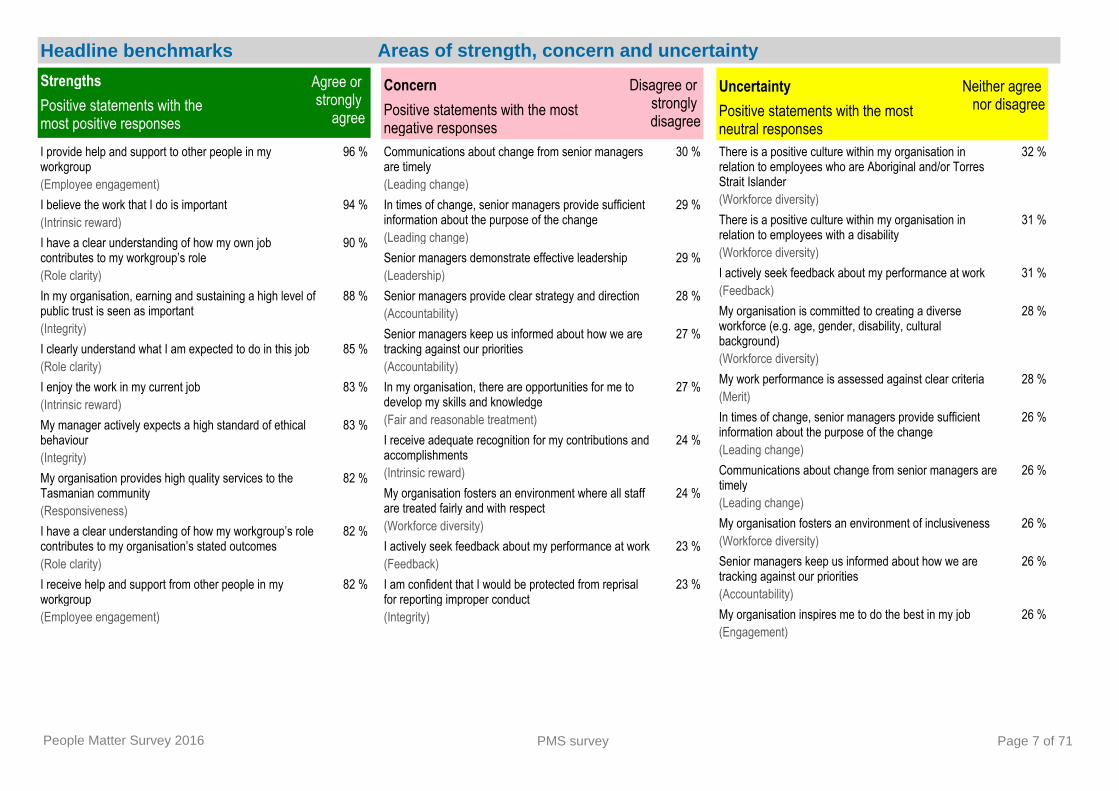
I provide help and support to other people in my workgroup
96 %
(Employee engagement)I believe the work that I do is important 94 %(Intrinsic reward)I have a clear understanding of how my own job contributes to my workgroup’s role
90 %
(Role clarity)In my organisation, earning and sustaining a high level of public trust is seen as important
88 %
(Integrity)I clearly understand what I am expected to do in this job 85 %(Role clarity)I enjoy the work in my current job 83 %(Intrinsic reward)My manager actively expects a high standard of ethical behaviour
83 %
(Integrity)My organisation provides high quality services to the Tasmanian community
82 %
(Responsiveness)I have a clear understanding of how my workgroup’s role contributes to my organisation’s stated outcomes
82 %
(Role clarity)I receive help and support from other people in my workgroup
82 %
(Employee engagement)
Headline benchmarks Areas of strength, concern and uncertainty
StrengthsPositive statements with the most positive responses
Agree or strongly
agree
ConcernPositive statements with the most negative responses
Disagree or strongly disagree
Communications about change from senior managers are timely
30 %
(Leading change)In times of change, senior managers provide sufficient information about the purpose of the change
29 %
(Leading change)Senior managers demonstrate effective leadership 29 %(Leadership)Senior managers provide clear strategy and direction 28 %(Accountability)Senior managers keep us informed about how we are tracking against our priorities
27 %
(Accountability)In my organisation, there are opportunities for me to develop my skills and knowledge
27 %
(Fair and reasonable treatment)I receive adequate recognition for my contributions and accomplishments
24 %
(Intrinsic reward)My organisation fosters an environment where all staff are treated fairly and with respect
24 %
(Workforce diversity)I actively seek feedback about my performance at work 23 %(Feedback)I am confident that I would be protected from reprisal for reporting improper conduct
23 %
(Integrity)
UncertaintyPositive statements with the most neutral responses
Neither agree nor disagree
There is a positive culture within my organisation in relation to employees who are Aboriginal and/or Torres Strait Islander
32 %
(Workforce diversity)There is a positive culture within my organisation in relation to employees with a disability
31 %
(Workforce diversity)I actively seek feedback about my performance at work 31 %(Feedback)My organisation is committed to creating a diverse workforce (e.g. age, gender, disability, cultural background)
28 %
(Workforce diversity)My work performance is assessed against clear criteria 28 %(Merit)In times of change, senior managers provide sufficient information about the purpose of the change
26 %
(Leading change)Communications about change from senior managers are timely
26 %
(Leading change)My organisation fosters an environment of inclusiveness 26 %(Workforce diversity)Senior managers keep us informed about how we are tracking against our priorities
26 %
(Accountability)My organisation inspires me to do the best in my job 26 %(Engagement)
People Matter Survey 2016 PMS survey Page 7 of 71
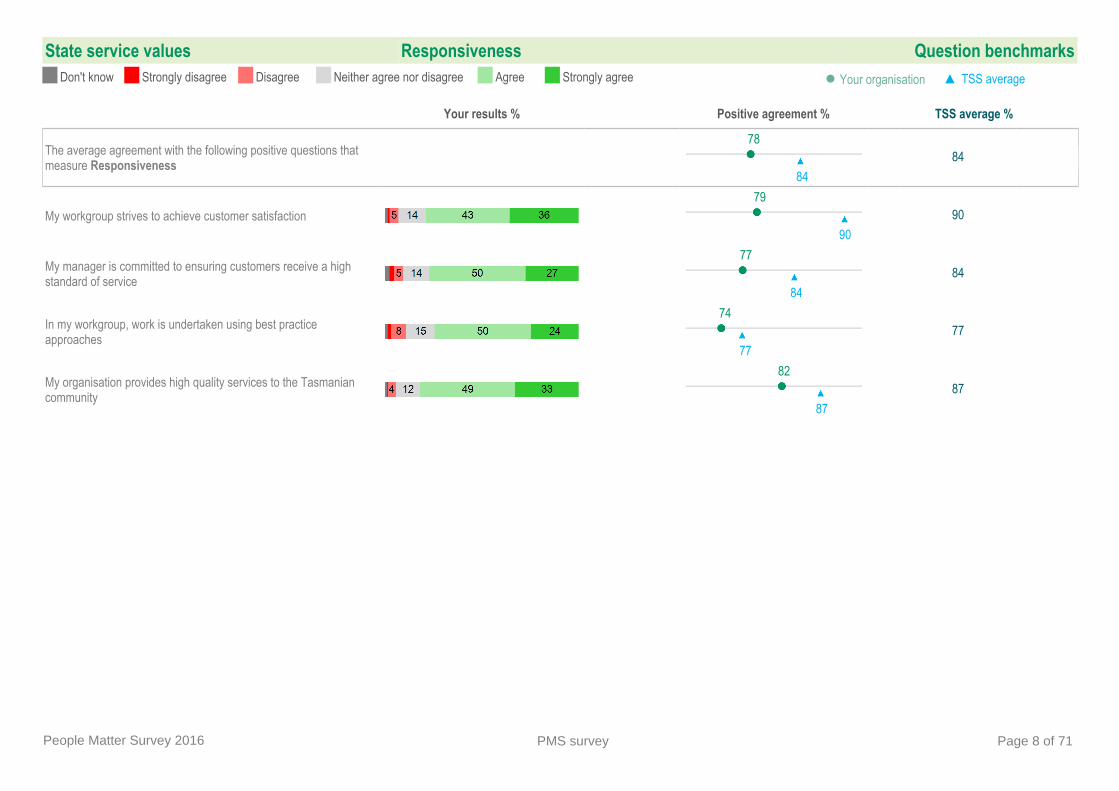
State service values Responsiveness Question benchmarksDon't know Strongly disagree Disagree Neither agree nor disagree Agree Strongly agree ● Your organisation ▲ TSS average
Your results % Positive agreement % TSS average %
The average agreement with the following positive questions that measure Responsiveness
7884
84
My workgroup strives to achieve customer satisfaction79
9090
My manager is committed to ensuring customers receive a high standard of service
7784
84
In my workgroup, work is undertaken using best practice approaches
7477
77
My organisation provides high quality services to the Tasmanian community
8287
87
People Matter Survey 2016 PMS survey Page 8 of 71
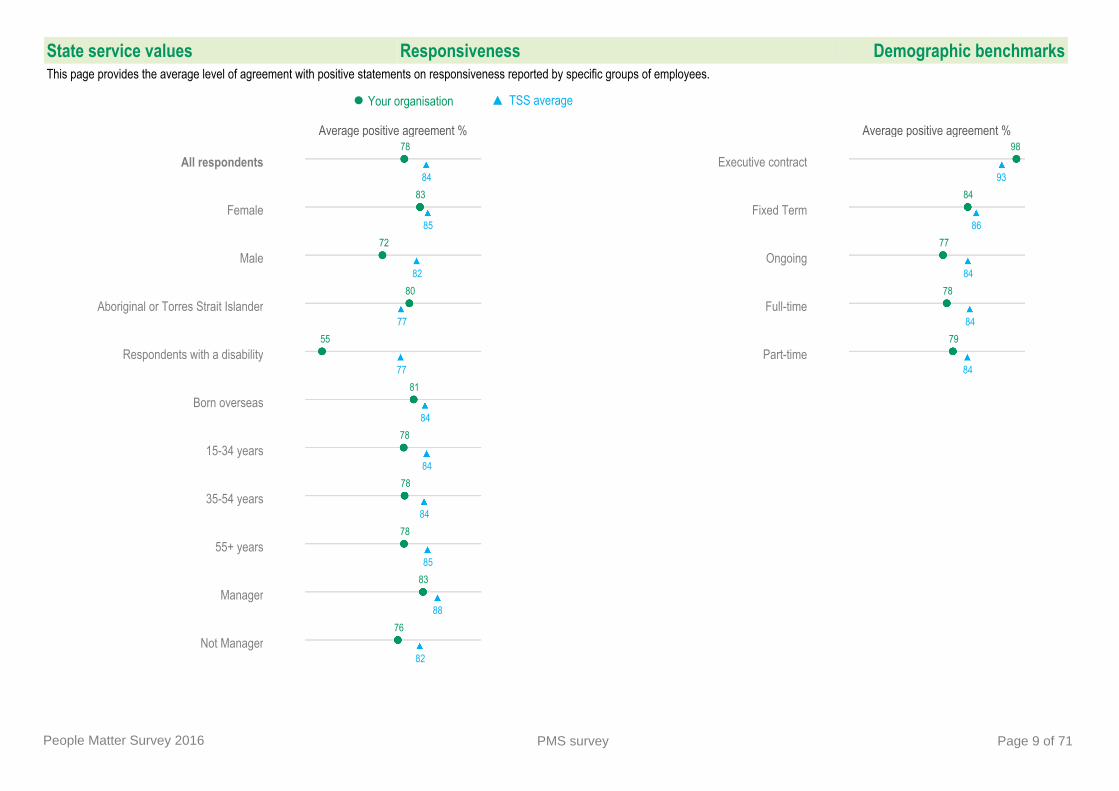
State service values Responsiveness Demographic benchmarksThis page provides the average level of agreement with positive statements on responsiveness reported by specific groups of employees.
● Your organisation ▲ TSS average
Average positive agreement %
All respondents78
84
Female83
85
Male72
82
Aboriginal or Torres Strait Islander80
77
Respondents with a disability55
77
Born overseas81
84
15-34 years78
84
35-54 years78
84
55+ years78
85
Manager83
88
Not Manager76
82
Average positive agreement %
Executive contract98
93
Fixed Term84
86
Ongoing77
84
Full-time78
84
Part-time79
84
People Matter Survey 2016 PMS survey Page 9 of 71

State service values Integrity Question benchmarksDon't know Strongly disagree Disagree Neither agree nor disagree Agree Strongly agree ● Your organisation ▲ TSS average
Your results % Positive agreement % TSS average %
The average agreement with the following positive questions that measure Integrity
7173
73
People in my workgroup are honest, open and transparent in their dealings
7477
77
In my organisation, earning and sustaining a high level of public trust is seen as important
8889
89
In my organisation, engaging in improper conduct is not tolerated67
6969
My manager encourages employees to avoid conflicts of interest74
7575
My manager actively demonstrates a high standard of ethical behaviour
7980
80
My manager actively expects a high standard of ethical behaviour83
8484
I am confident that I would be protected from reprisal for reporting improper conduct
4550
50
In my organisation, there are procedures and systems designed to prevent employees engaging in improper conduct
5965
65
In my organisation, there are procedures and systems in place to assist employees in avoiding conflicts of interest
6867
67
People Matter Survey 2016 PMS survey Page 10 of 71

State service values Integrity Demographic benchmarksThis page provides the average level of agreement with positive statements on integrity reported by specific groups of employees.
● Your organisation ▲ TSS average
Average positive agreement %
All respondents71
73
Female71
69
Male70
72
Aboriginal or Torres Strait Islander74
66
Respondents with a disability52
62
Born overseas69
72
15-34 years73
75
35-54 years70
71
55+ years70
72
Manager79
76
Not Manager68
70
Average positive agreement %
Executive contract100
92
Fixed Term75
75
Ongoing69
71
Full-time71
73
Part-time68
69
People Matter Survey 2016 PMS survey Page 11 of 71
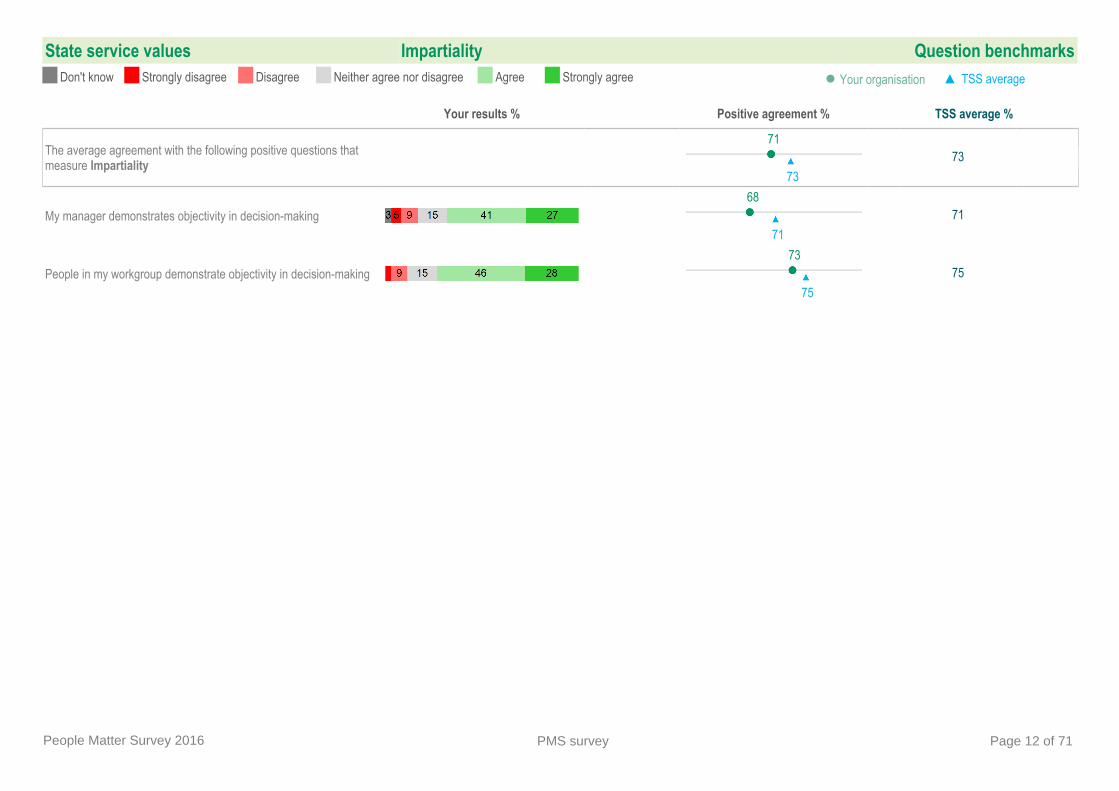
State service values Impartiality Question benchmarksDon't know Strongly disagree Disagree Neither agree nor disagree Agree Strongly agree ● Your organisation ▲ TSS average
Your results % Positive agreement % TSS average %
The average agreement with the following positive questions that measure Impartiality
7173
73
My manager demonstrates objectivity in decision-making68
7171
People in my workgroup demonstrate objectivity in decision-making73
7575
People Matter Survey 2016 PMS survey Page 12 of 71
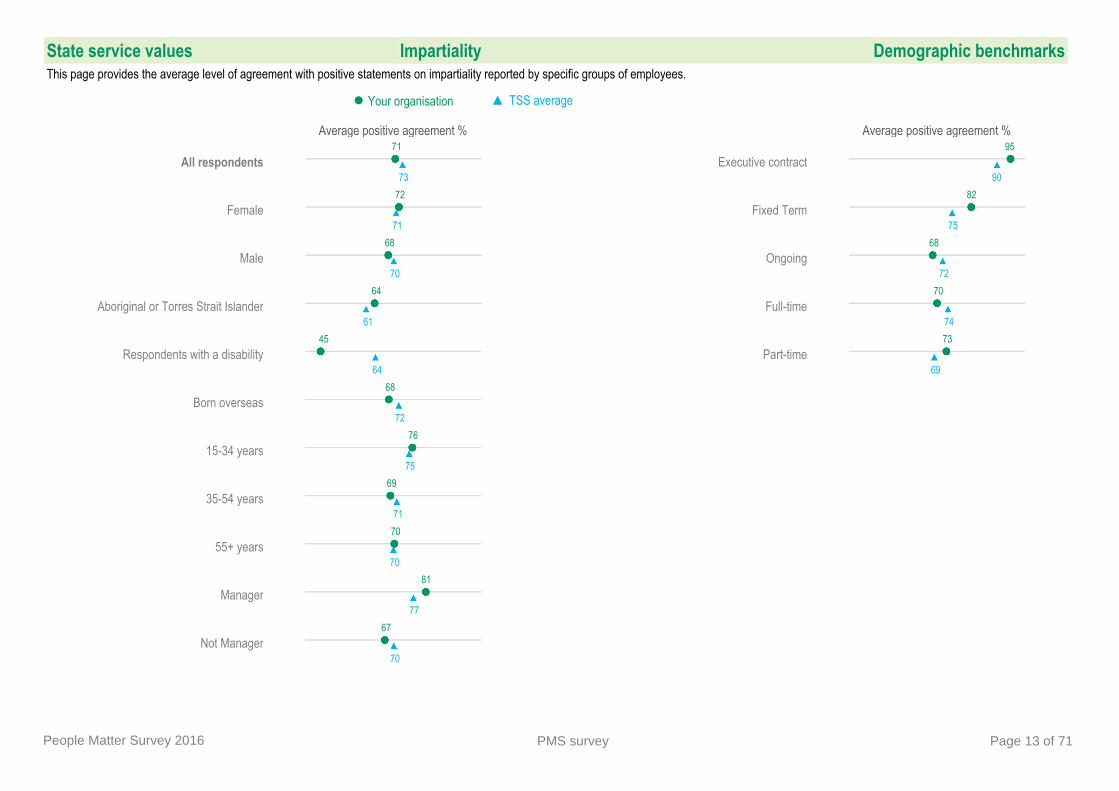
State service values Impartiality Demographic benchmarksThis page provides the average level of agreement with positive statements on impartiality reported by specific groups of employees.
● Your organisation ▲ TSS average
Average positive agreement %
All respondents71
73
Female72
71
Male68
70
Aboriginal or Torres Strait Islander64
61
Respondents with a disability45
64
Born overseas68
72
15-34 years76
75
35-54 years69
71
55+ years70
70
Manager81
77
Not Manager67
70
Average positive agreement %
Executive contract95
90
Fixed Term82
75
Ongoing68
72
Full-time70
74
Part-time73
69
People Matter Survey 2016 PMS survey Page 13 of 71
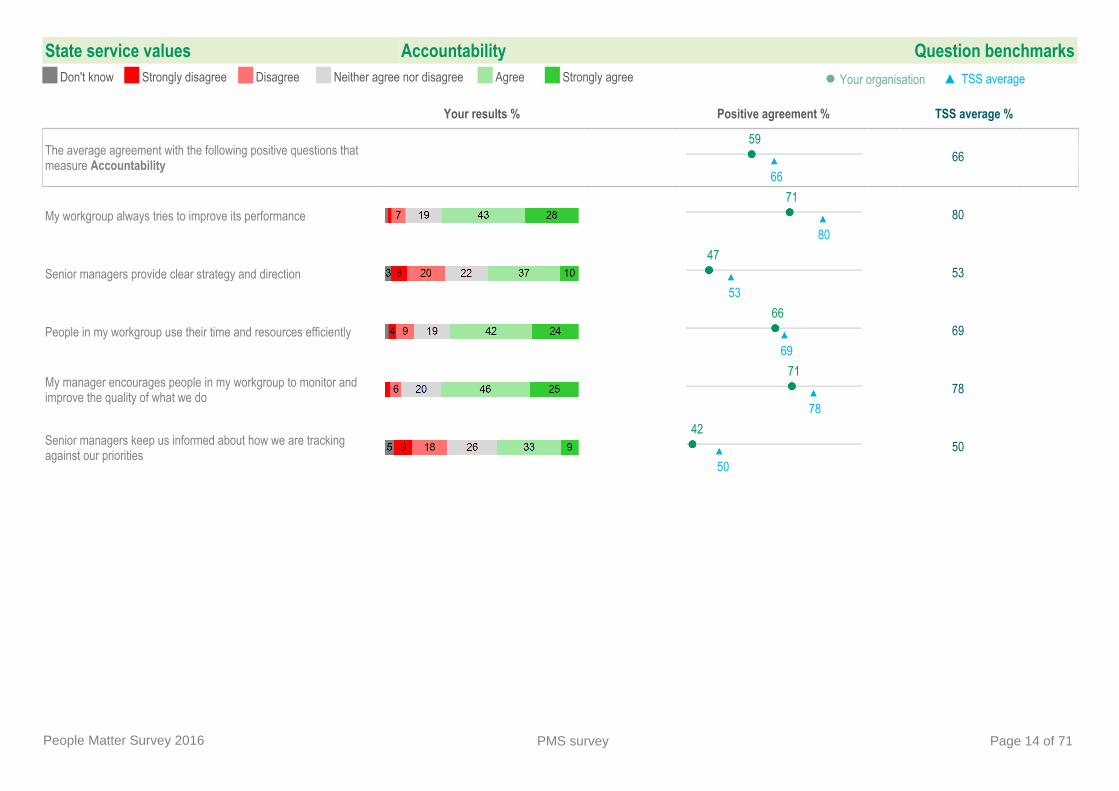
State service values Accountability Question benchmarksDon't know Strongly disagree Disagree Neither agree nor disagree Agree Strongly agree ● Your organisation ▲ TSS average
Your results % Positive agreement % TSS average %
The average agreement with the following positive questions that measure Accountability
5966
66
My workgroup always tries to improve its performance71
8080
Senior managers provide clear strategy and direction47
5353
People in my workgroup use their time and resources efficiently66
6969
My manager encourages people in my workgroup to monitor and improve the quality of what we do
7178
78
Senior managers keep us informed about how we are tracking against our priorities
4250
50
People Matter Survey 2016 PMS survey Page 14 of 71
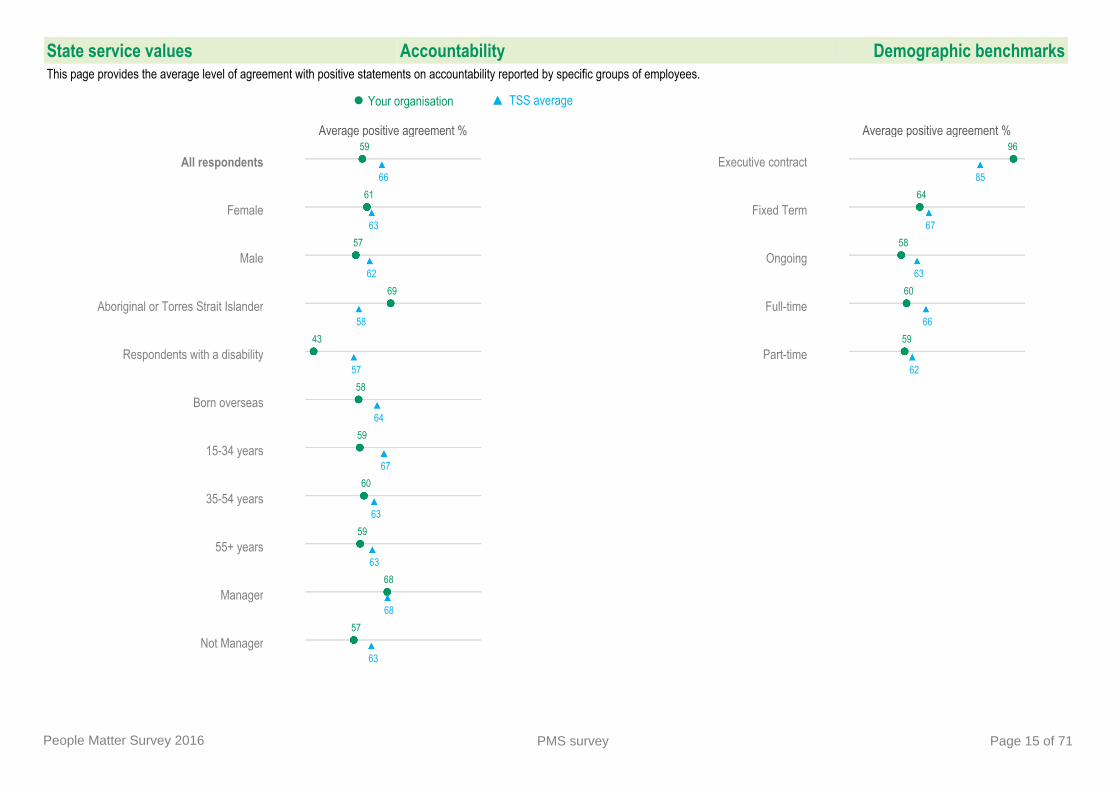
State service values Accountability Demographic benchmarksThis page provides the average level of agreement with positive statements on accountability reported by specific groups of employees.
● Your organisation ▲ TSS average
Average positive agreement %
All respondents59
66
Female61
63
Male57
62
Aboriginal or Torres Strait Islander69
58
Respondents with a disability43
57
Born overseas58
64
15-34 years59
67
35-54 years60
63
55+ years59
63
Manager68
68
Not Manager57
63
Average positive agreement %
Executive contract96
85
Fixed Term64
67
Ongoing58
63
Full-time60
66
Part-time59
62
People Matter Survey 2016 PMS survey Page 15 of 71
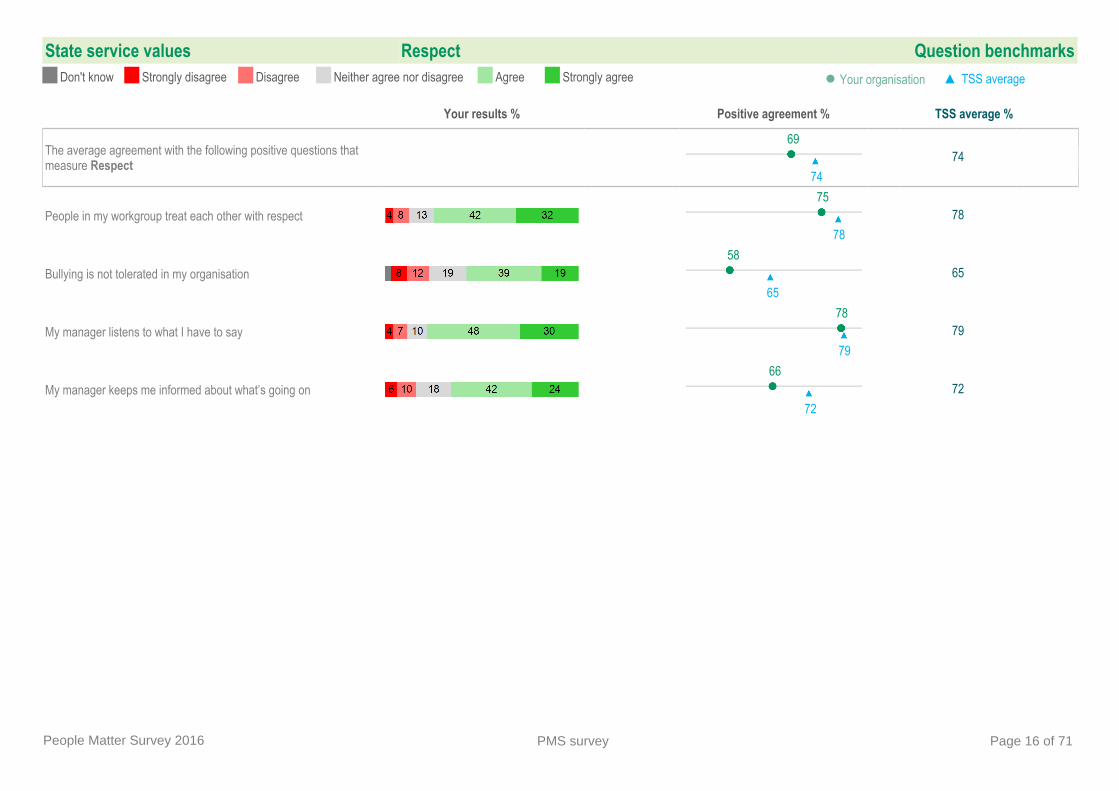
State service values Respect Question benchmarksDon't know Strongly disagree Disagree Neither agree nor disagree Agree Strongly agree ● Your organisation ▲ TSS average
Your results % Positive agreement % TSS average %
The average agreement with the following positive questions that measure Respect
6974
74
People in my workgroup treat each other with respect75
7878
Bullying is not tolerated in my organisation58
6565
My manager listens to what I have to say78
7979
My manager keeps me informed about what’s going on66
7272
People Matter Survey 2016 PMS survey Page 16 of 71
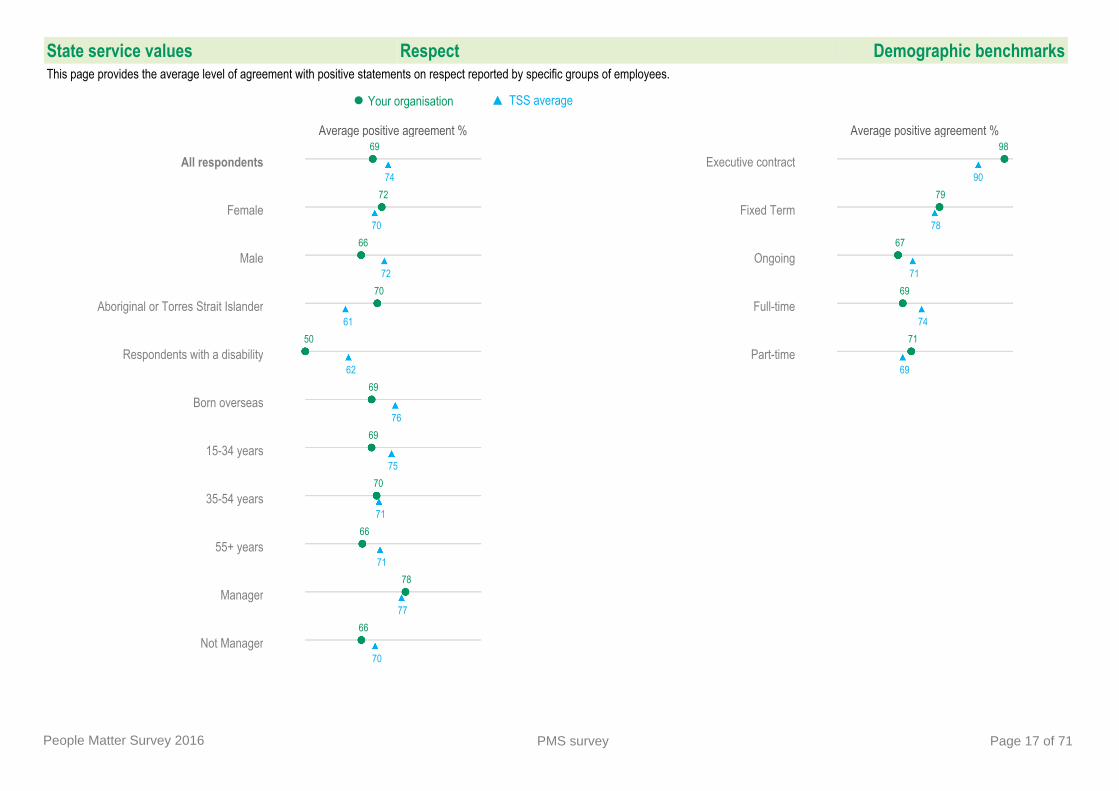
State service values Respect Demographic benchmarksThis page provides the average level of agreement with positive statements on respect reported by specific groups of employees.
● Your organisation ▲ TSS average
Average positive agreement %
All respondents69
74
Female72
70
Male66
72
Aboriginal or Torres Strait Islander70
61
Respondents with a disability50
62
Born overseas69
76
15-34 years69
75
35-54 years70
71
55+ years66
71
Manager78
77
Not Manager66
70
Average positive agreement %
Executive contract98
90
Fixed Term79
78
Ongoing67
71
Full-time69
74
Part-time71
69
People Matter Survey 2016 PMS survey Page 17 of 71

State service values Leadership Question benchmarksDon't know Strongly disagree Disagree Neither agree nor disagree Agree Strongly agree ● Your organisation ▲ TSS average
Your results % Positive agreement % TSS average %
The average agreement with the following positive questions that measure Leadership
5965
65
My manager encourages behaviours that are consistent with my organisation’s values
7880
80
My manager translates organisational messages in a way that is meaningful to me
6471
71
Senior managers model my organisation’s values51
5656
Senior managers demonstrate effective leadership46
5353
In my organisation, behaviour consistent with the State Service Principles is acknowledged
5766
66
People Matter Survey 2016 PMS survey Page 18 of 71
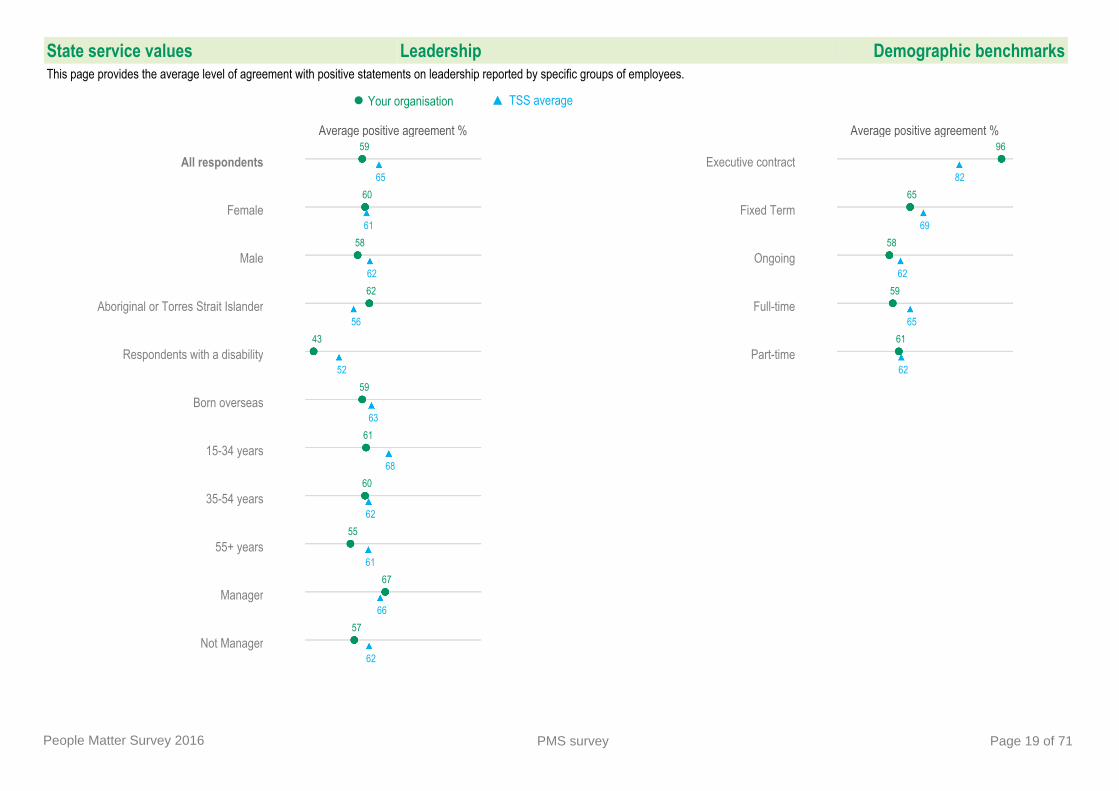
State service values Leadership Demographic benchmarksThis page provides the average level of agreement with positive statements on leadership reported by specific groups of employees.
● Your organisation ▲ TSS average
Average positive agreement %
All respondents59
65
Female60
61
Male58
62
Aboriginal or Torres Strait Islander62
56
Respondents with a disability43
52
Born overseas59
63
15-34 years61
68
35-54 years60
62
55+ years55
61
Manager67
66
Not Manager57
62
Average positive agreement %
Executive contract96
82
Fixed Term65
69
Ongoing58
62
Full-time59
65
Part-time61
62
People Matter Survey 2016 PMS survey Page 19 of 71

Employment principles Merit Question benchmarksDon't know Strongly disagree Disagree Neither agree nor disagree Agree Strongly agree ● Your organisation ▲ TSS average
Your results % Positive agreement % TSS average %
The average agreement with the following positive questions that measure Merit
5462
62
My work performance is assessed against clear criteria51
6262
People recruited to my organisation seem to have the right skills for the job
5662
62
People Matter Survey 2016 PMS survey Page 20 of 71
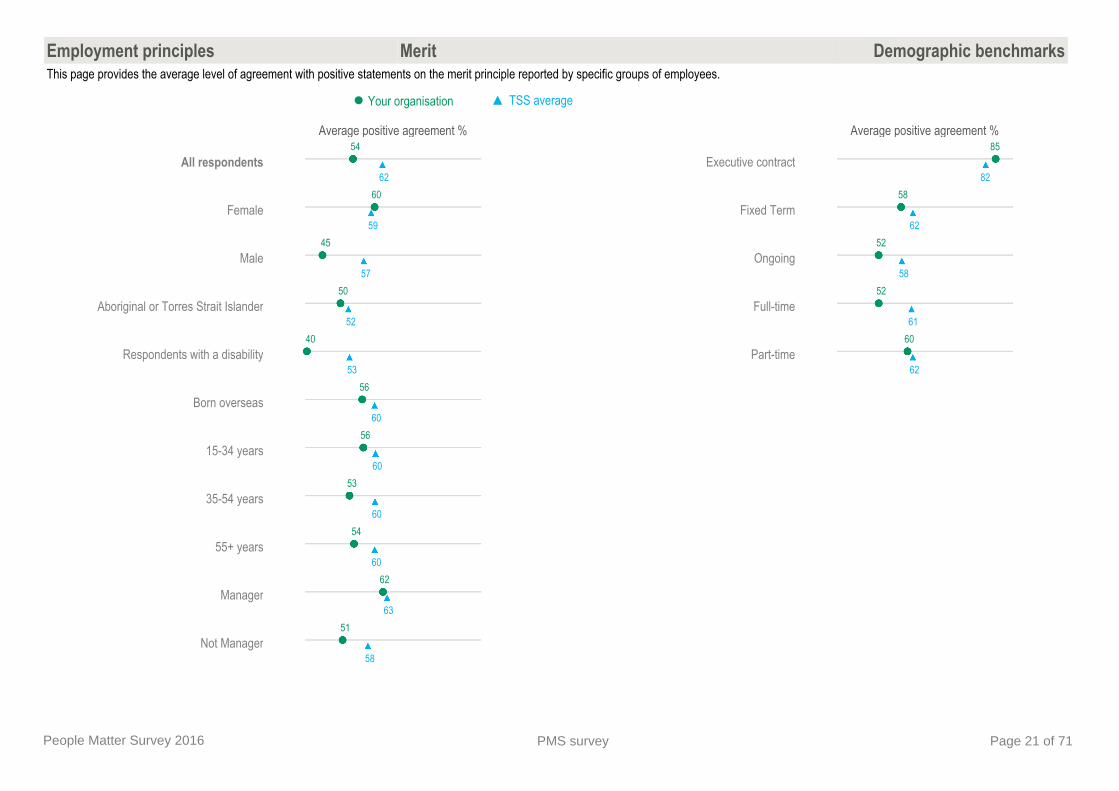
Employment principles Merit Demographic benchmarksThis page provides the average level of agreement with positive statements on the merit principle reported by specific groups of employees.
● Your organisation ▲ TSS average
Average positive agreement %
All respondents54
62
Female60
59
Male45
57
Aboriginal or Torres Strait Islander50
52
Respondents with a disability40
53
Born overseas56
60
15-34 years56
60
35-54 years53
60
55+ years54
60
Manager62
63
Not Manager51
58
Average positive agreement %
Executive contract85
82
Fixed Term58
62
Ongoing52
58
Full-time52
61
Part-time60
62
People Matter Survey 2016 PMS survey Page 21 of 71
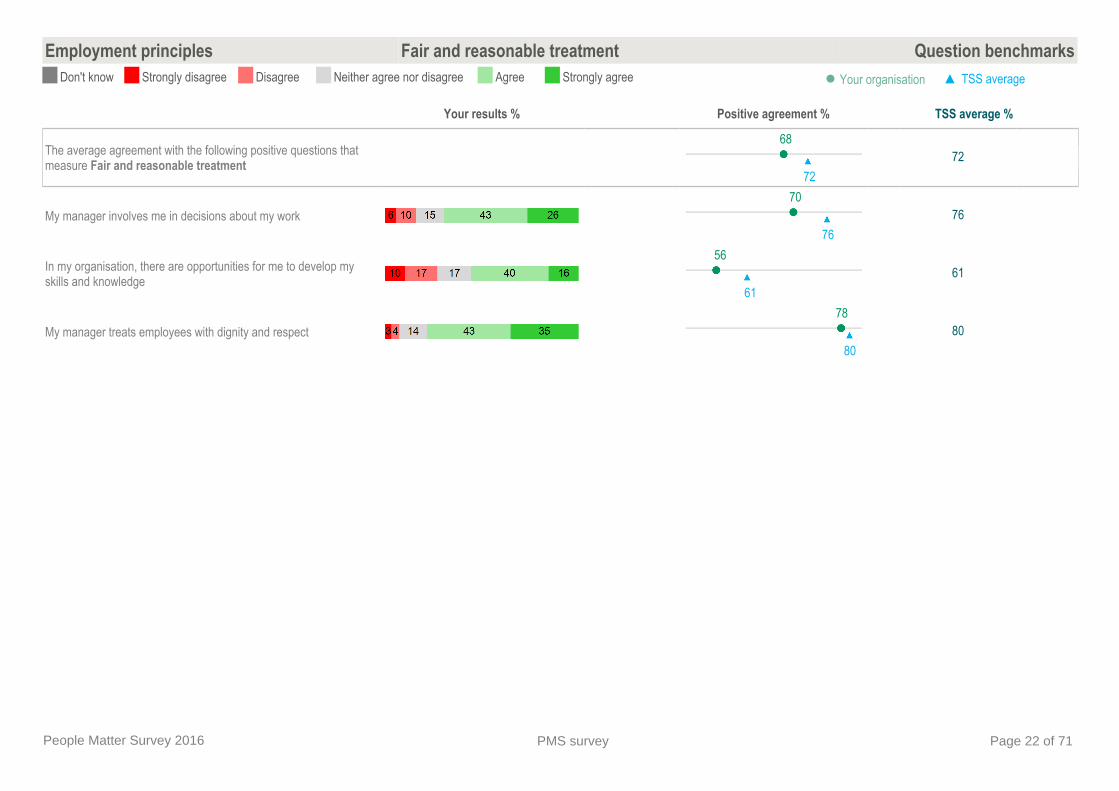
Employment principles Fair and reasonable treatment Question benchmarksDon't know Strongly disagree Disagree Neither agree nor disagree Agree Strongly agree ● Your organisation ▲ TSS average
Your results % Positive agreement % TSS average %
The average agreement with the following positive questions that measure Fair and reasonable treatment
6872
72
My manager involves me in decisions about my work70
7676
In my organisation, there are opportunities for me to develop my skills and knowledge
5661
61
My manager treats employees with dignity and respect78
8080
People Matter Survey 2016 PMS survey Page 22 of 71

Employment principles Fair and reasonable treatment Demographic benchmarksThis page provides the average level of agreement with positive statements on fair and reasonable treatment reported by specific groups of employees.
● Your organisation ▲ TSS average
Average positive agreement %
All respondents68
72
Female70
70
Male65
70
Aboriginal or Torres Strait Islander67
61
Respondents with a disability46
63
Born overseas67
75
15-34 years71
75
35-54 years68
70
55+ years64
69
Manager76
75
Not Manager65
69
Average positive agreement %
Executive contract97
88
Fixed Term80
77
Ongoing65
70
Full-time67
73
Part-time70
69
People Matter Survey 2016 PMS survey Page 23 of 71
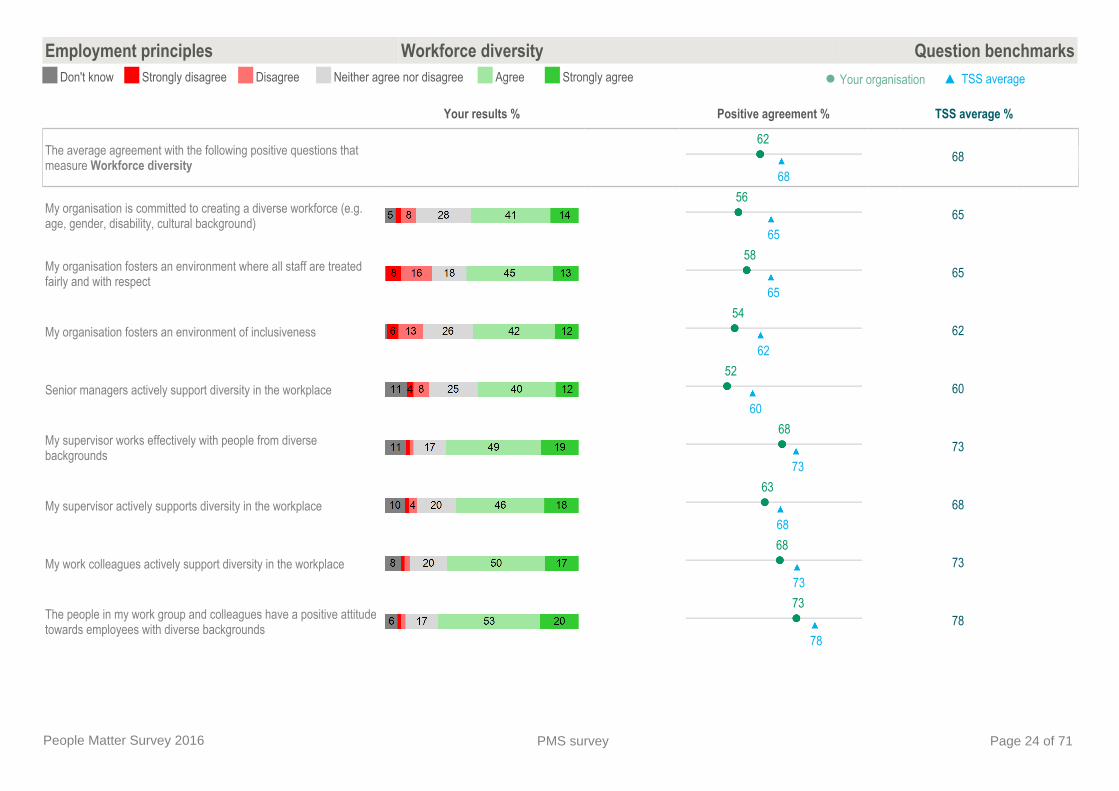
Employment principles Workforce diversity Question benchmarksDon't know Strongly disagree Disagree Neither agree nor disagree Agree Strongly agree ● Your organisation ▲ TSS average
Your results % Positive agreement % TSS average %
The average agreement with the following positive questions that measure Workforce diversity
6268
68
My organisation is committed to creating a diverse workforce (e.g. age, gender, disability, cultural background)
5665
65
My organisation fosters an environment where all staff are treated fairly and with respect
5865
65
My organisation fosters an environment of inclusiveness54
6262
Senior managers actively support diversity in the workplace52
6060
My supervisor works effectively with people from diverse backgrounds
6873
73
My supervisor actively supports diversity in the workplace63
6868
My work colleagues actively support diversity in the workplace68
7373
The people in my work group and colleagues have a positive attitude towards employees with diverse backgrounds
7378
78
People Matter Survey 2016 PMS survey Page 24 of 71

Employment principles Workforce diversity Question benchmarksDon't know Strongly disagree Disagree Neither agree nor disagree Agree Strongly agree ● Your organisation ▲ TSS average
Your results % Positive agreement % TSS average %
There is a positive culture within my organisation in relation to employees with a disability
4557
57
There is a positive culture within my organisation in relation to employees from varied cultural backgrounds
6069
69
There is a positive culture within my organisation in relation to gender
6877
77
There is a positive culture within my organisation in relation to employees who are Aboriginal and/or Torres Strait Islander
4452
52
There is a positive culture within my organisation in relation to employees who identify as LGBTI (lesbian, gay, bisexual, transgender and intersex)
5457
57
There is a positive culture within my organisation in relation to employees who have caring responsibilities
7175
75
There is a positive culture within my organisation in relation to employees who work part-time
7479
79
There is a positive culture within my organisation in relation to employees who use flexible work practices
7071
71
There is a positive culture within my organisation in relation to employees of different age groups
7681
81
People Matter Survey 2016 PMS survey Page 25 of 71
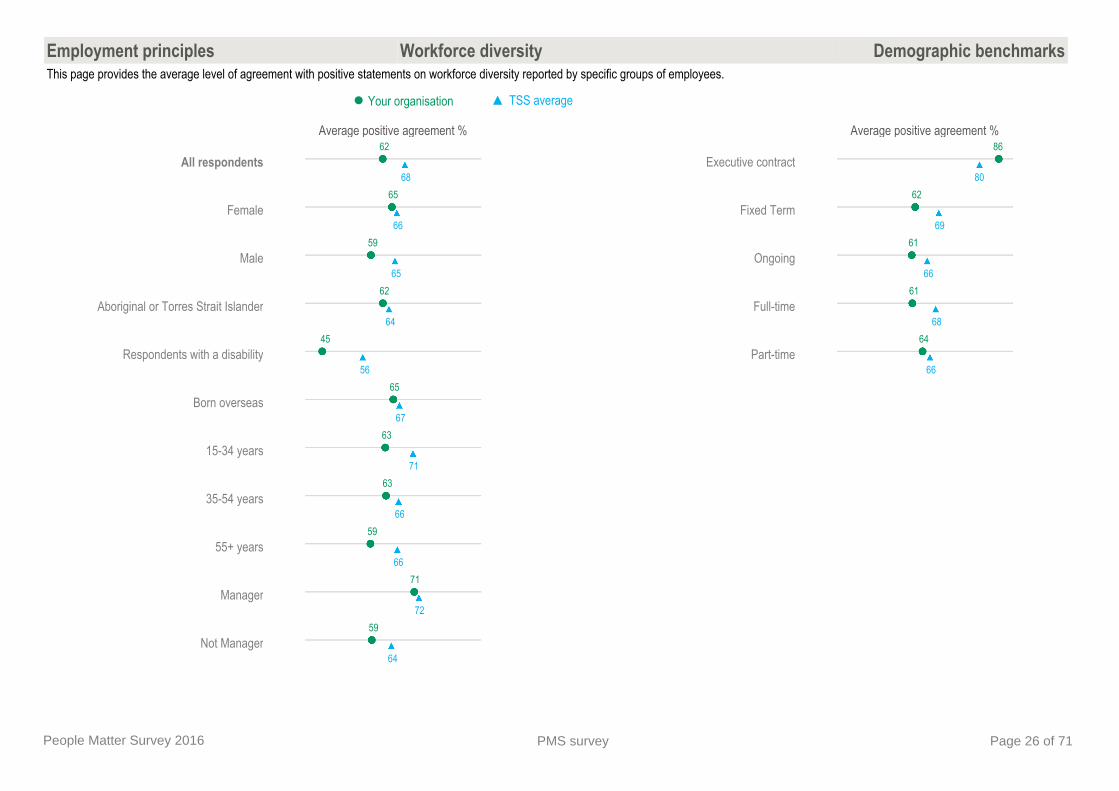
Employment principles Workforce diversity Demographic benchmarksThis page provides the average level of agreement with positive statements on workforce diversity reported by specific groups of employees.
● Your organisation ▲ TSS average
Average positive agreement %
All respondents62
68
Female65
66
Male59
65
Aboriginal or Torres Strait Islander62
64
Respondents with a disability45
56
Born overseas65
67
15-34 years63
71
35-54 years63
66
55+ years59
66
Manager71
72
Not Manager59
64
Average positive agreement %
Executive contract86
80
Fixed Term62
69
Ongoing61
66
Full-time61
68
Part-time64
66
People Matter Survey 2016 PMS survey Page 26 of 71

Employment principles Workforce diversity Demographic benchmarks 2Don't know Strongly disagree Disagree Neither agree nor disagree Agree Strongly agree ● Your organisation ▲ TSS average
Your results % Positive agreement % TSS average %
There is a positive culture within my organisation in relation to gender
Female69
7373
Male67
7777
Disability is not a barrier to success in my organisation
People with a disability33
4949
People without a disability46
5757
There is a positive culture within my organisation in relation to employees of different age groups
15-34 years79
8080
35-54 years77
7979
55+ years70
7979
People Matter Survey 2016 PMS survey Page 27 of 71

Employment principles Workforce diversity Demographic benchmarks 3Don't know Strongly disagree Disagree Neither agree nor disagree Agree Strongly agree ● Your organisation ▲ TSS average
Your results % Positive agreement % TSS average %
There is a positive culture within my organisation in relation to employees from varied cultural backgrounds
Aboriginal or Torres Strait Islander64
6767
Non ATSI60
6969
Born in Australia58
6868
Born overseas in a country where English is a primary language69
6767
Born overseas in other country70
7979
There is a positive culture within my organisation in relation to employees who identify as LGBTI (lesbian, gay, bisexual, transgender and intersex)
Same sex attracted / Bisexual54
5757
People Matter Survey 2016 PMS survey Page 28 of 71
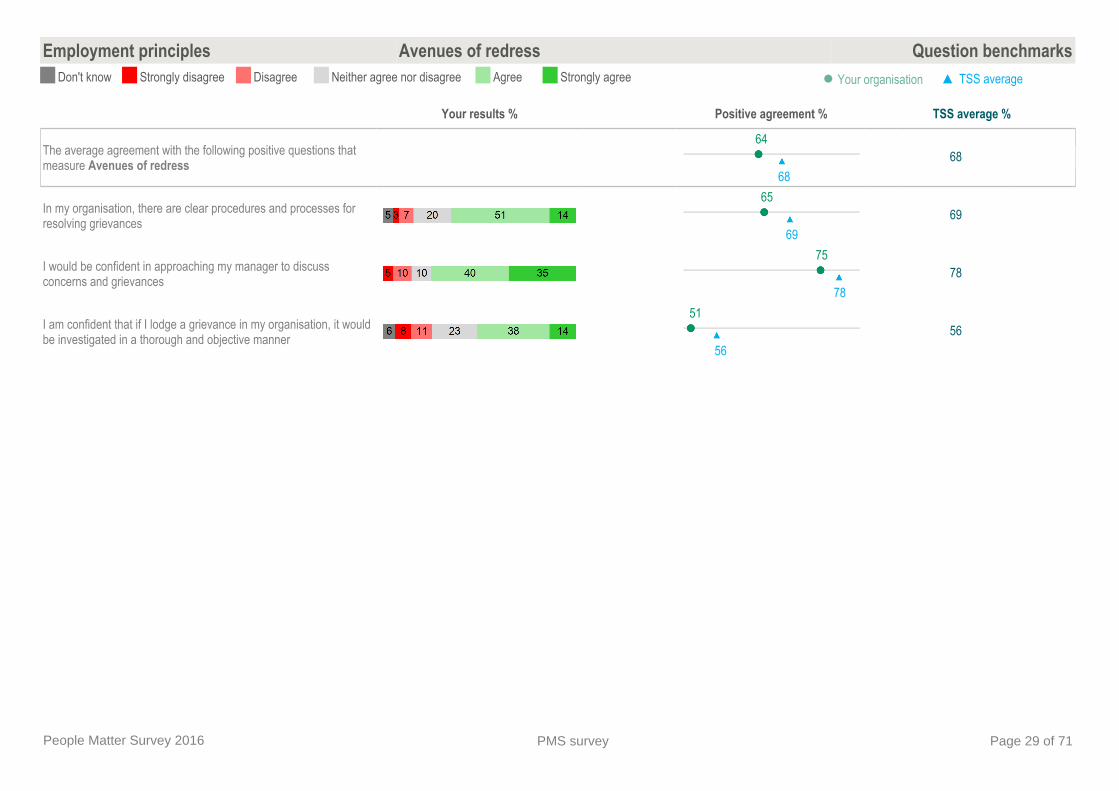
Employment principles Avenues of redress Question benchmarksDon't know Strongly disagree Disagree Neither agree nor disagree Agree Strongly agree ● Your organisation ▲ TSS average
Your results % Positive agreement % TSS average %
The average agreement with the following positive questions that measure Avenues of redress
6468
68
In my organisation, there are clear procedures and processes for resolving grievances
6569
69
I would be confident in approaching my manager to discuss concerns and grievances
7578
78
I am confident that if I lodge a grievance in my organisation, it would be investigated in a thorough and objective manner
5156
56
People Matter Survey 2016 PMS survey Page 29 of 71
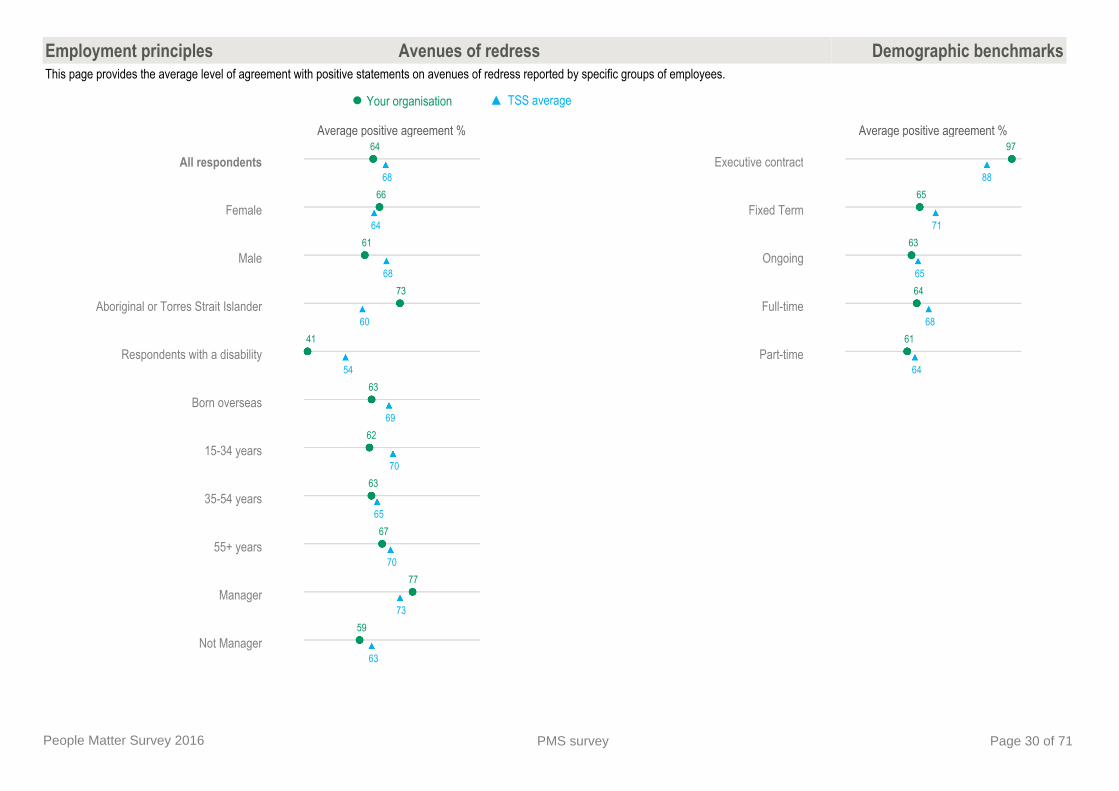
Employment principles Avenues of redress Demographic benchmarksThis page provides the average level of agreement with positive statements on avenues of redress reported by specific groups of employees.
● Your organisation ▲ TSS average
Average positive agreement %
All respondents64
68
Female66
64
Male61
68
Aboriginal or Torres Strait Islander73
60
Respondents with a disability41
54
Born overseas63
69
15-34 years62
70
35-54 years63
65
55+ years67
70
Manager77
73
Not Manager59
63
Average positive agreement %
Executive contract97
88
Fixed Term65
71
Ongoing63
65
Full-time64
68
Part-time61
64
People Matter Survey 2016 PMS survey Page 30 of 71
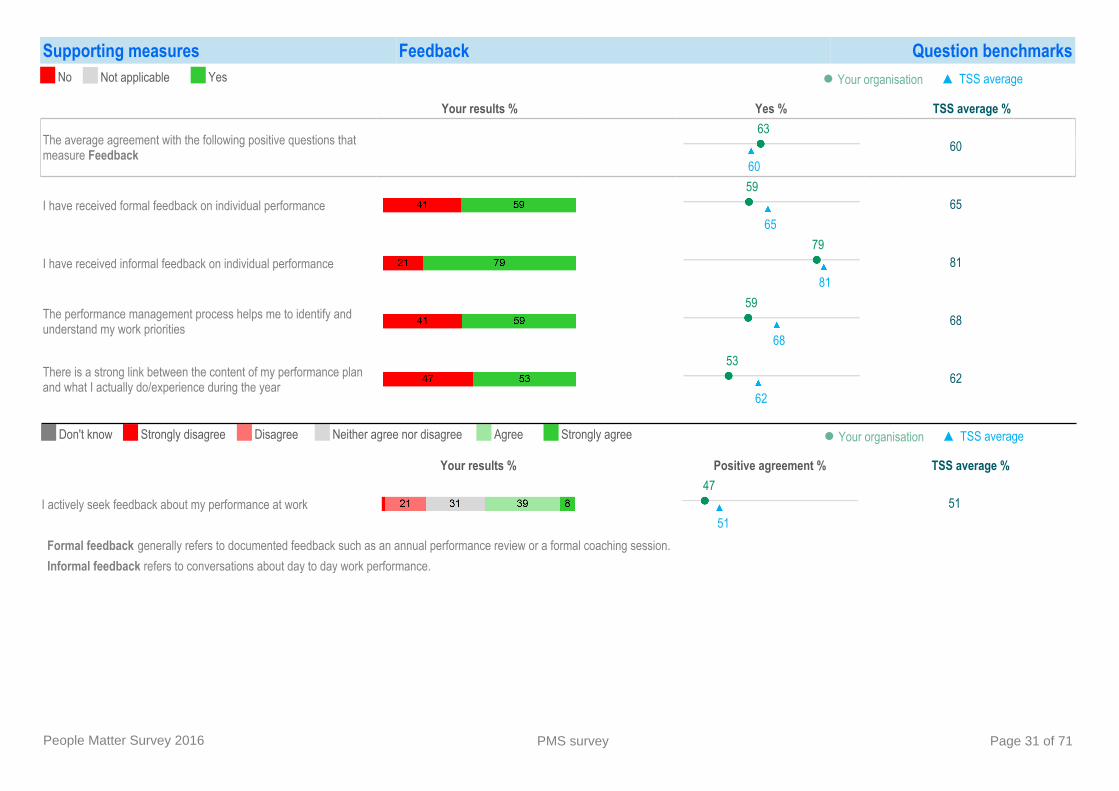
Supporting measures Feedback Question benchmarksNo Yes ● Your organisationNot applicable ▲ TSS average
Your results % Yes % TSS average %
The average agreement with the following positive questions that measure Feedback
6360
60
I have received formal feedback on individual performance59
6565
I have received informal feedback on individual performance79
8181
The performance management process helps me to identify and understand my work priorities
5968
68
There is a strong link between the content of my performance plan and what I actually do/experience during the year
5362
62
Formal feedback generally refers to documented feedback such as an annual performance review or a formal coaching session.Informal feedback refers to conversations about day to day work performance.
Your results % Positive agreement % TSS average %
I actively seek feedback about my performance at work47
5151
Don't know Strongly disagree Disagree Neither agree nor disagree Agree Strongly agree ● Your organisation ▲ TSS average
People Matter Survey 2016 PMS survey Page 31 of 71

Supporting measures Feedback Demographic benchmarksThis page shows the proportion of each group that received any form of feedback (informal or formal).
● Your organisation ▲ TSS average
Average yes %
All respondents63
60
Female65
58
Male59
56
Aboriginal or Torres Strait Islander57
55
Respondents with a disability56
57
Born overseas63
58
15-34 years67
66
35-54 years63
58
55+ years57
51
Manager73
60
Not Manager59
58
Average yes %
Executive contract88
72
Fixed Term61
59
Ongoing62
58
Full-time62
60
Part-time64
57
People Matter Survey 2016 PMS survey Page 32 of 71
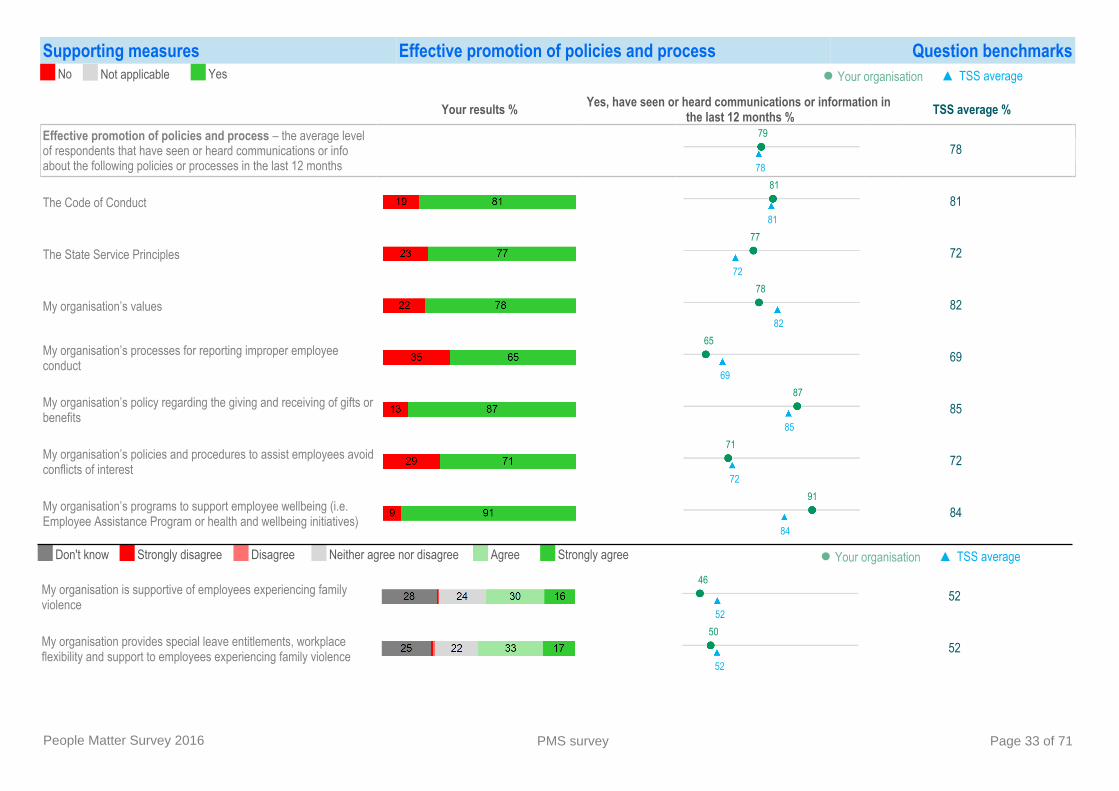
Supporting measures Effective promotion of policies and process Question benchmarksNo Yes ● Your organisationNot applicable ▲ TSS average
Your results % Yes, have seen or heard communications or information in the last 12 months % TSS average %
Effective promotion of policies and process – the average level of respondents that have seen or heard communications or info about the following policies or processes in the last 12 months
7978
78
The Code of Conduct81
8181
The State Service Principles77
7272
My organisation’s values78
8282
My organisation’s processes for reporting improper employee conduct
6569
69
My organisation’s policy regarding the giving and receiving of gifts or benefits
8785
85
My organisation’s policies and procedures to assist employees avoid conflicts of interest
7172
72
My organisation’s programs to support employee wellbeing (i.e. Employee Assistance Program or health and wellbeing initiatives)
9184
84
My organisation is supportive of employees experiencing family violence
4652
52
My organisation provides special leave entitlements, workplace flexibility and support to employees experiencing family violence
5052
52
Don't know Strongly disagree Disagree Neither agree nor disagree Agree Strongly agree ● Your organisation ▲ TSS average
People Matter Survey 2016 PMS survey Page 33 of 71
THIS PAGE IS INTENTIONALLY BLANK
People Matter Survey 2016 PMS survey Page 34 of 71

Supporting measures Job satisfaction Question benchmarksVery dissatisfied Dissatisfied Neither satisfied nor dissatisfied Satisfied Very satisfied ● Your organisation ▲ TSS average
Your results % Satisfied % TSS average %Change
on 2015 %pt
Regular feedback/recognition for effort52
5656
Level of autonomy in my job76
7575
Chance to be creative/ innovative57
6262
Considering everything, how satisfied are you with your current job70
71 -271
Considering everything, how would you rate your overall satisfaction with your organisation as an employer?
6770
70
People Matter Survey 2016 PMS survey Page 35 of 71
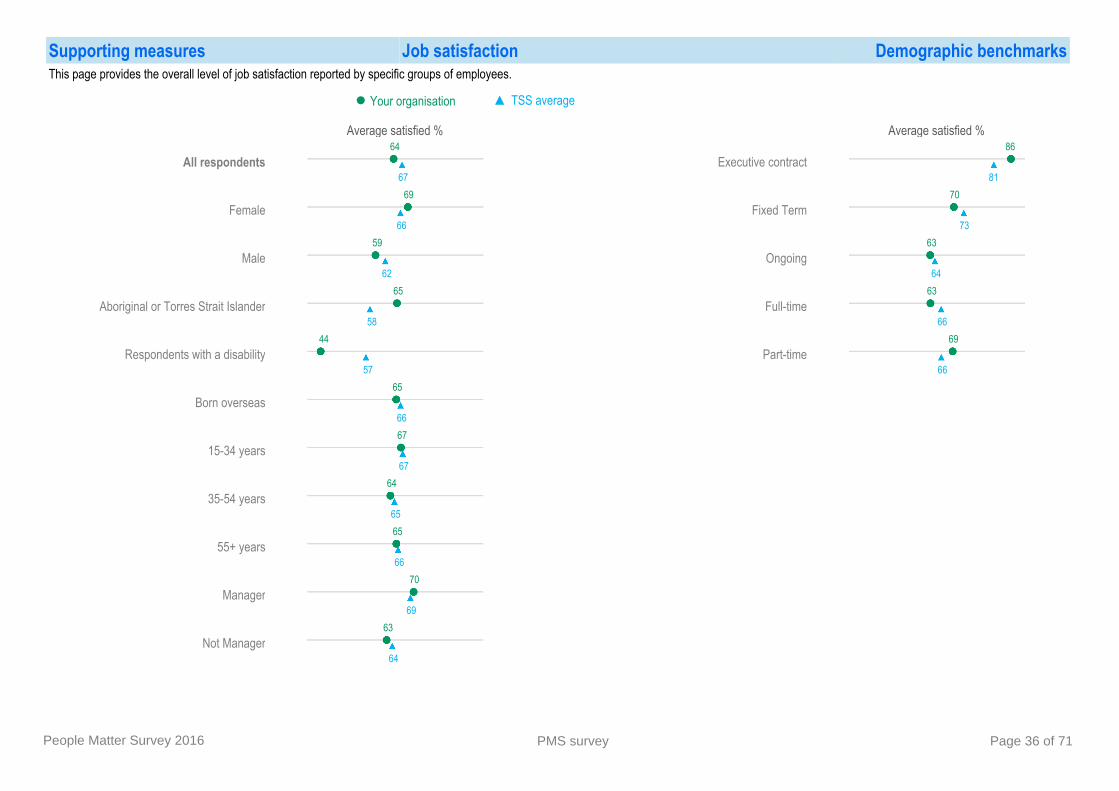
Supporting measures Job satisfaction Demographic benchmarksThis page provides the overall level of job satisfaction reported by specific groups of employees.
● Your organisation ▲ TSS average
Average satisfied %
All respondents64
67
Female69
66
Male59
62
Aboriginal or Torres Strait Islander65
58
Respondents with a disability44
57
Born overseas65
66
15-34 years67
67
35-54 years64
65
55+ years65
66
Manager70
69
Not Manager63
64
Average satisfied %
Executive contract86
81
Fixed Term70
73
Ongoing63
64
Full-time63
66
Part-time69
66
People Matter Survey 2016 PMS survey Page 36 of 71

Supporting measures Engagement Question benchmarksDon't know Strongly disagree Disagree Neither agree nor disagree Agree Strongly agree ● Your organisation ▲ TSS average
Your results % Engagement score** TSS average %Change
on 2015 %pt
Engagement indexAverage engagement score
6568 +2
68
I would recommend my organisation as a good place to work
6769 +2
69
I am proud to tell others I work for my organisation
7173 +1
73
I feel a strong personal attachment to my organisation
6769 +3
69
My organisation motivates me to help achieve its objectives
6265 +2
65
My organisation inspires me to do the best in my job
6265 +3
65** Engagement score %: Each respondent is given a score for each engagement question where strongly agree equates to 100 points, agree equates to 75 points, neither agree nor disagree equates to 50 points, disagree equates to 25 points and strongly disagree equates to 0 points.
People Matter Survey 2016 PMS survey Page 37 of 71
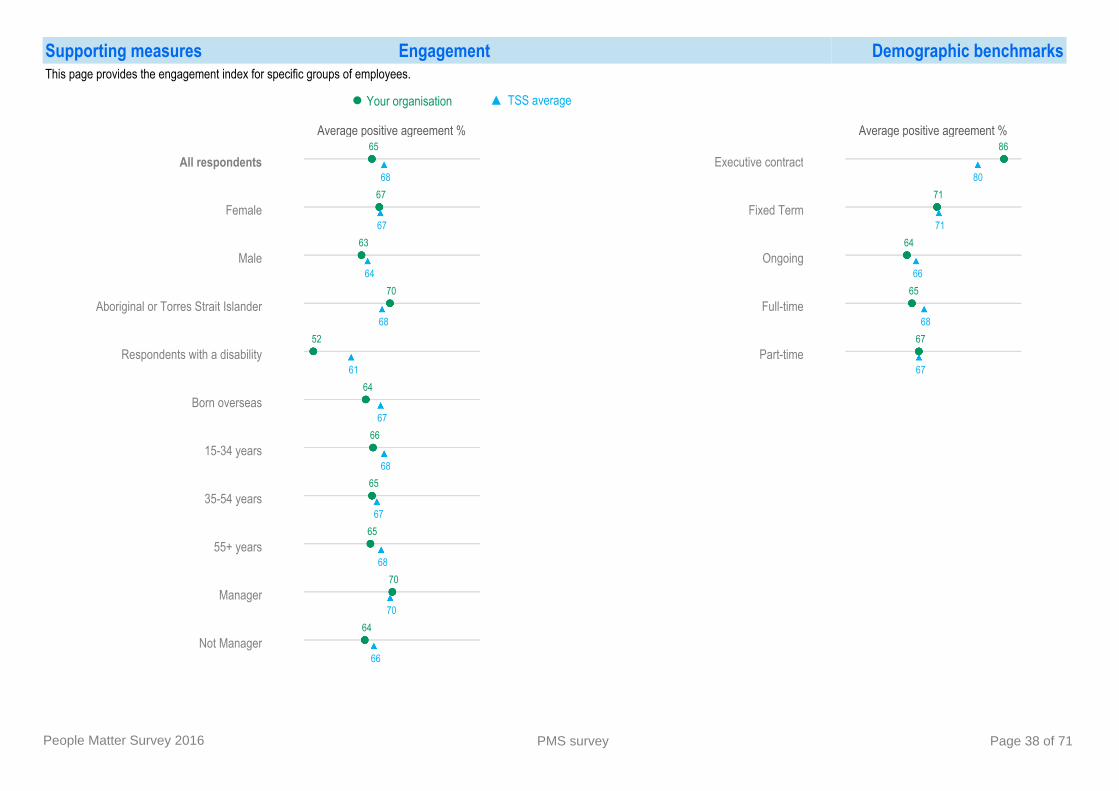
Supporting measures Engagement Demographic benchmarksThis page provides the engagement index for specific groups of employees.
● Your organisation ▲ TSS average
Average positive agreement %
All respondents65
68
Female67
67
Male63
64
Aboriginal or Torres Strait Islander70
68
Respondents with a disability52
61
Born overseas64
67
15-34 years66
68
35-54 years65
67
55+ years65
68
Manager70
70
Not Manager64
66
Average positive agreement %
Executive contract86
80
Fixed Term71
71
Ongoing64
66
Full-time65
68
Part-time67
67
People Matter Survey 2016 PMS survey Page 38 of 71
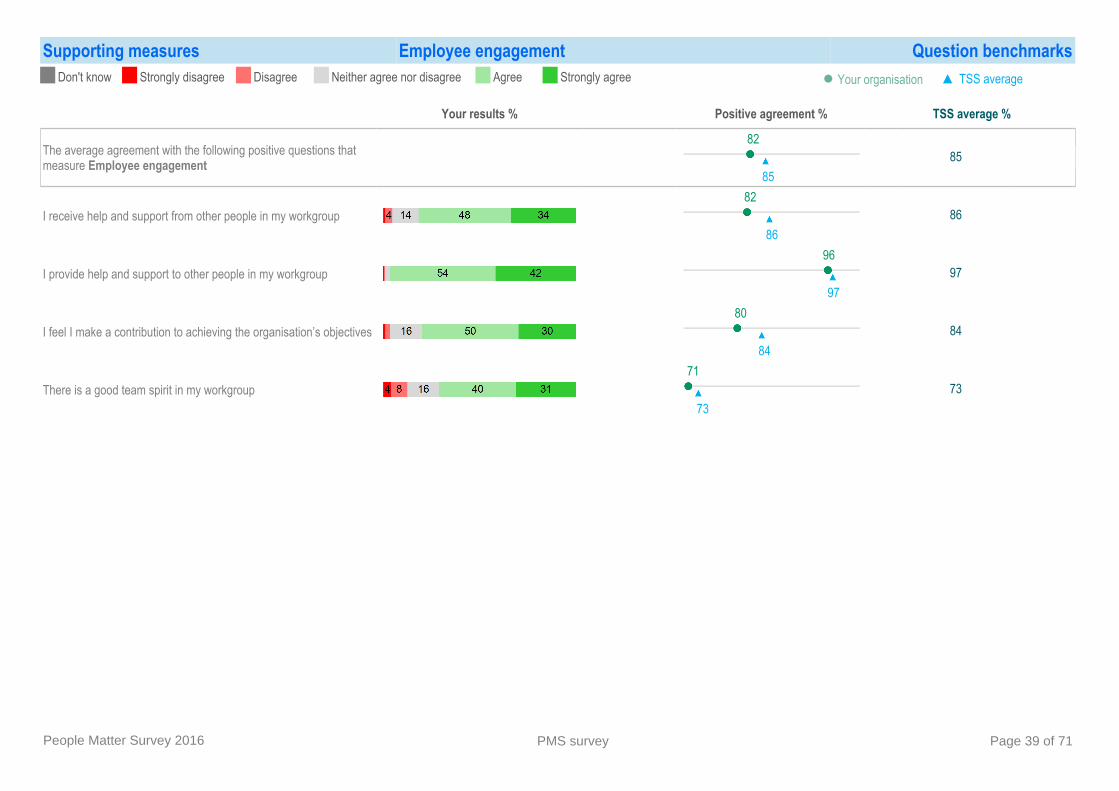
Supporting measures Employee engagement Question benchmarksDon't know Strongly disagree Disagree Neither agree nor disagree Agree Strongly agree ● Your organisation ▲ TSS average
Your results % Positive agreement % TSS average %
The average agreement with the following positive questions that measure Employee engagement
8285
85
I receive help and support from other people in my workgroup82
8686
I provide help and support to other people in my workgroup96
9797
I feel I make a contribution to achieving the organisation’s objectives80
8484
There is a good team spirit in my workgroup71
7373
People Matter Survey 2016 PMS survey Page 39 of 71
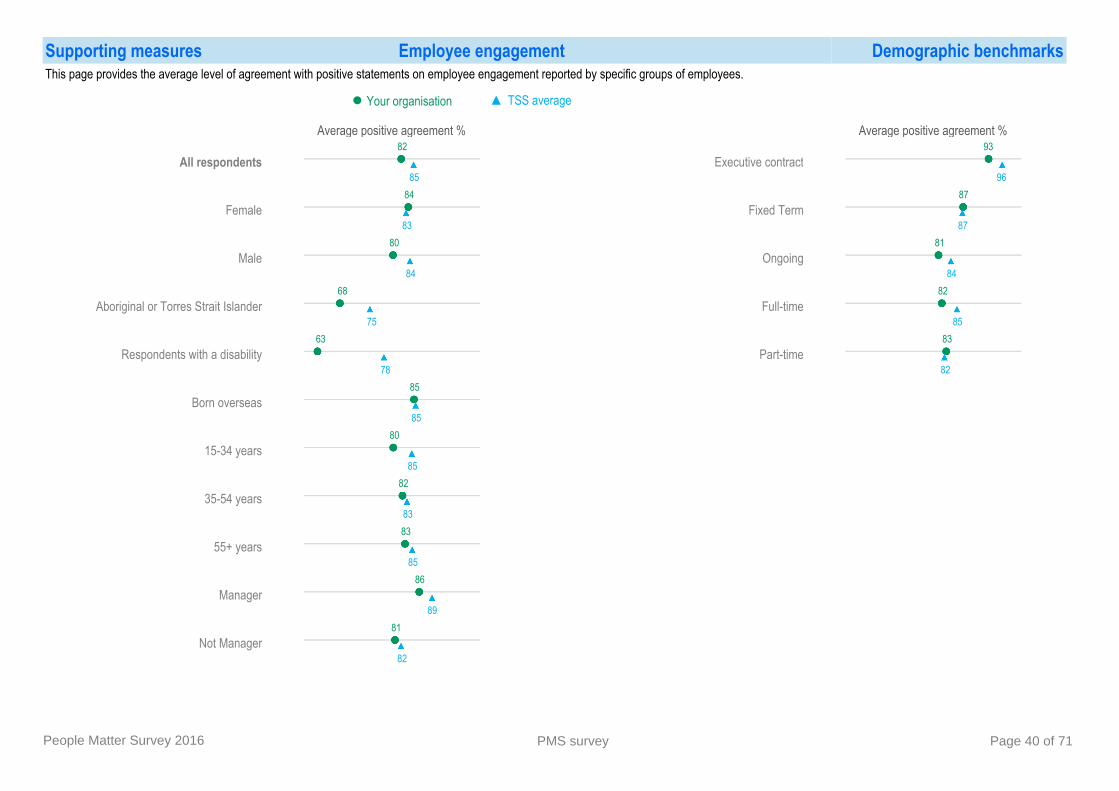
Supporting measures Employee engagement Demographic benchmarksThis page provides the average level of agreement with positive statements on employee engagement reported by specific groups of employees.
● Your organisation ▲ TSS average
Average positive agreement %
All respondents82
85
Female84
83
Male80
84
Aboriginal or Torres Strait Islander68
75
Respondents with a disability63
78
Born overseas85
85
15-34 years80
85
35-54 years82
83
55+ years83
85
Manager86
89
Not Manager81
82
Average positive agreement %
Executive contract93
96
Fixed Term87
87
Ongoing81
84
Full-time82
85
Part-time83
82
People Matter Survey 2016 PMS survey Page 40 of 71
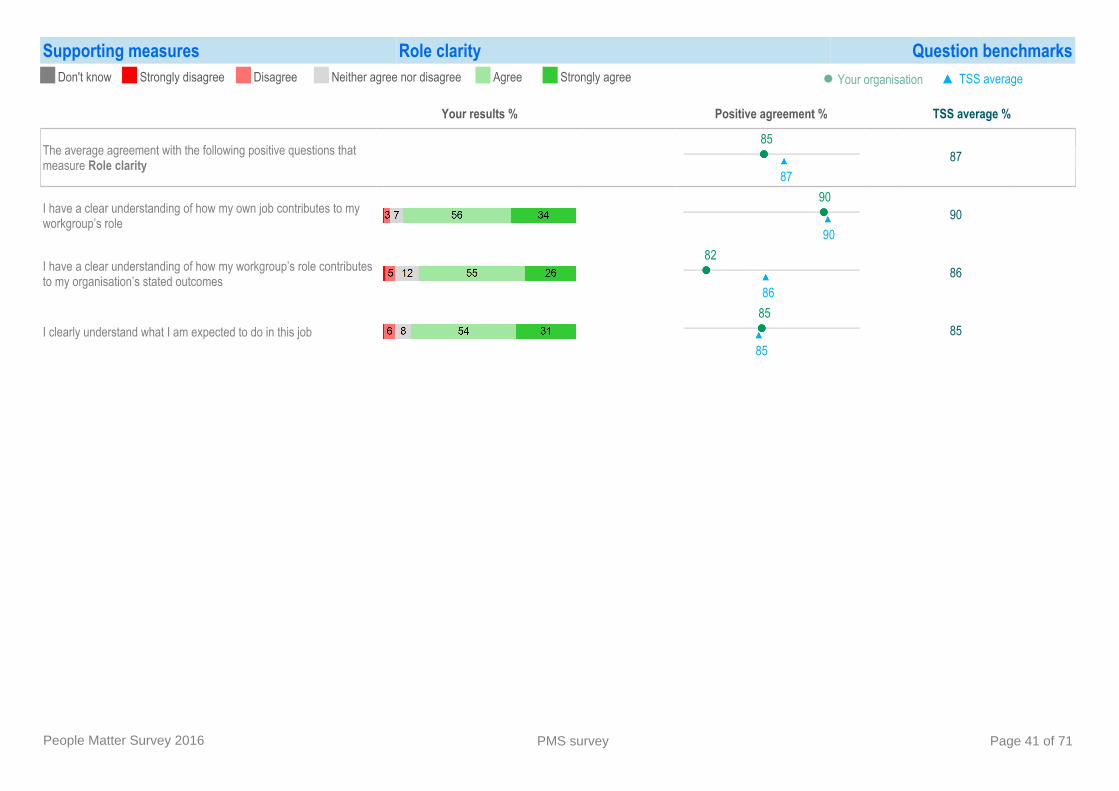
Supporting measures Role clarity Question benchmarksDon't know Strongly disagree Disagree Neither agree nor disagree Agree Strongly agree ● Your organisation ▲ TSS average
Your results % Positive agreement % TSS average %
The average agreement with the following positive questions that measure Role clarity
8587
87
I have a clear understanding of how my own job contributes to my workgroup’s role
9090
90
I have a clear understanding of how my workgroup’s role contributes to my organisation’s stated outcomes
8286
86
I clearly understand what I am expected to do in this job85
8585
People Matter Survey 2016 PMS survey Page 41 of 71
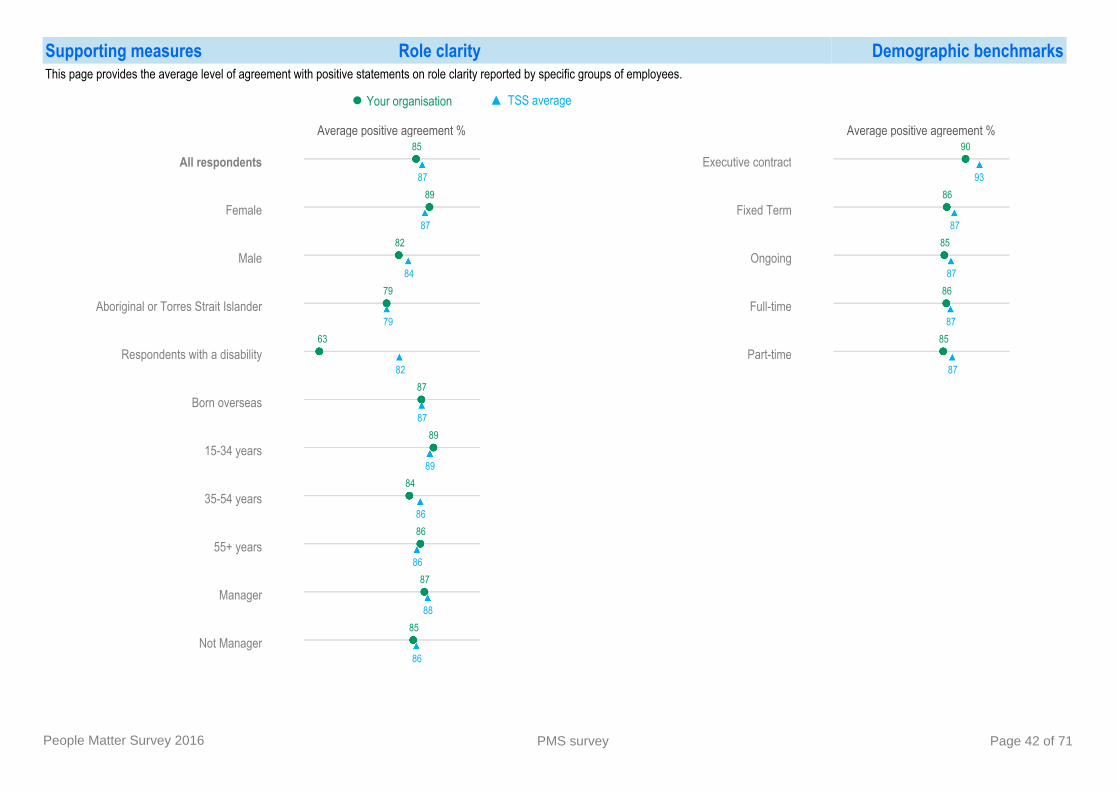
Supporting measures Role clarity Demographic benchmarksThis page provides the average level of agreement with positive statements on role clarity reported by specific groups of employees.
● Your organisation ▲ TSS average
Average positive agreement %
All respondents85
87
Female89
87
Male82
84
Aboriginal or Torres Strait Islander79
79
Respondents with a disability63
82
Born overseas87
87
15-34 years89
89
35-54 years84
86
55+ years86
86
Manager87
88
Not Manager85
86
Average positive agreement %
Executive contract90
93
Fixed Term86
87
Ongoing85
87
Full-time86
87
Part-time85
87
People Matter Survey 2016 PMS survey Page 42 of 71
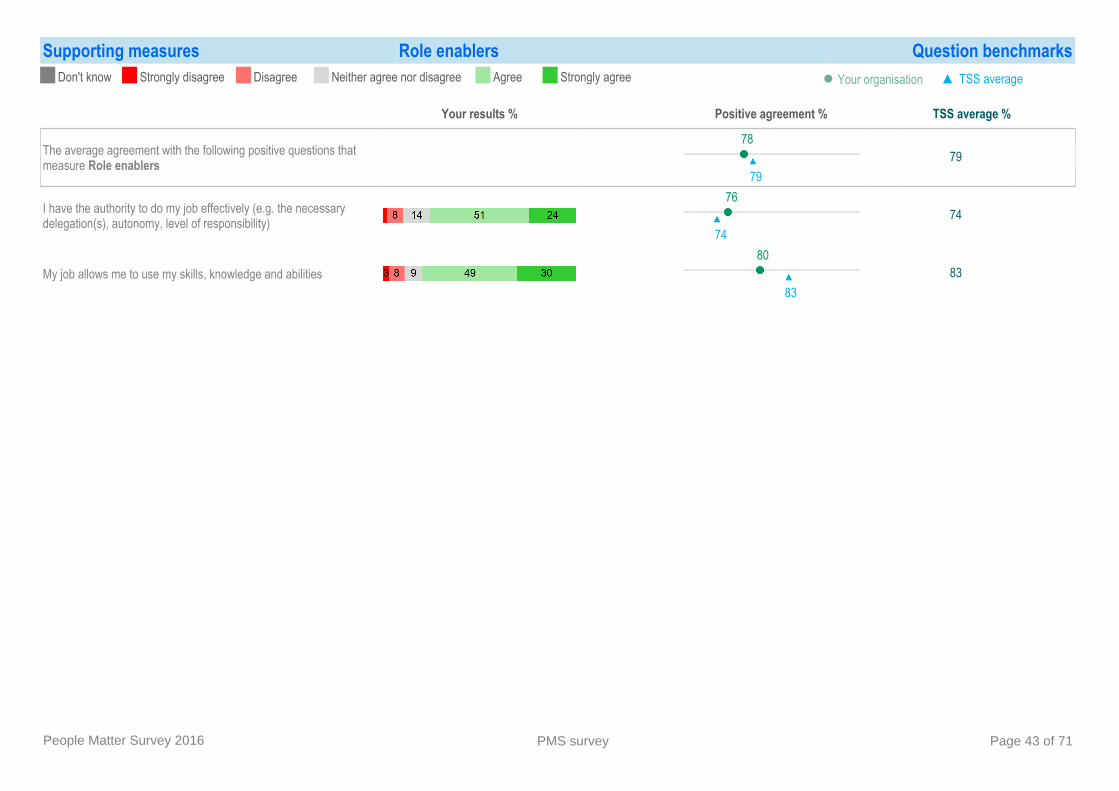
Supporting measures Role enablers Question benchmarksDon't know Strongly disagree Disagree Neither agree nor disagree Agree Strongly agree ● Your organisation ▲ TSS average
Your results % Positive agreement % TSS average %
The average agreement with the following positive questions that measure Role enablers
7879
79
I have the authority to do my job effectively (e.g. the necessary delegation(s), autonomy, level of responsibility)
7674
74
My job allows me to use my skills, knowledge and abilities80
8383
People Matter Survey 2016 PMS survey Page 43 of 71

Supporting measures Role enablers Demographic benchmarksThis page provides the average level of agreement with positive statements on role enablers reported by specific groups of employees.
● Your organisation ▲ TSS average
Average positive agreement %
All respondents78
79
Female79
79
Male75
74
Aboriginal or Torres Strait Islander73
75
Respondents with a disability52
68
Born overseas78
78
15-34 years82
79
35-54 years77
78
55+ years76
77
Manager81
81
Not Manager76
77
Average positive agreement %
Executive contract95
86
Fixed Term83
80
Ongoing76
77
Full-time78
78
Part-time77
79
People Matter Survey 2016 PMS survey Page 44 of 71
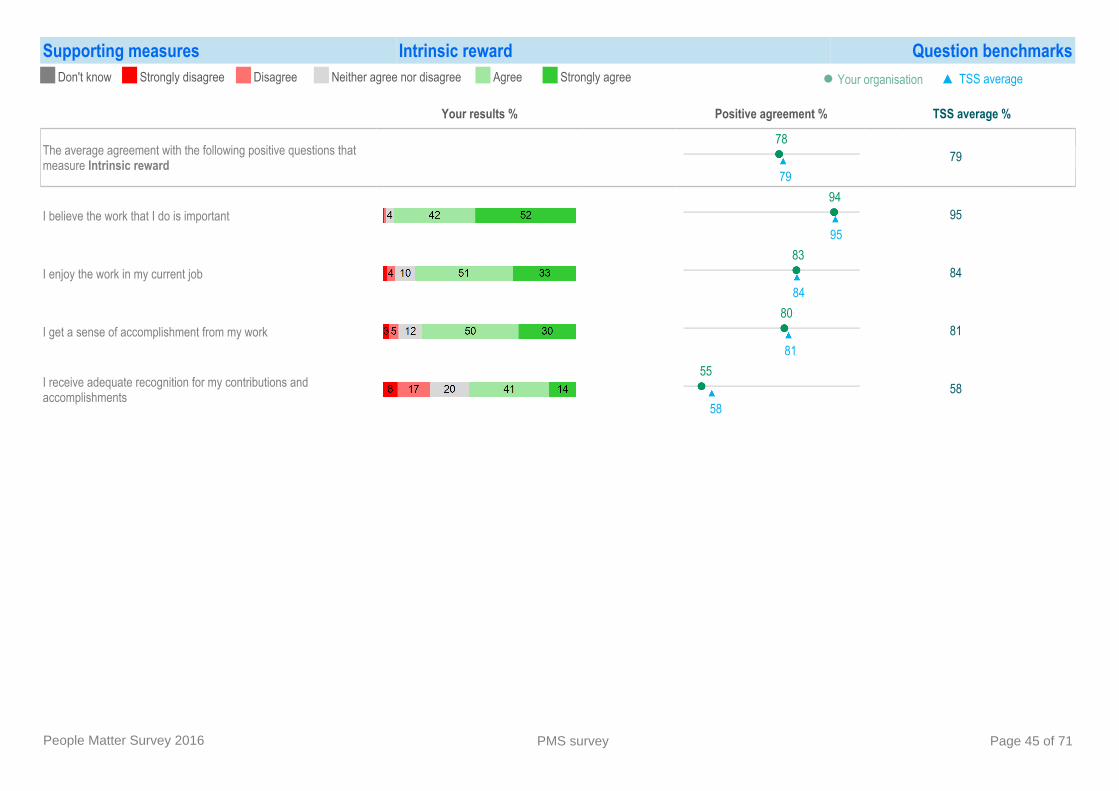
Supporting measures Intrinsic reward Question benchmarksDon't know Strongly disagree Disagree Neither agree nor disagree Agree Strongly agree ● Your organisation ▲ TSS average
Your results % Positive agreement % TSS average %
The average agreement with the following positive questions that measure Intrinsic reward
7879
79
I believe the work that I do is important94
9595
I enjoy the work in my current job83
8484
I get a sense of accomplishment from my work80
8181
I receive adequate recognition for my contributions and accomplishments
5558
58
People Matter Survey 2016 PMS survey Page 45 of 71
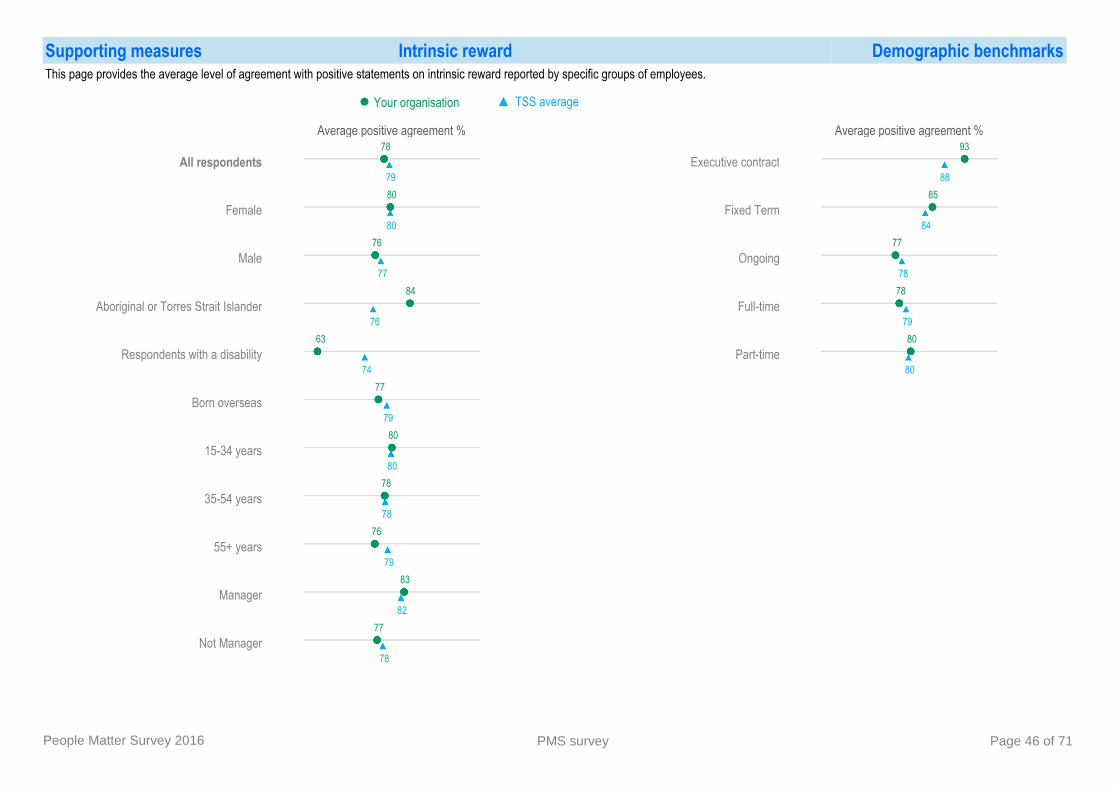
Supporting measures Intrinsic reward Demographic benchmarksThis page provides the average level of agreement with positive statements on intrinsic reward reported by specific groups of employees.
● Your organisation ▲ TSS average
Average positive agreement %
All respondents78
79
Female80
80
Male76
77
Aboriginal or Torres Strait Islander84
76
Respondents with a disability63
74
Born overseas77
79
15-34 years80
80
35-54 years78
78
55+ years76
79
Manager83
82
Not Manager77
78
Average positive agreement %
Executive contract93
88
Fixed Term85
84
Ongoing77
78
Full-time78
79
Part-time80
80
People Matter Survey 2016 PMS survey Page 46 of 71
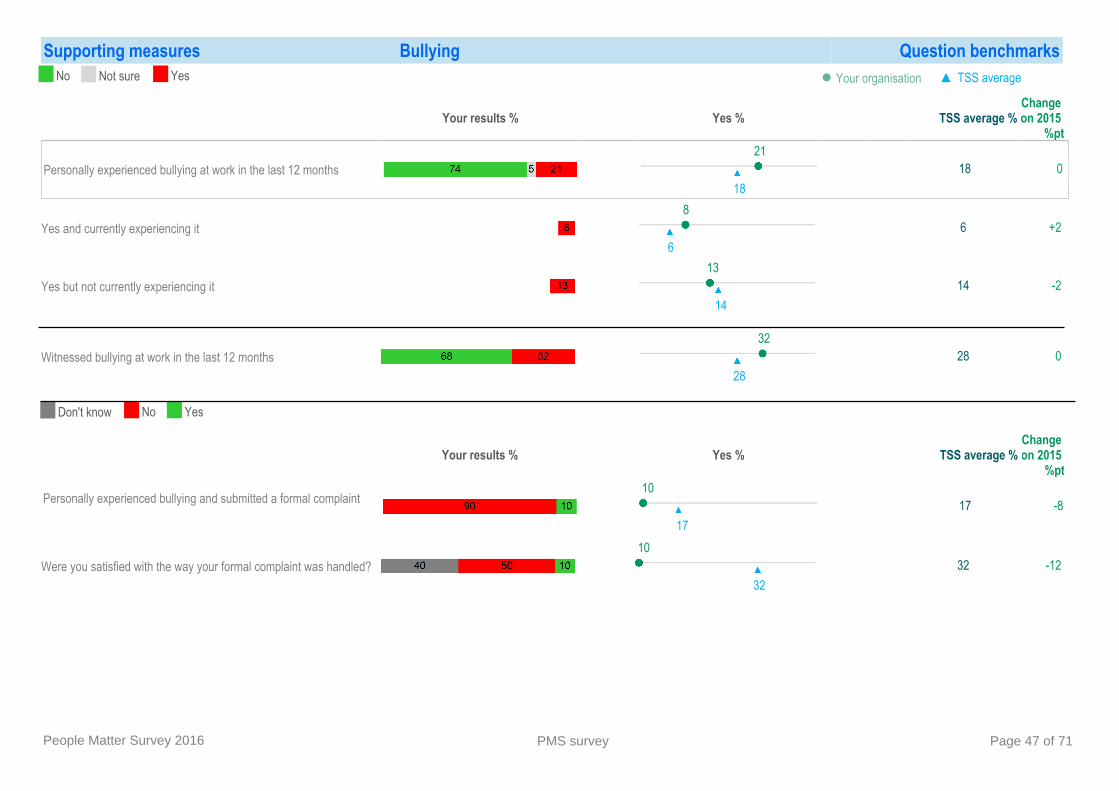
Supporting measures Bullying Question benchmarks
Your results % Yes % TSS average %Change on 2015
%pt
Personally experienced bullying at work in the last 12 months21
18 018
No Yes ● Your organisationNot sure ▲ TSS average
Personally experienced bullying and submitted a formal complaint
Your results % Yes % TSS average %Change on 2015
%pt10
17 -817
Yes and currently experiencing it8
6 +26
Yes but not currently experiencing it13
14 -214
No YesDon't know
Witnessed bullying at work in the last 12 months32
28 028
Were you satisfied with the way your formal complaint was handled?10
32 -1232
People Matter Survey 2016 PMS survey Page 47 of 71
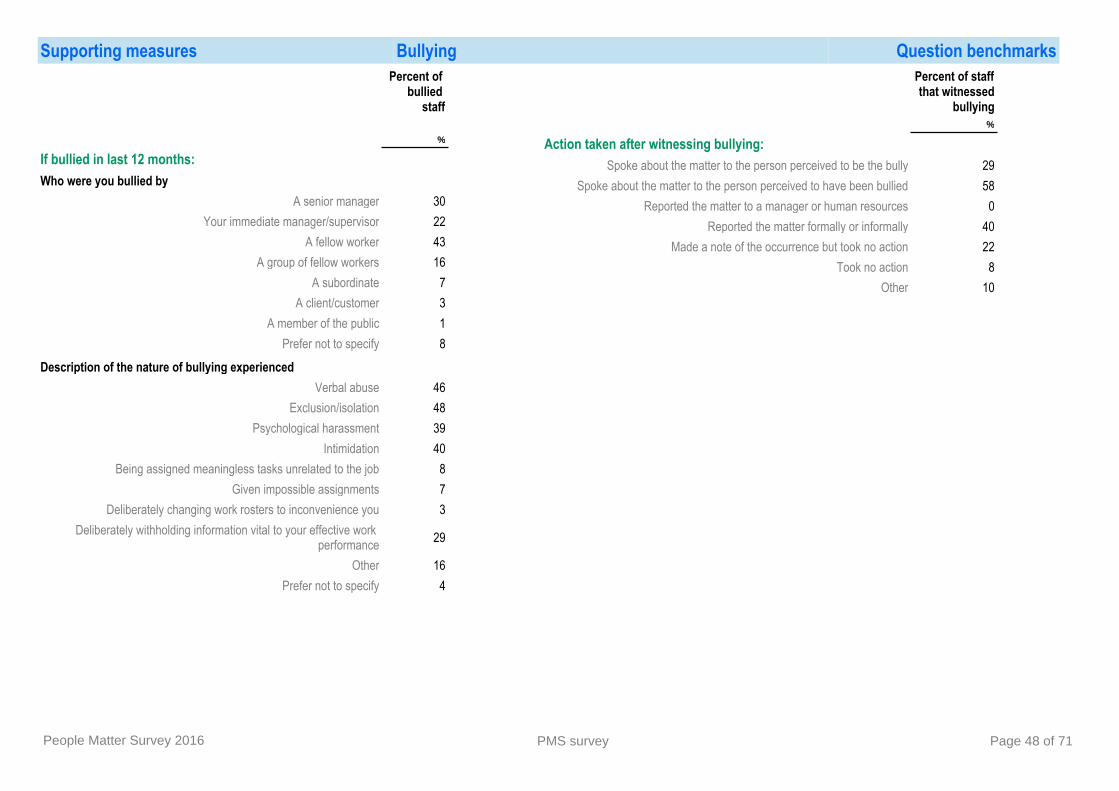
Supporting measures Bullying Question benchmarksPercent of
bullied staff
%
If bullied in last 12 months:Who were you bullied by
A senior manager 30Your immediate manager/supervisor 22
A fellow worker 43A group of fellow workers 16
A subordinate 7A client/customer 3
A member of the public 1Prefer not to specify 8
Description of the nature of bullying experiencedVerbal abuse 46
Exclusion/isolation 48Psychological harassment 39
Intimidation 40Being assigned meaningless tasks unrelated to the job 8
Given impossible assignments 7Deliberately changing work rosters to inconvenience you 3
Deliberately withholding information vital to your effective work performance 29
Other 16Prefer not to specify 4
Percent of staff that witnessed
bullying%
Action taken after witnessing bullying:Spoke about the matter to the person perceived to be the bully 29
Spoke about the matter to the person perceived to have been bullied 58Reported the matter to a manager or human resources 0
Reported the matter formally or informally 40Made a note of the occurrence but took no action 22
Took no action 8Other 10
People Matter Survey 2016 PMS survey Page 48 of 71
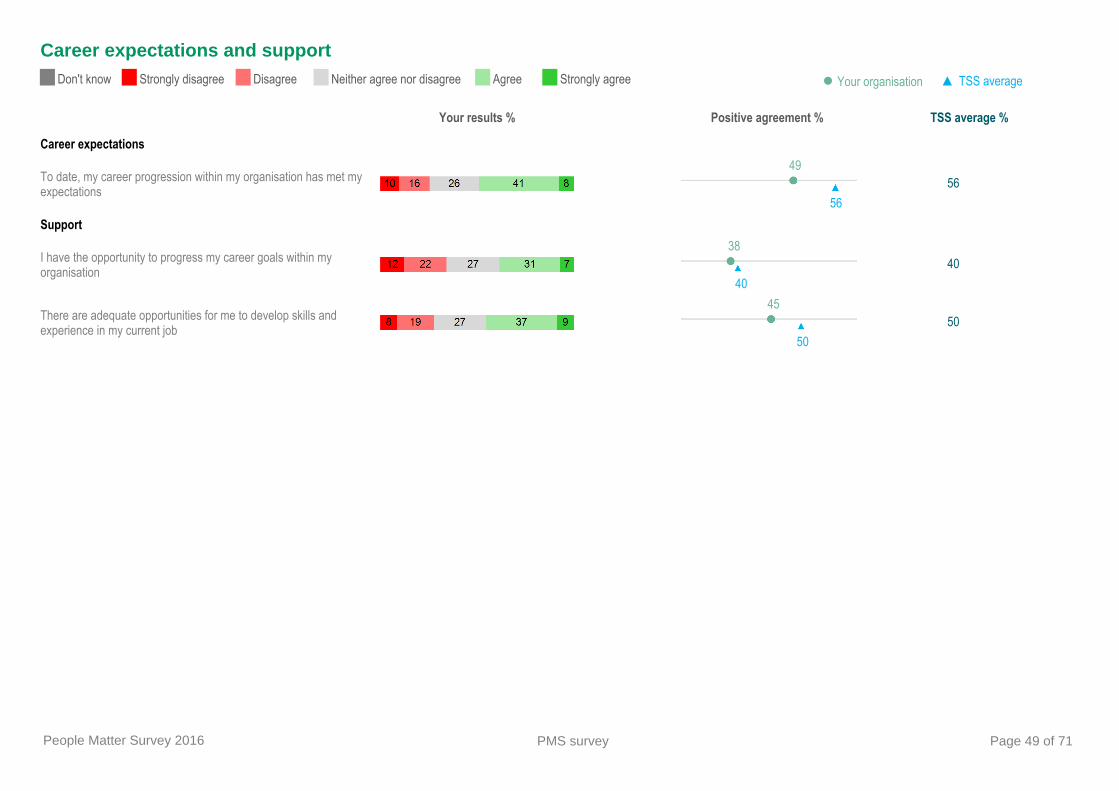
Career expectations and supportDon't know Strongly disagree Disagree Neither agree nor disagree Agree Strongly agree ● Your organisation ▲ TSS average
Your results % Positive agreement % TSS average %
Career expectations
To date, my career progression within my organisation has met my expectations
4956
56Support
I have the opportunity to progress my career goals within my organisation
3840
40
There are adequate opportunities for me to develop skills and experience in my current job
4550
50
People Matter Survey 2016 PMS survey Page 49 of 71
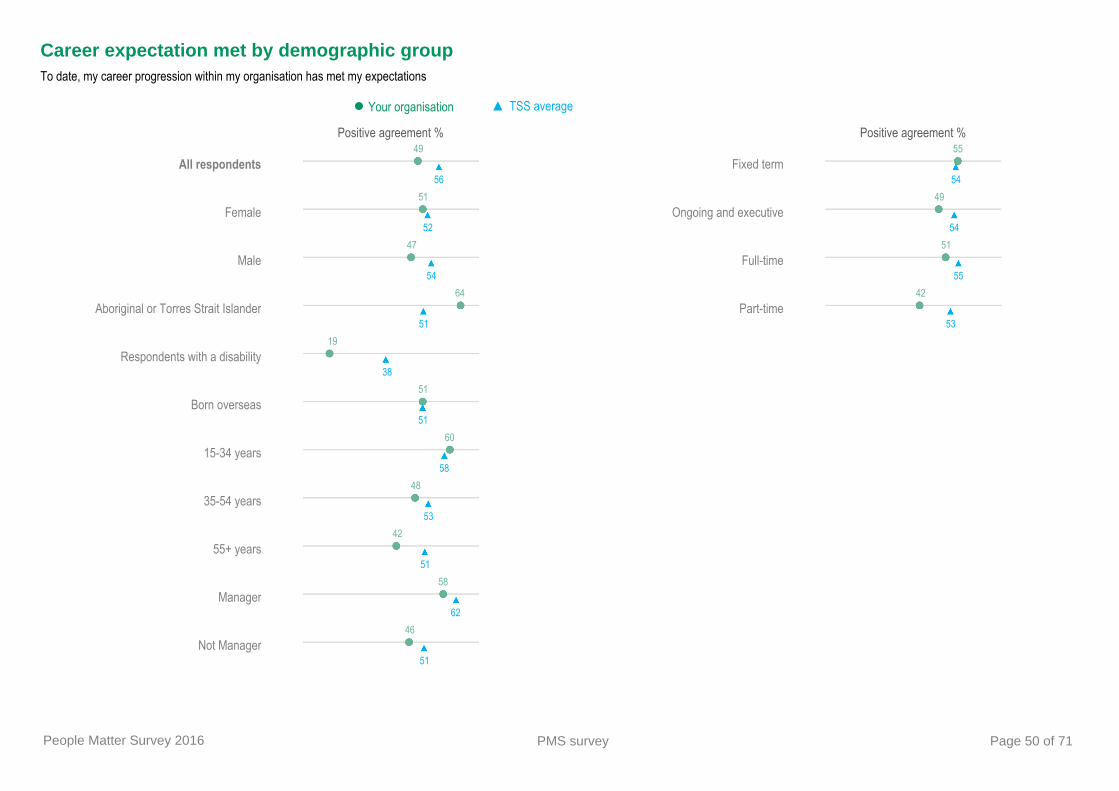
Career expectation met by demographic group
● Your organisation ▲ TSS average
Positive agreement %
Fixed term55
54
Ongoing and executive49
54
Full-time51
55
Part-time42
53
To date, my career progression within my organisation has met my expectations
Positive agreement %
All respondents49
56
Female51
52
Male47
54
Aboriginal or Torres Strait Islander64
51
Respondents with a disability19
38
Born overseas51
51
15-34 years60
58
35-54 years48
53
55+ years42
51
Manager58
62
Not Manager46
51
People Matter Survey 2016 PMS survey Page 50 of 71

Intention to stay or leaveLeave organisation StayDon't know ▲ TSS average ● Your organisation
Breakdown of intentions
Leave Yes % of all respondents
The private sector3
5
The community/non-government sector1
2
Outside the labour market .e.g (returning to study, retiring, personal reasons)
5
5
Your results %
Do you foresee your future employment/career in the next five years in:
Leave % TSS average %
1011
11
Stay Yes % of all respondents
Continuing in the State Service72
69
Don't know18
19
People Matter Survey 2016 PMS survey Page 51 of 71
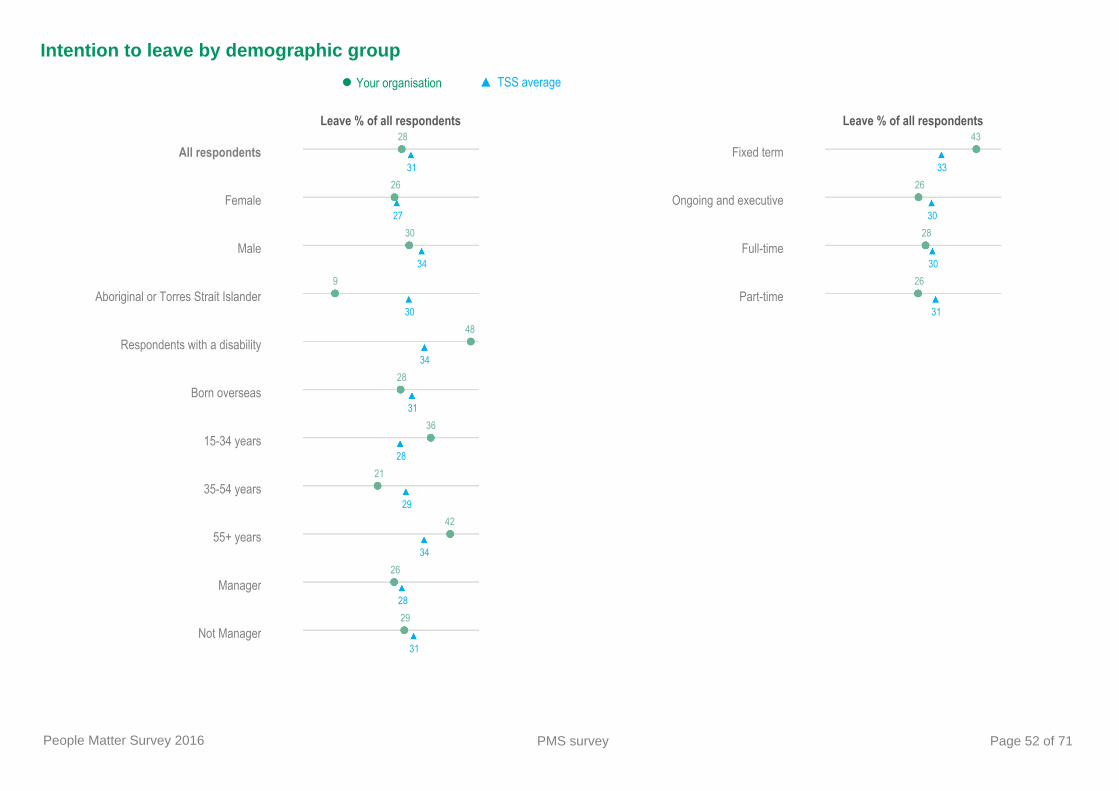
Intention to leave by demographic group
● Your organisation ▲ TSS average
Leave % of all respondents
Fixed term43
33
Ongoing and executive26
30
Full-time28
30
Part-time26
31
Leave % of all respondents
All respondents28
31
Female26
27
Male30
34
Aboriginal or Torres Strait Islander9
30
Respondents with a disability48
34
Born overseas28
31
15-34 years36
28
35-54 years21
29
55+ years42
34
Manager26
28
Not Manager29
31
People Matter Survey 2016 PMS survey Page 52 of 71

Factors influencing intention to leave
● Your organisation ▲ TSS average
A respondent could pick up to two factors.
Yes % of respondents intending to leave, excluding retirement
Career factors
Opportunity to broaden experience (Pull)21
23
To seek/take a promotion elsewhere (Pull)5
12
Limited opportunities to gain further experience at my organisation (Push)
21
17
My interests do not match my job role (Push)6
13
Lack of future career opportunities at my organisation (Push)
29
26
Other factors
Desire to relocate interstate or overseas (Pull)
7
8
Better location / reduce travel time (Pull)2
5
End of contract/secondment (Push)8
11
Other30
23
Yes % of respondents intending to leave, excluding retirement
Job / organisation factorsLack of flexible work arrangements for managing (e.g. family/caring commitments) (Push)
2
4
My workload is excessive (Push)7
13
A lack of recognition for doing a good job (Push)
11
16
For better remuneration (Pull)5
7
Poor relationship with my supervisor (Push)6
6
People Matter Survey 2016 PMS survey Page 53 of 71

Change experienced
● Your organisation ▲ TSS average
Yes %In the past 12 months, has your current workgroup been directly affected by significant workplace change
64
59
Change experiencedA respondent could select all that applied.
% of those that experienced significant change
Substantial change in your work priorities31
27
Substantial change in your type of work26
23
Organisational restructure47
52
Change in management above your direct line manager
26
39
Change in direct line manager28
35
% of those that experienced significant change
Increase in employee numbers24
18
Decrease in employee numbers44
39
Change in physical workplace (e.g. moved to a new building, existing workplace renovated)
36
35
Other11
11
Organisation policy and/or priority change26
25
People Matter Survey 2016 PMS survey Page 54 of 71
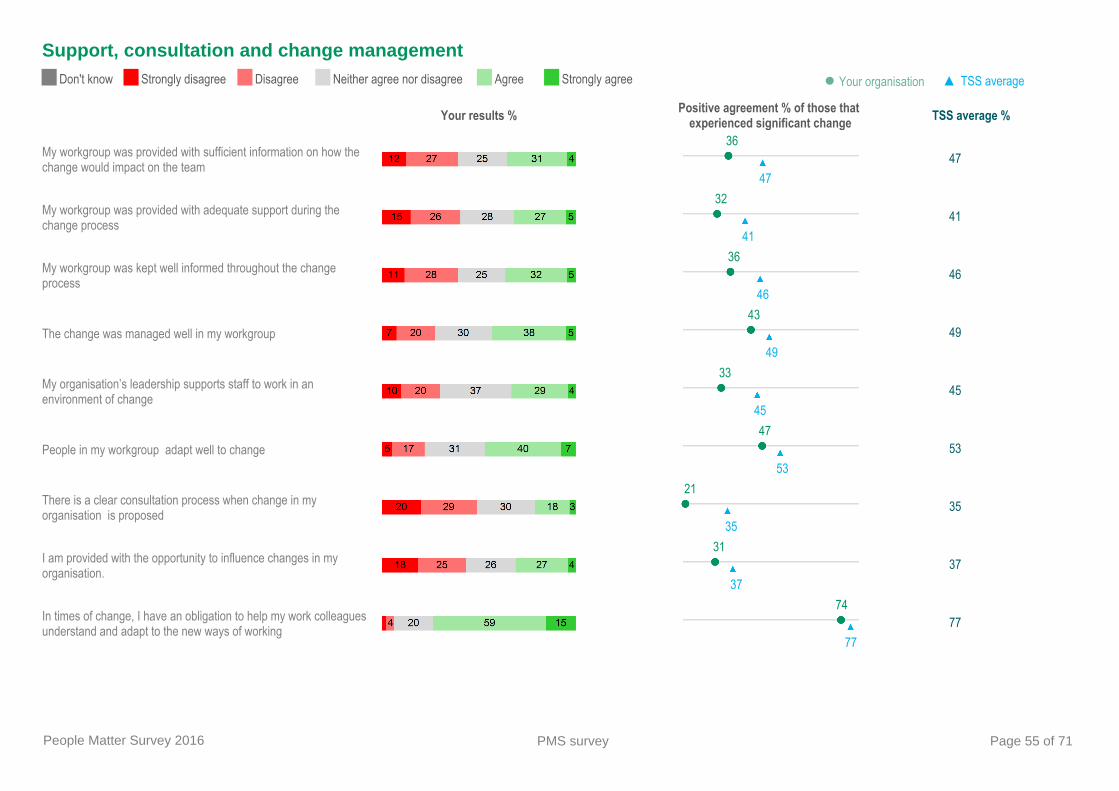
Support, consultation and change managementDon't know Strongly disagree Disagree Neither agree nor disagree Agree Strongly agree ● Your organisation ▲ TSS average
Your results % Positive agreement % of those that experienced significant change TSS average %
My workgroup was provided with sufficient information on how the change would impact on the team
3647
47
My workgroup was provided with adequate support during the change process
3241
41
My workgroup was kept well informed throughout the change process
3646
46
The change was managed well in my workgroup43
4949
My organisation’s leadership supports staff to work in an environment of change
3345
45
People in my workgroup adapt well to change47
5353
There is a clear consultation process when change in my organisation is proposed
2135
35
I am provided with the opportunity to influence changes in my organisation.
3137
37
In times of change, I have an obligation to help my work colleagues understand and adapt to the new ways of working
7477
77
People Matter Survey 2016 PMS survey Page 55 of 71

Supporting measures Leading change Question benchmarksDon't know Strongly disagree Disagree Neither agree nor disagree Agree Strongly agree ● Your organisation ▲ TSS average
Your results % Positive agreement % TSS average %
The average agreement with the following positive questions that measure Leading change
4149
49
Communications about change from senior managers are timely41
4747
In times of change, senior managers provide sufficient information about the purpose of the change
4150
50
People Matter Survey 2016 PMS survey Page 56 of 71
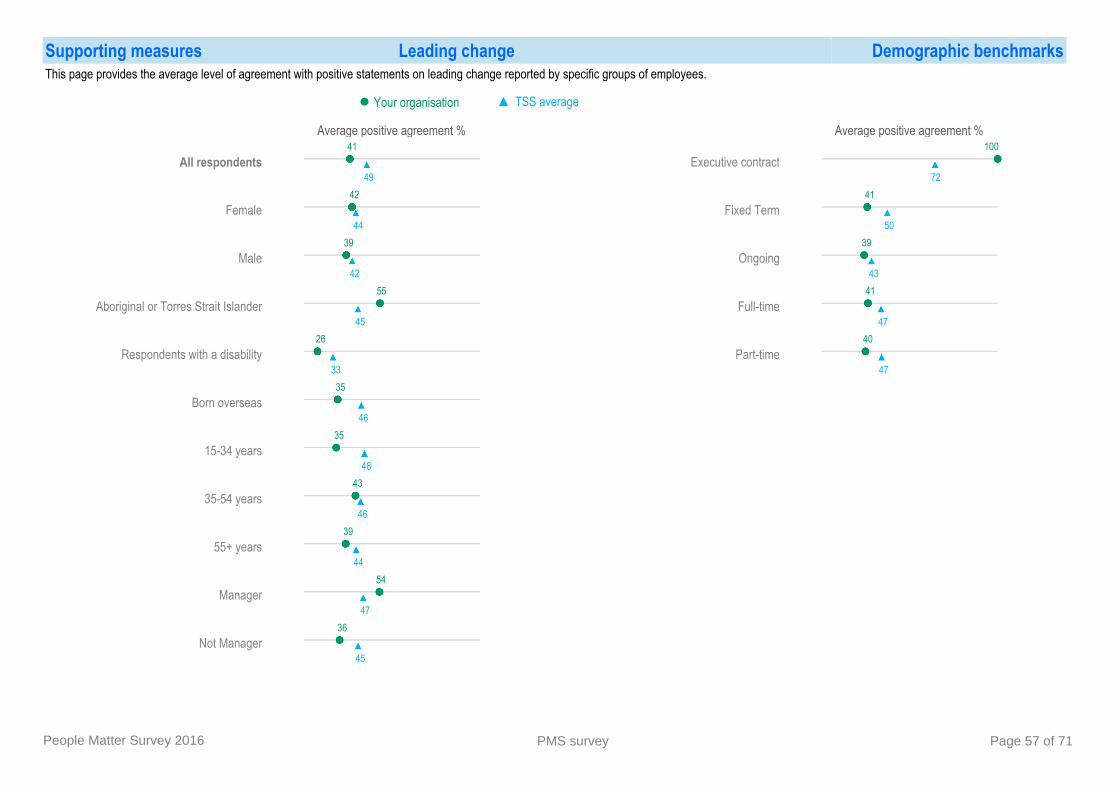
Supporting measures Leading change Demographic benchmarksThis page provides the average level of agreement with positive statements on leading change reported by specific groups of employees.
● Your organisation ▲ TSS average
Average positive agreement %
All respondents41
49
Female42
44
Male39
42
Aboriginal or Torres Strait Islander55
45
Respondents with a disability26
33
Born overseas35
46
15-34 years35
48
35-54 years43
46
55+ years39
44
Manager54
47
Not Manager36
45
Average positive agreement %
Executive contract100
72
Fixed Term41
50
Ongoing39
43
Full-time41
47
Part-time40
47
People Matter Survey 2016 PMS survey Page 57 of 71
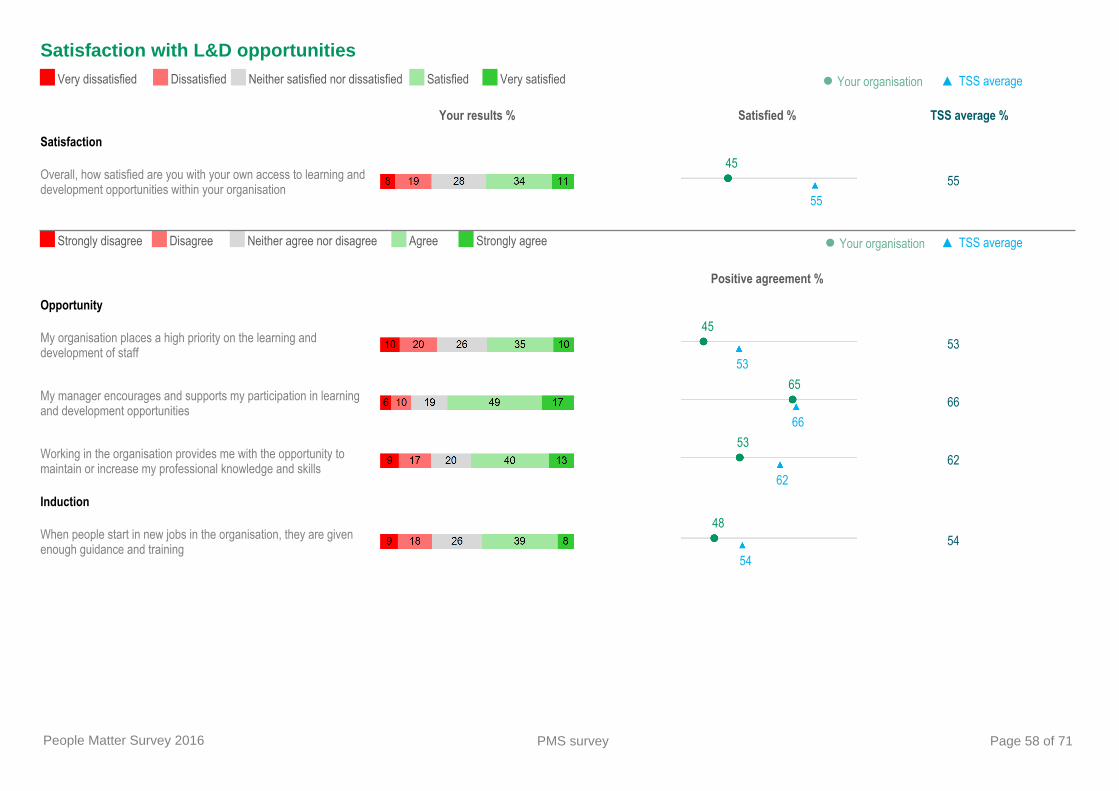
Satisfaction with L&D opportunitiesVery dissatisfied Dissatisfied Neither satisfied nor dissatisfied Satisfied Very satisfied ● Your organisation ▲ TSS average
Your results % Satisfied % TSS average %
Satisfaction
Overall, how satisfied are you with your own access to learning and development opportunities within your organisation
4555
55
Strongly disagree Disagree Neither agree nor disagree Agree Strongly agree ▲ TSS average ● Your organisation
Positive agreement %
Opportunity
My organisation places a high priority on the learning and development of staff
4553
53
My manager encourages and supports my participation in learning and development opportunities
6566
66
Working in the organisation provides me with the opportunity to maintain or increase my professional knowledge and skills
5362
62Induction
When people start in new jobs in the organisation, they are given enough guidance and training
4854
54
People Matter Survey 2016 PMS survey Page 58 of 71

Satisfaction with L&D opportunities by demographic group
● Your organisation ▲ TSS average
Satisfied %
All respondents45
55
Female51
50
Male38
50
Aboriginal or Torres Strait Islander55
45
Respondents with a disability48
41
Born overseas46
52
15-34 years51
56
35-54 years45
53
55+ years43
50
Manager54
60
Not Manager42
50
Satisfied %
Fixed term53
54
Ongoing and executive44
53
Full-time44
55
Part-time52
52
Overall, how satisfied are you with your own access to learning and development opportunities within your organisation?
People Matter Survey 2016 PMS survey Page 59 of 71

Implementation of L&D plans
No YesNot sure ▲ TSS average ● Your organisation
Your results % Yes % TSS average %L&D needs identified and agreed?
In the past 12 months, have your learning and development needs been identified and agreed with your supervisor
5262
62
L&D needs addressed?Yes % of respondents whose L&D
needs have been identified and agreed
To date, have your learning and development needs been addressed in the agreed timeframe
8481
81
Why L&D has not progressed within agreed timeframe
Yes % of respondents whose L&D has not been addressed
My supervisor hasn’t had the time 19
25
I haven’t had the time24
32
There is no money in the budget46
48
Appropriate learning and development opportunities have not occurred
46
51
Yes % of respondents whose L&D has not been addressed
I’ve changed work areas or jobs8
9
Other things have taken priority27
49
Other24
23
Yes, fully48
4949
Yes, partially36
3737
People Matter Survey 2016 PMS survey Page 60 of 71
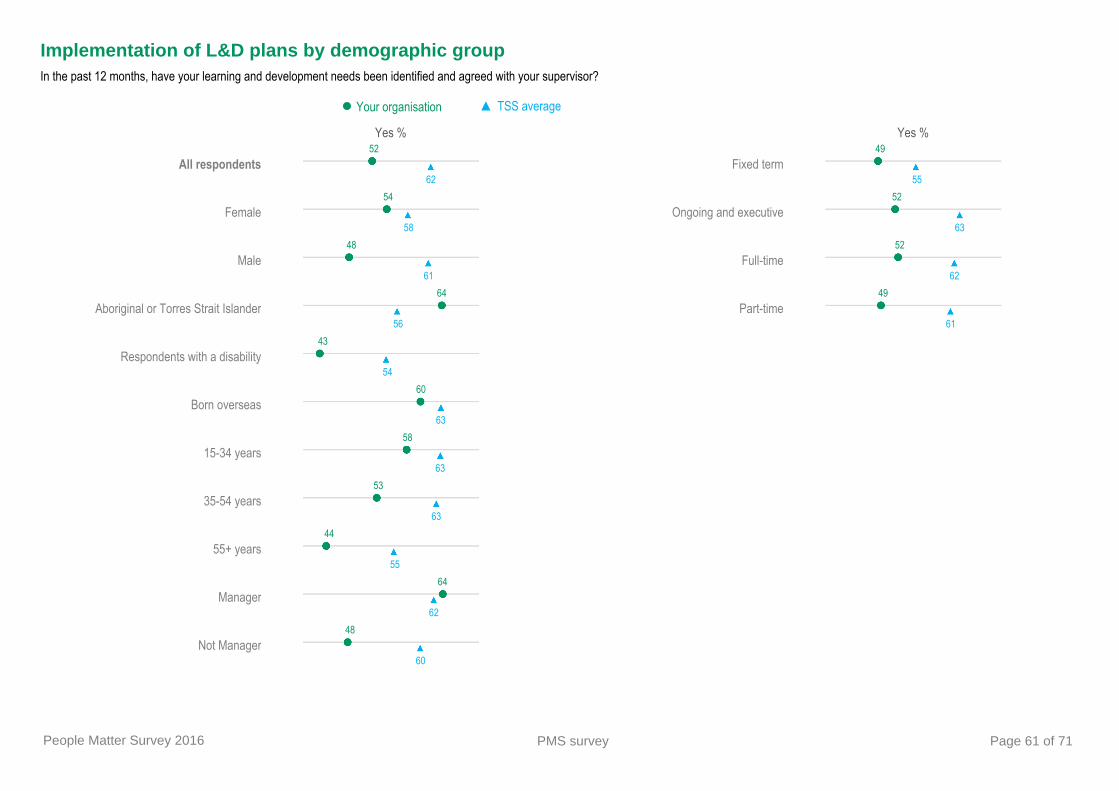
Implementation of L&D plans by demographic group
● Your organisation ▲ TSS average
Yes %
All respondents52
62
Female54
58
Male48
61
Aboriginal or Torres Strait Islander64
56
Respondents with a disability43
54
Born overseas60
63
15-34 years58
63
35-54 years53
63
55+ years44
55
Manager64
62
Not Manager48
60
Yes %
Fixed term49
55
Ongoing and executive52
63
Full-time52
62
Part-time49
61
In the past 12 months, have your learning and development needs been identified and agreed with your supervisor?
People Matter Survey 2016 PMS survey Page 61 of 71

Implementation of skills development activitiesNo YesNot sure ▲ TSS average ● Your organisation
Your results % Yes % TSS average %
Incidence
In the past 12 months, have you undertaken any skills development activities? Examples could include attending a course, online learning, or mentoring/coaching
6462
62
Strongly disagree Disagree Neither agree nor disagree Agree Strongly agree ▲ TSS average ● Your organisation
Positive agreement % of those who have undertaken skills
development activities in the past 12 months
Performance
Helped you do your job better69
7979
Help you advance your career development41
4343
People Matter Survey 2016 PMS survey Page 62 of 71
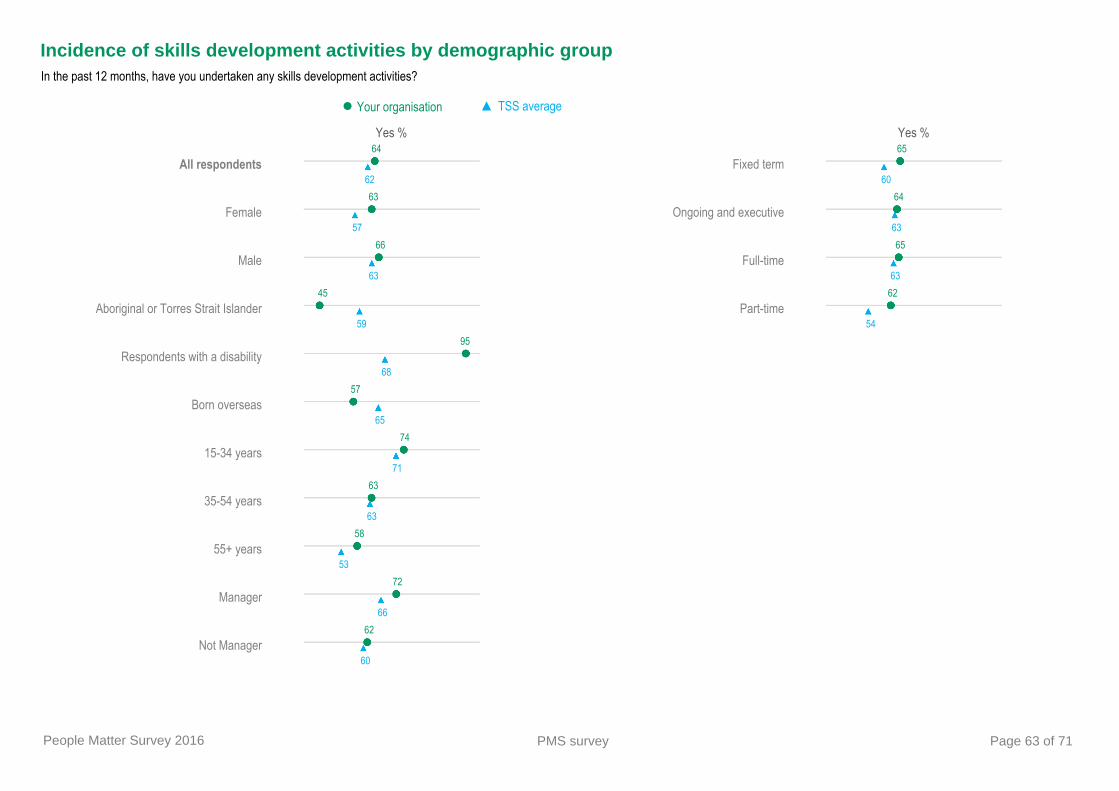
Incidence of skills development activities by demographic group
● Your organisation ▲ TSS average
Yes %
All respondents64
62
Female63
57
Male66
63
Aboriginal or Torres Strait Islander45
59
Respondents with a disability95
68
Born overseas57
65
15-34 years74
71
35-54 years63
63
55+ years58
53
Manager72
66
Not Manager62
60
Yes %
Fixed term65
60
Ongoing and executive64
63
Full-time65
63
Part-time62
54
In the past 12 months, have you undertaken any skills development activities?
People Matter Survey 2016 PMS survey Page 63 of 71

Work life balanceVery dissatisfied Dissatisfied Neither satisfied nor dissatisfied Satisfied Very satisfied ● Your organisation ▲ TSS average
Your results % Satisfied % TSS average %
Satisfaction with work/life balance in current job
All employees66
6565
Managers / team leaders(126 respondents)
6159
59
Staff that directly engage with customers(372 respondents)
6765
65
People Matter Survey 2016 PMS survey Page 64 of 71
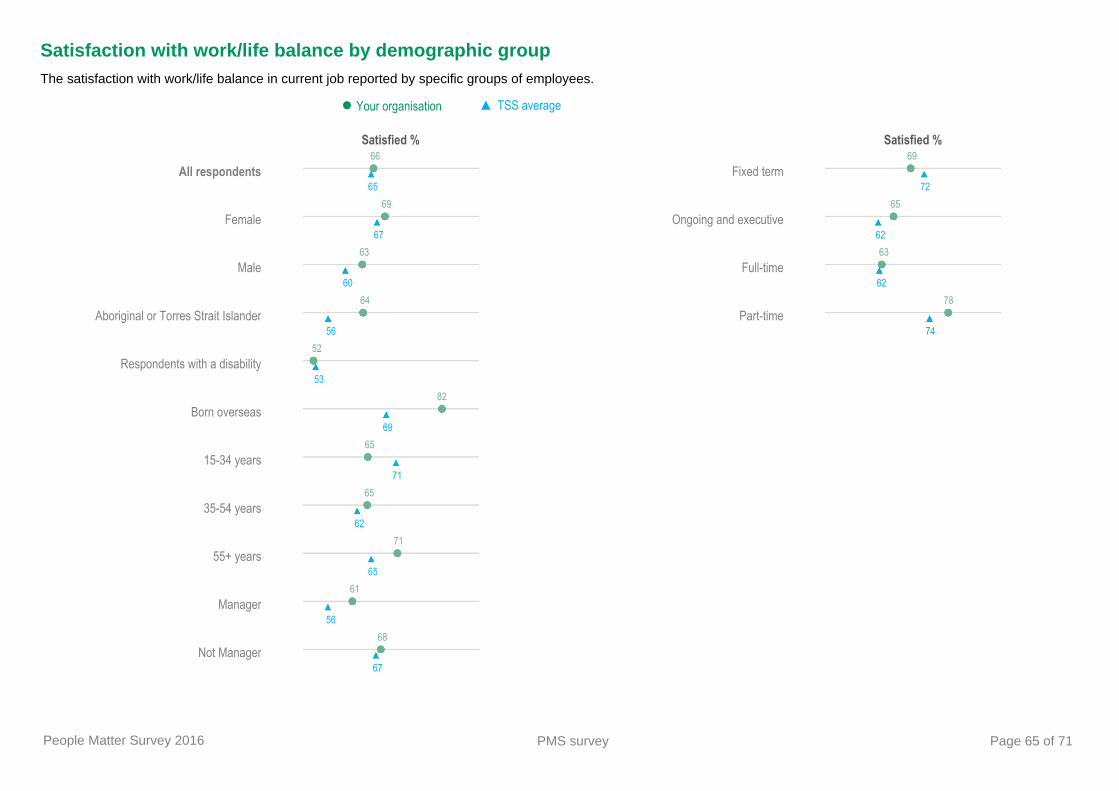
Satisfaction with work/life balance by demographic group
● Your organisation ▲ TSS average
Satisfied %
All respondents66
65
Female69
67
Male63
60
Aboriginal or Torres Strait Islander64
56
Respondents with a disability52
53
Born overseas82
69
15-34 years65
71
35-54 years65
62
55+ years71
65
Manager61
56
Not Manager68
67
Satisfied %
Fixed term69
72
Ongoing and executive65
62
Full-time63
62
Part-time78
74
The satisfaction with work/life balance in current job reported by specific groups of employees.
People Matter Survey 2016 PMS survey Page 65 of 71

Impact of work related stressStrongly disagree Disagree Neither agree nor disagree Agree Strongly agree ▲ TSS average ● Your organisation
Your results % Positive disagreement % TSS average %
Impact of work related stress
Work related stress regularly has a negative impact on my personal life
4343
43
Managers / Team Leaders % of Managers / Team leaders Positive disagreement % of Managers / Team leaders
(126 respondents)
I often have to manage difficult / problematic employee behaviour40
3636
Managing employees has a negative effect on my personal life (e.g. causing stress)
4949
49
People Matter Survey 2016 PMS survey Page 66 of 71
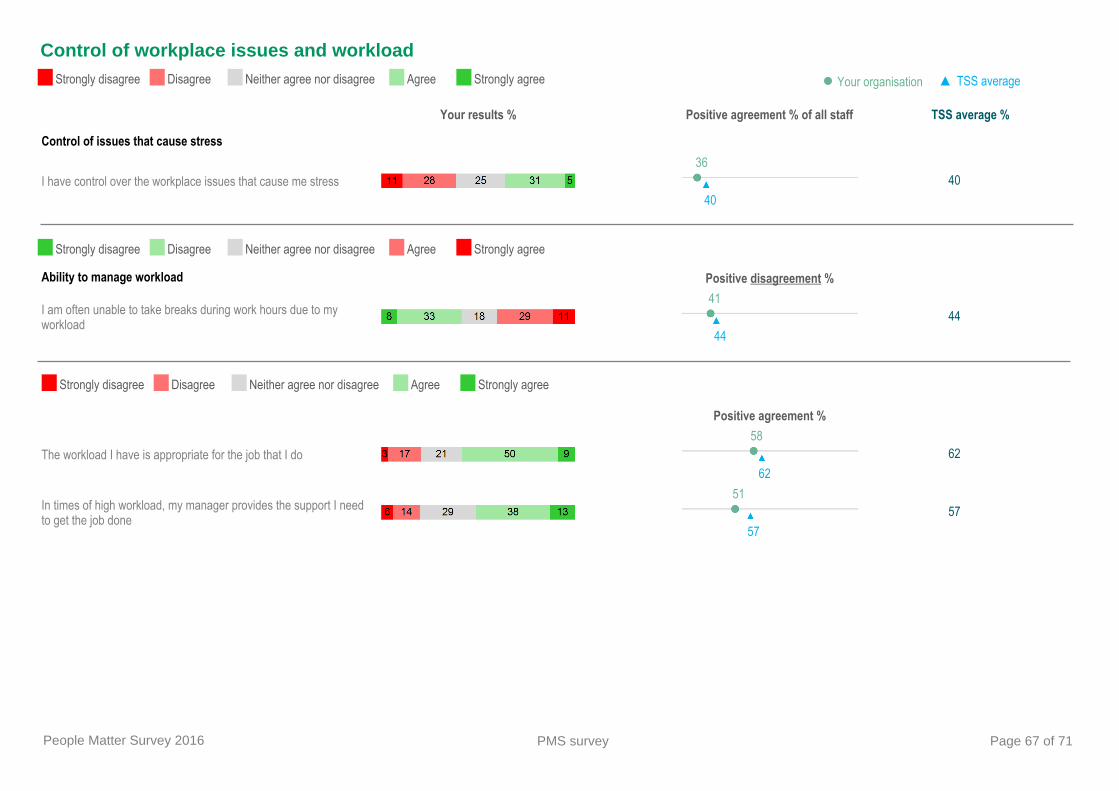
Control of workplace issues and workloadStrongly disagree Disagree Neither agree nor disagree Agree Strongly agree ▲ TSS average ● Your organisation
Your results % Positive agreement % of all staff TSS average %
Control of issues that cause stress
I have control over the workplace issues that cause me stress36
4040
Strongly disagree Disagree Neither agree nor disagree Agree Strongly agree
Ability to manage workload Positive disagreement %
I am often unable to take breaks during work hours due to my workload
4144
44
Strongly disagree Disagree Neither agree nor disagree Agree Strongly agree
Positive agreement %
The workload I have is appropriate for the job that I do58
6262
In times of high workload, my manager provides the support I need to get the job done
5157
57
People Matter Survey 2016 PMS survey Page 67 of 71
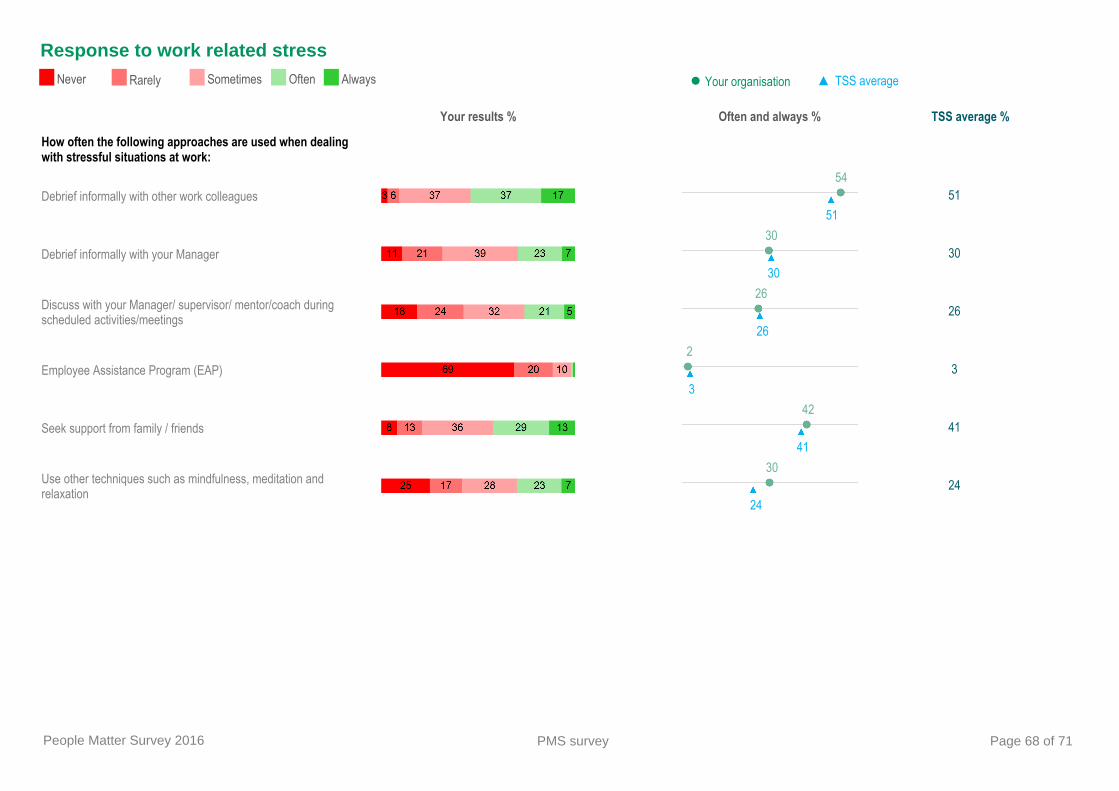
Response to work related stress
Your results % Often and always % TSS average %
How often the following approaches are used when dealing with stressful situations at work:
Debrief informally with other work colleagues54
5151
Debrief informally with your Manager30
3030
Discuss with your Manager/ supervisor/ mentor/coach during scheduled activities/meetings
2626
26
Employee Assistance Program (EAP)2
33
Seek support from family / friends42
4141
Use other techniques such as mindfulness, meditation and relaxation
3024
24
Never Rarely Sometimes Often Always ● Your organisation ▲ TSS average
People Matter Survey 2016 PMS survey Page 68 of 71
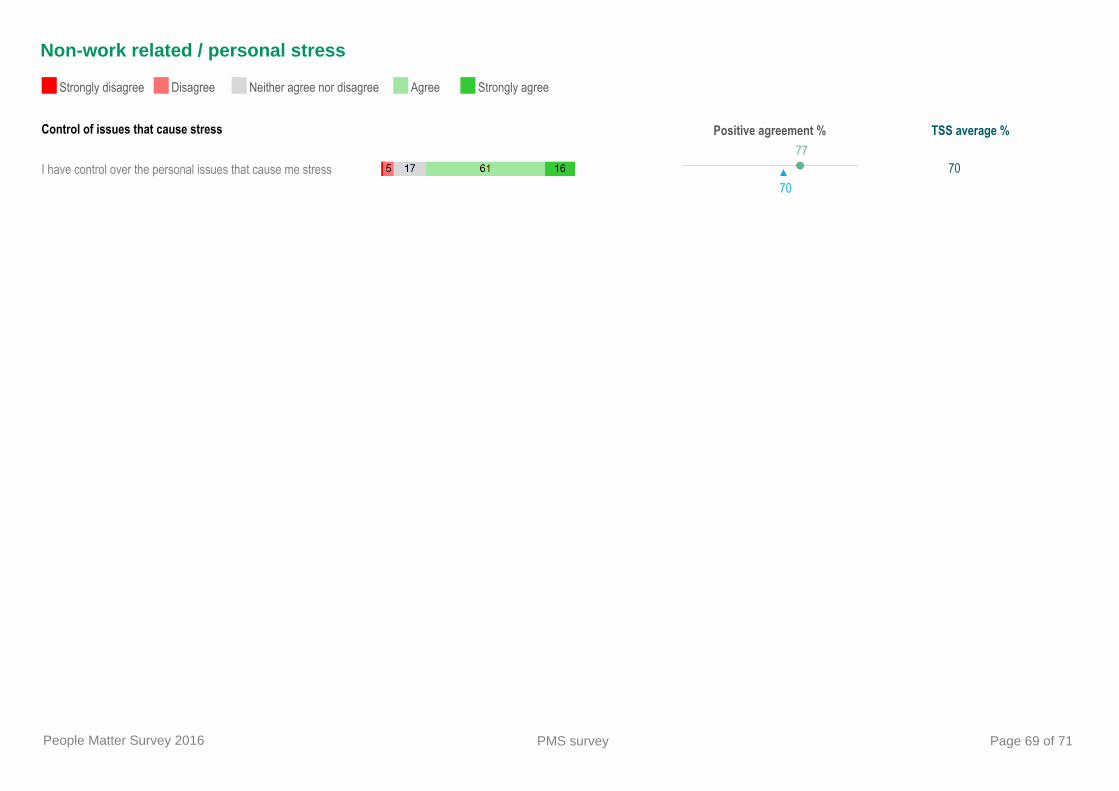
Non-work related / personal stress
Strongly disagree Disagree Neither agree nor disagree Agree Strongly agree
Control of issues that cause stress Positive agreement % TSS average %
I have control over the personal issues that cause me stress77
7070
People Matter Survey 2016 PMS survey Page 69 of 71

Employee support – 1 of 2Strongly disagree Disagree Neither agree nor disagree Agree Strongly agree ▲ TSS average ● Your organisation
Your results % Positive agreement % TSS average %
My organisation provides a safe work environment76
8888
My workgroup encourages and supports employees to have a good work/life balance
6771
71
My organisation encourages and supports employees to have a good work/life balance
7071
71
My organisation has effective procedures in place to support employees who may experience stress
5961
61
I am encouraged to report health and safety incidents and injuries84
8989
I am able to effectively manage my workload72
7272
My manager takes a positive interest in my well-being70
7272
My organisation is committed to employee wellbeing66
6666
Employee safety is discussed at regular workgroup meetings54
6464
I have received instruction/training appropriate to my role to address WH&S hazards, incidents and injuries in accordance with my organisation’s policies
6982
82
I have both the opportunities and resources at work to support my health and wellbeing
6370
70
People Matter Survey 2016 PMS survey Page 70 of 71
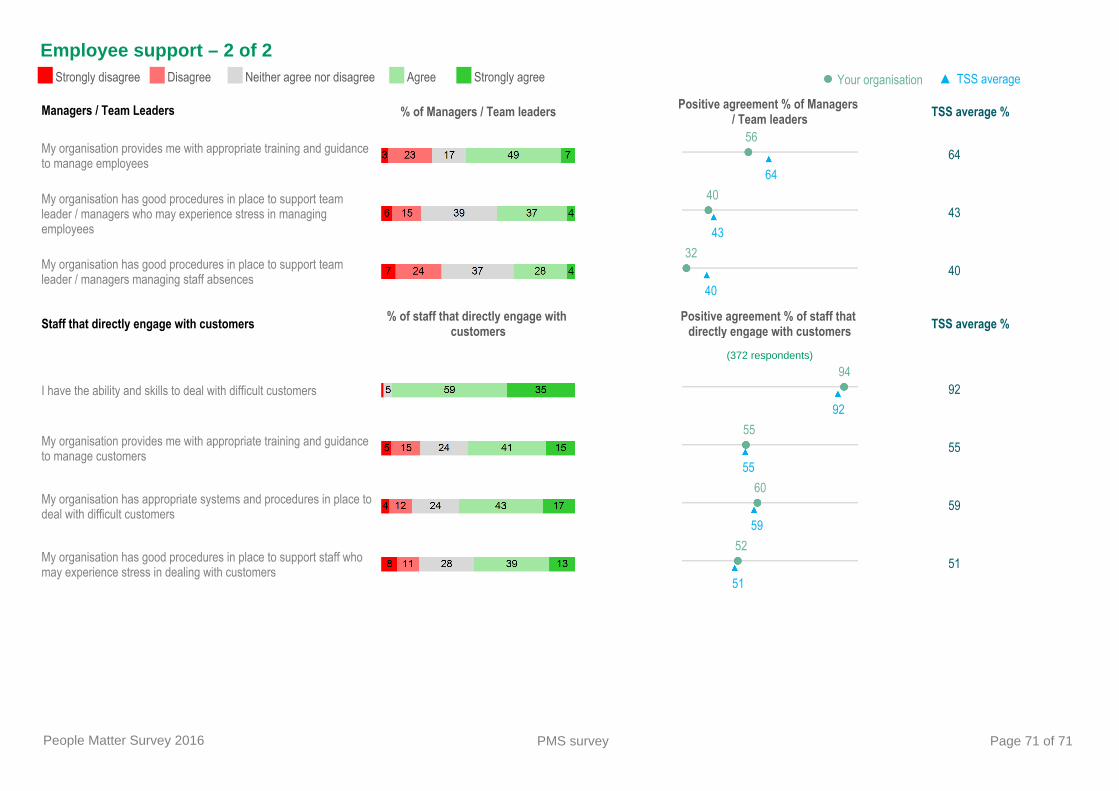
Employee support – 2 of 2Strongly disagree Disagree Neither agree nor disagree Agree Strongly agree ▲ TSS average ● Your organisation
Staff that directly engage with customers % of staff that directly engage with customers
Positive agreement % of staff that directly engage with customers TSS average %
(372 respondents)
I have the ability and skills to deal with difficult customers94
9292
My organisation provides me with appropriate training and guidance to manage customers
5555
55
My organisation has appropriate systems and procedures in place to deal with difficult customers
6059
59
My organisation has good procedures in place to support staff who may experience stress in dealing with customers
5251
51
Managers / Team Leaders % of Managers / Team leaders Positive agreement % of Managers / Team leaders TSS average %
My organisation provides me with appropriate training and guidance to manage employees
5664
64
My organisation has good procedures in place to support team leader / managers who may experience stress in managing employees
4043
43
My organisation has good procedures in place to support team leader / managers managing staff absences
3240
40
People Matter Survey 2016 PMS survey Page 71 of 71