taking the pulse of ncea - cbg.co.nz · support for ncea in 2006 . in 2006, support for ncea from...
TRANSCRIPT
Taking the pulse of NCEA
Findings from the NZCER National Survey of Secondary Schools 2006
Rosemary Hipkins
NEW ZEALAND COUNCIL FOR EDUCATIONAL RESEARCH
TE RÜNANGA O AOTEAROA MÖ TE RANGAHAU I TE MÄTAURANGA
WELLINGTON
2007

New Zealand Council for Educational Research
P O Box 3237
Wellington
New Zealand
© NZCER, 2007
ISBN 978-1-8777293-61-0
Distributed by NZCER Distribution Services
P O Box 3237
Wellington
New Zealand
Downloaded from: http://www.nzcer.org.nz/pdfs/15782.pdf

Acknowledgements
Many people contribute to NZCER’s national surveys. We are grateful to the secondary school
principals, teachers, trustees, and parents who took the time to complete their respective NZCER
national surveys, as well as to other school managers who co-ordinated the process where
necessary. PPTA representatives in the secondary schools assisted with the random distribution of
surveys. NZCER researchers are very aware of the increasing demands placed on schools in an
environment where evidence-informed decision making is seen as an important aspect of policy
formulation so we really appreciate this continuing support for our work.
Thanks are due to those individuals who read and commented on the survey drafts and helped
identify issues to be addressed. In particular, we are grateful to Rob Willets of PPTA, and NZSTA
staff for feedback on the NZCER secondary national survey drafts. Several principals and
teachers piloted the relevant survey drafts and gave useful feedback.
NZCER national surveys are a team effort. Ben Gardiner has ably managed the national survey
project in all its stages. Without his organisation and determination, we would not have achieved
the response rates we did, particularly from our busy secondary school principals. Edith Hodgen
led the data management and data analysis phases of the project, and designed then implemented
the additional analysis reported in Section 6. Simon Leong assisted with the primary analysis and
presentation of the survey data. Keren Brooking assisted with the initial shaping of the report and
Robyn Baker provided critical feedback to the completed draft. Kristina Louis provided
information services and Christine Williams provided secretarial support. Sarah Boyd and Bev
Webber managed the publication processes and Shelley Carlyle carried out the final editing.
i © NZCER

ii © NZCER

Table of Contents
Acknowledgements i
Executive summary i
Key new findings about NCEA i Support for NCEA in 2006 i High levels of uncertainty amongst parents ii Lack of support for further systemic change ii Understanding of NCEA among community stakeholders ii Reducing assessment pressures on students ii NCEA implementation and educational agencies iii
1. Introduction 1
Background to the report 1 Structure of the report 2
2. Research methodology 5
The national survey sample 5 Principals who responded 6 Teachers who responded 6 Trustees who responded 7 Parents who responded 7
Analysis of the data 8 Interpreting the graphs 8
3. Perceptions of NCEA as a qualification 9
Support for NCEA 10 Changes in support for NCEA over time 10
Credibility of the qualification 11 The value of NCEA as a record of learning 13 How well is NCEA understood in the wider community? 14
Parents’ understanding of NCEA 14 Employers’ understanding of NCEA 16 Understanding of NCEA within universities 16
Why are principals more supportive of NCEA overall? 17
iii © NZCER

4. Impacts of NCEA on curriculum and assessment practice 19
The potential for curriculum change 19 Conflation of curriculum and assessment 20 Designing assessment items to reflect shifts in curriculum 21 To what extent are NCEA/curriculum interactions seen as an issue? 22
What are schools prepared to do about overassessment? 23 Managing via proactive design measures 24 Managing via the timing of assessments across the years of school 26 Managing the spread of assessments across one year 27 Managing workload issues 28 What might be influencing reluctance to reduce assessment events? 29
Moderation as part of the assessment process 30 Sources of advice and support for teachers’ work 31 Perceptions of time demands 32 Is advice from different agencies consistent? 33
Principals’ views on advice provision and accountability measures 33 Resourcing NCEA 35
5. NCEA and student motivation 37
Motivating lower achievers 37 Possible impacts on teachers’ views 38 Possible impacts on parents’ views 39
Motivating high achievers 40 Developments in 2007 41
Student choice 41
6. The future of NCEA 43
Do people want another new system? 43 Is there a desire to return to the previous system? 44
7. NCEA as a “lightning rod” for other concerns 45
Findings for teachers 46 Indicators of job satisfaction 46 Engaging with wider changes in education 46 Indicators of networking and collegiality 48 Demographic associations 49
Findings for parents 50 Overall feelings about the school 50 Taking an active interest in education 50 Achievement issues 51 Demographic differences 52
Findings for trustees 52
iv © NZCER

v © NZCER
Being happy and confident in the BOT role 52 Engaging with education issues 53 Demographic differences 53
Findings for principals 54 Budget, staffing, and workload 54 Curriculum and assessment issues 54 Relationships 55 Demographic differences 56
Is NCEA really acting as a lightning rod? 56 NCEA as an unsettling curriculum influence 56 Keeping up with the pace? 58
Taking the pulse of NCEA 59
References 61
Tables
Table 1 A comparison of responding teacher and principal age groups 7
Table 2 Changes in support for NCEA between 2003 and 2006 11
Table 3 Agreement that parents do not understand NCEA: 2003 and 2006 15
Table 4 Teachers’ perceptions of main achievements in the last three years 22
Table 5 The extent to which NCEA/curriculum interactions are seen as “major issues”
facing the school 23
Table 6 Principals’ perceptions of NCEA-related budget pressure points 36
Table 7 Results of cluster analysis 45
Table 8 Profile of responses by school size 63
Table 9 Profile of responses by decile 63
Table 10 Profile of responses by school type 64
Table 11 Profile of responses by school authority 64

Figures
Figure 1 Support for NCEA in 2006 10 Figure 2 Responses to the statement The NCEA is a credible qualification in the wider
community 12 Figure 3 Responses to the statement that The NCEA is a valuable record of student learning 13 Figure 4 Perceptions of parents’ lack of understanding of NCEA 15 Figure 5 Perceptions that The NCEA gives us freedom to design the curriculum how we
want 20 Figure 6 Response to the statement Assessment is driving the curriculum now, even at
Years 9 and 10 21 Figure 7 Principal and teacher views on managing overassessment via course design 25 Figure 8 Principal and teacher views on managing the timing of assessments across the
years of school 27 Figure 9 Principal and teacher views on managing the balance of internal and external
assessments within one year of school 28 Figure 10 Principal and teacher views of measures already in place to manage NCEA
workloads 29 Figure 11 Teachers’ views of their access to support for professional matters 31 Figure 12 Teachers’ responses to time demands of some administration/accountability tasks 32 Figure 13 Teachers’ views of consistency of MOE/NZQA messages 33 Figure 14 Principals’ views of their access to support for professional matters 34 Figure 15 Principals’ responses to time demands of some administration/accountability tasks 34 Figure 16 Principals’ views of consistency of advice from different sources 35 Figure 17 Impact of NCEA on motivation of lower achievers 38 Figure 18 Impact of NCEA on motivation of higher achievers 40 Figure 19 Perceptions that students have too much responsibility for their NCEA choices 42 Figure 20 Support for the development of a new qualifications system 43 Figure 21 Support for a return to the previous system 44
Appendices
Appendix A: Profiles of secondary schools responding to 2006 National Survey 63 Appendix B: Responses from principals 65 Appendix C: Teachers’ responses 67 Appendix D: Trustees’ responses 69 Appendix E: Parents’ responses 71
i © NZCER

Executive summary
This is the second major report of findings from the NZCER National Survey of Secondary
Schools 2006. The first report addressed planning and reporting processes in schools and was
released earlier in 2007. NZCER national surveys are actually four surveys in one—one each
from secondary school principals, teachers, trustees, and parents. On the whole, these separate
surveys cover complementary, but not identical, questions. The core material of this report was a
set of Likert-scaled items about NCEA that were identical in the four surveys, or nearly so.
Key new findings about NCEA
The report endorses findings that have already been reported elsewhere. For example, it confirms
the impact of NCEA implementation on teachers’ workloads and in budget areas such as
photocopying. However, the report also informs NCEA debate in some areas where systematic
data have not been easily accessible up until now, or where new dimensions can be added to
existing knowledge about NCEA. Six such areas of new findings are summarised in this executive
summary.
Support for NCEA in 2006 In 2006, support for NCEA from secondary principals, and from teachers who were senior
managers, continued at high levels (this was also the case in 2003). Eighty-nine percent of
principals were personally supportive of NCEA and the majority of this group strongly agreed
they were supportive, as did many senior managers. In 2006, most principals felt they had either
successfully sustained or improved their school’s implementation of NCEA over the three years
since the last national survey. Most principals also saw NCEA as a valuable record of student
learning, and three-quarters of them said it had motivated lower achieving students to do better.
Views were more evenly split about whether it motivates higher achievers to do better.
While there was more divergence in the views of teachers and trustees, overall more were positive
than were not, both in their support for NCEA and in the view that it is a valuable record of
student learning. Teachers’ and trustees’ views on whether NECA motivates lower achievers to
do better were evenly split, and overall they were more likely to disagree that it motivates higher
achievers to do better.
Those teachers and trustees who were more negative about NCEA were more likely to express
concerns about other aspects of their work, including some that were seemingly only tangentially
related. Where lack of support was expressed, it may be the case that NCEA has been acting as
something of a “lightning rod” for more general concerns about secondary education. This effect
i © NZCER

was particularly strong in the pattern of teacher responses and the many associations with being
negative about NCEA are reported in Section 7.
High levels of uncertainty amongst parents The pattern of parents’ responses was characterised by high levels of “not sure/don’t know”
responses. Around half the sample responded this way to each of NCEA items. Half of the parents
also felt the school had not kept them well informed about NCEA. As for the teachers and
trustees, those parents who were more negative about NCEA were also more likely to express
concerns about other aspects of their child’s schooling, with NCEA perhaps acting as a “lightning
rod” for other concerns such as anxiety about progress, or lack of contact with the school.
Lack of support for further systemic change Patterns of responses suggested there is no mandate for further high-level design changes to the
qualifications system. Few teachers or trustees, and even fewer principals, wanted to return to the
previous system. Similar numbers of parents agreed as disagreed but, again, their most common
response was uncertainty. Few principals, parents, or trustees wanted to start again and design
another qualifications system. There was more support from teachers for this suggestion, albeit
outweighed by those who either disagreed, or were uncertain.
Understanding of NCEA among community stakeholders A majority of principals and teachers thought that employers do not understand NCEA. Also,
around half of them were unsure if universities understand NCEA. A majority of principals,
teachers, and trustees similarly felt that parents do not understand NCEA, although just under half
the parents thought they did understand it! These views doubtless contribute to the finding that
around a third of each group are unsure if NCEA is a credible qualification in the wider
community.
Reducing assessment pressures on students The view that assessment is driving the curriculum, even at Years 9 and 10, was widely shared
amongst principals, teachers, and trustees. Even so, few schools appeared to be employing, or
even actively considering, some steps they could potentially take to manage overassessment.
More principals than teachers were willing to consider measures such as placing strict credit
limits on individual courses and encouraging students to prioritise assessments. Both principals
and teachers were relatively evenly divided between holding the view that limits should be placed
on the numbers of either internal or external assessment events students faced, and those who
thought no such limits should be imposed Very few respondents of either group were willing to
consider managing assessment pressures by postponing NCEA assessments for some students
until Year 12 or Year 13.
ii © NZCER

NCEA implementation and educational agencies More principals than teachers said that it takes too much time to assemble the information
required by NZQA. Notwithstanding the pressures of their co-ordination role, middle managers
were no more likely to say this than other teachers, but nearly half the teachers said they did not
know. A third of the teachers believed that NCEA moderation processes take too much time but
again a similar number said they did not know if this was the case.
Principals and senior managers were more likely than other teachers to say they could access
timely advice and support from NZQA staff. A majority of principals said they could access such
support from MOE (especially local or regional staff), PPTA, School Support, and ERO. By
contrast, around half the teachers were unsure about whether they could access timely advice and
support from any of their potential sources, including their local subject association, School
Support advisers, NZQA moderators and staff.
A bare majority of principals saw no conflict between policy messages from different sources
such as MOE and NZQA, or NZQA and School Support advisers. However, around a third of
principals and nearly two-thirds of the teachers were unsure if such conflicts existed.
iii © NZCER

iv © NZCER

1. Introduction
Five years after the implementation of reforms to secondary school qualifications began it seems
timely to document current perceptions of the National Certificates of Educational Achievement
(NCEA). This report presents findings from the NZCER National Survey of Secondary Schools
2006. This is actually four surveys in one—one each from secondary school principals, teachers,
trustees, and parents. On the whole, the surveys cover complementary, but not identical,
questions. The core material of this report was a set of Likert-scaled items about NCEA that were
identical in the four surveys, or nearly so.
Background to the report
This report is set against a background of ongoing controversy about NCEA. Negative
commentary has far outweighed positive comment in the media (Brooking 2006). Helping to put
this in perspective, the research reported here aims to address the question of the extent to which
the media debate accurately reflects views held in the wider education sector. The title of the
report reflects this intent.
NCEA is part of an ambitious series of reforms that began a decade before NCEA implementation
with the intention of developing a “seamless” National Qualifications Framework (NQF) from
Level 1 to the postgraduate Level 8. Consequently NCEA reforms have arisen in an environment
of existing debate about the relative merits of standards-based and norm-referenced methods of
assessment. In her analysis of this formative decade, Dobric (2006) found that different groups of
policy actors held different ideological positions, and hence saw issues differently. She reported
that such differences were temporarily set aside while acceptable policy solutions to specific
issues were being formulated, only to re-emerge more recently as the initial implementation phase
came to a close. Something of these tensions, no longer suspended, can be seen in the survey
findings that follow.
A multiplicity of aims has been suggested for the NQF development as a whole. These include:
the creation of an open credit transfer system
the breaking of the academic/vocational divide
the removal of a “time-served” requirement for gaining qualifications
the creation of an outcomes-based assessment model
recognition of prior learning
the development of a comprehensive quality control system (Peddie 1998).
The NCEA reforms added further ambitious aims to this list:
1 © NZCER

the provision of more detailed and evidence-informed records of school learning;
the potential to address different types of learning outcomes;
an emphasis on learning success for all students,
being able to work progressively towards outcomes; and
greater engagement of students in learning and in making informed choices about study
(Dobric 2006; Meyer, McClure et al. 2006).
Congruent with aims for the overall NQF reform, it was hoped that bringing “academic” and
“vocational” courses into the one qualification regime would bring more parity of esteem for the
vocational courses, and encourage innovative integration of curriculum (Hipkins, Vaughan et al.
2004). For the policy makers, the potential to foster “lifelong learning” for changing economic
and social needs has been an important aspiration, if not a clear action focus (Hipkins 2005).
Many of the above aims represent considerable shifts from traditional practice. The resultant
changes were bound to generate controversy, and still do. Arguably, NCEA itself has been the
most contested part of the overall NQF reforms, perhaps because high-stakes assessment at the
senior secondary school level is more visible in the wider community than are tertiary-level
assessment practices. This report attempts to frame the differences uncovered in the four surveys
in terms of wider differences in perspectives about the aims of secondary school education and the
purposes that senior secondary school qualifications should serve.
Structure of the report
Section 2 outlines the research methodology. The next five sections are organised around
responses to Likert items with a similar theme, with questions from other parts of each surveys
woven into the discussion as relevant.
Section 3 considers a cluster of statements related to issues of credibility and confidence in the
qualification, framing these in the light of controversial features of the design. Statements
discussed in this section are:
I am supportive of NCEA (included in all four surveys—principals, teachers, trustees,
parents).
The NCEA is a credible qualification in the wider community (principals, teachers, trustees,
parents).
The NCEA is a valuable record of student learning (principals, teachers, trustees, parents).
Parents don’t understand NCEA (principals, teachers, trustees) and I don’t understand NCEA
(parents).
Employers don’t understand NCEA (principals, teachers).
Universities don’t understand NCEA (principals, teachers).
Section 4 explores a range of curriculum and assessment opportunities and issues that have come
into a new focus since the implementation of NCEA. The views of principals and teachers
2 © NZCER

predominate, with trustee views reported where relevant to their role. The statements discussed in
this section are:
The NCEA gives us freedom to design the curriculum how we want (teachers, principals,
trustees).
Assessment is driving the curriculum now, even at Years 9 and 10 (teachers, principals,
trustees).
There is too much assessment now (trustees, parents).
There have been many hidden costs to NCEA implementation (teachers, principals).
NZQA moderation is often unpredictable (teachers) and moderation feedback to the school’s
teachers seems unpredictable (trustees).
Section 5 highlights issues of student motivation and NCEA. The statements discussed here were
addressed by all four groups. They are:
The NCEA motivates underachieving students to do better.
The NCEA motivates high-achieving students to do their best.
Students have too much responsibility for their NCEA choices.
Section 6 reports on two statements that tested the extent of desire for substantive change in the
qualification (as opposed to making ongoing refinements). Again, each statement was addressed
by all four responding groups:
I think we should create another assessment system.
I think we should return to the previous assessment system.
Finally, Section 7 draws NCEA findings together with associated patterns of responses to other
parts of each survey to ponder the extent to which NCEA might be acting as something of a
“lightning rod” for wider discontent with the many changes that have been taking place in
education over the last several decades.
3 © NZCER

4 © NZCER

2. Research methodology
NZCER’s national surveys are carried out at periodic intervals. There are four different surveys in
any one set—for principals, teachers, trustees, and parents. Use of at least some repeat questions
allows changes over time to be documented.
The NCEA questions discussed in this report formed part of one theme (Curriculum,
Assesssment, and ICT) of the NZCER National Survey of Secondary Schools 2006. Material from
this survey has been used in a recent paper on school governance (Wylie 2007), and findings from
the planning and reporting (PAR) section have also been documented alongside findings from a
separate PAR survey of primary schools (Hipkins, Joyce et al. 2007).
In addition to questions about NCEA, principals were asked about: resources and staffing;
planning and reporting; innovations and initiatives; school-wide learning and leadership;
relationships; the board of trustees (BOT); work as a principal; and looking ahead. The survey
was comprehensive and required 80–90 minutes to complete.
Themes in the teachers’ survey were similar with minor modifications to reflect differing
emphases in the different roles. The teacher survey was a little shorter, requiring about 60 minutes
to complete.
Trustees were asked about aspects of their understandings of and support for NCEA, as relevant
to their role. Other themes included: your role as a trustee; funding and resourcing; planning and
reporting; relations with school staff; human resources; contact with parents and the community;
community consultation; BOT capacity, achievements, and issues; and external agencies and role
with schools. This survey required approximately 30 minutes of response time.
Parents were also asked about their understandings of and support for NCEA, and about their
sources of information concerning NCEA. Their survey required about 20 minutes to complete.
The national survey sample
Appendix A sets out the characteristics of secondary schools nationwide and the characteristics of
the 2006 responding schools. It shows that the responding principals and trustees were broadly
representative of all secondary schools, while responses from very large main urban schools were
somewhat overrepresented in the teacher sample.
5 © NZCER

Principals who responded Principals of all state and state integrated secondary schools were invited to participate in the
2006 National Survey.1 The overall response rate for principals was 62 percent,2 from 194 of a
possible 315 secondary schools. As in 2003, more males (72 percent) than females responded,
reflecting gender differences in this role. Most of these principals (90 percent) identified as
Päkehä/European, and 6 percent were Mäori.
Seventeen percent of respondents had become principals in the last two years. A further 23
percent had served between three and five years, 28 percent between six and 10 years, 18 percent
between 11 and 15 years, and 12 percent over 15 years. Compared to 2003, the 2006 profile is
slightly skewed towards more experienced principals.
Teachers who responded One in eight teachers in state and state integrated secondary schools were randomly invited to
participate, with surveys distributed with the help of the PPTA representative and individually
returned (or not) to preserve teacher anonymity. Of the 2061 teacher surveys distributed, 40
percent were returned in a sufficiently completed state to be included. Sixty-two percent of the
respondents were female, which is almost identical to the response profile in 2003 and is
representative of the gender composition of teachers. Eighty-nine percent of the respondents
identified as Päkehä /European, 5 percent identified as Mäori, 3 percent as Asian, and 2 percent as
Pasifika or as “New Zealander” respectively.
Sixty-six percent of the responding teachers had some management responsibility. Five percent
were senior managers, 38 percent were middle managers (e.g., curriculum or faculty leaders), 15
percent held the newly established role of specialist classroom teacher, and 8 percent were deans.
Eight percent of respondents had become teachers in the last two years. A further 14 percent had
served between three and five years, 13 percent between six and 10 years, 10 percent between 11
and 15 years, and 54 percent over 15 years. Compared to the principals, more of the responding
teachers were in younger age groups.
1 By contrast, the NZCER National Survey of Secondary Schools 2003 was based on a random sample of 200 secondary schools, stratified by roll size and decile.
2 This compares favourably with the 48 percent response rate from the smaller overall sample of 200 schools in 2003.
6 © NZCER

Table 1 A comparison of responding teacher and principal age groups
Age of respondents Principals
(n=194) Teachers (n=818)
<30 years 11
30–39 2 19
40–49 22 27
50–59 69 36
60+ 7 6
Note: Numbers may not add to 100 because of rounding.
Trustees who responded Every BOT chair was invited to respond, and to also invite one other trustee, who might be
expected to have a differing viewpoint on some matters, to take part. Again each trustee returned
their completed survey individually. Forty-four percent of a potential pool of 630 trustees
responded (n=278). Just one trustee responded from 76 schools, with two responding, as
requested, from a further 101 schools.
Responding trustees tended to be relatively experienced in the role. The mean length of time as a
trustee was four years. Just 11 percent had been a trustee for less than one year and 36 percent had
served in this role for more than five years. The most common reason for wanting to be a trustee
was to “contribute to the community” (84 percent).
The sample was gender balanced (47 percent female, 53 percent male). Just 6 percent of
respondents were aged under 40, with nearly half (42 percent) 50 or over. Most were Päkehä (84
percent), with 9 percent identifying as Mäori, 2 percent as of Pacific origin, and less than 1
percent as Asian.
Parents who responded Parents from 27 schools were surveyed producing an identical response rate (47 percent) to that of
2003 (n=708). Ninety-five percent of parents currently had one or two children at the school with
71 percent reporting having had a child at the school for two–six years. Twenty-one percent of
respondents indicated they were employed in the education sector.
More females (82 percent) than males (18 percent) responded. Seventy-seven percent of the
respondents identified as Päkehä/European, 12 percent identified as Mäori, 8 percent as “New
Zealander”, 5 percent as Pacific, and 2 percent as Asian.
7 © NZCER

Analysis of the data
Questions about NCEA were mainly in the form of Likert scale responses to statements about
aspects of NCEA. In many cases the same statement was given to all four groups and their
responses are clustered together for ease of comparison. The derivation of these statements is
briefly outlined in each section.
Cross-tabulations with other parts of the surveys were carried out using SAS, and results tested
for significance using chi-squares. Only differences significant at the p < 0.05 level are included.
At the p < 0.05 level, a 1-in-20 chance exists that a difference or relationship as large as that
observed could have arisen randomly in random samples. Tests of significance do not imply
causal relationships, simply statistical association. Although comparison of proportions alone can
seem to show differences, these differences may not be statistically significant once the size of the
group is taken into account. In the report, the term “trend” refers to differences which were just
above the p < 0.05 level, where a larger sample might have revealed them to be significant.
Interpreting the graphs The graphs used in this report display responses to questions that were devised as Likert scales,
measuring agreement or disagreement on a sliding scale. The midline vertical line is centred on
the category on the scale where participants were neutral, unsure, or did not know enough about
the question. Graphs are ordered from responses to which there was greatest agreement at the top
of the graph, to those where greatest disagreement was found at the bottom of the graph. Note that
some items need to be interpreted in reverse—that is, disagreement actually signals support for
NCEA because of the way the statement stem was written.
8 © NZCER

3. Perceptions of NCEA as a qualification
In many ways NCEA departs from, and challenges, traditional high-stakes assessment practice,
even if it is not always as different as people seem to think. Much that was hidden before is now
more transparent and this is challenging. For example, the strategic omission of parts of a
traditional examination was not immediately apparent in the mark gained, whereas strategic
skipping an NCEA external assessment shows up as a “not achieved” for that standard.
The move from traditional and familiar norm-referenced examinations to a more flexible model of
standards-based assessment has required substantial professional learning on the part of all
secondary teachers, in all the following areas:
• developing an understanding of the principles of standards-focused assessment;
• learning to adapt existing tasks and write new tasks for a standards-focused regime;
• learning to make new types of judgments of students’ achievement—rethinking
time-honoured practices for ‘marking’ of students’ work;
• developing a shared professional understanding of standards and learning to use the
moderation processes designed for this purpose; and
• rethinking course designs to accommodate new possibilities that are opening up.
(Hipkins, Vaughan et al. 2004, p.61)
It has been difficult for students, parents, and the public to shift from the seeming objectivity of
percentage scores, that allowed easy comparison between students, to a situation where students
pit themselves against a standard. The meaning of assessment results seems less clear to people,
even though actual learning outcomes are reported in some detail. Arguably this aspect of NCEA
needed to be more carefully explained, since it such a break from the shared experience of so
many people. In view of these and other challenges it seems timely to review perceptions of
NCEA as a qualification. This section reports on responses to the following statements:
I am supportive of NCEA.
The NCEA is a credible qualification in the wider community.
The NCEA is a valuable record of student learning.
Parents don’t understand NCEA (principals, teachers, trustees) and I don’t understand NCEA
(parents).
Employers don’t understand NCEA.
Universities don’t understand NCEA.
9 © NZCER
Support for NCEA
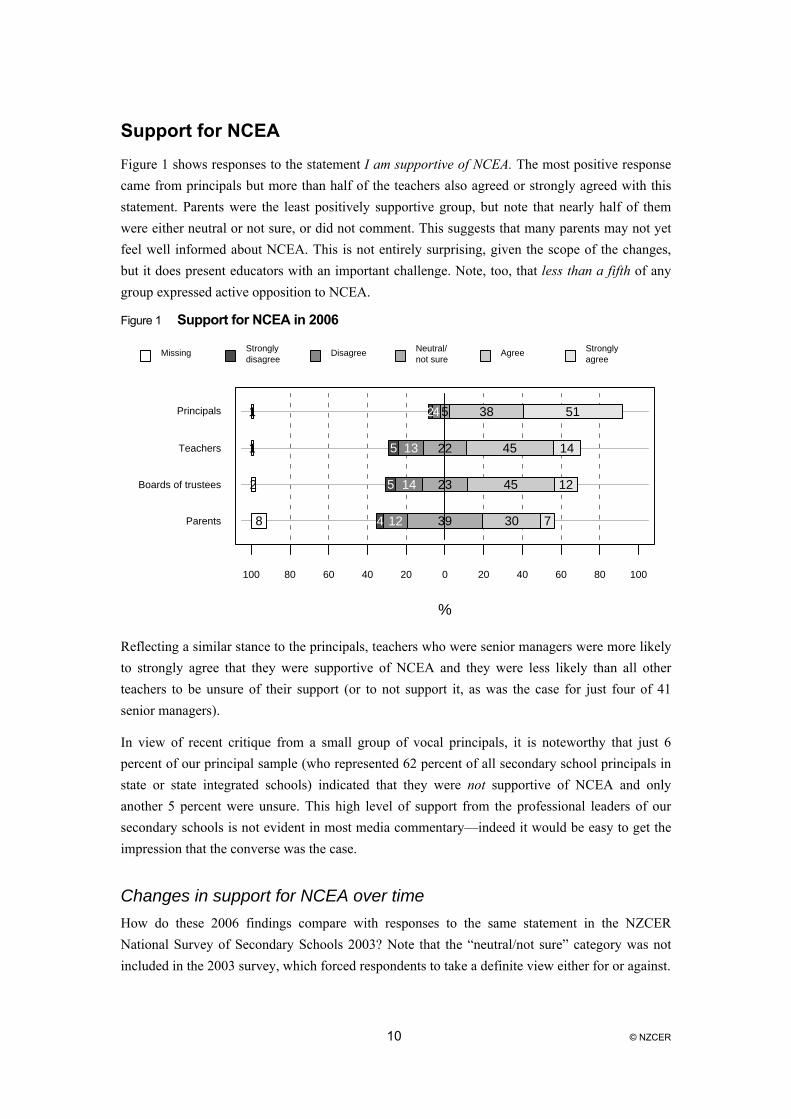
Figure 1 shows responses to the statement I am supportive of NCEA. The most positive response
came from principals but more than half of the teachers also agreed or strongly agreed with this
statement. Parents were the least positively supportive group, but note that nearly half of them
were either neutral or not sure, or did not comment. This suggests that many parents may not yet
feel well informed about NCEA. This is not entirely surprising, given the scope of the changes,
but it does present educators with an important challenge. Note, too, that less than a fifth of any
group expressed active opposition to NCEA.
Figure 1 Support for NCEA in 2006
Principals
Teachers
Boards of trustees
Parents
%
100 80 60 40 20 0 20 40 60 80 100
2
5
5
4
4
13
14
12
5
22
23
39
38
45
45
30
51
14
12
7
1
1
2
8
Missing Stronglydisagree
Disagree Neutral/not sure
Agree Stronglyagree
Reflecting a similar stance to the principals, teachers who were senior managers were more likely
to strongly agree that they were supportive of NCEA and they were less likely than all other
teachers to be unsure of their support (or to not support it, as was the case for just four of 41
senior managers).
In view of recent critique from a small group of vocal principals, it is noteworthy that just 6
percent of our principal sample (who represented 62 percent of all secondary school principals in
state or state integrated schools) indicated that they were not supportive of NCEA and only
another 5 percent were unsure. This high level of support from the professional leaders of our
secondary schools is not evident in most media commentary—indeed it would be easy to get the
impression that the converse was the case.
Changes in support for NCEA over time How do these 2006 findings compare with responses to the same statement in the NZCER
National Survey of Secondary Schools 2003? Note that the “neutral/not sure” category was not
included in the 2003 survey, which forced respondents to take a definite view either for or against.
10 © NZCER
As the next table shows, support from principals has continued at a high level. Furthermore,
significantly more (51 percent) were strongly supportive in 2006, compared to 36 percent in 2003.
By contrast, support from teachers appears to have softened somewhat. This comparison needs to
be treated with caution because 22 percent of teachers indicated they were not sure in 2006—a
response that was not available to them in 2003. Those who were definitely “anti” actually
declined across the three years (24 percent disagreed or strongly disagreed they were supportive
in 2003 compared to 18 percent in 2006).
Table 2 Changes in support for NCEA between 2003 and 2006
I am supportive of NCEA
(agree/strongly agree)
Principals
Teachers
Trustees
Parents
2003 responses 87% (n=95) 65% (n=744) Not asked 44% (n=503)
2006 responses 89% (n=194) 60% (n=818) 58% (n=278) 37% (n=708)
On the face of it, support from parents has also declined somewhat. However, again, the large
“neutral/not sure” category (39 percent!) is where the difference really seems to lie. Whereas 21
percent of 2003 parents disagreed or strongly disagreed that they were supportive, that figure was
18 percent in 2006—very little changed.
Information was not collected for trustees in 2003 so we cannot comment on changes in this
group’s opinions.
Credibility of the qualification
The credibility of NCEA is a high-stakes political issue. The move from a well-established norm-
referenced system for making judgements about learning to a standards-based system has required
a rethinking of some aspects of traditional assessment practice. In reality, achievement standards
represent a somewhat uneasy hybrid of both types of system. Students can be awarded each
individual achievement standards at one of three levels—achieved, merit, or excellence. The
intention was that these should represent qualitatively different levels of achievement of the same
outcome, with words such as “describe”, “explain”, and “discuss” often used to discriminate
between the three levels of performance. Of course such words convey little sense of an actual
achievement level in the absence of a body of examples. Indeed, international assessment expert
Gabrielle Matters notes that three things are necessary to establish a “standard”:
The descriptor of the intended standard (i.e. achievement standards/US statements for
NCEA);
Evidence of learning, in the form of student work, that purports to meet the standard; and
Consensus amongst expert judges that the evidence does indeed meet the standard (Matters
2006, p.21).
11 © NZCER

The second and third of these things could not begin to be accumulated and debated until NCEA-
style assessments actually began, and it has taken time to establish “standards” for each standard.
In the absence of pre-implementation trials, there was a perception of “flip flopping” of pass
levels during the early years of NCEA and this has been an area where the qualification’s
credibility has been called to account. In the past, scaling was used to keep a semblance of
regularity in the standard of examinations from year to year. But this was relatively invisible
whereas the differing proportions of students awarded A/M/E passes for any one standard are a
matter of pubic record. (They are shown in bar-chart format on each student’s record of learning.)
The imperative for greater transparency has been implemented, but the cost may have been an
undermining of faith in the “standard” of the qualification itself—that is, it may be held in lower
esteem than traditional examinations that are actually far less transparent but seem more
straightforward.
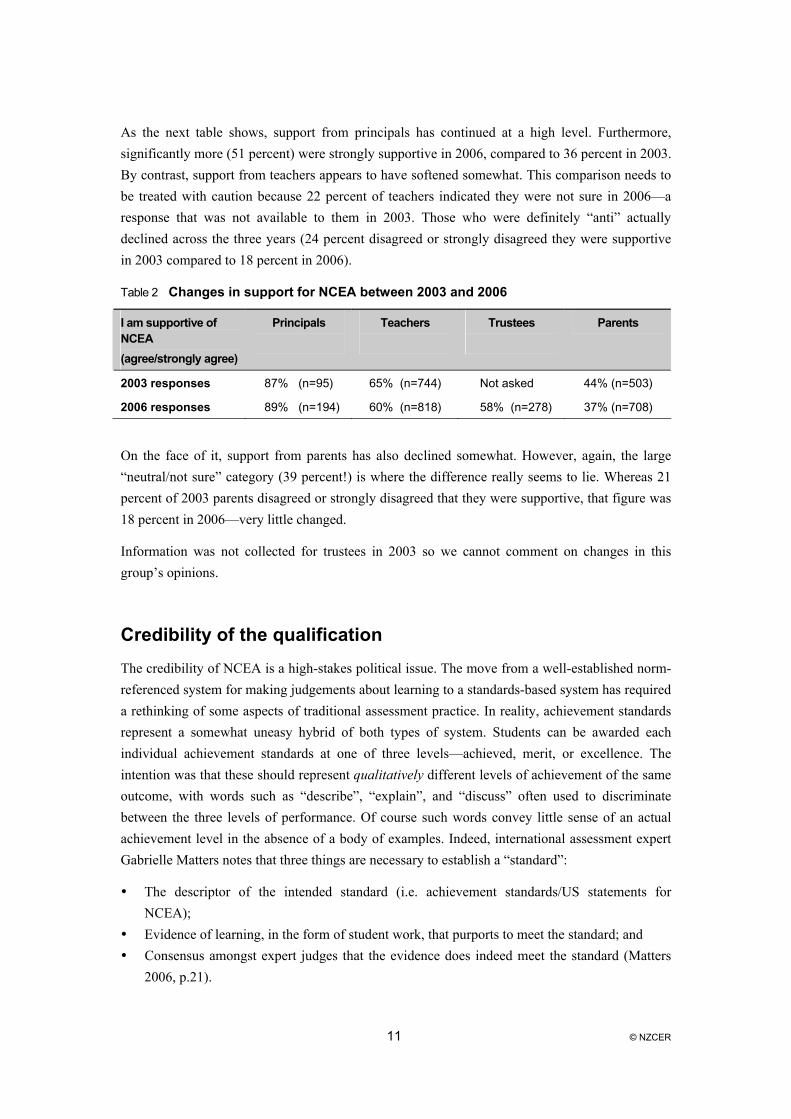
Nearly half the principals believed NCEA was credible in the wider community. Teachers were
the least certain about this statement, with trustees reasonably evenly divided between
uncertainty, and agreement and disagreement concerning NCEA’s credibility. It is interesting that,
again, only half the parents felt able to comment either way.
Figure 2 Responses to the statement The NCEA is a credible qualification in the wider community
Principals
Boards of trustees
Parents
Teachers
%
100 80 60 40 20 0 20 40 60 80 100
3
8
5
7
16
21
15
26
34
30
39
38
38
34
25
24
9
7
5
3
1
1
11
1
Missing Stronglydisagree
Disagree Neutral/not sure
Agree Stronglyagree
Over a third of the participants from all groups did not know what the rest of the community
thought (34–39 percent) and this is probably the most important finding for this statement. Are we
seeing the results of negative media reporting in this uncertainty? Does work need to be done in
this area so that parents and students can be reassured that their qualification will be understood
and valued by those who need to use this information about their learning?
It is interesting that more teachers thought NCEA was not credible than thought it was. We
checked if this view was coloured by concerns about moderation because teachers are the group
most directly involved in this process of checking that judgements made in different schools are
12 © NZCER

equivalent, so that the award of qualifications is fair and consistent across contexts. Cross-
tabulations did indeed show that teachers who disagreed or strongly disagreed that NCEA is a
credible qualification in the wider community were more likely than all other teachers to also
identify “more stability in moderation” as one of the main things they would change about their
work as a teacher. However this was not the only difference between teachers who did and did not
see NCEA as credible, and it would be premature to conclude that this was the causal influence on
their responses. We return to the moderation question in the next section, and overall patterns of
responses in Section 7.
The value of NCEA as a record of learning
All groups were asked to respond to the statement The NCEA is a valuable record of student
learning. Beliefs here are likely to be related to whether qualifications are seen as something that
should competitively sort students or, alternatively, report what each individual student has
achieved. The format of the record of learning is also at issue. In place of one global mark each
student now has multiple records for each subject—one for each standard they have achieved.
More interpretation is required to access the meaning of this record for any specified purpose.
The next figure shows that, again, principals were most likely to agree with the premise that
NCEA is valuable (82 percent), with very little active disagreement (6 percent). Over half the
trustees agreed (53 percent), although we can see that uncertainty is greater. Note that active
disagreement is still relatively low (23 percent here) as it is for teachers and parents. Nevertheless,
teachers and parents were more equivocal, and as for other statements, many parents (42 percent
here) were not sure or did not respond. Again, senior managers were more likely than all other
teachers to agree or strongly agree that NCEA is a valuable record of student learning.
Figure 3 Responses to the statement that The NCEA is a valuable record of student learning
Principals
Boards of trustees
Teachers
Parents
%
100 80 60 40 20 0 20 40 60 80 100
1
6
5
4
5
17
19
14
11
24
29
32
54
46
37
31
28
7
8
7
1
0
2
10
Missing Stronglydisagree
Disagree Neutral/not sure
Agree Stronglyagree
13 © NZCER
There were strong similarities in overall patterns of responses between views of credibility and
the value of NCEA as a record of learning. Almost all teachers who strongly agreed that NCEA is
a credible qualification also strongly agreed that it provides a valuable record of student learning.
The same pattern held in reverse for disagreement.
Almost half (49 percent) of the parents of students in the Competent Learners @ 16 study saw
NCEA as a “better method of assessment” for their child. Almost a quarter (24 percent) did not
(Wylie and Hipkins in press). While the question was shaped somewhat differently, their reasons
for these views help inform the responses being discussed here. The most commonly cited reason
for thinking NCEA was a better way of assessing was that students are able to see their progress
and accumulate credits throughout the year (48 percent). The modular nature of assessment may
lead to more complex records of achievement, but it also allows for this sense of progress to build.
On the other hand, of those parents who disagreed that NCEA is better, 8 percent cited concerns
about course fragmentation. Clearly the issues here are not black and white.
How well is NCEA understood in the wider community?
So far the discussion in this section has highlighted areas where it seems that intended purposes
and design aspects of NCEA may not have been widely understood. This does not mean that no
effort has been made to help people understand, but communication and debate in this area
certainly seems not to have been as effective as might have been intended. Given this level of
debate, how did the survey participants respond to three statements about the understanding of
groups in the wider community potentially impacted by NCEA?
Parents’ understanding of NCEA Responses reported above tend to support the view that parental understanding is a challenge that
remains to be fully addressed. Via their children, NCEA impacts on families. Parents’ perceptions
of the credibility of NCEA will be coloured by their experiences of their children’s experiences,
as well as by media reporting. Earlier NCEA research reported the perception of school
professionals that parents did not understand NCEA. Perhaps unsurprisingly, parents whose
children were more likely to have been successful in the former system were also seen as more
likely to be “hankering back” to that regime (Hipkins, Vaughan et al. 2004, pp.65-67).
With these earlier findings in mind, principals, trustees, and teachers were asked to respond to the
statement Parents don’t understand NCEA. Parents were given a slightly different statement—I
don’t understand NCEA. The next figure shows the combined responses to these statements.
14 © NZCER

Figure 4 Perceptions of parents’ lack of understanding of NCEA
Teachers
Boards of trustees
Principals
Parents
%
100 80 60 40 20 0 20 40 60 80 100
0
2
0
10
9
10
19
31
27
25
23
19
48
47
48
20
15
15
10
10
1
1
1
10
Missing Stronglydisagree
Disagree Neutral/not sure
Agree Stronglyagree
More than half of the principals, teachers, and trustees agreed that parents don’t understand
NCEA, but approximately a quarter of each group were not sure. Interestingly, just 9 percent of
teachers disagreed with the statement. Perhaps they are better placed to judge, since they are more
likely to be in direct communication with a wide range of parents over achievement matters (73
percent of parents said they attended parent/teacher interviews, for example, and this is by far the
most frequently cited form of parental contact with the school).
Even so, “understanding” can be on several levels. It may well be that parents do understand the
“nuts and bolts” of how achievement will be assessed and reported (just 9 percent of parents said
they received poor or very poor information concerning their child’s learning progress, or were
unsure about this) but that they have less understanding of some of the philosophical issues
discussed above. Teasing these differences out would require more fine-grained research.
What we can say is that 41 percent of parents claimed to understand NCEA, and 30 percent
admitted they did not. We were also interested to see whether these perceptions had changed since
2003. The next table shows that parents’ views have remained the same while principals now
have less confidence than teachers that parents understand NCEA.
Table 3 Agreement that parents do not understand NCEA: 2003 and 2006
Parents do not understand NCEA (agree/strongly agree)
Principals
Teachers
Trustees
Parents
2003 responses 52% (n=95) 70% (n=744) Not asked 31% (n=503)
2006 responses 58% (n=194) 63% (n=818) 62% (n=278) 30% (n=708)
Note: Percentages gained by totalling the agree and strongly agree responses together.
15 © NZCER

Only half the parents (50 percent) in 2006 felt the school had kept them well informed about
NCEA, and this has hardly changed since 2003, when 52 percent believed this had been done
well.
Employers’ understanding of NCEA Students in our Learning Curves study expressed considerable anxiety about how well employers
understood NCEA (Hipkins, Vaughan et al. 2005). Those with a high number of unit standards in
their courses were concerned that these might be seen as inferior because they cannot be endorsed
with merit or excellence and so would suffer by comparison with results from achievement
standards. Those with a high number of internally assessed standards were concerned that
externally assessed standards might be seen as harder to gain, and therefore of more merit. A
number of students said they were attempting to accumulate very high credit totals so that they
could create a competitive “point of difference” when seeking employers’ attention—or for
university entrance.
In this current study, 70 percent of principals and 65 percent of teachers thought that employers
did not understand NCEA, and another 20 percent of principals and 29 percent of teachers were
unsure. That very few of either group have any confidence about this suggests it is an issue that
needs to be addressed urgently.
Understanding of NCEA within universities Just as students may need to compete for employment, so some will compete for limited study
places in highly sought after university courses. Even for courses where there is open entry in the
first year of study, students must achieve University Entrance (UE) to be eligible to enrol. Dobric
(2006) suggested that NZQA, as a new agency, posed an initial threat to tertiary institutions, that
considered the application of a “vocational” qualification model to academic qualifications was
inappropriate. One response from the universities was to create a system for UE that is not
identical to a Level 3 NCEA award, even though both are judged on the basis of the same
assessment results, in the same year of school.
In the light of this issue, principals and teachers were asked to respond to the statement
Universities don’t understand NCEA. Just 25 percent of principals and 26 percent of teachers
agreed or strongly agreed with this statement. However, many more were uncertain (40 percent of
principals; 50 percent of teachers), with specialist classroom teachers and classroom teachers
more likely to be unsure than senior staff, middle managers, or deans. Senior managers were
polarised in their views about universities’ understanding of NCEA. They were more likely to
agree or strongly agree (37 percent of them) that university staff do not understand, but they were
also more likely to disagree (39 percent of them) with this statement. It may be that this pattern
reflects their experiences, whether positive or negative, of liaising with universities to ensure
unproblematic transitions for Year 13 students.
16 © NZCER

Why are principals more supportive of NCEA overall?
Principals are the leaders of change in their schools and so are challenged to engage deeply with
the issues it raises. In the NZCER National Survey of Secondary Schools 2003, 13 percent of
principals cited implementation of NCEA as one of their main achievements in the last five years,
but another 3 percent said this was an area in which they had yet to achieve what they wanted.
The 2003 survey was taken in the second year of implementation so these relatively low response
rates to this aspect are interesting. Perhaps, for most principals, this was simply work as usual. A
slightly different set of questions in the 2006 survey reveals a different pattern—one that suggests
deeper engagement with the issues and challenges of NCEA. Frustration at not being able to
achieve what they wanted for NCEA was expressed by 6 percent of principals—double the
number from 2003. On the other hand, 45 percent of principals said they had made improvements
in implementation across the three years and 41 percent said they had sustained high levels of
success with implementation.
Those who had been principals for between three and five years were more likely to say they had
made improvements in the implementation of NCEA. Interestingly, those who had been principals
for 6–10 years were more likely to say they had sustained high levels of achievement in the
implementation of NCEA. This suggests that this group of mid-career principals addressed the
new assessment challenges earlier (or perhaps more comfortably) than did other principals. As
might be expected, new principals (less than two years) were more likely to say they had yet to
achieve what they wanted for NCEA implementation. It takes time to implement sustainable
changes in professional practice, in part because a new school culture must be forged. This cluster
of findings is a reminder that sustainable change takes time, and will occur at a different pace in
different schools.
17 © NZCER

18 © NZCER

4. Impacts of NCEA on curriculum and assessment practice
One of the original and ongoing concerns in NCEA debate has related to the purposes of an
assessment system for senior secondary education. As in all times of rapid social change, the
potential for innovative, forward-looking development exists alongside the powerful lure of the
known and familiar. The NCEA reforms were intended to align assessment for qualifications with
other educational changes related to the rise of what we now call the “knowledge society”. The
idea of equipping students for life in the 21st century requires educators to rethink many aspects
of their work that may have been taken for granted in the 20th century. In his report on NCEA
design, Black (2001) said it was vital to be clear about the purpose and use of assessment and
suggested that curriculum issues should have been debated when reframing the assessment
system. In the event, a revised national curriculum is in the process of being completed in 2007,
having been released in draft form in late 2006. As schools debate challenges for their own
implementation of this new national curriculum, it seems likely that changes to NCEA will need
to be considered afresh.
This section reports on responses to the following beliefs that sit at the intersection of views about
curriculum and assessment:
The NCEA gives us freedom to design the curriculum how we want.
Assessment is driving the curriculum now, even at Years 9 and 10.
There is too much assessment now.
There have been many hidden costs to NCEA implementation.
NZQA moderation is often unpredictable (teachers) and moderation feedback to the school’s
teachers seems unpredictable (trustees).
Overassessment was found to be an issue in the Learning Curves research, and so the principal
and teacher surveys also included items that addressed measures schools could take to address
this. Reponses to these items are also reported in this section.
The potential for curriculum change
The design of NCEA has potentially led to the decoupling of the senior secondary curriculum
from its former tight alignment to examination prescriptions (Bolstad 2006). Because there are so
many standards, courses can be put together in many different ways and no longer is any one
“subject” necessarily the same for all students. A recent survey shows that such innovation is now
widespread in the senior secondary school (Hipkins in press) but greater curriculum flexibility has
19 © NZCER

the contradictory potential to be very innovative or to respond to uncertainty by reinforcing
conservative views of curriculum. How much freedom then, do schools think they have? Three
groups (not parents) were asked to respond to the statement The NCEA gives us freedom to design
the curriculum how we want. As the next figure shows, principals were more likely to be in
agreement with this idea. Many teachers appeared somewhat less convinced, with almost as many
agreeing and disagreeing. Trustees were also divided in their views, with more of them not sure
than in the other two groups.
Figure 5 Perceptions that The NCEA gives us freedom to design the curriculum how we want
Principals
Teachers
Boards of trustees
%
100 80 60 40 20 0 20 40 60 80 100
2
9
5
11
29
27
9
21
29
56
35
34
21
6
3
1
1
2
Missing Stronglydisagree
Disagree Neutral/not sure
Agree Stronglyagree
There were significant links between the perception that NCEA is a barrier to making curriculum
changes, and generally negative views of NCEA. These are explored more fully in Section 7.
Conflation of curriculum and assessment If the main purpose of learning in the senior secondary school is seen as gaining qualifications,
then assessment for these qualifications may become the de facto curriculum. The conflation of
curriculum coverage with high-stakes assessment is not new, nor unique to New Zealand (Hayes,
Mills et al. 2006 describe this tension at work in Australia, for example). However, as long as it
remains unaddressed, many teachers will continue to describe curriculum courses in terms of the
standards used to assess them (Hipkins, Vaughan et al. 2004).
This conflation can lead to widespread overassessment, especially as NCEA replaces one end-of-
year examination (and the relatively small internally assessed course component that was a feature
of some subjects) with a number of assessment events spread through the year, across all three
years of senior secondary school. The consequence is that many students are gaining far more
credits than they need for an NCEA award. Furthermore, it is now common practice for Year 10
students, and in some cases Year 9 students, to be assessed with tasks that have an NCEA format
so that they are familiar with what to expect. However, some schools go further and provide
20 © NZCER

actual NCEA assessments during Year 10. Since students are not permitted to begin accumulating
actual NCEA credits until they are in Year 11, the school “banks” these for documentation at the
appropriate time.
Against this background of constant assessment activity, we asked principals, teachers, and
trustees to respond to the statement Assessment is driving the curriculum now, even at Years 9 and
10. Most teachers agreed (80 percent), as did more than half the principals (66 percent) and
trustees (66 percent).
Figure 6 Response to the statement Assessment is driving the curriculum now, even at Years 9 and 10
Teachers
Principals
Boards of trustees
%
100 80 60 40 20 0 20 40 60 80 100
2
2
0
8
16
11
9
14
23
49
49
53
31
17
12
0
2
1
Missing Stronglydisagree
Disagree Neutral/not sure
Agree Stronglyagree
Parents were asked a respond to the somewhat different, but related, statement—There is too
much assessment now—and this was also included in the trustee survey. Over half the parents (54
percent) did not respond or did not have a view on this matter. Of those who did have a view,
somewhat more disagreed (28 percent) than agreed (20 percent). Half the trustees (48 percent)
agreed or strongly agreed that there is too much assessment and a further 33 percent were unsure
or did not answer the question. This is congruent with their view that assessment is driving the
curriculum.
Designing assessment items to reflect shifts in curriculum While conflation of curriculum and assessment may lead to too much assessment, this does not
necessarily imply that curriculum innovation has been stifled. Other research has suggested that in
subjects where achievement standards were developed to reflect new types of curriculum goals,
there has indeed been considerable change in teaching and learning (Hipkins, Conner et al. 2006).
Something of an assessment-linked shift in curriculum focus could be read into the data reported
next.
21 © NZCER

Between 2003 and 2006 there were increases in the number of teachers reporting a sense of
achievement in the identified aspects of their work, including the design and refining of new
NCEA assessments. The sense here is that, notwithstanding NCEA pressures, changes in teachers’
curriculum focus have been substantial and their professional learning has been considerable.
Table 4 Teachers’ perceptions of main achievements in the last three years
Nature of achievement 2006 responses (n=818)
%
2003 responses (n=744 )
%
Increase in my own knowledge and skills 73 45
Positive/improved learning environment 63 46
Improved teaching programme 57 34
Refining/introducing new NCEA assessments 52 46
Improvements in student achievement 52 30
Improved student assessment for learning 38 18
Implementation of an innovative programme 38 23
Better meeting needs of a particular group 37 25
Involvement of parents with students’ learning 11 3
It may be that teachers were simply feeling more confident and optimistic in the second half of
2006, when the latest survey was taken. On the other hand, the MOE has made a considerable
investment in strengthening secondary teachers’ pedagogical knowledge over this time period,
with the Best Evidence Syntheses (BES) and professional development programmes in areas such
as AtoL (assess to learn), LDPD (literacy professional development across the curriculum), the
numeracy and CAS (algebraic calculator) projects in mathematics, Te Kotahitanga, and so on. It
seems likely that the positive shifts shown in teachers’ views of their main achievements reflect
this refocusing of teaching around better meeting the learning needs of the diverse students now in
our secondary schools. With the stated aims outlined in the introduction to this report, NCEA
arguably has the potential to have contributed to these shifts as new types of assessments have
been designed. Thus it would be a mistake not to take all this change in curriculum focus (both
nationally and as implemented by individual schools and teachers) into account when weighing up
the impact of NCEA. Section 7 returns to this challenge.
To what extent are NCEA/curriculum interactions seen as an issue? In another part of each survey we asked about major issues confronting the school. The next table
shows the extent of explicitly expressed concern about assessment, NCEA, and curriculum
matters. The most commonly reported concern of each group (which happens to be funding in all
four cases) is included on the table to allow for relative comparisons within as well as across
groups. Concerns about student achievement are also included. NCEA and assessment are by no
22 © NZCER

means the only factors that impact on achievement but we did look for connections here and so
the frequency data are included in this table. We discuss achievement issues in Section 5.
Table 5 The extent to which NCEA/curriculum interactions are seen as “major issues”
facing the school
Aspect Principals (n=194)
%
Teachers (n=818)
%
Trustees (n=278)
%
Parents (n=708)
%
Funding 81 53 74 41
Student achievement 60 44 45 37
Assessment workload 55 44 28 15
NCEA workload 46 49 33 21
Assessment driving the curriculum 41 43 17 8
New curriculum framework 28 17 12 7
The table shows relatively higher levels of concern about workload issues amongst teachers and
principals than amongst parents and trustees. This is to be expected since teachers bear the brunt
of actual implementation in the classroom and principals must support them in this as well as lead
and resource change.
Could parents have interpreted these issues in terms of their own children’s experiences, rather
than in terms of the learning needs of whole groups of students? We cannot be sure without finer-
grained research. However, of the 10 percent of parents who agreed or strongly agreed that NCEA
has caused my child too much stress, just under half also identified NCEA workload as an issue.
Interestingly, at a time when the draft of the revised national curriculum was about to be released,
only small numbers of each group seemed to have this on their personal radar as an issue of
concern.
What are schools prepared to do about overassessment?
Several studies have linked teacher concerns about NCEA to issues of increased workload and
stress (Hipkins and Vaughan 2002; Education Review Office 2004; Alison 2005). This issue was
again highlighted in a comprehensive survey of teacher workload issues commissioned by the
MOE in 2004 (Ingvarson, Kleinhenz et al. 2005). This dissatisfaction centred around the
increased paperwork connected with record keeping and moderation, particularly for heads of
departments/faculty leaders, and the time needed to create new assessment resources. However,
the workload report also made the interesting observation that:
Teachers and managers who expressed strong philosophical opposition to NCEA were much
more inclined to resent it as an ‘imposition’ on their workload than those who accepted its
23 © NZCER

approach to assessment and underlying curriculum principles (Ingvarson, Kleinhenz et al.
2005, p.169).
The findings from 2006 clearly indicate ongoing concern about the impact of assessment on
workloads and on curriculum, especially amongst teachers and principals. However the many
associations between dissatisfaction with NCEA and other aspects of teachers’ work, explored in
Section 7, suggest that this caution from Ingvarson’s team is well founded.
As for the view that assessment is driving the curriculum, we see the potential for interesting
contradictions between opinions about additional workloads and about other aspects of NCEA.
The Learning Curves study concluded that there are a number of measures schools could
potentially take immediately to address the issue of overassessment (Hipkins, Vaughan et al.
2004). However, that research also suggested that these measures might not be widely supported
as acceptable solutions, and we wanted to test this out. We asked both teachers and principals to
indicate their school’s stance on a range of actions that could potentially be taken to reduce
overassessment. For each action, we asked for a response on a Likert scale where the positions
that could be taken were: already do; considering; have not considered; wouldn’t do. In this way
we sought indicators of actual change, debate about change, and resistance to change. As for the
statements concerning views of NCEA, responses are reported here by themes, allowing for easier
comparisons between the two groups, but the entire set of responses from each group has been
included in Appendices B–E.
Managing via proactive design measures Students need just 80 credits at Level 1 and 60 at Level 2 and again at Level 3 for NCEA awards.
We have already noted that many students seem to be gaining far more credits than this. Placing a
strict credit limit on individual courses could immediately ameliorate overassessment.
Conversations in the six Learning Curves schools suggested that this action enjoyed support from
principals (Hipkins, Vaughan et al. 2004) but was contentious for some teachers, for reasons we
outline shortly. As the next figure shows, this pattern is confirmed across a wide range of schools,
with 68 percent of principals, compared to 51 percent of teachers, perceiving that the school
already does this or is considering doing so.
24 © NZCER

Figure 7 Principal and teacher views on managing overassessment via course design
Principals: Strict credit limit onindividual courses
Principals: Integrated tasks assessmultiple standards
Principals: Students encouraged toprioritise assessments
Teachers: Integrated tasks assessmultiple standards
Teachers: Strict credit limit onindividual courses
Teachers: Students encouraged toprioritise assessments
%
100 80 60 40 20 0 20 40 60 80 100
14
4
17
9
12
13
16
32
21
34
32
32
38
35
15
28
27
17
30
25
43
23
24
32
2
4
4
5
6
5
Missing Wouldn’tdo
Have notconsidered
Considering Already do
Another possible design measure relates to the flexibility provided if NCEA is used to uncouple
assessment and “subjects” in the senior secondary school. Just as whole courses might be assessed
by standards from different subject domains, there is potential to assess any one task with several
internally assessed standards, again likely to be drawn from different domains. Some research
tasks (say in economics, geography, or a science subject) could be used to assess an aspect of
statistics, for example, and almost certainly could assess expository writing. In this case the
assessment load on individual teachers remains the same, but students would experience less
assessment events overall, and arguably more time would be freed up for teaching and learning.
As Figure 7 shows, principal and teacher views were more closely aligned for this design
measure. While only around a quarter of each group said they already do this, another third were
considering doing so, and few of either group dismissed the possibility outright.
It might at first seem odd to have placed the third item in Figure 7—Students encouraged to
prioritise assessments—under the “design” heading. However, analysis of student focus group
responses in the third year of Learning Curves highlighted the potential for students to actively
design an NCEA award related to the purposes for which they want it, if they are encouraged to
see that they have this flexibility in the choices they make about which of the many assessment
25 © NZCER

opportunities offered to them they will actually take up.3 This represents a real change from the
previous assessment regime, where expert “others” designed a qualification that was the same for
all students, and they in turn measured up to it, or not. With NCEA students can collect credits
from widely varying combinations of achievement standards and unit standards, depending on
their learning goals (for a more detailed discussion see Hipkins, Vaughan et al. 2005) and
evidence suggests schools are taking advantage of this flexibility in their assessment design for
various courses (Hipkins in press).
Framed in this forward-looking way, choosing not to undertake a specific assessment could be a
proactive design choice rather than an issue of work avoidance or crisis management via a spur of
the moment response to assessment pressure (although, as we discuss in Section 5, these are likely
to be driving influences in some cases). Again, Figure 7 shows that principals are more likely to
support this measure than teachers, who as a group hold more conflicted views. This could be
another interesting topic for professional conversations as the new curriculum is implemented.
Managing via the timing of assessments across the years of school The next figure reports responses to several measures that could help manage assessment by
selectively offering assessments to different students at different year levels, rather than offering
all students assessment at every year level in the senior school. The first of these measures—
Credits banked before Year 11 if possible—arguably adds to overall assessment pressures by
moving these down into the lower secondary school, even if it gives students an encouraging
headstart in Year 11. The pattern shown here confirms that this practice is widespread and seen as
broadly acceptable, with just 3 percent of principals and 8 percent of teachers saying their school
would not do this. This will doubtless be a contributing factor to the belief that assessment is
driving the curriculum now “even at Years 9 and 10”.
3 In practice, many aspects of the “shape” of NCEA they gain will be decided by others at the course design stage. The assessments students might choose between are closely tied to the subjects they choose to take (or in which they are placed). The assessment events offered in subjects (including whether achievement standards or unit standards will be used) are determined by teachers.
26 © NZCER

Figure 8 Principal and teacher views on managing the timing of assessments across the years of school
Principals: Credits banked before Year11 where possible
Teachers: Credits banked before Year 11where possible
Principals: Some students not assesseduntil Level 2
Teachers: Some students not assesseduntil Level 2
Principals: Some students not assesseduntil Level 3
Teachers: Some students not assesseduntil Level 3
%
100 80 60 40 20 0 20 40 60 80 100
3
8
37
42
49
51
2
18
49
45
43
40
16
27
13
7
6
2
76
43
0
2
0
1
3
4
1
5
2
6
Missing Wouldn’tdo
Have notconsidered
Considering Already do
Designing NCEA awards for all three levels of senior secondary schooling has been contentious.
On the one hand, it offers the possibility of accessible assessment to students who may aspire to
go no further than Level 1 or 2 before moving into other work or study pathways. This supports
the aim of flexibility in learning and assessment. On the other hand, many students arguably do
not need Level 1 qualifications, or even Level 2, if they have their sights set on university study.
There has been debate about whether one whole level should be removed, and which level this
should be, but with no apparent consensus view, no nationwide change has been made. However,
since there is no “time served” regulation that insists students gain a qualification at one level
before moving to the next, schools need not wait for change to be officially decided, at least in
theory. Nevertheless, Figure 8 indicates a widespread lack of support for taking such measures
unilaterally in individual schools.
Managing the spread of assessments across one year Another timing issue relates to the management of timing of assessments across any one year. We
asked about willingness to place limits on the number of internal and external assessments in any
one subject and the next figure compares these. Both are measures that slightly more teachers
think happen and principals are less willing to consider. The differences are unlikely to be
significant and again doubtless reflect different roles in the school.
27 © NZCER
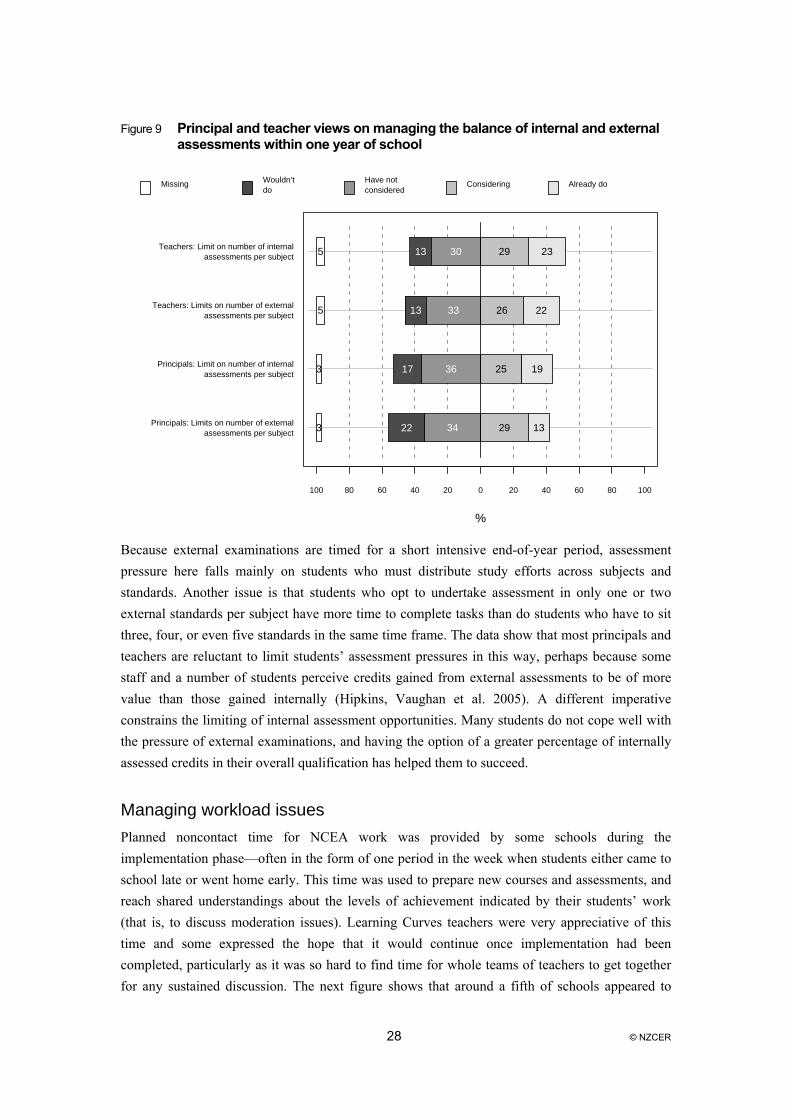
Figure 9 Principal and teacher views on managing the balance of internal and external assessments within one year of school
Teachers: Limit on number of internalassessments per subject
Teachers: Limits on number of externalassessments per subject
Principals: Limit on number of internalassessments per subject
Principals: Limits on number of externalassessments per subject
%
100 80 60 40 20 0 20 40 60 80 100
13
13
17
22
30
33
36
34
29
26
25
29
23
22
19
13
5
5
3
3
Missing Wouldn’tdo
Have notconsidered
Considering Already do
Because external examinations are timed for a short intensive end-of-year period, assessment
pressure here falls mainly on students who must distribute study efforts across subjects and
standards. Another issue is that students who opt to undertake assessment in only one or two
external standards per subject have more time to complete tasks than do students who have to sit
three, four, or even five standards in the same time frame. The data show that most principals and
teachers are reluctant to limit students’ assessment pressures in this way, perhaps because some
staff and a number of students perceive credits gained from external assessments to be of more
value than those gained internally (Hipkins, Vaughan et al. 2005). A different imperative
constrains the limiting of internal assessment opportunities. Many students do not cope well with
the pressure of external examinations, and having the option of a greater percentage of internally
assessed credits in their overall qualification has helped them to succeed.
Managing workload issues Planned noncontact time for NCEA work was provided by some schools during the
implementation phase—often in the form of one period in the week when students either came to
school late or went home early. This time was used to prepare new courses and assessments, and
reach shared understandings about the levels of achievement indicated by their students’ work
(that is, to discuss moderation issues). Learning Curves teachers were very appreciative of this
time and some expressed the hope that it would continue once implementation had been
completed, particularly as it was so hard to find time for whole teams of teachers to get together
for any sustained discussion. The next figure shows that around a fifth of schools appeared to
28 © NZCER
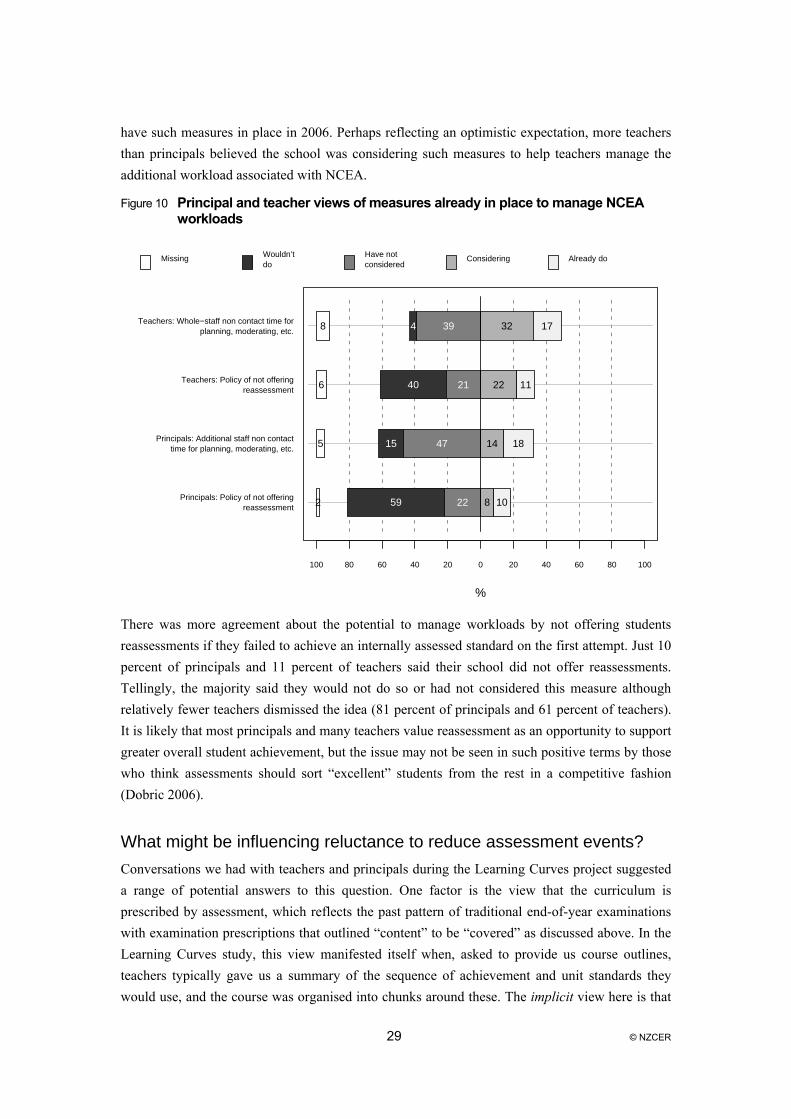
have such measures in place in 2006. Perhaps reflecting an optimistic expectation, more teachers
than principals believed the school was considering such measures to help teachers manage the
additional workload associated with NCEA.
Figure 10 Principal and teacher views of measures already in place to manage NCEA workloads
Teachers: Whole−staff non contact time forplanning, moderating, etc.
Teachers: Policy of not offeringreassessment
Principals: Additional staff non contacttime for planning, moderating, etc.
Principals: Policy of not offeringreassessment
%
100 80 60 40 20 0 20 40 60 80 100
4
40
15
59
39
21
47
22
32
22
14
8
17
11
18
10
8
6
5
2
Missing Wouldn’tdo
Have notconsidered
Considering Already do
There was more agreement about the potential to manage workloads by not offering students
reassessments if they failed to achieve an internally assessed standard on the first attempt. Just 10
percent of principals and 11 percent of teachers said their school did not offer reassessments.
Tellingly, the majority said they would not do so or had not considered this measure although
relatively fewer teachers dismissed the idea (81 percent of principals and 61 percent of teachers).
It is likely that most principals and many teachers value reassessment as an opportunity to support
greater overall student achievement, but the issue may not be seen in such positive terms by those
who think assessments should sort “excellent” students from the rest in a competitive fashion
(Dobric 2006).
What might be influencing reluctance to reduce assessment events? Conversations we had with teachers and principals during the Learning Curves project suggested
a range of potential answers to this question. One factor is the view that the curriculum is
prescribed by assessment, which reflects the past pattern of traditional end-of-year examinations
with examination prescriptions that outlined “content” to be “covered” as discussed above. In the
Learning Curves study, this view manifested itself when, asked to provide us course outlines,
teachers typically gave us a summary of the sequence of achievement and unit standards they
would use, and the course was organised into chunks around these. The implicit view here is that
29 © NZCER

the purpose of learning in the senior secondary school is to gain qualifications. Asked to articulate
other purposes for learning specific subjects, some Learning Curves students were simply at a loss
to think of anything beyond the most obvious of connections, such as that English allows you to
communicate with others (Hipkins and Vaughan 2002). Making other purposes for learning more
explicit is a challenge that could be taken up as the new curriculum is implemented.
Limiting assessment events will not be popular amongst teachers who fear loss of motivation if
Moderation as part of the assessment process
tion 3 reported that
In the PPTA commissioned report, Teachers Talk About NCEA, Alison (2005) reported that
es some teachers told us of tasks that had been collaboratively
students cannot directly see a credit reward for their efforts. This reasoning is not new of course.
Teachers have always used the prospect of gaining qualifications as a means of creating a sense of
purpose for learning, especially where more immediate links to life contexts are not so apparent.
What is new is that this pressure extends across the whole learning year, whereas previously the
emphasis on preparing for assessment would have been more apparent as examinations loomed.
Another new aspect is that credits may be dangled constantly as a “carrot” and indeed this has
been done so enthusiastically that many teachers now believe they will not be able to interest
students in any learning that does not attract a credit reward (Hipkins, Vaughan et al. 2004; Alison
2005).
We now turn to an issue that has been mentioned several times in passing. Sec
even those teachers who are largely positive about NCEA have issues with external moderation—
an important quality assurance component of NCEA design. Moderation takes two forms.
Teachers submit tasks they have designed, to gain approval that these are appropriate to assess
what is intended. They also submit a sample of student work, assessment schedules, and grades
allocated when requested to do so.
external moderation lacked credibility for the majority of teachers because of inconsistencies in
moderator judgements, pettiness by some moderators, and inadequate and mistrusted processes
for appeal. She reported that teachers did not have confidence in the rigor of the system and
wanted a more stringent system.
During the Shifting Balances studi
prepared for submission to different local moderators. If these identical tasks and assessment
schedules were returned with differing judgements about their suitability, these teachers
understandably felt aggrieved. We commented on the emotive terms in which they expressed their
feeling about this situation. It seems to strike right at the core of a view of oneself as a competent
teacher (Hipkins, Conner et al. 2006). A different issue can arise with post-assessment
moderation. In the early stages of implementation, teachers were encouraged to select borderline
examples so that the second opinion of the moderator could help them strengthen their
understanding of where the standard lay. However, some NCEA critics saw the relatively high
numbers of changes recommended as evidence that teachers had not been exercising good
30 © NZCER

judgement. Consequently, many teachers began to limit their professional risk by sending in
examples where they were more certain of their judgement, missing an important professional
learning opportunity in the process. This aspect has also been modified in 2007 and teachers will
now be asked to submit a random sample of work, and the percent of work sampled will also
increase.
Against this background of rumbling controversy, teachers were asked to respond to the statement
Sources of advice and support for teachers’ work t timely advice and support
NZQA moderation feedback is often unpredictable. Nearly two-thirds (62 percent) agreed or
strongly agreed. Just 11 percent disagreed or strongly disagreed and the rest were unsure. Trustees
responded to a similar statement: Moderation feedback to the school’s teachers is often
unpredictable. Over half (55 percent) did not know, but 32 percent agreed with the statement.
Parents’ and principals’ views on this issue were not sought.
The next figure shows teachers’ responses to the statement I can ge
from…. Half the teachers got advice from their local subject association, but another third were
unsure—perhaps because they had no contact with such a group, if indeed it existed and held
meetings nearby. It is concerning that close to half the teachers did not know whether timely
advice and support could be provided by any of the other three groups, and that less than a fifth of
the teachers were confident they could access such support from NZQA or the moderators it
employs.
Figure 11 Teachers’ views of their access to support for professional matters
Timely advice, appropriate support fromlocal subject association
Timely advice, appropriate support fromSchool Support Services advisers
Timely advice, appropriate support fromNCEA moderator(s)
Timely advice, appropriate support fromNZQA staff
100 80 60 40 20 0 20 40 60 80 100
3
4
9
7
7
9
20
17
34
46
45
50
35
27
20
18
15
9
1
3
6
5
4
4
Missing Stronglydisagree
Disagree Neutral/not sure
Agree Stronglyagree
%
Differing perceptions were associated with holding a different role. Senior managers were more
likely to agree they could get timely advice and support from NZQA staff. Middle managers, who
are responsible for subject leadership and for ensuring moderation processes take place
appropriately, were more likely to disagree they could get timely advice and support from their
NCEA moderator, but also to strongly agree that such advice was forthcoming from School
31 © NZCER

Support staff. Middle managers were also more likely to acknowledge the support of their subject
association, where teachers who were not managers were more likely to be unsure if they could
access support from this source.
Perceptions of time demands ime-consuming process that adds to other For curriculum leaders, moderation can be a t
management demands. Within-school moderation is important for consistency of judgements and
then there is the administration associated with external moderation. The necessary
documentation must be requested from other teachers, assembled, and sent. Feedback must be
considered and discussed and appropriate action taken. Examples of student work must be filed
and stored according to the school’s overall NCEA management policy. As the next figure shows,
around a third of the teachers found the time needed for these activities to be burdensome. A
similar number felt the same way about data required for within-school accountability procedures.
Figure 12 Teachers’ responses to time demands of some administration/accountability tasks
Takes too much time to adapt andassemble information required by NCEA
moderator(s)
Takes too much time to adapt andassemble information required by NZQA
staff
Takes too much time to adapt andassemble information required by school
management
100 80 60 40 20 0 20 40 60 80 100
1
1
3
20
11
31
35
47
36
26
25
20
12
10
5
5
7
6
Missing Stronglydisagree
Disagree Neutral/not sure
Agree Stronglyagree
%
Interestingly, senior managers were more likely than middle managers or other teachers to say it
takes too much time to assemble information required by NZQA. These senior managers were
polarised over the question of whether it takes too much time to assemble information required by
NCEA moderators. Whereas the views of middle managers were spread across the full spectrum
of responses, and other teachers were more likely to be neutral/unsure, senior managers were
more likely than all other teachers to either strongly agree or to disagree with this statement. It
seems surprising that more senior managers thought moderation takes too much time, given that it
is middle managers who bear the brunt of this administration. On the other hand, middle managers
were more likely to agree it takes too much time to assemble information required by the school’s
management! It may be that these middle managers are more likely to see professional benefits
for the effort expended in gathering moderation data, but we cannot be sure without finer-grained
research.
32 © NZCER
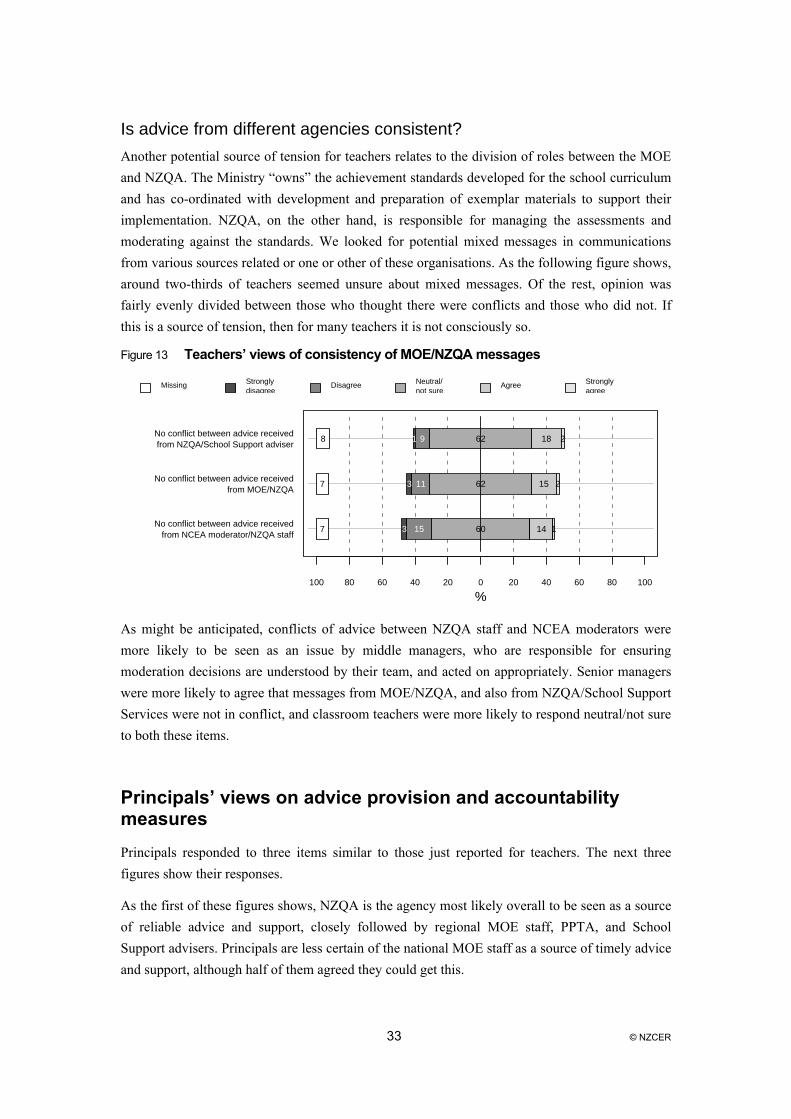
Is advice from different agencies consistent? Another potential source of tension for teachers relates to the division of roles between the MOE
and NZQA. The Ministry “owns” the achievement standards developed for the school curriculum
and has co-ordinated with development and preparation of exemplar materials to support their
implementation. NZQA, on the other hand, is responsible for managing the assessments and
moderating against the standards. We looked for potential mixed messages in communications
from various sources related or one or other of these organisations. As the following figure shows,
around two-thirds of teachers seemed unsure about mixed messages. Of the rest, opinion was
fairly evenly divided between those who thought there were conflicts and those who did not. If
this is a source of tension, then for many teachers it is not consciously so.
Figure 13 Teachers’ views of consistency of MOE/NZQA messages
No conflict between advice receivedfrom NZQA/School Support adviser
No conflict between advice receivedfrom MOE/NZQA
No conflict between advice receivedfrom NCEA moderator/NZQA staff
%100 80 60 40 20 0 20 40 60 80 100
1
3
3
9
11
15
62
62
60
18
15
14
2
2
1
8
7
7
Missing Stronglydisagree
Disagree Neutral/not sure
Agree Stronglyagree
As might be anticipated, conflicts of advice between NZQA staff and NCEA moderators were
more likely to be seen as an issue by middle managers, who are responsible for ensuring
moderation decisions are understood by their team, and acted on appropriately. Senior managers
were more likely to agree that messages from MOE/NZQA, and also from NZQA/School Support
Services were not in conflict, and classroom teachers were more likely to respond neutral/not sure
to both these items.
Principals’ views on advice provision and accountability measures
Principals responded to three items similar to those just reported for teachers. The next three
figures show their responses.
As the first of these figures shows, NZQA is the agency most likely overall to be seen as a source
of reliable advice and support, closely followed by regional MOE staff, PPTA, and School
Support advisers. Principals are less certain of the national MOE staff as a source of timely advice
and support, although half of them agreed they could get this.
33 © NZCER

Figure 14 Principals’ views of their access to support for professional matters
NZQA staff
MOE staff (local/regional)
PPTA staff
School Support Services advisers
ERO
MOE staff (national office)
Group Special Education
Teachers’ Council
CYFS
%
100 80 60 40 20 0 20 40 60 80 100
1
2
4
2
3
3
8
9
19
7
11
5
6
9
15
21
39
30
16
14
20
24
28
28
23
30
30
61
53
55
48
52
42
35
19
18
14
19
13
16
7
8
11
1
1
Stronglydisagree
Disagree Neutral/not sure
Agree Stronglyagree
Figure 15 Principals’ responses to time demands of some administration/accountability tasks
MOE staff (national office)
ERO
NZQA staff
Teachers’ Council
Group Special Education
MOE staff (local/regional)
CYFS
School board of trustees
%
100 80 60 40 20 0 20 40 60 80 100
2
4
2
3
2
2
3
9
15
23
23
18
26
31
21
53
18
17
24
32
36
33
45
19
44
32
40
31
23
24
22
15
19
21
10
13
8
6
4
1
3
3
2
3
5
4
5
3
Missiing Stronglydisagree
Disagree Neutral/not sure
Agree Stronglyagree
The figure above shows that gathering information required by MOE national office is the activity
of this type that principals are most likely to perceive (63 percent) as taking too much time.
Around half the principals also perceived that it takes too much time to assemble information for
ERO or for NZQA. By contrast, very few of them (16 percent) see assembling information for
34 © NZCER
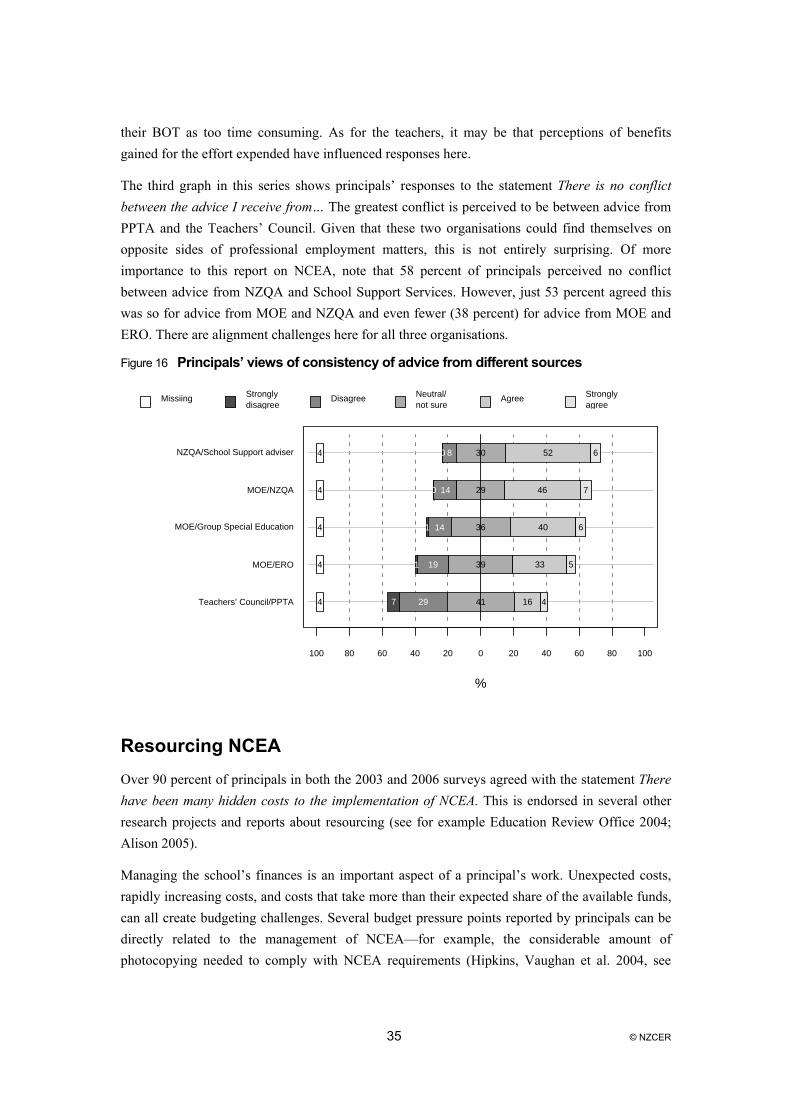
their BOT as too time consuming. As for the teachers, it may be that perceptions of benefits
gained for the effort expended have influenced responses here.
The third graph in this series shows principals’ responses to the statement There is no conflict
between the advice I receive from… The greatest conflict is perceived to be between advice from
PPTA and the Teachers’ Council. Given that these two organisations could find themselves on
opposite sides of professional employment matters, this is not entirely surprising. Of more
importance to this report on NCEA, note that 58 percent of principals perceived no conflict
between advice from NZQA and School Support Services. However, just 53 percent agreed this
was so for advice from MOE and NZQA and even fewer (38 percent) for advice from MOE and
ERO. There are alignment challenges here for all three organisations.
Figure 16 Principals’ views of consistency of advice from different sources
NZQA/School Support adviser
MOE/NZQA
MOE/Group Special Education
MOE/ERO
Teachers’ Council/PPTA
%
100 80 60 40 20 0 20 40 60 80 100
0
0
1
1
7
8
14
14
19
29
30
29
36
39
41
52
46
40
33
16
6
7
6
5
4
4
4
4
4
4
Missiing Stronglydisagree
Disagree Neutral/not sure
Agree Stronglyagree
Resourcing NCEA
Over 90 percent of principals in both the 2003 and 2006 surveys agreed with the statement There
have been many hidden costs to the implementation of NCEA. This is endorsed in several other
research projects and reports about resourcing (see for example Education Review Office 2004;
Alison 2005).
Managing the school’s finances is an important aspect of a principal’s work. Unexpected costs,
rapidly increasing costs, and costs that take more than their expected share of the available funds,
can all create budgeting challenges. Several budget pressure points reported by principals can be
directly related to the management of NCEA—for example, the considerable amount of
photocopying needed to comply with NCEA requirements (Hipkins, Vaughan et al. 2004, see
35 © NZCER

p.61). The next table shows the extent to which principals perceived these budgetary pressures to
be in evidence in their schools.
Table 6 Principals’ perceptions of NCEA-related budget pressure points
Frequency of responses to three items (n=194) Budget pressure point
Unexpected extra cost %
Cost that increased rapidly
%
Large proportion of the overall budget
%
Admin support staff 20 27 40
Photocopying 11 35 17
NCEA compliance and moderation 10 22 10
At 35 percent, the rapid increase in photocopying costs was one of the three most frequently
reported cost escalations. (Increases in costs of IT maintenance and the coverage of teachers’
noncontact hours were also reported by 35 percent of respondents.) Obviously not all extra
photocopying or administration support time will be directly attributable to NCEA requirements,
but earlier NCEA research predicts this shift. It also aligns with the reported rapid increase in
NCEA compliance costs. That just 10–11 percent of principals had not expected these increases
suggests that most had anticipated that they would need to set aside more resources for
photocopying and administration support than in the past.
In view of these cost escalations, it is worth asking “What gives?” Principals were also asked
about what they would be likely to cut to manage the budgetary pressures. Few thought they could
make cuts in these areas directly (administration support, 5 percent; photocopying, 4 percent;
NCEA compliance and moderation, 3 percent). Rather, cuts were most likely to be made to
maintaining class sizes (16 percent), teacher aide time (13 percent), planned school initiatives (12
percent), or property development (11 percent). It is concerning that these are all likely to impact
directly on the quality of the students’ classroom learning experiences.
36 © NZCER

5. NCEA and student motivation
One of the explicit aims of NCEA was to allow greater numbers of students to be rewarded for
their learning successes rather than being given premature messages that they were learning
“failures” (Dobric 2006). There is evidence that this policy objective is meeting with some
success, with greater numbers of students gaining qualifications, and moving on to post-school
study pathways (Phillips 2007). The most recent findings from the Competent Learners @ 16
study provide encouraging evidence that “lower achiever” students are being given more
opportunities than in the past to experience success in gaining qualifications from their learning,
even if they take two years to gain an NCEA award. It is of particular interest that the “percentage
achieved” success rate of the students taking less traditional subject combinations is almost as
high as for those in the two more traditional academic clusters (Wylie and Hipkins 2006).
Nevertheless, concerns have continued to be expressed about the impact of NCEA design on
students’ motivation to learn, especially for higher achievers who are motivated by the
competitive element in traditional assessments (Meyer, McClure et al. 2006). This highlights
several tensions to be managed. First, different learners have different needs and so motivation
issues may be experienced differently by them. Also, this is an area where assumptions about
purposes for learning and the nature of evidence that learning has occurred can impact on how
observed behaviours are interpreted. Care and caution are needed when determining what reported
data actually mean.
In the light of this caution, this section explores how motivation issues were seen to be playing
out in the second half of 2006 when the survey was completed. Reponses to the following Likert
scale items are reported:
The NCEA motivates underachieving students to do better.
The NCEA motivates high-achieving students to do their best.
Students have too much responsibility for their NCEA choices.
To some extent, events have overtaken these findings, with changes to NCEA design announced
in 2007. These will be further discussed shortly.
Motivating lower achievers
Zepke and colleagues (2006), in a comprehensive synthesis of the research literature, outlined the
pros and cons of standards-based assessment. They found, overall, more advantages than
disadvantages. Some of the advantages of a qualification system based on competency-based
assessment such as NCEA, particularly for low-achieving students, are that students:
37 © NZCER

have more choice and flexibility about what they were learning.
can choose subjects more relevant to a particular vocation.
experience more possibilities for skill-based learning as well as theoretical or “higher order”
learning.
can more easily manage learning in modularised units of work.
are motivated to achieve as their credits build up.
This is a strong set of theoretical advantages, but how are these good intentions working out in
practice? All participants in the survey were also asked to respond to the statement The NCEA
motivates underachieving students to do better. The next figure shows their views.
Figure 17 Impact of NCEA on motivation of lower achievers
Principals
Teachers
Boards of trustees
Parents
%
100 80 60 40 20 0 20 40 60 80 100
3
12
10
7
9
29
29
19
12
17
28
37
61
37
28
22
14
5
3
5
1
1
1
10
Missing Stronglydisagree
Disagree Neutral/not sure
Agree Stronglyagree
Principals were most strongly in agreement with this statement (75 percent agreed or strongly
agreed). Teachers were divided in their views, with as many disagreeing as agreeing, and 17
percent unsure. Trustees’ responses were divided in much the same way but more of them were
unsure. As for other items in the survey, parents showed the highest levels of uncertainty with
nearly half (47 percent) not sure or not commenting, and only a quarter prepared to state a yes or
no opinion on this.
Possible impacts on teachers’ views Why are views so divided amongst all but the principals’ group? It seems likely that the answer to
this question will turn on the ways student behaviour is interpreted and the inferences made on the
basis of observed choices and behaviours. Care is needed here that NCEA is not blamed unfairly
when engagement in learning emerges as an issue. The recently completed analysis of data from
38 © NZCER

the Competent Learners @ 16 research reported that engagement at school was indeed strongly
correlated with NCEA achievement4 but also described other important influences:
Levels of engagement in school, and feeling affirmed at school have moderate to strong
correlations, yet they remain distinct. Both have similar levels of association with student
reports of positive classroom learning activities and relations with their teachers; their being
absorbed in learning and their attitude to work, with reasonably similar levels between
student and teacher views. This pattern suggests that both dimensions are important when it
comes to student openness to their learning opportunities, and willingness to make an effort
(Wylie and Hipkins in press, p.38).
The support of the teacher and the quality of the learning experience are highlighted here. Other
research suggests that enhanced success for lower achievers will have come from focusing more
on internally assessed standards (Hipkins, Vaughan et al. 2004; Meyer, McClure et al. 2006) and
many of these are likely to be unit standards because they cover a wider range of assessment
focuses than the more academically oriented achievement standards. This can be seen as a means
of limiting less-confident students’ exposure to external examinations, keeping assessment events
closer to their learning, and making the curriculum more relevant to their lives and aspirations
(Hipkins, Vaughan et al. 2005; Zepke, Leach et al. 2006).
Such considerations stand in contrast to those who associate gaining predominantly unit
standards-sourced credits with “work avoidance” because they seem to see unit standards as an
inferior assessment option (Meyer et al., 2006). Paul Black warned of this possibility if two
pathways through NCEA were kept, saying that NCEA structure per se would not be sufficient to
overcome a strongly entrenched academic/vocational binary in society at large (Black 2001). The
more negative response from some teachers may be linked to being unhappy with the recent
broadening of the curriculum generally, away from a narrower range of more traditional
“academic” learning outcomes that competitively sort students by ranked ability. The next section
returns to this possibility, exploring the likelihood that NCEA is acting as a “lightning rod” for
more widespread dissatisfactions with contemporary education trends and developments.
Possible impacts on parents’ views The Competent Learners @ 16 research reported that parents of lower achieving students, who
themselves had often been lower achievers at school, were more likely than other parents to agree
that their child would do the bare minimum to gain credits, or go for credits that are easy to get
(Wylie and Hipkins in press, p.117). If motivation is seen in these narrower extrinsic terms, and
learning is seen as no more meaningful than a means to an arbitrary end (gaining credits) then this
view is understandable. It may be that some parents are better able to see wider purposes and
connections in their child’s learning than others. Wylie and Hipkins provide evidence that student
enjoyment is higher when learning is connected with the world beyond school, so the challenge
4 Specifically the number of Level 1 NCEA credits gained to the date of the fieldwork in Year 11 or Year 12.
39 © NZCER

here would seem to be to help teachers, parents, and students look beyond NCEA per se when
considering motivation issues.
Motivating high achievers
Alison (2005) reported early concerns that credit accumulation could limit the quality of learning
for some students if they took the view that “achieved is good enough” and that reaching the 80
credit requirement could encourage some students to cease making an effort. This concern is
obviously related to those discussed above in that there is an underlying assumption that gaining
qualifications is the primary means of giving direction and purpose to learning. Alison did
acknowledge that this is not always the case. She also reported that the highest achieving students
continued to be motivated to work for excellence, and NCEA was extending and challenging them
(Alison 2005). Over time this view appeared to wane somewhat, and the Meyer report was
influential in persuading the MOE that motivation of higher achievers was an issue it needed to
address (Meyer, McClure et al. 2006). The data reported next show considerable support for this
view. All participants were asked to respond to the statement The NCEA motivates high achieving
students to do their best.
Figure 18 Impact of NCEA on motivation of higher achievers
Principals
Parents
Boards of trustees
Teachers
%
100 80 60 40 20 0 20 40 60 80 100
15
9
18
26
28
20
37
37
18
31
22
15
33
19
19
17
6
9
4
4
1
11
0
1
Missing Stronglydisagree
Disagree Neutral/not sure
Agree Stronglyagree
There is seemingly much more concern about the impact of NCEA on motivation of higher
achievers. Just 39 percent of principals agreed or strongly agreed that NCEA motivates this group,
compared to the 75 percent who saw NCEA as motivating lower achieving students to do better.
Trustees were also somewhat less likely to agree NCEA motivates higher achievers (21 percent
compared to 31 percent for lower achievers). Parents’ views were little changed (28 and 27
40 © NZCER

percent agreement respectively). Exactly half the number of teachers agreed with this statement
(21 percent) as agreed NCEA could motivate lower achievers (42 percent).
Developments in 2007 As this report was being prepared the MOE announced changes to allow NCEA certificates to be
endorsed with merit or excellence if sufficient overall credits were achieved at these levels. This
is a direct response to concerns such as those that lie behind the pattern of responses here, and as
supported by other research. It seems important, however, to make a careful distinction between
extrinsic and intrinsic motivation—particularly if a disposition for ongoing learning is seen as an
outcome of schooling that is worth fostering.
In the light of this observation, it is interesting that the parents of the Competent Learners @ 16
sample who had the most positive attitudes toward school were also the most likely to report that
their child would always strive for merit or excellence in NCEA assessments, and that they would
work hard regardless of whether the topic was assessed or not (Wylie and Hipkins in press, p.118-
9).
Student choice
With the implementation of NCEA, students have been granted increased agency to make
assessment choices, at least in theory. In the Learning Curves project, many students saw
choosing to skip as a legitimate strategy for managing overassessment, or for avoiding the
likelihood of failure or potentially embarrassing assessments such as speeches in English. Early in
the implementation phase, some teachers were already concerned that students could choose to
skip assessments (Hipkins, Vaughan et al. 2004). However, other teachers actively helped
students decide which assessments to skip as a means of managing their workloads. This
highlights the question of how strategic students are in the skipping decisions they make. The
Learning Curves project found that the students taking courses weighted towards traditional
subjects were more likely to be strategic while those taking contextual or vocational combinations
were more likely to make ad hoc decisions, or to not be in command of their credit totals at all. It
seemed that different groups of students actively participated in the production of quite different
types of NCEA qualifications, with associated differences in the “learning pathways” they kept
open (Hipkins, Vaughan et al. 2005).
Against this background, the national survey asked for responses to the statement Students have
too much responsibility for their NCEA choices. The next figure shows there was not a great deal
of support for this view, although around a third of each group were unsure.
41 © NZCER

Figure 19 Perceptions that students have too much responsibility for their NCEA choices
Teachers
Boards of trustees
Principals
Parents
%
100 80 60 40 20 0 20 40 60 80 100
3
3
6
5
30
36
49
29
37
32
28
40
22
21
14
11
6
5
2
2
3
3
1
14
Missing Stronglydisagree
Disagree Neutral/not sure
Agree Stronglyagree
This time, teachers were the group most likely to agree (albeit just 28 percent of them),
presumably because they need to negotiate internal assessments with students.
It is interesting that just 14 percent of parents actively perceived that their child had been given
too much responsibility for their NCEA choices while 35 percent disagreed.
Note, however, that when missing data are added to neutral/not sure responses, more than half the
parents did not have a view one way or the other. As in so many other aspects of NCEA, they
could benefit from opportunities to discuss such “bigger picture” NCEA questions and issues.
42 © NZCER

6. The future of NCEA
Brooking (2006) found that while there was a lot of criticism generally about NCEA and the New
Zealand Qualifications Framework at the time of the implementation of NCEA, no viable
alternative qualification structure was suggested. Against this background, participants in the
2006 national surveys were asked to comment on two future-scenario statements concerning the
continued acceptance and use of NCEA as a national qualification:
I think we should create another assessment system.
I think we should return to the previous assessment system.
Do people want another new system?
In spite of the criticisms and disagreements described in the earlier sections of this report, the
majority of survey respondents disagreed with the statement I think we should create another
assessment system. Congruent with their high levels of support for NCEA, most principals were
opposed, and fewer of them were unsure. Again, as for earlier items, just under half the parent
group were unsure. Teachers were the group most likely to agree, but at 27 percent, this could
hardly be described as a strong mandate for change, particularly as 46 percent disagreed.
Figure 20 Support for the development of a new qualifications system
Teachers
Boards of trustees
Parents
Principals
%
100 80 60 40 20 0 20 40 60 80 100
20
26
12
50
26
35
23
27
26
23
41
11
17
13
8
7
10
3
5
3
1
1
11
2
Missing Stronglydisagree
Disagree Neutral/not sure
Agree Stronglyagree
43 © NZCER

Is there a desire to return to the previous system?
Another possibility is that people who are not supportive of NCEA would prefer to return to the
more familiar procedures of the assessment system that was replaced by NCEA. We tested
support for this prospect by asking for responses to the statement I think we should return to the
previous assessment system.
The responses show even less appetite for this sort of change than for designing another new
system. Of the four groups, only parents were more likely to agree, although still only around a
quarter of them (23 percent wanted to go back, compared with 13 percent who wanted ongoing
change). This is congruent with their uncertainty about many aspects of NCEA—by contrast the
previous examination system is one that many parents would have directly experienced. Teachers
on the other hand were more likely to disagree with this idea (17 percent wanted to go back,
compared with 27 percent who wanted a new system). Principals’ and trustees’ views were much
the same for both statements.
Figure 21 Support for a return to the previous system
Parents
Teachers
Boards of trustees
Principals
%
100 80 60 40 20 0 20 40 60 80 100
7
24
21
66
19
30
37
21
39
28
27
8
13
11
10
4
10
6
4
1
11
1
1
0
Missing Stronglydisagree
Disagree Neutral/not sure
Agree Stronglyagree
If there is little appetite for either of these proposals, then there is a clear need to address ongoing
issues with NCEA itself, and some of these have been highlighted in previous sections. However,
doing so will not necessarily afford greater acceptance amongst those who are broadly opposed to
NCEA as a qualification. Another interesting possibility emerged during the analysis of these
responses—opposition to NCEA may be symptomatic of other discontents, for which NCEA has
acted as something of a lightning rod. That possibility is interrogated next.
44 © NZCER
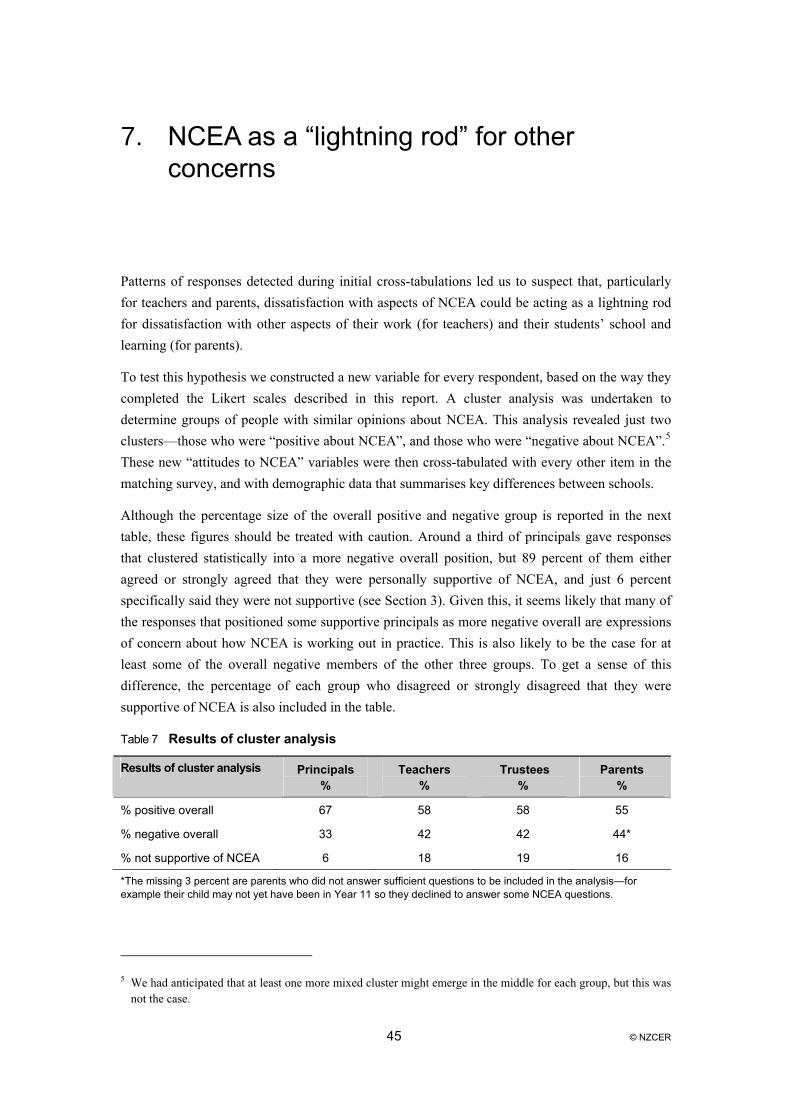
7. NCEA as a “lightning rod” for other concerns
Patterns of responses detected during initial cross-tabulations led us to suspect that, particularly
for teachers and parents, dissatisfaction with aspects of NCEA could be acting as a lightning rod
for dissatisfaction with other aspects of their work (for teachers) and their students’ school and
learning (for parents).
To test this hypothesis we constructed a new variable for every respondent, based on the way they
completed the Likert scales described in this report. A cluster analysis was undertaken to
determine groups of people with similar opinions about NCEA. This analysis revealed just two
clusters—those who were “positive about NCEA”, and those who were “negative about NCEA”.5
These new “attitudes to NCEA” variables were then cross-tabulated with every other item in the
matching survey, and with demographic data that summarises key differences between schools.
Although the percentage size of the overall positive and negative group is reported in the next
table, these figures should be treated with caution. Around a third of principals gave responses
that clustered statistically into a more negative overall position, but 89 percent of them either
agreed or strongly agreed that they were personally supportive of NCEA, and just 6 percent
specifically said they were not supportive (see Section 3). Given this, it seems likely that many of
the responses that positioned some supportive principals as more negative overall are expressions
of concern about how NCEA is working out in practice. This is also likely to be the case for at
least some of the overall negative members of the other three groups. To get a sense of this
difference, the percentage of each group who disagreed or strongly disagreed that they were
supportive of NCEA is also included in the table.
Table 7 Results of cluster analysis
Results of cluster analysis Principals %
Teachers %
Trustees %
Parents %
% positive overall 67 58 58 55
% negative overall 33 42 42 44*
% not supportive of NCEA 6 18 19 16
*The missing 3 percent are parents who did not answer sufficient questions to be included in the analysis—for example their child may not yet have been in Year 11 so they declined to answer some NCEA questions.
5 We had anticipated that at least one more mixed cluster might emerge in the middle for each group, but this was not the case.
45 © NZCER

Findings for teachers
Teachers in the positive group were more likely to respond positively to other parts of the survey
and the negative group to respond negatively to those same items.6 The associations we found are
organised into three key themes: indicators of job satisfaction; engaging with wider changes in
education; and indicators of networking and collegiality.
Indicators of job satisfaction Teachers who were positive about NCEA were more likely to say they enjoyed the job and that
their morale as a teacher was high. They were more likely to say they got the support they needed
to do the job effectively; that the school retained good teachers; that career progression was
available in the school; that their work and personal life were balanced; that they had enough time
for the classroom part of the job; that they could manage their workload; and that the staff were
well treated. Of course, many teachers who were negative about NCEA answered at least some of
these aspects in the affirmative, and that holds for all the differences that follow. Collectively,
however, the many trends to statistically significant differences add to a powerful picture of an
overall very different set of beliefs and motivations for pro- and anti-NCEA groups.
Looking ahead, teachers who were negative about NCEA were more likely to see recruitment and
retention of teachers as an issue; to be concerned about the quality of teachers, as well as about
assessment workloads generally and NCEA workload specifically. They were more likely to think
assessment was driving the curriculum, and that their school was too large. By contrast, teachers
who were positive about NCEA were more likely to be concerned about parent and community
support going forward.
Engaging with wider changes in education Teachers who were positive about NCEA were more likely to be already implementing
curriculum innovations, or to be considering making changes to the curriculum they taught,
including: introducing a greater proportion of practical activities; adding more contemporary
issues and examples; integrating a literacy component; focusing on assessment for learning; using
individual learning programmes; integrating two or more subjects; and allocating projects that get
their students to use their parents as sources of new information. These teachers were also more
likely to say they involved students in taking responsibility for their own learning via individual
goal setting, and in identifying their own learning needs, using learning logs or similar. They were
more likely to identify a positive or improved learning environment, improvements in student
achievement, and improved student assessment for learning as main personal achievements of the
6 These patterns do not preclude positive responses to some items from those negative about NCEA and vice versa. The focus here is on overall patterns of responses, not the summed responses from any one individual. The point is important to make because if any one person was negative about all (or even most) of the items reported next, one would question why they stayed in the job.
46 © NZCER

last three years. All of these practices could be seen as implicated in developing a curriculum with
key competencies at its heart, so this difference in intentions is telling.
By contrast, teachers who were negative about NCEA were more likely to perceive barriers to
making changes in the curriculum they taught. The following 11 factors were all more likely to be
seen as barriers by this group: lack of time; lack of resources; national curriculum requirements;
NCEA requirements; time taken for NCEA assessments; wrong kind of professional development;
staffing levels; class size is too big; class is too diverse; parents’ expectations; and I don’t have
authority. It is interesting that, despite being more likely to see diversity as a barrier to curriculum
change, teachers who were negative about NCEA did not appear to be interested in moving to
more student-centred practices such as those outlined in the paragraph above.
Congruent with these perceived barriers, teachers who were more negative about NCEA were
more likely to say they would want to make the following changes to their work: reduce
administration/paperwork; reduce assessment requirements; reduce assessment workload; have
more noncontact time; experience more stability in moderation; have fewer nonteaching duties;
and to see a more positive appreciation of teachers.
Teachers who were negative about NCEA were also more likely to disagree that use of IT is an
essential and routine aspect of learning, and to think that its use is too time consuming for the
benefits gained. They did not see it as a high priority. They were more likely to say they would
never: have students create slideshow presentations to show audiences outside their class; use
moviemaking, music making, video editing, or sound editing as learning activities; or use IT to
communicate with people outside the school for school purposes. (Teachers who were more
supportive of NCEA did not necessarily yet do these things either, but they were more likely to
say they would like to do so in the future.) Again, constraints were more likely to be seen as
preventing the integration of IT into the classes of the more negative group. These included: lack
of IT resources; lack of suitable hardware; too much demand for computer labs; and an overfull
curriculum.
Some aspects of NCEA practice that can enhance learning success for a wider range of students
were less likely to be taken up by the negative group. They were more likely to say they would
not support students to bank credits while in Year 10, or to say they were not considering doing
so. They were more likely to say they would not allow resubmission of work for reassessment, or
were considering such a policy, whereas teachers who were positive about NCEA were more
likely to say they would never consider cutting off this opportunity. The latter group were also
more likely to say they would not consider placing strict limits on the number of internal
assessment events in their subject, whereas those who were negative about NCEA had more
mixed views about this.
Teachers who were positive about NCEA were also more likely to identify the following as
helpful purposes for the implementation of Planning and Reporting (PAR) processes: setting goals
for student achievement; raising achievement for all students; and raising achievement for
underachieving groups. They were more likely to say their school took actions in response to PAR
47 © NZCER

feedback that could include: developing an action plan; distributing professional readings; setting
up a whole-school discussion to develop shared understanding; holding a discussion with the BOT
to develop shared understandings; and changing the way the school monitored student progress.
In response to a series of Likert scale items about setting and meeting PAR targets, teachers who
were negative about NCEA were more likely to give negative responses and the positive teachers
to give positive responses to all but one of the provided items. Differences were found for: PAR
activities are part of our school-wide professional development; they have helped me identify and
address the specific learning needs of my students; they have led to useful discussions with
colleagues; they have helped raise achievement levels in my class; and they give students insights
into how they learn; and PAR processes take too much time for the benefits gained.
Indicators of networking and collegiality As might be anticipated, this powerful set of indicators of disenchantment (or its opposite)
outlined above also extends to teachers’ networks and professional connections.
Teachers who were positive about NCEA were more likely to say the most useful ideas for their
teaching programme had come from: informal contact with other teachers in the school; visits to
other schools; advisers such as School Support Services; an action research project; assessment
tools including asTTle and PATs; ongoing whole-school professional development; new
curriculum support materials; TKI; their subject association; and NCEA itself. Collectively these
present a picture of teachers who are talking and sharing ideas and resources and learning from
each other. In view of this, it is not surprising that this group was more likely to say their
professional development in the last year had resulted in them trying new ideas in their teaching,
and to sharing those ideas with other staff.
These teachers perceived that they had more opportunities to learn from such interchanges.
Teachers who were positive about NCEA were more likely to say: they had been involved with
their colleagues in observing each other’s teaching, and that they used their noncontact time to do
this. They were more likely to be involved in setting useful targets for student achievement, and to
say that the school supported them to take risks in their teaching, and that there was a consistent,
positive approach to student behaviour and discipline. They were more likely to say their BOT
staff representative provided group reports to staff after BOT meetings, and to see the BOT as on
top of the task or making steady progress.
In contrast, teachers who were negative about NCEA were more likely to rate as very poor or
poor the within-school sharing of various sources of professional knowledge: teaching resources;
assessment resources; lesson planning resources; and knowledge about individual students.
Adding to this sense of isolation, teachers who were negative about NCEA were more likely to
rate the principal’s relationship with staff as poor; to say they didn’t know how to rate working
relationships between trustees, and to see the board’s relationship with staff as poor, or as
something they could not comment on. They were more likely to say they had not felt safe in the
school grounds at times.
48 © NZCER

Of the group of teachers who were dissatisfied with the way they were appraised, those who were
negative about NCEA were also more likely to say they had no confidence in the appraisal
process. They were more likely to think appraisal was used to supply information to ERO. By
contrast, teachers who were positive about NCEA were more likely to say that appraisal in the
school was used to: identify staff professional development needs; inform school
development/strategic planning; plan own career; and to support and encourage staff.
Teachers who were negative about NCEA were less likely to feel they had a role to play in
strategic decision-making processes, and to say there were areas of school life where they should
be involved in decisions but were not. They were more likely to think too much responsibility was
asked of the BOT. And they were more likely to say they were not asked about: curriculum;
budget allocation; strategic planning; setting targets for student achievement; use of student
achievement data (where they were also more likely to say they did not want to be asked);
allocation of duties; professional development; student discipline/behaviour; appraisal of staff;
special needs provision; and reporting to parents. Many of these strategic decisions align with
other aspects of negative views already reported in this section. Again, the picture painted is one
of disengagement and disempowerment.
Where teachers who were negative about NCEA were more likely to say they had little or no
contact with other schools, those who were positive were more likely to say they shared:
information on students; and the services of the RTLB7 and other specialist teachers.
Similarly, those who were negative about NCEA were more likely to disagree that they could
access timely advice and support from the MOE, NZQA, or their NCEA moderator. They were
more likely to think there was a conflict between the advice offered by MOE and NZQA; MOE
and ERO; NZQA and School Support Services; and their NCEA moderator and the NZQA staff.
They were also more likely to agree that it took too much time to assemble information required
by the MOE, NZQA staff; NCEA moderator; the school’s BOT; the school management; ERO
and the Teachers’ Council. The picture of disillusion, of compliance rather than active
engagement with feedback and support, is very strong.
Demographic associations The pattern of overall negative or positive associations outlined above was not related to teachers’
age, or years in the job. There was a trend for teachers who were senior and middle managers to
be positive about NCEA and for all other teachers to be negative (but this did not reach
significance: p = 8 percent.)
Nor was this variable related to school authority (state or state integrated), decile, or type of
school (urban, secondary urban, minor urban, rural). There was, however, an association with
school size. Teachers in schools with rolls of 1500+ were more likely to be negative about NCEA.
7 Resource Teacher of Learning and Behaviour.
49 © NZCER
It is not difficult to see that the negative feelings associated with not being well connected into
professional learning and change could be exacerbated when individual teachers feel they are
“lost” amongst a very large school staff.
Findings for parents
The proportions of overall positive or negative parents are very similar to those for the teachers.
Again, several themes emerged in the responses. As might be expected, they have a somewhat
different focus from the themes for the teacher responses.
Overall feelings about the school Parents who were supportive of NCEA were more likely to say they were generally happy with
their child’s education (84 percent of them said this, compared to 75 percent who were not
supportive of NCEA).8 Parents who are not supportive of NCEA are not necessarily unhappy—
just more likely to be so. The main reason for not being happy was that insufficient information
was shared with parents (at just 9 percent, this was a small subgroup of all parents) and those who
were more negative about NCEA were more likely to think this.
Parents who were not supportive of NCEA were more likely to want: smaller classes for their
child; more accountability; more information to support their child’s learning at home; and stricter
discipline in the school.
Taking an active interest in education While most parents felt welcome at their child’s school, this was more likely to be the case for
those who were supportive of NCEA (again, 84 percent of supportive parents compared to 75
percent of not supportive parents).
Active involvement in the school’s activities has been less common in secondary schools than
primary schools, but may be increasing. (Whereas 53 percent of parents said they had no
involvement in 2006, 67 percent said this in 2003.) Here again, parents who were involved were
more likely to be supportive of NCEA. These parents were more likely to have helped with
fundraising, school trips, and cultural activities and to have responded to school surveys and taken
part in consultation. Not surprisingly, they were more likely to have informal contact with
teachers during school trips, at school functions, or at school meetings.
Parents who were supportive of NCEA were more likely to say they were satisfied with the way
the school developed its charter and annual plans, and that they felt they had been genuinely
consulted on those matters. However, they were also more likely to say they would like additional
information about BOT decisions, and that the role of the BOT was an issue facing the school. By
8 The figures are included here as a reminder that this section is about relative differences in patterns of responses.
50 © NZCER

contrast there was a trend for those who were not supportive of NCEA to say they had no contact
with the school’s BOT.
Parents who were negative about NCEA were more likely to say they had not had contact with
their child’s teachers that year. A general feeling of not being as in touch or involved was also
reflected in their view that they would have liked to have more say in managing student
behaviour, in the choice of their child’s teachers, and in curriculum. Congruent with this, these
parents were also more likely to say that the quality of the teachers was an issue facing the school.
Parents who are involved are likely to know more about what is happening in the school and it
may be that this more active involvement is linked to an interest in wider education issues. Parents
who were more positive about NCEA were more likely to say they got information about
education from the newspaper, TV, ERO reports, books, and the Team-Up website. By contrast,
those who were not supportive of NCEA were somewhat more likely to say their information
about education came from other parents.
Achievement issues Parents who were supportive of NCEA were more likely to say the information they received
about their child’s overall learning programme was very good, and there was a trend for them to
say the same about their child’s learning progress. By contrast, those who were not supportive of
NCEA were more likely to say they wanted additional information about their child’s progress
and achievement, and about NCEA in general. Four aspects of achievement information tended to
be identified more often by this group. They wanted the information to: be easier to understand;
compare their child with national standards; explain the assessments/tests taken; and provide ideas
that would allow parents to support ongoing learning.
Data gathered in the Competent Learners @ 16 research provides some insights into reasons some
parents might be more negative about NCEA if they are anxious about their child’s achievement.
In that study, parents of lower achievers were more likely to believe that their child would do the
bare minimum to gain the credits they needed (Wylie and Hipkins in press). It may be that this
anxiety could lead them to blame NCEA if their child was not motivated to learn.
Parents who were not supportive of NCEA were more likely to see NCEA workloads as an issue
facing the school. It is not clear from the item whether they were thinking about teacher
workloads or their own child’s pressures. Greater stress on students at assessment time was seen
as an issue by just 12 percent of the Competent Learners @ 16 parents, so it is possible that at
least some of the 22 percent of parents who expressed this concern in the national survey were
thinking about teacher workloads.
In total, 46 percent of parents said they had raised a concern with the school during the year. Of
this group, those negative about NCEA were also more likely to indicate their child had special
needs, including health issues. While a small group in total (just 5 percent of all parents said this)
51 © NZCER
it is not difficult to see that NCEA, with its steady stream of internal assessments, could provide
anxieties and practical difficulties for this group.
Demographic differences Parents who were not supportive of NCEA were more likely to have students enrolled in low-
decile schools. Asian, Mäori, and Pasifika parents were more likely to be positive about NCEA
and those who identified as “New Zealander/Kiwi” or Päkehä to be negative. (The latter were the
largest group overall: 83 percent of the negative parents identified as this group, compared to 72
percent of the positive parents.)
Findings for trustees
The cluster analysis revealed two groups of very similar proportions to those for teachers and
parents. Again, we see a pattern of associations with other aspects of the school’s life, where
positive experiences are associated with being positive about NCEA and negative experiences
with being more negative about NCEA overall.
Being happy and confident in the BOT role Trustees who said being a board member had helped them gain the confidence to try new things
were more likely to be positive about NCEA, and there was a trend for this association where they
said they had increased their skills in working with others. This group was also more likely to say
they had attended whänau or Pasifika support meetings with parents.
Whereas trustees who were supportive of NCEA were more likely to say they had regular contact
with the BOT of other schools, those who were not supportive were more likely to think the board
needed to work more with management people from other schools. They were also more likely to
say the BOT did not review its own progress.
There were differences related to inputs to the board’s work. For example, trustees who wanted to
see a reduction in expectations that the board would consult with the community were more likely
to be negative about NCEA. By contrast, those who said they gained advice and support from the
MOE were more likely to be positive about NCEA. The positive group was also more likely to
say the board sought advice from their regional School Trustees Association (STA) or sought
legal advice if they faced an industrial relations issue.
Interestingly, trustees who belonged to seemingly more stable boards (those from which no-one
had resigned in the last 12 months) were more likely to be positive about NCEA. Trustees who
were negative about NCEA were more likely to belong to a BOT from which two or even three
people had resigned in the last 12 months.
52 © NZCER

Engaging with education issues Those trustees who recognised the aim of raising achievement of all students as an intention of the
Planning and Reporting (PAR) policy and procedures were more likely to be positive about
NCEA.9 They were also more likely to think this policy ensured that schools were accountable to
their community and that BOTs now spent more time monitoring patterns of student achievement
and engagement. Whereas trustees who were negative about NCEA were more likely to indicate
just one benefit for PAR processes, those who were more positive about NCEA were more likely
to nominate two or more benefits of the application of this policy in the school.
Interestingly, the positive group was more likely to be critical of their success in meeting the PAR
targets they set, saying most or some had been met, but seldom that all had been met. By contrast,
trustees who were negative about NCEA were more likely to say all targets had been met, or to be
not sure. Where targets had not been met, trustees who were positive about NCEA were more
likely to say this situation had been discussed by the BOT.
Trustees who were positive about NCEA were more likely to say the BOT had discussed findings
of an ERO review with the school staff. This was the only significant difference found for the
bank of items related to contact between the BOT and the staff. Why this one and not others? In
the light of the pattern of PAR differences it may be that being positive about NCEA is related to
a “what next” approach to improving learning at the school.
Trustees who were positive about NCEA were also more likely to say the BOT had consulted the
wider school community on the following three issues: student behaviour; health and safety of
students; and sex education. It should be noted, however, that there was no overall difference in
responses for items such as funding, property, strategic planning, curriculum, and overall student
achievement.
There were also differences in perceptions of issues that confronted the school. Echoing some of
the parental views outlined above, trustees who were negative about NCEA were more likely to
see the quality of teachers as an issue and also, not surprisingly, NCEA workload. It is concerning
that trustees who were positive about NCEA were more likely to be concerned about a falling roll
situation. Since the survey was conducted there has been considerable media commentary about
offering alternatives to NCEA as a marketing strategy to attract parents to a school, or to hold
those who might otherwise be lured away by other schools making such offers. The support of
these trustees must be vulnerable if they find themselves in a competitive context where appeals
to past certainties and tradition are used as a marketing tool.
Demographic differences Just under a fifth of responding trustees said they were employed in the education sector (18
percent). They could have been the staff representative on the BOT, or perhaps a teacher at
9 Findings related to the PAR items in the 2006 National Survey have already been reported (Hipkins, et al., 2007).
53 © NZCER
another school. Three-quarters of this group were positive about NCEA, compared to just over
half the trustees not employed in education.
In a reverse of the pattern found for parents, trustees from low-decile schools were more likely to
be positive about NCEA. There were no other differences related to school type or size.
No differences were found for variables such as gender, age, ethnicity, or educational
qualifications.
Findings for principals
Reflecting the patterns reported in the previous sections, the negative cluster group of principals
was smaller than for teachers, trustees, or parents. There were also fewer significant differences in
patterns of associations than for the teachers, parents, and trustees. In part this could be a
statistical effect—an imbalance between two groups within a relatively small sample population
makes statistical significance harder to establish. However, the pattern also accords with the
findings of the previous sections that most principals, while some have more reservations than
others, are personally supportive of NCEA.
Budget, staffing, and workload Principals who were more negative overall about NCEA were also more likely to be concerned
about rapid rises in the cost of ICT consumables and maintenance, and also the rapid increase in
costs of a planned school initiative. They were more likely to report budget pressures related to:
property development; property depreciation; and covering teachers’ noncontact hours. Congruent
with these concerns, they were also more likely to say the staffing entitlement was not enough to
meet the school’s needs. Not surprisingly, they were more likely to also say funding was a major
issue confronting the school.
Just over half the principals said the school had difficulty attracting suitable staff for middle
management roles. Those who said this, and who were more negative about NCEA, were more
likely to say that this difficulty related to not paying enough for the responsibility that being a
middle manager entailed.
Principals who were more negative overall about NCEA were also more likely to say they would
like to reduce the amount of administration and paperwork entailed with their role. However, they
were also more likely to see themselves continuing as the principal of their current school for the
next five years.
Curriculum and assessment issues Principals who were positive about NCEA were more likely to say the school had introduced an
inquiry learning approach as a curriculum initiative. The numeracy programme was a common
initiative overall (78 percent of principals said they had this in the school) but was more common
54 © NZCER
in schools where the principal was not as supportive of NCEA (86 percent, compared to 75
percent of positive principals’ schools).
Principals who were positive about NCEA were more likely to say the school used results from
Progressive Achievement Tests (PATs) as a source of data for PAR processes, whereas those who
were negative abut NCEA were more likely to say they were in the process of doing so, or were
contemplating doing so. The positive principals were also more likely to say that the Government
should not set minimum standards of achievement that have to be reported to parents.
As for the teachers, principals who were negative about NCEA were more likely to say they
placed strict limits on the number of internal assessment events in their subject, or were
considering doing so, while those who were positive about NCEA said they would not do this.
Principals who were negative were also more likely to say they were considering making students
prioritise assessments, which again the positive principals were more likely to say they would not
do or hadn’t considered doing. In common with the other three groups, those principals who were
negative about NCEA were more likely to see NCEA workload as an issue confronting the
school. It is worth noting that this was the one significant association found for all four clusters
(i.e., teachers, parents, trustees, and principals) who were negative about NCEA.
Relationships Whereas many differences were found for teachers, just one difference in associations within the
school’s community was found for principals, and the pattern appears to be in the opposite
direction. Two-thirds of principals who were negative about NCEA said they had a very good
relationship with their school staff, compared to just under half of those who were positive about
NCEA. The latter group was more likely to be somewhat self-critical, saying the relationship was
good or satisfactory. By contrast, teachers who were negative about NCEA were also more likely
to be negative about a range of relationships.
Principals who were positive about NCEA were more likely to say they shared information about
students with other local secondary schools, and also that they ran combined classes. They were
more likely to be part of an RTLB cluster and hence to share the resource teachers.
Principals who were negative about NCEA were more likely to say the BOT should have the
responsibility for negotiating the principal’s salary and employment conditions, provided that the
MOE then paid for these. They were more likely to believe that this was ultimately the BOT’s
responsibility as the principal’s employer and that it would allow local conditions to be taken into
account. Conversely, principals who were positive about NCEA were more likely to believe the
BOT lacked the expertise to do this.
55 © NZCER

Demographic differences Principals who were positive about NCEA were more likely to be female. Most of the principals
in the negative cluster were males (although there were also many males in the positive cluster
because there were more of them overall—they made up 72 percent of the total sample).
For this group, there were no significant differences in associations by school authority, type, size,
or decile.
Is NCEA really acting as a lightning rod?
Given the comprehensive parade of differences in associations, especially for the teachers and
parents, it could be argued that a negative stance towards NCEA is just one dissatisfaction among
many—no more nor less an influence on overall attitudes than any other potential candidate for
this position. This section concludes by advancing the counter-argument that NCEA is different
and so has become a focus for a gathering together of other sources of discontent and concern
with education more generally.
Two main lines of argument are advanced. The first summarises indications that very different
views of curriculum and learning underpin the different overall stances toward NCEA. The
second discusses possible reasons for, and potential impacts of, feeling more or less connected to
the overall school community.
NCEA as an unsettling curriculum influence The modular structure of NCEA assessments has opened up a space for curriculum innovation in
the senior secondary school because individual standards can be flexibly combined to assess any
specific combination of learning objectives in a course. Early indications were that schools began
to cautiously adopt this flexibility into their curriculum planning, right from the first year of
NCEA implementation (Hipkins and Vaughan 2002). A more recent snapshot of course
innovation suggests that most schools have now responded to these new possibilities by designing
courses with the needs of specific groups of students in mind, and that more such innovations are
being considered (Hipkins 2007). While much innovation has, to date, centred around the mix of
assessments used and their more flexible timing, the snapshot also reported evidence of
curriculum innovation, and indicators that more of this type of change is being actively
considered by many schools.
Courses that are flexibly designed to meet different sorts of learning needs challenge assumptions
about curriculum, learning, and assessment that are likely to be deeply held, and often tacit rather
than able to be clearly articulated. Gilbert (2005) describes a traditional and familiar model of
secondary education based on the organising principles of industrial societies, where students are
organised on assembly line principles (timetables and “subjects”), processed in batches (age group
classes), and subjected to end-point quality controls (high-stakes assessments) where those who
succeed on the common set of learning terms (officially the curriculum but actually often an
56 © NZCER
examination prescription for a subject) are eligible for further education and those who fail leave
school to enter the world of work. Dobric (2006) identified the view that sorting excellent
students from the rest is an important purpose of assessment for qualifications as one of four types
of “assessment discourses”. In her study, people who held such views were more likely to express
reservations about NCEA, and to hold with conservative macro-ideologies. Interviewed members
of the Education Forum and the Business Roundtable either held to this “excellence” view, or
they held a more instrumental view of assessing “usefulness” of learning.
Gilbert argued that the competitive model is wasteful of individual student’s diverse strengths,
and no longer appropriate in the rapidly evolving “knowledge society” of the 21st century, where
different sorts of knowledge and work skills are needed for as many of the population as possible,
not just for an elite, and where dispositions for lifelong learning should be fostered (Gilbert 2005).
These types of outcomes are more closely aligned with Dobric’s other two assessment discourses:
“fulfilment” is about achieving one’s personal potential while “recognition” is aligned with a
progressive ideology of participation and empowerment. Gilbert’s view has implications for
ongoing curriculum change, and for rethinking views of the nature of evidence of learning (with
obvious assessment implications), and it could be argued that NCEA can be an important step in
the direction of meeting the types of 21st century learning needs she describes, not those of the
19th century when the current model of schooling was devised. Interestingly, Dobric found that
interviewees who were more sympathetic to this type of argument were more likely to be MOE,
PPTA, or NZQA personnel. Interviewees in schools were spread across all four sets of beliefs,
which doubtless helps account for the wide spread of teacher opinions documented in this report.
The associations reported in this section provide suggestions of impacts of holding one of these
assessment discourses on support for NCEA. For example, the teachers who were more positive
about NCEA were more likely to respond to other parts of the survey with indications that they
were redesigning their courses to meet the diverse learning needs of students, that they saw great
use of ICT as something to aspire to, and that they valued students’ more active involvement in
learning and assessment. These teachers, along with positive principals and trustees, were more
likely to give indications of support for aspects of the PAR process that would focus the school’s
work on improving the achievement of all students—an aim that runs counter to the sorting out of
an elite group. These responses are indications of a view that all students can learn and improve,
and should be supported to do so, and of a more flexible view of what could constitute a learning
curriculum for different students.
By contrast, being more negative about NCEA was associated with a tight linking of curriculum
and assessment, such that negative teachers saw assessment as driving the curriculum and
negative parents worried that without a sufficiently strong assessment “carrot” their child would
see no reason to do more than the bare minimum of work. Teachers’ opposition to resubmission
of work when a standard is not achieved on the first attempt suggests a view of assessment as a
competitive sorter rather than as a check on learning that is potentially available to all. The view
of learning as topping up on a preset body of knowledge to re-present in examinations could be
seen as underpinning teacher concerns that the curriculum is overfull and that ICT is not an
57 © NZCER

important priority, as well as some trustees’ view that it is not necessary to consult parents about
curriculum and learning. This more transmissive view of learning a prescribed “subject” with pre-
set content locates the teacher as primarily responsible for ensuring students learn material
deemed to be important by someone else. If they don’t “deliver” to this pre-set agenda (the origins
of which they may not even be aware) with sufficient clarity and force, their students will be
disadvantaged. Something of this type of belief could be read into the negative teachers’ concerns
that their classes were too big and too diverse for them to do their job effectively, and into
negative parents’ desire for smaller classes and better discipline. In the same vein, the “quality of
teachers” was more likely to be seen as an issue by teachers, parents, and trustees who were
negative about NCEA. This was one of just two “issues facing the school” about which there was
widespread agreement across the groups. (NCEA workload was the other.)
The imminent introduction of the final version of a revised national curriculum framework,
structured as it is to support curriculum flexibility and learning models better aligned with 21st
than 19th century ways of organising schools, provides a challenging context in which to consider
the philosophical differences outlined here. Will those teachers, parents, and to a lesser extent
trustees and principals, who seem to have judged NCEA on the basis of traditional assumptions
about schooling, give the new curriculum a negative reception for similar reasons? At the very
least, wider and carefully supported debate about the reasons for change would seem to be timely.
Keeping up with the pace? In times of rapid change, those who feel they have a stake in what is happening, are arguably
more likely to feel in control of their responses to that change, whereas those who simply react as-
and-when events other people compel them to do so are more likely to feel coerced and alienated.
There are indications that such responses and feelings are at work in the associations reported
above.
For teachers, parents, and trustees, being more positive about NCEA was associated with
indications of active involvement in the life of the school. Positive teachers were more likely to be
talking with peers in their own school and in others schools, sharing ideas and resources. This
group of parents was more likely to be involved in school activities, and gave indications of being
better informed about education generally. This group of trustees was more likely to say they
were learning and growing in the role. Teachers and parents who were positive about NCEA were
more likely to say they were consulted about ongoing change, and trustees to say they took an
active part in that consultation.
By contrast, the more negative teachers gave indications of being more isolated professionally.
These included not feeling consulted about change, not sharing with peers, not feeling confident
of the school’s appraisal processes. Negative parents were likely to be less in touch with the
school, but more anxious about their child’s learning and the general quality of the education they
were receiving.
58 © NZCER

NCEA is not the first set of extensive change that school communities have faced, but it is
different in that it potentially undermines many traditional but tacit assumptions about education
and specifically about the purposes and organisation of schooling. It is not difficult to see that
such changes would be harder to understand without a confident and active involvement in
implementation of the new assessment regime. It may be that a focus on the deeper drivers of
change in schooling in this century could accompany the introduction of the revised curriculum.
The pattern outlined here suggests it will be important to address this challenge for all groups with
a stake in education, not just teachers and school leaders.
What role do principals play, as leaders of change, in influencing the views of other groups? We
checked whether being from a school with a more negative principal was associated with also
being negative. Only data from schools where we got responses from the principal and the other
group in question were tested. We found that teachers who were negative overall were more likely
to be in schools where the principal was also negative. However, this association did not hold for
either trustees or parents.
Taking the pulse of NCEA
Contrary to much of the presentation of NCEA in the media, this report describes an NCEA with
some minor aliments but basically in good heart, and with a pulse of acceptance and change
beating strongly. There are issues to address but many of these are already well documented—for
example, workload and moderation concerns, administration costs, and issues of student
motivation. Indeed, during the preparation of this report, the MOE has taken steps to address
many of these issues—steps that have been largely well received.
The main new contributions of this report are the following findings:
the widespread support for NCEA
the lack of any desire to either revert to the former system or design a new one
the high levels of uncertainty about NCEA amongst parents
concerns about how well understood NCEA is amongst other education stakeholders such as
employers and universities
the strong patterns of association between teachers’ curriculum innovation and their views of
NCEA, but also
the seeming reluctance of schools to adopt measures that could immediately reduce
assessment pressures on students.
To extend the metaphor just a little further, the pulse of NCEA would appear to be beating most
strongly where change in the overall school is aligned and located within a system-wide
conversation about the learning needs of each student. The health of NCEA is seen to be most
compromised by those who would judge it in relation to more the traditional education outcomes
and values of the 19th and 20th centuries.
59 © NZCER

60 © NZCER

References
Alison, J. (2005). Teachers talk about NCEA. Research report on focus groups with secondary teachers. Wellington, Post Primary Teachers Association.
Black, P. (2001). Report to the Qualifications Development Group Ministry of Education , New Zealand on the proposals for development of the National Certificate of Educational Achievement. London, School of Education, King's College.
Bolstad, R. (2006). "Questions for a twenty-first century senior secondary curriculum." Curriculum Matters 2: 105-127.
Brooking, K. (2006). The NCEA: Competing viewpoints since implementation and the debate about its future. NZARE Conference, Rotorua, December 2006.
Dobric, K. (2006). "Drawing on discourses: Policy actors in the debates over the National Certificates of Educational Achievement 1996-2000." Annual Review of Education in New Zealand 15: 85-109.
Education Review Office (2004). Progress of NCEA Levels 1 and 2, and readiness of schools to implement level 3. Wellington, Educaton Review Office.
Gilbert, J. (2005). Catching the Knowledge Wave? The Knowledge Society and the future of education. Wellington, NZCER Press.
Hayes, D., M. Mills, et al. (2006). Teachers & Schooling Making a Difference. Crows Nest NSW, Allen and Unwin.
Hipkins, R. (2005). "The NQF/NCEA in the context of the "knowledge society" and national policy expectations." New Zealand Annual Review of Education 15: 27-38.
Hipkins, R. (2007). Course innovation in the senior secondary curriculum: a snapshot taken in July 2007. Wellington, New Zealand Council for Educational Research. Hipkins, R. (in press). Assessing key competencies: Why would we? How could we? Wellington,
Ministry of Education. Hipkins, R., L. Conner, et al. (2006). Shifting Balances 2: The impact of NCEA implementation on the
teaching of geography and home economics. Wellington, Ministry of Education. Hipkins, R., C. Joyce, et al. (2007). School planning and reporting in action: the early years of the new
framework. Wellington, New Zealand Council for Educational Research. Hipkins, R. and K. Vaughan (2002). From Cabbages to Kings: Interim research report - first year of
Learning Curves: Meeting student learning needs in an evolving qualifications regime. . Wellington, New Zealand Council for Educational Research: 140.
Hipkins, R. and K. Vaughan (2002). Well I know I need English and maths. Pushing the Boundaries: the heightened role of career planning in knowledge societies. An International Conference for the Careers Industry., Wellington, Careers Service.
Hipkins, R., K. Vaughan, et al. (2004). Shared pathways and multiple tracks. Interim research report - second year of Learning Curves, Meeting student learning needs in an evolving qualifications regime. Wellington, New Zealand Council for Educational Research.
Hipkins, R., K. Vaughan, et al. (2005). Shaping our futures: Meeting secondary students' learning needs in a time of evolving qualifications. Wellington, New Zealand Council for Educational Research.
Ingvarson, L., E. Kleinhenz, et al. (2005). Secondary teacher workload study report. Melbourne, Australian Council for Educational Research.
Matters, G. (2006). Australian Education Review: Using data to support learning in schools: Students, teachers and systems. Melbourne, Australian Council for Educational Research.
Meyer, L., J. McClure, et al. (2006). The Impact of NCEA on Student Motivation. Wellington, Report prepared by Victoria University of Wellington for Ministry of Education.
61 © NZCER

62 © NZCER
Peddie, R. (1998). Plus Ca Change...? Assessment, Curriculum and the New Zealand Qualifications Authority. Ten Years On: Reforming New Zealand Education. Biennial Conference of the New Zealand Educational Administration Society, Wellington, New Zealand Educational Administration Society.
Phillips, D. (2007). "The contribution of research to the review of national qualifications policy: The case of the National Certificate of Educational Achievement (NCEA)." Annual Review of Education in New Zealand 16: 173-191.
Wylie, C. (2007). School governance in New Zealand - How is it working? Wellington, New Zealand Council for Educational Research.
Wylie, C. and R. Hipkins (2006). Growing Independence: Competent Learners @14. Wellington, Ministry of Education.
Wylie, C. and R. Hipkins (in press). On the edge of adulthood: young people's school and out-of-school experiences at 16. Wellington, Ministry of Education.
Zepke, N., L. Leach, et al. (2006). Standards-based assessment in the senior secondary school: A research synthesis. Wellington, New Zealand Qualifications Authority.

Appendix A: Profiles of secondary schools responding to 2006 National Survey
Table 8 Profile of responses by school size
Size MOE data (n=315
schools) %
Principals (n=194)
%
Teachers (n=818)
%
Trustees (n=278)
%
<100 1 1 <1 1
100–249 7 6 3 7
250–399 14 13 6 15
400–749 31 33 24 33
750–1499 37 37 48 35
1500+ 10 11 19 10
Note: Numbers may not add to 100 because of rounding.
Whereas the principal and trustee samples closely reflect the overall characteristics of secondary
schools, it is evident that the teacher sample is skewed towards larger schools, and responses from
smaller secondary schools are underrepresented relative to the overall range of school sizes. This
reflects the much larger number of teachers employed in bigger schools—it is not possible to
simultaneously represent the full teacher population and the experiences of teachers in different
types of schools in the same sample. Because each school has one principal, and only two trustees
per school were sampled, this sampling dilemma does not arise for those populations.
Table 9 Profile of responses by decile
Decile grouping MOE data (n=315 schools)
%
Principals (n=194)
%
Teachers (n=818)
%
Trustees (n=278)
%
1–2 low 16 13 11 11
3–8 mid 66 69 67 70
9–10 high 18 18 21 19
Note: Numbers may not add to 100 because of rounding.
The largest secondary schools tend to be high-decile schools and so this pattern of responses again
reflects the overrepresentation of teachers in larger schools. The slight underrepresentation of
low-decile schools, for all three responding groups, is likely to be associated with the smaller size
of many of them.
63 © NZCER
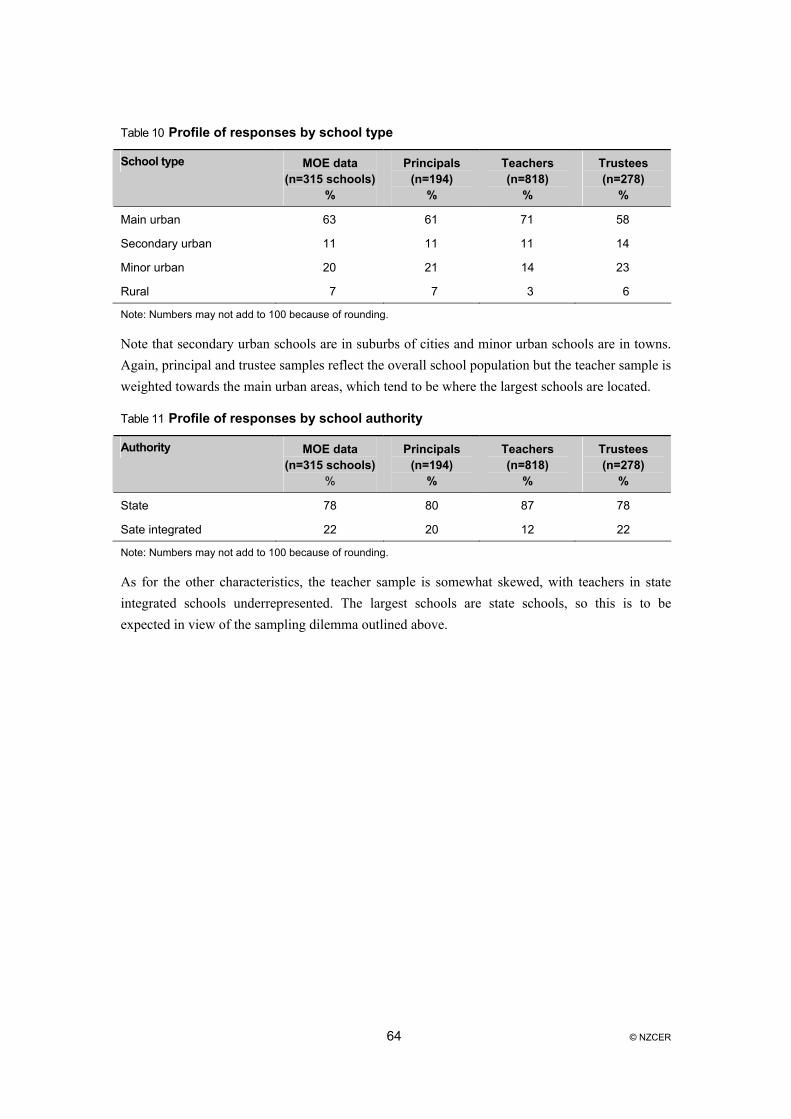
Table 10 Profile of responses by school type
School type MOE data (n=315 schools)
%
Principals (n=194)
%
Teachers (n=818)
%
Trustees (n=278)
%
Main urban 63 61 71 58
Secondary urban 11 11 11 14
Minor urban 20 21 14 23
Rural 7 7 3 6
Note: Numbers may not add to 100 because of rounding.
Note that secondary urban schools are in suburbs of cities and minor urban schools are in towns.
Again, principal and trustee samples reflect the overall school population but the teacher sample is
weighted towards the main urban areas, which tend to be where the largest schools are located.
Table 11 Profile of responses by school authority
Authority MOE data (n=315 schools)
%
Principals (n=194)
%
Teachers (n=818)
%
Trustees (n=278)
%
State 78 80 87 78
Sate integrated 22 20 12 22
Note: Numbers may not add to 100 because of rounding.
As for the other characteristics, the teacher sample is somewhat skewed, with teachers in state
integrated schools underrepresented. The largest schools are state schools, so this is to be
expected in view of the sampling dilemma outlined above.
64 © NZCER

Appendix B: Responses from principals
There have been many hidden coststo the implementation of NCEA
I am supportive of NCEA
The NCEA is a valuable record ofstudent learning
The NCEA gives us freedom todesign the curriculum how we want
The NCEA motivates underachievingstudents to do better
Employers don’t understand theNCEA
Assessment is driving thecurriculum now, even at Years 9
and 10
Parents don’t understand the NCEA
The NCEA is a crediblequalification in the wider
community
The NCEA motivates high−achievingstudents to do their best
Universities don’t understand theNCEA
Students have too muchresponsibility for NCEA choices
I think we should create anotherassessment system
I think we should return to theprevious assessment system
%
100 80 60 40 20 0 20 40 60 80 100
0
2
1
2
3
1
2
0
3
15
4
6
50
66
4
4
5
11
9
9
16
19
16
28
30
49
27
21
5
5
11
9
12
20
14
23
34
18
40
28
11
8
40
38
54
56
61
48
49
48
38
33
22
14
7
4
51
51
28
21
14
21
17
10
9
6
3
2
3
1
Stronglydisagree
Disagree Neutral/not sure
Agree Stronglyagree
Note: Percentages may not add to 100 because of rounding errors and/or non responses.
65 © NZCER

66 © NZCER

Appendix C: Teachers’ responses
Assessment is driving thecurriculum now, even at Years 9
and 10There have been many hidden costs
to the implementation of NCEA
Employers don’t understand theNCEA
NZQA moderation feedback is oftenunpredictable
Parents don’t understand the NCEA
I am supportive of NCEA
The NCEA is a valuable record ofstudent learning
The NCEA motivates underachievingstudents to do better
The NCEA gives us freedom todesign the curriculum how we want
Students have too muchresponsibility for NCEA choices
I think we should create anotherassessment system
The NCEA is a crediblequalification in the wider
communityUniversities don’t understand the
NCEA
The NCEA motivates high−achievingstudents to do their best
I think we should return to theprevious assessment system
%
100 80 60 40 20 0 20 40 60 80 100
2
1
1
0
0
5
5
12
9
3
20
7
2
26
24
8
3
5
10
9
13
19
29
29
30
26
26
20
37
30
9
24
29
26
27
22
29
17
21
37
26
38
50
15
28
49
35
44
39
48
45
37
37
35
22
17
24
22
17
11
31
36
20
24
15
14
8
5
6
6
10
3
4
4
6
Stronglydisagree
Disagree Neutral/not sure
Agree Stronglyagree
Note: Percentages may not add to 100 because of rounding errors and/or non responses.
67 © NZCER

68 © NZCER

Appendix D: Trustees’ responses
Assessment is driving the curriculumnow, even at Years 9 and 10
Parents don’t understand the NCEA
I am supportive of NCEA
The NCEA is a valuable record ofstudent learning
There is too much assessment now
The NCEA is a credible qualification inthe wider community
The NCEA gives the school freedom todesign the curriculum how we want
Moderation feedback to the school’steachers seems unpredictable
The NCEA motivates underachievingstudents to do better
Students have too much responsibilityfor NCEA choices
The NCEA motivates high−achievingstudents to do their best
I think we should create anotherassessment system
I think we should return to theprevious assessment system
I don’t understand NCEA
%
100 80 60 40 20 0 20 40 60 80 100
0
2
5
6
2
8
5
1
10
3
18
26
21
28
11
10
14
17
19
21
27
11
29
36
37
35
37
46
23
25
23
24
29
30
29
54
28
32
22
23
27
13
53
47
45
46
36
34
34
24
28
21
19
13
10
10
12
15
12
7
10
7
3
8
3
5
4
3
4
1
Stronglydisagree
Disagree Neutral/not sure
Agree Stronglyagree
Note: Percentages may not add to 100 because of rounding errors and/or non responses.
69 © NZCER

70 © NZCER

71 © NZCER
Appendix E: Parents’ responses
The school has kept us well informedabout the NCEA
The NCEA is a valuable record ofstudent learning
I am supportive of NCEA
The NCEA is a credible qualification inthe wider community
I don’t understand NCEA
The NCEA motivates high−achievingstudents to do their best
The NCEA motivates underachievingstudents to do better
I think we should return to theprevious assessment system
There is too much assessment now
I think we should create anotherassessment system
Students have too much responsibilityfor NCEA choices
The NCEA has caused my child too muchstress
%
100 80 60 40 20 0 20 40 60 80 100
4
4
4
5
10
9
7
7
3
12
5
11
12
14
12
15
31
20
19
19
25
23
29
35
23
32
39
39
19
31
37
39
41
41
40
30
39
31
30
25
20
19
22
13
16
8
11
7
11
7
7
5
10
9
5
10
4
5
2
3
11
10
8
11
10
11
10
11
13
11
14
14
Missing Stronglydisagree
Disagree Neutral/not sure
Agree Stronglyagree
Note: Percentages may not add to 100 because of rounding errors and/or non responses.