t-stub connection component tests james a swanson and roberto t leon school of civil and...
TRANSCRIPT

T-Stub ConnectionComponent Tests
James A Swanson and Roberto T Leon
School of Civil and Environmental Engineering
Georgia Institute of Technology
Atlanta, Ga.
http://www.ce.gatech.edu/~sac/
SAC Subtask 7.03
Tests on Bolted ConnectionsSAC Subtask 7.03
Tests on Bolted Connections• Synthesis of existing data• Testing:
– Individual T-stubs and angles– Full-scale exterior-type connections
• Interpretation• Design Recommendations• Further testing
• Synthesis of existing data• Testing:
– Individual T-stubs and angles– Full-scale exterior-type connections
• Interpretation• Design Recommendations• Further testing
ApproachApproach
• Identify and quantify individual failure modes
• Assess influence of monotonic vs. cyclic loading
• Develop simplified models
• Calibrate with advanced FEM
• Provide design aids (?)
• Identify and quantify individual failure modes
• Assess influence of monotonic vs. cyclic loading
• Develop simplified models
• Calibrate with advanced FEM
• Provide design aids (?)
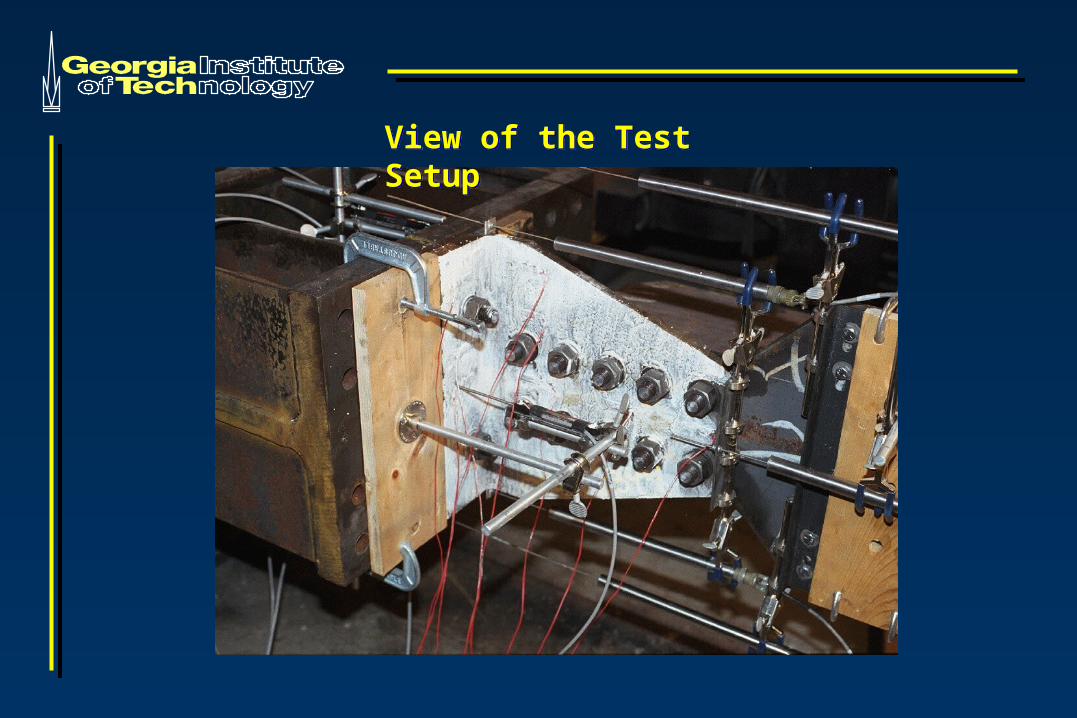
View of the Test SetupView of the Test Setup

size of T-section or clip angle
size and number of bolts:
beam flange thickness
type of bolt
VariablesVariables

Test SetupTest Setup
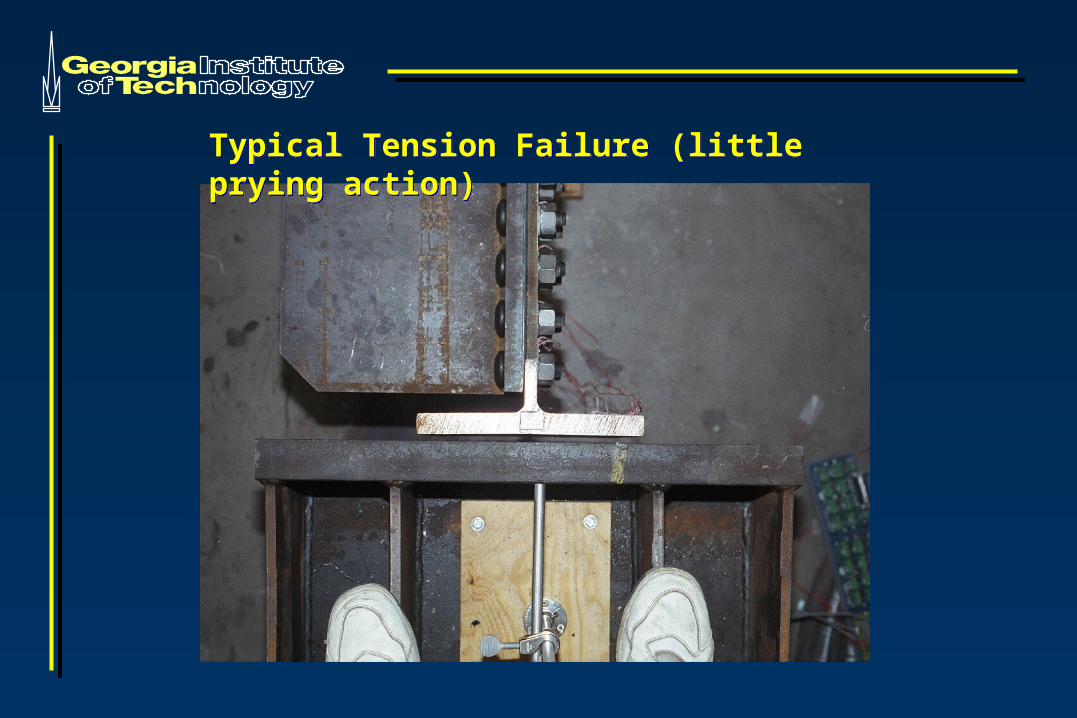
Typical Tension Failure (little prying action)Typical Tension Failure (little prying action)

Prying DeformationsPrying Deformations

Typical Tension Bolt FailuresTypical Tension Bolt Failures
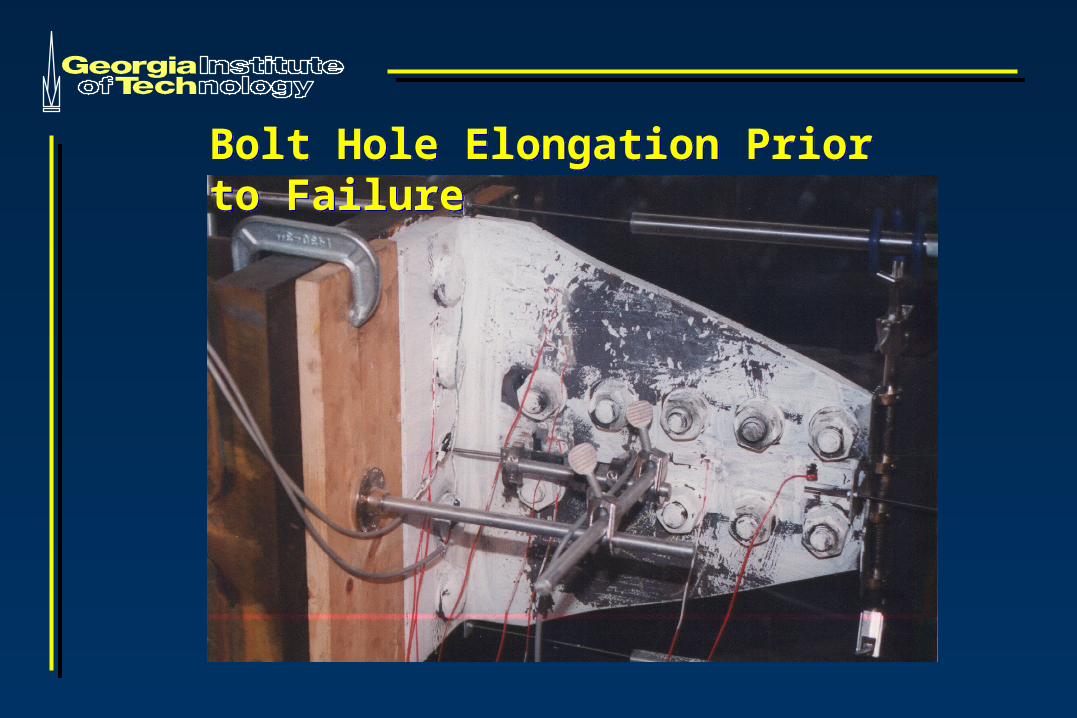
Bolt Hole Elongation Prior to FailureBolt Hole Elongation Prior to Failure
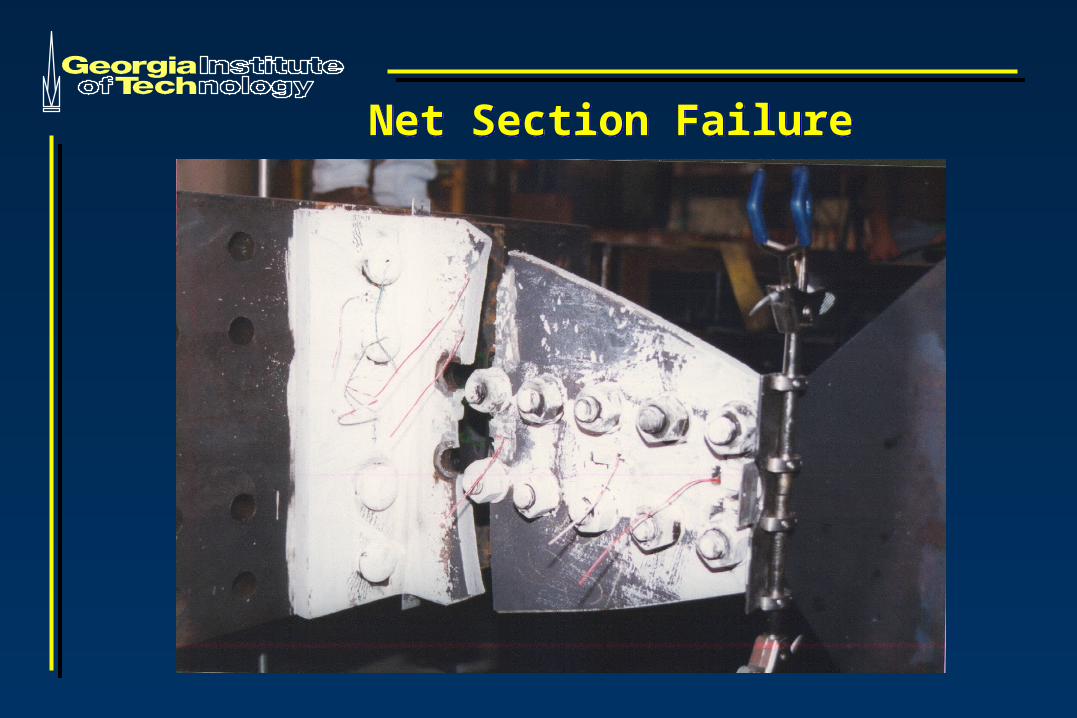
Net Section FailureNet Section Failure

Block Shear Failure
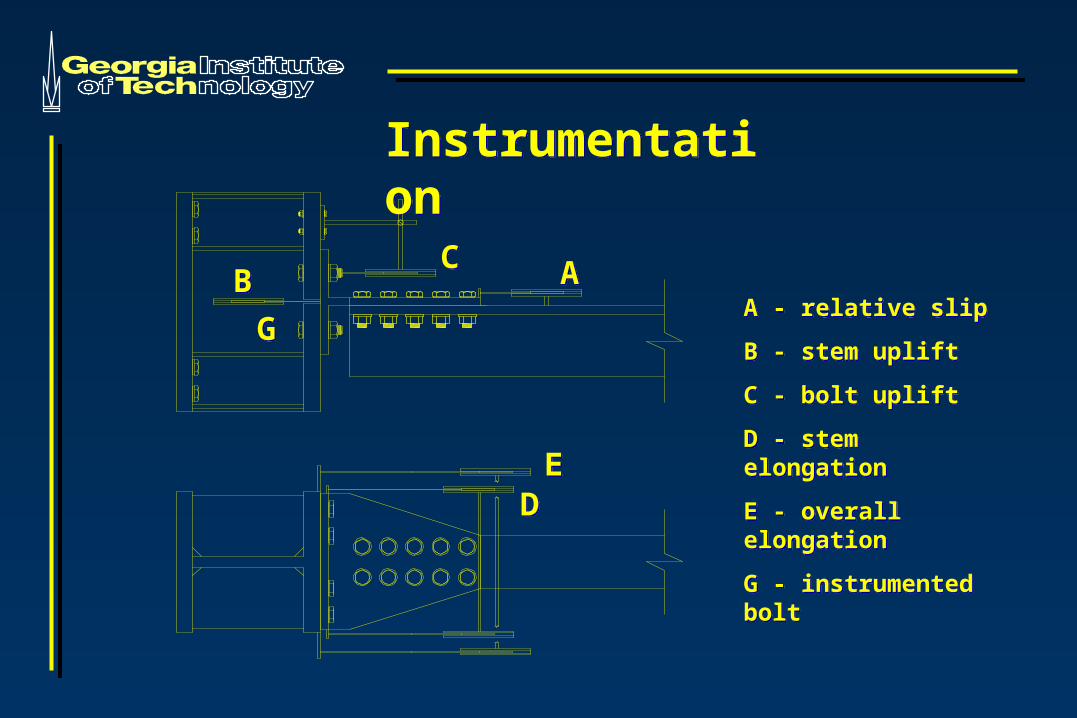
InstrumentationInstrumentation
A - relative slip
B - stem uplift
C - bolt uplift
D - stem elongation
E - overall elongation
G - instrumented bolt
A - relative slip
B - stem uplift
C - bolt uplift
D - stem elongation
E - overall elongation
G - instrumented bolt
EEDD
CC
GG
BB AA

Connection Spring Model
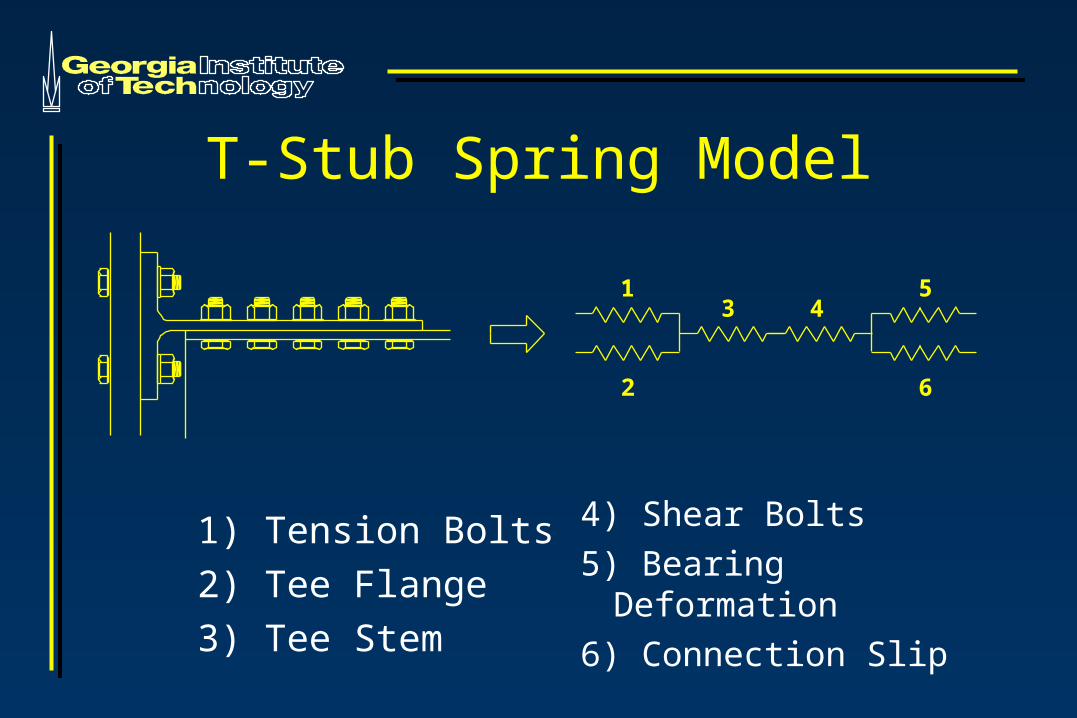
T-Stub Spring Model
1
2
3 45
6
4) Shear Bolts
5) Bearing Deformation
6) Connection Slip
1) Tension Bolts
2) Tee Flange
3) Tee Stem

TA-01 P/Including Post Fracture Data
Deformation (in)
-0.4 -0.2 0.0 0.2 0.4 0.6 0.8 1.0 1.2 1.4 1.6
Lo
ad (
kip
)
-500
-400
-300
-200
-100
0
100
200
300
400
500
Deformation (mm)-10 -5 0 5 10 15 20 25 30 35 40
Lo
ad (
kN)
-2000
-1500
-1000
-500
0
500
1000
1500
2000
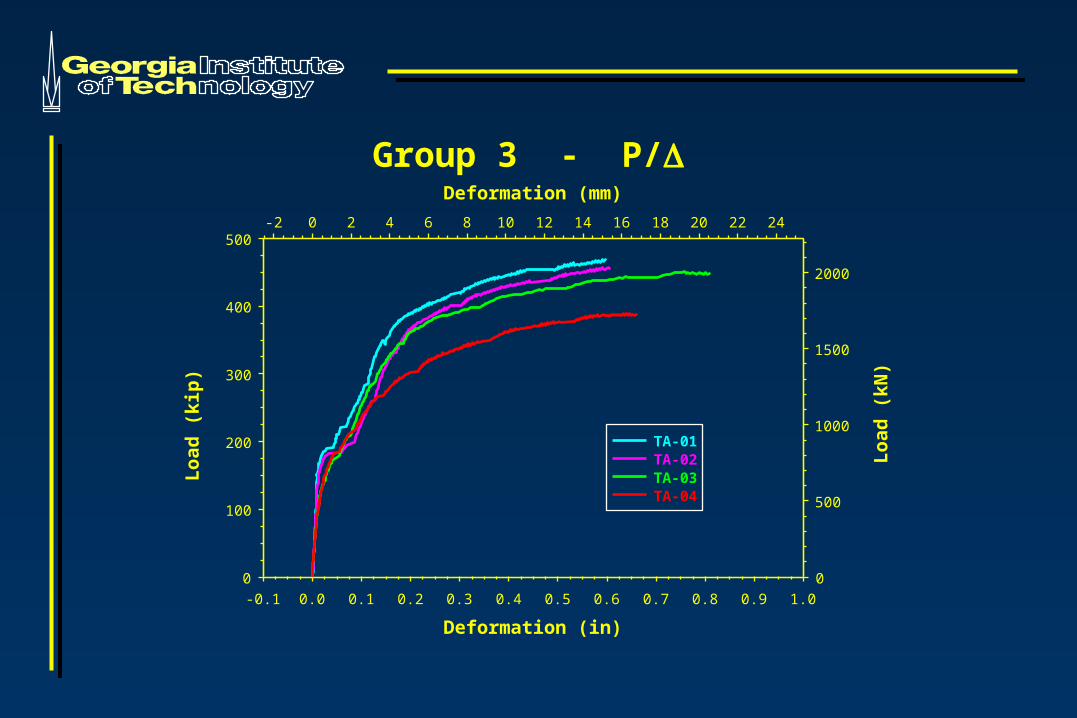
Group 3 - P/
Deformation (in)
-0.1 0.0 0.1 0.2 0.3 0.4 0.5 0.6 0.7 0.8 0.9 1.0
Lo
ad (
kip
)
0
100
200
300
400
500
Deformation (mm)
-2 0 2 4 6 8 10 12 14 16 18 20 22 24
Lo
ad (
kN)
0
500
1000
1500
2000
TA-01TA-02TA-03TA-04

Group 3 - P/Uplift
Deformation (in)
-0.1 0.0 0.1 0.2 0.3 0.4 0.5 0.6 0.7 0.8 0.9 1.0
Lo
ad (
kip
)
0
100
200
300
400
500
TA-01TA-02TA-03TA-04
Deformation (mm)
-2 0 2 4 6 8 10 12 14 16 18 20 22 24
0
500
1000
1500
2000
Lo
ad (
kN)
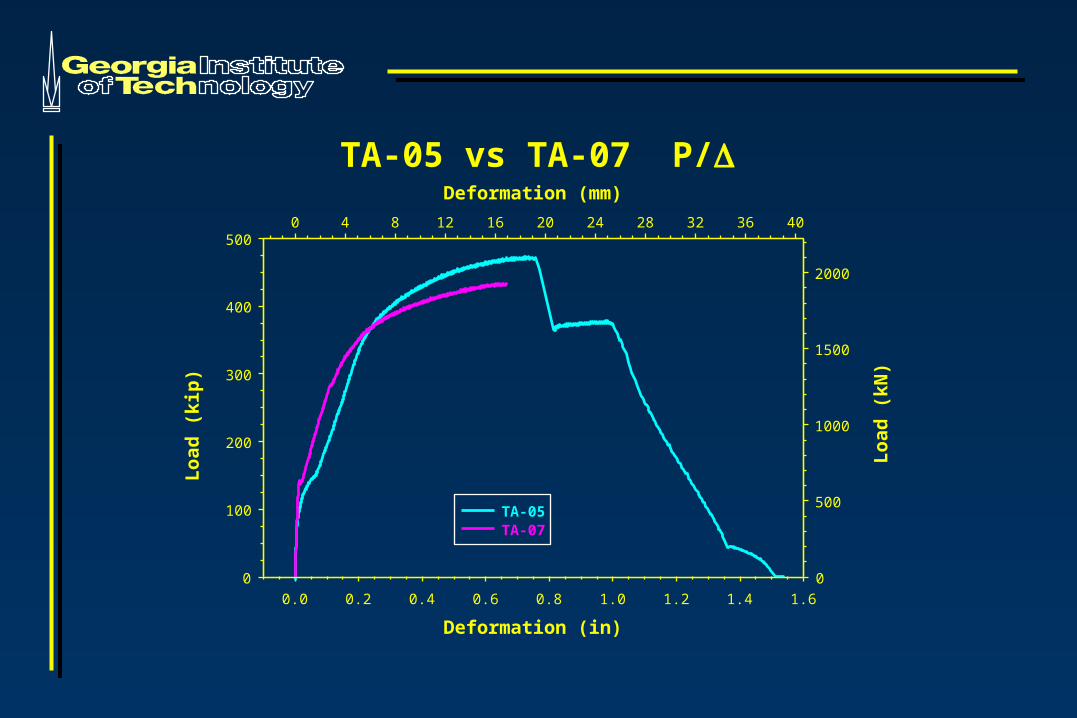
TA-05 vs TA-07 P/
Deformation (in)
0.0 0.2 0.4 0.6 0.8 1.0 1.2 1.4 1.6
Lo
ad (
kip
)
0
100
200
300
400
500
TA-05TA-07
Deformation (mm)
0 4 8 12 16 20 24 28 32 36 40
0
500
1000
1500
2000
Lo
ad (
kN)
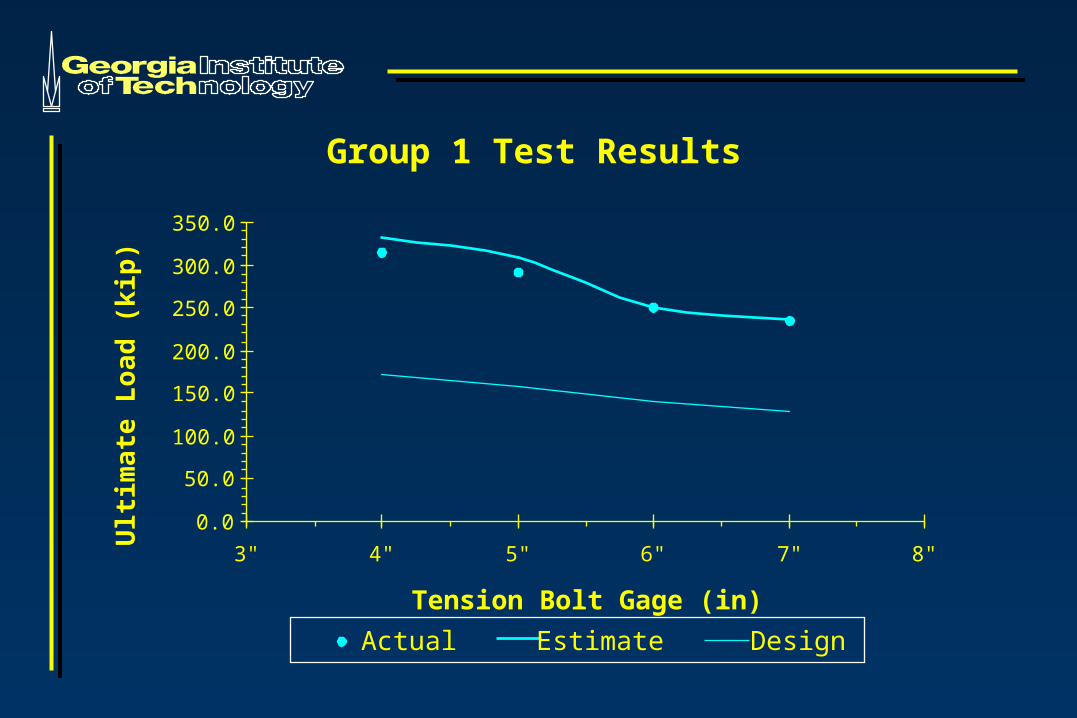
Group 1 Test Results
0.0
50.0
100.0
150.0
200.0
250.0
300.0
350.0
3" 4" 5" 6" 7" 8"
Tension Bolt Gage (in)
Ult
ima
te L
oa
d (
kip
)
Actual Estimate Design

TA-03 P/Bolt Force #3
Total Applied Load (kip)
-500 -400 -300 -200 -100 0 100 200 300 400 500
Bo
lt F
orc
e (k
ip)
0
10
20
30
40
50
60
70
80
90
100
Total Applied Load (kN)
-2000 -1500 -1000 -500 0 500 1000 1500 2000
Bo
lt F
orc
e (k
N)
0
50
100
150
200
250
300
350
400

SAC Test FS-03SAC Test FS-03
W21x44 beam
W14 x 145 column
T same as TD-01
7/8 in. A490 bolts
W21x44 beam
W14 x 145 column
T same as TD-01
7/8 in. A490 bolts
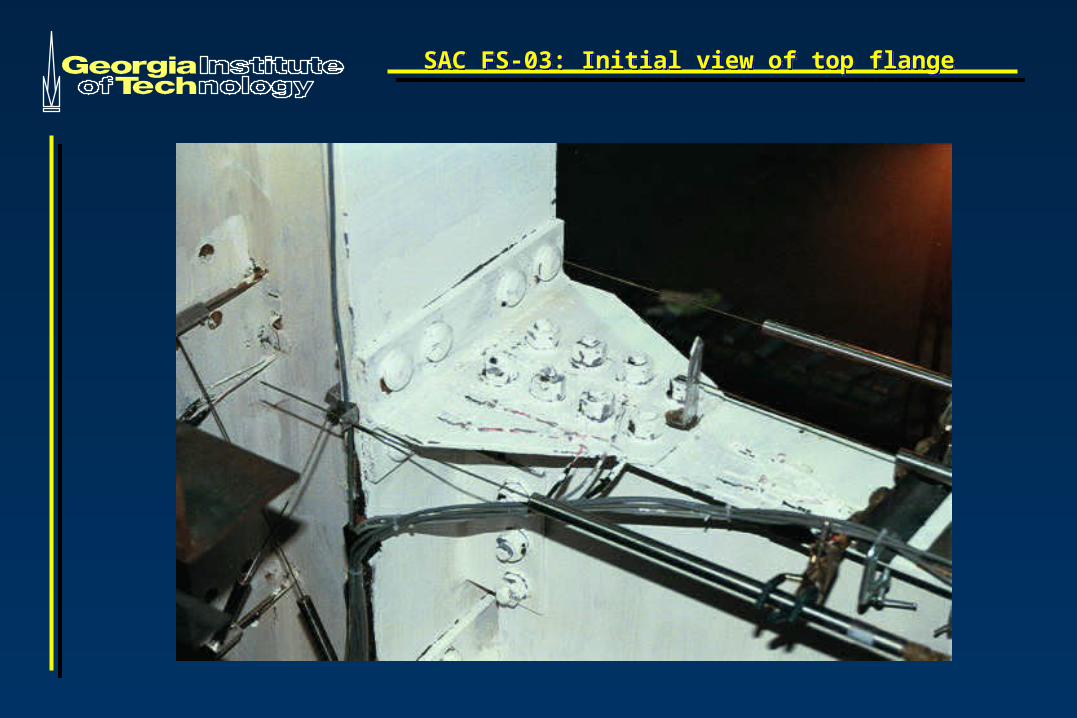
SAC FS-03: Initial view of top flangeSAC FS-03: Initial view of top flange
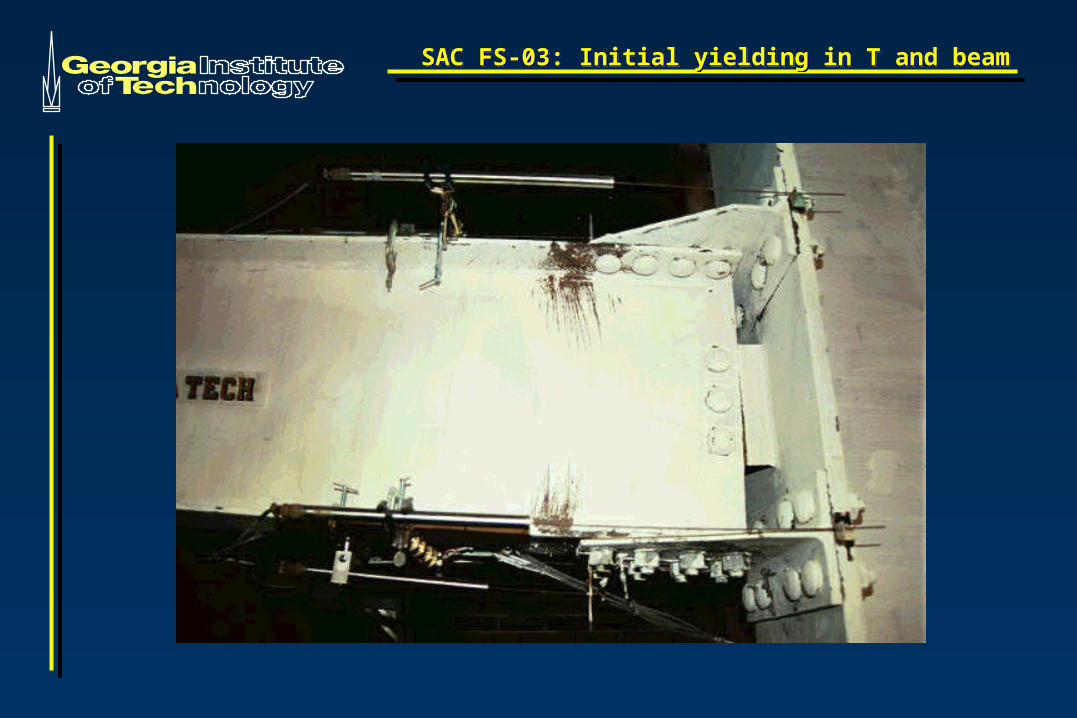
SAC FS-03: Initial yielding in T and beamSAC FS-03: Initial yielding in T and beam
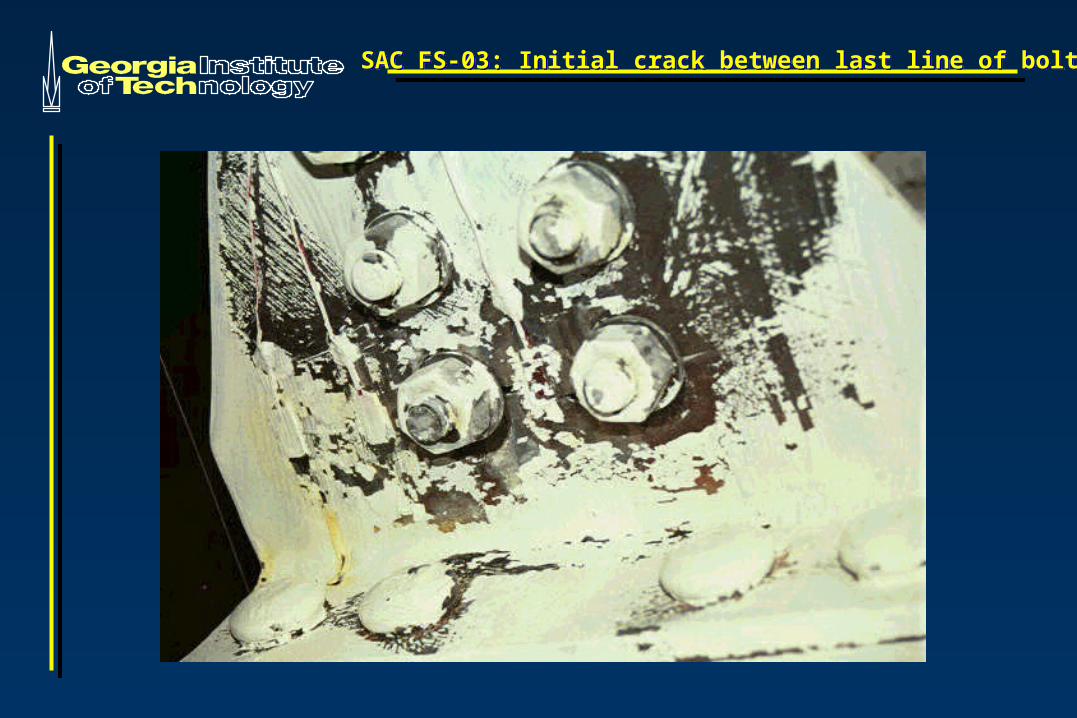
SAC FS-03: Initial crack between last line of boltsSAC FS-03: Initial crack between last line of bolts
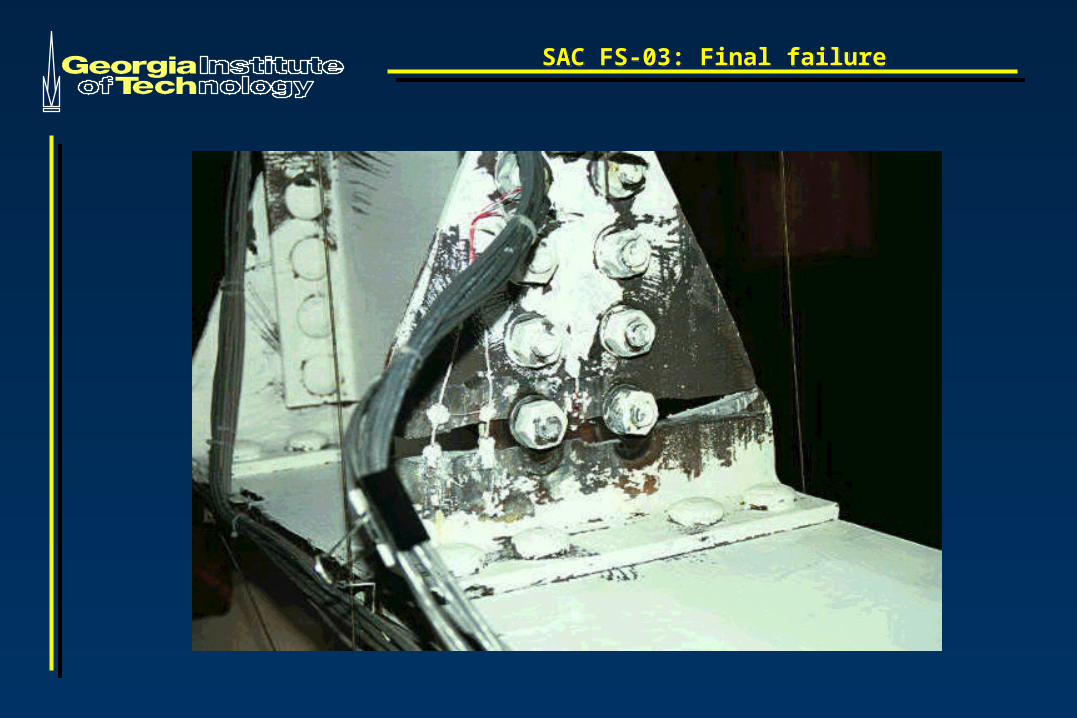
SAC FS-03: Final failureSAC FS-03: Final failure


Conclusions• The spring model should work well in predicting
stiffness characteristics.
• Net section fracture and block shear (after
extensive yielding) are the most desirable failure
modes because of their ductility.
• Component testing can provide a more
economical means of testing than conventional
full scale testing.

AcknowledgementsThe work presented here is funded by the Federal
Emergency Management Association (FEMA)
through a grant to SAC
• Structural Engineers Association of California (SEAOC)
• Applied Technology Council (ATC)
• California Universities for Research in Earthquake Engineering
(CUREe)