optimus system overview structural system of the optimus is designed by leslie e. robertson...
TRANSCRIPT
Punit G. Das | Structural Technical Report 3
December 2, 2012 The Optimus | India 1The
Opt
imus
Punit DasStructural OptionAdvisor: Dr. Linda Hanagan
AE SENIOR THESIS 2012-13TECHNICAL REPORT 3
Signature Boutique Offices India

Table of ContentsExecutive Summary! 3
Building Introduction! 4
Structural System Overview ! 6
Foundations 6
Gravity Framing System 7
Floor System 8
Lateral System 9Design Codes! 10
Materials! 12
Gravity Loads! 14
Lateral Loads! 17
Wind Loads 17
Seismic loads 22
Analysis of Lateral Loads 26
Finite Element Model 29Conclusion! 30
Appendix 1: Wind Loads! 31
Appendix 2: Seismic Loads! 49
Appendix 4: Spot check of Shear Wall! 53
Appendix 5: Story Drift! 57
Punit G. Das | Structural Technical Report 3
December 2, 2012 The Optimus | India 2

Executive SummaryThe third technical report consists of analysis of the lateral force resisting system of The Optimus. The 17 story, 252 ft tall reinforced concrete building is supported by reinforced concrete 8” flat slabs on reinforced concrete columns. The flat slabs contain 8” deep drop panels around the columns. The building facade is supported at the perimeter of the floor slabs. The 1st to the 3rd level of the building consist of parking spaces and 5th to 17th level consists of office spaces. The roof of the building houses a garden and a gymnasium. The structure of the building has been optimized and designed to fit with the architecture of the building.
The lateral force resisting system is an important part of the structural system that helps stabilize the building and supports the building form wind loads and earthquake effects. The lateral system of The Optimus consists of a reinforced shear wall core that spans from the base of the building to the roof. The Optimus contains 14 shear walls spanning North-South direction and 3 shear walls spanning in East-West direction. All the walls are concentrated around the elevator shaft and stairwells where continuity can be achieved in the wall system.
The lateral system analysis in this report starts with calculation of wind loads using ASCE 7-10 Directional procedure. The basic wind speed used to calculate wind loads is acquired from the weather data of the existing location of the building. Seismic loads are calculated using Equivalent Lateral Force Procedure in ASCE 7-10 and by relocating the building to a location with similar seismic behavior. The building was relocated because ASCE 7-10 does not contain seismic information for the existing location of the building.
The wind loads were distributed vertically to determine force at each story and the force at a typical story was distributed horizontally. Similarly, vertical distribution of seismic base shear was calculated. The horizontal distribution of wind and seismic loads was carried out using stiffness values of each shear wall. It was found that two shear walls were critical in carrying maximum shear and the largest wall was checked for shear and overturning moment. Also. the stiffness of every story was used to calculate drifts due to seismic and wind loads due to cracked as and un-cracked section of shear walls. It was found that the drifts at the top story were under the limiting deflection defined in ASCE 7-10.
Although finite element modeling of the building was performed, the report was not able to acquire appropriate results from the computer model. This was because of lack of simplification of the building elements. It was found that simplification of floor diaphragms to rigid-membrane elements and proper mesh size would help simplify the model for future computer analysis.
Punit G. Das | Structural Technical Report 3
December 2, 2012 The Optimus | India 3
Building Introduction
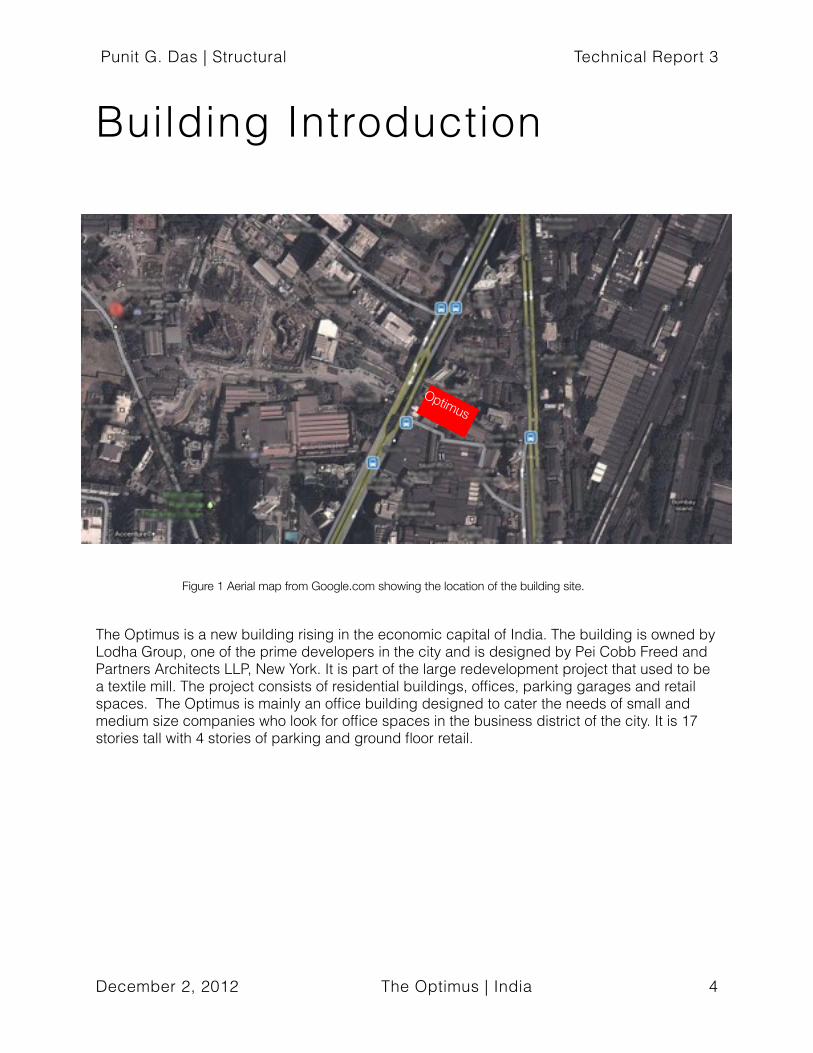
The Optimus is a new building rising in the economic capital of India. The building is owned by Lodha Group, one of the prime developers in the city and is designed by Pei Cobb Freed and Partners Architects LLP, New York. It is part of the large redevelopment project that used to be a textile mill. The project consists of residential buildings, offices, parking garages and retail spaces. The Optimus is mainly an office building designed to cater the needs of small and medium size companies who look for office spaces in the business district of the city. It is 17 stories tall with 4 stories of parking and ground floor retail.
Punit G. Das | Structural Technical Report 3
December 2, 2012 The Optimus | India 4
Optimus
Figure 1 Aerial map from Google.com showing the location of the building site.

The design of The Optimus is functional and elegant. Although the building is located in tight boundaries it makes efficient use of space by expanding vertically. To cater the requirements of the offices, it offers open and customizable floor space. The spacing of the structural and architectural elements offer flexible partitioning for office areas. The building provides recreational facilities that include a gymnasium, roof garden, green balcony spaces at every floor and a garden at the lobby area. The 2 basements and first 3 levels are dedicated to parking with 5th level as garden, lobby and office. The office spaces start from 6 to 17th story and 18th
story contains a roof garden.
Just like the interior, the exterior of the building is efficient in utilizing the available resources at the same time maintaining its aesthetic qualities. The envelope of the building is designed to fit into the fabric of the city which also becomes an important architectural feature of the building. Three kinds of materials decorate the facade: metal, stone and plants. The north facade, that faces residential apartments, provides a view of green wall to the apartment buildings and the south facade provides a panoramic view of the city to all the office spaces.
The south facade is dominated by a bold and modern look with metal cladding and windows offset inside to provide solar shading in the interior. The front facade facing the main street shows a play of all materials on the facade: stone, metal and green wall giving a rich look to
the building front.
The structure of the building complements the architectural features. A successful building is achieved when its structure and architecture integrate without compromise. The structure plays an important role in facilitating the show of different materials on the facade and in achieving an open floor plan. Most of the columns in the floor area are pushed to the exterior so that interior is open. The facade forms the skin of the building concealing the columns and overall structural system of the building. This facilitates different architectural features in the exterior and interior of the building.
Punit G. Das | Structural Technical Report 3
December 2, 2012 The Optimus | India 5
Figure 2 Rendering showing roof garden
Figure 3 Rendering of the building entrance
Figure 4 Rendering of the building facade
Structural System OverviewStructural system of The Optimus is designed by Leslie E. Robertson Associates (Mumbai). It has been optimized to increase floor space area, to celebrate the architecture and economize the overall cost of the building. In order to achieve these goals, reinforced concrete was chosen as a prime material to design the structural members. The properties of concrete allow fluidity in design. It also facilitates design changes during construction. Concrete is a preferred material over steel for construction in India because it is readily available. Also, the labor for concrete based construction is cheaper as compared to steel The structural system of the building consists of flat slabs supported by columns and shear walls that sit on a mat foundation.
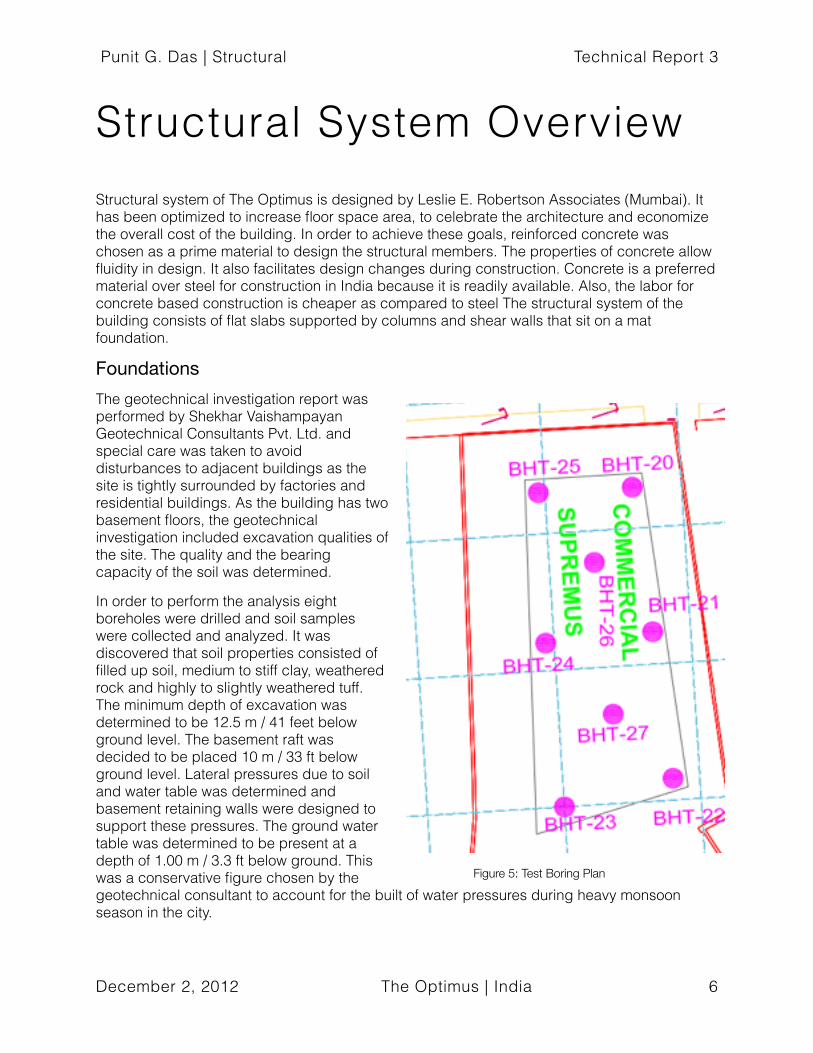
FoundationsThe geotechnical investigation report was performed by Shekhar Vaishampayan Geotechnical Consultants Pvt. Ltd. and special care was taken to avoid disturbances to adjacent buildings as the site is tightly surrounded by factories and residential buildings. As the building has two basement floors, the geotechnical investigation included excavation qualities of the site. The quality and the bearing capacity of the soil was determined.
In order to perform the analysis eight boreholes were drilled and soil samples were collected and analyzed. It was discovered that soil properties consisted of filled up soil, medium to stiff clay, weathered rock and highly to slightly weathered tuff. The minimum depth of excavation was determined to be 12.5 m / 41 feet below ground level. The basement raft was decided to be placed 10 m / 33 ft below ground level. Lateral pressures due to soil and water table was determined and basement retaining walls were designed to support these pressures. The ground water table was determined to be present at a depth of 1.00 m / 3.3 ft below ground. This was a conservative figure chosen by the geotechnical consultant to account for the built of water pressures during heavy monsoon season in the city.
Punit G. Das | Structural Technical Report 3
December 2, 2012 The Optimus | India 6
Figure 5: Test Boring Plan

Gravity Framing System
The reinforced concrete framing system of The Optimus is developed to fit different types of floor spaces from the basement to top floor. The column, beam and slab system are chosen to fit with the architecture of the building as well as to act as architectural elements.
Architecture and structural system integration is seen in the columns of the building that change its cross sectional properties and layout as the space progresses from basement to the top of the building. The columns from the basement to the level 5 are rectangular and oriented parallel to the parking spaces. These rectangular columns transition to circular and square columns in office spaces from level 5 to the top level. This transition occurs with the use of transfer girders, columns brackets and adjustments to account for eccentricity in the columns. The columns sizes range from 1.5 ft to 3 ft in width and 1.5 ft to 7 ft in length. Circular columns range from 1.5 ft to 3 ft in diameter in the office areas. the building has a peculiar column with cross section of a parallelogram. This column is located at the entrance of the building and defines the corner of the building from the base to the top adding to the architecture.
Beams integrated with flat slab are present in the parking areas.Transfer girders are present at the fifth level where the floor plan changed from parking to office. Beams are also used to transfer lateral loads from facade to the shear walls. The 8 - 12 inch slabs connect to the columns with drop panels ranging about 8 in additional depth. Drop panels mainly exist at parking spaces and thin drops are added at slabs in office spaces. The slabs also create interaction between the columns and core walls of the building and help distributing gravity loads.
Punit G. Das | Structural Technical Report 3
December 2, 2012 The Optimus | India 7
Basement parking
Office spaces
Upper level parking
Circular columns in office areas (red)
Smaller circular columns at higher stories (cyan)
Rectangular columns in parking (yellow)
Figure 6: ETABS model, 3D view extruded.
Floor System
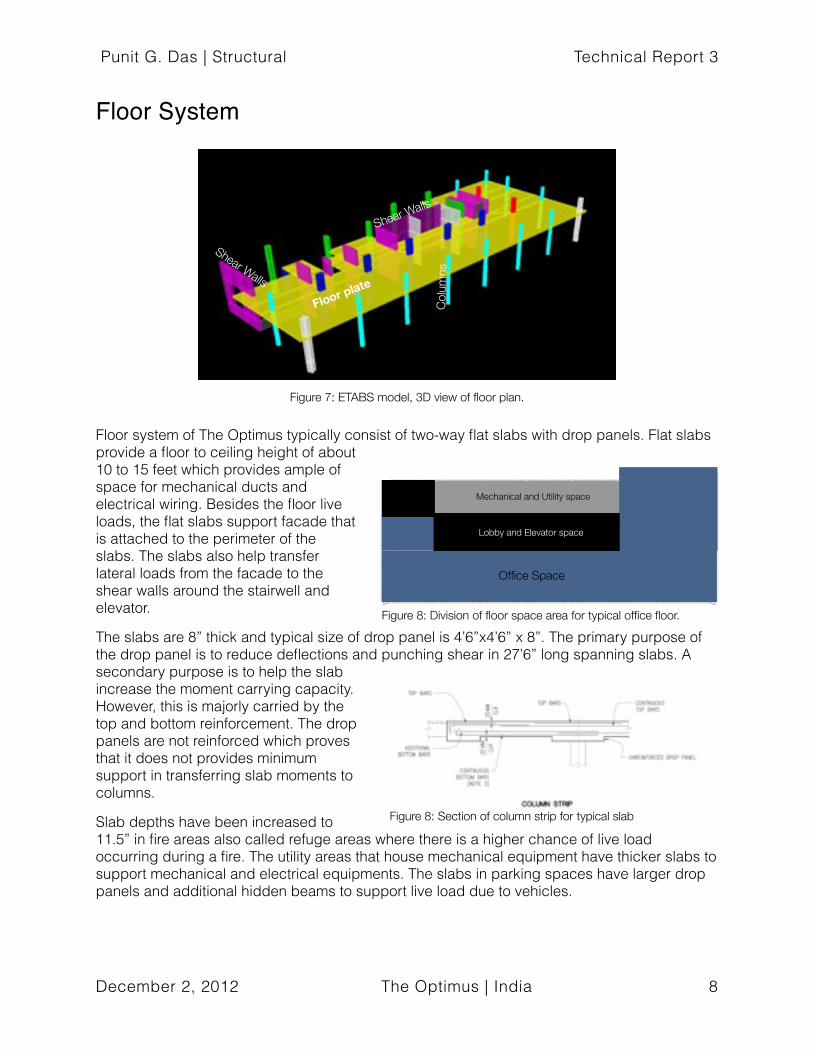
Floor system of The Optimus typically consist of two-way flat slabs with drop panels. Flat slabs provide a floor to ceiling height of about 10 to 15 feet which provides ample of space for mechanical ducts and electrical wiring. Besides the floor live loads, the flat slabs support facade that is attached to the perimeter of the slabs. The slabs also help transfer lateral loads from the facade to the shear walls around the stairwell and elevator.
The slabs are 8” thick and typical size of drop panel is 4’6”x4’6” x 8”. The primary purpose of the drop panel is to reduce deflections and punching shear in 27’6” long spanning slabs. A secondary purpose is to help the slab increase the moment carrying capacity. However, this is majorly carried by the top and bottom reinforcement. The drop panels are not reinforced which proves that it does not provides minimum support in transferring slab moments to columns.
Slab depths have been increased to 11.5” in fire areas also called refuge areas where there is a higher chance of live load occurring during a fire. The utility areas that house mechanical equipment have thicker slabs to support mechanical and electrical equipments. The slabs in parking spaces have larger drop panels and additional hidden beams to support live load due to vehicles.
Punit G. Das | Structural Technical Report 3
December 2, 2012 The Optimus | India 8
Floor plate
Col
umns
Shear Walls
Shear Walls
Office Space
Lobby and Elevator space
Mechanical and Utility space
Figure 7: ETABS model, 3D view of floor plan.
Figure 8: Division of floor space area for typical office floor.
Figure 8: Section of column strip for typical slab

Lateral System
The Main Lateral Force Resisting System consists of shear walls present at the core of the building. The shear walls envelope the elevator and stairwell which is the best way to achieve
continuity in the walls from bottom to the top without adding obstructions in the floor area. The walls span from the base to of the building to the roof and range 8 inch to 20 inch thick. The walls connect to each other through the floor slab or link beams to act as a unified system against wind and seismic forces. There are 14 short length walls in the North-South direction and 3 long shear walls in the East-West direction. The shear wall X1 in the East-West direction is a major element that is 47 ft long 16 inch thick supporting the transverse loads. The wall Y1 is a major element in supporting loads due to torsion because the wall is located farthest from the center of rigidity giving a larger moment arm.
Punit G. Das | Structural Technical Report 3
December 2, 2012 The Optimus | India 9
Y1 Y2
Y3
Y5
Y4 Y6Y7 Y8 Y9 Y10 Y11 Y12 Y13 Y14
X1X2
X3
Figure 9: Shear Walls labelled for a typical office floor plan.
Figure 10: Shear walls in 3D extruded view.

Design CodesAs the building is located in India, the Indian Standard (IS) code is used to design The Optimus. However, the American codes are used in this report while performing analysis. This will also provide a comparison between the two codes and also a look into the design from the perspective of the american rules.
• Minimum design loads for Buildings other than seismic loadsIS Code Description
IS 875 (Part 1): 1987 Dead loads IS 875 (Part 2): 1987 Imposed loadsIS 875 (Part 3): 1987 Wind loadsIS 875 (Part 5): 1987 Special loads and load combinations
• Seismic Provisions for buildingsIS Code Description
IS 1893: 2002 Criteria for earthquake resistance design of structure
IS 4326: 1993 Earthquake resistant design and Construction of Buildings - Code of Practice
IS 13920: 1993 Ductile Detailing of Reinforced concrete Structures subjected for Seismic Forces - Code of Practice
• Building code requirements for Structural Concrete:IS Code Description
IS 456: 2000 Plain and Reinforced Concrete - Code of practice
SP 16 Structural use of concrete. Design charts for singly reinforced beams, doubly reinforced beams and columns.
SP 34 Handbook on Concrete Reinforcement & Detailing
IS 1904 Indian Standard Code of practice for design and construction foundations in Soil: General Requirements
Punit G. Das | Structural Technical Report 3
December 2, 2012 The Optimus | India 10

IS Code Description
IS 2950 Indian Standard Code of Practice for Design and Construction of Raft Foundation (Part –1)
IS 2974 Code of practice for design & construction of machine foundation
IS 2911 Code of practice for design & construction of Pile foundation (Part I 1o IV)
• Building code used for Structural SteelIS Code Description
IS 800: 1984 Code of practice for general construction in Steel
• Design codes to be used for Tech 3 American codes to analyze the existing conditions.
American Code Description
ACI 318-11 Concrete Design CodeASCE 7-10 Minimum design loads for
Buildings and Structures for Dead, Live, Wind and Seismic loads.
Punit G. Das | Structural Technical Report 3
December 2, 2012 The Optimus | India 11

MaterialsMaterials used on this project help achieve efficiency in the structural system. This is achieved by economizing the use of material with respect to increasing height. Hence, higher strength concrete is used in the shear walls and columns in the lower floors. As we go higher, the material strength decreases.
Use of the material Indian Code American Code
Material Equivalent Material
Raft and pile foundations
M40 5000 psi
PCC M15 3000 psislabs and beams M40 5000 psi
Perimeter basement wall except Grid A
M40 5000 psi
Perimeter basement wall on Grid A
M60 7000 psi
Walls, Columns and Link beams from
foundation for 5th floor
M60 7000 psi
Walls, Columns and Link beams from 5th
floor to above
M40 5000 psi
Punit G. Das | Structural Technical Report 3
December 2, 2012 The Optimus | India 12

ConcreteConcreteConcreteConcreteConcreteConcreteIndian CodeIndian CodeIndian Code American CodeAmerican CodeAmerican Code
Concrete Grade
f’c (psi) Ec (ksi) Equivalent Concrete type
f’c Ec = 57000√f’c (ksi)
M60 7000 5614.3 High strength concrete 28 days
7000 psi 4768.9
M40 4700 4584.3 Ordinary ready mix 5000 psi 4030.5M15 1750 2807.2 Ordinary ready mix 3000 psi 3122.01
fck is 28 compressive strength for 150mmx150mm cube.
Poission’s ratio = 0.2
Coefficient of thermal expansion = 9.9x10-0.6 per deg C.
fck is 28 compressive strength for 150mmx150mm cube.
Poission’s ratio = 0.2
Coefficient of thermal expansion = 9.9x10-0.6 per deg C.
fck is 28 compressive strength for 150mmx150mm cube.
Poission’s ratio = 0.2
Coefficient of thermal expansion = 9.9x10-0.6 per deg C.
f’c - specified compressive strength of concrete.
Coefficient of thermal expansion = 5.5x10⁻⁶ per deg F.
Poissions ratio = 0.2
f’c - specified compressive strength of concrete.
Coefficient of thermal expansion = 5.5x10⁻⁶ per deg F.
Poissions ratio = 0.2
f’c - specified compressive strength of concrete.
Coefficient of thermal expansion = 5.5x10⁻⁶ per deg F.
Poissions ratio = 0.2ReinforcementReinforcementReinforcementReinforcementReinforcementReinforcement
According to IS: 1786 Fe 415 (Fy = 415 MPa/ 60 ksi) or Fe 500 (Fy = 500 MPa) steel bars are used.
According to IS: 1786 Fe 415 (Fy = 415 MPa/ 60 ksi) or Fe 500 (Fy = 500 MPa) steel bars are used.
According to IS: 1786 Fe 415 (Fy = 415 MPa/ 60 ksi) or Fe 500 (Fy = 500 MPa) steel bars are used.
According to ASTM A615, deformed and plain carbon steel bars are used with Fy = 60 ksi. According to ASTM A615, deformed and plain carbon steel bars are used with Fy = 60 ksi. According to ASTM A615, deformed and plain carbon steel bars are used with Fy = 60 ksi.
Punit G. Das | Structural Technical Report 3
December 2, 2012 The Optimus | India 13

Gravity LoadsThe dead, superimposed and live loads used on the project are referred to IS Code provisions whereas the report uses ASCE 7-10 provisions to calculate live loads. The superimposed dead loads that are used are provided by the structural engineer because they are loads from actual materials like floor finishes used on the project. The difference in live loads and calculation procedures like Live load reduction will cause difference in analysis results. However, the assumption is that indian code gives conservative results because it accounts for contingencies in construction and materials used on the project. The tables below show the difference in loading values between the IS code and ASCE 7-10 provisions.
• Typical Dead LoadsIS Code (kN/ m3) ACI 318-11 / ASCE 7-10 (lb / ft3)
Normal weight Concrete 25.00 150Floor finishes / Plasters 20.00 140
Loading Area Type of Load IS Code (kN/ m2)ACI 318-11 / ASCE 7-10
(lb / ft2)
Parking Space and Drive-way
Superimposed Dead Load 1.75 36.6
Parking Space and Drive-way
Live Load (vehicles) 2.50 non-reducible 40 non-reducibleParking Space and Drive-way
Live Load (fire truck over ground floor) 15.00 non-reducible
300 (AASHTO LRFD Bridge design
standards) - non-reducible
Covered Entryway over ground floor
Superimposed Dead Load 7.25 151.4Covered Entryway
over ground floorLive Load 4.00 100
Entrance Lobby, Elevator lobbies
Superimposed Dead Load 2.00 41.8Entrance Lobby,
Elevator lobbiesLive Load 3.00 100
Mechanical Floor Superimposed Dead Load
2.00 41.8Mechanical Floor
Live Load 7.50 Non-reducible 150 non-reducible
Electrical room over ground floor
Superimposed Dead Load 2.00 41.8Electrical room
over ground floorLive Load 13.50 non-reducible 282 non-reducible
Punit G. Das | Structural Technical Report 3
December 2, 2012 The Optimus | India 14

Loading Area Type of Load IS Code (kN/ m2)ACI 318-11 / ASCE 7-10
(lb / ft2)
StairsSuperimposed Dead
Load 1.50 31.33Stairs
Live Load 3.00 100
Toilet roomsSuperimposed Dead
Load 4.50 94Toilet rooms
Live Load 2.00 40
Typical OfficeSuperimposed Dead
Load 3.00 62.7Typical Office
Live Load 4.00 100
Retail over ground floor
Superimposed Dead Load 4.575 95.6Retail over ground
floorLive Load 4.00 100
Eatery and UtilitySuperimposed Dead
Load 3.00 62.7Eatery and Utility
Live Load 5.00 100
Outdoor Utility over Level 105, 107 and similar
Superimposed Dead Load 5.625 117.5Outdoor Utility
over Level 105, 107 and similar
Live Load 5.00 100
Planted Terrace Superimposed Dead Load 12.50 261.1Planted Terrace
Live Load 3.00 100
Amenity / Fitness Center
Superimposed Dead Load 3.50 73.10Amenity / Fitness
CenterLive Load 5.00 100
Water tank over level 119
Superimposed Dead Load 3.50 73.1Water tank over
level 119Live Load 35 non-reducible 731 non-reducible
Electrical Panel room at ground
floor
Superimposed Dead Load 2.00 41.8Electrical Panel
room at ground floor
Live Load 13.50 non-reducible 282 non-reducible
RoofSuperimposed Dead
Load 5.50 114.9Roof
Live Load 3.00 Non-reducible 100 non-reducible
Punit G. Das | Structural Technical Report 3
December 2, 2012 The Optimus | India 15

Loading Area Type of Load IS Code (kN/ m2)ACI 318-11 / ASCE 7-10
(lb / ft2)
Peripheral loads Superimposed Dead line load over wall
surface0.75 15.7
• Live load reduction According to IS 875 (part 2) - 1987, section 3.2, live load has been reduced.
IS CodeIS Code ASCE 7-10
Walls, columns, piers, their supports and foundation:
Walls, columns, piers, their supports and foundation:
Reduction in live loads is carried out as per the provision in ASCE 7-10 Section 4.7.2/
Number of floors supported
% reduction in total live load
Reduction in live loads is carried out as per the provision in ASCE 7-10 Section 4.7.2/
1
2
3
4
5 to 10
over 10
0
10
20
30
40
50 Reduction in live loads is carried out as per the provision in ASCE 7-10 Section 4.7.2/
Beams, girders and trussesBeams, girders and trusses
Reduction in live loads is carried out as per the provision in ASCE 7-10 Section 4.7.2/
Supported Area % reduction in total live load
Reduction in live loads is carried out as per the provision in ASCE 7-10 Section 4.7.2/
less than 50m2
50m2 to 100 m2
100m2 to 150 m2
150m2 to 200 m2
200m2 to 250m2
Over 250 m2
0
5
10
15
20
25
Reduction in live loads is carried out as per the provision in ASCE 7-10 Section 4.7.2/
Punit G. Das | Structural Technical Report 3
December 2, 2012 The Optimus | India 16

Lateral LoadsWind and Seismic loads were calculated using ASCE 7-10 provisions. Wind pressures were used to find story forces and seismic base shear and mass of stories was used to find the story force due to seismic loads. The calculations are performed manually in Appendix 1.
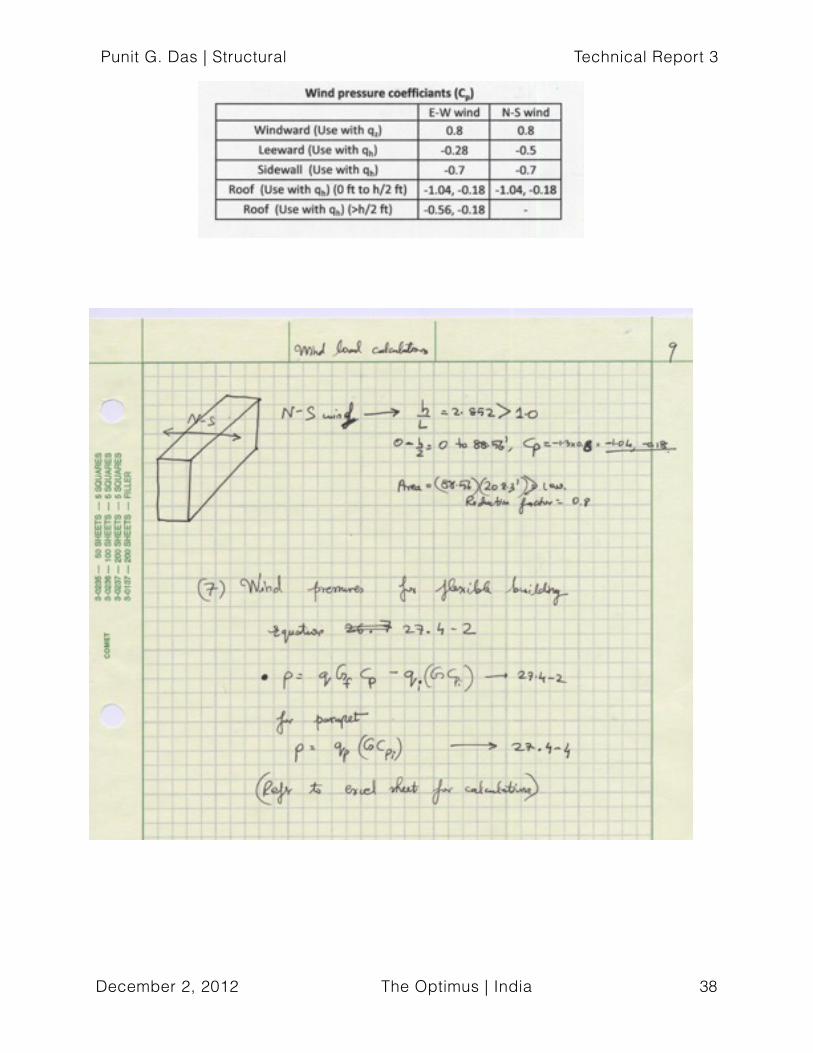
Wind LoadsThe wind loads were calculated using the ASCE 7-10 Part 1 of the MWFRS Directional Procedure (Chapter 27). This procedure was chosen as appropriate for hand calculations and computer analysis because the building height is greater than 60 ft and is fairly enclosed. The windward, leeward, sidewall and roof pressured were also calculated using the directional procedure.
The basic wind speed (98.4 miles/hour) was determined from the weather data of the existing location in India. The behavior of the wind is dominated by the location of the building that is closer to the sea. This was the reason why exposure category D was chosen for wind pressure coefficient. Other parameters were chosen based on the location, the shape of the building and the simplifications made for ease of calculation. The exterior walls of the building were projected onto East-West and North-South planes and building was simplified to a cuboid. The mean roof height of the building is the distance from the ground to the top of the ceiling of the roof gymnasium, also termed as parapet wall by the architect. The envelope of the roof top gymnasium was termed as parapet walls because it’s the part of the building where shear walls don’t exist and a separate roof top structure.
The simplification made also affected the calculation of the natural frequency of the building. Consequently, this affect the determinations of gust effects on the building. As the the lateral force resisting system of the building consist of shear wall core, the following formula was used from ASCE 7-10 to calculate the natural frequency of the building.
The net wind pressures were calculated using gust effect factors,
Punit G. Das | Structural Technical Report 3
December 2, 2012 The Optimus | India 17

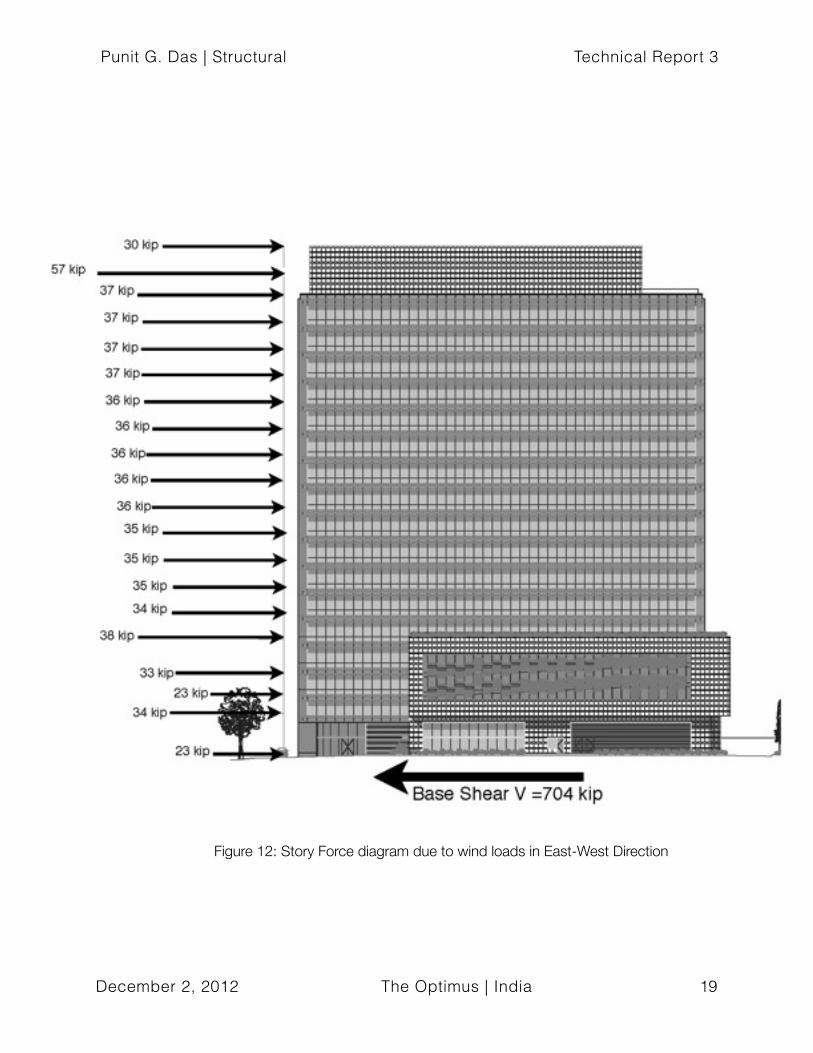
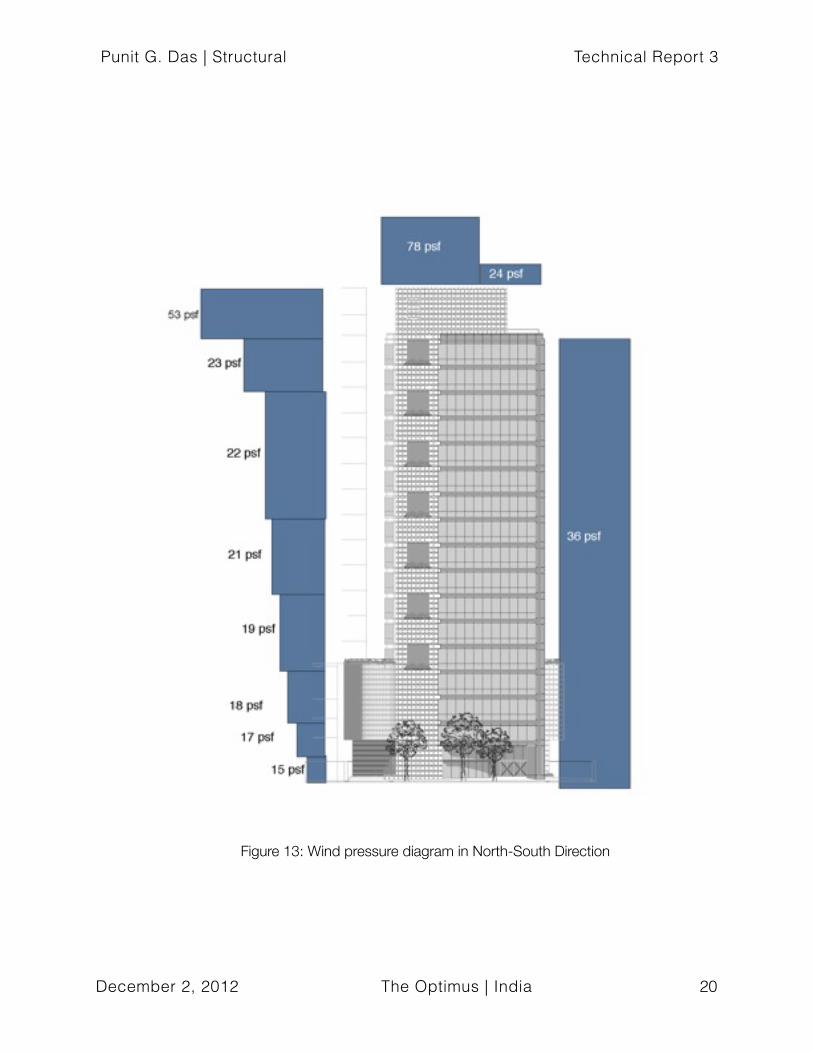
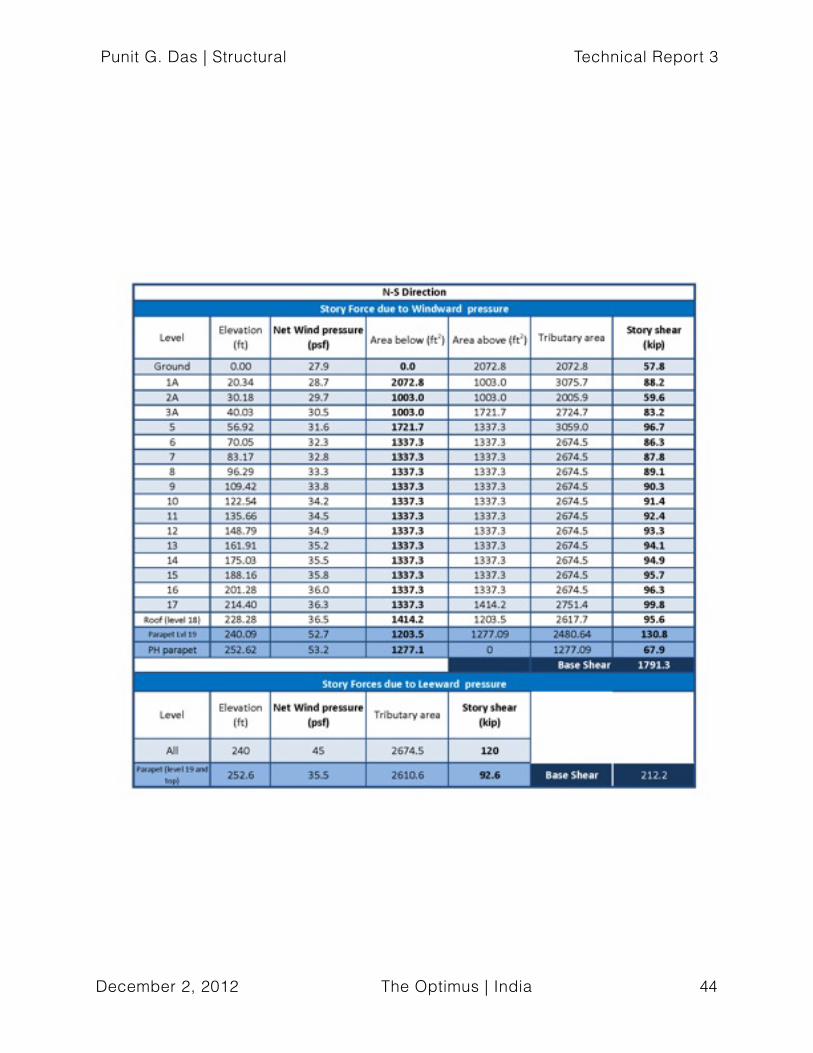
wind load parameters and internal pressures of the building. Wind pressures resulted in higher base shear in the North-South direction as compared to East-West direction which is evident because of the slender shape in the building and higher surface area in the north-south direction. The story forces are collected by the facade which is supported at the perimeter of the floor slab. The floor slab is flat slab assumed to be a rigid diaphragm. The forces from the facade are transferred to the shear walls through the floor slab.
Punit G. Das | Structural Technical Report 3
December 2, 2012 The Optimus | India 18
Figure 11: Wind pressure diagram in East-West Direction
Punit G. Das | Structural Technical Report 3
December 2, 2012 The Optimus | India 19
Figure 12: Story Force diagram due to wind loads in East-West Direction
Punit G. Das | Structural Technical Report 3
December 2, 2012 The Optimus | India 20
Figure 13: Wind pressure diagram in North-South Direction

Punit G. Das | Structural Technical Report 3
December 2, 2012 The Optimus | India 21
Figure 14: Story Force diagram due to wind loads in North-South Direction

Seismic loads
The seismic loads were calculated using Equivalent Lateral Force Procedure from ASCE 7-10 Chapter 12.8. In order to calculate seismic base shear, the ground accelerations were not available for the existing location in ASCE 7-10. Therefore, the building was relocated to a location with similar seismic activity - New York. It was determined from USGS seismic world maps that the seismic behavior of New York is similar to the existing location of the building. However, the soil characteristics remained the same that was available in the geotechnical report of the location of the building. As the lateral system of the building is a reinforced shear wall, it falls in Seismic Design Category C according to Table 12.2-1, ASCE 7-10 and Seismic Risk Category I in ASCE 7-10. The approximate time period of the building was calculated to be 1.41 seconds using the following formula provided in ASCE 7-10.
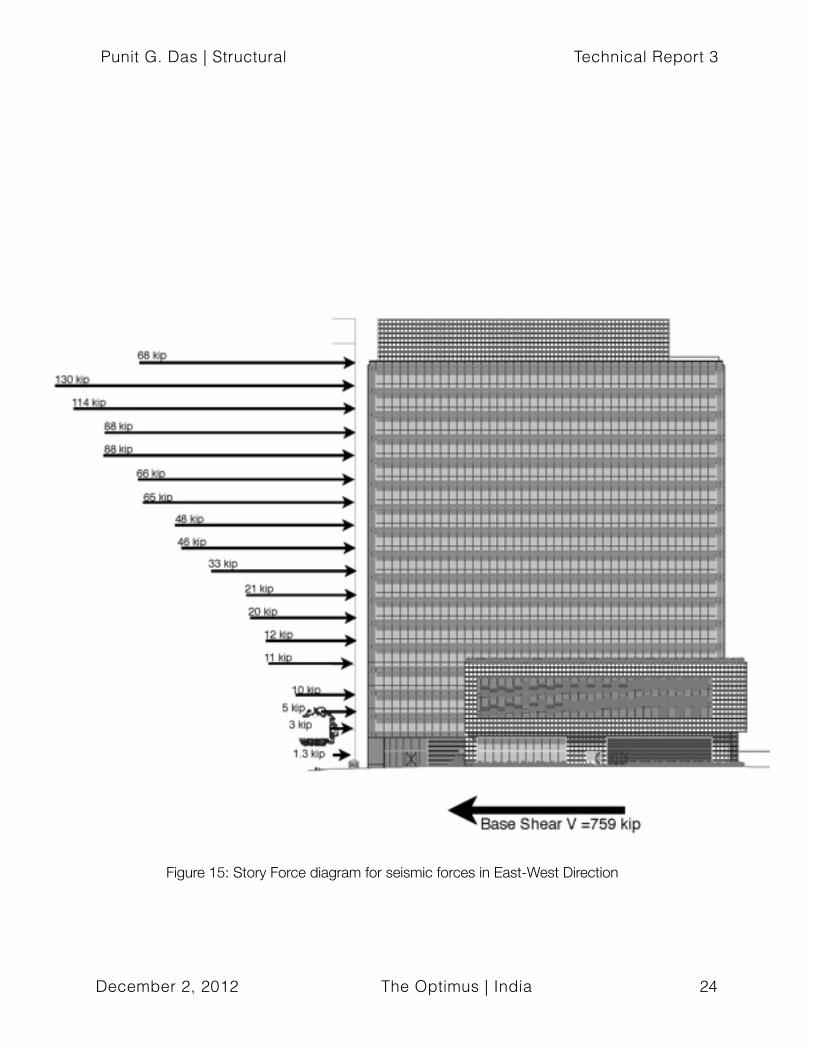
The ground accelerations and time period was used to calculate the seismic design coefficient. This was further used factor the seismic weight of the building to get the effective seismic weight and finally, the seismic base shear of the building. According to ASCE 7-10, the seismic weight of the building consist of self-weight of members, superimposed dead loads and 25% of the live loads. As the formula for time period does not differ for North-South and East-West directions, the seismic coefficient remains the same and also, the base shear. Conceptually, the building will have a higher time period in the North-South direction of the slender shape and consequently, a lower base shear. However, it would be a conservative approach to use same base shear in both directions. Also, using this conservative approach did not make seismic loads to control the lateral system. Generally, it is assumed that the lateral system tall buildings is controlled by wind loads which was found to be true in the analysis that is explained further in the report.
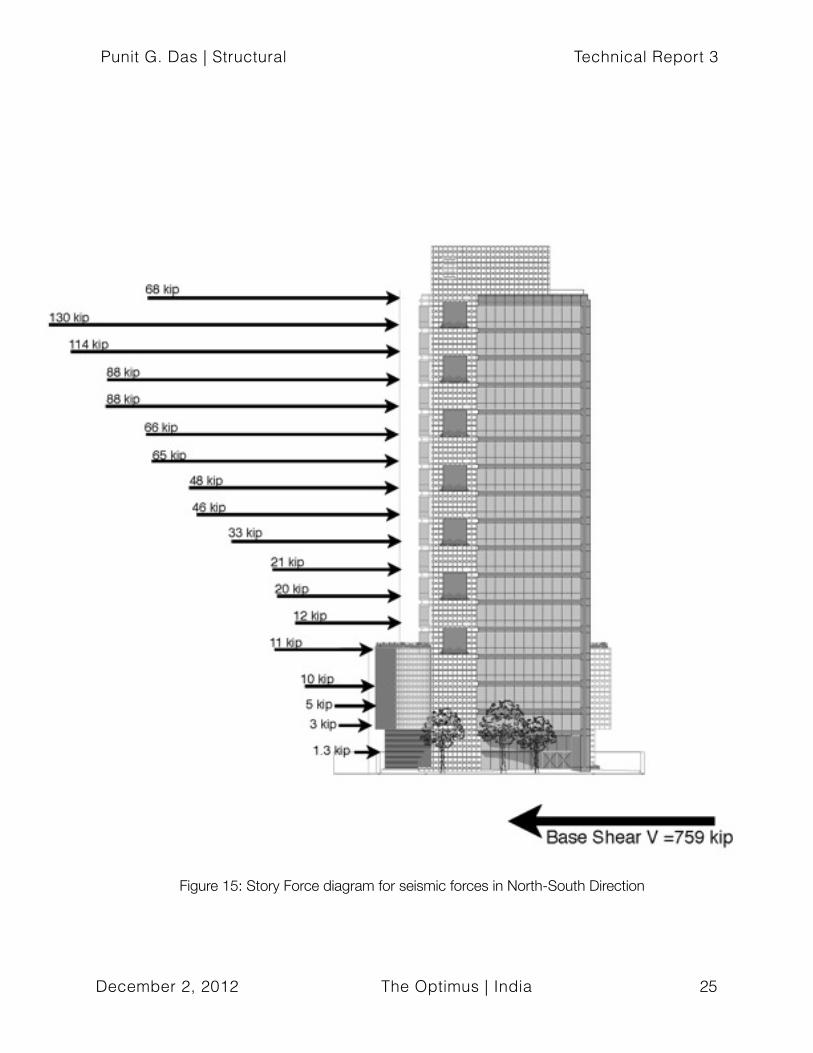
The seismic base shear was vertically distributed according to the mass of each story and further, distributed horizontally among the shear walls according to the stiffness. The stiffer shear walls attracted greater shear forces. The calculation of horizontal distribution of forces and story drifts for wind and seismic loads are explained and compared further in analysis section of the report.
Punit G. Das | Structural Technical Report 3
December 2, 2012 The Optimus | India 22

Punit G. Das | Structural Technical Report 3
December 2, 2012 The Optimus | India 23
Punit G. Das | Structural Technical Report 3
December 2, 2012 The Optimus | India 24
Figure 15: Story Force diagram for seismic forces in East-West Direction
Punit G. Das | Structural Technical Report 3
December 2, 2012 The Optimus | India 25
Figure 15: Story Force diagram for seismic forces in North-South Direction
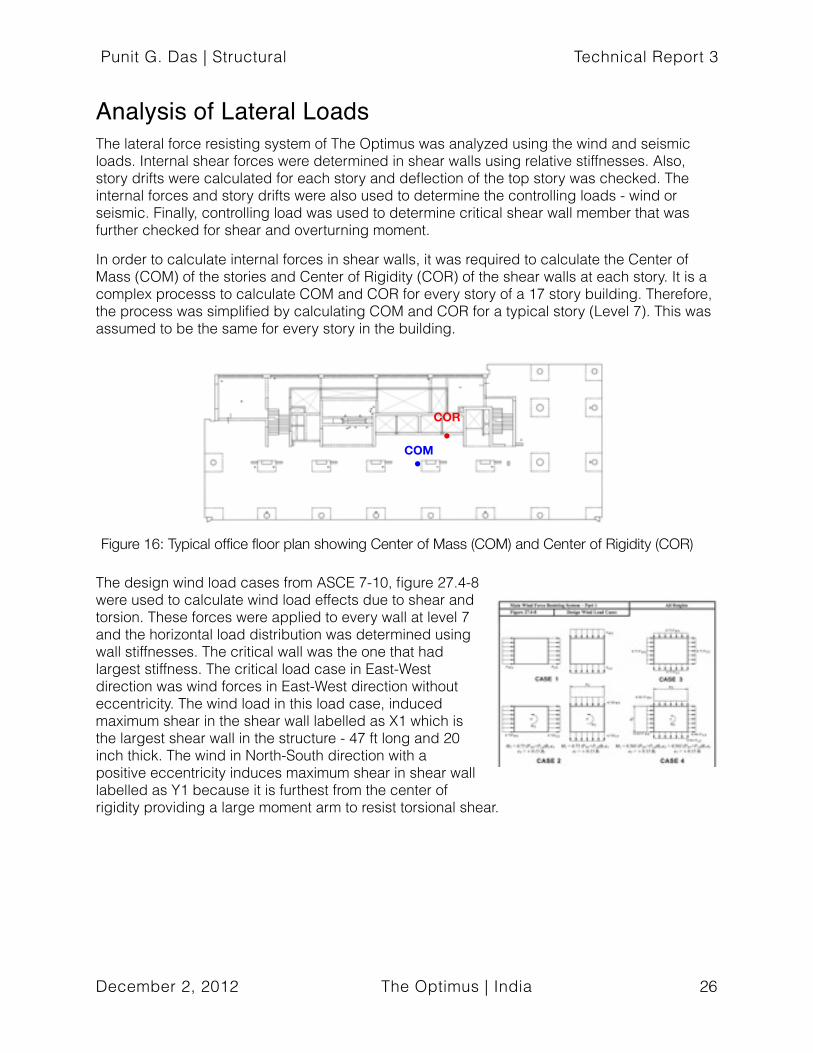
Analysis of Lateral LoadsThe lateral force resisting system of The Optimus was analyzed using the wind and seismic loads. Internal shear forces were determined in shear walls using relative stiffnesses. Also, story drifts were calculated for each story and deflection of the top story was checked. The internal forces and story drifts were also used to determine the controlling loads - wind or seismic. Finally, controlling load was used to determine critical shear wall member that was further checked for shear and overturning moment.
In order to calculate internal forces in shear walls, it was required to calculate the Center of Mass (COM) of the stories and Center of Rigidity (COR) of the shear walls at each story. It is a complex processs to calculate COM and COR for every story of a 17 story building. Therefore, the process was simplified by calculating COM and COR for a typical story (Level 7). This was assumed to be the same for every story in the building.
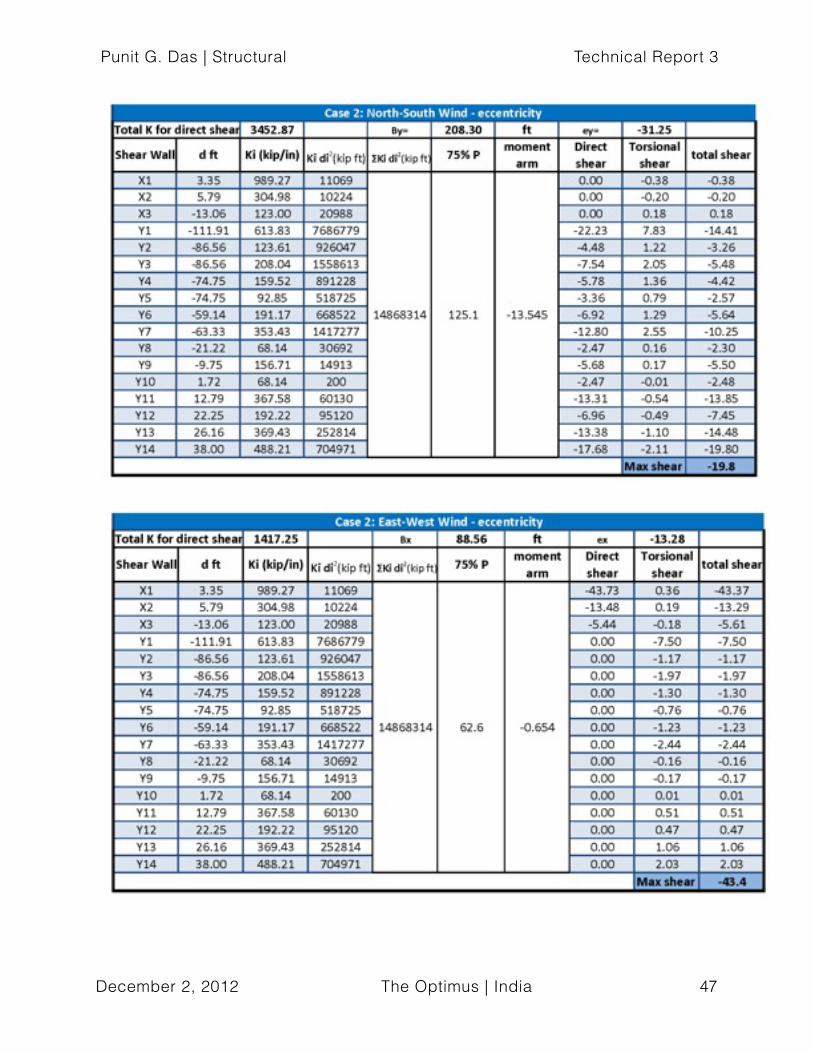
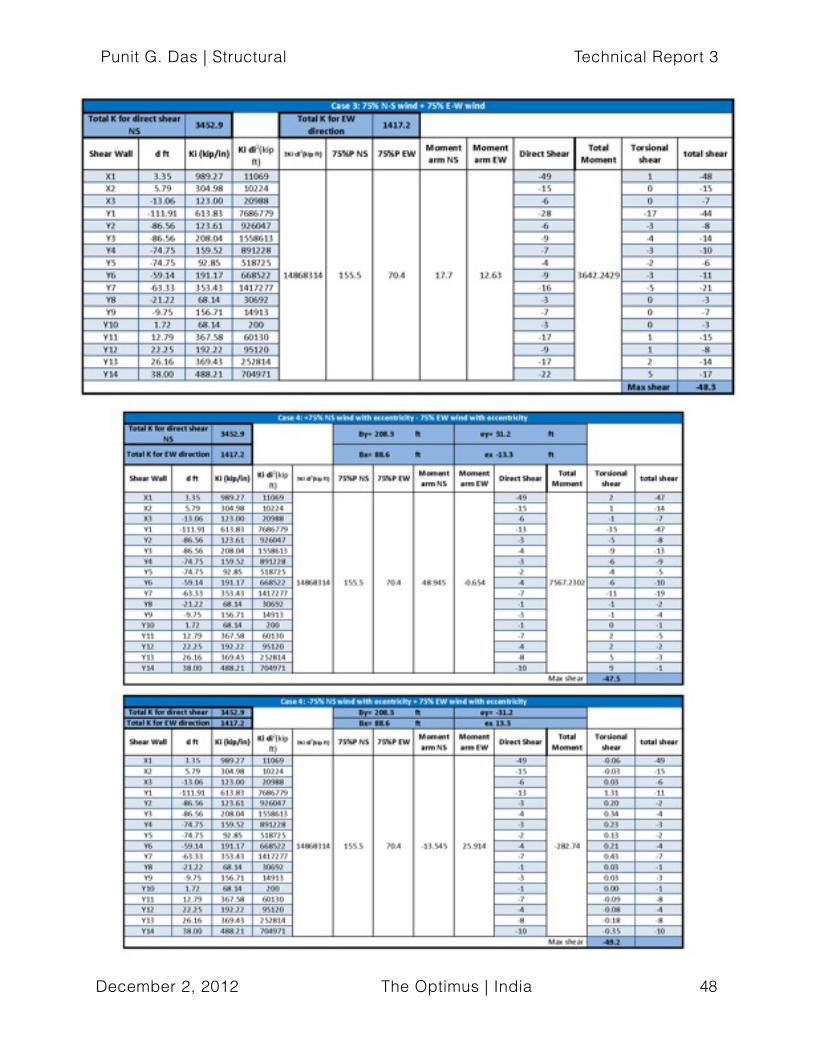
The design wind load cases from ASCE 7-10, figure 27.4-8 were used to calculate wind load effects due to shear and torsion. These forces were applied to every wall at level 7 and the horizontal load distribution was determined using wall stiffnesses. The critical wall was the one that had largest stiffness. The critical load case in East-West direction was wind forces in East-West direction without eccentricity. The wind load in this load case, induced maximum shear in the shear wall labelled as X1 which is the largest shear wall in the structure - 47 ft long and 20 inch thick. The wind in North-South direction with a positive eccentricity induces maximum shear in shear wall labelled as Y1 because it is furthest from the center of rigidity providing a large moment arm to resist torsional shear.
Punit G. Das | Structural Technical Report 3
December 2, 2012 The Optimus | India 26
COR
COM
Figure 16: Typical office floor plan showing Center of Mass (COM) and Center of Rigidity (COR)

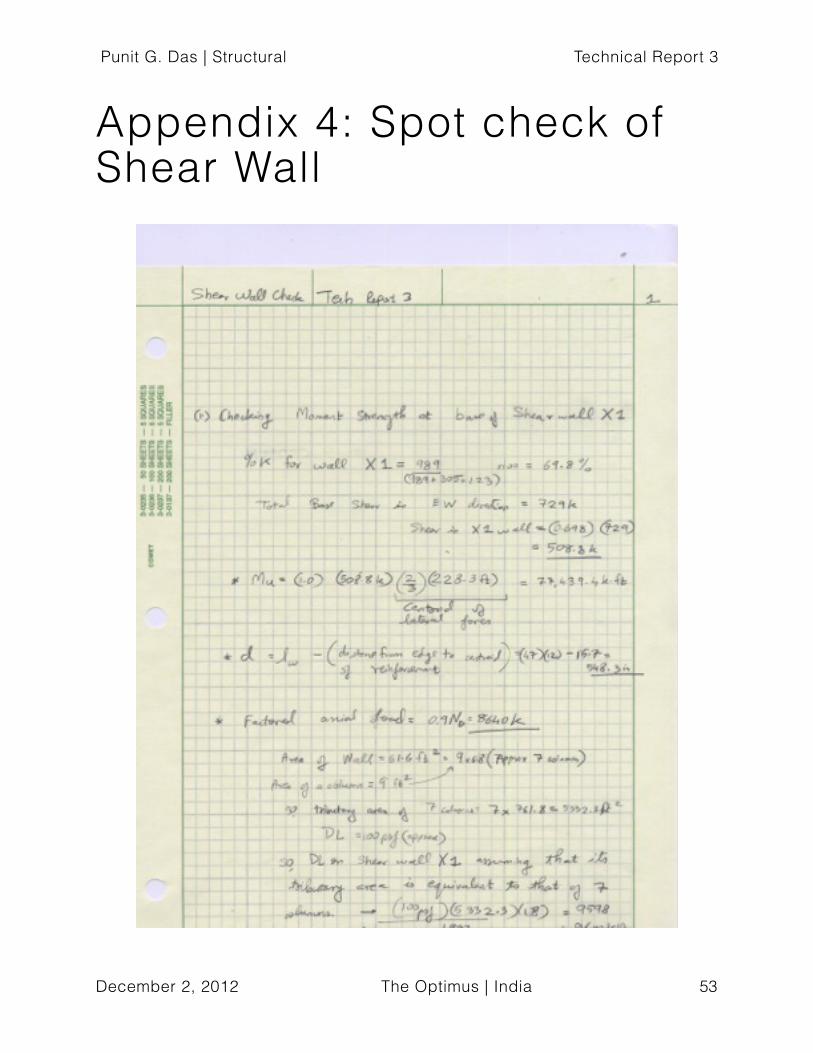
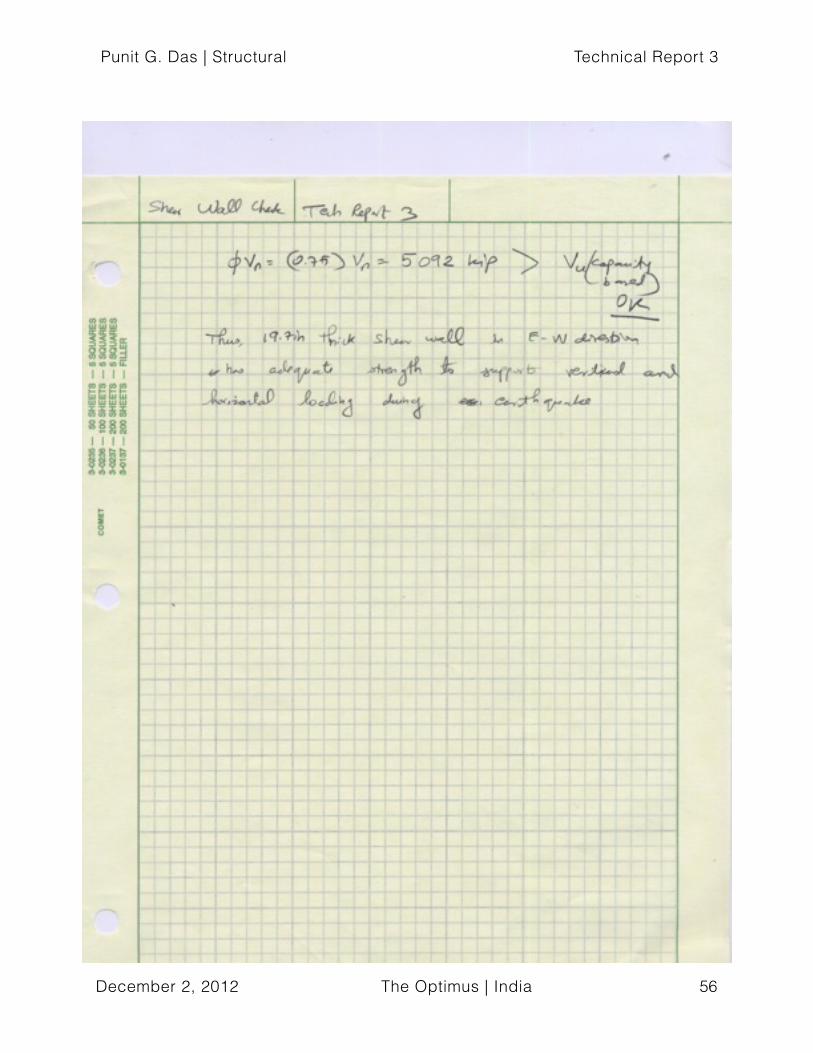
The vertical story forces due to seismic loads at Level 7 were used to calculate internal shear forces in walls due to direct shear and shear due to accidental torsion. The walls Y1 in North-South direction and X1 in East-West direction were determined as critical walls similar to wind loads. As the base shear due to wind loads was higher than that due to seismic loads, the wall X1 was checked for shear and overturning moments. The wall X1 has added reinforcement at the ends which resist overturning moments in positive and negative directions. As a spot check, the wall X1 was check for its shear and moment capacity. The shear and moment reinforcement at the boundary elements (the ends of the shear wall) were taken into consideration for a conservative approach. By applying maximum shear, the wall passed in shear and overturning moment and the reinforcement was determined to be adequate.
Figure 18: Cross-section of core wall at the ground level. Shear Wall X1 highlighted.
As a building becomes taller, it becomes more flexible at higher stories. This causes large deflections at higher stories which affect the comfort level of the inhabitants. The ASCE 7-10, Commentary Chapter C mentions that the lateral drift of the building should be in the order of h/600 to h/400. The story drifts were calculated for wind and seismic forces. This calculation was carried out by determining stiffness in shear walls at each story due to unit distributed loads. The unit distributed wind and seismic loads were applied to the stiffness to find story drift. For ease of calculation and to reduce complexity, the cross-section of shear wall was assumed to be consistent from the base of the structure to the roof. The thickness and modulus of elasticity controlled the calculation of stiffness. From the base to level 5, the walls had higher
Punit G. Das | Structural Technical Report 3
December 2, 2012 The Optimus | India 27SU-S-203.3
WALL SCHEDULEGROUND UPTO LEVEL 1
ALPHA SUPREMUS
A
CKGB F
GE
QN DPR
H SU EDIFICE CONSULTANTS PVT. LTD.
BARKER MOHANDASPEI COBB FREED & PARTNERS ARCHITECTS LLP
SPECTRAL SERVICES CONSULTANTS PVT. LTD.
LESLIE E. ROBERTSON ASSOCIATESCONSULTING ENGINEERS (INDIA) PVT. LTD.
COM
COR
Y1 X1
Figure 17: Critical Shear walls X1 and Y1

thickness and higher strength concrete (5000 psi). Thickness in walls decreased after level 5 and 4000 psi concrete was used as material for walls. Using the provisions of ACI 318-11, section 10.10.4.1, un-cracked and cracked modifiers were applied to the gross moment of inertia of the shear walls and drifts were calculated. It was found that the drift due to wind loads in a cracked section was maximum - 10.2 inches at the roof of the building. Although this value is higher than the drift limit in ASCE 7-10 - h/400 = 8.67 in, it can be termed as an overestimated value. The reason for overestimation of story drift is that additional stiffness at lower stories was disregarded as well as the stiffness offered by the large column at the lower stories was disregarded for ease of calculation. Hence, additional stiffness due to columns and additional shear walls in the base would help reduce the deflection at the roof.
Punit G. Das | Structural Technical Report 3
December 2, 2012 The Optimus | India 28
Story drifts due to Wind loads for un-cracked walls Story drifts due to Seismic loads for un-cracked walls
Story drifts due to Wind loads for cracked walls Story drifts due to Seismic loads for cracked walls

Finite Element Model
A finite element model of the building was made using ETABS. The model was intended to be used for finding more accurate values for internal forces and story drifts. Accuracy in results is achieved by modeling every structural element of the building in ETABS with precision. Although, the entire building was modeled in ETABS, it became complex enough to fix the errors that gave skewed results.
Although modeling every structural element in the building is important for accurate results, it is also important to keep the model relatively simple. Making appropriate simplifications in the model helps in faster run time, easier debugging and reliable results. In the ETABS model, the beams were modeled as line elements, floors, shear walls were modeled as shell elements. A 48 inch mesh size was chosen to auto-mesh the floors and shear walls. It is anticipated that the complications in the computer model was caused because of the use of auto-mesh for shell elements like floor slabs and shear walls. Using manual meshing would have ensured proper alignment of the every node which can be an in issue while using automatic meshing. Hence, simplifications in the model will result in a reasonable model with accurate results. For further analysis it is planned that the floors will be modeled as rigid-diaphragm membrane elements. By using rigid-diaphragm membrane elements, modeling program will disregard the effects of out-of-plane forces in floor diaphragms. This will help in reducing complexity of the model without much affect on results due to lateral forces. These simplifications help in saving modeling time while performing a schematic-level analysis on a building structure where the behavior of a structure is more of a concern than getting accurate results. In order to attain, accurate and precise results which are more useful at the design-development stage; manual meshing of shell elements is required.
Punit G. Das | Structural Technical Report 3
December 2, 2012 The Optimus | India 29
Figure 20: 3d view of ETABS Model of The Optimus: Entire structural system, shear walls, beams and and shear walls

ConclusionThorough calculations of the effects of wind and seismic forces on The Optimus have resulted in conclusion that the lateral force resisting system is sufficient to carry the lateral loads at it’s existing location. The internal forces due to direct shear and torsional forces reveal that the long shear wall at the core, spanning East-West and the shear wall at the East facade were critical elements. The largest shear wall out of these two was checked for shear and overturning moment and it found to be adequate in carrying the required shear and overturning moments.
It was found that the wind loads controlled the design of the lateral force resisting elements. The reason for wind controlling lateral system members is that it induces higher base shear and story drifts as compared to that due to seismic loads. The drifts were calculated for cracked and un-cracked wall sections and it was found that the drifts at the top story were slightly above the limiting deflection in ASCE 7-10. It was found that the higher deflection was attained because of the assumption of using same shear wall layout from the base to the top to reduce complexity in calculation. If the additional stiffness at the bottom stories were taken into consideration, then the deflection would fall under the limiting drift as specified in ASCE 7-10.
Although the computer model was useful in acquiring the results due to modeling errors, it was found that simplifications in modeling elements like the floors and walls would help in reducing complexity and achieving better and accurate results.
Punit G. Das | Structural Technical Report 3
December 2, 2012 The Optimus | India 30
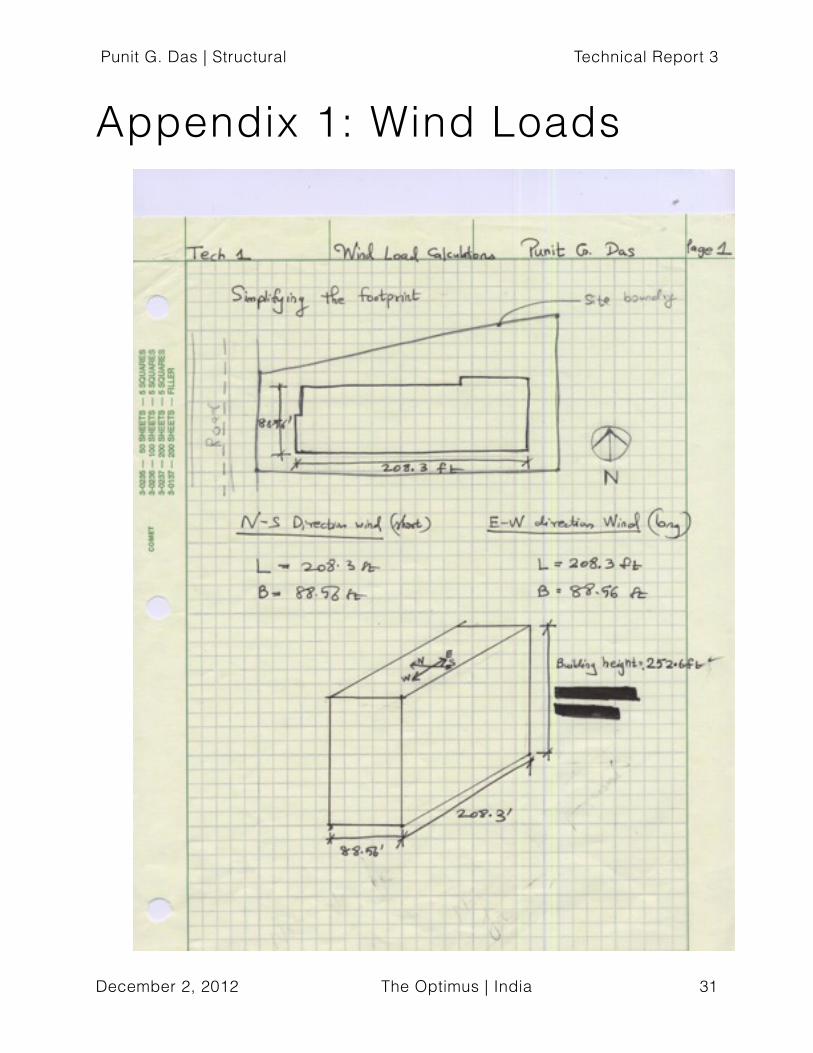
Appendix 1: Wind Loads Punit G. Das | Structural Technical Report 3
December 2, 2012 The Optimus | India 31

Punit G. Das | Structural Technical Report 3
December 2, 2012 The Optimus | India 32

Punit G. Das | Structural Technical Report 3
December 2, 2012 The Optimus | India 33

Punit G. Das | Structural Technical Report 3
December 2, 2012 The Optimus | India 34

Punit G. Das | Structural Technical Report 3
December 2, 2012 The Optimus | India 35

Punit G. Das | Structural Technical Report 3
December 2, 2012 The Optimus | India 36

Punit G. Das | Structural Technical Report 3
December 2, 2012 The Optimus | India 37
Punit G. Das | Structural Technical Report 3
December 2, 2012 The Optimus | India 38

Punit G. Das | Structural Technical Report 3
December 2, 2012 The Optimus | India 39

Punit G. Das | Structural Technical Report 3
December 2, 2012 The Optimus | India 40

Punit G. Das | Structural Technical Report 3
December 2, 2012 The Optimus | India 41

Punit G. Das | Structural Technical Report 3
December 2, 2012 The Optimus | India 42

Punit G. Das | Structural Technical Report 3
December 2, 2012 The Optimus | India 43
Punit G. Das | Structural Technical Report 3
December 2, 2012 The Optimus | India 44

Punit G. Das | Structural Technical Report 3
December 2, 2012 The Optimus | India 45

Punit G. Das | Structural Technical Report 3
December 2, 2012 The Optimus | India 46
Punit G. Das | Structural Technical Report 3
December 2, 2012 The Optimus | India 47
Punit G. Das | Structural Technical Report 3
December 2, 2012 The Optimus | India 48

Appendix 2: Seismic Loads Punit G. Das | Structural Technical Report 3
December 2, 2012 The Optimus | India 49

Punit G. Das | Structural Technical Report 3
December 2, 2012 The Optimus | India 50

Punit G. Das | Structural Technical Report 3
December 2, 2012 The Optimus | India 51

Punit G. Das | Structural Technical Report 3
December 2, 2012 The Optimus | India 52
Appendix 4: Spot check of Shear Wall
Punit G. Das | Structural Technical Report 3
December 2, 2012 The Optimus | India 53

Punit G. Das | Structural Technical Report 3
December 2, 2012 The Optimus | India 54

Punit G. Das | Structural Technical Report 3
December 2, 2012 The Optimus | India 55
Punit G. Das | Structural Technical Report 3
December 2, 2012 The Optimus | India 56
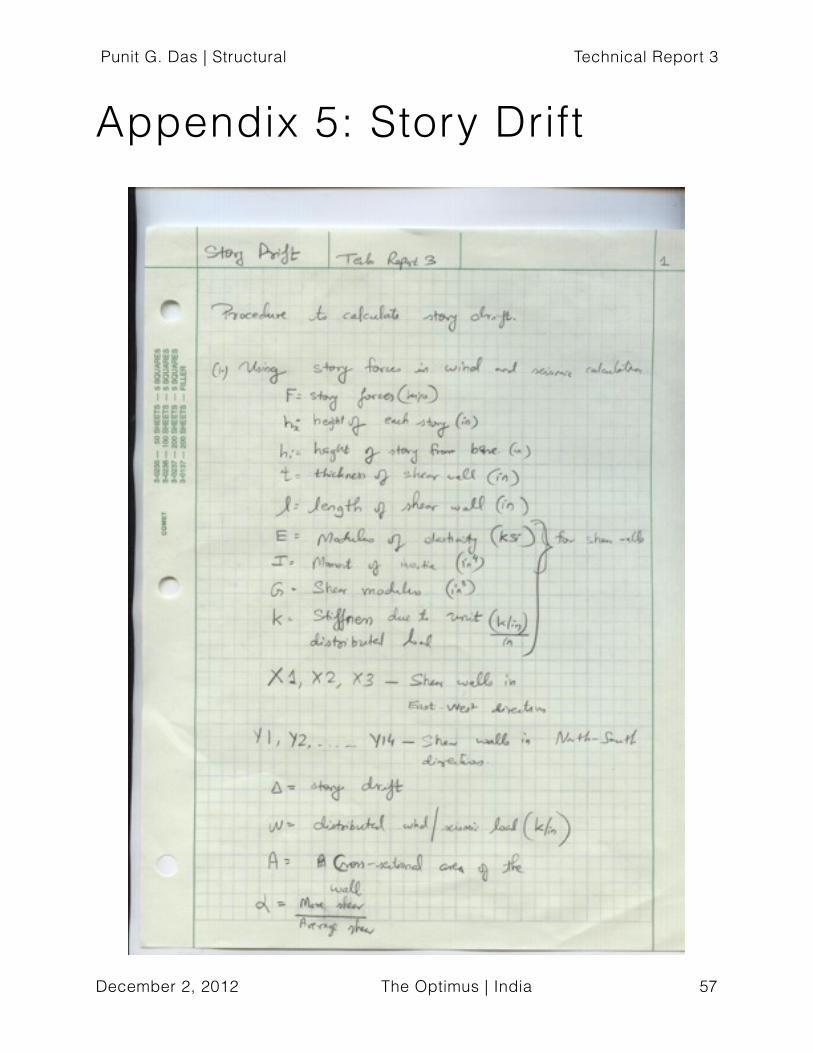
Appendix 5: Story Drift Punit G. Das | Structural Technical Report 3
December 2, 2012 The Optimus | India 57

Punit G. Das | Structural Technical Report 3
December 2, 2012 The Optimus | India 58
Complete excel sheet calculations for story drift can be made available upon request. Due to large
number of tables and sheets, the files are not at-tached to this file.