survey of ulrs and union reps supporting learning and skills, 2014
DESCRIPTION
At the end of 2014 unionlearn conducted a survey of union reps engaged in supporting learning at work to get an up-to-date picture of their activities in the workplace, including the main opportunities and challenges that they identified in promoting the union learning agenda.TRANSCRIPT
Survey of ULRs and union reps supporting learning and skills, 2014

Survey of ULRs and union reps supporting learning and skills, 2014 unionlearn 2015 2
Survey of ULRs and union reps supporting learning and skills, 2014 unionlearn 2015 3
Contents
page
Introduction 4
Executive summary 5
Characteristics of ULRs and union reps 9
Sector breakdown and workplace characteristics 9
Current and previous union posts 11
Activities undertaken by ULRs and union reps 13
Impact of ULRs and union reps 15
Training and support for ULRs and union reps 18
References and notes 22
Survey of ULRs and union reps supporting learning and skills, 2014 unionlearn 2015 4
Introduction
At the end of 2014 unionlearn conducted a survey of union reps engaged in supporting learning at work to get an up-to-date picture of their activities in the workplace, including the main opportunities and challenges that they identified in promoting the union learning agenda. The survey was undertaken online and the data collected using Survey Monkey.
People were invited to respond if they were an existing union learning rep (ULR) or another kind of union rep involving a role in supporting learning and skills in the workplace. In addition people were invited to respond if they had been a ULR or a union rep involved in supporting learning and skills in the past but had since given up the role.
Fifty six per cent of respondents said that they were currently a ULR and a large number of them were combining this with another union rep role. Nearly 1 in 10 respondents said that they currently did not hold any union post. It is estimated that around a third of respondents were union representatives without a specific ULR remit but who had some form of engagement with the learning agenda.
A total of 880 individuals responded to the survey but in some cases the response rate for specific questions was lower than this. Where this is statistically significant the actual response rate for the specific question is given in the relevant table or chart.
In order to maintain a degree of consistency over time, the questions in the 2014 survey were largely based on the questions used in previous surveys of ULRs commissioned by unionlearn. In some cases comparisons are made with the trends from these previous ULR surveys but this must be treated with a large degree of caution for two reasons.
First, the previous ULR surveys only looked at the role of ULRs and did not include other union reps in their samples (unless of course they were combining this with their ULR role, e.g., union reps operating as ULRs and Health and Safety reps). Secondly, most of the previous surveys were undertaken using a very different methodology involving postal questionnaires distributed to all ULRs on the unionlearn database in order to establish a statistically robust sample size. The two most recent ULR surveys (2007 and 2009) produced on this basis are available on the unionlearn website.1

Survey of ULRs and union reps supporting learning and skills, 2014 unionlearn 2015 5
Executive summary
Some key messages
Unlike previous ULR surveys commissioned by unionlearn, the 2014 survey was aimed more widely at both ULRs and other union reps engaged in learning and skills. A third of survey respondents were not ULRs but were other union reps with some degree of engagement in the union learning agenda. The first key message coming out of the latest survey is that it appears that union activity in the workplace in support of learning and skills is being mainstreamed across a wider cohort of union reps.
This finding is also highlighted in a recent unionlearn research report which includes an analysis of union activity on learning and skills drawing on data from the latest Workplace Employment Relations Survey (WERS 2011).2 This concludes that “perhaps most notable was the proportion of all union representatives that had any specific responsibility for promoting learning at the workplace .... [which] increased from around a quarter of all union representatives in 2004 (24.7%) to just under a third (31.3%) in 2011.”
As identified in previous ULR surveys the union learning agenda continues to attract a more diverse range of union activists compared with the characteristics of the total population of union reps. Nearly half (47%) of the respondents to our current survey of ULRs and union reps were women and this compares with the 2009 ULR survey showing the proportion of women previously peaking at 43%. The latest gender statistics for the total population of union reps, taken from an analysis3 of the Workplace Employment Relations Surveys series, shows that 43% of union reps are women (according to WERS 2011).
Another positive finding is that our latest survey shows that the combined efforts of ULRs and union reps are largely sustaining the level of activity and impact on learning and skills that was recorded in previous ULR surveys. For example, 92% of the reps said that their activities had raised awareness of learning among colleagues, 81% had directly helped colleagues who had no/little experience of learning, and 78% said that that as a result of their activities they had directly help increase the number of colleagues accessing training opportunities.
Finally it is welcome that our survey highlights that learning agreements remain a major foundation of the union learning agenda in many workplaces. Sixty one per cent of reps reported that a formal learning agreement was in existence in their organisation or workplace and this compares favourably with the 2009 ULR survey which identified 57% of ULRs reporting the existence of a learning agreement.
Survey of ULRs and union reps supporting learning and skills, 2014 unionlearn 2015 6
Characteristics of union reps supporting learning and skills
Marginally more men (53%) than women (47%) responded to the survey. The relatively high proportion of women responding to the survey suggests that learning and skills is a powerful means of attracting more women to become actively involved in union activities in the workplace. Whilst recognising the limitations of direct comparisons with previous ULR surveys (see page 4) it is notable that the latest gender breakdown compares very favourably with previous surveys as regards the proportion of women reps. The previous highest incidence was the 43% of women ULRs identified in the 2009 ULR survey.
In line with the general trends for all union reps, the age profile of our survey respondents showed that the vast majority - 91% - were aged over 35 years. In addition 31% were aged over 55. But this age profile compares favourably with the age profile of the total population of union reps3, with the latest figures (for 2011) showing that 55% are aged over 50.
Sector and workplace characteristics
Two thirds of ULRs and other reps were in the public sector compared with just under a quarter (24%) in the private sector. This partly reflects the fact that the number of union members in the private sector is less (42% of total union membership). Another factor may be that union reps in the public sector are, on average, more likely to get time off from their employers to undertake the necessary training to become a ULR or union rep and to fulfil their union duties in the workplace.
These recent trends are generally in line with previous findings over the last decade (e.g. according to the 2005 ULR Survey 62% of ULRs were in the public sector). The largest proportion of ULRs and union reps - 28% - were found in the Public Administration sector which includes local and central government. Over two thirds (69%) of ULRs and union reps were based in companies or organisations with 250 or more employees.
Current and previous union posts
Over half (56%) of respondents were active ULRs and it is estimated that a third of them were ULRs without any additional responsibilities while two thirds were ULRs that also undertook other union roles (e.g. mainstream union rep, health and safety rep etc.). It is estimated that around a third of respondents were union reps without a specific ULR remit, but who had some degree of engagement with the learning and skills agenda. Active ULRs and union reps were asked how long they had been engaged in these roles – nearly three fifths (59%) said 4 years or more and more than a third (36%) said 1-3 years. One in ten respondents said they were no longer an active ULR or union rep.
Survey of ULRs and union reps supporting learning and skills, 2014 unionlearn 2015 7
Activities to promote learning and skills
The amount of time reps spend on promoting learning and skills has remained relatively consistent over time (e.g. when comparisons are made with previous ULR surveys). In 2014 a third of reps said they spend less than 1 hour a week on learning and skills activities (most worrying of all, 14% said they could not allocate any time to this activity). Forty five per cent said they spend between 1 and 5 hours and 22% said they spend more than 5 hours a week
The survey shows that the most common activities in support of learning and skills undertaken by ULRs and union reps are providing information and advice (83%) and recruiting/helping to recruit new union members (70%). Bearing in mind the caveats above about making direct comparisons with previous ULR surveys, the respective percentages for the equivalent responses from the 2009 ULR survey were 94% and 74%.
Impact of activities
More than 9 out of 10 reps said that their activities raised awareness of learning among colleagues and more than 8 out of 10 said they had specifically helped colleagues who had little or no experience of learning. Over three quarters said they had helped to increase the number of colleagues accessing training and 75% said they had helped to increase the amount of training individuals received. Reps also perceived that the union role had a positive impact on promoting dialogue on training with management, with 70% citing a positive impact in this area.
It is also significant that the activities of reps in supporting learning and skills were seen to impact positively on the wider aspects of working life. For example, three quarters of reps reported an increased interest in union membership as a result of their activities on learning and skills. Sixty eight per cent said their activities on learning and skills had helped to promote better employment relations by improving relationships in the workplace between the union and managers.
The survey also measured impact in terms of increasing access to specific types of learning and training. Around a third of reps said that their activities had led to more individuals accessing: training leading to vocational/academic qualifications; continuing professional development (CPD); job-related training not leading to qualifications; personal interest/leisure courses; and, basic literacy and numeracy skills. One in five reps identified increased take-up of apprenticeships whilst 1 in 10 identified increased take-up of work experience, internships and traineeships for young people.
Survey of ULRs and union reps supporting learning and skills, 2014 unionlearn 2015 8
Training and support
Accessing time off their normal working duties to engage in union activities in support of learning and skills remains a major barrier faced by a significant number of ULRs and union reps. Nearly a quarter of respondents said they received no paid release from their employer and around 1 in 9 said they only received a maximum of one hour per week. At the other end of the scale 30% reported that they received more than 5 hours per week. Overall, three quarters said they thought that they were given reasonable time off to conduct their ULR/union rep role.
Nearly ninety per cent said that work colleagues were supportive of their ULR/union rep role and there was a similarly positive response regarding the support of their individual union (84%) and the support provided by unionlearn (86%).
Previous research has indicated that institutional arrangements in the workplace (e.g. learning agreements, learning centres etc.) that have the joint support of employers and unions play a major role in strengthening the coverage and impact of the union learning agenda. Over three fifths of ULRs and other union reps said that a formal learning agreement was in existence and this was slightly more than in the last (2009) ULR survey. Three tenths of respondents said that there was a union learning centre at their workplace and this is slightly less than the 2009 ULR survey when one third gave a positive response.
Survey of ULRs and union reps supporting learning and skills, 2014 unionlearn 2015 9
Characteristics of ULRs and union reps
A gender breakdown of the survey respondents shows that there were marginally more men (53%) than women (47%). Earlier ULR surveys commissioned by unionlearn show the proportion of women ULRs increasing over time. For example, the 2003 ULR survey showed that 38% of ULRs were women and by the 2009 ULR survey this had increased to 43%. Bearing in mind the differences between our current survey and previous ULR surveys (see page 4), it is encouraging that the 2014 survey shows that nearly half of ULRs and other union reps supporting learning and skills are women.
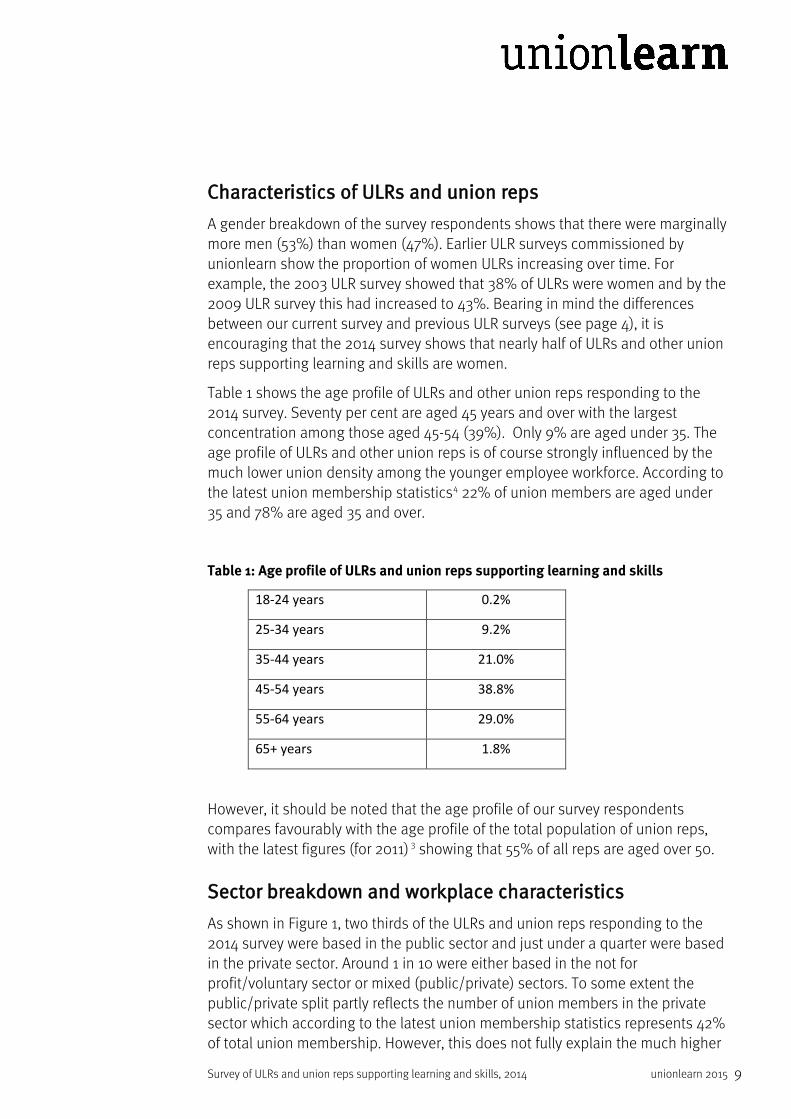
Table 1 shows the age profile of ULRs and other union reps responding to the 2014 survey. Seventy per cent are aged 45 years and over with the largest concentration among those aged 45-54 (39%). Only 9% are aged under 35. The age profile of ULRs and other union reps is of course strongly influenced by the much lower union density among the younger employee workforce. According to the latest union membership statistics4 22% of union members are aged under 35 and 78% are aged 35 and over.
Table 1: Age profile of ULRs and union reps supporting learning and skills
18-24 years 0.2%
25-34 years 9.2%
35-44 years 21.0%
45-54 years 38.8%
55-64 years 29.0%
65+ years 1.8%
However, it should be noted that the age profile of our survey respondents compares favourably with the age profile of the total population of union reps, with the latest figures (for 2011) 3 showing that 55% of all reps are aged over 50.
Sector breakdown and workplace characteristics
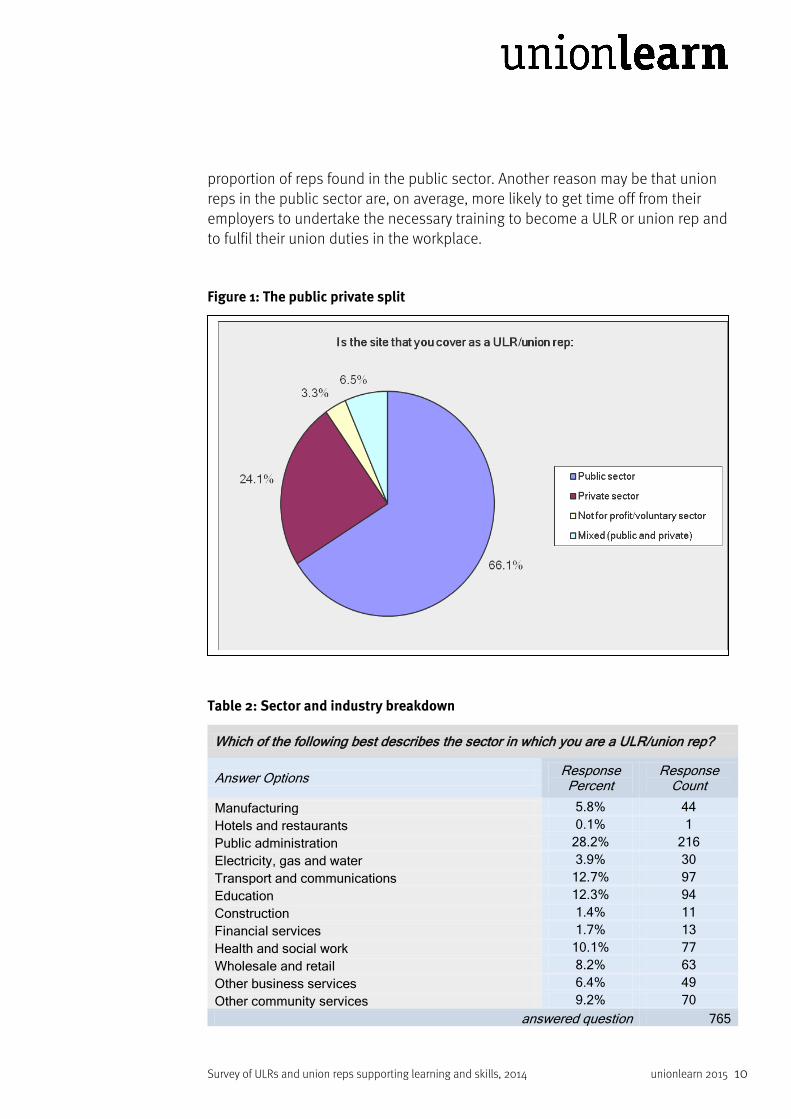
As shown in Figure 1, two thirds of the ULRs and union reps responding to the 2014 survey were based in the public sector and just under a quarter were based in the private sector. Around 1 in 10 were either based in the not for profit/voluntary sector or mixed (public/private) sectors. To some extent the public/private split partly reflects the number of union members in the private sector which according to the latest union membership statistics represents 42% of total union membership. However, this does not fully explain the much higher
Survey of ULRs and union reps supporting learning and skills, 2014 unionlearn 2015 10
proportion of reps found in the public sector. Another reason may be that union reps in the public sector are, on average, more likely to get time off from their employers to undertake the necessary training to become a ULR or union rep and to fulfil their union duties in the workplace.
Figure 1: The public private split
Table 2: Sector and industry breakdown
Which of the following best describes the sector in which you are a ULR/union rep?
Answer Options Response Percent
Response Count
Manufacturing 5.8% 44 Hotels and restaurants 0.1% 1 Public administration 28.2% 216 Electricity, gas and water 3.9% 30 Transport and communications 12.7% 97 Education 12.3% 94 Construction 1.4% 11 Financial services 1.7% 13 Health and social work 10.1% 77 Wholesale and retail 8.2% 63 Other business services 6.4% 49 Other community services 9.2% 70
answered question 765
Survey of ULRs and union reps supporting learning and skills, 2014 unionlearn 2015 11
Table 2 provides a breakdown of the proportion of ULRs and union reps in different sectors/industries and to some extent these trends reflect the public/private split highlighted above. In addition the total number of the employee workforce in each sector/industry and the union density for each sector/industry are of course other key factors. On this basis it is not too surprising that large numbers of union reps supporting learning and skills are found in sectors such as Public Administration which includes local and central government.
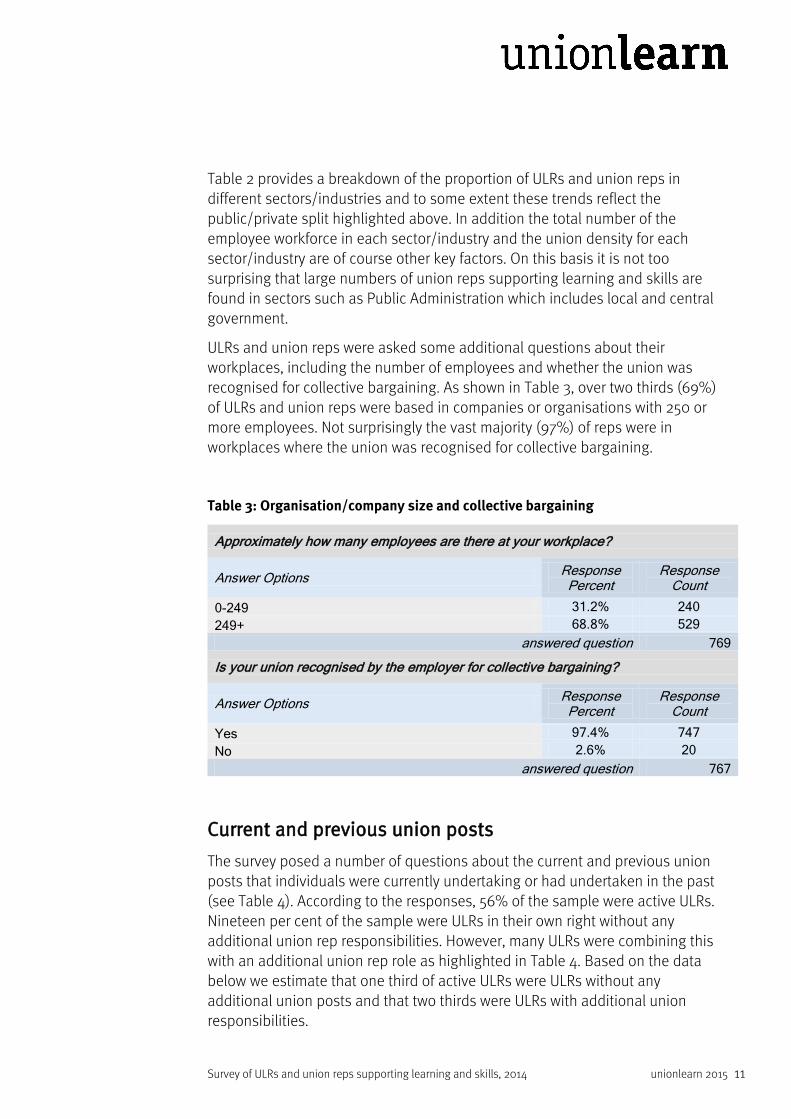
ULRs and union reps were asked some additional questions about their workplaces, including the number of employees and whether the union was recognised for collective bargaining. As shown in Table 3, over two thirds (69%) of ULRs and union reps were based in companies or organisations with 250 or more employees. Not surprisingly the vast majority (97%) of reps were in workplaces where the union was recognised for collective bargaining.
Table 3: Organisation/company size and collective bargaining
Approximately how many employees are there at your workplace?
Answer Options Response Percent
Response Count
0-249 31.2% 240 249+ 68.8% 529
answered question 769
Is your union recognised by the employer for collective bargaining?
Answer Options Response Percent
Response Count
Yes 97.4% 747 No 2.6% 20
answered question 767
Current and previous union posts
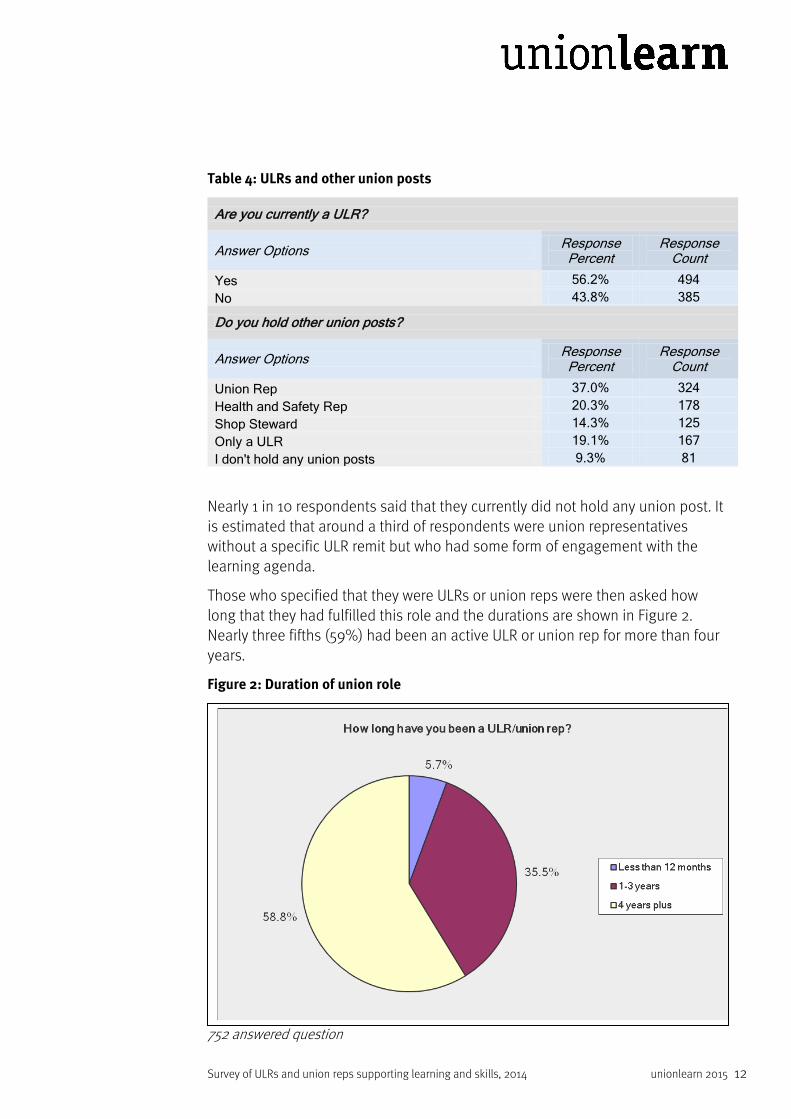
The survey posed a number of questions about the current and previous union posts that individuals were currently undertaking or had undertaken in the past (see Table 4). According to the responses, 56% of the sample were active ULRs. Nineteen per cent of the sample were ULRs in their own right without any additional union rep responsibilities. However, many ULRs were combining this with an additional union rep role as highlighted in Table 4. Based on the data below we estimate that one third of active ULRs were ULRs without any additional union posts and that two thirds were ULRs with additional union responsibilities.
Survey of ULRs and union reps supporting learning and skills, 2014 unionlearn 2015 12
Table 4: ULRs and other union posts
Are you currently a ULR?
Answer Options Response Percent
Response Count
Yes 56.2% 494 No 43.8% 385
Do you hold other union posts?
Answer Options Response Percent
Response Count
Union Rep 37.0% 324 Health and Safety Rep 20.3% 178 Shop Steward 14.3% 125 Only a ULR 19.1% 167 I don't hold any union posts 9.3% 81
Nearly 1 in 10 respondents said that they currently did not hold any union post. It is estimated that around a third of respondents were union representatives without a specific ULR remit but who had some form of engagement with the learning agenda.
Those who specified that they were ULRs or union reps were then asked how long that they had fulfilled this role and the durations are shown in Figure 2. Nearly three fifths (59%) had been an active ULR or union rep for more than four years.
Figure 2: Duration of union role
752 answered question
Survey of ULRs and union reps supporting learning and skills, 2014 unionlearn 2015 13
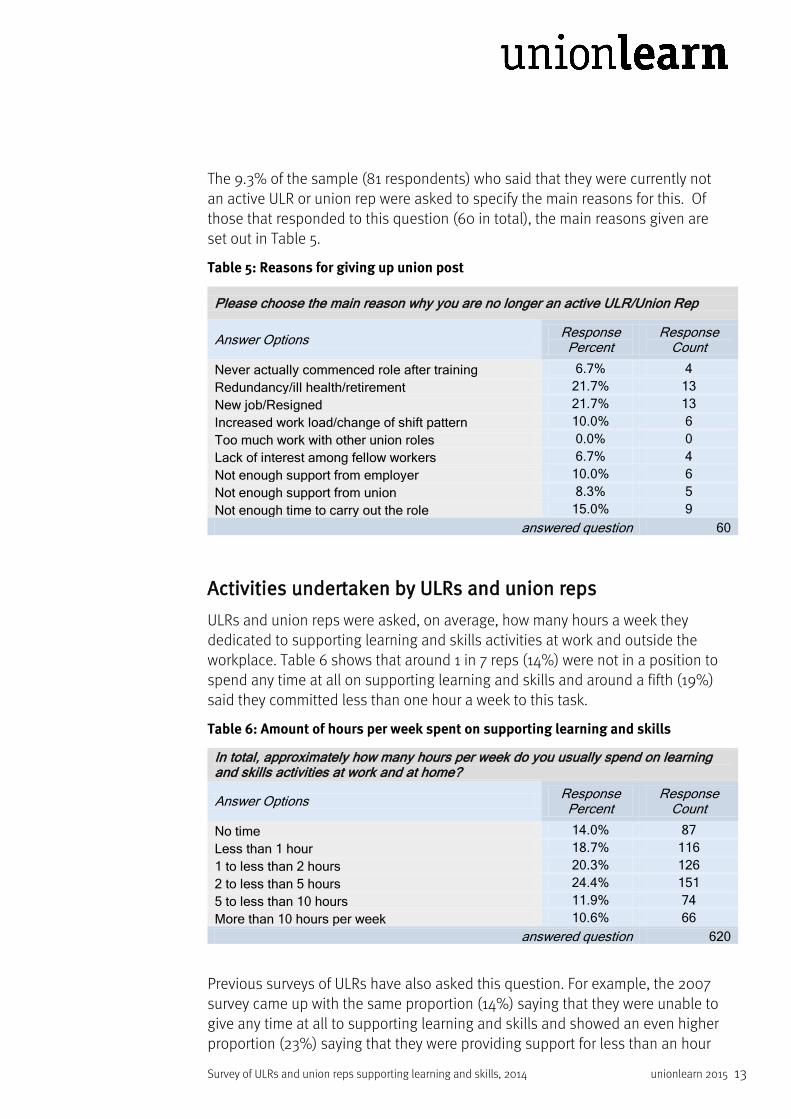
The 9.3% of the sample (81 respondents) who said that they were currently not an active ULR or union rep were asked to specify the main reasons for this. Of those that responded to this question (60 in total), the main reasons given are set out in Table 5.
Table 5: Reasons for giving up union post
Please choose the main reason why you are no longer an active ULR/Union Rep
Answer Options Response Percent
Response Count
Never actually commenced role after training 6.7% 4 Redundancy/ill health/retirement 21.7% 13 New job/Resigned 21.7% 13 Increased work load/change of shift pattern 10.0% 6 Too much work with other union roles 0.0% 0 Lack of interest among fellow workers 6.7% 4 Not enough support from employer 10.0% 6 Not enough support from union 8.3% 5 Not enough time to carry out the role 15.0% 9
answered question 60
Activities undertaken by ULRs and union reps
ULRs and union reps were asked, on average, how many hours a week they dedicated to supporting learning and skills activities at work and outside the workplace. Table 6 shows that around 1 in 7 reps (14%) were not in a position to spend any time at all on supporting learning and skills and around a fifth (19%) said they committed less than one hour a week to this task.
Table 6: Amount of hours per week spent on supporting learning and skills
In total, approximately how many hours per week do you usually spend on learning and skills activities at work and at home?
Answer Options Response Percent
Response Count
No time 14.0% 87 Less than 1 hour 18.7% 116 1 to less than 2 hours 20.3% 126 2 to less than 5 hours 24.4% 151 5 to less than 10 hours 11.9% 74 More than 10 hours per week 10.6% 66
answered question 620
Previous surveys of ULRs have also asked this question. For example, the 2007 survey came up with the same proportion (14%) saying that they were unable to give any time at all to supporting learning and skills and showed an even higher proportion (23%) saying that they were providing support for less than an hour

Survey of ULRs and union reps supporting learning and skills, 2014 unionlearn 2015 14
per week. The 2007 survey also highlighted relatively similar findings to the current survey for the other durations of time spent per week, as follows: 1 to less than 2 hours (18%); 2 to less than 5 hours (20%); 5 to less than 10 hours (13%); and, more than 10 hours (11%).
The 2014 survey then asked ULRs and union reps to indicate if they had been involved in 6 key areas of support for learning and skills in the workplace over the past 12 months. These specific questions were also asked in the last main survey of ULRs commissioned by unionlearn in 2009. it should be noted that comparisons with the 2009 survey and other previous ULR surveys need to be treated with a large degree of caution as the 2009 survey only surveyed ULRs whilst the 2014 survey includes many union reps who are not trained ULRs.
The current survey (see Table 7) shows that the most common activities in support of learning and skills undertaken by ULRs and union reps are providing information and advice (83%) and recruiting/helping to recruit new union members (70%). Bearing in mind the caveats above about making direct comparisons, the respective percentages for the equivalent responses from the 2009 ULR survey were 94% and 74%.
Table 7: Learning and skills support provided by ULRs and union reps
During the last 12 months (or since becoming a ULR/union rep) have you:
Answer Options Response Percent
Response Count
Provided information and advice to colleagues on learning opportunities 83.4% 494
Helped colleagues to get funding for learning 24.0% 142 Arranged (or helped to arrange) courses for colleagues 55.4% 328
Recruited (or helped to recruit) new members into the union 70.4% 417
Conducted a learning needs assessment 28.4% 168 Meet and/or networked with ULRs from other workplaces 55.6% 329
answered question 592
In comparing the 2014 and 2009 survey responses, the greatest divergences are in relation to the following two responses: helped colleagues to get funding for learning (24% in 2014 and 48% in 2009); and, conducted a learning needs assessment (28% in 2014 and 53% in 2009). These support services are ones that non-ULR union reps would not be expected to deliver so it is likely that these significant differences are largely explained by the fact that only 56% of the 2014 sample were active ULRs. However, a significant proportion of the 2014 respondents are still delivering core services (e.g. 55% saying that they arranged, or helped to arrange, courses for colleagues).

Survey of ULRs and union reps supporting learning and skills, 2014 unionlearn 2015 15
Impact of ULRs and union reps
The survey drew on the questions asked in the 2009 ULR survey in order to make some assessment of the impact of current activities on learning and skills undertaken by ULRs and union reps. Keeping in mind the differences between the 2009 ULR survey and the current survey, it is still interesting to compare impact levels. It should also be noted that the 2009 survey (unlike the 2014 survey) included a fourth response option to allow respondents to specify if they were “unsure” about whether there was an impact or not.
Table 8 sets out a range of “impacts” that respondents were asked to score their activities against by selecting one of three options: positively (yes), yes to a certain degree, or negatively (no). Ninety two per cent said that they felt that their activities had some effect in raising awareness of learning amongst colleagues (yes [50.1%] and yes to a certain extent [42.1%]). This compares relatively favourably with the respective responses in the 2009 survey which were 94% overall (yes [54.4%] and yes to a certain extent [39.3%]). In line with this finding, the response rates for the other specified impacts had also not changed dramatically since the 2009 survey (especially once the responses to the additional “Unsure” option in the 2009 survey were taken into account).
Table 8: Impact of activities to promote learning and skills
Do you feel that your ULR activity has had any of the following effects? Yes Yes, to a
certain extent
No Response count
Raised awareness of learning amongst colleagues
50.1% 42.1% 7.9% 573
Increased interest in union membership
29.0% 45.6% 25.3% 572
Improved relationships between the union and managers
24.9% 42.8% 32.3% 570
Increased the number of colleagues accessing training
37.9% 40.5% 21.6% 570
Increased the amount of training for individual colleagues
33.2% 41.5% 25.3% 569
Helped colleagues who had no/little experience of learning
40.6% 40.8% 18.6% 569
Improved management/union dialogue on learning
24.1% 45.9% 30.0% 564
Question answered by 576 respondents

Survey of ULRs and union reps supporting learning and skills, 2014 unionlearn 2015 16
The next highest response regarding the positive effects of union learning activities undertaken by reps in 2014 was related to helping colleagues who had no/little experience of learning, which has been an acknowledged area of strength since ULRs were first established in the late 1990s. Eighty one per cent of respondents cited a positive effect (yes [40.6%] and yes to a certain extent [40.8%]) using this impact criteria.
The next highest response related to increasing the number of colleagues accessing training – over 78% responded positively (yes [37.9%] and yes to a certain extent [40.5%]) using this impact criteria. Seventy five per cent of reps also responded positively when asked if their activities increased the amount of training for individual colleagues (yes [33.2%] and yes to a certain extent [41.5%]).
Union engagement in learning and skills clearly also has a positive spin off for promoting wider dialogue with management on this issue as well as improving wider employment relations in the workplace and boosting union membership. In the 2014 survey 70% of reps cited a positive effect in relation to improving management/union dialogue on training (yes [24.1%] and yes to a certain extent [45.9%]). Sixty eight per cent of reps also cited a positive effect for improving relationships between the union and managers (yes [24.9%] and yes to a certain extent [42.8%]). In addition three quarters of reps reported an increased interest in union membership (yes [29%] and yes to a certain extent [45.6%]) as a result of their activities on learning and skills.
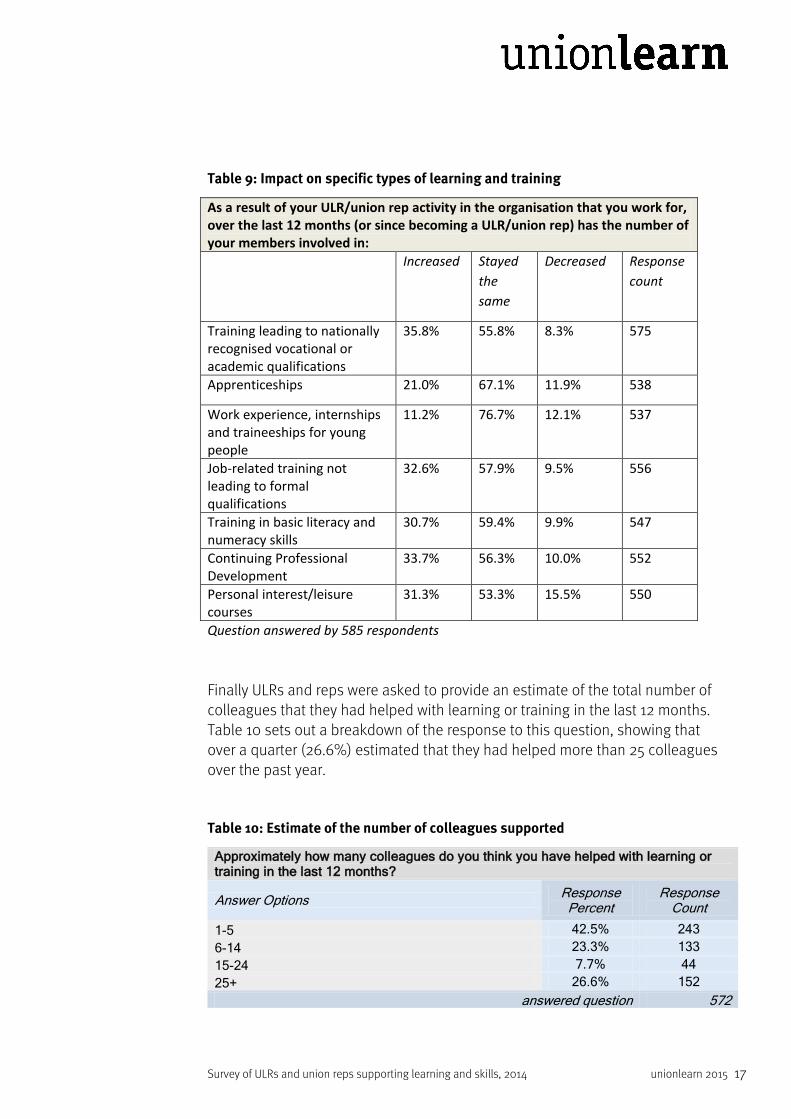
The survey also asked a range of questions relating to how the work of ULRs and other union reps impacted on the number of individuals engaging in specific forms of learning and training during the previous 12 months (see Table 9). Around a third of all reps said that their activities had had a positive impact in supporting more individuals at their work to undertake: training leading to vocational/academic training (35.8%); continuing professional development, CPD (33.7%); job-related training not leading to qualifications (32.6%); personal interest/leisure courses (31.3%); and, basic literacy and numeracy skills (30.7%).
There was less impact on apprenticeship numbers (21% of reps cited an increase) and the lowest finding was for increased take-up of work experience, internships and traineeships for young people (11.2% of reps cited an increase). In line with similar findings from other parts of the survey, the ability of ULRs and union reps to support young people into learning and training will be lower for reasons outside their control, especially the much lower union density found among young people in the labour market.
Survey of ULRs and union reps supporting learning and skills, 2014 unionlearn 2015 17
Table 9: Impact on specific types of learning and training
As a result of your ULR/union rep activity in the organisation that you work for, over the last 12 months (or since becoming a ULR/union rep) has the number of your members involved in: Increased Stayed
the same
Decreased Response count
Training leading to nationally recognised vocational or academic qualifications
35.8% 55.8% 8.3% 575
Apprenticeships 21.0% 67.1% 11.9% 538
Work experience, internships and traineeships for young people
11.2% 76.7% 12.1% 537
Job-related training not leading to formal qualifications
32.6% 57.9% 9.5% 556
Training in basic literacy and numeracy skills
30.7% 59.4% 9.9% 547
Continuing Professional Development
33.7% 56.3% 10.0% 552
Personal interest/leisure courses
31.3% 53.3% 15.5% 550
Question answered by 585 respondents
Finally ULRs and reps were asked to provide an estimate of the total number of colleagues that they had helped with learning or training in the last 12 months. Table 10 sets out a breakdown of the response to this question, showing that over a quarter (26.6%) estimated that they had helped more than 25 colleagues over the past year.
Table 10: Estimate of the number of colleagues supported
Approximately how many colleagues do you think you have helped with learning or training in the last 12 months?
Answer Options Response Percent
Response Count
1-5 42.5% 243 6-14 23.3% 133 15-24 7.7% 44 25+ 26.6% 152
answered question 572

Survey of ULRs and union reps supporting learning and skills, 2014 unionlearn 2015 18
Training and support for ULRs and union reps
The survey posed a number of questions about the training and support that ULRs and other union reps receive. ULRs (both existing and inactive) were asked if they had undertaken the initial training course provided by the TUC and/or the initial training course provided by their own union. There was a fairly even split with 50% of ULRs saying that they had taken the TUC course and 57% saying that they had taken the course provided by their own union. There may of course be individuals who will have taken both courses and this presumably explains why the two responses total more than 100%. Nearly a quarter of ULRs (24%) said that they had attended follow-on ULR courses specialising in specific aspects of learning and skills.
ULRs and union reps were then asked how many hours of paid release they normally received from management to undertake their union activities and the results are set out in Table 11. Nearly a quarter (23.9%) said they received no time at all whilst around 1 in 9 (11.6%) received less than one hour. Over a third (34.6%) received between 1 and 5 hours. Nearly 30% received more than 5 hours of paid release per week, and out of those, over 14% received 5-10 hours and just under 16% received more than 10 hours.
Table 11: Paid release for ULRs and union reps
How many hours per week of paid release from work do you normally receive from your employers for union activities?
Answer Options Response Percent
Response Count
No time 23.9% 146 Less than 1 hour 11.6% 71 1 to less than 2 hours 14.3% 87 2 to less than 5 hours 20.3% 124 5 to less than 10 hours 14.1% 86 More than 10 hours per week 15.7% 96
answered question 610
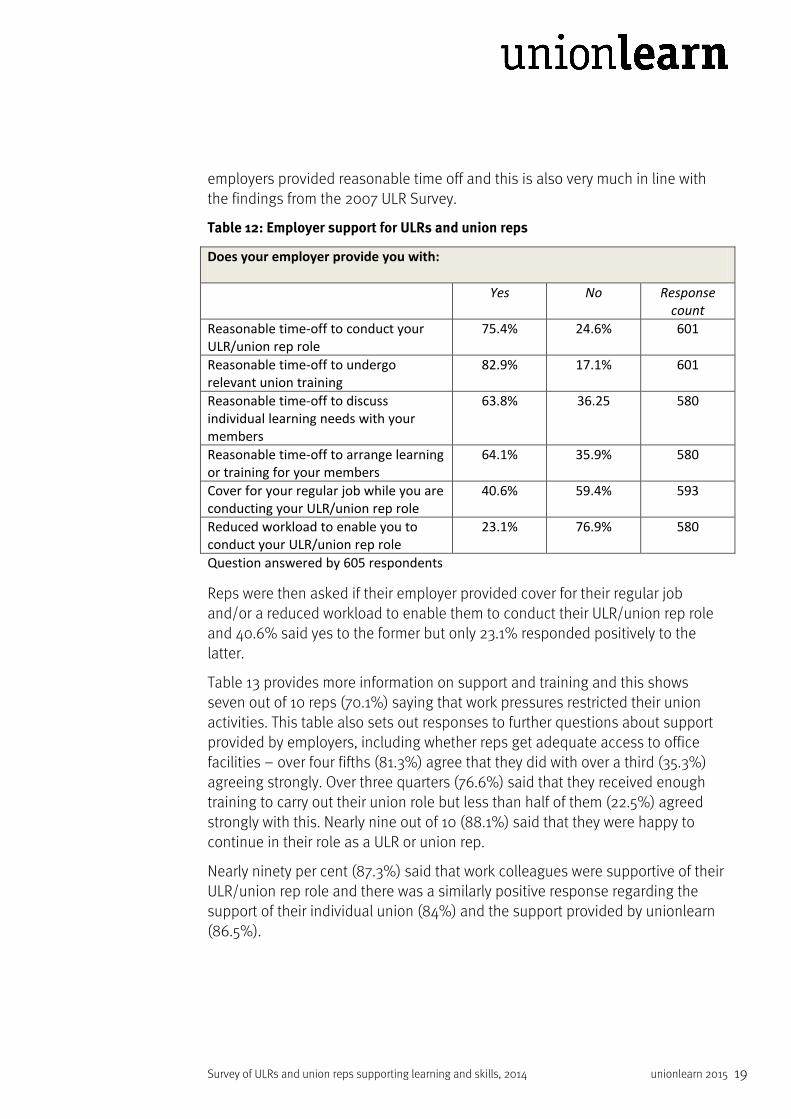
ULRs and union reps were also asked a number of additional questions about their view of the time off they received for different aspects of their ULR/union rep role and these findings are set out in Table 12. Just over three quarters (75.4%) said they thought they were given reasonable time off to conduct their ULR/union rep role and a higher proportion (82.9%) said they received reasonable time off to undergo relevant union training. The respective responses in the 2007 ULR Survey were 70% and 83% suggesting a degree of continuity on this front.
Two additional questions were asked about the amount of time off reps received to discuss individual learning needs and to arrange learning or training for individual members. To both these questions, 64% of reps said that their
Survey of ULRs and union reps supporting learning and skills, 2014 unionlearn 2015 19
employers provided reasonable time off and this is also very much in line with the findings from the 2007 ULR Survey.
Table 12: Employer support for ULRs and union reps
Does your employer provide you with: Yes No Response
count Reasonable time-off to conduct your ULR/union rep role
75.4% 24.6% 601
Reasonable time-off to undergo relevant union training
82.9% 17.1% 601
Reasonable time-off to discuss individual learning needs with your members
63.8% 36.25 580
Reasonable time-off to arrange learning or training for your members
64.1% 35.9% 580
Cover for your regular job while you are conducting your ULR/union rep role
40.6% 59.4% 593
Reduced workload to enable you to conduct your ULR/union rep role
23.1% 76.9% 580
Question answered by 605 respondents
Reps were then asked if their employer provided cover for their regular job and/or a reduced workload to enable them to conduct their ULR/union rep role and 40.6% said yes to the former but only 23.1% responded positively to the latter.
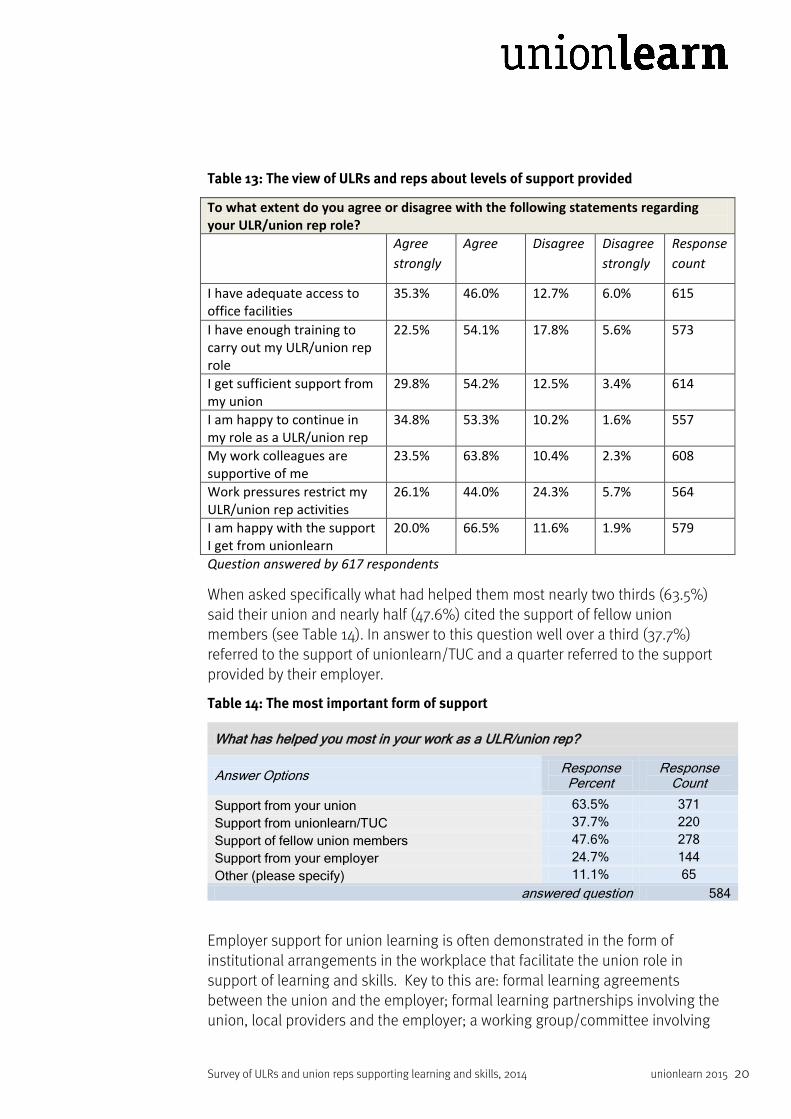
Table 13 provides more information on support and training and this shows seven out of 10 reps (70.1%) saying that work pressures restricted their union activities. This table also sets out responses to further questions about support provided by employers, including whether reps get adequate access to office facilities – over four fifths (81.3%) agree that they did with over a third (35.3%) agreeing strongly. Over three quarters (76.6%) said that they received enough training to carry out their union role but less than half of them (22.5%) agreed strongly with this. Nearly nine out of 10 (88.1%) said that they were happy to continue in their role as a ULR or union rep.
Nearly ninety per cent (87.3%) said that work colleagues were supportive of their ULR/union rep role and there was a similarly positive response regarding the support of their individual union (84%) and the support provided by unionlearn (86.5%).
Survey of ULRs and union reps supporting learning and skills, 2014 unionlearn 2015 20
Table 13: The view of ULRs and reps about levels of support provided
To what extent do you agree or disagree with the following statements regarding your ULR/union rep role? Agree
strongly Agree Disagree Disagree
strongly Response count
I have adequate access to office facilities
35.3% 46.0% 12.7% 6.0% 615
I have enough training to carry out my ULR/union rep role
22.5% 54.1% 17.8% 5.6% 573
I get sufficient support from my union
29.8% 54.2% 12.5% 3.4% 614
I am happy to continue in my role as a ULR/union rep
34.8% 53.3% 10.2% 1.6% 557
My work colleagues are supportive of me
23.5% 63.8% 10.4% 2.3% 608
Work pressures restrict my ULR/union rep activities
26.1% 44.0% 24.3% 5.7% 564
I am happy with the support I get from unionlearn
20.0% 66.5% 11.6% 1.9% 579
Question answered by 617 respondents
When asked specifically what had helped them most nearly two thirds (63.5%) said their union and nearly half (47.6%) cited the support of fellow union members (see Table 14). In answer to this question well over a third (37.7%) referred to the support of unionlearn/TUC and a quarter referred to the support provided by their employer.
Table 14: The most important form of support
What has helped you most in your work as a ULR/union rep?
Answer Options Response Percent
Response Count
Support from your union 63.5% 371 Support from unionlearn/TUC 37.7% 220 Support of fellow union members 47.6% 278 Support from your employer 24.7% 144 Other (please specify) 11.1% 65
answered question 584
Employer support for union learning is often demonstrated in the form of institutional arrangements in the workplace that facilitate the union role in support of learning and skills. Key to this are: formal learning agreements between the union and the employer; formal learning partnerships involving the union, local providers and the employer; a working group/committee involving

Survey of ULRs and union reps supporting learning and skills, 2014 unionlearn 2015 21
the union and employer to discuss union learning; and, a union-led learning centre.
Table 15 sets out the main findings regarding these arrangements. Over three fifths (61%) of ULRs and other union reps said that a formal learning agreement was in existence in their organisation or workplace. Taking into account the methodological issues about comparisons with previous ULR surveys, it is positive that the findings from the 2014 survey suggest that learning agreements remain a major foundation of the union learning agenda in many workplaces and is actually more evident than reported in the 2009 ULR survey, which reported that 57% of ULRs reported the existence of a learning agreement.
Table 15: Learning agreements, learning centres and dialogue on training
At the organisation you conduct your ULR/union rep role:
Answer Options Yes No Don't know Response Count
Is there a formal learning agreement for ULR/union reps? 61.1% 23.1% 15.7% 597
Is there a formal learning partnership involving your union, local providers and the employer?
40.1% 34.2% 25.7% 591
Is there a union learning centre? 29.5% 58.6% 11.9% 596 Is there a working group/committee involving your union and employer to discuss union learning?
37.7% 45.9% 16.4% 591
answered question 602
Forty per cent of ULRs and other union reps in our current survey reported that there was a formal learning partnership and this compares with 47% in the 2009 survey. The current survey also showed that nearly two fifths (37.7%) of reps engaged in dialogue with employers through a working group/committee with a remit for discussing union learning.
Nearly three tenths (29.5%) of respondents to the 2014 survey said that there was a union learning centre at their workplace and this compares with 34% in the 2009 survey, showing a relatively small degree of decline. However, there is evidence of a longer-term decline in union-led learning centres (e.g. 44% of ULRs in the 2007 survey and 52% of ULRs in the 2005 survey said there was a union learning centre available in their workplaces).
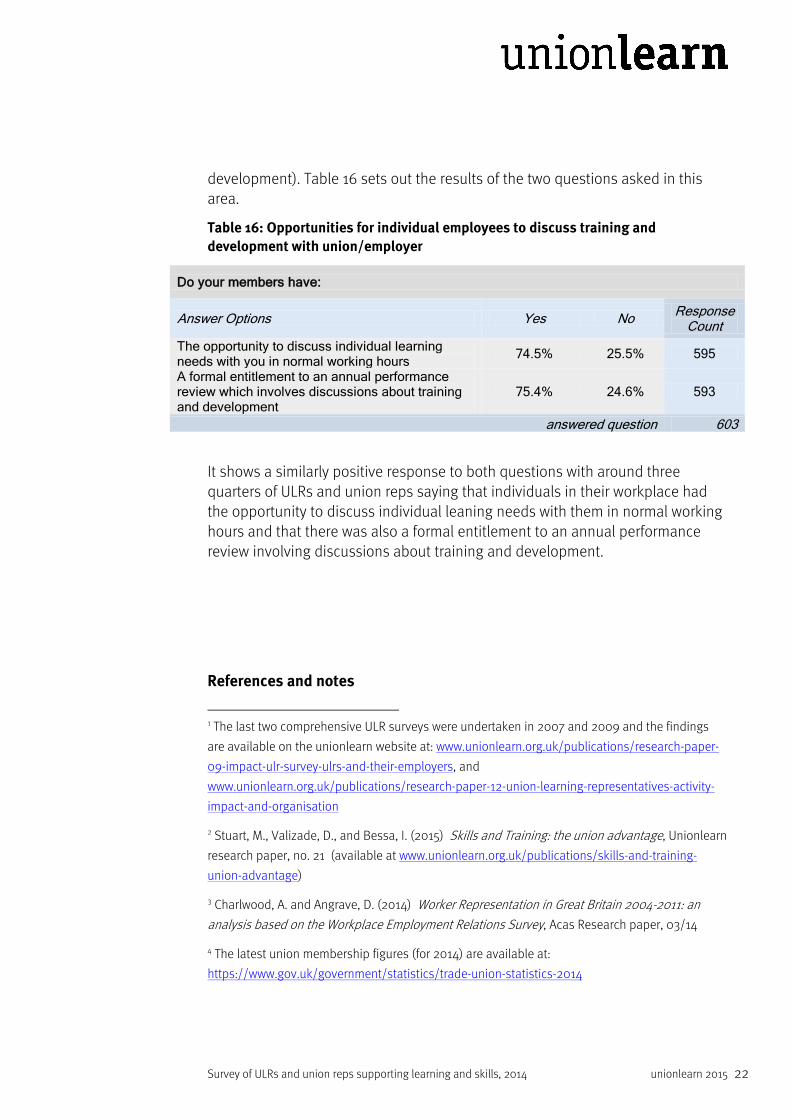
The ability of ULRs and union reps to engage with individual employees is also influenced by the culture of the workplace and whether the employer encourages this form of engagement by ULRs and union reps. Another important factor is whether formal structures exist for individual employees to discuss their training and development with their employer (e.g. a formal entitlement to an annual performance review which involves discussions about training and
Survey of ULRs and union reps supporting learning and skills, 2014 unionlearn 2015 22
development). Table 16 sets out the results of the two questions asked in this area.
Table 16: Opportunities for individual employees to discuss training and development with union/employer
Do your members have:
Answer Options Yes No Response Count
The opportunity to discuss individual learning needs with you in normal working hours 74.5% 25.5% 595
A formal entitlement to an annual performance review which involves discussions about training and development
75.4% 24.6% 593
answered question 603
It shows a similarly positive response to both questions with around three quarters of ULRs and union reps saying that individuals in their workplace had the opportunity to discuss individual leaning needs with them in normal working hours and that there was also a formal entitlement to an annual performance review involving discussions about training and development.
References and notes
1 The last two comprehensive ULR surveys were undertaken in 2007 and 2009 and the findings
are available on the unionlearn website at: www.unionlearn.org.uk/publications/research-paper-
09-impact-ulr-survey-ulrs-and-their-employers, and
www.unionlearn.org.uk/publications/research-paper-12-union-learning-representatives-activity-
impact-and-organisation
2 Stuart, M., Valizade, D., and Bessa, I. (2015) Skills and Training: the union advantage, Unionlearn
research paper, no. 21 (available at www.unionlearn.org.uk/publications/skills-and-training-
union-advantage)
3 Charlwood, A. and Angrave, D. (2014) Worker Representation in Great Britain 2004-2011: an
analysis based on the Workplace Employment Relations Survey, Acas Research paper, 03/14
4 The latest union membership figures (for 2014) are available at:
https://www.gov.uk/government/statistics/trade-union-statistics-2014