supporting information - royal society of chemistry · this includes: materials and methods ......
TRANSCRIPT
Supporting Information
Encapsulation of Ultrafine Metal-Oxides Nanoparticles within
Mesopores for Biomass-Derived Catalytic Applications
Ruiqi Fang,a Panliang Tian,a Xianfeng Yang,b Rafael Luque,*c and Yingwei Li*a
aState Key Laboratory of Pulp and Paper Engineering, School of Chemistry and
Chemical Engineering, South China University of Technology, Guangzhou 510640,
China. Email: [email protected]
bAnalytical and Testing Centre, South China University of Technology, Guangzhou
510640, China.
cDepartamento de Química Orgánica, Universidad de Córdoba, Edif. Marie Curie,
Ctra Nnal IVa, Km 396, E14014, Córdoba, Spain. Email: [email protected]
This PDF file includes:
Materials and methods
Tables S1 to S5
Figures S1 to S12
Electronic Supplementary Material (ESI) for Chemical Science.This journal is © The Royal Society of Chemistry 2018

Experimental
All reagents are of analytical grade and were used without further purification.
Synthesis of ZIF-67
In a typical synthesis, 0.73 g of Co(NO3)2·6H2O was dissolved in 15 mL
methanol to form a clear solution A. Then, 0.82 g of 2-methylimidazole was dissolved
in 15 mL methanol to form a clear solution B. The solutions A and B were mixed
together at room temperature and stirred for 24 h. The resulting purple powder was
washed with methanol several times and dried under vacuum at 50 ºC overnight.
Synthesis of Co@KIT-6
In a typical synthesis, a 5 mL methanol solution containing Co(NO3)2·6H2O
(1.02 g) and KIT-6 (1.0 g) was first prepared and treated with under vacuum to
remove the adsorbed air. Then, another 5 mL of freshly prepared methanol solution
containing 2-methylimidazole (1.15 g) was added under vigorous stirring. The
mixture was further stirred for 24 h under vacuum, followed by centrifugation and
washing with methanol for several times. The resultant powder was denoted as ZIF-
67@KIT-6. After drying at 50 ºC overnight, the ZIF-67@KIT-6 sample was calcined
at 250 ºC for 3 h with a heating rate of 1 ºC min-1 from room temperature in O2
atmosphere. The obtained material was denoted as Co@KIT-6.
For comparison, the ZIF-67@KIT-6 samples were subjected to different
calcination progresses. The prepared materials were denoted as Co@KIT-6-x, where
x indicated the calcination temperatures or heating rates.

Synthesis of Cu@KIT-6
In a typical synthesis, a 5 mL methanol solution containing Cu(NO3)2·3H2O
(0.73 g) and KIT-6 (1.0 g) was first prepared and treated under vacuum to remove the
adsorbed air. Then, another 5 mL of freshly prepared methanol solution containing
1,3,5-benzenetricarboxylate (0.17 g) was added under vigorous stirring. The mixture
was further stirred at 80 ºC for 20 h under vacuum, followed by centrifugation and
washing with methanol for several times. The resultant powder was denoted as
HKUST-1@KIT-6. After drying at 50 ºC overnight, the HKUST-1@KIT-6 sample
was calcined at 250 ºC for 3 h with a heating rate of 1 ºC min-1 from room
temperature in O2 atmosphere. The obtained material was denoted as Cu@KIT-6.
Synthesis of Fe@KIT-6
In a typical synthesis, a 5 mL N,N-dimethylformamide solution containing
FeCl3·6H2O (0.81 g) and KIT-6 (1.0 g) was first prepared and treated under vacuum
to remove the adsorbed air. Then, another 5 mL of freshly prepared N,N-
dimethylformamide solution containing terephthalic acid (0.5 g) was added under
vigorous stirring. The mixture was further stirred at 100 ºC for 12 h under vacuum,
followed by centrifugation and washing with N,N-dimethylformamide for several
times. The resultant powder was denoted as MIL-88b@KIT-6. After drying at 50 ºC
overnight, the MIL-88b@KIT-6 sample was calcined at 250 ºC for 3 h with a heating
rate of 1 ºC min-1 from room temperature in O2 atmosphere. The obtained material
was denoted as Fe@KIT-6.

Synthesis of Ni@KIT-6
In a typical synthesis, a 5 mL methanol solution containing Ni(NO3)2·6H2O
(1.02 g) and KIT-6 (1.0 g) was first prepared and treated under vacuum to remove the
adsorbed air. Then, another 5 mL of freshly prepared methanol solution containing 2-
methylimidazole (1.15 g) was added under vigorous stirring. The mixture was further
stirred at 140 ºC for 12 h under vacuum, followed by centrifugation and washing with
methanol for several times. The resultant powder was denoted as Ni-ZIF@KIT-6.
After drying at 50 ºC overnight, the Ni-ZIF@KIT-6 sample was calcined at 250 ºC for
3 h with a heating rate of 1 ºC min-1 from room temperature in O2 atmosphere. The
obtained material was denoted as Ni@KIT-6.
Synthesis of KIT-6-blank
In a typical synthesis, a 5 mL methanol solution containing KIT-6 (1.0 g) was
prepared and treated with liquid nitrogen under vacuum to remove the adsorbed air.
After that, another 5 mL freshly prepared methanol solution containing
Co(NO3)2·6H2O (0.73 g) was added under vigorously stirring. The mixture was
stirred for 24 h under vacuum followed by centrifugation and washing with methanol
for several times, the obtained powder was denoted as KIT-6-blank.
Synthesis of Co/KIT-6
Co/KIT-6 was prepared by a wetness impregnation method. In a typical synthesis,
a 5 mL methanol solution containing KIT-6 (1.0 g) was prepared. Then, another 5 mL

freshly prepared methanol solution containing Co(NO3)2·6H2O (1.02 g) was added
under vigorous stirring. The mixture was further stirred for 24 h followed by
centrifugation and drying at 50 ºC overnight. Then the pink powder was calcined at
250 ºC for 3 h with a heating rate of 1 ºC min-1 from room temperature in O2
atmosphere. The obtained material was denoted as Co/KIT-6.
Catalyst characterization
Powder X-ray diffraction (PXRD) patterns of the samples were obtained on a
Rigaku diffractometer (D/MAX-IIIA, 3kW) using Cu Kα radiation (40 kV, 30 mA, λ
= 0.1543 nm). BET surface areas and pore size measurements were performed with
N2 adsorption/desorption isotherms at 77 K on a Micromeritics ASAP 2020M
instrument. Before measurements, samples were degassed at 100 ºC for 12 h. The
cobalt contents in the samples were measured quantitatively by atomic absorption
spectroscopy (AAS) on a HITACHI Z-2300 instrument. Elemental analysis was
performed on an Elementar Vario EL III equipment by weighing samples of 0.2–0.3
mg and packing with aluminum foil for the measurement. Fourier transform infrared
spectroscopy (FT-IR) measurements were carried out on a Thermo Fisher iS10
instrument equipped with a liquid nitrogen cooled MCT detector. The magnetic
properties of the catalyst were measured on a Quantum Design physical property
measurement system (PPMS-9). Thermogravimetric analysis (TG) was carried out on
a NETZSCH STA 409 PC/PG under air atmosphere (20 mL·min-1).
The size and morphology of materials were studied by scanning electron
microscopy (SEM) and transmission electron microscopy (TEM). SEM was carried
out on a Zeiss Merlin instrument. TEM and high-angle annular dark-field scanning
transmission electron microscopy (HAADF-STEM) were recorded on a JEOL JEM-
2010F instrument equipped with EDX analysis (Bruker XFlash 5030T) operated at
200 kV. In order to better analyze the dispersion and the sizes of the cobalt oxide
nanoparticles, the samples were embedded in Spurr’s resin and cut into ~30 nm thin
sections using the ultramicrotome.
XPS measurements were performed in a ultra-high vacuum (UHV) multipurpose
surface analysis system (SpecsTM model Germany) operating at pressures <10-10
mbar using a conventional X-ray source (XR-50, Specs, Mg Kalpha, 1253.6 eV) in a
“stop-and-go” mode to reduce potential damage due to sample irradiation. Binding
energies were referenced to the C1s line at 284.6 eV from adventitious carbon.
Deconvolution curves for the XPS spectra were obtained using software supplied by
the spectrometer manufacturer.
General procedures for HMF oxidation
In a typical run, HMF (1.0 mmol) and catalyst (metal 1 mol%) were added to
H2O (3 mL) in the autoclave with magnetic stirrer. After purging the reactor several
times with air, the reactor was maintained at 80 ºC, 0.1 MPa air for 2 h with a stirring
speed of 600 rpm. During the reaction, samples were taken and analyzed by HPLC
(Shimazu LC-20A). The first sample was taken when the reaction temperature
reached 80 ºC. After reaction, the reactor was cooled to room temperature and the
catalyst was isolated from the solution by centrifugation, washed with methanol and
reused directly.
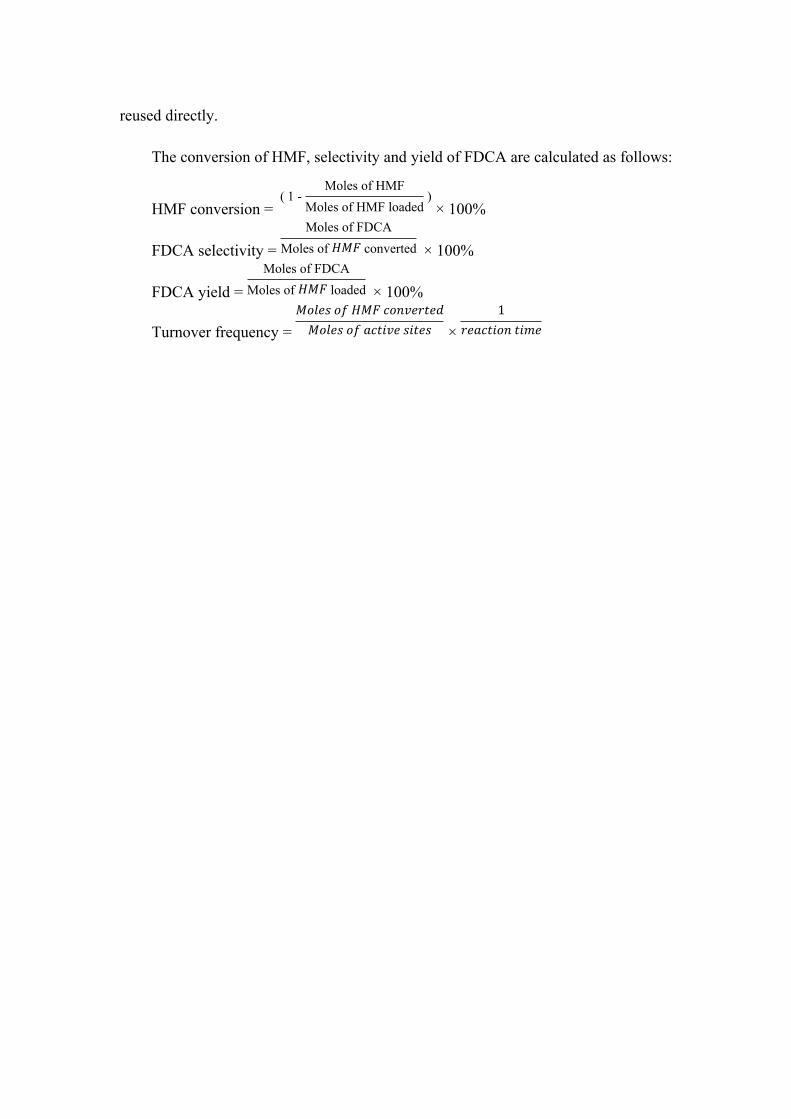
The conversion of HMF, selectivity and yield of FDCA are calculated as follows:
HMF conversion = × 100% ( 1 -
Moles of HMFMoles of HMF loaded
)
FDCA selectivity = × 100%Moles of FDCA
Moles of 𝐻𝑀𝐹 converted
FDCA yield = × 100%Moles of FDCA
Moles of 𝐻𝑀𝐹 loaded
Turnover frequency = × 𝑀𝑜𝑙𝑒𝑠 𝑜𝑓 𝐻𝑀𝐹 𝑐𝑜𝑛𝑣𝑒𝑟𝑡𝑒𝑑
𝑀𝑜𝑙𝑒𝑠 𝑜𝑓 𝑎𝑐𝑡𝑖𝑣𝑒 𝑠𝑖𝑡𝑒𝑠1
𝑟𝑒𝑎𝑐𝑡𝑖𝑜𝑛 𝑡𝑖𝑚𝑒

Fig. S1 (a) Low-angle and (b) high-angle powder XRD patterns, (c) nitrogen adsorption/desorption isotherms and pore size distribution and (d) FT-IR spectra of Co-based materials.

Fig. S2 (a) SEM and (b) TEM images of the ZIF-67@KIT-6 material, (c) simulated FFT patterns of the ZIF-67 crystal. The reciprocal distance between two (440) spots is 0.667 Å-1, revealing that the lattice distance of (440) planes for the ZIF-67 crystal is 2.99 Å.
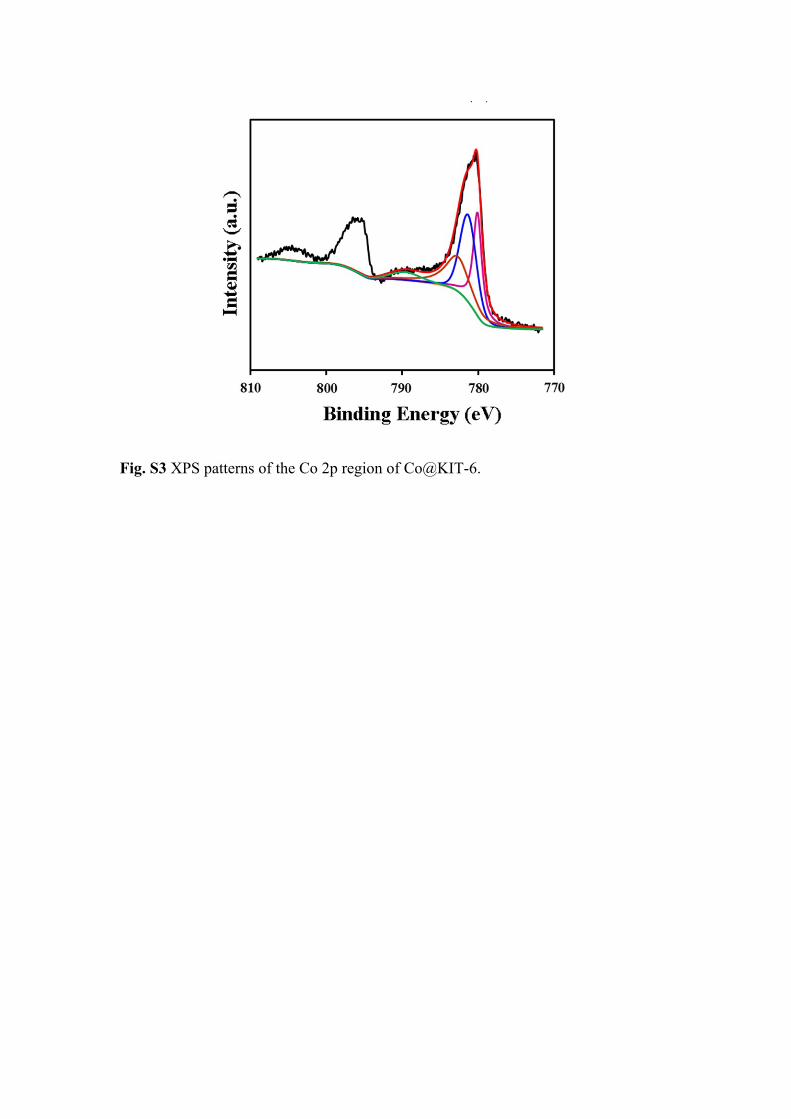
Fig. S3 XPS patterns of the Co 2p region of Co@KIT-6.

Fig. S4 TEM images of (a) parent KIT-6 ultrathin cuts, (b) Co/KIT-6 and (c) HRTEM of an individual Co3O4 nanoparticle.
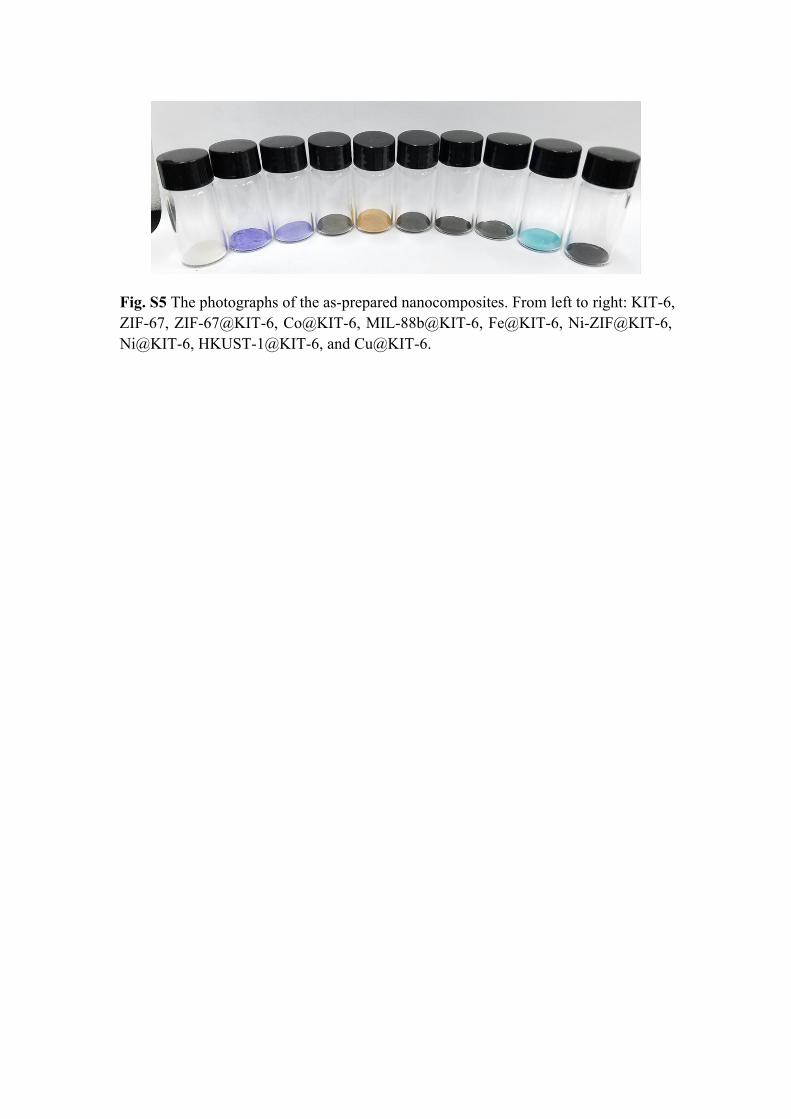
Fig. S5 The photographs of the as-prepared nanocomposites. From left to right: KIT-6, ZIF-67, ZIF-67@KIT-6, Co@KIT-6, MIL-88b@KIT-6, Fe@KIT-6, Ni-ZIF@KIT-6, Ni@KIT-6, HKUST-1@KIT-6, and Cu@KIT-6.

Fig. S6 (a) XRD patterns of MIL-88b@KIT-6 and simulated MIL-88b, (b) FT-IR spectra of KIT-6, MIL-88b@KIT-6 and MIL-88b (from top to bottom. For the parent KIT-6, the two major absorption bands at 1080 and 790 cm-1 revealed stretching vibrations of Si-O-Si bonds. For pure MIL-88b, the band at 550 cm-1 was assigned to the vibration of Fe-O bonds. The strong bands at 1399 and 1663 cm-1 were related to the vibration of C-O and C=O bonds), (c, d) Low- and high-angle XRD patterns of Fe@KIT-6, (e, f) TEM images of Fe@KIT-6 ultrathin cuts, in which homogeneously dispersed Fe3O4 NPs could be obviously observed as dark spots, (g) HR-TEM image of an individual Fe3O4 nanoparticle, (h) XPS patterns of Fe 2p region, (i-l) STEM image and elemental mappings of Fe, Si and O of Fe@KIT-6 ultrathin cuts.

Fig. S7 XRD patterns of HKUST-1@KIT-6 and simulated HKUST-1, (b) FT-IR spectra of KIT-6, HKUST-1@KIT-6 and HKUST-1 (from top to bottom. For the parent KIT-6, the two major absorption bands at 1080 and 790 cm-1 revealed stretching vibrations of Si-O-Si bonds. For pure HKUST-1, the band at 620 cm-1 was assigned to the vibration of Cu-O bonds. The strong bands at 1449 and 1647 cm-1 were related to the vibration of C=C and C=O bonds), (c, d) Low- and high-angle XRD patterns of Cu@KIT-6, (e, f) TEM images of Cu@KIT-6 ultrathin cuts, in which homogeneously dispersed CuO naoparticles could be obviously observed as dark spots, (g) HR-TEM image of an individual CuO nanoparticle, (h) XPS patterns of Cu 2p region, (i-l) STEM image and elemental mappings of Cu, Si and O of Cu@KIT-6 ultrathin cuts.

Fig. S8 XRD patterns of Ni-ZIF@KIT-6 and Ni-ZIF, (b) FT-IR spectra of KIT-6, Ni-ZIF@KIT-6 and Ni-ZIF (from top to bottom. For the parent KIT-6, the two major absorption bands at 1080 and 790 cm-1 revealed stretching vibrations of Si-O-Si bonds. For pure Ni-ZIF, the band at 598 cm-1 was assigned to the vibration of Ni-N bonds. The weak band at 1590 was related to the vibration of C=N bond), (c, d) Low- and high-angle XRD patterns of Ni@KIT-6, (e, f) TEM images of Ni@KIT-6 ultrathin cuts, in which homogeneously dispersed NiO naoparticles could be obviously observed as dark spots, (g) HR-TEM image of an individual NiO nanoparticle, (h) XPS patterns of Ni 2p region, (i-l) STEM image and elemental mappings of Ni, Si and O of Ni@KIT-6 ultrathin cuts.
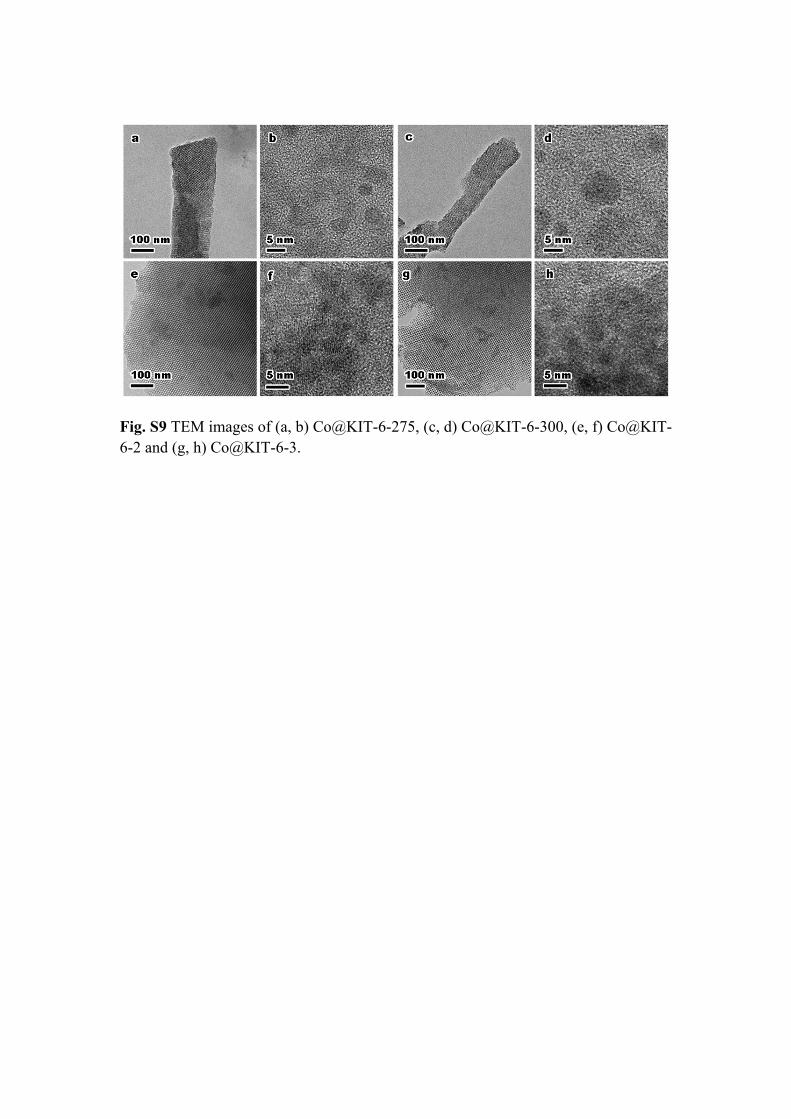
Fig. S9 TEM images of (a, b) Co@KIT-6-275, (c, d) Co@KIT-6-300, (e, f) Co@KIT-6-2 and (g, h) Co@KIT-6-3.

Fig. S10 (a) Hysteresis loops of Co@KIT-6 and Co/KIT-6, and (b) TG-DSC curves of the recycled Co@KIT-6 (red) and Co/KIT-6 (blue) catalysts.
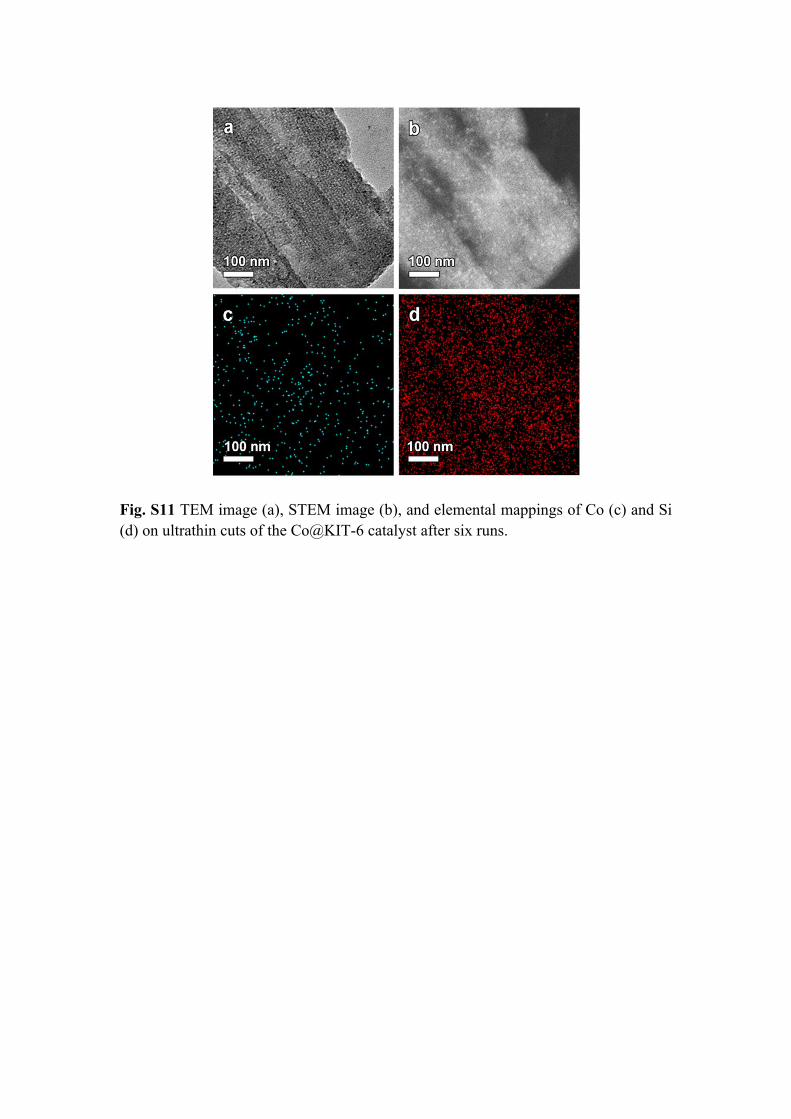
Fig. S11 TEM image (a), STEM image (b), and elemental mappings of Co (c) and Si (d) on ultrathin cuts of the Co@KIT-6 catalyst after six runs.

Fig. S12 TEM image of the Co/KIT-6 catalyst after six runs.
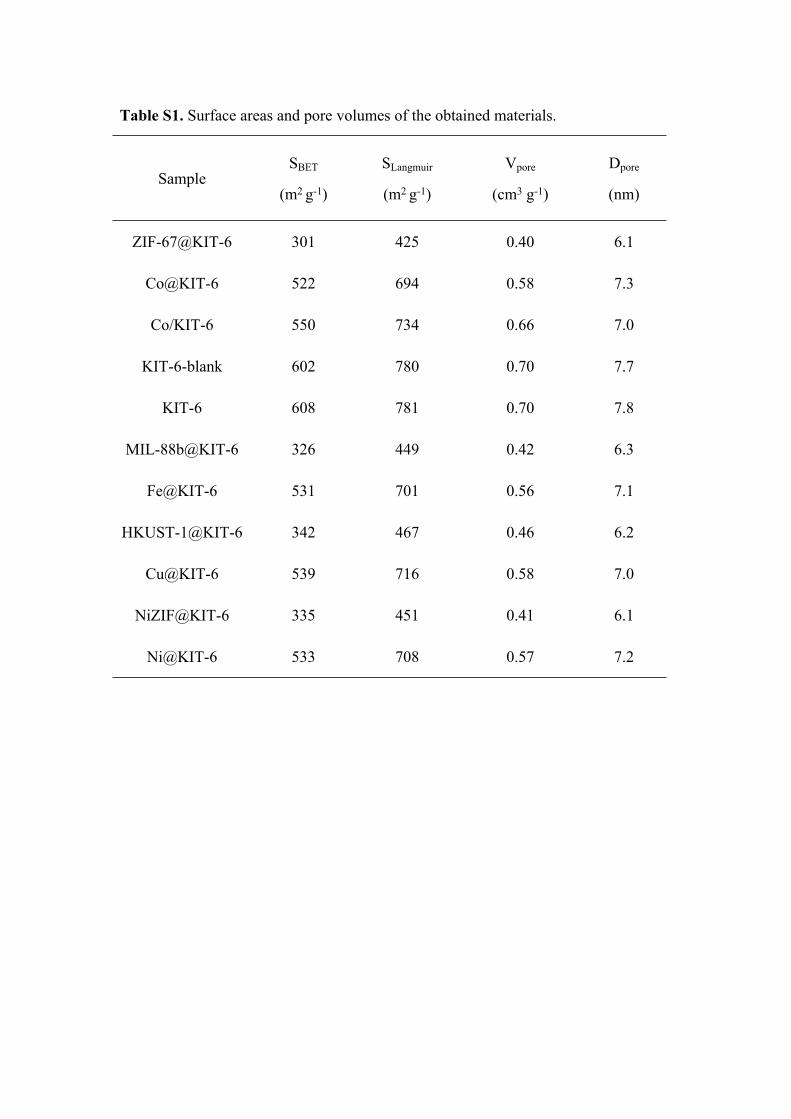
Table S1. Surface areas and pore volumes of the obtained materials.
SampleSBET
(m2 g-1)
SLangmuir
(m2 g-1)
Vpore
(cm3 g-1)
Dpore
(nm)
ZIF-67@KIT-6 301 425 0.40 6.1
Co@KIT-6 522 694 0.58 7.3
Co/KIT-6 550 734 0.66 7.0
KIT-6-blank 602 780 0.70 7.7
KIT-6 608 781 0.70 7.8
MIL-88b@KIT-6 326 449 0.42 6.3
Fe@KIT-6 531 701 0.56 7.1
HKUST-1@KIT-6 342 467 0.46 6.2
Cu@KIT-6 539 716 0.58 7.0
NiZIF@KIT-6 335 451 0.41 6.1
Ni@KIT-6 533 708 0.57 7.2

Table S2. Elemental compositions of the as-synthesized materials measured by AAS
and elemental analysis.
Element content (%)Sample
C Co Fe Cu Ni
ZIF-67 43.4 26.7 - - -
ZIF-67@KIT-6 16.5 10.1 - - -
Co@KIT-6 - 13.6 - - -
Co/KIT-6 - 13.6 - - -
KIT-6-blank - - - - -
MIL-88b@KIT-6 3.4 - 10.7 - -
Fe@KIT-6 - - 11.3 - -
HKUST-1@KIT-
610.8 - - 9.4 -
Cu@KIT-6 - - - 11.6 -
NiZIF@KIT-6 16.9 - - - 10.5
Ni@KIT-6 - - - - 13.4
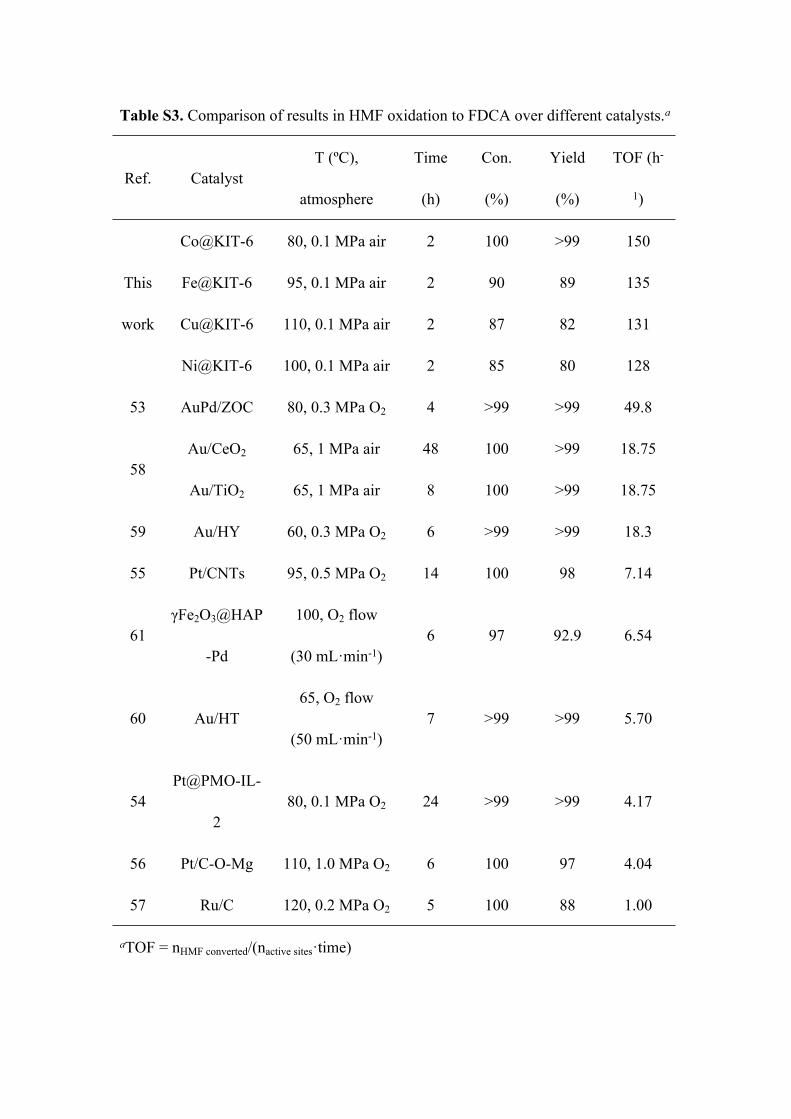
Table S3. Comparison of results in HMF oxidation to FDCA over different catalysts.a
Ref. CatalystT (ºC),
atmosphere
Time
(h)
Con.
(%)
Yield
(%)
TOF (h-
1)
Co@KIT-6 80, 0.1 MPa air 2 100 >99 150
Fe@KIT-6 95, 0.1 MPa air 2 90 89 135
Cu@KIT-6 110, 0.1 MPa air 2 87 82 131
This
work
Ni@KIT-6 100, 0.1 MPa air 2 85 80 128
53 AuPd/ZOC 80, 0.3 MPa O2 4 >99 >99 49.8
Au/CeO2 65, 1 MPa air 48 100 >99 18.7558
Au/TiO2 65, 1 MPa air 8 100 >99 18.75
59 Au/HY 60, 0.3 MPa O2 6 >99 >99 18.3
55 Pt/CNTs 95, 0.5 MPa O2 14 100 98 7.14
61γFe2O3@HAP
-Pd
100, O2 flow
(30 mL·min-1)6 97 92.9 6.54
60 Au/HT65, O2 flow
(50 mL·min-1)7 >99 >99 5.70
54Pt@PMO-IL-
280, 0.1 MPa O2 24 >99 >99 4.17
56 Pt/C-O-Mg 110, 1.0 MPa O2 6 100 97 4.04
57 Ru/C 120, 0.2 MPa O2 5 100 88 1.00
aTOF = nHMF converted/(nactive sites·time)
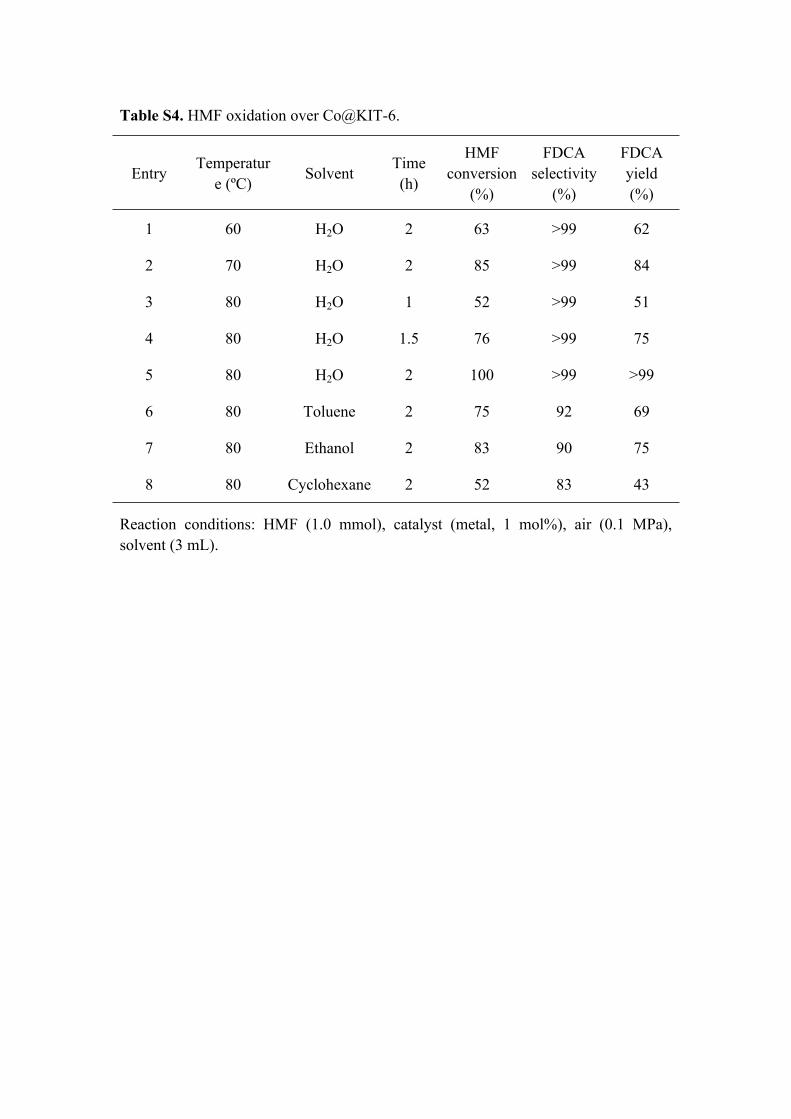
Table S4. HMF oxidation over Co@KIT-6.
Entry Temperature (ºC) Solvent Time
(h)
HMF conversion
(%)
FDCA selectivity
(%)
FDCA yield(%)
1 60 H2O 2 63 >99 62
2 70 H2O 2 85 >99 84
3 80 H2O 1 52 >99 51
4 80 H2O 1.5 76 >99 75
5 80 H2O 2 100 >99 >99
6 80 Toluene 2 75 92 69
7 80 Ethanol 2 83 90 75
8 80 Cyclohexane 2 52 83 43
Reaction conditions: HMF (1.0 mmol), catalyst (metal, 1 mol%), air (0.1 MPa), solvent (3 mL).

Table S5. The Co contents before and after the reaction.
SampleCo content
before reaction(wt%)
Co content after reaction
(wt%)
Amount of Co leached
(wt%)
Leaching percentage
(%)
Co@KIT-6 13.6 13.5 0.1 <1
Co/KIT-6 13.6 12.5 1.1 8.1