spin resolved photoelectron spectroscopy of fe3o4: the case
TRANSCRIPT

IOP PUBLISHING JOURNAL OF PHYSICS: CONDENSED MATTER
J. Phys.: Condens. Matter 19 (2007) 315218 (22pp) doi:10.1088/0953-8984/19/31/315218
Spin resolved photoelectron spectroscopy of Fe3O4: thecase against half-metallicity
J G Tobin1, S A Morton1, S W Yu1, G D Waddill2, I K Schuller3 andS A Chambers4
1 Lawrence Livermore National Laboratory, Livermore, CA 94550, USA2 Department of Physics, University of Missouri-Rolla, Rolla, MO 65409, USA3 Department of Physics, University of California-San Diego, La Jolla, CA 92093, USA4 Pacific Northwest National Laboratory, Richland, WA 99392, USA
Received 30 October 2006, in final form 11 January 2007Published 3 July 2007Online at stacks.iop.org/JPhysCM/19/315218
AbstractMany materials have been theoretically predicted to be half-metallic, and hencesuitable for use as pure spin sources in spintronic devices. Yet to date,remarkably few of these predictions have been experimentally verified. Wehave used spin polarized photoelectron spectroscopy to study one candidatehalf-metallic system, Fe3O4. Such experiments are normally hampered bydifficulties in producing clean stoichiometric surfaces with a polarization thatis truly representative of that of the bulk. However, by utilizing higher photonenergies than have traditionally been used for such experiments, we can studypolarization in ‘as received’ samples, essentially ‘looking through’ the disruptedsurface.
High quality, strain relieved, ex situ prepared Fe3O4 films have beenthoroughly characterized by diffraction, transport and magnetometry studies oftheir crystallographic, electronic and magnetic properties. The spectroscopicresults are found to agree fairly closely with previously published experimentaldata on in situ grown thin films and cleaved single crystals. However, despite thehigher photoelectron kinetic energies of the experiment, it has not been possibleto observe 100% polarization at the Fermi level. Hence, our data do not supportthe claim of true half-metallicity for Fe3O4.
(Some figures in this article are in colour only in the electronic version)
1. Introduction
The field of half-metallic ferromagnets has attracted intense theoretical, experimental, andtechnological interest in the decades since de Groot [1] first postulated the existence of suchmaterials, based upon theoretical band structure calculations of the ferromagnetic Heusleralloy NiMnSb. By definition, such materials possess metallic character for one electron spin
0953-8984/07/315218+22$30.00 © 2007 IOP Publishing Ltd Printed in the UK 1

J. Phys.: Condens. Matter 19 (2007) 315218 J G Tobin et al
population and insulating or semiconducting character for the other, and thus exhibit 100%polarization of the conduction band. Much of the interest in such materials stems fromthe technological potential of half-metals for use as a pure spin sources in future spintronicapplications [2], which would fully exploit the electron spin state in addition to its charge toproduce innovative, non-volatile, radiation-hard, data processing and storage devices.
Theoretical band structure calculations have now predicted half-metallic character for awide range of materials. In addition to Heusler alloys [3], these include, perovskites [4, 5],metallic oxides [6] and CMR systems [7]. Despite intense experimental investigation overmany years, very few of these theoretical predictions have been verified experimentally [8].The most compelling evidence to date for half-metallic character has been obtained fromAndreev reflection studies of the metallic oxide CrO2 [9] and spin resolved photoemissionstudies of the perovskite LaSrMnO3 [10]. However, the latter report has recently beenquestioned in the literature [11]. The reasons for the absence of 100% polarization in realworld systems are many-fold. These include the limitations inherent to the theoretical modelsthat arise from (1) the complex crystallographic structures of many of the candidate materialsand (2) the possible presence of strong electron correlation which would severely limit theappropriateness of the standard single-electron picture. Furthermore, significant experimentalchallenges have also been encountered in studying many candidate half-metallic systems.These experimental limitations include the recurrent issues of stoichiometry, contamination,surface termination, reconstruction [12] and segregation [13]. All of these make it extremelychallenging to obtain a surface with a stoichiometric, electronic and magnetic character thattruly represents that of the bulk material and is thus suitable for further study using the standardtechniques for measuring the polarization of the conduction electrons—Andreev reflection orspin resolved photoemission. These experimental and theoretical difficulties have spurredparticular interest in the proposed metallic oxide half-metals CrO2 and Fe3O4. These twooxides have crystallographic structures that are much simpler than that of many of the othercandidate materials, making them significantly easier both to model theoretically and to prepareexperimentally. Furthermore, both materials have long histories of prior technological use,particularly in the data recording industry, and so their preparation and characteristics arealready well understood. Fe3O4 in particular can be grown using relatively minor variationson standard deposition techniques, which thus makes it particularly suitable for acceleratedintegration into potential device physics applications.
In the next several sections of the paper, the following topics will be discussedsequentially: (section 2) historical overview: the structure and magnetism of Fe3O4;(section 3) sample preparation; (section 4) experimental details; (section 5) experimentalresults from ‘as received’ samples; (section 6) impact of cleaning via ion bombardment;(section 7) temperature dependent spin polarization measurements; (section 8) depth dependentpolarization measurements; (section 9) comparison of experimental results to theoretical DOScalculations; and (section 10) summary discussion. In the (section 11) conclusions, it will bedescribed how the experimental results point inevitably to the absence of half-metallicity inFe3O4.
2. Historical overview: the structure and magnetism of Fe3O4
At room temperature Fe3O4 has a cubic inverse spinel structure in which the larger O ions forma close-packed fcc structure, with the smaller Fe ions occupying two distinct interstitial siteswithin the O lattice that are normally denoted as A and B. One third of the Fe ions occupy thetetrahedrally coordinated A sites, which consist solely of Fe3+ ions, whilst the remaining twothirds occupy the B sites which are octahedrally coordinated and contain both Fe2+ and Fe3+
2

J. Phys.: Condens. Matter 19 (2007) 315218 J G Tobin et al
ions arranged in a random distribution. Across a temperature range from 120 K up to the Neeltransition at 858 K, the moments within the individual A and B sublattices are ferromagneticallycoupled, but in opposite directions. This results in an overall ferrimagnetic character with a netmagnetic moment of 4.1 μB per formula unit [14]. Theoretical local spin density approximationband structure calculations [6] of this ferrimagnetic phase have predicted that it is half-metallicwith a spin up band gap of approximately 0.4 eV and a partially filled metallic spin down t2g
conduction band.One particularly noteworthy feature of Fe3O4 is the existence of a Verwey transition [15]
at 120 K, which is characterized by an abrupt drop in conductivity by some two orders ofmagnitude upon cooling through the transition, as well as a pronounced drop in magnetization.The precise nature of this transition has long been the subject of much debate. However Verweyand Haayman [15] have interpreted it as resulting from spontaneous ordering of the Fe B latticesites leading to a structural transformation from cubic to monoclinic and the closing down ofthe two-stage electron hopping process between the 2+ and 3+ B lattice sites that forms theprimary conduction mechanism above Tv.
The presence of the Verwey transition is of crucial importance for any experimentalinvestigation of the proposed half-metallic character of Fe3O4, as it precludes the use of oneof the most powerful techniques normally utilized in such investigations: Andreev reflection.These measurements must be performed at temperatures that are significantly below the Tv
for Fe3O4. Hence, most studies of electron polarization in Fe3O4 have focused on usingspin resolved photoemission or spin resolved secondary electron spectroscopy. To date, suchmeasurements have yielded highly disparate results in which polarizations at Ef range from+30% [16] to −80% [17] for thin films and −40% [18] to −60% [16] for bulk cleaved singlecrystals. A number of factors have been invoked to explain the failure to observe −100%polarization in Fe3O4, including the presence of strong electron correlation effects [19, 20] andthe excitation of spin waves [17]. It is clear than one factor of crucial importance in suchmeasurements is the presence of significant sample preparation and characterization issuessuch as surface reconstructions [12], surface disorder, surface contamination and interfacialstrain [21]. The latter is a particular problem for the type of thin film samples that are ofcrucial interest for possible spintronic applications and which must generally be grown on anepitaxial substrate. Interfacial strain has been shown to have a dramatic impact on the observedmagnetic properties of such samples [21, 22]. Hence, proper characterization and eliminationof interfacial strain is vital in any systematic investigation of the polarization of epitaxial thinfilm Fe3O4 samples. Such characterization can be achieved through close monitoring of thesharpness, magnitude and onset temperature of the Verwey transition. Small variations in theobserved values from those that are characteristic of bulk single crystals are indicative of (1)the presence of strain, (2) small deviations from stoichiometry, or (3) sample inhomogeneityin the films [23, 24]. Such measurements provide a powerful tool for the characterization ofFe3O4 sample quality and are crucial in the preparation of high quality, strain free films forsubsequent polarization analysis.
3. Sample preparation
Single-crystal, epitaxial, thin films of Fe3O4(001) were prepared by the University ofCalifornia-San Diego (UCSD) and Pacific Northwest National Laboratory (PNNL), using twoslightly different preparation methods. Samples prepared by UCSD were grown by reactivedc sputtering of Fe onto MgO(001) substrates. Deposition was conducted in a partial pressureof O2 (2% ± 0.2%) at a substrate temperature of 400 ◦C. The existence of several structurallysimilar stable iron oxide phases at room temperature necessitates the precise control of gas
3

J. Phys.: Condens. Matter 19 (2007) 315218 J G Tobin et al
Figure 1. X-ray diffraction scan of Fe3O4 thin filmgrown via the UCSD method shows negligible interfacialroughness.
Figure 2. Temperature dependent magnetometry data forstrain relieved Fe3O4 film grown via the UCSD method;data are normalized to a temperature of 120 K. Notethe drop in magnetization occurring at approximately thesame temperature as the Verwey transition seen in bulkFe3O4 crystals.
composition and substrate temperature, if the correct stoichiometry and crystal structure are tobe achieved. MgO has been widely used as a growth template for Fe3O4 as its lattice parameteris almost precisely half that of Fe3O4. Although the lattices have a different crystallographicstructure, they are both based on an O fcc sublattice which allows for a continuous O structureacross the interface. Despite this, such films normally exhibit considerable in plane tensilestress due to the 3% interfacial lattice mismatch. In turn, this leads to anomalous magneticproperties [21, 22] and a suppressed Verwey transition [23], that occurs at a temperaturesignificantly below that normally observed in bulk single crystals. In plane stress was relievedin the UCSD samples by the growth of a 300 A buffer layer between the MgO substrateand the final 1000 A Fe3O4 layer. Such multilayer samples displayed negligible signs ofinterfacial roughness and strain when characterized by x-ray diffraction (XRD, figure 1) andreflection high energy electron diffraction (RHEED). They also exhibited pronounced Verweytransitions at temperatures close to those observed in bulk single crystals, as determined bytemperature dependent measurements of sample magnetization passing through the transition(figure 2). Furthermore, the magnetization hysteresis loops (figure 3) are square above theVerwey transition temperature, corresponding to the ferrimagnetic coupling regime of the Aand B sublattices, in which the two sublattices switch magnetization simultaneously. Below theVerwey transition, the loops become stepped corresponding to weak ferromagnetic coupling ofthe sublattices. Here, there are separate discrete switching points for the A and B sublattices,occurring at different field strengths, as would be expected from bulk single-crystal Fe3O4
samples. Thus, the ex situ growth of high quality, strain free, Fe3O4 thin films on MgO
4

J. Phys.: Condens. Matter 19 (2007) 315218 J G Tobin et al
Figure 3. Temperature dependent magnetic hysteresisloops from strain relieved Fe3O4 film grown via theUCSD method. Note single switching above the Verweytransition temperature and two-stage switching below it.
Figure 4. RHEED images from an Fe3O4 film grown bythe PNNL method compared to equivalent images fromthe bare MgO substrate.
and the precise characterization of their structural character via x-ray and electron diffractiontechniques, combined with magnetometry studies of their Verwey transitions, avoids some ofthe pitfalls associated with the in situ oxidation of single-crystal Fe surfaces [25, 26].
Samples grown at PNNL were prepared in a slightly different manner, by evaporationof Fe at a rate of 0.5 ± 0.1 A s−1, in the presence of an oxygen plasma. The oxygenplasma was activated by an electron cyclotron resonance source in the manner describedelsewhere [12]. Evaporation was again onto Mg(001) substrates and again a buffer layer wasused to alleviate interfacial strain. In this case, a somewhat different method was used to obtainhigh quality strain free samples. Initial growth of the first 1000 A of Fe3O4 was conducted atan elevated temperature of 450 ◦C, then the temperature was lowered to 250 ◦C for the final1000 A deposition. This preliminary, high temperature growth phase causes out-diffusion ofMg from the substrate [24], into the lower layers of the film. This results in step-flow growth,which relieves interfacial strain, removes defects and produces atomically smooth Fe3O4
surfaces as characterized by RHEED (figure 4). Additional in situ characterization, by lowenergy electron diffraction (LEED, figure 5), demonstrated the presence of the characteristic√
2 × √2 R45◦ surface reconstruction of Fe3O4 [12], with no evidence of any additional
contributions from other ordered phases such as Fe2O3 or FeO. In situ x-ray photoelectronspectroscopy (XPS), conducted with a Scienta 200 analyser, demonstrated that the ratios ofthe Fe3+ and Fe2+ contributions to the Fe 2p3/2 peak and the overall O 1s lineshape are allcharacteristic of those seen in high quality single-phase Fe3O4 samples [12] (figure 6).
5

J. Phys.: Condens. Matter 19 (2007) 315218 J G Tobin et al
Figure 5. LEED image from an Fe3O4 film grown via thePNNL method show the
√2 ×√
2 R45◦ surface reconstructionthat is characteristic of a high quality Fe3O4 surface. Theenergy was 97 eV.
Figure 6. (a) In situ XPS spectrum (hν = 1253.6 eV) of the Fe 2p region taken from a Fe3O4 filmgrown via the PNNL method. Fe2+ contribution is visible as a distinct shoulder on the low bindingenergy side of the Fe3+ peak. (b) In situ XPS spectrum (hν = 1253.6 eV) of the O 1s peak regiontaken from a Fe3O4 film grown via the PNNL method.
4. Experimental details
After growth, the samples were transferred ex situ to the Beamline 7 SpectroMicroscopyFacility Spin Chamber at the Advanced Light Source. Here were performed further studies
6

J. Phys.: Condens. Matter 19 (2007) 315218 J G Tobin et al
s
Figure 7. Here is shown a schematic of the energy and spin analyser system. The multichanneldetector (no spin) is at the exit plane of the large hemisphere. The multichannel detector has a holein its centre, which permits electrons to go through it and into the electron optical system. Thisincludes a 90◦ bend and ends at the Mott detector. The Mott detector measures two components ofthe spin, along z and x .
using XPS, UPS, x-magnetic linear dichroism in photoemission (MLDAD) and spin resolvedphotoelectron spectroscopy (SPES). This facility is described in detail elsewhere [27, 28].The third-generation, high brightness undulator provides a tunable source of 80–1300 eVphotons, linearly polarized in the plane of the accelerator. Peak flux from first-harmonicradiation is obtained over an energy range of approximately 80–190 eV and it is this region thatprovides optimal conditions for SPES and for valence band photoemission. Higher energy fifth-harmonic radiation can also be used for core level XPS, primarily for sample characterizationpurposes. The XPS measurements were normally conducted at an energy of 1253 eV forcomparison with published data from Mg Kα sources. It should be noted that the first-harmonicenergy range used for both valence band spin integrated and spin resolved photoemission, andhence both the kinetic energy of the emitted photoelectrons and the resulting experimentalsampling depth, are all substantially higher than those commonly used for SPES at most othersynchrotron facilities or with traditional noble gas discharge sources.
The emitted photoelectrons are collected by a PHI 10360 SCA hemispherical analysermodified to be capable of operation in both spin integrated (conventional XPS) and spinresolved (SPES) mode [27, 29] (see figure 7). In spin integrated mode, the electrons aredetected by a microchannel plate detector situated at the exit plane. In spin resolved mode,the electrons are focused through a central hole in the channel plates and enter a compact20 kV micro-Mott detector capable of resolving both the in plane and out of plane componentsof magnetization with a Sherman function of 0.12 and a figure of merit of approximately
7

J. Phys.: Condens. Matter 19 (2007) 315218 J G Tobin et al
105. Samples were measured under remnant magnetization conditions, in which they exhibitvirtually complete saturation (figure 3). Between successive spectral sweeps the magnetizationdirection was reversed via pulsed Helmholtz coils. This procedure was used to eliminate anypossible contribution from instrumental asymmetries [30].
The experimental resolution for spin integrated XPS, taking into account both photonsource and analyser contributions, is as follows: (1) approximately 0.1 eV for valence bandand shallow core level studies conducted at energies below 190 eV and (2) 0.8 eV for highenergy XPS survey spectra that were conducted at energies above approximately 1000 eV. Inspin resolved mode, the experimental resolution is approximately 0.5 eV for energies below190 eV. The analyser was operated at an angular resolution of approximately ±7◦ resultingin parallel and perpendicular reciprocal space momentum (k) resolutions of 1.56 and 0.1 A
−1
respectively. This large angular acceptance has important implications for the study of half-metals: in order to meet the definition of half-metallicity, the candidate material must exhibit100% polarization over the entire Brillouin zone. A spin spectrometer with high angularresolution will only probe a small proportion of the Fermi surface that is highly localized ink-space. Hence, even if the measured polarization in that region reaches 100%, this is notsufficient to confirm the half-metallic nature of the sample. The large angular acceptance ofour analyser combined with the relatively large unit cell of Fe3O4 (a = 8.3962 A; henceG = 0.75 A), means that we are probing a significant fraction of the Brillouin zone. Thus,our spin resolved band structure measurements are largely free of k dependent angular effects.Furthermore, by varying the photon energy, the region be sampled can moved around in inversespace. Additionally, photoelectron diffraction effects, which can also contribute significantlyto the observed signal in a conventional spin integrated photoemission measurement, havepreviously been demonstrated to have a negligible impact on electron spin polarization as afunction of emission angle [31]. Hence the data presented can be considered to be primarilyangle integrated in character and truly representative of the of the bulk density of states (DOS).
5. Experimental results from ‘as received’ samples
As can be seen in figure 8(a), there is a strong spin specific response that was observed in the asreceived samples. An extensive analysis of surface degradation (figure 8(b)) and contamination(figure 8(c)) effects was also pursued, as will be described next.
Throughout the data acquisition phase samples were maintained at a base pressure of∼5 × 10⁻¹⁰. As a result of exposure to atmosphere during the ex situ transfer the samplesdisplayed initial ‘as received’ surface contamination levels of ∼0.5–1 nm, as measured byAuger electron spectroscopy (AES) and angle dependent XPS (hν = 1250 eV). This consistedentirely of C and O species [32]. Comparison of XPS core level ratios (figure 8(c)) shows thatC/Fe ratio rises with increasing emission angle, confirming that the C is strongly segregatedat the surface. The O/Fe ratio remains approximately constant, indicating that O is present inboth the bulk and surface layer, as expected for adventitious surface contamination. Despite thisinitial surface contamination, XPS measurements of Fe 2p and O 1s (figure 9), conducted on thesame sample as for figure 6 but after ex situ exposure to atmosphere, reveal that the Fe2+ andFe3+ contributions to the Fe 2p lineshape remain essentially unchanged. This result confirmsthat there has been no significant change in chemical environment as a result of exposure. TheO 1s peak also remains largely unchanged although it is considerably broader than before. Thebroadening of the O 1s peak may be due to the presence of low levels of multiple organic specieson the surface. However, it may also simply be a reflection of the somewhat lower resolutionof the analyser. UPS measurements of the Fe3O4 valence band conducted at a photon energy of
8

J. Phys.: Condens. Matter 19 (2007) 315218 J G Tobin et al
(c)
(c)
Figure 8. (a) Spin resolved photoemission spectra from (a) ‘as received’ sample hν = 160 eV.(b) Spin resolved photoemission spectra from a sample after Ne + sputtering, hν = 160 eV. Notethe large effect observed in the as received sample in (a) and the reduction of the effect in (b).(c) Angle dependent XPS measurements of Fe, C and O core level ratios taken from a sample afterexposure to air during transfer.
160 eV (figure 10) are also virtually identical to published spectra from in situ prepared Fe3O4
films [20].MLDAD measurements conducted on the Fe 3p peak at a photon energy of 160 eV
(figure 11) demonstrated the characteristic ‘W’ form of Fe3O4 [26]. The ‘W’ form arisesfrom the overlapping sets of Fe 3p multiplet structures from the Fe2+ (octahedral) and Fe3+(octahedral and tetrahedral) sites. SPES conducted on these ‘as received’ samples at a photonenergy of 160 eV (figure 8(a)) revealed strong positive polarization (∼40%) of the valence bandmaximum, decreasing to a crossover in the sign of the polarization at approximately 0.9 eV, andstrong negative polarization of the Fermi edge (∼−40%). These data were indistinguishable inboth magnitude and form from data reported for both in situ cleaved bulk single-crystal Fe3O4
samples [18] and in situ prepared thin film samples [19]. Together, the results discussed aboveconclusively demonstrate that exposure to atmosphere during transfer has a negligible impact
9

J. Phys.: Condens. Matter 19 (2007) 315218 J G Tobin et al
Figure 9. (a) XPS spectrum (hν = 1253.6 eV) of the Fe 2p region taken from the same sample asfor figure 6 after exposure to air during ex situ transfer. Fe2+, 3+ ratios remain virtually unchangedindicating no significant change in chemical environment as a result of exposure to the air. (b) XPSspectrum (hν = 1253.6 eV) of the O 1s peak region taken from same sample as for figure 6 afterexposure to air during ex situ transfer.
Figure 10. Valence band UPS spectrum of ‘as received’ Fe3O4 film. hν = 160 eV.
10

J. Phys.: Condens. Matter 19 (2007) 315218 J G Tobin et al
Figure 11. Magnetic linear dichroism spectrum of Fe 3p peak from ‘as received’ sample, hν =160 eV. Here, there is no spin detection, only the dichroic response in spin integrated photoemission,driven by magnetization reversal and the utilization of a chiral configuration of vectors includinglinear polarization.
on sample quality for high quality, ex situ prepared samples, apart from the addition of a thinoverlayer of weakly bound adsorbates.
6. Impact of cleaning via ion bombardment
In contrast, in situ cleaning processes can have a dramatic impact on the observed magneticproperties of the sample. As can be seen in figure 8(b), 5 min exposure to Ne+ bombardmentor annealing at 500 ◦C resulted in total loss of the previously strong polarization and evensome reversal of polarization [16]. Despite this dramatic impact on the near surface magneticproperties, XPS measurements conducted before and after sample cleaning provided noindication that such significant sample modification had taken place. Hence, spin resolvedphotoemission provides a powerful surface specific probe of magnetic order. Some success inproducing clean surfaces was observed by annealing in a partial pressure of 10−6 O2 for 15 min.This procedure also resulted in an increase in the observed polarization of some 10% in absolutemagnitude, for samples showing particularly high levels of initial contamination. However,the risk of significant sample modification either through changes in surface stoichiometry orincreased Mg diffusion mobility from the underlying substrate was deemed too great to rely onthis procedure. Thus subsequent discussion will focus on measurements of high quality, ex situprepared samples displaying low to moderate levels of as received surface contamination.
7. Temperature dependent spin polarization measurements
The temperature dependence of the near Fermi edge polarization of the ‘as received’ sampleswas investigated over a range of temperatures from 100 K up to room temperature using anAPD Cryogenics Displex DE202 closed cycle helium cryostat with a quoted accuracy of ±1 K.Spectra taken at representative temperatures can be seen in figure 12. Little difference couldbe detected in the spin resolved near Fermi edge spectra across the range of temperaturesstudied. These results are similar to previous studies [33] using high resolution spin integratedultraviolet photoemission spectroscopy (UPS), which also demonstrated minimal changes in
11
J. Phys.: Condens. Matter 19 (2007) 315218 J G Tobin et al
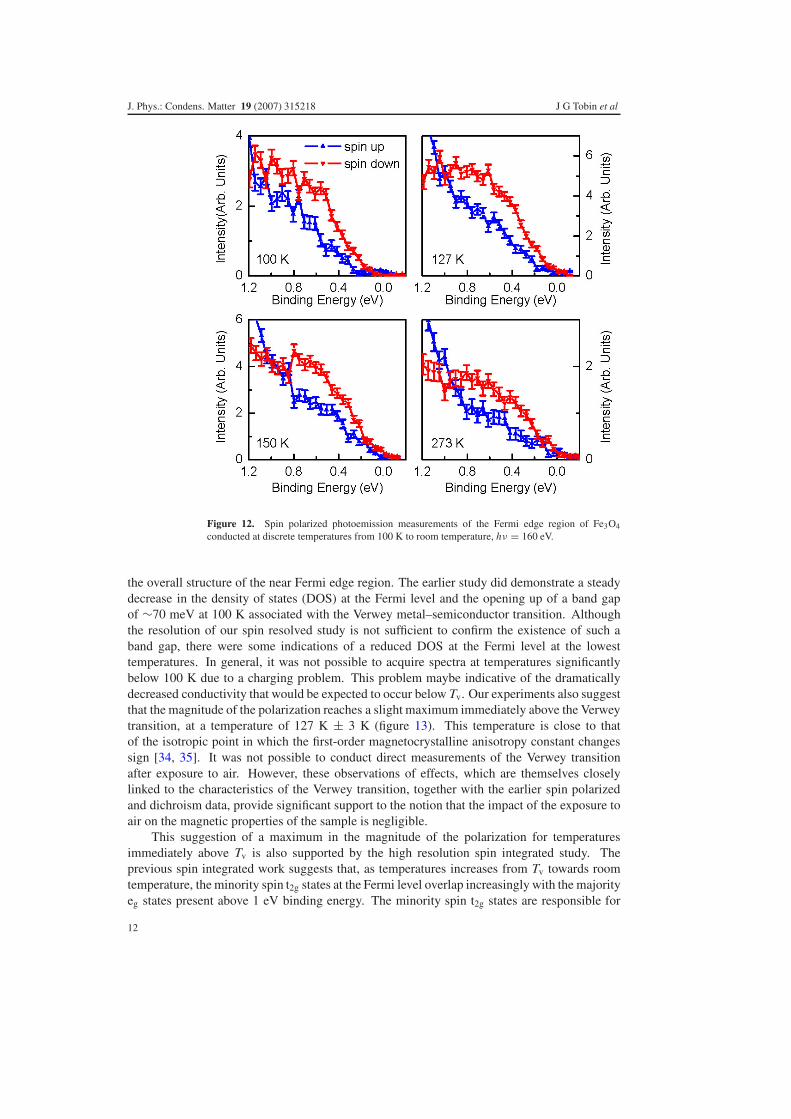
Figure 12. Spin polarized photoemission measurements of the Fermi edge region of Fe3O4
conducted at discrete temperatures from 100 K to room temperature, hν = 160 eV.
the overall structure of the near Fermi edge region. The earlier study did demonstrate a steadydecrease in the density of states (DOS) at the Fermi level and the opening up of a band gapof ∼70 meV at 100 K associated with the Verwey metal–semiconductor transition. Althoughthe resolution of our spin resolved study is not sufficient to confirm the existence of such aband gap, there were some indications of a reduced DOS at the Fermi level at the lowesttemperatures. In general, it was not possible to acquire spectra at temperatures significantlybelow 100 K due to a charging problem. This problem maybe indicative of the dramaticallydecreased conductivity that would be expected to occur below Tv. Our experiments also suggestthat the magnitude of the polarization reaches a slight maximum immediately above the Verweytransition, at a temperature of 127 K ± 3 K (figure 13). This temperature is close to thatof the isotropic point in which the first-order magnetocrystalline anisotropy constant changessign [34, 35]. It was not possible to conduct direct measurements of the Verwey transitionafter exposure to air. However, these observations of effects, which are themselves closelylinked to the characteristics of the Verwey transition, together with the earlier spin polarizedand dichroism data, provide significant support to the notion that the impact of the exposure toair on the magnetic properties of the sample is negligible.
This suggestion of a maximum in the magnitude of the polarization for temperaturesimmediately above Tv is also supported by the high resolution spin integrated study. Theprevious spin integrated work suggests that, as temperatures increases from Tv towards roomtemperature, the minority spin t2g states at the Fermi level overlap increasingly with the majorityeg states present above 1 eV binding energy. The minority spin t2g states are responsible for
12

J. Phys.: Condens. Matter 19 (2007) 315218 J G Tobin et al
Figure 13. Fermi edge spin polarization as afunction of temperature for three ‘as received’samples, hν = 160 eV.
the half-metallic character, so this process would be expected to result in a steady decreasein the observed polarization. Operationally, for all subsequent spin resolved measurements,temperatures around the polarization maximum of 127 K were used.
8. Depth dependent polarization measurements
The magnitude of the observed polarization of the near Fermi edge region of Fe3O4 issignificantly less than the 100% required for half-metallicity. However, this observation doesnot necessarily preclude the existence of half-metallic character for bulk Fe3O4, as a number ofadditional factors, both experimental and physical, may act to reduce the observed value fromthat of the bulk material. The relatively broad energy resolution of the electron analyser withMott detection means that data are convoluted over a relatively wide region in the vicinity of theFermi level, not all of which would necessarily possess 100% polarization. This convolutionwould act to reduce the maximum observed value. Furthermore, the existence of the welldocumented
√2 × √
2 R45◦ Fe3O4 surface reconstruction [12] strongly suggest the presenceof a significant magnetically weak region at the surface. Such reconstructions are readilyaccounted for by invoking the principle of surface autocompensation [36, 37], i.e. that the mostenergetically stable surfaces of compound materials with some degree of ionicity are those forwhich cation (anion) derived dangling bonds are completely empty (or full). However, thisprinciple applies only to semiconducting or insulating surfaces. Such surfaces are driven toachieve autocompensation, through reconstruction, in order to eliminate the surface dipole,which produces a diverging electrostatic energy in the bulk. There is no need to reconstruct inorder to autocompensate if a surface is metallic because the surface dipole would be screenedby free carriers. The fact that Fe3O4(001) exhibits a reconstruction predicted by the surfaceautocompensation principle for either of the two possible bulk terminations [38, 39] suggeststhat the surface layer is not metallic, but either semiconducting or insulating. If this layer ismagnetically weak (or magnetically dead), it’s contribution to the SPES signal would mix withthat of underlying layers to yield a SP of less than 100%. In addition, the presence of additionalsurface contamination in the ‘as received’ samples will further increase the thickness of themagnetically dead surface layer, to an extent that is dependent on the amount of contaminationpresent.
13

J. Phys.: Condens. Matter 19 (2007) 315218 J G Tobin et al
8.1. Estimation of possible magnetically dead surface layer
If we assume that the surface corruption or reconstruction would tend to destroy theferrimagnetism associated with the bulk, we can attempt to estimate the underlying spinpolarization, by calculating the relative contributions from an unmagnetized surface layer andfrom an assumed HMFM bulk material below.
P ′ ={∫ t
0 (1/2)I0 e−x/λ dx}
↑ − {∫ t0 (1/2)I0 e−x/λ dx + ∫ ∞
t I0 e−x/λdx}
↓{∫ t0 (1/2)I0 e−x/λ dx
}↑ + {∫ t
0 (1/2)I0 e−x/λ dx + ∫ ∞t I0 e−x/λdx
}↓
P ′ = e−t/λ.
Here, we have defined I0 as a normalized emission and e−x/λ is the attenuation, with xbeing the depth into the sample, λ the mean free path of the outgoing electron [40, 41], and tis the thickness of the surface corruption or reconstruction. Our typical observed polarizationis about −40%. If P ′ is set equal to |−40%|, then t/λ = 0.92. Since the mean free path isabout 5–8 A, this means that the corrupted/reconstructed layer is on the order of 5–7 A thick,or roughly 1/2 to 1 unit cell (a = 8.4 A). Thus, it is possible that there is approximately 1/2to 1 unit cell of the Fe3O4 that is being demagnetized by the residual surface contaminationor reconstruction. Of course, this is a maximal prediction, based upon the assumption of anunderlying bulk polarization of 100%, which may not be justifiable. We will return to this later.
The existence of a magnetically dead surface layer, overlying a more strongly polarizedbulk can be confirmed through the use of angle dependent spin polarized photoemission. Dueto the previously described angle integrating character of the spin analyser and the relativelylarge unit cell of Fe3O4, such angular dependent measurements will be largely devoid ofmomentum dependent angular effects. Instead, they will be dominated by the change inthe experimental sampling depth as photoelectrons are detected from progressively shallowerdepths at increasing emission angles, to produce a probe of polarization as a function of depth.This effect can be seen clearly in figure 14 which shows spin polarized spectra of the nearFermi edge region of two typical ‘as received’ samples. Also shown are their associated spinintegrated survey spectra taken at 1253.6 eV, displaying the differing levels of initial surfacecontamination, as indicated by the strength of the C 1s peak visible at approximately 285 eV. Anumber of features should be noted. The spin resolved spectra are similar at normal emission,displaying strong negative polarization of the near Fermi edge region, decreasing to a crossoverpoint around 1 eV. As the angle of electron emission is increased, sample A displays a markeddecrease in the polarization at the Fermi edge, as might be expected from the presence of asmooth, contiguous and homogeneous unpolarized overlayer. In contrast, sample B displaysa greatly reduced angular dependence. Indeed, the changes in polarization are less than theexperimental error. These observations can be explained by reference to the initial levelsof contamination, as indicated by the spin integrated survey spectra. The level of surfacecontamination present on sample B is less than one third of that present on sample A. Thus, thedemagnetized overlayer, due to possible intrinsic reconstruction and surface disruption fromthe contamination, is much larger on sample A. Hence, the diminution of the spin polarizationwith increasing off-normal angle is greatly accelerated in sample A relative to sample B.
This approach can be independently corroborated, by studying how the polarization of thenear Fermi edge region changes as a function of photon energy (figure 15). Decreasing thephoton energy also changes the electron attenuation length in a manner analogous to that ofincreasing the emission angle. The range of electron probe depths accessible by changing thephoton energy is not as great as those accessible via changes in electron emission angle, andthe picture is further complicated by the changes in atomic cross sections, which also occur
14

J. Phys.: Condens. Matter 19 (2007) 315218 J G Tobin et al
Figure 14. Angle dependent spin resolved spectra of the near Fermi region, conducted at 0◦, 30◦and 60◦ off normal emission, for two different ‘as received’ samples, at hν = 160 eV. Also shownare the corresponding XPS survey spectrum, illustrating the relative levels of surface contamination.
as a function of photon energy. (Although, the relative contributions of Fe, C, and O remainapproximately constant across this energy range [42].) However, despite these limitations, sucha study does allow an independent estimate of the thickness of the magnetically dead surfacelayer and hence to further constrain the possible range of the underlying bulk polarizations. Wewill return to these subjects below.
8.2. Quantitative model of a magnetically dead surface layer
The angular dependence of the polarization can be considered in a more quantitative manner.This would enable one to estimate the underlying bulk polarization of the Fe3O4 samples, oncethe presence of the magnetically dead (nominally paramagnetic) surface layer, formed from thecombined effects of surface reconstruction and surface contamination, was taken into account.The polarization is derived from the up and down components [30, 43] in the manner describedin equation (1)
P = I + − I −
I + + I − . (1)
However, in the case of a material possessing a magnetically distinct surface layer, the spin upand down populations can be thought of as having two separate contributions, derived from theunderlayer (i ) and overlayer ( j ), as shown in equation (2).
I + = i+ + j+
I − = i− + j− (2)
15

J. Phys.: Condens. Matter 19 (2007) 315218 J G Tobin et al
Figure 15. Photon energy dependent spin resolved spectra of the near Fermi edge region conductedat normal emission. Samples are the same as those used in figure 14.
wherei = i+ + i−
j = j+ + j− (3)
p = (i+ − i−)/(i+ + i−). (4)
From these it is possible to extract the component, p, due solely to the underlying bulkmaterial (4). Assuming that the overlayer is magnetically dead, and hence j+ = j−, then
p = P
(1 + j
i
)(5)
and from standard overlayer attenuation theory
j = j0(1 − e−z/z0)
i = i0e−z/z0(6)
where z is the electron path length and z0 is the electron escape depth. If d is the film thicknessand θ is the emission angle then
z = d
cos θ. (7)
Hence substituting into (5) and defining the parameters ρ and n,
ρ = j0i0
n = z
z0.
(8)
16
J. Phys.: Condens. Matter 19 (2007) 315218 J G Tobin et al
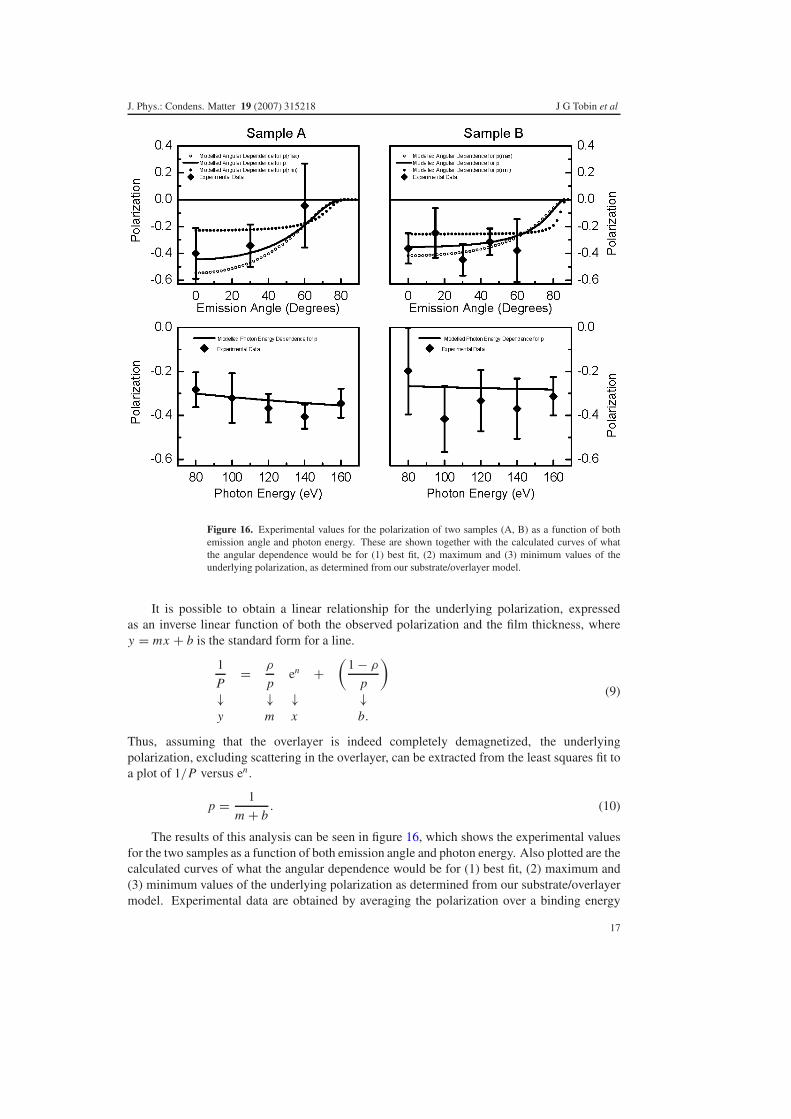
Figure 16. Experimental values for the polarization of two samples (A, B) as a function of bothemission angle and photon energy. These are shown together with the calculated curves of whatthe angular dependence would be for (1) best fit, (2) maximum and (3) minimum values of theunderlying polarization, as determined from our substrate/overlayer model.
It is possible to obtain a linear relationship for the underlying polarization, expressedas an inverse linear function of both the observed polarization and the film thickness, wherey = mx + b is the standard form for a line.
1
P= ρ
pen +
(1 − ρ
p
)
↓ ↓ ↓ ↓y m x b.
(9)
Thus, assuming that the overlayer is indeed completely demagnetized, the underlyingpolarization, excluding scattering in the overlayer, can be extracted from the least squares fit toa plot of 1/P versus en .
p = 1
m + b. (10)
The results of this analysis can be seen in figure 16, which shows the experimental valuesfor the two samples as a function of both emission angle and photon energy. Also plotted are thecalculated curves of what the angular dependence would be for (1) best fit, (2) maximum and(3) minimum values of the underlying polarization as determined from our substrate/overlayermodel. Experimental data are obtained by averaging the polarization over a binding energy
17

J. Phys.: Condens. Matter 19 (2007) 315218 J G Tobin et al
Figure 17. Theoretical spin resolved density of states of Fe3O4 (after Zhang and Setpathy [6]).
range of 0–0.2 eV, to reduce the statistical error involved. This model predicts an underlyingbulk polarization for Fe3O4 of
pbulk = −65% ± 35%.
The rather broad error bars are a result of the broad minimum in the model. However, the resultsdo indeed suggest that the underlying bulk polarization of Fe3O4 is significantly higher than thatwhich has typically been measured in surface sensitive spectroscopies. In these measurements,the magnitude of the observed polarization is reduced from it’s ‘true’ value, by the presencesof a non-magnetic surface layer. It is also possible that experimental factors tend to reducethe observed polarization, such as the effects of finite analyser energy resolution or final stateeffects. Nevertheless, based upon these angular and energy dependences, there remains onlya small chance that Fe3O4 may indeed be half-metallic in the bulk. Below, in the conclusionssection, we will return to a discussion of what this measured polarization of −65% may mean.
9. Comparison of experimental results to theoretical DOS calculations
Once the physical and experimental effects discussed are properly taken into account a directcomparison can then be made between theoretical, spin dependent band structure models andexperimental spin resolved valence band spectra. The spin dependent, valence band density ofstates of magnetite has been modelled by Zhang and Setpathy [6] using a local spin densityapproximation approach (figure 17). These calculations predict the presence of a majority spinband gap at Ef extending to a binding energy of approximately 0.4 eV. Hence, the majority spinpopulation is predicted to be insulating in character. In contrast, the minority carriers possess ametallic character with states derived predominantly from the Fe 3d t2g bands of the B latticesites present at the Fermi level. This model predicts −100% electron polarization at the Fermilevel (and thus half-metallicity in Fe3O4). The model also predicts the presence of a 1 eV wideband gap in the minority states at a binding energy of 3 eV, resulting in +100% polarization ofthe valence band maximum.
However, before a direct comparison can be made between these theoretical band structurecalculations and the experimental data reported here, the experimental and physical effectsdiscussed previously must be taken into account. The effects of finite analyser resolution,surface imperfections, and differing photoelectron cross sections must be introduced into the
18

J. Phys.: Condens. Matter 19 (2007) 315218 J G Tobin et al
Figure 18. Comparison of experimental spin up (a) and spin down (b) spectra with simulatedspectra derived from the theoretical band structure of half-metallic Fe3O4. The key operationsemployed upon the theory plots from figure 17 include broadening and scaling down the spin uppeak at a binding energy of 3 eV to match the experimental curve. This is tantamount to reducingthe polarization.
calculations in order to produce ‘simulated’ spin resolved spectra that facilitate comparisonwith the experimental data.
This analysis procedure and the calculation of simulated spin up and spin down spectra hasbeen discussed in greater detail by the authors elsewhere [44]. The result of this process can beseen in figure 18.
As can be seen there is strong agreement between the experimental data and the simulatedspectra derived from theoretical first principles calculations, once the broadening and down-scaling operations have been performed. The simulated spectra display both the correct overallenvelopes as well as reproducing specific features of the spin resolved spectra such as thestrong majority peak at 3 eV, the reversal of polarization at approximately 1 eV and the stronglynegatively polarized Fermi region, which exhibits a polarization of about −40%. However, themagnitude and variations of the experimentally measured spin polarized spectra in the regionsof 0.5–2.0 eV and 4.0–5.0 eV binding energy are significantly different than the predictionsof the theory, even with the broadening and down-scaling corrections. Hence, although theexperimental and theoretical polarizations are actually in general agreement once correctionsfor the effects of the demagnetized surface region are implemented, a detailed comparison still
19

J. Phys.: Condens. Matter 19 (2007) 315218 J G Tobin et al
indicates significant disparities. This result suggests that while the single-electron results ofZhang and Satpathy [6] are on the right track and almost quantitatively correct, somethingadditional is going on the valence bands. This will be addressed below.
10. Summary discussion
The experiments have demonstrated the feasibility of using well characterized, high quality,strain relieved, ex situ-prepared samples to investigate the spin resolved band structure ofFe3O4. Measurements conducted with a variety of spectroscopic and magnetic probesdemonstrates that while exposure to air results in the formation of a surface layer of adventitioushydrocarbons, it leaves the chemical, electronic and magnetic properties of the samplescompletely unchanged. Moreover, the observed dichroic properties, polarization at the Fermienergy and band structure of ‘as received’ Fe3O4 sample has been shown to be consistent withthat of in situ grown thin film samples and cleaved single crystals. The use of higher photonenergies to conduct the valence band spectroscopy allows us to probe through this adventitiouslayer and removes the necessity for potentially damaging cleaning processes, which have beenshow to significantly impact surface magnetism.
Temperature dependent polarization measurements have shown that the polarization islargely independent of temperature over a temperature range for the Verwey transition up toroom temperature. However, it does pass through a maximum amplitude at a temperature of127 K, which is linked to changes in the first-order magnetocrystalline anisotropy constant.
The measured polarization has been shown to be significantly impacted, by the unavoidablepresence of a magnetically dead surface layer. Hence, obtaining a surface with a polarizationthat is truly representative of that of the bulk material is not feasible by any conventionalsample preparation techniques. However, by probing the spin resolved band structure of ‘asreceived’ samples without attempting to further modify the surface in any way, and by usingphotons of a higher energy than conventionally used for spin resolved photoemission, wecan probe through this disrupted surface layer. By combining this approach with theoreticalpredictions, we obtain an estimate of the polarization of the underlying bulk material. The spinpolarized spectra of these ‘as received’ samples have been compared to those generated from anexisting theoretical model which predicts half-metallic character for Fe3O4. These have beenshown to be in general agreement once the effects of finite analyser energy resolution, surfaceimperfections, and photoelectron cross sections are included, but with a polarization magnitudereduced significantly from 100%.
11. Conclusions
The salient results are as follows:
(1) The measured polarization at the Fermi edge of the ‘as received’ samples wasapproximately −30% to −40%.
(2) Using take-off angle and photon energy variations to probe the Fermi edge polarization ofthe underlying bulk material, a bulk polarization value of −65% was obtained.
(3) Comparing simulated spectra based upon a single-electron model to the experimentalspectra produced near quantitative agreement, but nagging discrepancies remain.
All of this points to something going on beyond the prediction of −100% polarizationfrom a single-electron picture. This result is seemingly in contradiction with the experimentalresult of Dedkov et al [17], who report the observation of −80% polarization at the Fermi
20

J. Phys.: Condens. Matter 19 (2007) 315218 J G Tobin et al
Figure 19. Spin polarization argument following Alvarado and Bagus. See [46].
level. However, these measurements were taken with He I (21.22 eV) and 3◦ angular resolution.Under these conditions, one is not averaging over the Brillouin zone but is instead susceptible toband effects. As discussed above, averaging over the zone is very important. Half-metallicityrequires that the entire density states have one spin only. Observing a high polarization at asingle spot in the BZ has been observed before in non-HMFM systems [45]. So its observationby Dedkov et al at a single angle is NOT a proof of HMFM in Fe3O4.
The obvious candidate is electron correlation. Interestingly, Alvarado and Bagus [46]addressed this issue in 1978, and predicted that the photoelectron spin polarization for a highspin state of d6 character would be −2/3 = −66.7% (figure 19). This is embarrassingly closeto the determination above for the underlying bulk polarization of −65%. (It should also benoted that measurements performed by Vescovo et al [47] using the PNNL type of samplesproduced a polarization value of −50%, qualitatively supporting our values of −30% to −40%and −65%.) The possibility does remain that finite temperature effects (e.g. magnon bandstructure, [48]) are the cause of the reduction of the magnitude of the spin polarization below100%. Unfortunately, measurements nearer to 0 K are an impossibility, because of the Verweytransition in Fe3O4. Our experimental results are consistent with the prediction of electroncorrelation effects. In any case, all of the evidence in our study indicates a reduction of themagnitude the Fermi level polarization, so that the desired value of −100% polarization is notachieved. Fe3O4 is not a half-metallic ferromagnet.
Acknowledgments
This work was performed under the auspices of the US Department of Energy, by the Universityof California Lawrence Livermore National Laboratory under contract W-7405-Eng-48. Workthat was performed by LLNL and UMR personnel was supported by the Office of Basic EnergyScience at the US Department of Energy. The ALS and the Spectromicroscopy Facility havebeen built and operated under funding from the Office of Basic Energy Science at DOE. Workat UCSD is supported by DOE. Work at PNNL is supported by the Offices of the Biologicaland Environmental Research and Basic Energy Sciences at DOE.
21

J. Phys.: Condens. Matter 19 (2007) 315218 J G Tobin et al
References
[1] de Groot R A et al 1983 Phys. Rev. Lett. 50 2024[2] Wolf S A and Treger D 2000 IEEE Trans. Magn. 36 2748[3] Helmholdt R B et al 1984 J. Magn. Magn. Mater. 43 249[4] Jin S et al 1994 Science 264 413[5] deBoer et al 1997 Solid State Commun. 102 621[6] Zhang Z and Satpathy S 1991 Phys. Rev. B 44 13319[7] Pickett W E and Singh D J 1996 Phys. Rev. B 53 1146[8] Kamper K P 1987 Phys. Rev. Lett. 59 2788[9] Ji Y et al 2001 Phys. Rev. Lett. 86 5585
[10] Park J-H et al 1998 Nature 392 794[11] Dulli H et al 2000 Phys. Rev. B 62 R14629[12] Chambers S A and Joyce S A 1999 Surf. Sci. 420 111[13] Bona G L, Meier F and Taborelli M 1985 Solid State Commun. 56 391[14] Kakol Z and Honig J M 1989 Phys. Rev. B 40 9090[15] Verwey E J and Haayman P W 1941 Physica 8 979[16] Aeschlimann M et al 1987 Helv. Phys. Acta 60 794[17] Dedkov Y S, Rudiger U and Guntherodt G 2002 Phys. Rev. B 65 064417[18] Alvarado S F et al 1975 Phys. Rev. Lett. 34 319[19] Huang D J et al 2002 Surf. Rev. Lett. 9 1007[20] Huang D J et al 2002 J. Magn. Magn. Mater. 239 261[21] Margulies D T et al 1996 Phys. Rev. B 53 9175[22] Margulies D T et al 1997 Phys. Rev. Lett. 79 5162[23] Lind D M et al 1992 Phys. Rev. B 45 1838[24] Anderson J F et al 1997 Phys. Rev. B 56 9902[25] Kim H-J, Park J-H and Vescovo E 2000 Phys. Rev. B 61 15284[26] Kim H-J, Park J-H and Vescovo E 2000 Phys. Rev. B 61 15288[27] Tobin J G et al 1998 MRS Symp. Proc. 524 185[28] Denlinger J D et al 1995 Rev. Sci. Instrum. 66 1342[29] Tobin J G and Schumann F O 2001 Surf. Sci. 478 211[30] Johnson P D 1997 Rep. Prog. Phys. 60 1217[31] Waddill G D et al 1994 Phys. Rev. B 50 6774[32] Morton S A et al 2000 Bull. Am. Phys. Soc. 45 644[33] Chainai A et al 1995 Phys. Rev. B 51 17976[34] Gridin V V, Hearne G R and Honig J M 1996 Phys. Rev. B 53 15518[35] Stacey F D and Banerjee S K 1974 The Physical Principles of Rock Magnetism (New York: Elsevier)[36] Pashley M D 1989 Phys. Rev. B 40 10481[37] LaFemina J P 1994 Crit. Rev. Surf. Chem. 3 297[38] Chambers S A, Thevuthasan S and Joyce S A 2000 Surf. Sci. 450 L273[39] Stanka B et al 2000 Surf. Sci. 448 49[40] Somorjai G A 1981 Chemistry in Two Dimensions: Surfaces (Ithaca, NY: Cornell University)[41] Ertl G and Kueppers J 1974 Low Energy Electrons and Surface Chemistry (Weinheim: Verlag Chemie)[42] Yeh J J and Lindau I 1985 At. Data Nucl. Tables 32 1[43] Kessler J 1985 Polarized Electrons (Berlin: Springer)[44] Morton S A et al 2002 Surf. Sci. Lett. 513 L451[45] Hochstrasser M, Tobin J G, Rotenberg E and Kevan S D 2002 Phys. Rev. Lett. 89 216802[46] Alvarado S F and Bagus P S 1978 Phys. Lett. A 67 397[47] Vescovo E, Kim H J, Ablett J M and Chambers S A 2005 J. Appl. Phys. 98 084507[48] Dowben P A and Skomski R 2004 J. Appl. Phys. 95 7453
Dowben P A and Jenkins S J 2007 The limits to spin-polarization in finite-temperature half-metallic ferromagnetsFrontiers in Magnetic Materials ed A V Narliker (Berlin: Springer)
22