magnetically retrievable ce-doped fe3o4 nanoparticles as
TRANSCRIPT

RSC Advances
PAPER
Ope
n A
cces
s A
rtic
le. P
ublis
hed
on 2
6 Ju
ly 2
019.
Dow
nloa
ded
on 3
/14/
2022
4:4
6:43
AM
. T
his
artic
le is
lice
nsed
und
er a
Cre
ativ
e C
omm
ons
Attr
ibut
ion
3.0
Unp
orte
d L
icen
ce.
View Article OnlineView Journal | View Issue
Magnetically retr
aDepartment of Chemistry, Centre of Ad
University, Chandigarh 160014, India. E-mabDr S. S. Bhatnagar University Institute of Ch
UICET), Panjab University, Chandigarh, 160cCSIR – Central Scientic Instruments Orga
IndiadUGC-DAE Consortium for Scientic Resear
Indore – 452 017, India
† Electronic supplementary informa10.1039/c9ra03252e
Cite this: RSC Adv., 2019, 9, 23129
Received 1st May 2019Accepted 5th July 2019
DOI: 10.1039/c9ra03252e
rsc.li/rsc-advances
This journal is © The Royal Society of C
ievable Ce-doped Fe3O4
nanoparticles as scaffolds for the removal of azodyes†
Aashima,a Shivani Uppal,a Arushi Arora,a Sanjeev Gautam, b Suman Singh,c
R. J. Choudharyd and S. K. Mehta *a
Considering the significant impact of magnetically retrievable nanostructures, herein, Fe3O4 and Ce-doped
Fe3O4 nanoparticles were employed as scaffolds for the removal of the Reactive Black 5 (RB5) azo dye. We
synthesized the Ce-doped Fe3O4 nanoparticles via hydrothermal treatment at 120 �C for 10 h with varying
cerium concentrations (1.5–3.5%) and characterized them using basic techniques such as FTIR and UV-
visible spectroscopy, and XRD analysis. The retention of their magnetic behaviors even after cerium
amalgamation was demonstrated and confirmed by the VSM results. FESEM and EDX were used for the
morphological and purity analysis of the synthesized nanoabsorbents. XPS was carried out to determine
the electronic configuration of the synthesized samples. The porosity of the magnetic nanoparticles was
investigated by BET analysis, and subsequently, the most porous sample was further used in the
adsorption studies for the cleanup of RB5 from wastewater. The dye adsorption studies were probed via
UV-visible spectroscopy, which indicated the removal efficiency of 87%. The prepared Ce-doped Fe3O4
nanoabsorbent showed the high adsorption capacity of 84.58 mg g�1 towards RB5 in 40 min. This is
attributed to the electrostatic interactions between the nanoabsorbent and the dye molecules and high
porosity of the prepared sample. The adsorption mechanism was also analyzed. The kinetic data well-
fitted the pseudo-first-order model, and the adsorption capability at different equilibrium concentrations
of the dye solution indicated monolayer formation and chemisorption phenomena. Furthermore, the
magnetic absorbent could be rapidly separated from the wastewater using an external magnetic field
after adsorption.
1. Introduction
Synthetic dyes have provided us with the advantage of achieving fastand brighter colors. Dyestuffs require a large amount of water fordyeing. About 80% of dyestuffs stay on the substrate, whereas therest just go down the drain.1 With the development of the printingand dyeing industry, wastewater pollution is posing a threat withdyes as typical organic pollutants. The toxic nature of dyes hasbecome a cause of serious concern to environmentalists. The use ofsynthetic dyes has an adverse effect on all life forms such ashumans, animals or plants, and the grave outcomes necessitatetheir effective disposal; azo dyes bear an azo (–N]N) functional
vanced Studies in Chemistry, Panjab
emical Engineering and Technology (SSB
014, India
nization, Sector-30, Chandigarh 160030,
ch, University Campus, Khandwa Road,
tion (ESI) available. See DOI:
hemistry 2019
group together with complex chemical moieties comprising phenyl(C6H5CH2), naphthyl (C10H7CH2) or phenylamine (C6H5–NH2)groups;2 these moieties are highly complex for treatment via tradi-tional biological methods. Thus, various chemical and physicaltreatment methods, such as coagulation–occulation,3 advancedoxidation,4 membrane ltration,5 adsorption on activated carbon,6
and electrochemical7 and catalysis approaches,8 have long beenestablished for the decolorization of textile wastewater. However,most of these methods suffer from high cost of experimentation,use of sophisticated instruments and manpower and inability tomeet the permissible disposal levels. Most importantly, they haveunsatisfactory recyclability and inefficient regeneration, whichrestrict their application in an industrial setup.
Adsorption has been commonly used as an effective techniquefor the removal of dyes. Activated carbon,9 rice husk,10 metalhydroxide sludge,11 zeolites12 and other compounds derived fromnatural sources have been used as adsorbents. Moreover, theadsorption process is preferred over the degradation of azo linkagessince various reactive species, i.e. hydroxyl and hydrogen radicals,are involved in the latter process that lead to various degradationproducts (e.g. arylamines), which are potentially more toxic than thedyestuff itself.13
RSC Adv., 2019, 9, 23129–23141 | 23129

RSC Advances Paper
Ope
n A
cces
s A
rtic
le. P
ublis
hed
on 2
6 Ju
ly 2
019.
Dow
nloa
ded
on 3
/14/
2022
4:4
6:43
AM
. T
his
artic
le is
lice
nsed
und
er a
Cre
ativ
e C
omm
ons
Attr
ibut
ion
3.0
Unp
orte
d L
icen
ce.
View Article Online
Magnetic nanoparticle (Np) adsorption has unfolded as anauxiliary method to usual adsorption for the treatment ofeffluent wastewater;14 hence, magnetic nanoadsorbents canserve as rapid dye adsorbing agents for the adsorption of dyesfrom wastewater effluent due to the presence of hydroxyl groupson their surfaces and consequently can be easily retrieved fromthe medium using a magnetic eld post implementation. Somestudies have been reported on the adsorption of pollutants onmagnetite-based composites.15–17 Magnetic lignin-based adsor-bents have been synthesized, and their adsorption capacity hasbeen found to be more than 90% for azo dyes.18 Elwakeel et al.19
used magnetic chitosan resins to remove Reactive Black 5 (RB5)from aqueous solutions and were able to efficiently elute theadsorbate back. Chatterjee et al.20 used modied zero-valentiron with various surfactants, such as cetyl-trimethylammonium bromide and sodium dodecyl sulfate, forthe removal of RB5 from wastewater. Pure magnetite (Fe3O4)exhibits excellent magnetic properties; however, its adsorptionefficiency towards pollutants is low.21 Thus, doping of othermetals/metal ions, such as zinc and cobalt, into the Fe3O4
matrix increases the availability of its surface sites; thisaccordingly improves the adsorption capacity of Fe3O4.22,23
Furthermore, Su et al.24 reported the relationship betweenmanganese doping and adsorption properties. The maximumadsorption capacity was found to be 84.54 mg g�1 in the case ofdoped hematite as compared to the case of undoped hematite(33.02 mg g�1). Vanadium-doped Fe3O4 promoted the adsorp-tion of methylene blue with a high degree of decolouration. Theimproved adsorption efficiency was due to the increase insupercial hydroxyl groups.25
In the present study, we fabricated Fe3O4 and Fe3O4 dopedwith cerium (Ce), Ce–Fe3O4, via a hydrothermal treatment. Ceexhibits a facile transition between the +3 and +4 oxidationstates, and the differences in the oxidation states of the hostand dopant metal leads to the generation of octahedral (Ov)defects, which act as charge compensating vacancies and tendto inuence various properties. The synthesized samples werewell characterized by XRD, UV-vis spectroscopy, N2 adsorption/desorption, FTIR spectroscopy, FE-SEM and XPS. The concen-tration of cerium as a dopant was varied, and XRD was con-ducted to conrm the doping. The magnetic behavior wasanalyzed using VSM studies. Furthermore, the effect of ceriumconcentration on various properties, such as magnetic andsurface area properties, was investigated. Reactive Black 5(RB5), an anionic dye that belongs to the category of azo-reactivedyes and is extensively used in textile industries for dyeing, hasbeen selected as a model dye. This study highlights the poten-tial application of Ce-doped Fe3O4 Nps as efficient RB5 adsor-bents and their magnetic retrieval with the retention of theirproperties, which widens their scope for application in envi-ronmental remediation processes.
2. Experimental2.1. Materials
Iron(III) chloride hexahydrate (FeCl3$6H2O, 97%), iron(II) sulphatehexahydrate (FeSO4$6H2O, $99%) and Reactive Black 5 were
23130 | RSC Adv., 2019, 9, 23129–23141
purchased from Sigma-Aldrich. Aqueous ammonia (25%) waspurchased from Merck. Cerium(III) nitrate hexahydrate (Ce(NO3)3-$6H2O, $99%) was obtained from HPLC Pvt. Ltd. All chemicalswere of analytical grade and used without further purication.Deionised water (DW) was used for the synthesis and samplepreparation.
2.2. Synthesis of Fe3O4 and Ce–Fe3O4 Nps through thehydrothermal treatment
The synthesis of Fe3O4 and Ce–Fe3O4 Nps was performed bya hydrothermal method (Scheme 1). In a typical reactionprocess, FeCl3$6H2O (0.270 g) and 0.139 g of FeSO4$6H2Osolutions were dissolved in 10 mL distilled water. The mixturewas then stirred for 5 min, followed by the dropwise addition of5 mL of NH3 solution (25%). To this mixture, Ce(NO3)3$6H2O atdifferent concentrations, obtained by dissolving differentamounts of it ranging from 1.5 to 3.5 wt% in 10 mL distilledwater, was added followed by stirring for 30 min at roomtemperature. The obtained solution was then transferred toa Teon-lined stainless-steel autoclave and placed in a furnaceat 120 �C for 10 h. The autoclave was allowed to naturally cooldown to room temperature aer the hydrothermal treatment.The precipitate was recovered, washed several times withdistilled water and nally with ethanol to remove the impuritiesand dried in an oven at 60 �C.
2.3. Characterization techniques
X-ray diffraction studies were performed using the PANalyticalX'pert PRO XRD at the scanning speed of 8� min�1 with Cu-Karadiation (1.5418 A) in the 2q range of 10–80�. The FTIR spectrawereobtained using a thermally controlled diode laser in the trans-mittance mode in the spectral region of 4000–500 cm�1 usingThermo Scientic, Nicolet iS50 FTIR. The UV-visible absorptionspectra were obtained using the JASCO V 530 spectrophotometer (4-21, Sennin-cho 2-chome, Hachioji, Tokyo 193-0835, Japan model).The spectral range of 190–450 nmwas covered with the precision of�0.2 nm using quartz cuvettes having 1 cm path length. The LakeShore Vibrating Sample Magnetometer (VSM) was used to measurethe magnetization as a function of the applied eld and tempera-ture. Malvern Zeta Nano S90 (Malvern Instruments, Malvern, UK),which calculates intensity weighted mean particle size (Z-average, nm � S.D.), has been used to obtain the particle sizedistribution of the sample. The surface morphology of the samplewas analyzed using the Hitachi-SU8010 eld-emission electronmicroscope (FE-SEM), operating at the voltage of 15 kV. Electronmicrographs were obtained by transmission electron microscopy(TEM-TECNAI 200 kV). Energy dispersive X-ray spectroscopy anal-ysis was carried out using Bruker-Xash. The BET surface areas ofthe sampleswere analyzed by nitrogen adsorption–desorption usinga N2 adsorption analyzer, BELSORP. Aer degassing all the samplesat 423 K for 15 hours, the BET surface area was determined usingthe multipoint BET method. The Barrett–Joyner–Halenda (BJH)method was used to analyse the pore-size distribution using theadsorption branch of the isotherm. X-ray photoelectron spectros-copy (XPS) was performed using the Omicron energy analyzer (EA-125) with an Al Ka (1486.6 eV) X-ray source. The sample was
This journal is © The Royal Society of Chemistry 2019

Scheme 1 Schematic for the fabrication of Fe3O4 and Ce–Fe3O4 Nps.
Paper RSC Advances
Ope
n A
cces
s A
rtic
le. P
ublis
hed
on 2
6 Ju
ly 2
019.
Dow
nloa
ded
on 3
/14/
2022
4:4
6:43
AM
. T
his
artic
le is
lice
nsed
und
er a
Cre
ativ
e C
omm
ons
Attr
ibut
ion
3.0
Unp
orte
d L
icen
ce.
View Article Online
sputtered with Ar+ for 5 min before the spectra were obtained. Thebackground vacuum in the analyzer chamber was of the order of10�10 Torr during the XPS measurement.
2.4. Dye adsorption experiments
All experiments were performed at room temperature underlight. For adsorption studies, at rst, 10 mg of the synthesizedsample was added to 50 ppm of dye solution, i.e. RB5, toconrm the adsorption capability of the synthesized nano-materials. The dye concentration was 30 ppm for all the dyesemployed herein. The pH value was maintained between 3 and4. The color of the RB5 solution faded with time, conrmingadsorption. Initially, various optimization parameters wereinvestigated by analysing the effect of contact time, pH anddosage on adsorption. For adsorption capacity calculations, theUV-visible absorbance was measured every 5 min by pipettingout 1 mL solution and then ltering it. The equilibriumadsorption amount (Qe) of the 3.5% Ce–Fe3O4 Nps for the RB5dye was calculated using the following eqn (1):
Qe ¼ v(Co � Ce)/m (1)
where Co and Ce are the initial and equilibrium concentrations(mg L�1) of the dye solution, respectively, v corresponds to thevolume of the dye solution, and m refers to the weight of theNps.
Fig. 1 XRD pattern of the pure Fe3O4 and doped synthesized samples.
3. Results and discussion3.1. Physical characterization of the synthesized samples
3.1.1. X-ray diffraction. The XRD patterns of the Fe3O4 andCe–Fe3O4 samples are shown in Fig. 1. The X-ray diffractogramsof the polycrystalline samples reveal the generation of an
This journal is © The Royal Society of Chemistry 2019
unambiguous single-phase inverse spinel structure. The XRDpattern of the undoped Fe3O4 sample exhibits diffraction peaksat about 30.39�, 35.66�, 43.15�, 53.96�, 57.30� and 62.94�, cor-responding to the (220), (311), (400), (422), (511) and (440)planes; this is agreement with literature (JCPDF card, le no. 74-0748); all the observed peaks have been indexed to pure Fe3O4,and no diffraction peaks corresponding to oxidized ceriumspecies are found; the XRD peaks provide the requisite infor-mation about the location of the dopant in the crystal lattice.The ion distribution between the tetrahedral and octahedralsites is determined by the relative size and charge on/of cationsand the size of the interstices.26,27 In the Ce–Fe3O4 system, theFe2+ ions show high crystal eld stabilization energy (CFSE),whereas the Fe3+ and Ce4+ ions have zero CFSE at both theoctahedral and the tetrahedral sites. Therefore, considering the
RSC Adv., 2019, 9, 23129–23141 | 23131

Fig. 2 FTIR spectra of pure Fe3O4 and doped Fe3O4.
RSC Advances Paper
Ope
n A
cces
s A
rtic
le. P
ublis
hed
on 2
6 Ju
ly 2
019.
Dow
nloa
ded
on 3
/14/
2022
4:4
6:43
AM
. T
his
artic
le is
lice
nsed
und
er a
Cre
ativ
e C
omm
ons
Attr
ibut
ion
3.0
Unp
orte
d L
icen
ce.
View Article Online
CFSE and ionic radii, it is reasonable that Ce4+ enters theoctahedral sites. The substitution can change the 2q values, asshown in the inset of Fig. 1; this is indicative of cation substi-tution since upon substitution, the crystallite size changes,resulting in a change in scattering.35
With an increase in the dopant concentration, an increase incrystallinity was observed; this was indirect evidence of thedecrease in the crystallite size of the synthesized samples. Thecrystallite size was calculated using the Debye–Scherrer equa-tion as follows:
D ¼ Kl
b cos q(2)
where the parameter D is the crystallite size, l is the wavelengthof X-rays used (0.154 nm), q is the Bragg's diffraction angle andb is the full-width-at-half maxima (FWHM). The average crys-tallite size was calculated and is presented in Table 1. Thecrystallite size was found to increase; this could be ascribed tothe slight difference in the ionic radii of both cations, whichmade the substitution possible. If the ionic radii of the two ionsdiffer by less than 14%, crystal chemistry permits the miscibilityand substitution of ions.28 Therefore, we can conclude thatsubstitution of ions in the crystal lattice occurs without theformation of any other phase.
3.2. Fourier transform infrared spectroscopy (FTIR)
FTIR spectra provide details about the molecular structure andits environment since it is sensitive to various chemical bondsand functional groups present in a molecule. The FTIR spectraof Fe3O4 and Ce–Fe3O4 Nps are depicted in Fig. 2. Fe3O4
exhibits29 only two bands between 400 and 800 cm�1. The peakat 1614 cm�1 and the broad band between 3200 and 3500 cm�1
are attributed to the stretching and bending vibrations of thehydroxyl groups,30,31 which indicate the existence of watermolecules adsorbed on the surface of Fe3O4 and Ce–Fe3O4,respectively. This is mainly due to chemical co-precipitation,where particles are naturally covered with hydroxyl groups.The characteristic peak at 540 cm�1 with a shoulder at 625 cm�1
corresponds to the intrinsic stretching vibrations of metal–oxygen at the tetrahedral site.32
In addition, the low frequency peak observed at around445 cm�1 is assigned to the metal–oxygen stretching vibra-tion at the octahedral site. The band disturbances below1500 cm�1 are due to the lowering of the local symmetry asa result of distortion due to the presence of different cationsat different sites33 (Fig. 2). Moreover, the bands near
Table 1 Crystallite size calculated from the XRD pattern
SystemCrystallitesize (nm)
Fe3O4 25.331.5% Ce–Fe3O4 24.882.5% Ce–Fe3O4 23.223.5% Ce–Fe3O4 23.09
23132 | RSC Adv., 2019, 9, 23129–23141
540 cm�1 become less intense and broader because of thedisturbance of the local symmetry via the introduction ofCe4+ into the lattice. The absorption band at 540 cm�1
gradually shied; this was attributed to the revampedbonding force between the cations and oxygen anionsbecause of the presence of cerium ions.
3.3. UV-visible spectra
The UV-vis analysis helps to understand the optical behaviourof materials. Thus, in this study, the absorbance of Fe3O4 andCe–Fe3O4 Nps was monitored at ambient temperature(Fig. S1†). Magnetite exhibits thermally induced electrondelocalization between adjacent Fe2+ and Fe3+ ions, and itselectronic transitions are assigned to intervalence chargetransfer (IVCT) transitions in the visible and near-IR region.34
The optical properties were enhanced by the introduction ofCe into the lattice of Fe3O4, as can be observed by the intensityenhancement. This can be accredited to the fact that newdefects are introduced aer the substitution of Ce cations intothe lattice unit.
3.4. Vibrating sample magnetometer (VSM)
Fig. 3 shows the dependence of magnetization on the applied eld(M–H) for all the synthesized samples at room temperature. All thesamples displayed ferromagnetic behaviour. The hysteresis loopwas used to calculate the magnetism saturation (Ms) and coercivity(Hc), as listed in Table 2. The undoped Fe3O4 sample displayedbetter Ms than the doped samples. The Ce-doped Fe3O4 sampleexhibited decreased magnetism due to the presence of surfacedefects, which caused a decrease in the exchange coupling betweenneighbouring iron ions on the surface.35 This occurs due to the lackof an oxygen super exchange mechanism. Surface spin disorder iscaused by the broken exchange bonds on the surface of the parti-cles, which inuences magnetism.36 It has been reported that spincanting reduces aer rare earth doping and thus increases themagnetization.37 The decrease inMs with an increase in the dopinglevel is attributed to the pronounced effect of the f-electrons in
This journal is © The Royal Society of Chemistry 2019
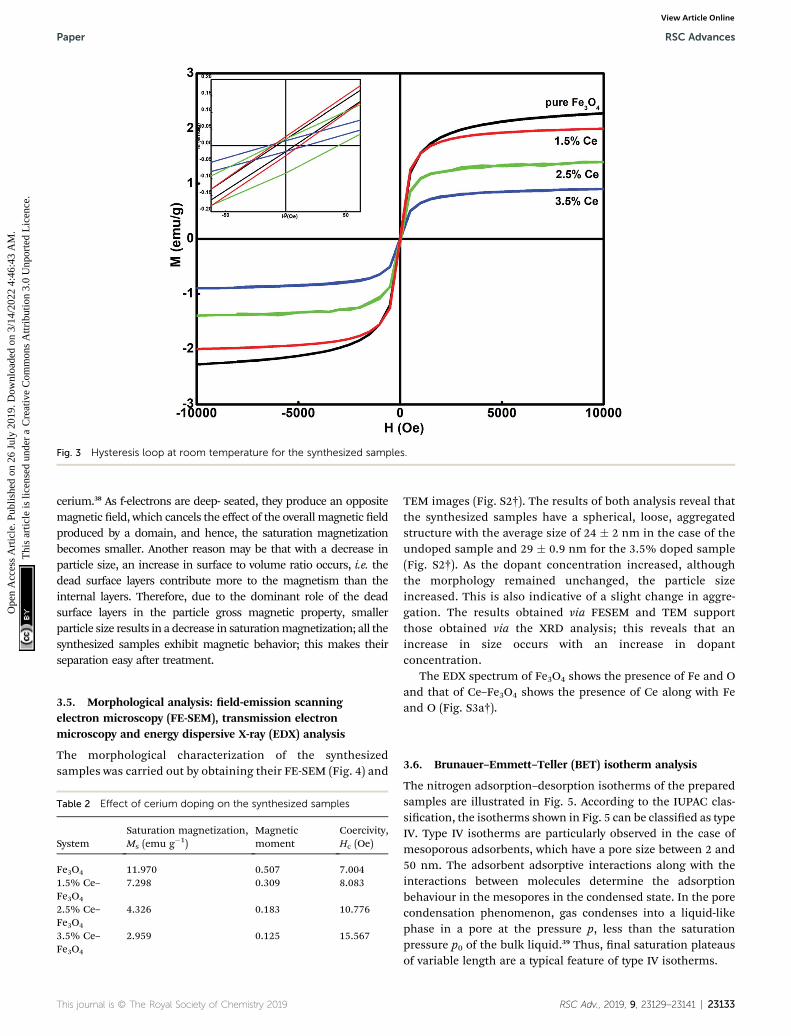
Fig. 3 Hysteresis loop at room temperature for the synthesized samples.
Paper RSC Advances
Ope
n A
cces
s A
rtic
le. P
ublis
hed
on 2
6 Ju
ly 2
019.
Dow
nloa
ded
on 3
/14/
2022
4:4
6:43
AM
. T
his
artic
le is
lice
nsed
und
er a
Cre
ativ
e C
omm
ons
Attr
ibut
ion
3.0
Unp
orte
d L
icen
ce.
View Article Online
cerium.38 As f-electrons are deep- seated, they produce an oppositemagnetic eld, which cancels the effect of the overall magnetic eldproduced by a domain, and hence, the saturation magnetizationbecomes smaller. Another reason may be that with a decrease inparticle size, an increase in surface to volume ratio occurs, i.e. thedead surface layers contribute more to the magnetism than theinternal layers. Therefore, due to the dominant role of the deadsurface layers in the particle gross magnetic property, smallerparticle size results in a decrease in saturationmagnetization; all thesynthesized samples exhibit magnetic behavior; this makes theirseparation easy aer treatment.
3.5. Morphological analysis: eld-emission scanningelectron microscopy (FE-SEM), transmission electronmicroscopy and energy dispersive X-ray (EDX) analysis
The morphological characterization of the synthesizedsamples was carried out by obtaining their FE-SEM (Fig. 4) and
Table 2 Effect of cerium doping on the synthesized samples
SystemSaturation magnetization,Ms (emu g�1)
Magneticmoment
Coercivity,Hc (Oe)
Fe3O4 11.970 0.507 7.0041.5% Ce–Fe3O4
7.298 0.309 8.083
2.5% Ce–Fe3O4
4.326 0.183 10.776
3.5% Ce–Fe3O4
2.959 0.125 15.567
This journal is © The Royal Society of Chemistry 2019
TEM images (Fig. S2†). The results of both analysis reveal thatthe synthesized samples have a spherical, loose, aggregatedstructure with the average size of 24 � 2 nm in the case of theundoped sample and 29 � 0.9 nm for the 3.5% doped sample(Fig. S2†). As the dopant concentration increased, althoughthe morphology remained unchanged, the particle sizeincreased. This is also indicative of a slight change in aggre-gation. The results obtained via FESEM and TEM supportthose obtained via the XRD analysis; this reveals that anincrease in size occurs with an increase in dopantconcentration.
The EDX spectrum of Fe3O4 shows the presence of Fe and Oand that of Ce–Fe3O4 shows the presence of Ce along with Feand O (Fig. S3a†).
3.6. Brunauer–Emmett–Teller (BET) isotherm analysis
The nitrogen adsorption–desorption isotherms of the preparedsamples are illustrated in Fig. 5. According to the IUPAC clas-sication, the isotherms shown in Fig. 5 can be classied as typeIV. Type IV isotherms are particularly observed in the case ofmesoporous adsorbents, which have a pore size between 2 and50 nm. The adsorbent adsorptive interactions along with theinteractions between molecules determine the adsorptionbehaviour in the mesopores in the condensed state. In the porecondensation phenomenon, gas condenses into a liquid-likephase in a pore at the pressure p, less than the saturationpressure p0 of the bulk liquid.39 Thus, nal saturation plateausof variable length are a typical feature of type IV isotherms.
RSC Adv., 2019, 9, 23129–23141 | 23133

Fig. 4 FE-SEM analysis of the (a) undoped and (b) 1.5%, (c) 2.5%, and (d) 3.5% cerium-doped samples.
Fig. 5 BET curves of (a) undoped and (b) 1.5%, (c) 2.5%, and (d) 3.5% cerium-doped samples.
23134 | RSC Adv., 2019, 9, 23129–23141 This journal is © The Royal Society of Chemistry 2019
RSC Advances Paper
Ope
n A
cces
s A
rtic
le. P
ublis
hed
on 2
6 Ju
ly 2
019.
Dow
nloa
ded
on 3
/14/
2022
4:4
6:43
AM
. T
his
artic
le is
lice
nsed
und
er a
Cre
ativ
e C
omm
ons
Attr
ibut
ion
3.0
Unp
orte
d L
icen
ce.
View Article Online

Paper RSC Advances
Ope
n A
cces
s A
rtic
le. P
ublis
hed
on 2
6 Ju
ly 2
019.
Dow
nloa
ded
on 3
/14/
2022
4:4
6:43
AM
. T
his
artic
le is
lice
nsed
und
er a
Cre
ativ
e C
omm
ons
Attr
ibut
ion
3.0
Unp
orte
d L
icen
ce.
View Article Online
Hysteresis is accompanied by the phenomenon of capillarycondensation in the case of type IV isotherms.40 The mean porediameter of the synthesized samples ranged between 14 and19 nm (Table S1†). The void spaces between nanoparticles thatconstitute the nanospheres create these pores.
The pore size distributions of the catalysts were calculated bythe Barrett–Joyner–Halenda (BJH) curve (inset of Fig. 5). It isevident that the adsorption capacities of the pure Fe3O4 and Ce-doped Fe3O4 samples increase with equilibrium pressure; thismay be attributed to the condensation of N2 molecules inmesopores at high pressures. Doping with Ce increased thespecic surface area (Table S1†) available for adsorption from71.6 to 97.6 cm3 g�1, implying that 3.5% Ce–Fe3O4 could facil-itate the diffusion and adsorption of the target pollutant; thiswould be helpful for the elevation of adsorption capacity. TheBET specic surface area, which is an important property foradsorption studies, is high; this may be due to porosity resultingfrom the aggregation of magnetic Nps. Therefore, the systemwith maximum surface area (3.5% Ce–Fe3O4) is favorable foradsorption applications and has been chosen for furtherstudies, i.e. adsorption of RB5 from wastewater.
3.7. X-ray photoelectron spectroscopy (XPS) analysis
To evaluate the elemental composition, chemical environmentand oxidation states of the various elements present in the
Fig. 6 XPS spectra of the 3.5% cerium-doped sample (a) O 1s, (b) Fe 2p
This journal is © The Royal Society of Chemistry 2019
synthesized system, the XPS spectra were obtained. Fig. 6 depictsthe deconvoluted XPS spectra of 3.5% Ce–Fe3O4, i.e. Ce 3d, O 1sand Fe 2p states of the elements present in the examined sample.The peak centered around 537.3 eV (OII) is attributed to the O2�
ions attached to the Fe atoms (Fig. 6a). The intense peak at538.1 eV (OI) results from the conguration and photo ionizationof the 1s core level in the case of molecular oxygen.41
The peak around 528.06 eV (OIII) is due to oxygen present in thecerium oxide lattice,42 which indicates the presence of cerium oxideas an impurity. The ratio of the oxygen peaks (OII/OIII) in the ironand cerium lattice depicts that the amount of cerium oxide is veryless. The peaks observed at 883.4 eV and 901.6 eV (Fig. 6b) are due tothe spin–orbit coupling of the 3d5/2 and 3d3/2 levels, respectively.The peaks located at 883.4 eV, 889.9 eV, 899 eV, 901.6 eV, 908.4 eVand 917.5 eV are ascribed to the 3d104f1 electronic state of Ce4+, andthe peaks positioned at 885.06 eV and 902.8 eV are attributed to the3d104f1 states of the Ce3+ ion.43 The Fe 2p core level XPS spectrumreveals the peaks of Fe 2p3/2 and Fe 2p1/2 at 718.3 eV and 724.5 eV,which are attributed to the Fe3+ state of Fe44 (Fig. 6c). Fe 2p3/2 doesnot have a satellite peak;44 this conrms the formation of Fe3O4 inthe present study.
3.8. Adsorption studies of 3.5% Ce–Fe3O4
The feasibility of the synthesized nanoparticles as procientnanoabsorbents for the removal of Reactive Black 5 (RB5),
and (c) Ce 3d.
RSC Adv., 2019, 9, 23129–23141 | 23135

RSC Advances Paper
Ope
n A
cces
s A
rtic
le. P
ublis
hed
on 2
6 Ju
ly 2
019.
Dow
nloa
ded
on 3
/14/
2022
4:4
6:43
AM
. T
his
artic
le is
lice
nsed
und
er a
Cre
ativ
e C
omm
ons
Attr
ibut
ion
3.0
Unp
orte
d L
icen
ce.
View Article Online
a textile azo dye, was explored. The strong adsorption capacity ofNps is ascribed to the ionic interactions between the dye and thenano-absorbent. The higher charge and porosity of the nano-absorbent led to high removal efficiency. The adsorption peak at600 nm in the visible spectrum of an aqueous solution of RB5 wasobtained using 5 mg of Nps and found to decrease with time (1–90min) (Fig. 7). For this, the absorbance of RB5 wasmonitored inthe presence of the nanoadsorbent. The higher charge andporosity of the presented nanoadsorbent facilitated the removalof the dye through strong ionic interactions between the dye andCe–Fe3O4. Fig. 7 shows the absorbance spectra in the presenceand absence of the nanoadsorbent.
3.8.1. Effect of operational parameters on the removal ofdye. To optimize the adsorption ability of the nanoadsorbent forRB5, the effect of various operational parameters, such as pH,dosage, dye concentration and contact time, on the removal ofthe dye was examined at room temperature.
3.8.1.1. Effect of pH. pH is a vital parameter for contaminantremoval as the degree of RB5 adsorption is initially controlledby the surface charge on Ce–Fe3O4, which is affected by thesolution pH. Thus, the effects of the solution pH on RB5adsorption were investigated in the pH range from 3 to 10(Fig. 8a). The optimum pH for the removal of RB5 was deter-mined via batch mode experiments performed on the RB5 dyewith the concentration of 30 ppm and Nps dosage of 5 mg.Signicant adsorption took place at acidic pH than that atalkaline pH. The maximum removal was found at pH 3. Theresults obtained were interpreted on the basis of zero pointcharge (zpc). The zpc generally lies between 6 and 6.8 mV.45 Theeffect of pH on the surface of the synthesized Nps is presentedin Fig. S4,† which depicts that the zpc lies between 6 and6.9 mV. A pH lower than the zpc generates a positive surfacecharge due to the accumulation of H+ ions or association (FeOH+ H+ / FeOH2
+) of protons. Contrarily, on moving to a higherpH, the presence of excessive OH� ions or dissociation (FeOH/ FeO� + H+) makes the surface negatively charged. Being ananionic dye, RB5 is adsorbed more cogently at lower pH values.Therefore, the higher removal efficacy of the nanoadsorbent at
Fig. 7 (a) UV-visible spectra of RB5 in the presence of 5 mg of Nps withi
23136 | RSC Adv., 2019, 9, 23129–23141
low pH can be attributed to the electrostatic attraction betweenRB5 and Nps, and the reduction in removal at higher pH islinked to the electrostatic force of repulsion between these two(Fig. S5†). The maximum removal was observed for pH ¼ 3, andtherefore, this value was maintained for the remaining batchadsorption experiments.
3.8.1.2. Effect of initial RB5 concentration. The impact of theinitial concentration (10, 20, 30, 50 and 100 ppm) of RB5 wasprobed by xing the Nps dosage amount at 5 mg and pH ¼ 3 atambient room temperature (Fig. 8b). The dye removal efficiencydecreased with an increase in initial dye concentration. The dyeremoval capacity of Nps has a negative impact on the initial dyeconcentration. It was noticed that the removal efficiency was87% at 30 ppm in the presence of 5 mg Nps, whereas underanalogous conditions, the 100 ppm dye concentration showed49% elimination. This effect can be explained on the basis ofsaturation of accessible surface active sites of the adsorbentwith dye molecules. At lower concentration of dye, the numberof available sites to dye ratio was optimum due to which theremoval efficiency was high.
3.8.1.3. Effect of nanoabsorbent dosage. The inuence of Npsdosage amount on the dye removal efficiency is illustrated inFig. 8c. Thus, dosage studies were performed to determine thecapacity of the adsorbent to remove the dye. The adsorbentamounts were varied from 0.1 to 1 mg mL�1 against 30 ppm ofRB5 at pH 3, temperature 25 �C and time of 90 min. With anincrement in nanoadsorbent dose, the percentage removal ofdye increased from 16 to 97% due to the greater availability ofadsorbent surface sites for adsorption.
3.8.1.4. Effect of contact time. To evaluate the effect of reactiontime, the adsorption of RB5 in the presence of Nps with time wasalso analysed (Fig. 7a). Briey, 5 mg of 3.5% Ce–Fe3O4 was added to10 mL of 30 ppm RB5 solution. The absorbance of the solution wasmonitored at the wavelength of 600 nm as a function of time up to90 min, aer which saturation was observed. Fig. 7b shows theinuence of time on dye removal at pH 3, and almost 97% of theRB5 has been adsorbed within 90 min. Further equilibration of thesystem beyond 90 min did not enhance the removal efficacy of the
n time interval of 1–40 min and (b) adsorption profile of RB5 with time.
This journal is © The Royal Society of Chemistry 2019
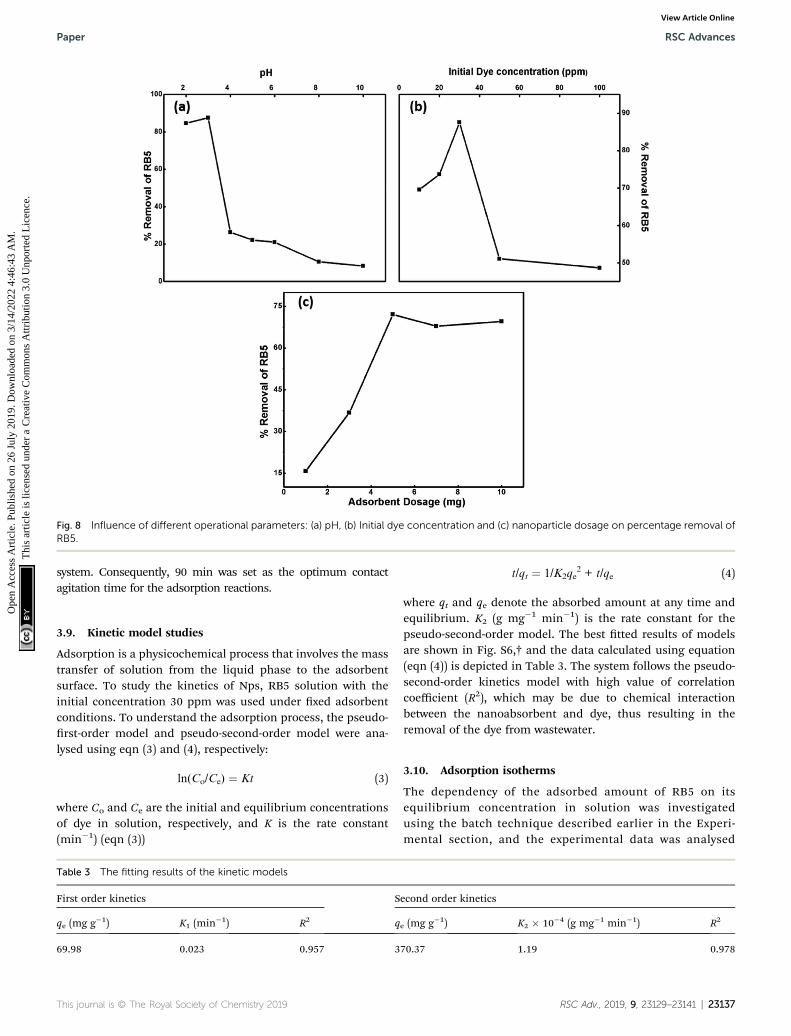
Fig. 8 Influence of different operational parameters: (a) pH, (b) Initial dye concentration and (c) nanoparticle dosage on percentage removal ofRB5.
Paper RSC Advances
Ope
n A
cces
s A
rtic
le. P
ublis
hed
on 2
6 Ju
ly 2
019.
Dow
nloa
ded
on 3
/14/
2022
4:4
6:43
AM
. T
his
artic
le is
lice
nsed
und
er a
Cre
ativ
e C
omm
ons
Attr
ibut
ion
3.0
Unp
orte
d L
icen
ce.
View Article Online
system. Consequently, 90 min was set as the optimum contactagitation time for the adsorption reactions.
3.9. Kinetic model studies
Adsorption is a physicochemical process that involves the masstransfer of solution from the liquid phase to the adsorbentsurface. To study the kinetics of Nps, RB5 solution with theinitial concentration 30 ppm was used under xed adsorbentconditions. To understand the adsorption process, the pseudo-rst-order model and pseudo-second-order model were ana-lysed using eqn (3) and (4), respectively:
ln(Co/Ce) ¼ Kt (3)
where Co and Ce are the initial and equilibrium concentrationsof dye in solution, respectively, and K is the rate constant(min�1) (eqn (3))
Table 3 The fitting results of the kinetic models
First order kinetics S
qe (mg g�1) K1 (min�1) R2 q
69.98 0.023 0.957 3
This journal is © The Royal Society of Chemistry 2019
t/qt ¼ 1/K2qe2 + t/qe (4)
where qt and qe denote the absorbed amount at any time andequilibrium. K2 (g mg�1 min�1) is the rate constant for thepseudo-second-order model. The best tted results of modelsare shown in Fig. S6,† and the data calculated using equation(eqn (4)) is depicted in Table 3. The system follows the pseudo-second-order kinetics model with high value of correlationcoefficient (R2), which may be due to chemical interactionbetween the nanoabsorbent and dye, thus resulting in theremoval of the dye from wastewater.
3.10. Adsorption isotherms
The dependency of the adsorbed amount of RB5 on itsequilibrium concentration in solution was investigatedusing the batch technique described earlier in the Experi-mental section, and the experimental data was analysed
econd order kinetics
e (mg g�1) K2 � 10�4 (g mg�1 min�1) R2
70.37 1.19 0.978
RSC Adv., 2019, 9, 23129–23141 | 23137

Table 4 The fitting results of different models
Isotherm Parameters
Langmuir R2 ¼ 0.988, Qm ¼ 84.585 mg g�1, b¼ 0.337 L g�1
Freundlich R2 ¼ 0.983, n ¼ 2.46, Kf ¼ 3.227Dubinin–Radushkevich (D–R) R2 ¼ 0.726, b ¼ 2.28 � 10�7 mol2 J�2, Qs ¼ 28.19 mg g�1
RSC Advances Paper
Ope
n A
cces
s A
rtic
le. P
ublis
hed
on 2
6 Ju
ly 2
019.
Dow
nloa
ded
on 3
/14/
2022
4:4
6:43
AM
. T
his
artic
le is
lice
nsed
und
er a
Cre
ativ
e C
omm
ons
Attr
ibut
ion
3.0
Unp
orte
d L
icen
ce.
View Article Online
according to the Langmuir, Freundlich and DR isotherms toexamine the type of dye molecule adsorption on the Npssurface. For wastewater treatment applications, theadsorption isotherms were analysed for evaluating theadsorption mechanism. The Langmuir model is valid formonolayer sorption on a surface with a nite number ofidentical sites. The distribution of dye at the solid solutioninterface has been described by the Langmuir equation. Thewell-known Langmuir model is presented by eqn (5) asfollows:
Ce
Qe
¼ 1
KLQmþ 1
QmCe (5)
log Qe ¼ log Kf + 1/n log Ce (6)
Fig. 9 UV spectra of a mixture of dyes before and after the adsorption
23138 | RSC Adv., 2019, 9, 23129–23141
where Qe is the adsorbed amount of dye at equilibriumconcentration, Ce is the equilibrium solute concentration, Qm isthe maximum adsorption capacity and KL is the equilibriumconstant for the Langmuir t. Kf and 1/n are the Freundlichconstants related to the adsorption capacity and adsorptionintensity, respectively. Fig. S7a and b† show the tting results ofthe Langmuir and Freundlich adsorption models, respectively.The calculated values are presented in Table 4. The Qm valueobtained from the Langmuir isotherm adsorption model issupported by the experimental Qm (81.11 mg g�1). The R2 valuesof both the Langmuir and the Freundlich model indicate that theadsorption site can be occupied by only one or more RB5 mole-cules; this results in the formation of a monolayer/multilayer.
The adsorption process is mainly controlled by twomethods: (a) lm diffusion and (b) intraparticle (surface or
of dyes.
This journal is © The Royal Society of Chemistry 2019
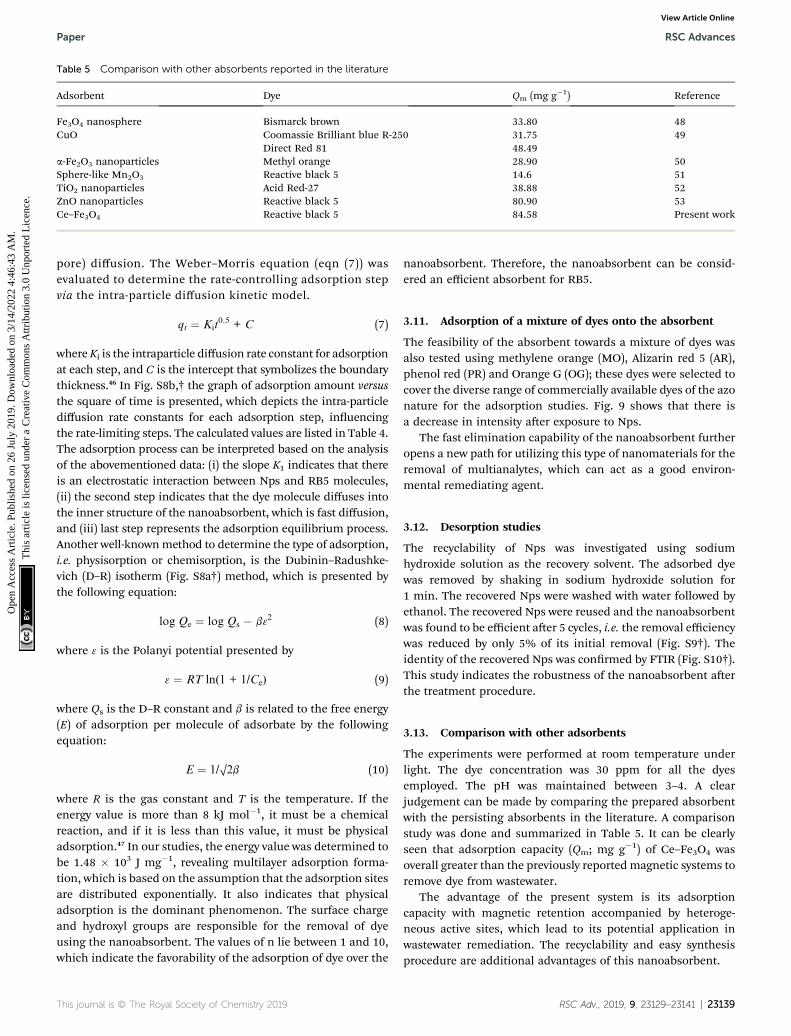
Table 5 Comparison with other absorbents reported in the literature
Adsorbent Dye Qm (mg g�1) Reference
Fe3O4 nanosphere Bismarck brown 33.80 48CuO Coomassie Brilliant blue R-250 31.75 49
Direct Red 81 48.49a-Fe2O3 nanoparticles Methyl orange 28.90 50Sphere-like Mn2O3 Reactive black 5 14.6 51TiO2 nanoparticles Acid Red-27 38.88 52ZnO nanoparticles Reactive black 5 80.90 53Ce–Fe3O4 Reactive black 5 84.58 Present work
Paper RSC Advances
Ope
n A
cces
s A
rtic
le. P
ublis
hed
on 2
6 Ju
ly 2
019.
Dow
nloa
ded
on 3
/14/
2022
4:4
6:43
AM
. T
his
artic
le is
lice
nsed
und
er a
Cre
ativ
e C
omm
ons
Attr
ibut
ion
3.0
Unp
orte
d L
icen
ce.
View Article Online
pore) diffusion. The Weber–Morris equation (eqn (7)) wasevaluated to determine the rate-controlling adsorption stepvia the intra-particle diffusion kinetic model.
qt ¼ Kit0.5 + C (7)
where Ki is the intraparticle diffusion rate constant for adsorptionat each step, and C is the intercept that symbolizes the boundarythickness.46 In Fig. S8b,† the graph of adsorption amount versusthe square of time is presented, which depicts the intra-particlediffusion rate constants for each adsorption step, inuencingthe rate-limiting steps. The calculated values are listed in Table 4.The adsorption process can be interpreted based on the analysisof the abovementioned data: (i) the slope K1 indicates that thereis an electrostatic interaction between Nps and RB5 molecules,(ii) the second step indicates that the dye molecule diffuses intothe inner structure of the nanoabsorbent, which is fast diffusion,and (iii) last step represents the adsorption equilibrium process.Another well-knownmethod to determine the type of adsorption,i.e. physisorption or chemisorption, is the Dubinin–Radushke-vich (D–R) isotherm (Fig. S8a†) method, which is presented bythe following equation:
log Qe ¼ log Qs � b32 (8)
where 3 is the Polanyi potential presented by
3 ¼ RT ln(1 + 1/Ce) (9)
where Qs is the D–R constant and b is related to the free energy(E) of adsorption per molecule of adsorbate by the followingequation:
E ¼ 1/O2b (10)
where R is the gas constant and T is the temperature. If theenergy value is more than 8 kJ mol�1, it must be a chemicalreaction, and if it is less than this value, it must be physicaladsorption.47 In our studies, the energy value was determined tobe 1.48 � 103 J mg�1, revealing multilayer adsorption forma-tion, which is based on the assumption that the adsorption sitesare distributed exponentially. It also indicates that physicaladsorption is the dominant phenomenon. The surface chargeand hydroxyl groups are responsible for the removal of dyeusing the nanoabsorbent. The values of n lie between 1 and 10,which indicate the favorability of the adsorption of dye over the
This journal is © The Royal Society of Chemistry 2019
nanoabsorbent. Therefore, the nanoabsorbent can be consid-ered an efficient absorbent for RB5.
3.11. Adsorption of a mixture of dyes onto the absorbent
The feasibility of the absorbent towards a mixture of dyes wasalso tested using methylene orange (MO), Alizarin red 5 (AR),phenol red (PR) and Orange G (OG); these dyes were selected tocover the diverse range of commercially available dyes of the azonature for the adsorption studies. Fig. 9 shows that there isa decrease in intensity aer exposure to Nps.
The fast elimination capability of the nanoabsorbent furtheropens a new path for utilizing this type of nanomaterials for theremoval of multianalytes, which can act as a good environ-mental remediating agent.
3.12. Desorption studies
The recyclability of Nps was investigated using sodiumhydroxide solution as the recovery solvent. The adsorbed dyewas removed by shaking in sodium hydroxide solution for1 min. The recovered Nps were washed with water followed byethanol. The recovered Nps were reused and the nanoabsorbentwas found to be efficient aer 5 cycles, i.e. the removal efficiencywas reduced by only 5% of its initial removal (Fig. S9†). Theidentity of the recovered Nps was conrmed by FTIR (Fig. S10†).This study indicates the robustness of the nanoabsorbent aerthe treatment procedure.
3.13. Comparison with other adsorbents
The experiments were performed at room temperature underlight. The dye concentration was 30 ppm for all the dyesemployed. The pH was maintained between 3–4. A clearjudgement can be made by comparing the prepared absorbentwith the persisting absorbents in the literature. A comparisonstudy was done and summarized in Table 5. It can be clearlyseen that adsorption capacity (Qm; mg g�1) of Ce–Fe3O4 wasoverall greater than the previously reported magnetic systems toremove dye from wastewater.
The advantage of the present system is its adsorptioncapacity with magnetic retention accompanied by heteroge-neous active sites, which lead to its potential application inwastewater remediation. The recyclability and easy synthesisprocedure are additional advantages of this nanoabsorbent.
RSC Adv., 2019, 9, 23129–23141 | 23139
RSC Advances Paper
Ope
n A
cces
s A
rtic
le. P
ublis
hed
on 2
6 Ju
ly 2
019.
Dow
nloa
ded
on 3
/14/
2022
4:4
6:43
AM
. T
his
artic
le is
lice
nsed
und
er a
Cre
ativ
e C
omm
ons
Attr
ibut
ion
3.0
Unp
orte
d L
icen
ce.
View Article Online
4. Conclusions
In summary, magnetite (Fe3O4) Nps with different ceriumconcentrations as dopants were synthesized using the hydro-thermal method. The XRD analysis conrmed the presence ofa single phase with an inverse nal structure at all doping levels.The crystallite size was found to increase with an increase indoping concentration. The XRD results revealed the doping ofCe ions into the crystal lattice of magnetite. The saturationmagnetization decreased with an increase in Ce content. Thestructural modication depends on the cation occupancyamong the octahedral and tetrahedral sites, which inuencesdifferent properties of the prepared nanoparticles. BET analysiswas performed to determine the surface area of the nano-particles, and the system with highest surface area wasconsidered for wastewater treatment. The adsorption behaviorof the 3.5% Ce–Fe3O4 was examined in detail by varying theoperational parameters including pH, concentration of Nps, dyeconcentration and contact time. The kinetic studies andadsorption isotherms were employed to determine the mecha-nism of docking of the dye over the Nps surface. The removalefficiency was found to be 87%, and the efficiency was main-tained even aer 5 cycles. Thus, the results conrm the validityof the synthesized Nps in environmental applications i.e. effi-cacy in the removal of toxic pollutants from the environment.
Conflicts of interest
There are no conicts of interest to declare.
Acknowledgements
The authors gratefully acknowledge the DST-PURSE-II and SAIF/CIL, Panjab University, Chandigarh, for providing character-ization facility.
References
1 M. T. Yagub, T. K. Sen, S. Afroze and H. M. Ang, Adv. ColloidInterface Sci., 2014, 209, 172–184.
2 N. N. Nassar, N. N. Marei, G. Vitale and L. A. Arar, Can. J.Chem. Eng., 2015, 93, 1965–1974.
3 Y. Lau, Y. Wong, T. Teng and N. Morad, RSC Adv., 2015, 5,34206–34215.
4 N. Azbar, T. Yonar and K. Kestioglu, Chemosphere, 2004, 55,35–43.
5 T. Kim, C. Park and S. Kim, J. Cleaner Prod., 2005, 13, 776–786.
6 K. Narcisse, Y. Augustin, K. Benjamin, D. Gone andA. Trokourey, J. Environ. Manage., 2015, 156, 10–14.
7 C. Araujo, G. R. Oliveira, N. S. Fernandes and C. A. Martınez-huitle, Environ. Sci. Pollut. Res., 2014, 21, 9777–9784.
8 M. Blanco, A. Martinez, A. Marcaide, E. Aranzabe andA. Aranzabe, Am. J. Anal. Chem., 2014, 5, 490–499.
9 D. Pathania, S. Sharma and P. Singh, Arabian J. Chem., 2017,10, S1445–S1451.
23140 | RSC Adv., 2019, 9, 23129–23141
10 T. G. Chuah, A. Jumasiah, I. Azni, S. Katayon and T. Choong,Desalination, 2005, 175, 305–316.
11 S. Netpradit, P. Thiravetyan and S. Towprayoon, Water Res.,2004, 38, 71–78.
12 C. Li, H. Zhong, S. Wang, J. Xue, Z. Zhang, J. Xue andZ. Zhang, J. Ind. Eng. Chem., 2015, 23, 344–352.
13 M. Cai, M. Jin and L. K. Weavers, Ultrason. Sonochem., 2011,18, 1068–1076.
14 J. Gong, B. Wang, G. Zeng, C. Yang, C. Niu and Q. Niu, J.Hazard. Mater., 2009, 164, 1517–1522.
15 F. Ferrarini, L. R. Bonetto, J. S. Crespo and M. Giovanela,Water Sci. Technol., 2016, 73(9), 2132–2141.
16 Z. Qi, H. Lan, T. P. Joshi, R. Liu, H. Liu and J. Qua, RSC Adv.,2016, 6, 66990–67001.
17 M. Y. Nassar, I. S. Ahmed and H. S. Hendy, J. Mol. Liq., 2018,271, 844–856.
18 C. Jiang, X. Wang, D. Qin, W. Da, B. Hou, C. Hao and J. Wu, J.Hazard. Mater., 2019, 369, 50–61.
19 K. Z. Elwakeel, J. Hazard. Mater., 2009, 167, 383–392.20 S. Chatterjee, S. Lim and S. H. Woo, Chem. Eng. J., 2010, 160,
27–32.21 X. L. Peng, F. Xu, W. Z. Zhang, J. Y. Wang, C. Zeng, M. J. Niu
and E. Chmielewska, Colloids Surf., A, 2014, 443, 27–36.22 S. Sun, H. Zeng, D. B. Robinson, S. Raoux, P. M. Rice,
S. X. Wang and G. Li, J. Am. Chem. Soc., 2004, 126, 273–279.23 M. Y. Nassar, I. S. Ahmed and M. A. Raya, J. Mol. Liq., 2019,
282, 251–263.24 H. Su, X. Wang, Y. Sun, D. Xu, L. Li, C. Liu, S. Zeng and
D. Sun, Bull. Korean Chem. Soc., 2017, 38, 1155–1162.25 X. Liang, S. Zhu, Y. Zhong, J. Zhu, P. Yuan, H. He and
J. Zhang, Appl. Catal., B, 2010, 19, 151–159.26 W. Wolski, E. Wolska and J. Kaczmarek, Phys. Status Solidi A,
1993, 51, 51–54.27 B. P. Ladgaonkar and A. S. Vaingankar, Mater. Chem. Phys.,
1998, 56, 280–283.28 A. Q. Wang, D. Souza and T. Diane, J. Mater. Chem., 2006, 16,
481–488.29 W. B. White and B. A. D. Anoelis, Spectrochim. Acta, Part A,
1967, 23, 985–995.30 M. Y. Nassar andM. Khatab, RSC Adv., 2016, 6, 79688–79705.31 M. Y. Nassar, T. Y. Mohamed, I. S. Ahmed and I. Samir, J.
Mol. Liq., 2017, 225, 730–740.32 M. Abboud, S. Youssef, J. Podlecki, R. Habchi, G. Germanos
and A. Foucaran, Mater. Sci. Semicond. Process., 2015, 39,641–648.
33 J. Tang, M. Myers, K. A. Bosnick and L. E. Brus, J. Phys. Chem.B, 2003, 107, 7501–7506.
34 S. O. P. W. S. Phanichphant, J. Electroceram., 2006, 16, 363–368.
35 D. Padalia, U. C. Johri andM. G. H. Zaidi,Mater. Chem. Phys.,2016, 169, 89–95.
36 B. Bhushan, Z. Wang, J. Tol, N. S. Dalal, A. Basumallick,N. Y. Vasanthacharya, S. Kumar and D. Das, J. Am. Ceram.Soc., 2012, 6, 1985–1992.
37 L. Zhao, H. Yang, X. Zhao, L. Yu, Y. Cui and S. Feng, Mater.Lett., 2006, 60, 1–6.
This journal is © The Royal Society of Chemistry 2019

Paper RSC Advances
Ope
n A
cces
s A
rtic
le. P
ublis
hed
on 2
6 Ju
ly 2
019.
Dow
nloa
ded
on 3
/14/
2022
4:4
6:43
AM
. T
his
artic
le is
lice
nsed
und
er a
Cre
ativ
e C
omm
ons
Attr
ibut
ion
3.0
Unp
orte
d L
icen
ce.
View Article Online
38 M. Thommes and K. A. Cychosz, Adsorption, 2014, 20, 233–250.
39 M. Thommes, K. Kaneko, A. V. Neimark, J. P. Olivier,F. Rodriguez-Reinoso, J. Rouquerol and K. S. W. Sing, PureAppl. Chem., 2015, 87, 1051–1069.
40 M. W. Ruckman, J. Chen, S. L. Qiu, P. Kuiper andM. Strongin, Phys. Rev. Lett., 1991, 67, 2533–2566.
41 D. Channei, B. Inceesungvorn, N. Wetchakun andS. Phanichphant, Int. J. Photoenergy, 2013, 2013, 1–9.
42 T. L. Barr, C. G. Fries, F. Cariati, J. C. J. Bart and N. Giordano,J. Chem. Soc., Dalton Trans., 1983, 1825–1829.
43 T. Varnashita and P. Hayes, Appl. Surf. Sci., 2008, 254, 2441–2449.
44 M. Muhler, R. Schlogl and G. Ertl, J. Catal., 1992, 138, 413–444.
45 T. M. Petrova, L. Fachikov and J. Hristov, Int. J. Chem. Biol.Eng., 2011, 3, 134–152.
This journal is © The Royal Society of Chemistry 2019
46 S. Han, K. Liu, L. Hu, F. Teng, P. Yu and Y. Zhu, Sci. Rep.,2017, 7, 1–11.
47 F. Helfferich, Ion Exchange, McGraw-Hill Book, 1962, vol.138, p. 133.
48 M. Khosravi, B. Yahyaei and S. Azizian, J. Dispersion Sci.Technol., 2014, 35, 1135–1142.
49 M. Chauhan, B. Sharma, R. Kumar, G. R. Chaudhary,A. A. Hassan and S. Kumar, Environ. Res., 2019, 168, 85–95.
50 A. Debnath, K. Deb, K. K. Chattopadhyay and B. Saha,Desalin. Water Treat., 2016, 57, 13549–13560.
51 M. Y. Nassar, A. S. Amin, I. S. Ahmed and S. Abdallah, J.Taiwan Inst. Chem. Eng., 2016, 64, 79–88.
52 M. A. Behnajady, S. Yavari and N. Modirshahla, Chem. Ind.Chem. Eng. Q., 2014, 20, 97–107.
53 M. Y. Nassar, M. M. Moustafa and M. M. Taha, RSC Adv.,2016, 6, 42180–42195.
RSC Adv., 2019, 9, 23129–23141 | 23141