supervised by dr. rana ejaz ali khan associate professor
TRANSCRIPT

1
DETERMINANTS AND IMPACT OF URBAN
INFORMAL SECTOR’S GROWTH ON DEVELOPMENT
OF SOUTHERN PUNJAB, (PAKISTAN)
By
Durdana Qaiser Gillani
Roll No. 01
Supervised by
Dr. Rana Ejaz Ali Khan
Associate Professor &
Chairman Department of Economics
A thesis
Submitted to
Department of Economics
The Islamia University of Bahawalpur for the partial Fulfillment of
the Degree of Doctorate of Philosophy in Economics
Session: 2008-11
Department of Economics
The Islamia University of Bahawalpur
Pakistan

2
3
CERTIFICATE
It is hereby certified that wok presented by Durdana Qaiser Gillani D/O Syed Qaiser
Abbas Gillani in the thesis entitled “Determinants and Impact of Urban Informal
Sector‟s Growth on Development of Southern Punjab (Pakistan)” has been
successfully defended and is accepted in its present form as satisfying the requirement
for the degree of Doctor of Philosophy in the Economics in the Department and
Faculty the Islamia University of Bahawalpur.
Dr. RANA EJAZ ALI
Associate Professor of Economics
Supervisor
Department of Economics
The Islamia University of Bahawalpur

4
Dedication
To the humanity of this universe without any discrimination of
gender, cast, creed and religion. To all those who have chastity of
heart and mind, potential to confront the challenges with
transparency, courage to eradicate hypocrisy, urge to survive
through thick and thin and dignified attitude of paying back, bad
with good.
5
Acknowledgement
I have pearls in my eyes to admire the blessings of compassionate and
omnipotent ALLAH because the words are bound, knowledge is limited and time is
short to express His dignity. It is one of the infinite blessings of ALLAH that He
bestowed me with the potential and ability to complete my research work and explore
a tiny part of ocean of knowledge of world.
I would like to thanks to my supervisor Dr. Rana Ejaz Ali Khan (Associate
Professor and Chairman Department of Economic), The Islamic University,
Bahawalpur (IUB) for his kind guidance during my research work.
I would like to thanks Dr. Karamat Ali (Professor of Economic), Ex
Chairman, Department of Economics in The Islamia University of Bahawalpur for his
valuable guidance. I would like to thanks to Dr. Abid Aman Burki (Professor of
Economics), Lahore University of management Sciences for his kind and humble
cooperation.
I am indebted to Dr. Touseef Azid (Professor of Economics), Bahauddin
Zakariya University Multan for his nice cooperation. I would like to thanks Dr.
Shahnawaz Malik (Professor of Economics), Bahauddin Zakariya University Multan
for his nice encouragement.
I offer my humble thanks from the core of my heart to family members
especially my parents and few friends (my valuable assets) who supported me through
out, motivated and kept involved with their active assistance.
Durdana Qaiser Gillani

6
TABLE OF CONTENTS
Contents Page#
Chapter 1: Introduction
1.1 Statement of the Problem 01
1.2 Objectives of the Study 07
1.3 Material and Methods 08
1.4 Organization of the Study 09
Chapter 2: Urban Informal Sector Growth and Development
2.1 Introduction 11
2.2 Urban Informal Sector: An Overview 12
2.3 An Overview of Pakistan‟s Growth and Development 24
2.4 Population, Labour Force and Employment Pattern in Pakistan 30
Economy
2.4.1 Labour Force Participation Rates in Pakistan 32
2.4.2 The Formal Sector, Informal Sector and 33
Employment Trends or Patterns
2.4.3 Pattern of Employment and Hours of Work 38
2.5 Unemployment Situation 39
2.6 Urbanization, Migration and Pakistan Economy 40
2.7 Poverty and Measures 41
2.8 Women and Urban Informal Sector 42
2.9 Concept of Development 43
2.9.1 Three Core Values of Development 44
2.9.2 The Objectives of Development 45
2.10 Basic Indicators of Development 46
2.10.1 Human Indicators and Development 46
2.10.2 Education Training and Employment Situation 49
2.10.3 Literacy Rates 50
2.11 Socio-Indicators and Development 50

7
2.12 Concluding Remarks 51
Chapter 3: Theoretical Framework
3.1 Introduction 53
3.2 Conceptual Framework 53
3.2.1 Labour Supply and Employment 54
3.3 Neo-Classical theory of Labour Supply Decision 55
3.3.1 Neo-Classical Individual Labour Supply 55
3.3.2 Household Labour Supply 63
3.4 The Basic Theory of Human Capital 65
3.5 Theoretical Approaches Towards Urban Informal Sector 68
3.5.1 Dualistic Labour Market Approach 68
3.5.2 Neo-Liberal Approach 69
3.5.3 Structural Articulation Approach 70
3.6 Conclusion 71
Chapter 4: Literature Review
4.1 Introduction 72
4.2 Informal Employment and Classic Theories of Growth and 72
Development
4.3 Review of Empirical Evidence and Urban Informal Sector 77
4.4 Literature Review of Urban Informal Sector in Pakistan 96
4.5 Concluding Remarks 103
Chapter 5: Measuring Urban Informal Sector: Some Basic Issues
5.1 Introduction 105
5.2 Profile of the Study Areas 105
5.2.1 Bahawalpur Division 106
5.2.2 Multan Division 109
5.2.3 Dera Ghazi Khan Division 112
5.3 Sources of Data and Sampling Design 115
5.4 Survey Limitations 118
8
5.5 Determinants of Informal and Formal Sector Employment in 119
Urban Areas
5.5.1 Age of the Participants 119
5.5.2 Education 120
5.5.3 Gender 122
5.5.4 Marital Status 123
5.5.5 Formal Training 124
5.5.6 Parents‟ Educational Status 125
5.5.7 Household Size 126
5.5.8 Family Setup 127
5.5.9 Dependency Ratio 127
5.5.10 Number of Children 128
5.5.11 Number of Male Adolescents 128
5.5.12 Number of Female Adolescents 129
5.5.13 Spouse Participation in Economic Activities 130
5.5.14 Household Value of Assets 130
5.5.15 Rural-Urban Migration 131
5.5.16 Working Hours 132
5.6 Model and Methodological Issues 132
5.6.1 A Descriptive Data Analysis 132
5.6.2 A Multivariate Analysis of Urban Informal Sector Employment 132
5.6.2.1 A Binary Logit Model 134
5.6.2.2 Earnings Functions 136
5.6.3 Specification of Employment Model 137
5.6.3.1 General Model 137
5.6.3.2 Employment Model with Complete Years 138
of Education
5.6.3.3 Employment Model with Different Levels of 138
Education
5.6.3.4 Earnings Functions 139
5.6.3.5 Earnings Function with Different Levels of
Education 139
5.7 Concluding Remarks 142
Chapter 6: Descriptive Analysis of the Urban Informal and Formal

9
Sector in Southern Punjab, Pakistan
6.1 Introduction 143
6.2 Pair wise Correlations Matrix 144
6.3 Urban Informal and Formal Sector Employment: An Elementary 146
Analysis
6.3.1 Age Group and Urban Informal and Formal Sector Employment 146
6.3.2 Education and Urban Informal and Formal Sector Employment 147
6.3.3 Marital Status and Urban Informal and Formal Sector 148
Employment
6.3.4 Sex and Urban Informal and Formal Sector Employment 149
6.3.5 Formal Training and Urban Informal and Formal Sector 150
Employment
6.3.6 Father‟s Educational Status and Urban Informal and Formal 150
Sector Employment
6.3.7 Mother‟s Education and Urban Informal and Formal Sector 151
Employment
6.3.8 Size of Household and Urban Informal and Formal Sector 152
Employment
6.3.9 Number of Dependents and Urban Informal and Formal Sector 154
Employment
6.3.10 Family Setup and Urban Informal and Formal Sector 154
Employment
6.3.11 Number of Children and Urban Informal and Formal Sector 155
Employment
6.3.12 Male Adolescents and Urban Informal and Formal Sector 156
Employment
6.3.13 Female Adolescents and Urban Informal and Formal 157
Sector Employment
6.3.14 Spouse Working and Urban Informal and Formal Sector 158
Employment
6.3.15 Rural-Urban Migration and Urban Informal and Formal Sector 159
Employment
6.3.16 Employment Status and Urban Informal and Formal Sector 160
10
Employment
6.3.17 Sector of Employment and Urban Informal Sector Employment 161
6.3.18 Working Hours and Urban Informal Sector Employment 162
6.4 Descriptive Analysis of Urban Male Informal and Formal Sector 163
In Southern Punjab, Pakistan
6.4.1 Age Group and Urban Male Informal and Formal Sector 163
Employment
6.4.2 Education and Urban Male Informal and Formal Sector 165
Employment
6.4.3 Marital Status and Urban Male Informal and Formal Sector 166
Employment
6.4.4 Formal Training and Urban Male Informal and Formal Sector 166
Employment
6.4.5 Father‟s Educational Status and Urban Male Informal and Formal 167
Sector Employment
6.4.6 Mother‟s Education and Urban Male Informal and Formal Sector 168
Employment
6.4.7 Size of Household and Urban Male Informal and Formal Sector 169
Employment
6.4.8 Number of Dependents and Urban Male Informal and Formal 169
Sector Employment
6.4.9 Family Setup and Urban Male Informal and Formal Sector 171
Employment
6.4.10 Number of Children and Urban Male Informal and Formal Sector 171
Employment
6.4.11 Male Adolescents and Urban Male Informal and Formal 172
Sector Employment
6.4.12 Female Adolescents and Urban Male Informal and Formal 173
Sector Employment
6.4.13 Working Spouse and Urban Male Informal and Formal Sector 174
Employment

11
6.4.14 Rural-Urban Migration and Urban Male Informal & Formal 175
Sector Employment
6.4.15 Employment Status and Urban Male Informal Sector 176
Employment
6.4.16 Sector of Employment and Urban Male Informal and Formal 177
Sector Employment
6.4.17 Working Hours and Urban Male Informal Sector Employment 178
6.5 Descriptive Analysis of Urban Female Informal and Formal Sector 179
6.5.1 Age Group and Urban Female Informal and Formal Sector 179
Employment
6.5.2 Education and Urban Female Informal and Formal Sector 180
Employment
6.5.3 Marital Status and Urban Female Informal and Formal Sector 181
Employment
6.5.4 Formal Training and Urban Female Informal and Formal Sector 183
Employment
6.5.5 Father‟s Education Status and Urban Female Informal and 184
Formal Sector Employment
6.5.6 Mother‟s Education and Urban Female Informal and Formal 185
Sector Employment
6.5.7 Size of Household and Urban Female Informal and Formal 186
Sector Employment
6.5.8 Number of Dependents and Urban Female Informal and Formal 187
Sector Employment
6.5.9 Family Setup and Urban Female Informal and Formal Sector 188
Employment
6.5.10 Number of Children and Urban Female Informal and Formal 189
Sector Employment
6.5.11 Male Adolescents and Urban Female Informal and Formal
190
Sector Employment
6.5.12 Female Adolescents and Urban Female Informal and Formal
191
12
Sector Employment
6.5.13 Working Spouse and Urban Female Informal and Formal Sector 192
Employment
6.5.14 Rural-Urban Migration and Urban Female Informal and Formal 193
Sector Employment
6.5.15 Employment Status and Urban Female Informal and Formal 194
Sector Employment
6.5.16 Sector of Employment and Urban Female Informal Sector 195
Employment
6.5.17 Working Hours and Urban Female Informal Sector Employment 195
6.6 Concluding Remarks 196
Chapter 7: Determinants of Urban Informal Sector Employment: An Analysis
7.1 Introduction 197
7.2 Estimates of Binary Logit Model in Southern Punjab 198
7.3 Estimates of Binary Logit Model in District Bahawalpur 208
7.4 Estimates of Binary Logit Model in District Multan 216
7.5 Estimates of Binary Logit Model in District Dera Ghazi Khan 224
7.6 Concluding Remarks 232
Chapter 8: Earnings Determinants, Development and Urban Informal Sector:
An Analysis
8.1 Introduction 234
8.2 Estimates of Earning Functions of the Participants in Urban Informal 235
Sector in Southern Punjab
8.2.1 Estimates of Earnings Functions of the Participants in Urban 239
Informal Sector in District Bahawalpur
8.2.2 Estimates of Earnings Functions of the Participants in Urban 244
Informal Sector in District Multan
8.2.3 Estimates of Earnings Functions of the Participants in Urban 249
Informal Sector in District Dera Ghazi Khan
13
8.3 Human Development and Urban Informal Sector 253
8.3.1 Development and Urban Informal Sector in Southern Punjab 254
8.3.2 Development and Urban Informal Sector in District Bahawalpur 260
8.3.3 Development and Urban Informal Sector in District Multan 264
8.3.4 Development and Urban Informal Sector 268
in District Dera Ghazi Khan
8.4 Concluding Remarks 272
Chapter 9: Gender Employment in Urban Informal Sector: A Comparison
9.1 Introduction 275
9.2 Binary Logit Estimates of Determinants of Gender Employment 276
and Comparison in Urban Informal Sector in Southern Punjab
9.3 Binary Logit Estimates of Determinants of Gender Employment 288
and Comparison in Urban Informal Sector in District Bahawalpur
9.4 Binary Logit Estimates of Determinants of Gender Employment 299
and Comparison in Urban Informal Sector in District Multan
9.5 Binary Logit Estimates of Determinants of Gender Employment 310
and Comparison in Urban Informal Sector in District Dera Ghazi Khan
9.6 Concluding Remarks 320
Chapter 10: Conclusions & Policy Recommendations 324
REFERENCES 339
APPENDIX A 364

14
LIST OF TABLE
Description Page #
2.1 Growth Performance of Key Components of GDP (% Growth at Constant
Factor Cost)
25
2.2 Sectoral Share of the GDP Growth (Percentage Points) 26
2.3 Structure of Savings and Investment (As Percentage of GDP) 27
2.4 Civilian Labour Force, Employed and Unemployed for Pakistan (Million) 31
2.5 Population, Labour Force and Labour Force Participation (LFP) Rates 32
2.6 Employment Percentage in Informal Sector by Regional Gender 35
2.7 Employment Percentages by Major Industry and Gender in Informal Sector 36
2.8 Informal Sector by Major Occupation and Gender in Percentages 37
2.9 Informal Sector by Employment Status and Gender (%) 38
2.10 Hours of Work by Region and Gender (%) 39
2.11 Unemployment in Million by Gender and Region
2.12 Education and Literacy by Gender of Working Age Population (%)
2.13 Literacy Rates in Pakistan and Provinces
39
49
50
5.1 List of Variables Used in the Informal Sector Employment Equations 141
6.1 Pair Wise Correlation Matrix 145
6.2 Distribution of Respondents by Age Groups 146
6.3 Distribution of Respondents by Education 148
6.4 Distribution of Respondents by Marital Status 148
6.5 Distribution of Respondents by Sex 149
6.6 Distribution of Respondents by Formal Training 150
6.7 Distribution of Respondents by Father‟s Educational Status 151
6.8 Distribution of Respondents by Mother‟s Educational Status 151
6.9 Distribution of Respondents by the Size of Household 153
6.10 Distribution of Respondents by Number of Dependents 154
6.11 Distribution of Respondents by Type of Family System 155
6.12 Distribution of Respondents by Number of Children 156
6.13 Distribution of Respondents by Male Adolescents 158
6.14 Distribution of respondents by Female Adolescents 159
15
6.15 Distribution of Respondents by Spouse Participation in Economic Activities. 159 159
6.16 Distribution of Respondents by Rural-urban Migration 159
6.17 Distribution of Respondents by Employment Status 161
6.18 Distribution of Respondents by Sector of Employment 162
6.19 Distribution of Respondents by Working Hours 162
6.20 Distribution of Male Respondents by Age Groups 164
6.21 Distribution of Male Respondents by Levels of Education 165
6.22 Distribution of Male Respondents by Marital Status 166
6.23 Distribution of Male Respondents by Formal Training 167
6.24 Distribution of Male Respondents by Father‟s Educational Status 167
6.25 Distribution of Male Respondents by Mother‟s Educational Status 168
6.26 Distribution of Male Respondents by the Size of Household 169
6.27 Distribution of Male Respondents by Number of Dependents 170
6.28 Distribution of Male Respondents by Type of Family System 171
6.29 Distribution of Male Respondents by Number of Children 172
6.30 Distribution of Male Respondents by Male Adolescents 173
6.31 Distribution of Male Respondents by Female Adolescents 174
6.32 Distribution of Male Respondents by Spouse Participation 175
6.33 Distribution of Male Respondents by Rural-Urban Migration 176
6.34 Distribution of Male Respondents by Employment Status 177
6.35 Distribution of Male Respondents by Sector of Employment 178
6.36 Distribution of Male Respondents by Working Hours 178
6.37 Distribution of Female Respondents by Age Groups 180
6.38 Distribution of Female Respondents by Education 181
6.39 Distribution of Female Respondents by Marital Status 182
6.40 Distribution of Female Respondents by Formal Training 183
6.41 Distribution of Female Respondents by Father‟s Educational Status 184
6.42 Distribution of Female Respondents by Mother‟s Educational Status 185
6.43 Distribution of Female Respondents by the Size of Household 186
6.44 Distribution of Female Respondents by Number of Dependents 187
6.45 Distribution of Female Respondents by Type of Family System 188
6.46 Distribution of Female Respondents by Number of Children 189
6.47 Distribution of Female Respondents by Male Adolescents 190

16
6.48 Distribution of Female Respondents by Female Adolescents 191
6.49 Distribution of Female Respondents by Working Spouse 192
6.50 Distribution of Female Respondents by Rural-Urban Migration 193
6.51 Distribution of Female Respondents by Employment Status 194
6.52 Distribution of Female Respondents by Sector of Employment 195
6.53 Distribution of Female Respondents by Working Hours 195
7.1 Logit Estimates of Determinants of Urban Informal Sector Employment in
Southern Punjab-Probability of Informal Sector Employed (18-64)
206
7.2 Logit Estimates of Determinants of Urban Informal Sector Employment in
Southern Punjab with Different Levels of Education -Probability of Informal
Sector Employed(18-64)
207
7.3 Logit Estimates of Determinants of Urban Informal Sector Employment in
District Bahawalpur-Probability of Informal Sector Employed(18-64)
214
7.4 Logit Estimates of Determinants of Urban Informal Sector Employment in
District Bahawalpur with Different Levels of Education -Probability of Informal
Sector Employed (18-64)
215
7.5 Logit Estimates of determinants of Urban Informal sector employment in
District Multan-Probability of Informal Sector Employed (18-64)
222
7.6 Logit Estimates of Determinants of Urban Informal Sector Employment in
District Multan with Different Levels of Education -Probability of Informal
Sector Employed (18-64)
223
7.7 Logit Estimates of Determinants of Urban Informal Sector Employment in
District Dera Ghazi Khan-Probability of Informal Sector Employed (18-64)
230
7.8 Logit Estimates of Determinants of Urban Informal Sector Employment in
District Multan with Different Levels of Education -Probability of Informal
Sector Employed (18-64)
231
8.1 Earnings Functions of the Participants in Urban Informal Sector in Southern
Punjab
237
8.2 Earnings Functions of the Participants in Urban Informal Sector in Southern
Punjab with Different Levels of Education
238
8.3 Earnings Functions of the Participants in Urban Informal Sector in District
Bahawalpur
242
8.4 Earnings Functions of the Participants in Urban Informal Sector in District 243

17
Bahawalpur with Different Levels of Education
8.5 Earnings Functions of the Participants in Urban Informal Sector in District
Multan
247
8.6 Earnings Functions of the Participants in Urban Informal Sector in District
Multan with Different Levels of Education
248
8.7 Earnings Functions of the Participants in Urban Informal Sector in District
Dera Ghazi Khan
251
8.8 Earnings Functions of the Participants in Urban Informal Sector in District
Dera Ghazi Khan with Different Levels of Education
252
8.9 Economic Capital and Urban Informal Sector in Southern Punjab 255
8.10 Human Capital and Urban Informal Sector in Southern Punjab 257
8.11 Socio-cultural Activities and Urban Informal Sector in Southern Punjab 259
8.12 Economic Capital and the Urban Informal Sector in District Bahawalpur 261
8.13 Human Capital and the Urban Informal Sector in District Bahawalpur 262
8.14 Socio-Cultural Activities and the Urban Informal Sector in District
Bahawalpur
264
8.15 Economic Capital and the Urban Informal Sector in District Multan 265
8.16 Human Capital and Urban Informal Sector in District Multan 266
8.17 Socio- Cultural Activities and Urban Informal Sector in District Multan 267
8.18 Economic Capital and Urban Informal Sector in District Dera Ghazi Khan 269
8.19 Human Capital and Urban Informal Sector in District Dera Ghazi Khan 270
8.20 Socio-Cultural Activities and Urban Informal Sector in District Dera Ghazi Khan 271
9.1 Logit Estimates of Determinants of Gender Employment in Urban Informal
Sector in Southern Punjab -Probability of Informal Sector Employed (18-64)
286
18
9.2 Logit Estimates of Determinants of Gender Employment in Urban Informal
Sector in Southern Punjab with Different Levels of Education -Probability of
Informal Sector Employed (18-64)
287
9.3 Logit Estimates of Determinants of Gender Employment in Urban Informal
Sector in District Bahawalpur-Probability of Informal Sector Employed (18-64)
297
9.4 Logit Estimates of Determinants of Gender Employment in Urban Informal
Sector in District Bahawalpur -Probability of Informal Sector Employed (18-64)
298
9.5 Logit Estimates of Determinants of Gender Employment in Urban Informal
Sector in District Multan-Probability of Informal Sector Employed(18-64)
308
9.6 Logit Estimates of Determinants of Gender Employment in Urban Informal
Sector in District Multan with Different Levels of Education -Probability of
Informal Sector Employed (18-64)
309
9.7 Logit Estimates of Determinants of Gender Employment in Urban Informal
Sector in District Dera Ghazi Khan- Probability of Informal Sector Employed
(18-64)
318
9.8 Logit Estimates of Determinants of Gender Employment in Urban Informal
Sector in District Dera Ghazi Khan with different Levels of Education -
Probability of Informal Sector Employed(18-64)
319
19
LIST OF FIGURES
Fig # Page #
Indifference Curve and Budget Constraints 56
Income and Substitution Effects in Response to Change in Wage Rate 61
ABSTRACT

20
The present study looks at different aspects of the urban informal sector in three
divisions of Southern Punjab, Pakistan. The current study utilizes primary data from
three divisions of Southern Punjab by conducting household survey during 2012.
Theoretically, this research discusses neo-classical theory of labor supply, human
capital theory and approaches towards the urban informal sector. The sample consists
of 1506 participants of the informal and formal sector in the urban areas of three
districts such as Bahawalpur, Multan and Dera Ghazi Khan. The main focus is the
complete analysis of the socio-economic factors of the informal sector participants
who motivate or determine and enhance the growth potential of the urban informal
sector in Southern Punjab, Pakistan. The present study has analyzed the
characteristics of participants of the formal as well as informal sector employed. A
binary Logit model is used in order to estimate the probability of determinants of
urban informal sector employment of total sample along with the gender comparison
in three divisions. In addition, earning functions are estimated including human
capital variables to see the effect on participants‟ earnings. Moreover, the living
standard of the participants of the urban informal sector has been checked from a
Human Development perspective. Human development indicators (i.e. economic,
human and social capital) are used to gauge the relation between poverty and urban
informal sector employment. The study concludes a positive contribution of urban
informal sector in employment creation, income generation and the development of
the participants in Southern Punjab, Pakistan.
Chapter 1
INTRODUCTION
1.1 Statement of the Problem
21
The research conducted in the era of 1950 and 1960 states that the countries
across the world must pass through the process of development which is considered as
successive stages of economic growth. Primarily; it was a theory of economic
development in which the accurate quantity along with saving, investment, and
foreign aid were included. Moreover; these were necessary to make the developing
nations to proceed proactively with an economic growth path which had been
followed by most of the developed countries. Development has thus become
synonymous with rapid, aggregate economic growth.
The linear stages approach was to a great extent supplanted in the 1970s by
two contending schools of thought. The main idea which concentrated on hypotheses
and patterns of structural change used modern economic theory and statistical analysis
trying to depict the interior procedure of structural change that a typical developing
nation must experience in the event that it is to succeed in producing and maintaining
rapid economic growth. The second, the worldwide dependence revolution was more
radical and more political. It saw underdevelopment regarding universal and local
force connections, institutional and structural financial rigidities, and the subsequent
multiplication of dual economies and societies both inside and among the countries of
the world.
Dependence theories had a tendency to stress external and internal institutional
and political constraints on economic development. Accentuation was set on the
requirement for major new policies to eradicate destitution, to give more expanded
employment opportunities, and to reduce income inequalities. These and other
populist purposes were to be achieved inside the setting of developing economy, yet
the economic development essentially was not given grand status agreed to it by their
linear stages and structural change models (Todaro and Smith, 2012).
All through a great part of the 1980s and 1990s, a fourth approach held sway.
This neoclassical (in some cases called neoliberal) counterrevolution in financial
thought accentuated the valuable part of free markets, open economies, and the
privatization of inefficient public enterprises inability to create, as per this theory, is
not because of exploitive external and inward strengths as clarified by dependence
theorists. Maybe, it is essentially the consequence of a lot of government mediation

22
and regulation of the economy. Today's varied approach draws on these points of
view, and the qualities (Todaro and Smith, 2012).
The informal sector represents an imperative part of the economy and suerly
of the labour market in many countries, especially in developing countries. It plays a
pivotal role in creation of employment, production and income generation. The very
sector has the propensity to absorb bulk of the rapidly growing labour force in the
urban areas of countries with high rates of population growth or urbanization.
Informal sector employment provides an essential survival strategy to countries
lacking social safety nets in the form of unemployment insurance or where incomes,
particularly in the public sector, and pensions are low (Hussmanns and Mehran,
2001).
The conventional approach which defines informality rests on a dualistic
model of economy. The major hypothesis of the dualistic model is that surplus labour
can be tranfered from low productive traditional sector to high productive modern
sector to start the development process. Firstly, a theoretical model of development
was presented by Lewis (1954) in a dualistic economy. In this model, transformation
of surplus labour from the traditional sector and and its absorption in the modern
industrial sector indicate the informal sector as a temporary stage or transitory phase.
Be that as it may, the legalist way to deal with informality is based on the legal
instruments which influence informality.The enterpreneures participate in the
informal sector due to government institutions and regulations. Accordingly, informal
sector is referred as a store of financial dynamism refused to achieve its maximum
capacity because of regulations imposed by the government (De Soto 1989). Informal
sector is found as a voluntary phenomenon of firms to avail legal exemption benefits
from a mandated minimum wage policy (Rauch, 1991). The excessive taxes and
regulations by governments having inability to implement compliance increased the
informality (Loayza, 1996).
The trade reforms increase the infomalization. The sectors with the largest
reductions in tariffs experience sharpest increase in the share of skilled workers.
Regarding industry wage, premium diminished more in sectors which face large tariff
reductions and the diminishing premium increase inequality. The increasing size of
23
informal sector is related to the increased foreign competition i.e. sectors which
experienced large tariff reductions and trade exposure face enhanced informality in
prior to the labour market reform (Atanasio et al., 2004).
Contrarily, the growth of employment (formal) has no need to suggest a
compression of casual business if the two are supplements not substitutes. The level
of lower wage informal employment is decreased in spite of having been positively
associated with the business cycle. The informal opportunities are increased due to
home ownership. The majority of the workers are hired by firms in the personal
services sector (Mercilli, 2004). Workers due to economic instability forcefully
participate in the informal sector. Lack of stability and social protection in the formal
sector increses opportunities to work in the informal sector (with low productivity and
poor wages) are become a part of informal sector (Tokman, 2007).
The segmentation of labour market is investigated through a semi-parametric
approach in developing countries. On average, the wages in the formal sector are
higher than wages in informal sector (Paratap and Quintin, 2006). Moreover,
participants‟ earnings in the informal sector are not the lowest in the informal service
employment. In addition the workers earnings are not equal to the wages of unskilled
workers in the formal sector in New Delhi (Dasgupta, 2003).
Education and health are considered as the objectives of development. Health
is important for well-being and education is vital to satisfy and to reward the life.
Both are important for the wider view of extended human capabilities that lie at the
heart of the meaning of development. The role of education is important in the talent
of a developing country to captivate modern technology and to develop the size for
self-sustaining growth and development simultaneously. Furthermore, health is
required to enhance the productivity and effective education also relies on passable
health. Hence, education is viewed as most important components of growth and
development (Todaro and Smith, 2012).
Balanced population growth is crucial for progression of economy in a better
way. The population in a country is crucial in the economic development along with
for the social well-being of the people. Though, social distress and low economic
performance of economy can lead to poor management of human resources.

24
Historically, high population growth rate has been considered as an essential factor in
overall economic development of economy of Pakistan.
The government made commitments for the allocation of funds and measures
on an innovative policy to raise the issue seriously in terms of managing growth in
population and the labour force. Improved health facilities and promoted population
welfare activities through the Ministry of Population Welfare declined the crude birth
and fertility rates significantly, that causes a curtailment in the average growth of the
population accompanied by an increased labour force participation rate. Therefore,
further efforts are needed for development of better human resources.
Govt is facing important challenges to identify the development strategies in
order to generate new employment and income opportunities, and reduce
underemployment and unemployment. The urgent need to create employment
opportunities is underscored due to higher labour force growth rate than population
growth. Moreover, the women‟s share in both (wage and salary employment) has
decreased but still their share is up to a quarter of these jobs. Though, a greater part of
female workers is involved in the urban informal sector to continue existence
(Pakistan Economic Survey, 2011-12).
The formal sector is limited in its capacity to generate employment
opportunities. A greater part of labour force is engaged in informal sector
employment where productivity of labour is at low level and workers are not given
protection against exploitation by the employers. Consequently, wages are very
meagre despite longer working hours in informal sector. Therefore, the informal
sector must be promoted in order to absorb surplus labour. It is an attempt to enhance
the labour productivity in the informal sector and to protect the workers from
exploitation in informal sector (Kemal and Mehmood, 1998).
In Pakistan, the informal sector covers a wide range of labour market activities
and plays an important and sometimes controversial role that makes accessible
number of activities in labour market. It makes possible provision for jobs and
diminishes unemployment but almost all jobs are low paid. Furthermore,
unemployment indicates a situation in which people agreed and eligible to work at the
prevailing wage rate are not sufficiently expert to find jobs. In Pakistan, labour force

25
comprises all persons whose age is ten years and above and who are without work for
the reference period, presently available and looking for work (Labour Force Survey,
2011-12).
There is a complex relationship between informal employment and poverty.
On the one hand, poor people, due to inadequate formal opportunities, work in
informal economic activities as an alternative livelihood strategy. Contrarily, such
informal employment can itself either lead to poverty or contribute to poverty
reduction. These diverse results habitually exist together as restrictive on casual work
sort and particular nation connection and time period (Jutting, Parlevliet and
Xenogioni, 2008).
The significance of fiscal policy can't be overruled as it backings monetary
movement through manageable development and destitution lightening. The powerful
practice of the fiscal activities to assemble assets through taxes and public savings,
can subsidize greatly required public goods and services. It demonstrates supportive
to right financial uneven characters and also to advance venture and development by
ideal designation of investment and growth through making the tax system better.
Rapid economic growth and development need a well structured policy in the
country.1
The inward looking policies with fiscal incentives, mostly to manufacturing,
prevailed at large scale direct resource allocation towards the capital intensive
activities and adopt capital intensive techniques which are responsible for low
employment opportunities. There is a need to redirect policy towards the labour
intensive informal sector which probably uses capital to generate supplementary
employment opportunities with no compromising on economic growth in a better way
(see Kemal and Mehmood, 1993).
The urban informal sector is quite large and expanding rapidly due to growing
urbanization, migration and inadequate formal employment. The informal sector
provides employment to the poor segment and plays an entrepreneurial role in the
development of the economy as well. The informal sector tries to reduce
unemployment by creating more opportunities. The problems and constraints of the
1 see Pakistan Economic survey, 2011-12
26
informal sector must be removed in order to develop it. However, there is a need to
create more formal employment opportunities for the development of the economy.
It is gigantic to study the informal sector comprehensively because the very
sector is hallmark of heterogeneous activities. Inspite of rapid growth of GDP,
employment opportunities have been insufficient to fascinate the labour force which
is growing rapidly in Pakistan, so a large proportion of labour force is persuaded
towards informal sector for employment (Kemal and Mehmood, 1993). Informal
sector growth is very useful in formulating policy concerning employment, human
resource development and growth.
Few studies regarding various aspects of informal sector consisting of earnings
determinants, wage rates, labour productivity, capital intensity, skill development and
constraints on the growth of small units are carried out in Pakistan. While these
studies are very valuable as in they draw out the fundamental attributes of informal
sector exercises and requirements on their development, yet in light of the fact that
they have been done in disengagement from one another and are in view of little
specimen overviews, they regularly think of clashing proof and conflicting
arrangement recommendation which diminish the utility of their discoveries. The
distinctions in the center, technique, review configuration, scope and nature of the
investigation introduced in different studies have given clashing proof (Kemal and
Mehmood, 1993).
This study carries out a survey of the urban informal sector of Southern
Punjab, Pakistan with a view to examine different features of the informal sector.
Taking into consideration the size of the urban informal sector, this research looks at
the pattern of the urban informal sector and employment in three divisions of
Southern Punjab, Pakistan. For sake of analysis, dependent variable is probability of
informal sector employment and logistic techniques are used to analyse the
determinants of urban informal sector employment.
In addition, earnings functions are also estimated including human capital
variables to see effect on earnings of people employed in the informal sector using
regression techniques. A part from this, Human Development Perspective has been
used in order to identify the living standards of participants of the urban informal
27
sector and examine the link between them and poverty. Human development
indicators (i.e. economic, human and social capital) are used to gauge the relation
between poverty and the urban informal sector employment. Indicator of economic
capital is income of participants and the households‟ income which is measured by
using the poverty line to gauge the capacity of the informal sector participants in
meeting basic needs and hence get close to the idea of poverty. Human capital
includes the attainment of education, access to health services and access to housing
facilities which are measured on the basis of high level of access and higher
utilization of these facilities. Social capital covers access to social institution as
indicated by the participation in socio-cultural activities gauged by proportion of
informal sector employed watching television, listening to the radio programmes,
reading the newspapers or participation in local organization activities.
1.2 Objectives of the Study
The study has been conducted in order to examine different aspects of the
informal sector to devise strategy for the growth potential and development of the
urban informal sector in Southern Punjab. Particularly, the study emphasizes on:
1) To assess the nature and size of the urban informal sector employment in
Southern Punjab, Pakistan.
2) To examine the characteristics of people working in the informal and formal
sector employment of Southern Punjab, Pakistan.
3) To analyze the socio-economic and demographic factors of the participants of
the urban informal sector who motivate or determine and enhance growth
potential of the urban informal sector.
4) To empirically estimate the determinants of the urban informal sector
employment by using the binary Logit model.
5) To estimate the earnings structure of the urban informal sector employment by
using the regression techniques.
6) To focus on gender employment in the urban informal sector and comparison
in three divisions of Southern Punjab, Pakistan.
7) To highlight the effects of the urban informal sector‟s employment on
participant‟s development or to what extent these urban informal sector
28
participants possess economic, human and social capital in three divisions (i.e.
Bahawalpur, Multan and Dera Ghazi Khan) of Southern Punjab, Pakistan.
8) To design policies and offer recommendations for the future course of action.
1.3 Material and Methods
The gigantic part of this research is based on the primary source of data. This
study is primarily based on the multi-dimensional field survey that has been
conducted by the author during 2012. Almost 1506 workers are interviewed and
information is recorded for further analysis. Three divisions out of nine divisions have
been selected for survey. From each division, one district and two tehsils have been
selected. Simple random sampling and stratified sampling are undertaken for
collection of the data.
Moreover, the compiled data from the sources like Pakistan Economic Survey
(Annual), Publications of Government of Pakistan, World Bank Publications, ILO
Publications, Pakistan Millennium Developmet Goals Report and Labour Force
Survey (various issues) are used in this research.
In the present study, main focus is the complete analysis of determinants of
participants of the informal sector in urban areas of Southern Punjab, Pakistan. The
present study has analysed the characteristics of participants of the formal as well as
informal sector employment. Furthermore, econometric technique has been adopted
in order to estimate the probability of determinants of the urban informal sector
employment of total sample along with the gender comparison. The study also looks
at the earnings structure of participants of the urban informal sector in Southern
Punjab, Pakistan. Moreover, the living standard of the participants of the urban
informal sector has been checked by Human Development perspective. However, the
data and methodology are interpreted in detail in chapter five.
1.4 Organization of the Study
The organization of the study will be as follows:
The present study consists of ten chapters. After the prelude, Chapter two
deals with an overview of the informal sector, growth and economic development.

29
Chapter three explains Neo-classical Labour Supply theory and Human
Capital theory. Furthermore, the Theoretical Approaches towards the urban informal
sector are highlighted.
Chapter four consists of review of literature about different aspects of the
informal, the urban informal sector and economic development both at national and
international level seperately.
In chapter five, the preliminary analysis of data has been made and
measurement issues concerning it are described. It also explains the detail of study
areas, data source, and explanation of the determinants of the urban informal sector
employment, model, methodological issues and selection of variables.
Chapter six elaborates descriptive analysis of workers in the informal and
formal employment in labour market of Southern Punjab, Pakistan regarding total,
male and female sample.
In chapter seven, we will analyze empirically the socio-economic determinants
of workers who motivate, determine and promote the growth potential of the urban
informal sector of three divisions of Southern Punjab.
Chapter eight describes the earnings determinants of workers engaged in the
urban informal sector and economic development in terms of total surveyed sample in
Southern Punjab and its three districts.
Chapter nine interprets the determinants of employment of both genders and
makes comparison in the urban informal sector of Southern Punjab, Pakistan.
Chapter ten provides conclusions and policy recommendations.
30
Chapter 2
URBAN INFORMAL SECTOR, GROWTH AND
DEVELOPMENT
2.1 Introduction
Inspite of growth of GDP in Pakistan, employment opportunities have been
relatively insufficient to absorb the labour force growing at rapid rate due to promoted
industrialization in Pakistan. Due to trade, investment and public sector policies, the
capital-intensive industries prevailed at large scale however they discouraged the
informal sector or the situation gave way to industrialization (Kemal and Mehmood,
1998).
The growth in the size of the labour force has been increasing at a large scale
than the growth rate of formal sector jobs. In fact, it has been expected that private as
well as informal sector must play the leading role to create employment which, in
turn, changes trends significantly in unemployment, the formal and informal sector
employment. The informal sector is viewed as a very important sector of the economy
because development stratigies are redirected to endorse jobs and equity due to its
presence.
The informal sector certainly generates employment at higher level as
compared to formal sector for any particular investment having relatively high
productivity of capital. The process of the formal sector employment creation depends
on informal sector to a great extent. However, the productivity of workforce in the
informal sector is, most probably, rather low and they are not provided protection
against exploitation by employers who earn skimpy wages at the cost of longer
working hours. Consequently, policy intervention regarding informal sector must
hinge on the truth that informal sector, which is labour-intensive, creates additional
employment. At the same time, public policies are required to induce enhanced
labour productivity in the informal sector with no compromise on growth objective
and on workers‟ protection against exploitation. The policy is also needed to promote

31
and encourage informal economic activities instead of their active discrimination
(Kemal and Mehmood, 1998).
The arrangement of the chapter is as follows.
In section 2.2, we review the urban informal sector and various definitions of
the informal and urban informal sector at national and international level. The section
2.3 describes an overview of Pakistan‟s growth and development in relation to socio-
economic indicators over the time period to understand informal sector employment
in Pakistan. The section 2.4 shows population, labour force and employment pattern
in Pakistan economy. Unemployment situation is explained in section 2.5. Trends in
urbanization and migration in Pakistan economy are described in section 2.6. In
section 2.7, poverty and measures are explained. Section 2.8 highlights the women
and urban informal sector. Section 2.9 explains the concept of development. Human
indicators and development are stated in section 2.10. Section 2.11 shows social
indicators and development. Concluding remarks are presented in section 2.12.
2.2 Urban Informal Sector: An Overview
The informal economy has been oserved as having more of a fixed character
in countries where income and assets are not equally distributed. It was estimated that
informal work accounted for almost 80 % of non-agriculture employment during the
past decade, its share was over 60 % of urban employment and over 90 percent of
new job (see Charmes, 2002).
For women in sub-Saharan Africa, the informal economy denoted 92. 5 % of
the total job opportunities outside of agriculture as compared to men share of 71%.
However, in Asia, informal workers‟ shares ranged from 45 to 85 % of non-
agricultural employment and from 40 percent to 60 % of urban employment (ILO,
2002).2
In the developing countries, the share of self-employment is greater in the
informal employment as compared to wage employment. Specifically, share of self-
employment is 70% of informal employment in Sub-Saharan Africa (if South Africa
2 see Becker (2004).
32
is excluded, the share is 81%) 62% in North Africa, 60% in Latin America and 59%
in Asia (see Becker, 2004).
The bulk of people depend on the informal sector to earn a livlihood due to
lack of employment opportunities in the public as well as in the private formal sector.
Though their earnings remain very meager, that classifies them as poor, yet without
informal sector, it would be even negligible and their poverty would turn even worse.
Resultantly, the productivity and incomes of informal sector workers should be
enhanced outstandingly.3
The developing and developed countries consider informal sector as an issue
of great importance. The informal markets determine the co-operative
entrepreneurship to make economically and politically stronger the poorest people all
over the world. This silent revolution brought changes in societies around the World.
This overwhelmed the societies by extraordinary challenges; increasing opportunities
by setting up institutions and policies to allow their citizens to participate easily in all
sphere of economic, social, and political life (Chickering and Salahuddine,1991).
Urban informl sector contributes to curtail down the costs of urbanization. The
countries having cheaper labour in form of urban informal activities relatively pay
lesser urbanization costs.4
The informal sector has the potential to face sufficiently escalating
unemployment problem in Pakistan. Easy access, low skills and necessary investment
in informal economic activities increase the stock and annual addition to the work
force and the existing financial resources. The very sector has the potential to absorb
large portion of rural and urban workforce and to contribute significantly skill
development of work force (Sabur and Chayur, 1994).
The several definitions have been intricated because of mixed nature of the
informal economy and it can not enfold the presented definitions regarding the
informal sector. Yet, a lot of focal definitions are considered to show the different
view points of the informal economy.
3 see ESCAP, 2006. 4 see Richardson (1987).

33
The concept „Informal‟ is theoretically based on the dichotomy of the urban
economy in underdeveloped countries. Hart used the term “informl sector” in his
famous paper when he attended a conference which was held in Africa on the topic of
“urban unemployment”. It was arranged by the institute of Development Studies at
the University of Sussex. He focused on low income neighbourhood of Nima in Accra
and explained employment in the informal sector depends on new-comers who did not
find employment in the formal sector. He objected traditional outlook to deal with the
informal sector as being remarkably unproductive. In this way, various sorts of
activities, apt to fall in this sector, were neglected by research and policies equally to
a large extent (see Chowdhury, 2006).
International Labour Organization (ILO) introduced the concept of informal
sector in Employment Mission Report on Kenya in 1972 in that migration from the
countryside to the city caused urban unemployment. Along with the incapability of
the formal sector to make available adequate employment to rural migrants as well as
urban dwellers then, they are persuaded for small-scale and micro-level production
and distribution of goods and services. Accordingly, these mostly unrecognized,
unrecorded and unregulated small-scale activities are the informal sector. The
International Labour Organization (ILO) reports presented set of specific
characteristics of the informal sector. These enterprise production unit establishments
are as follows.
easy entry;
dependence on domestic resources;
family possession of enterprises;
labour-intensive, make use of adapted technology;
skills required beyond the scenario of formal school system;
unorganised and contestive markets;
lack of support and acknowledgement from the government;
It was concluded in ILO Kenya report that the informal sector efficiently
creates more jobs alongwith a quick increases the employment than formal sector.

34
Hart (1975) distinguished between income opportunities in wage and self-
employment in his dual model. He regards employment in the formal sector as the
wage employment and in the informal sector as self-employment.
In his conception of the informal and formal sector distinction, Weeks (1975)
emphasized the economic insecurity of operation in the informal sector. All private
sector enterprises which were officially documented, nurtured and regulated by the
state were viewed as in the formal sector. Contrarily, the informal sector comprised
the enterprises and individuals who were devoid of advantages and were not bound by
the government regulations. Moreover, these enterprises did not avail formal credit
and means causing transfer of foreign technology.5 People, without contributing to
social security institutes, were incorporated in informal group, apart from the group 2-
4 persons and domestic workers (Merrick, 1976).
Sethuraman (1976) suggested a list of criteria in order to identify the informal
sector enterprises. A manufacturing enterprise can be enlisted into the informal sector
by satisfying one or more conditions suggested below.
It engages ten persons or less incorporating part time and casual workers;
It functions on an illegal basis, incompatible to govt regulation;
It incorporates household family members of head of the enterprises;
It observes unfixed hours/working days;
Its operations are done in semi-permanent/temporary premises, or it shifts
location;
It does not use any electricity during manufacturing process;
It does not fulfill its credit needs from formal financial institutions;
It usually distributed output provided directly to final consumer;
Almost all workers have less than six years of formal schooling;
Breman (1976) demonstrated the crucial role of personal contacts to determine
the absorption into the informal work process with place and work type. Mazumdar
(1976) defined the informal sector as an “unprotected labour force” not covered by
5 Where numerous measures are seen in the informal sector economic operations such as tariff and
quota protection, import tax rebates, low interest rates selective monetary controls and licensing of
operations.
35
labour legislations. He viewed that the basic difference between informal and formal
sectors showed that formal sector employment was, somehow, protected so that the
wage levels and working conditions in the sector were generally not available to those
who seek job in the market until they enable themselves to cross the barriers of entry.
Peattie (1980) made query on the characteristics defined by ILO (1972). The
author was indifferent to accept the easy entrance in the informal sector. In her words,
these occupations were characterized as in informal sector due to a variety and
complexity of structure rather lack of formal structure. Cavalcanti (1981) explained
that informal sector consisted of small scale units producing and distributing goods
and services most preferably aiming at remarkable employment and income
generation, irrespective of the constraints on capital (i.e. physical and human) and the
technical know-how.
Smith and Koo (1983) identified two measures to distinguish the formal and
informal sector. These were employment type (i.e. all self-employed and unpaid
family workers engaged in the informal sector), and hired workers for domestic
services (such as maids, chauffeurs) or in small family enterprises were included in
the informal sector.
Banergee (1983) included the wage employment in the informal sector. Petty
trade would, approximately fall in informal sector (Okojie, 1980). House (1984)
distinguished the informal sector into two sub-sectors. First was the intermediate
sector which appeared as a reservoir of self-motivated entrepreneurs. The second was
the community of poor comprising large body of left behind and underemployed
labour.
Most important features of the urban informal sector by Fields (1975 and
1988) are given below:
Free entry, in the sense that (all entrants of the sector can get variety of work
which in turn provides with cash earnings);
Income distribution owes to institutional circumstances of production and
sales patterns of that sector;

36
Positive on-the-job search opportunities,because the participants of the
informal sector have a non-zero chance to seek out a job in the formal sector;
An intermediate probability (to search, as the participants have a better chance
to find a formal sector job than agricultural workers but they have a chance
than openly unemployed and unemployed workers);
A lower wage rate in the urban informal sector than in agriculture, which
arises endogenously due to higher search opportunity on-the-job;
Free entry is an important characteristic of the informal sector and other
features characterize the informal sector of typical developing economy;6
Tokman (1986) stated that migrants and newcomers with lack of human and
physical capital entered in the labour market and this induced them to decide to
perform activities avoiding their main requirement of being easy entrant into the
sector. However, the organization of the production seemed the major factor, while
the features of entry were just required to make difference between the units of
production using labour (paid or unpaid), and individual level units.
Others have also emphasized on diverse characteristics of the informal sector
which is of unorganised and non-institutional nature. The unauthorized operations that
did not avail incentive or social security system were incorporated in the informal
sector units.7 The informal sector proved temporary stage in urban areas for rural-
urban migrants expecting for receiving urban income higher than their agricultural
income.8
Generally, formal and informal sectors are distinguished by following:
Formal sector includes difficult entry, large scale, secure employment,
regulated enterprises, corporate ownership, links with international trade, capital
intensive, modern technology, fixed locations, reported/legal activity. Whereas,
informal sector is characterized by ease of entry, small-scale, insecure/seasonal
6 see Fields (1988), where free entry, income sharing, positive on the job training, an intermediate
search probability and lower wage in the urban informal sector than in agriculture. 7 Amin (1987) surveyed of wage workers and self-employed from 230 different informal sector
activities in Bangladesh. 8 The growth of urban sector has seen the establishment and growth of the informal sector, see
Chaudhary (1989).
37
employment, unregulated enterprises, family ownership and self-employment, local
market, labour intensive, traditional technology, transient patterns and
unreported/illicit activity.9
Boyd (1990) characterized the informal sector in terms of employment size,
informal networks, personal and social contacts of self-employed. The author
included self-employed unincorporated business owners in the informal sector. Kozel
and Alderman (1990) declared that labour force activities in household enterprises
engaged and production of goods consumed at home were productive as they
comprised the major part of the day.
Burki and Abbas (1991) measured the informal sector as firm size in Pakistan.
They added those establishments that were unregistered firms and hired 10 or fewer
than 10 workers. The apprentices and entrepreneurs both were used to define urban
informal sector. The informal sector was attributed as ease of entry, flexibility,
employment level (such as petty producers, petty traders, and casual disguised wage
labourers) and the lack of social benefits in Aman Jordan.10
Doan (1992) emphasized
on the stratification contained by the supposed informal sector i.e. part of the
economy that was unregulated by the state.11
The informal sector considered those
establishments which were unregistered with 10 workers or fewer. The concept of
legality was used to define informal sector.
Similarly, Swaminathan (1991) incorporated unregistered and unlicensed
establishments in the informal sector and these enterprises were considered as part of
the informal sector due to their unregulated status. The informal sector was defined as
an enterprise or production units. The authors emphasized that the employment in the
informal sector was not conditioned by regulations (i.e. any contract) and workers did
not access formal employment benefits i.e. fixed wages and employment security.12
9 see World Bank Country Study Report (1989).
10 see Doan (1992) for survey. 11
Doan (1992) showed distribution of workers i.e. petty traders, subcontractors salaried
workers, disguised wage labourers and casual wage labourers. 12 see Kemal and Mehmood (1993).
38
In January 1993 15th
International Conference of Labour Statistics gave the
international statistical definition of the informal sector and defined enterprises in
informal sector depending on following criteria:
There are private unincorporated enterprises, i.e. individuals or households
own these enterprises and are not composed as separate legal entites, as these
are accessible absolute accounts that allows for a financial separation of the
productive activities of the enterprise from the other activities of its owner(s).
All or at least a quantity of goods or services is being produced for sale or
barter, with inclusion of households to produce domestic or personal services
by hiring paid domestic employees.
The employment size of enterprises below a certain threshold must be
determined in keeping with national circumstances and they are unregistered
under particular structure of national legislation.
They are performing activities that come into the category of non-agricultural
along with secondary non-agricultural activities of enterprises in the
agricultural sector.
Paradhan (1995) considered two definitions: The first definition viewed the
size of the enterprise to indicate formality “if it was lower than 6, the work was
grouped as informal, if it was no less than 6, the job was formal”. The 2nd
definition
emphasized on worker‟s status (i.e. self-employed workers) to define informal sector.
Funkhouser (1996) defined informal sector as employment size i.e. self-
employed, domestic workers, family workers, and wage and salary workers in firms
of four or lesser persons excluding professional and technical occupations. Several
authors (Loyaza (1996); Jones and Fortin et al., (1997) measured the informality in
terms of legality. In their words, informal sector employment emerged due to
excessive taxes, regulations and minimum wages. The informal sector was
characterized by ease of entry, small scale, labour intensive and self-employment
(Samith and Metzger, 1998). In Fakuchi‟s (1998) study, the term informal sector was
regarded as those firms which were not formal and covered all small, cottages, and

39
family firms. The informal sector was characterized as sector of migrants, petty
traders and wage earners.13
Those small scale units which are engaged in producing goods and services,
primarily aiming at income and employment generation and not having intention for
tax payment evasion are regarded as informal sector. It has defined the informal sector
employment as labour force in un-incorporated enterprises, owned by own account
workers without considering the enterprise size or by employers who employ fewer
than 10 workers. Thus, informal sector enumerates all household enterprises managed
by own account workers and employers with fewer than ten persons involved in
production of activities, exclusive of agriculture or non-market production.14
Ranis and Stewart (1999) examined the informal sector with regard to the rest
of the economy and divided the very sector into two parts. One part was a
modernizing dynamic and the 2nd
one was a traditional stagnant one. The authors
highlighted that the informal sector was a disadvantaged part of a dualistic labour
market. Moreover, it appeared dualism relating to wages that were exceeded the
market clearing level.
The informal sector included both the family enterprises and industrial
establishments that hired less than ten employers. It also included the non-industrial
enterprises that hired fewer than twenty or at least twenty workers.15
Rosser et al.,
(2000) used the legalist approach to classify the informal sector. Accordingly, the
reasons to work in the informal sector were low tax rates and safety nets.
ILO (2001) describes these appropriate activities as it groups the informal
sector into these major parts:
(a) Owners or employers of microenterprises provide work for small number of
workers.
(b) Own-account workers are those who work without help or with unpaid
employes.
13 Study by Little and Levin et al. (1999). 14 Federal Bureau of Statistics (1998) 15 Malik and Nazli (1999) explained family enterprise, industrial establishments and non-industrial
establishments.
40
(c) Workers who are dependent found in micro-enterprises or serving employers
with no contract and casual workers.
Todaro (2000) argued that the informal sector largely depended on paid work by
women as primary source of employment in most developing countries (see Chen,
2001). It highlighted that the enterprises based on self-employment that availed
assistance of unpaid family members, domestic servants, low educated employees,
hired not more than ten workers. The informal workers did not avail social benefits
and protection and their relationship was not constrained by labour legislation and tax
rules were also included in informal sector.16
Gallaway and Bernasek (2002) found the informal sector as paid workers in a
family business as self-employed. Gray and Tudbal (2002) emphasized family
friendly work participation while defining informal work. The informal sector was
concerned with living condition, security and low benefits. Entrepreneurship was the
fundamental feature of informal sector (Reddy et al., 2003). The non-self-employment
was refered as in informal sector employment.17
The low status and unprofitable work were included in informal sector. 18
Das
(2003) looked upon informal self-employed workers who operated at their own farm
or non-farm enterprises or as own account workers with or without taking help from
partners and helpers, largely by hiring labour and unpaid helpers. This classification
excluded those entrepreneurs employing less than 3.5 workers. The micro-enterprises
were refered to those enterprises that incoporated family labour and hired at least 5
employees. The small scale enterprises provided work for above five and less than
twenty hired workers and medium scale enterprises with 20 employees or above
(Mukras, 2003).
Marshal and Oliver (2005) incorporated the entrepreneurship in informal
sector employment. The informal sector was regarded by two sub-sectors. One was
upper tier informal sector that did not facilitate the employees with benefits from
health, retirement or other benefits, but it was possible for the employees to resort to
16 see ILO report (2002). 17 see survey by Suharto (2002), Florez (2003), Zulu et al., (2002﴿ and Reddy (2003). 18
see studies by Dasgupta (2003), Ozcan et al., (2003), and Guang and Zheng (2005).
41
the law when they need ed it. Second was lower tier informal sector that included the
salaried employers who were, somehow, unprotected concerning the law, without
availing health retirement and other benefits (Bocquier, 2005).
Sandufur (2006) found that the establishments providing employment more
than five employees were included in the informal sector. Henley (2006) defined the
informality in terms of employment contract status, social security protection
according to the nature of the employment and the characteristics of the employer.
Ademu (2006) examined the income generating activities of urban dewellers
as in the informal sector. These worked without the restrictions and legal regulations
imposed by the government. The general characteristics of operators of an informal
sector are defined in the following form:
The factors of production are easily accessed by organizing the family and
friends socially.
Entrepreneurs involve in almost all branches of the economy i.e. productive
activities, general and specialized services.
The constraints on social relations determine more technology.
Operators‟ aspiration towards in the formal sector production as more profit-
oriented.
The operational definition was adopted by Kristic and Sanfy (2006) to define
informal employment. This definition was based on following:
1) Informal employees: wage employees without having payment of social
security contribution (health and pension insurance).
2) Informal self-employed: own-account workers and employers working in non-
agriculture family business without payment of social security contributions;
3) Farmers working on own farm.
4) Family workers who were not paid.
Florez (2003) defined informality in dualistic approach i.e. self-employed
excluding professionals and technicians, unremunerated family workers, domestic
servants, owners and salaried workers in small firms (utilizing 10 or lesser
42
employees). While, the owners and workers having no health insurance were
unprotected (i.e. all unpaid family workers and domestic servants) and added in
structural articulation approach. The term “informal sector” was invoked to refer as
construction work by Li and Peng (2006).
Gunatilaka (2008) defined the informal employment which contained units
involving in economic activities working outside the scope of official statistics. These
activities were done by family workers, employers, employee and temporary and
casual workers in the informal enterprises.
In 2003, 17th
International Conference of Labour Statistics defined the
informal sector employment or households in the following types of jobs:
Own-account workers working at owned informal sector enterprises;
Employers involved in the informal sector enterprises that they owned;
Participating family workers, (whatever be their work domain);
Members of informal producers‟ cooperatives in the informal sector;
Informally employed in the informal or formal sector;
Own-account workers producing goods for personal household use;
The informal sector contains small units responsible for production or services
keeping in view providing employment and incomes to the families engaged in these
activities. Such informal activities have often been characterised by low levels of
capital, skills, access to organized markets and technology; low and unstable incomes
and poor and unpredictable working conditions. In general, these activities are
working outside the scope of official statistics. They also do not avail social
protection.They are highly labour intensive but are based on casual employment
because of kinship. Activities in this sector rely on local and regional demand.19
According to Wamuthenya (2010), all small-scale activities that were
normally semi organized and unregulated and used low and simple technology were
considered informal sector. The sector covered self-employed persons or employers
of a few workers and unpaid family workers. The informal sector was defined by
Jonason (2009) as an unregistered employee, self-employed person, unpaid family
19 Source: Labour Force Survey, 2010-11.
43
worker, or an employer who hired lesser than five employees and did not contribute to
any social security transition.
A lot of research work on the urban informal sector created an ambiguity and
contradiction of definition because of smaller clear empirical basis for the notion. The
informal sector is gigantic in its size under any definition used. In this research, we
have followed the Funkhouser (1996) to define the informal sector i.e. the self-
employed, own-account workers, unpaid family workers, domestic workers, wage and
salaried workers in firms of less than five employees other than professional and
technicians. The employment size increases in urban areas of Southern Punjab,
Pakistan.
2.3 An Overview of Pakistan’s Growth and Development
The growth in per capita income was observed at about 2.2 % in Pakistan
economy during 1950-2000. Accordingly, per capita income has increased three
times. However, a decline was observed in growth rate decade by decade and
performance on social indicators was observed poor owing to this declining trend.
The economy observed a rapid increase in its growth during 2003-2007.
The resilience of Pakistan economy has been observed many times due to
crisis one after the other. The numerous shocks (domestic and external) targeted the
economy from 2007 onwards. The international oil and food inflation, security risks at
domestic level due to operation against extremism and repetitive natural catastrophes
(floods) have buffeted the macro level strategy with shock after shock (Government
of Pakistan Economic Survey, 2011-12).
The campaign against extremism along with associated destruction of physical
infrastructure, the migration of thousands of people from the affected areas with an
increased expenditures to support them have all taken their toll. As a result export
markets slowed down as compared to the last year. Gross Domestic Product (GDP)
growth of 6.5 percent per anum has been trapped at half level of Pakistan‟s long-term
growth potential. This is lesser than growth required for sustainable increase in
employment, income and GDP a reduction in poverty (Government of Pakistan
Economic Survey, 2011-12).
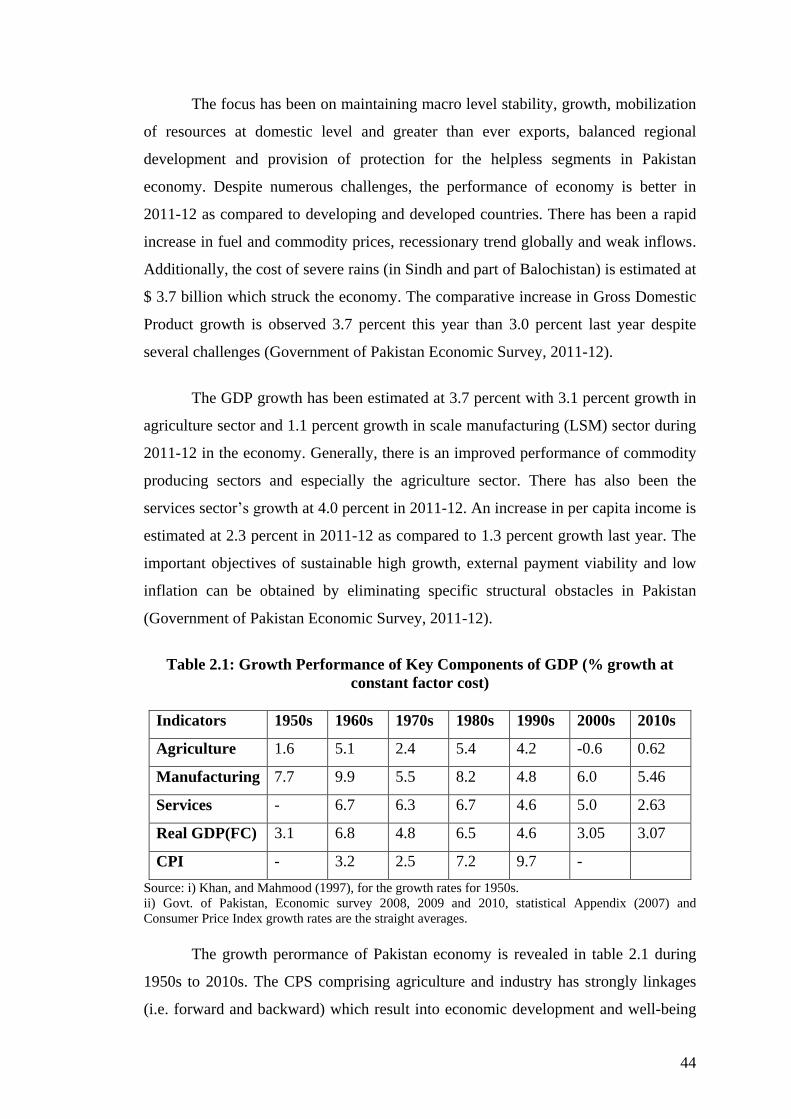
44
The focus has been on maintaining macro level stability, growth, mobilization
of resources at domestic level and greater than ever exports, balanced regional
development and provision of protection for the helpless segments in Pakistan
economy. Despite numerous challenges, the performance of economy is better in
2011-12 as compared to developing and developed countries. There has been a rapid
increase in fuel and commodity prices, recessionary trend globally and weak inflows.
Additionally, the cost of severe rains (in Sindh and part of Balochistan) is estimated at
$ 3.7 billion which struck the economy. The comparative increase in Gross Domestic
Product growth is observed 3.7 percent this year than 3.0 percent last year despite
several challenges (Government of Pakistan Economic Survey, 2011-12).
The GDP growth has been estimated at 3.7 percent with 3.1 percent growth in
agriculture sector and 1.1 percent growth in scale manufacturing (LSM) sector during
2011-12 in the economy. Generally, there is an improved performance of commodity
producing sectors and especially the agriculture sector. There has also been the
services sector‟s growth at 4.0 percent in 2011-12. An increase in per capita income is
estimated at 2.3 percent in 2011-12 as compared to 1.3 percent growth last year. The
important objectives of sustainable high growth, external payment viability and low
inflation can be obtained by eliminating specific structural obstacles in Pakistan
(Government of Pakistan Economic Survey, 2011-12).
Table 2.1: Growth Performance of Key Components of GDP (% growth at
constant factor cost)
Indicators 1950s 1960s 1970s 1980s 1990s 2000s 2010s
Agriculture 1.6 5.1 2.4 5.4 4.2 -0.6 0.62
Manufacturing 7.7 9.9 5.5 8.2 4.8 6.0 5.46
Services - 6.7 6.3 6.7 4.6 5.0 2.63
Real GDP(FC) 3.1 6.8 4.8 6.5 4.6 3.05 3.07
CPI - 3.2 2.5 7.2 9.7 -
Source: i) Khan, and Mahmood (1997), for the growth rates for 1950s.
ii) Govt. of Pakistan, Economic survey 2008, 2009 and 2010, statistical Appendix (2007) and
Consumer Price Index growth rates are the straight averages.
The growth perormance of Pakistan economy is revealed in table 2.1 during
1950s to 2010s. The CPS comprising agriculture and industry has strongly linkages
(i.e. forward and backward) which result into economic development and well-being
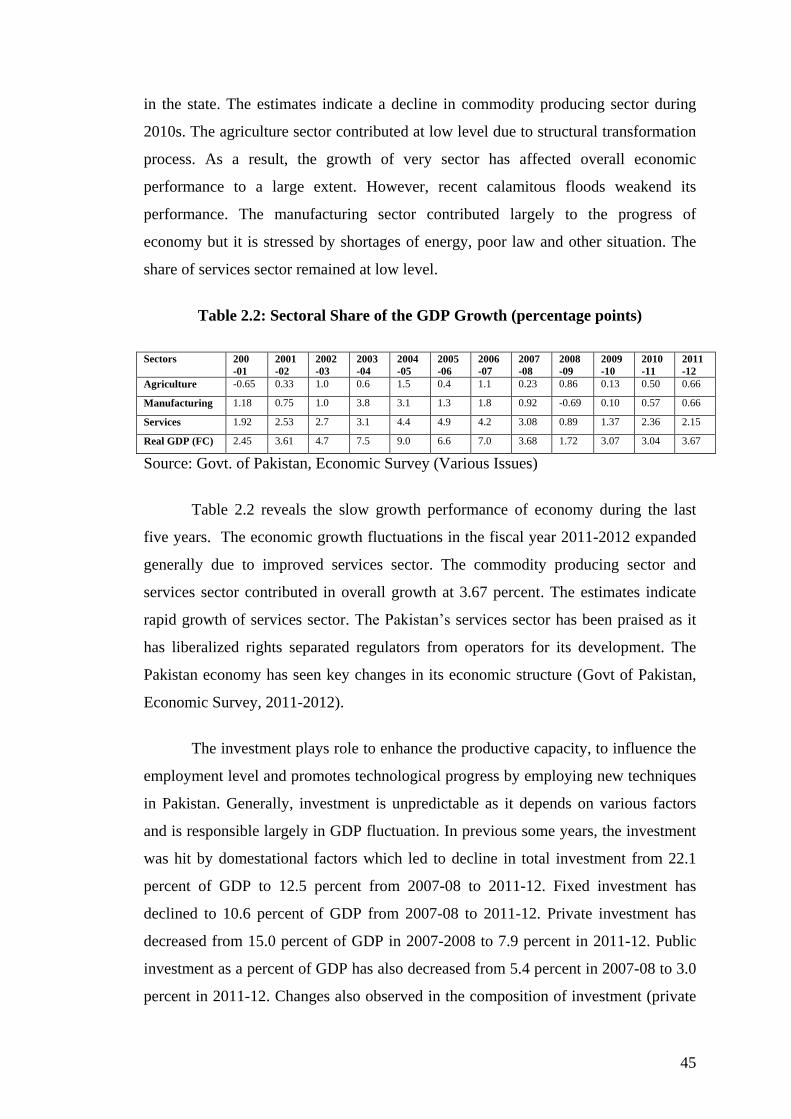
45
in the state. The estimates indicate a decline in commodity producing sector during
2010s. The agriculture sector contributed at low level due to structural transformation
process. As a result, the growth of very sector has affected overall economic
performance to a large extent. However, recent calamitous floods weakend its
performance. The manufacturing sector contributed largely to the progress of
economy but it is stressed by shortages of energy, poor law and other situation. The
share of services sector remained at low level.
Table 2.2: Sectoral Share of the GDP Growth (percentage points)
Sectors 200
-01
2001
-02
2002
-03
2003
-04
2004
-05
2005
-06
2006
-07
2007
-08
2008
-09
2009
-10
2010
-11
2011
-12
Agriculture -0.65 0.33 1.0 0.6 1.5 0.4 1.1 0.23 0.86 0.13 0.50 0.66
Manufacturing 1.18 0.75 1.0 3.8 3.1 1.3 1.8 0.92 -0.69 0.10 0.57 0.66
Services 1.92 2.53 2.7 3.1 4.4 4.9 4.2 3.08 0.89 1.37 2.36 2.15
Real GDP (FC) 2.45 3.61 4.7 7.5 9.0 6.6 7.0 3.68 1.72 3.07 3.04 3.67
Source: Govt. of Pakistan, Economic Survey (Various Issues)
Table 2.2 reveals the slow growth performance of economy during the last
five years. The economic growth fluctuations in the fiscal year 2011-2012 expanded
generally due to improved services sector. The commodity producing sector and
services sector contributed in overall growth at 3.67 percent. The estimates indicate
rapid growth of services sector. The Pakistan‟s services sector has been praised as it
has liberalized rights separated regulators from operators for its development. The
Pakistan economy has seen key changes in its economic structure (Govt of Pakistan,
Economic Survey, 2011-2012).
The investment plays role to enhance the productive capacity, to influence the
employment level and promotes technological progress by employing new techniques
in Pakistan. Generally, investment is unpredictable as it depends on various factors
and is responsible largely in GDP fluctuation. In previous some years, the investment
was hit by domestational factors which led to decline in total investment from 22.1
percent of GDP to 12.5 percent from 2007-08 to 2011-12. Fixed investment has
declined to 10.6 percent of GDP from 2007-08 to 2011-12. Private investment has
decreased from 15.0 percent of GDP in 2007-2008 to 7.9 percent in 2011-12. Public
investment as a percent of GDP has also decreased from 5.4 percent in 2007-08 to 3.0
percent in 2011-12. Changes also observed in the composition of investment (private
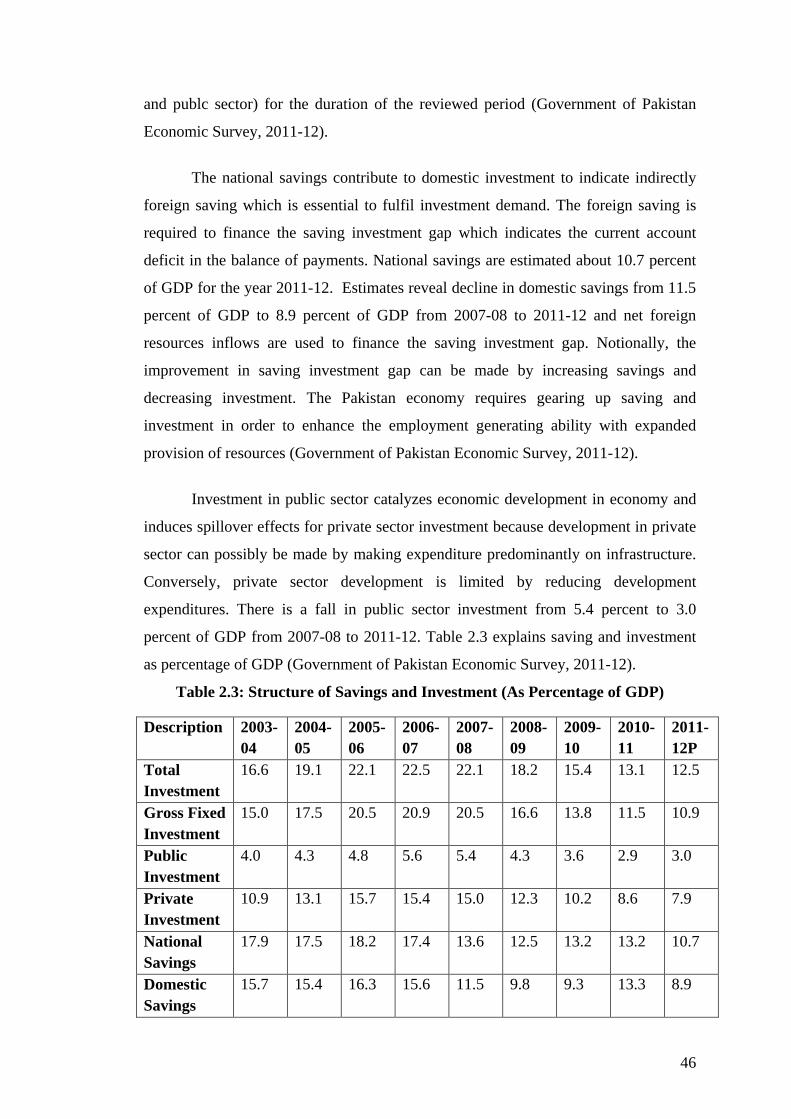
46
and publc sector) for the duration of the reviewed period (Government of Pakistan
Economic Survey, 2011-12).
The national savings contribute to domestic investment to indicate indirectly
foreign saving which is essential to fulfil investment demand. The foreign saving is
required to finance the saving investment gap which indicates the current account
deficit in the balance of payments. National savings are estimated about 10.7 percent
of GDP for the year 2011-12. Estimates reveal decline in domestic savings from 11.5
percent of GDP to 8.9 percent of GDP from 2007-08 to 2011-12 and net foreign
resources inflows are used to finance the saving investment gap. Notionally, the
improvement in saving investment gap can be made by increasing savings and
decreasing investment. The Pakistan economy requires gearing up saving and
investment in order to enhance the employment generating ability with expanded
provision of resources (Government of Pakistan Economic Survey, 2011-12).
Investment in public sector catalyzes economic development in economy and
induces spillover effects for private sector investment because development in private
sector can possibly be made by making expenditure predominantly on infrastructure.
Conversely, private sector development is limited by reducing development
expenditures. There is a fall in public sector investment from 5.4 percent to 3.0
percent of GDP from 2007-08 to 2011-12. Table 2.3 explains saving and investment
as percentage of GDP (Government of Pakistan Economic Survey, 2011-12).
Table 2.3: Structure of Savings and Investment (As Percentage of GDP)
Description 2003-
04
2004-
05
2005-
06
2006-
07
2007-
08
2008-
09
2009-
10
2010-
11
2011-
12P
Total
Investment
16.6 19.1 22.1 22.5 22.1 18.2 15.4 13.1 12.5
Gross Fixed
Investment
15.0 17.5 20.5 20.9 20.5 16.6 13.8 11.5 10.9
Public
Investment
4.0 4.3 4.8 5.6 5.4 4.3 3.6 2.9 3.0
Private
Investment
10.9 13.1 15.7 15.4 15.0 12.3 10.2 8.6 7.9
National
Savings
17.9 17.5 18.2 17.4 13.6 12.5 13.2 13.2 10.7
Domestic
Savings
15.7 15.4 16.3 15.6 11.5 9.8 9.3 13.3 8.9
47
The Pakistan economy witnessed growth of per capita real income at 2.3
percent in 2011-12. The growth is observed 1.3 percent for the year 2010. The
increase in per capita income in terms of dollars is observed $114 during 2010-2012.
It is estimated that workers‟ remittances enhanced by 25.8 percent in 2001 which are
higher than the previous year. The diversion of remittances from informal to the
formal channel at government level mostly resulted in resilence of remittances.
A noteworthy financial crisis has been observed in 2007-08 in global
economy. The crises originated in subprime mortgage loan portfolio. This was taken
aback that self-reliance of the international institutions and markets worsened the
economic development and balance of payments all over the world. The sever terms
of trade and slower economic growth which were faced by developing countries,
severly, and resulted in or lead to crises. Furthermore, the consumer, markets and
normally the investment process to produce goods and services were affected by the
financial melt down. This crisis (coincided with the rise in the process of commodities
and oil) decreased in aggregate demand and raised inflation all over the world
(Government of Pakistan Economic Survey, 2011-12).
The economy experienced a decline in inflation for the third consecutive year.
Consumer Price index estimated at a turn down of 14.2 percent during 2008- 2012
and it was observed in a single digit in 2012. The food and non-food inflation, on
average, is recorded at 11.1 percent and at 10.7 percent respectively. Both types of
inflation are higher as compared to previous year inflation.
The world‟s output and trade volume has experienced a turn down due to
inauspicious global environment during year 2011. The world‟s output estimated at
5.3 percent in 2010 and it decelerated to 3.9 percent in 2011. This falling global
economic activity sharply declined the growth of world trade from 13.0 percent in
2010 to 5.8 percent in 2010. An expansion of world output by 3.5 percent and trade
volume by 4.0 percent is anticipated during the period. The commodity prices in
international markets are decreased by global economic slow down which, turned-
down the world trade growth. There was also observed a decline in the prices of non-
fuel commodities from 26.3 percent to 17.8 percent during 2010 to 2011. The increase
in the prices is about at 10.3 percent in 2012 (Government of Pakistan Economic
Survey, 2011-12).
48
During July to April 2012, Pakistan has gone through a growth in export. It
remained buoyant and estimated at close to $ 13 billion, an increase of 16 percent
inspite of the worldwide slowdown. The capital flows to Pakistan were impacted by
worldwide recessionary trend. The sharp rise in oil prices and import of 1.2 million
metric tons of fertilizer also influenced the current account balance. Currently, there
has been observed signs of self-effacing improvement have been observed in the
economy. The current account deficit due to extended trade and services account
deficit was estimated at $ 3,394 during 2011-12.
Yet, continued support of the tranfers of workers‟s remittances expanded the
current account deficit. Trade volume expanded for the most part in result of 14.5
percent growth of imports and the 0.1 percent increased exports; thus increased trade
deficit by 49.2 percent. The trade deficit largely increased due to sharp increase in
import bill for the duration of july-April 2011-12 which boosted up due to higher
prices of crude oil at international level (Government of Pakistan Economic Survey,
2011-12).
It is observed that exports achieved $ 25 billion which is highest and shows 30
percent growth as limits both price and quality effect. Pakistan has also experienced
some diversification geographically regarding exports. 47.2 percent of the exports are
concentrated in five markets (USA, UK, Germany, Hong Kong, and U.A.E) of the
world and all other countires shared in exports at 52.8 percent. The share of exports of
these markets is about 35.7 percent while the share of exports of all other countries is
increased up to 64.3 percent in 2011-12. The increase in imports is noticed at 14.5
percent and continued at $ 33.1 billion for the period 2012. The current account
deficit stood at $ 3.4 billion principally due to high oil prices and import of fertilizers
for the period of 2012. The current account balance contained due to current transfers
in the form of workers‟ remittances (Government of Pakistan Economic Survey,
2011-12).
The public debt of Pakistan stood at Rs. 12024 billion as of March 31, 2012.
Public debt as a percentage of GDP stood at 58.2 percent by end-March 2012. It also
added to the EDL stock for the duration of July-March 2012. Furthermore, public debt
49
servicing stood at Rs. 720.3 billion against the budget amount of Rs.1034.2 billion of
the end of March 2012.20
High and speedy economic growth for large time period is prerequisite for
employment creation to accompany the rapid population growth and high living
statndard. The growth performance of the economy over the last five years can be
appreciated in many ways. Macro economic policies with structural reforms led to the
resurgence and statbility of the economy. However, there has been a slow growth
performance of Pakistan along with a decline in private, public sector investment and
a turn down in domestic savings throughout the last five years (GOP, Economic
Survey 2011-12).
The per capita real income has grown at an average rate of 2.3 percent during
the last year. Unemployment has increased from last three years. The poverty level
has been decreased and the development expenditures as a ratio of the economy
helpfully curtail down levels of unemployment in Pakistan (GOP, Economic Survey
2011-12).
2.4 Population, Labour Force and Employment Pattern in
Pakistan Economy
The population of a country plays an imperative part in economic
development and social well-being of the people. However, a turn down in economic
performance and social distress can be the result of poor human resource
management. The Pakistan economy faced socio-economic crises of food security,
and unemployment due to rapid population growth and lack of well-developed human
resources. However, the situation is being improved by the efforts of government.
Better health amenities and promotion of population welfare activities thorough the
ministry of population helpfully curtails down the crude birth and fertility rates
noticeably which lead to a decline in average growth rate of the population followed
by an increased labour participation rate. Thus, there has not been noticeable
reduction in growth of population and at the same time dependency ratio has
increased. Therefore, further essential efforts are required to make in order to improve
the human resources (Government of Pakistan Economic Survey, 2011-12).
20 GOP, Economic Survey, 2011-12.

50
A high rate of population growth has been exihibted in Pakistan since its
creation. Regarding size of population, Pakistan became sixth largest country of the
world from thirteenth country from 1951 to 2011. The rapidly growing population
demands security and fundamental services provsions. The labour force as being the
economically active part of population supply labour to produce goods and services in
the country. The labour force is very large in result of its large population size in
Pakistan. The government of Pakistan announced six labour policies in 1955, 1959,
1969, 1972, 2002 and 2010. These policies set down parameter for trade unionism
growth, protection of worker‟s rights, the settlement of industrial disputes and the
redress of workers grievances. The policy which reformed the labour law in 1972 was
most progressive one (Government of Pakistan Economic Survey, 2010-11).
The current government prerecognizes the significance of workers‟ and
employers‟ affable association to make them avail benefits without inflicting any set
back on the economy simultaneously. The mutual awareness and understanding of
both the workers‟ and employers‟ rights and obligations made it possible. The
observed labour force of 5.24 million people is 0.91 million more than the previous
year in Pakistan. In the economy, the employed people of 53.84 during 2010-11 were
0.63 million more as compared to the preceding year (Government of Pakistan
Economic Survey, 2010-11).
Table 2.4: Civilian Labour Force, Employed and Unemployed for Pakistan
(Million)
Year Labour Force Employed Unemployed
2003-04 45.5 42 3.5
2005-06 50.05 46.95 3.1
2006-07 50.33 47.65 2.68
2007-08 51.78 49.09 2.69
2008-09 53.72 50.79 2.93
2009-10 56.33 53.21 3.12
2010-11 57.24 53.84 3.40
Source: Varoius issues of labour force survey (2010-11)
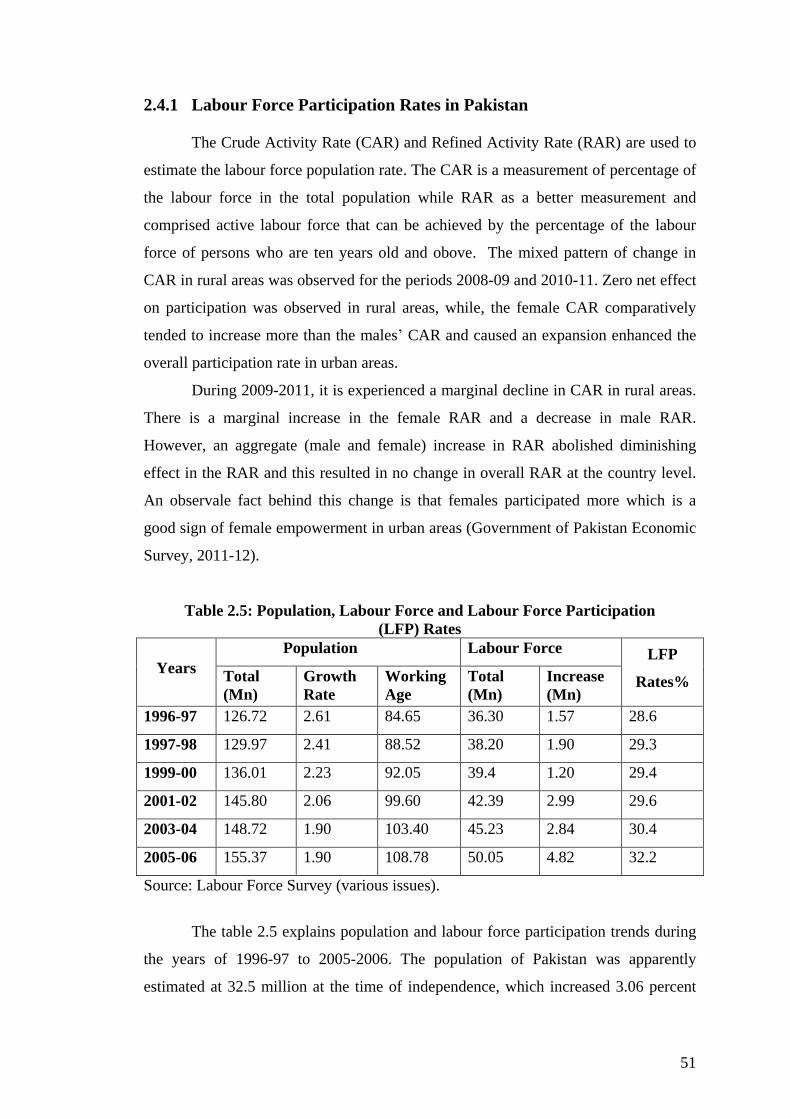
51
2.4.1 Labour Force Participation Rates in Pakistan
The Crude Activity Rate (CAR) and Refined Activity Rate (RAR) are used to
estimate the labour force population rate. The CAR is a measurement of percentage of
the labour force in the total population while RAR as a better measurement and
comprised active labour force that can be achieved by the percentage of the labour
force of persons who are ten years old and obove. The mixed pattern of change in
CAR in rural areas was observed for the periods 2008-09 and 2010-11. Zero net effect
on participation was observed in rural areas, while, the female CAR comparatively
tended to increase more than the males‟ CAR and caused an expansion enhanced the
overall participation rate in urban areas.
During 2009-2011, it is experienced a marginal decline in CAR in rural areas.
There is a marginal increase in the female RAR and a decrease in male RAR.
However, an aggregate (male and female) increase in RAR abolished diminishing
effect in the RAR and this resulted in no change in overall RAR at the country level.
An observale fact behind this change is that females participated more which is a
good sign of female empowerment in urban areas (Government of Pakistan Economic
Survey, 2011-12).
Table 2.5: Population, Labour Force and Labour Force Participation
(LFP) Rates
Years
Population Labour Force LFP
Rates% Total
(Mn)
Growth
Rate
Working
Age
Total
(Mn)
Increase
(Mn)
1996-97 126.72 2.61 84.65 36.30 1.57 28.6
1997-98 129.97 2.41 88.52 38.20 1.90 29.3
1999-00 136.01 2.23 92.05 39.4 1.20 29.4
2001-02 145.80 2.06 99.60 42.39 2.99 29.6
2003-04 148.72 1.90 103.40 45.23 2.84 30.4
2005-06 155.37 1.90 108.78 50.05 4.82 32.2
Source: Labour Force Survey (various issues).
The table 2.5 explains population and labour force participation trends during
the years of 1996-97 to 2005-2006. The population of Pakistan was apparently
estimated at 32.5 million at the time of independence, which increased 3.06 percent

52
per annum from 1947 to 1981 and decreased by 2.41 percent during 1998 and
expansion has been observed about four and half-fold during sixty years of its
independence. The annual growth rate of population was observed at 1.8 percent in
1947 in Pakistan while it has tended to increase up to 3.06 percent per annum in 1981
and experienced a decline to 2.41 percent in the year 1998. The population growth
rate declined slightly during 2006.
2.4.2 The Formal Sector, Informal Sector and Employment Trends
or Patterns
The excess informalization has been observed in the agriculture sector during
the past years and a self-cultivation trend and decline in share tenancy was also
observed. Both the agriculture and non-agriculture sectors experienced an increased
informalization. The share of the formal sector employment experienced a decline of
7 percent for males and of 6 percent in favour of females during 2000-2008. Trade
and services sector improved informalization in the urban labour market.21
The urban informal sector has been identified as firm size in Pakistan
(Guisinger and Irfan (1980), World Bank (1989a) and Burki (1990). The informal
sector contributed about 69% of employment in Pakistan in 1972-73 and 72.7% in
1985-86. It was observed as 2.878 million persons in 1972-73 and 4.970 million in
1985-86 with an increase of 4.3% annually. The above mentioned estimates indicate
that it is hard to define the informal sector as marginal to the urban economy, provider
of “employment of the last resort” or as a temporary sponge to take in new rural-
urban migrants who migrate with the expectation of getting opportunity in formal
sector in urban labour market. The informal sector largely prevailed in construction
and trade sector and it is autonomous to the formal (Nadvi, 1990).
The women occupied in the urban informal sector of Pakistan represent a
noteworthy part of labour force of economy i-e about 2 million. The women occupied
the urban informal sector of Pakistan represent a noteworthy part of labour force of
economy i.e. about 2 million. As the surplus and unskilled labour is unable to find
formal sector jobs. The informal sector permits entry and access to enterprises that
would otherwise deny them, and it makes offer for conditions well-matched with their
21
Source: GOP, Economic Survey, 2009-2010.

53
cultural constraints.It is estimated that the informal economy accounts for 40 % of
Gross National Product (GNP) of low-income countries.22
The formal sector employment was mainly outstanding in manufacturing
sector in 1972-73 and 35% work force was engaged in manufacturing in informal
sector.23
During 1984-1985, an increase was observed in the remarkable share of the
informal sector to 70.9 % of urban employment in the manufacturing sector in Sindh
and Punjab (World Bank 1989a) and 71% for all Pakistan in 1985-86 (Burki, 1990).
The formal economy comparatively made inroads in the finance, insurance, business,
services, community and social services sector over this period. The informal sector
stood dominant regarding employment in the construction, wholesale and retail
trading, hotels, transport, communications and storage industries within urban
Pakistan (Nadvi, 1990).
Informal sector is defined in terms of non-agriculture sector due to its
difficulty of defining it in the agriculture sector. The share of the informal sector is
64.6 percent of the employment in the main jobs outside agriculture sector and the
informal sector activities accounted for a significant proportion of total employment
and income generation. There are 68.3 percent of employed occupied in the informal
sector in rural areas is comparatively higher than the participants (61.1%) in the urban
areas. There are more formal sector activities in urban areas (38.9%) rather than rural
areas (31.7%). The male participants are relatively higher in the informal sector as
compared to female workers in the rural and urban areas.24
The majority of workforce is engaged in dominant agricultural activities in
rural areas. The increased participation of female workers is noted by 1.4 percent
during 2008-11. However, the male workers‟ involvement is reduced as compared to
female participants.25
The declining trend has been noticed in labour incorporation
sectors, due to growing dependence on capital intensive techniques. The educated and
skilled manpower increasingly are absorbed by the formal sector. Contrarily, a large
22 see World Bank Study (1989). 23 Guisinger and Irfan‟s estimates (1980) 24 Labour Force Survey (2011-2012) 25 Source: Pakistan Economic Survey (2011-12)
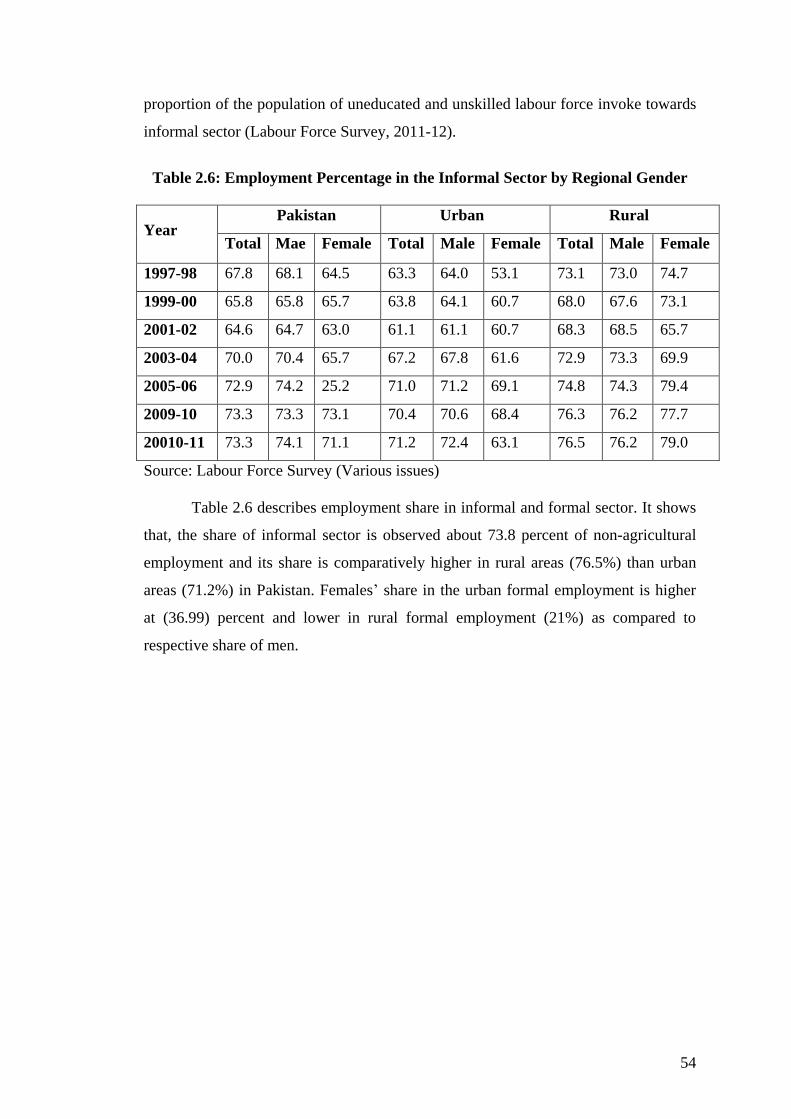
54
proportion of the population of uneducated and unskilled labour force invoke towards
informal sector (Labour Force Survey, 2011-12).
Table 2.6: Employment Percentage in the Informal Sector by Regional Gender
Year Pakistan Urban Rural
Total Mae Female Total Male Female Total Male Female
1997-98 67.8 68.1 64.5 63.3 64.0 53.1 73.1 73.0 74.7
1999-00 65.8 65.8 65.7 63.8 64.1 60.7 68.0 67.6 73.1
2001-02 64.6 64.7 63.0 61.1 61.1 60.7 68.3 68.5 65.7
2003-04 70.0 70.4 65.7 67.2 67.8 61.6 72.9 73.3 69.9
2005-06 72.9 74.2 25.2 71.0 71.2 69.1 74.8 74.3 79.4
2009-10 73.3 73.3 73.1 70.4 70.6 68.4 76.3 76.2 77.7
20010-11 73.3 74.1 71.1 71.2 72.4 63.1 76.5 76.2 79.0
Source: Labour Force Survey (Various issues)
Table 2.6 describes employment share in informal and formal sector. It shows
that, the share of informal sector is observed about 73.8 percent of non-agricultural
employment and its share is comparatively higher in rural areas (76.5%) than urban
areas (71.2%) in Pakistan. Females‟ share in the urban formal employment is higher
at (36.99) percent and lower in rural formal employment (21%) as compared to
respective share of men.

55
Table: 2.7: Employment Percentages by Major Industry and Gender in Informal
Sector
Major Industry Division 2009-10 2010-11
Total Male Female Total Male Female
Total 100.0 100.0 100.0 100.0 100.0 100.0
Manufacturing 21.4 17.8 54.6 22.3 18.6 57.4
Construction 15.8 17.4 1.2 16.1 17.7 0.9
Wholesale & Retail Trade 39.2 42.2 11.5 38.9 42.1 9.2
Transport Storage and
Communication
10.8 11.9 0.8 10.7 11.8 0.4
Community Social and
Personal Service
10.8 8.5 31.7 10.0 7.6 31.9
Others(includes mining, &
Quarrying, Electricity, Gas,
and Water and Finance,
Insurance, real estate and
Business Services
2.0 2.2 0.2 2.0 2.2 0.2
Source: Labour Force Survey (2010-11)
The table highlights trends in informal sector employment by major industries
and gender. The estimates show that informal sector accounts for 38.9 % of wholesale
and retail trade, manufacturing (22.3%), construction (16.1%), transport (10.7%) and
10.0% for community, social & personal services. The share of other catagory is 2
about percent.
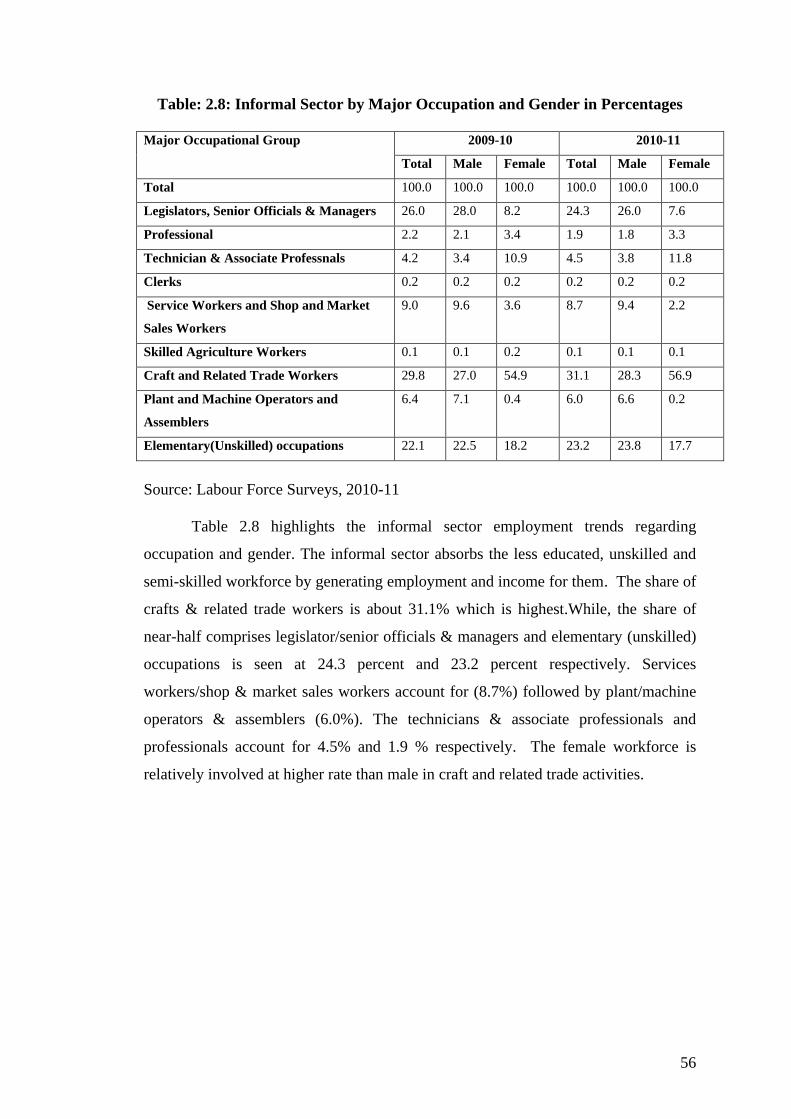
56
Table: 2.8: Informal Sector by Major Occupation and Gender in Percentages
Major Occupational Group 2009-10 2010-11
Total Male Female Total Male Female
Total 100.0 100.0 100.0 100.0 100.0 100.0
Legislators, Senior Officials & Managers 26.0 28.0 8.2 24.3 26.0 7.6
Professional 2.2 2.1 3.4 1.9 1.8 3.3
Technician & Associate Professnals 4.2 3.4 10.9 4.5 3.8 11.8
Clerks 0.2 0.2 0.2 0.2 0.2 0.2
Service Workers and Shop and Market
Sales Workers
9.0 9.6 3.6 8.7 9.4 2.2
Skilled Agriculture Workers 0.1 0.1 0.2 0.1 0.1 0.1
Craft and Related Trade Workers 29.8 27.0 54.9 31.1 28.3 56.9
Plant and Machine Operators and
Assemblers
6.4 7.1 0.4 6.0 6.6 0.2
Elementary(Unskilled) occupations 22.1 22.5 18.2 23.2 23.8 17.7
Source: Labour Force Surveys, 2010-11
Table 2.8 highlights the informal sector employment trends regarding
occupation and gender. The informal sector absorbs the less educated, unskilled and
semi-skilled workforce by generating employment and income for them. The share of
crafts & related trade workers is about 31.1% which is highest.While, the share of
near-half comprises legislator/senior officials & managers and elementary (unskilled)
occupations is seen at 24.3 percent and 23.2 percent respectively. Services
workers/shop & market sales workers account for (8.7%) followed by plant/machine
operators & assemblers (6.0%). The technicians & associate professionals and
professionals account for 4.5% and 1.9 % respectively. The female workforce is
relatively involved at higher rate than male in craft and related trade activities.
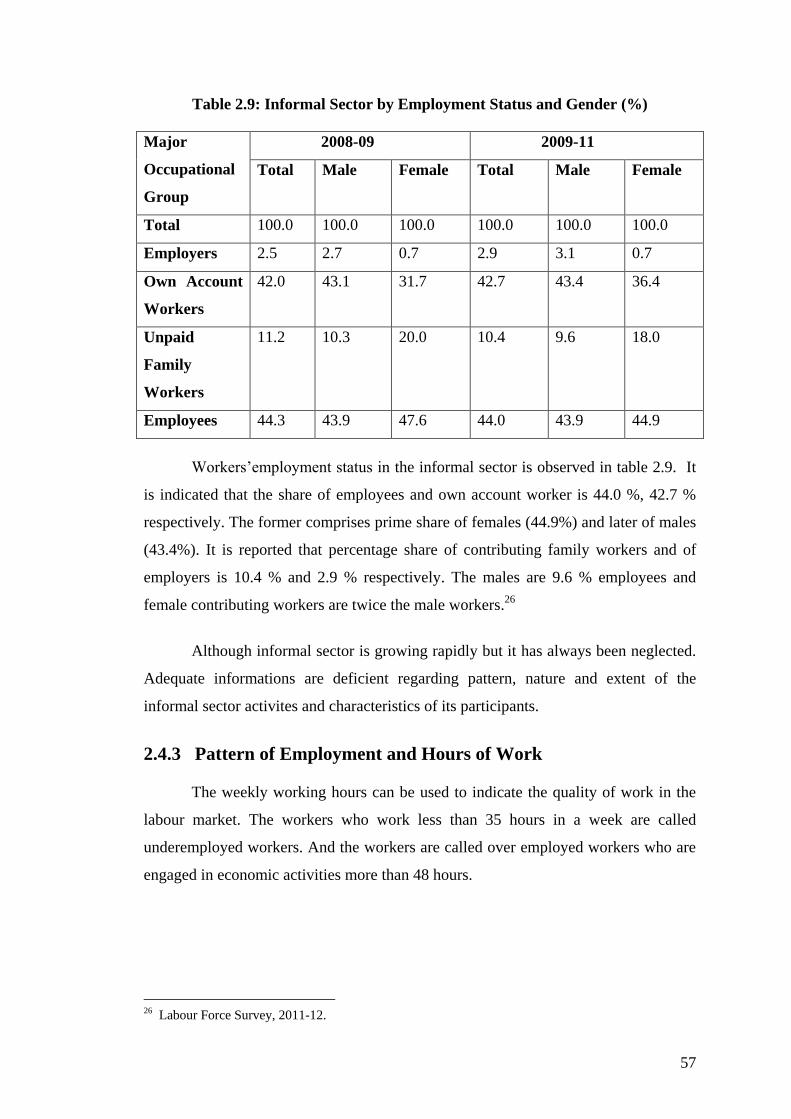
57
Table 2.9: Informal Sector by Employment Status and Gender (%)
Major
Occupational
Group
2008-09 2009-11
Total Male Female Total Male Female
Total 100.0 100.0 100.0 100.0 100.0 100.0
Employers 2.5 2.7 0.7 2.9 3.1 0.7
Own Account
Workers
42.0 43.1 31.7 42.7 43.4 36.4
Unpaid
Family
Workers
11.2 10.3 20.0 10.4 9.6 18.0
Employees 44.3 43.9 47.6 44.0 43.9 44.9
Workers‟employment status in the informal sector is observed in table 2.9. It
is indicated that the share of employees and own account worker is 44.0 %, 42.7 %
respectively. The former comprises prime share of females (44.9%) and later of males
(43.4%). It is reported that percentage share of contributing family workers and of
employers is 10.4 % and 2.9 % respectively. The males are 9.6 % employees and
female contributing workers are twice the male workers.26
Although informal sector is growing rapidly but it has always been neglected.
Adequate informations are deficient regarding pattern, nature and extent of the
informal sector activites and characteristics of its participants.
2.4.3 Pattern of Employment and Hours of Work
The weekly working hours can be used to indicate the quality of work in the
labour market. The workers who work less than 35 hours in a week are called
underemployed workers. And the workers are called over employed workers who are
engaged in economic activities more than 48 hours.
26 Labour Force Survey, 2011-12.

58
Table 2.10: Hours of Work by Region (%)
Hours Pakistan Urban Rural
Total 100.0 100.0 100.0
<15 1.6 0.7 2.0
15-24 5.4 2.2 6.8
25-34 7.4 4.2 8.7
35-41 20.4 13.6 23.3
42-48 24.5 29.1 22.5
49-55 11.6 12.7 11.1
56 hours
& above 28.4 36.8 24.9
Source: Labour Force Survey, 2010-11
The table 2.10 makes clear that there are 1.6 percent of participants working
less than 15 hours per week and 20.4 percent are found to be working between 35 to
41 hours. On the other hand, 24.5 percent of over employed are involved into work
activities about 48 hours (Labour Force Survey, 2010-11).
2.5 Unemployment Situation
Now we analyse the pattern and trends so far as unemployment. During year 2008-09,
it is estimated that there is 2.93 million unemployed labour forces in the country
which has increased up to 3.40 million in 2010-11(Labour Force Survey, 2011-12).
Table: 2.11 Unemployment in Million by Gender and Region
Years Pakistan Urban Rural
Total Male Female Total Male Female Total Male Female
2008-09 2.93 1.87 1.06 1.17 0.81 0.36 1.76 1.06 0.70
2009-10 3.12 1.91 1.21 1.23 0.79 0.44 1.89 1.12 0.77
2010-11 3.40 2.22 1.18 1.55 1.08 0.47 1.85 1.14 0.71
Table 2.11 indicates that unemployment rate increases gradually in urban as well as in
rural areas in the economy. The unemployment rate among males has increased too

59
over the last three years. However, it indicates significant drop for female rates in year
2010-11. The change for males is comparatively higher than the females.
2.6 Urbanization, Migration and Pakistan Economy
Urbanization is peculiar feature of mega cities and their crucial functionality
can be considered also. Most of the cities are observed as post-industrial production
sites for the leading-industries of present time, finance and specialized services. They
have become national or transnational market places where firms and governments
can purchase financial instruments and specialized services. In this way, they perform
pivotal role for the coordination, control and service of global capital.
Pakistan‟s urban population experienced an expansion over seven-fold which
led to enhanced total population over four-fold. The remarkable changes in social
sector consequently increased the rate of urbanization and the emergence of mega-
cities. Pakistan is seen as mainly urbanized nation in South Asia as city dwellers
account for 36 % of its population (2008). There is a small urbanization rate of 3 %
during 2005-10. The highest urbanization rate is noticed during industrialization
process and in formative years of Pakistan as urban population availed enough
opportunities till even eighties.
The urbanization rate is expected to boost up further because of natural
impetus of past high growth rates. It is also observed that more than half of total urban
population lives in eight urban areas such as Karachi, Lahore, Faisalabad, Rawalpindi,
Multan, Hyderabad, Gujranwala and Peshawar in 2005 in Pakistan. These cities grew
around 3 percent per year during 2000 to 2005. It is further expected that the growth
rates of these cities will exceed in the next decade.
There is a positive association between proportion of migrants and degree of
populous-ness and hence, provinces make a downward sequence of Punjab with
65.8%, Sindh with 24.8%; KPK with 9.0% and Balochistan with 0.4%. Migration
recedes in all provinces but Sindh is an exception in this regard. Moreover, male
migrants are observed in great proportion in all provinces except in Punjab in
coallation with proportion of females (Labour Force Survey, 2011-12).
60
A positive link between Interprovincial migration and level of urbanization is
observed but in decreasing order of Sindh 44.9 %, Punjab 35.0 %, KPK 19.5 % and
Balochistan 0.6 %. Interprovincial migration also decreased except in Sindh. Similar
gender disaggregated proportions are found. The female migrants are proportionally
higher in all provinces except in KP as compared to proportion of male workers. The
positive correlation is seen in the proportion of intra provincial migrants and the
degree of populous-ness. Provinces form expected series in order of Punjab with
74.2%, Sindh with 19.4%, KPK with 6.1% and Balochistan with 0.3% are similar for
both genders. Interprovincial migration recedes in all provinces except in Sindh.
Male migrants are higher in percentage as compared to female migrants in all
provinces except in Punjab (Labour Force Survey, 2011-12).
2.7 Poverty and Measures
Mitigating poverty has been at the top of the agenda of policy makers in most
of the developing economies. The poverty alleviation as one of the major aims of the
millennium development goals was planned by International organizations like the
United Nations Development Programme (UNDP).27
The way wherein people participate in the labour market is key to urban
poverty dynamics. The non-poor get job in the formal employment, whereas chronic
poverty is related with casual labour or with the business activities of the female
workers. Informal work is a mixed blessing dependent on content which offers an
escape inevitably clear that more chances translate into improved working conditions
or remuneration for the poor (Grant, 2008).
Urban poverty is witnessed in Pakistan and as somewhere else in the Third
World, it is probable to increase. The challenge for poverty predictors and policy
makers, thus, is to recognize and make perceptible urban poverty which is frequently
disguised and problematic to identify. To identify urban poverty magnificently, it is
required to recognize poverty in diverse ways, within the services and interstices of
Pakistan‟s fast growing towns, its metropolitan cities and within low income
settlements themselves (see Beall, 1997).
27 see World Bank, 2008

61
The relationship between poverty and growth is not unambiguous in the
context of Pakistan. A high growth did not result in substantial decrease in poverty in
the 1960s. However, incidence of consumption based poverty diminished despite low
growth in the 1970s. A high growth was observed in 1980s and early 2000s which
reduced poverty, which suppoted the poverty-growth nexus.
The official poverty line is calorie based in Pakistan. It is defined as per capita
food and non-food expenditure per month in order to support food consumption which
yields 2,350 calories per adult equivalent per day. The official poverty line was set at
673.54 in Pakistani rupees in 1998/99. Based on this definition of poverty line, the
head count (proportion of people below the poverty line) was 26.1 percent in 1990-91,
the benchmark year for the MDGs. Meanwhie the universal target of halving the
poverty rate by 2015, Pakistan made the goal for 13 percent reduction in absolute
poverty. The evidence indicated that absolute poverty tended to increase to 34.5
percent in the 1990s, and diminished thereafter to 12.4 percent by 2010/11.28
2.8 Women and Urban Informal Sector
Women are dominant among rural-urban migrants and may well consist of the
bulk of the urban population in some regions of the world. A rising number of
women in Latin America, Asia and Africa migrate in search of opportunities. Some of
the migrant women get formal sector jobs while others are forced to work in the
informal sector where they work temporarily with out getting social security benefits.
The single female migrants have also contributed to the increased proportion of urban
household headed by women who become poorer, face constricted resource
constraints, and have relatively high fertility rates. The changing composition of flows
of migration has imperative economic and demographic implications for a lot of urban
areas of the developing world.
Because of the female-headed households are usually bound to work in low-
productivity informal-sector employment and have to face higher dependency
burdens, this makes them more poor and malnourished and they access low formal
28 see Pakistan Millennium Development Goals Report (2013).

62
education, health care or clean water and sanitation, frequently remaining effectively
excluded from government services.
Many women involve themselves in small business ventures or
microenterprises that have need of slight or no initial capital and frequently involve
the marketing of homemade foodstuffs and handicrafts. Nevertheless, women‟s
limited access to capital results in high rates of return on their very small investments,
the extremely low capital labor ratios restrict women to low-productivity activities
(Todaro and Smith, 2012).
2.9 Concept of Development
In pure economic terms, development generally means capacity of a national
economy, whose initial economic condition has been more or less unchanged for a
long time, to generate and maintain an annual increase in its gross national income
(GNI) at rates of 5% to 7% or more. A common alternative economic index of
development has been the use of rates of growth of income per capita by considering
national ability to expand its output at a faster rate than population growth. Levels and
rates of growth of “real” per capita GNI (monetary growth of GNI per capita minus
the rate of inflation) can be used to measure the overall economic well-being of a
population.
In the past, economic development has also been seen in the ways of alteration
of the structure of production and employment. So the development strategies have
been focused on rapid industrialization, at the expense of agriculture and rural
development. With few exceptions, development was nearly always seen as an
economic phenomenon in which rapid gains in overall and per capital GNI growth
would either“trickle down” to the public in the form of jobs and other economic
opportunities or create the necessary conditions to distribute the economic and social
benefits of growth at a wider scale. Problems of poverty, discrimination, and
unemployment and income distribution were less important than “getting the growth
job done” (Todaro and Smith, 2012).
As in 1950s and 1960s, many developing nations did reach their economic
growth targets but the levels of living of the majority were unchanged. This indicates

63
that something was very wrong while defining the development in this traditional
way. In 1970s economic development was redefined in terms of reduction of poverty,
inequality, and unemployment within the context of a growing economy.
Additionally, “Redistribution from growth” became a common signal.29
Development must be conceived as a multidimensional process, which
involves major changes in social structures and national institutions, as well as the
acceleration of economic growth, reduction of inequality, and poverty. In short,
development must show the whole gamut of change by which an entire within that
social system, moves beyond a condition of life which is widely perceived as
unsatisfactory toward a situation which can be better regarded materially and
spiritually (see Todaro and Smith, 2012).
2.9.1 Three Core Values of Development
The main values such as sustenance, self-esteem, and freedom represent
common goals sought by all individuals and societies. They associate with basic
human needs that are found in almost all societies and cultures at all times. These core
values are examined below.30
Sustenance: The Ability to Meet Basic Needs
Evey one has basic needs for life and existence. These lives sustaining basic human
needs include food, shelter, health, and protection. When any of these is absent or in
short supply, a condition of “absolute underdevelopment” exits. A basic function of
all economic activity, therefore of “absolute underdevelopment” exists. A basic
function of all economic activity is to provide people with the means of
overwhelming the helplessness and misery arising from a lack of food, shelter, health
and protection. In this way, economic development is viewed as a necessary condition
for the improvement in the quality of life that is development. The realization of
human potential would not be possible at both (individual and societal level) with-out
the sustained and continuous economic growth.
29 see Todaro and Smith (2012). 30 see in Goulet, Cruel Choice, 1971.
64
Self-Esteem: To Be a Person
A second universal component of the good life is self-esteem which means a sense of
worth and self-respect. In which a person can not be used by others for their own
interests. All people and societies are in search of some basic form of self-esteem. It
can be given the names of authenticity, identity, dignity, respect, honor, or
recognition. The nature and form of this self-esteem may differ from one society to
anothers and from one culture to another.
Freedom from Servitude: To Be Able to Choose
A third and final value is to constitute the meaning of development is the concept of
human freedom. Freedom comprises an expanded variety of choices for societies and
their members together with a minimization of external constraints in the pursuit of
some social goal we call development.
2.9.2 The Objectives of Development
Development is not just a physical reality but also a state of mind in which society has
got the means to obtain better life, through social, economic, and institutional
processes. Whatever are special components of this better life, development in all
societies must possess these objectives:
1. To enhance the accessibility and widen the distribution of basic life sustaining
goods such as food, shelter, health, and protection.
2. To improve living standards with higher incomes, more access to jobs, better
education, and larger concentration on cultural and human values, all these
will provide enhanced material well-being along with greater self-esteem at
individual and national level.
3. To increase economic and social range available to the people and nations.
They should be at liberty from miseries; illiteracy, servitude, dependence and
narrow-mindedness etc not only in relation to other people but also to other
nations (see Todaro and Smith, 2012).

65
2.10 Basic Indicators of Development
The fundamental indictors of three facets of development are real income per
capita used for purchasing power; health which is gauged by life expectancy,
undernourishment, and child mortality, and educational attainment as evaluated by
literacy and schooling (see Todaro and Smith, 2012).
2.10.1 Human Indicators and Development
Human Capital and Development
Human capital has been defined in indifferent ways. As a broad concept, it is
recognized in form of obtainable human characteristics which enhance income. It
generally takes in people‟s knowledge and skills, obtained to some extent through
education along with their strength and vitality, based on their health and nutrition.
Human capital theory views health and education as available inputs for economic
production (Appleton and Teal, 1998).
The concept of human capital comprises knowledge, skills, attitudes, physical
and managerial effort which are needed to maneover capital, technology, and land
among other things, to produce goods and services for human consumption (UNECA,
1990). Human resource development is concerned with double objective of skills
building and provision of productive employment for non-utilized or underutilized
manpower. Equally the above mentioned objectives stem from investment in man in
the form of education and training that plays the role of institutional mechanisms in
order to improve people‟s knowledge, skills and capabilities (see Meire, 1970).
Health care, of course, is greatly related to such other types of basic needs
satisfaction i.e. adequate shelter, water supply and sanitation: however it has its own
contribution to make because, over all, it deals with person at the individual level (see
Ebrahim, 1984). A good health enhances the economic and social development of a
country. Thus, it is requisite to highlight the issue of health status of the people by a
various policies which must consist on short and long term actions to secure better
health outcomes (Pakistan Economic survey, 2011-12).

66
Both the health and education are closely associated in economic
development. From one point of view, greater health capital may increase the return
to investment in education, partly because health is a vital factor in school attendance
and in the formal learning process of a child. A longer life enhances the return to
investments in education; better health during working life may lower the rate of
depreciation of educational capital. From another point of view, high human capital
may increase the return to investments in health since many health programs
regarding health depend on elementary abilities frequently educated at school,
personal health and sanitation are included, not to mention basic literacy and
numeracy; education is also required for the formation and training of health
personnel. An improved productivity of efficiency due to spending on education
increased the return on a life saving investment in health (see Todaro and Smith,
2012).
Education is generally regarded as a key investment in human resources.
Education can be helpful to improve the learners‟ quality of life. The education can
improve too the individuals‟ skills and efficiency to produce useful things (see
Machlup, 1982).
The primary objective of government policy has been to improve the level and
quality of education by increasing enrolements at faster rate than population growth in
the last few years in Pakistan but it has been observed that literacy and primary
schools enrolment rates in Pakistan have shown improvement. Scarcity of resources,
deficient provision of facilities and training are the primary obstacles in imparting and
expanding education (see Mehmood, 1999).
There has been gradually growing educational facilities in Pakistan economy
overtime. A continuing inafficiency and low investment on education lead to low rate
of improvement in educational indicators. The estimated 39 % of population is (50
percent for males and 27 percent for females was the literacy rate, in 1996-97), still
behind most of the regional countries, especially when females‟ education is separated
(see Mehmood, 1999).
It becomes indispensable to evaluate a nation‟s average health and educational
attainments, which imitate core capabilities. Good health positively contributes in

67
economic and social development at country level. The people of Pakistan have
experienced an improved health over the past three decades. The vision of health
sector is based on healthy population having good health, enjoying better life quality
with healthy living standard. The improved measures are adopted to prevent deseases,
promote health, greater coverage of immunization, family planning, and female health
worker service availability to achieve this objective (Government of Pakistan
Economic Survey, 2011-12).
“Housing” is as multifaceted issue as the societies it works. Per capita income,
its distribution and housing prices set up the amount of housing that family can afford.
The urban growth rate makes the housing problems stronger due to city size. In
developing countries, a large number of cities have been grown faster and such
growth rate is expected to increase further at faster rate (Yeh, 1984).
A high natural population growth rate and growing urbanization coupled with
constrained availability of resources caused a sharp deterioration in the quality of life
gauged by indicator in the urban areas where resources were allocated for the
development of physical and social infrastructure.31
The potable water in its regular supply (basic need of mankind) is essential for
survival. Several health benefits can be achieved and living standards can be
improved by availiabiliy of quantities of water greater than the minimum amount to
maintain life. The secure and convenient sources of clean water will reduce mortality
and morbidity. The poor people of urban areas of developing countries experience
scarce supply of water due to lack of sources to provide the facility and information to
diminish the effects of unhygienic conditions (Kirke and Arthur, 1984).
In developing countries, there is poor potable water supply that is associated
with health hazard and nearly all the fatal diseases among the children.32
Mainly
observed deseaes are water borne in Pakistan. The estimates show that 60 percent of
the infants died caused by infectious and parasitic diseases, nearly all are water-borne.
This shows that drinkable water supply and sewerage facilities would affect
31 see Banuri, Kemal, and Mumtaz, (1997). 32 Study by Ahmad and Abdul Sattar (2007).

68
favourably the death services in Pakistan.33
Health improvement is an essential
ingredient of socio-economic development. The healthy people prove relatively more
productive as compared to unhealthy people (see Blomquist, 1986).
2.10.2 Education and Employment Situation
Education and training are important in employment creation and income generation
in economy of Pakistan. In this way, the technical and vocational competence of
workforce along with its productivity is required to enhance to meet up the emerging
world‟s challenges. As almost workforce without training and semi-skilled felt
reluctance to take value added production assignments due to the negligence on
supply side issues (Labour Force Survey, 2011-12).
Table 2.12: Education and Literacy by Gender of Working Age Population (%)
Education and Literacy 2009-10 2010-11
Total Male Female Total Male Female
No formal Education 0.5 0.6 0.5 0.4 0.4 0.4
Below Metric 37.5 44.9 29.5 38.0 45.4 30.0
Matric But Less than
Intermediate
10.7 13.1 8.0 10.8 13.2 8.4
Intermediate But Less
than Degree
4.7 5.6 3.8 4.8 5.7 3.9
Degree and Above 4.3 5.3 3.4 4.5 5.5 3.4
Literate 57.7 69.5 45.2 58.5 70.2 46.3
Illiterate 42.3 30.5 54.8 41.5 29.8 53.9
Total 100.0 100.0 100.0 100.0 100.0 100.0
Source: Labour Force Survey, 2010-11
The table 2.12 highlights the level of education and rate of literacy
percentages by gender of working population for the duration of 2010-11. It is
noticed that the current labour force largely has skills indicated by higher educational
terms. The level of literacy is observed as low as 57.7 percent. The estimates indicate
that under matric are 38 percent, 11 percent have passed matriculation and 5 percent
33 see Human Development Report, 1996.
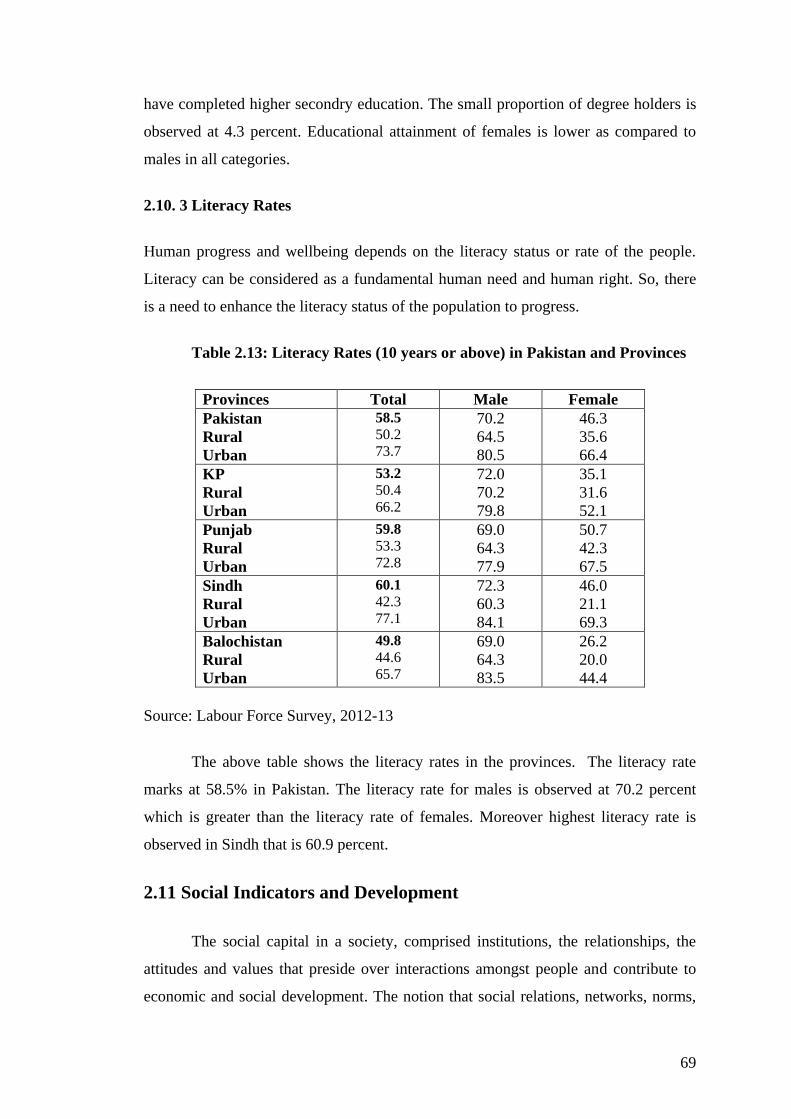
69
have completed higher secondry education. The small proportion of degree holders is
observed at 4.3 percent. Educational attainment of females is lower as compared to
males in all categories.
2.10. 3 Literacy Rates
Human progress and wellbeing depends on the literacy status or rate of the people.
Literacy can be considered as a fundamental human need and human right. So, there
is a need to enhance the literacy status of the population to progress.
Table 2.13: Literacy Rates (10 years or above) in Pakistan and Provinces
Provinces Total Male Female
Pakistan
Rural
Urban
58.5
50.2
73.7
70.2
64.5
80.5
46.3
35.6
66.4
KP
Rural
Urban
53.2
50.4
66.2
72.0
70.2
79.8
35.1
31.6
52.1
Punjab
Rural
Urban
59.8
53.3
72.8
69.0
64.3
77.9
50.7
42.3
67.5
Sindh
Rural
Urban
60.1
42.3
77.1
72.3
60.3
84.1
46.0
21.1
69.3
Balochistan
Rural
Urban
49.8
44.6
65.7
69.0
64.3
83.5
26.2
20.0
44.4
Source: Labour Force Survey, 2012-13
The above table shows the literacy rates in the provinces. The literacy rate
marks at 58.5% in Pakistan. The literacy rate for males is observed at 70.2 percent
which is greater than the literacy rate of females. Moreover highest literacy rate is
observed in Sindh that is 60.9 percent.
2.11 Social Indicators and Development
The social capital in a society, comprised institutions, the relationships, the
attitudes and values that preside over interactions amongst people and contribute to
economic and social development. The notion that social relations, networks, norms,

70
and values have an important issue in performance as development of society has long
been there in economics, sociology, anthropology, and political science literature.
However, the idea of social capital been put forth as a unifying concept having these
multidisciplinary views only in past 10 years (see Grootaert and Bastelaer, 2001)
Coleman (1990) explained the social capital as a variety of different entities all
of which comprised on some aspect of social structure, and which facilitated specific
actions of actors; whether they are personal or corporate actors. This definition
implicitly viewed the relations amongst the groups, rather than individuals. This
definition enlarged the concept of social capital by including both the associations
(i.e. vertical as well as horizontal) and behavior within and among other entities, such
as firms.
Social capital comprises the stock of active connections amongst people, the
trust, mutual understanding, and shared values and behaviors that connect members of
human networks and communities and make cooperative action possible. Social
capital makes any organization or any cooperative group, more than a collection of
individual‟s intent on achieving their own private purposes (see Cohen and Prusak,
2001).
2.12 Concluding Remarks
In this chapter, we have made an overview of the urban informal sector, keeping in
view the importance of informal sector in Pakistan economy. The urban informal
sector plays an important role in employment creation and in income generation. It is
noticed that the share of urban labour force engaged in the informal activities has also
increased gradually. The performance of Pakistan‟s economy is viewed in different
sectors regarding informal sector since 50s till present. The study further discussed all
the economic, human and social indictors and their performance in the economic
growth and development over the period of time. Evidence indicates that gradually
and constantly, Pakistan has shown an improved performane since the sixties in terms
of macroeconomic indicators. The GDP growth rate, which indicates an overall
economic activity, has increased significantly. The CPI has decreased, and investment
has increased during the years.
71
Moreover, the share of informal sector accounts for above seventy percent of
non-agricultural employment and its share is comparatively higher in rural areas than
urban areas in Pakistan. The impact of urban informal sector on the economic, human
and social development has been explained.

72
Chapter 3
THEORETICAL FRAMEWORK
3.1 Introduction
The decision to do work is ultimately a decision to utilize time in different
ways. One way in which people utlize their available time is pleasureable leisure
activities. On the other hand, people allocate their time more efficiently to work
related activities, most importantly household production. Alternatively, people have
the possibility to work for pay and can utilize their income for purchaseable
necessities (Ehrenberg and Smith, 1994). For maximum fulfillment of wants, the
efficient resource allocation is reqired. Hence, the efficient allocation of labour is
essential for economic development.
The supply of labour is typically defined as an amount of effort offered by a
given size population. In return, this amount is conveniently decomposed into four
factors: (1) the perecentage of population engaged in or seeking gainful employment,
usually called the labour force participation rate; (2) number of hours people are
agreeable to work per day, per week or per year while they are in the labour force; (3)
the effort that people make per hour a day while doing work; and (4) training and skill
levels that workers take to their jobs.34
The arrangement of the chapter is followed as: Section 3.2 discusses and
explains the conceptual framework related to employment and labour supply.
Theoretical framework of Neo-classical labour supply decision is evaluated in section
3.3. Section 3.4 describes the basic human capital theory. Section 3.5 elaborates the
theoretical approaches towards the urban informal sector. The last section 3.6 shows
the concluding remarks.
3.2 Conceptual Framework
A theoretical framework can be developed after problem definition,
completing a literature review and conducting field survey. Developing a good
34 see Berndt (1991)
73
theoretical framework is central to examine the problem under investigation and to
hypothesize and test certain relationships.
The study makes a detailed view of the concepts and issues which are
correlated to supply of labour and informal sector employment such as self-employed
(a person who during the reference period, engages in work activities for profit and
family gain, in cash and kind where the remuneration is directly dependent upon the
profit, the potential profits derived from the goods and services produced) without
getting assistance even from unpaid family members ; own account workers (a person
who is operating his or her own economic enterprise or involving independently in a
profession or trade, and without hiring employees). However, he or she may get
support by unpaid family workers; employers (a person who does work during the
reference period, on own-account or with the help of one or a few partners at a „self-
employment job‟ hiring one or above employees on a continuous basis); owner of
firms and unpaid family helper (a person performing without getting pay by an
economic enterprise being operated by his or her household or other related persons is
regarded as unpaid family member) and employee (a person who performs work to
get pay in kind from a public or private enterprise e.g casual wage worker and
domestic servants) (Labour Force Survey, 2005-06).
3.2.1 Labour Supply and Employment
The employment is defined as all persons who are 10 years old and over who
work minimum for one hour during the reference period and are either paid as
employees or self-employed. Permanent or regular employees who remain away from
work during the reference period, due to some reason but still receive their salary or
wages are also regognized as employed.35
The employed are defined as those individuals who worked for one hour or
more in order to earn wages or salary during the reference week or made use of their
energy for 15 hours or more of unpaid work in a family business or farm. Those
individuals, who did not work due to illness, inclement weather, or strikes and
lockouts are included too as employed but are incorporated in the separate sub-
category with a job but not work during work hours (see Brendt, 1991).
35 Labour Force Survey, 2011-2012.
74
3.3. The Neo-Classical Theory of Labour Supply Decision36
The study explains some theoretical model of labour supply management and
labour force participation developed by different economists. In this research, the
focus remained on growth of the informal sector and policy in urban areas of Southern
Punjab, Pakistan. We examine the individual‟s participation decision and the hours
supplied by the individual, given that participation. In this framework, the further
extensions are made to encompass the household rather than the individual as a
decision unit. Basic human capital theory and approaches to urban informal sector are
also explained.
3.3.1 Neo-Classical Individual Labour Supply37
Neo-Classical theory is an application of theory of consumer behavior. The
assumption is that individuals allocate time to market work and non-marketable
activities (leisure). Maximum utility is achieved by choosing a combination of goods
and leisure hours subject to time, price and income constraints.38
One dimension of labour supply is labour force participation (to be employed
or unemployed) where individuals have options whether to work for leisure or not?
An individual‟s priorities regarding making such decisions are determined by a two
pronged differentiable utility function U = F (Y, L), that depict the utility (U) which is
obtained from consuming alternative quantities of goods (Y) and leisure (L). It is
considered positive both the marginal utilities of Y and of L (MUY ≡ ∂U/∂Y and MUL
≡ ∂dU/dL), and the utility function is concave in Y and L, which implies that ∂2 U /
∂Y2, ∂
2 U / ∂ L
2 < 0, and ∂
2 U / ∂ Y ∂ L > 0.
Same satisfaction level is generated along with an indifference curve by
alternative combination of both L and Y. In Fig. 1.1, four indifference curves showing
greater levels of utility are drawn, I0, I1, I2, and I3. The slope as an important property
of indifference curve is derived in the following. The total differential of the utility
function U (Y, L) is
36 see Berndt (1991) 37 see Berndt (1991) 38 see H.Gregg Lewis (1975) in which labour supply model is presented.
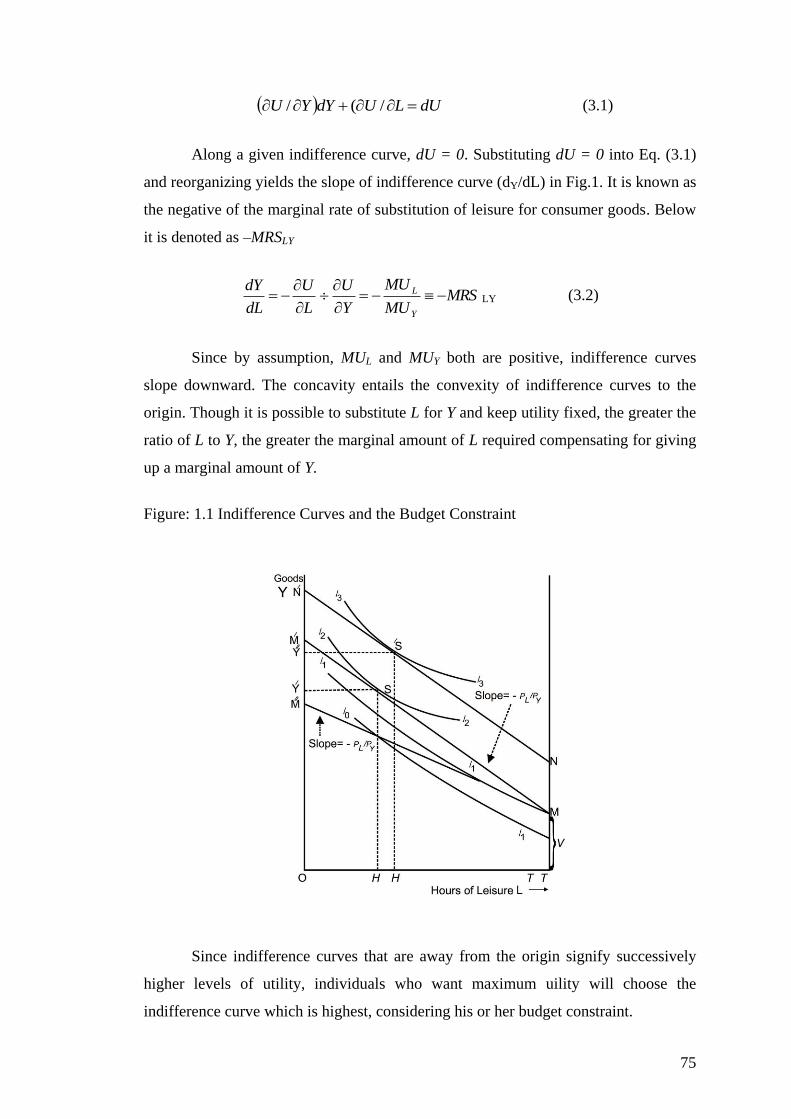
75
dULUdYYU /(/ (3.1)
Along a given indifference curve, dU = 0. Substituting dU = 0 into Eq. (3.1)
and reorganizing yields the slope of indifference curve (dY/dL) in Fig.1. It is known as
the negative of the marginal rate of substitution of leisure for consumer goods. Below
it is denoted as –MRSLY
MRSMU
MU
Y
U
L
U
dL
dY
Y
L
LY (3.2)
Since by assumption, MUL and MUY both are positive, indifference curves
slope downward. The concavity entails the convexity of indifference curves to the
origin. Though it is possible to substitute L for Y and keep utility fixed, the greater the
ratio of L to Y, the greater the marginal amount of L required compensating for giving
up a marginal amount of Y.
Figure: 1.1 Indifference Curves and the Budget Constraint
Since indifference curves that are away from the origin signify successively
higher levels of utility, individuals who want maximum uility will choose the
indifference curve which is highest, considering his or her budget constraint.

76
Prices, non-labour income, and time are the primary three factors that
influence the budget constarint. First, if the unit price of goods be PY, and the
exogenous and constant wage rate be PL, then the individual‟s real wage is PL/ PY.
Second, the individual‟s nonlabour or property income is shown as Q; in case of
consumption goods the real amount of nonlabour income is Q/PY. Third, leisure
(nonmarket) hours L plus hours which is dedicated to market work H must exhaust T,
that is, L+H = T. Further, labour income equals the product PLH, and the real labour
income forgone by choosing one more unit of leisure as an alternate for working
equals PL/PY.
If individual is assumed to spend all of his or her available income, the above
three factors imply the budget constraint
YPQLTPQHPI YLL )( (3.3)
In the equation above, sum of labour and non-labour income is represented by
I, the total money income. There are two ways to write Equation (3.3). As the notion
is that an individual spends his or her full income „C‟ on goods and leisure, Gary
Becker [1965] has included PLL in the both side of Eq. (3.3), obtaining
QTPLPYPYPLPIC LLYYL (3.4)
This formulation indicates that full income budget constraint is comprised of
total amount of available time, T, which is evaluated at the constant wage rate PL plus
non-labour income Q. This full income C is then totally consumed on leisure (PLL)
and on goods (PY Y).
On the other hand, to facilitate graphical analysis, Eq. (3.3) is rewritten in
terms of real income,
LPY
P
Py
QT
P
Py L
y
L ..
(3.5)
When Eq. (3.5) is graphed as in Fig. 1.1, the budget line (MM) which
represents the income constraint, with intercept equal to [(PL/PY). T + Q/PY] and slope
equal to - (PL/PY). Note that even if L = T (while all time is devoted towards leisure),
77
the budget line M'M does not cross the horizontal axis unless nonlabour income Q is
zero.
Utility maximization subject to the budget constraint Eq. (3.5) involves
choosing the set of Y and L that is feasible (on budget line) and is on the highest
indifference curve that touches the budget line M'M. This point is at S, where the
slope of the indifference curve I2 (-MRSLY) equals the slope of the budget line – PL/PY
in Figure.1.1. It is possible for the individual to purchase goods OY', to choose leisure
OH', and the supplies hours of labour H'T to the market at this point.
More formally, the individual obtains solution of his or her maximization
problem by maximizing U = F (Y, L) subject to the budget constraint PYY = PL (T-L)
+ Q. However, the Lagrangian function is applied here
])([),( QLTPYPLYU LY (3.6)
We take first partial derivatives of Ψ with respect to Y and L, set them equal to
zero, and then solve. This yield,
Y
L
LY
Y
L
P
PMRS
MU
MU
YU
LU
/
/ (3.7)
It is shown in Eq. (3.7) that utility is maximized at the point where, MRSLY
(the negative of which, by Eq. (3.2), is equal to the slope of the indifference curve)
and the real wage rate PL/PY (the negative of which, by Eq. (3.5), equals the slope of
the budget line M'M).Collectively they are equal.
Fig. 1.1 indicates that the individual is allowed to maximize his or her utility
at an interior solution S where L < T and H > 0, that, where the individual participates
in the labour force with non-zero H. The case that is mentioned above is critical to
understand the decision of labour force participation. Assume that individual would
earn the lower wage rate by working in market with some non-labur income Q and
preferences as before, he now faces budget constraint PY Y = PL' (T-L) + Q, which is
drawn in Fig.1.1 as the flatter budget line M''M . The individual could attain highest
indifference curve, I1, by showing his or her preferences and the budget constraint
M''M. At point M, the indifference curve I1 touches the budget line MM, where L = T
78
and H = 0, such point shows less partaking of individuals in the labour force by
spending all of his or her time in leisure (nonmarket activities). The individuals are
unable to attain merely any higher indifference curve with such preferences and
budget constraints.
Point M shows a corner solution to the individual‟s utility maximization
problem rather than an interior solution. Note, particularly the slope of the
indifference curve is steeper than that of the budget line, indicating that MRSLY >
PL/PY at the corner solution M, rather than Eq. (3.7) holding, where MRSLY = PL/PY.
This suggest that decision of labour force participation can be seen simply as
complying to whether the individual‟s has any utility maximization problem, given
budget constraints, yields a corner solution or an interior solution. In particular, if at
the solution point, MRSLY = PL/PY, then H > 0 and L < T- an interior solution occurs
and if instead at the solution point, MRSLY > PL/PY, then H= 0 and L= T- a corner
solution is being obtained.
Neo-Classical framework of labour supply puts forward that individual‟s act
rationally for maximization of their utility by willingly opting for jobs administered
by the basic condition that market wage rate exceeds reservation wage. The
reservation wage is actually the amount of extra earnings the individual would be
provided to give up one unit of leisure, the maximum wage where he or she is
willingly to involve in employment, is denoted as w* and indicated by the slope of
indifference curve at point M. 39
Fig. 1.1 shows that the reservation wage w* is greater
than the market wage PL at budget line M''M that is, the extra satisfaction from an
hour of leisure is greater than the wage rate. However, if the wage rate rises then
budget line rotates upward from M''M to M'M, and then at certain point the wage rate
would surpass the reservation wage, which results in a positive labour force supply.
Hence, PL > w* indicates positive labour force participation condition.
A few important imlications of this economic theory of labour force
participaion are noteworthy. Firstly, for individuals having identical reservation
wages those who have higher (potential) wage rates are being participated more in the
39 This reservation wage notion is apparently due to Jacob Mincer (1963). Important extensions and
applications include those of Reuben Granau (1973b) and James Heckman (1974b); also see Gronau
(1986).
79
labour force. Secondly, for individuals having with identical potential wage rates
those with lower reservation wages are being participated more in the labour force. As
“workaholics” have lower reservation wages as compared to, say, avoid hobbyists,
given identical potential wage rates, workaholics are working more. Likewise, women
who have to tackle expensive daycare of their children are likely to have higher
reservation wages as compared to single, career-oriented women having no children;
other things being equal, we would expect the higher labour for participation rates in
the later case. It is noteworthy, that such difference in preferrences among individuals
is indicated by the shape and slope of their indifference curves. Additionally, the
shape of indifference curve may change for a given individual at different points
during his or her life cycle.
The above presented theoretical framework generalizes the cases in which
only several points for hours at work are obtainable to employees. Such situations
state the optimal corner solution i.e. the largest amount of working hours where
market wage exceeds or equals reservation wage.
The changes in non-labour income and in the wage rate affect labour supply.
Suppose that the individual faces an increase in non-labour income from TM to TC in
Fig. 1.1 with constant wage rate at PL and obtains new budget line which is N'N
parallel to the old budget line M'M. If we firstly discuss initial equilibrium at S, the
increased non-labour income makes possible the movement of utility maximizing
individual to a higher indifference curve, I3, tangent to the new budget line N'N at
point S'. This point shows the increases in hours of leisure consumed to OH'', the
decreases to H''T in amount of labour supplied, and increases the amount of goods
consumed upto OY''. The pure income effect is the result of outward movement from
S to S' and increases the L and Y due to increased non-labour income. However, pure
income effect on hours of labour supplied is negative which reflects the implicit
assumption i.e. leisure as a normal good.
When the individuals experience a change in wage rate, the response reflects
both income and substitution effects. Fig. 1.2 illustrates the initial equilibrium point S,
at which the I0 indifference curve is tangent to the original budget line M'M, which
shows OY units of goods and OH hours of leisure consumed and HT hours of labour
supplied. Now, there is an increase in wage rate while goods prices, preferences, and
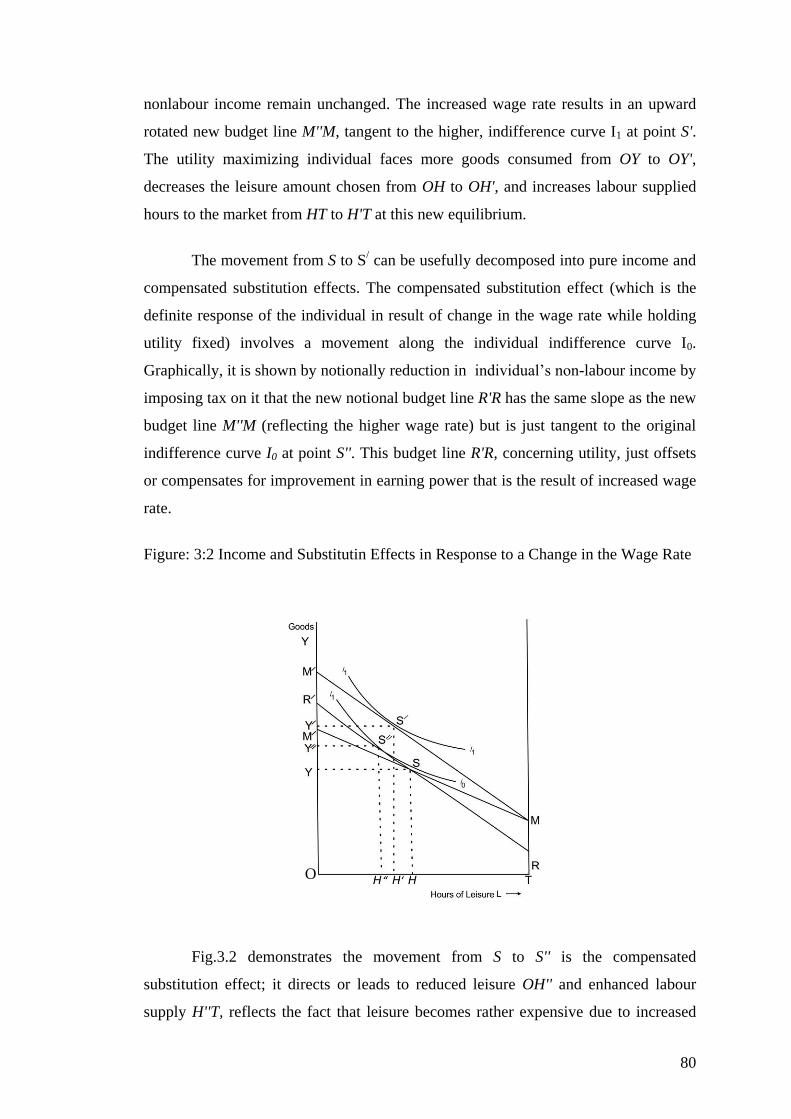
80
nonlabour income remain unchanged. The increased wage rate results in an upward
rotated new budget line M''M, tangent to the higher, indifference curve I1 at point S'.
The utility maximizing individual faces more goods consumed from OY to OY',
decreases the leisure amount chosen from OH to OH', and increases labour supplied
hours to the market from HT to H'T at this new equilibrium.
The movement from S to S/ can be usefully decomposed into pure income and
compensated substitution effects. The compensated substitution effect (which is the
definite response of the individual in result of change in the wage rate while holding
utility fixed) involves a movement along the individual indifference curve I0.
Graphically, it is shown by notionally reduction in individual‟s non-labour income by
imposing tax on it that the new notional budget line R'R has the same slope as the new
budget line M''M (reflecting the higher wage rate) but is just tangent to the original
indifference curve I0 at point S''. This budget line R'R, concerning utility, just offsets
or compensates for improvement in earning power that is the result of increased wage
rate.
Figure: 3:2 Income and Substitutin Effects in Response to a Change in the Wage Rate
Fig.3.2 demonstrates the movement from S to S'' is the compensated
substitution effect; it directs or leads to reduced leisure OH'' and enhanced labour
supply H''T, reflects the fact that leisure becomes rather expensive due to increased
O

81
wage rate. By isolating this compensated substitution effect, the pure income effect
(without changing the prices) is the residual movement from S'' to S', with addition
leisure from OH'' to OH' and supplied labour to the market falling from H''T to H'T.
Incidentally, the (nomenclature) can be confusing, it is noteworthy that the total
movement from S to S' due to a rise in wage rate is called the uncompensated or gross
substitution effect in copious literature. Hence, the summation of compensated
substitution effect and pure income effect is uncompensated or gross substitution
effect.
The above graphical analysis shows that an increase in the wage rate leads the
utility-maximizing individual to respond in two different ways. Firstly, the
uncompensated substitution effect results in more labour supply and less leisure.
Secondly, pure income effect indicates a reduction of labour supply and more leisure.
Figure 1.2 shows that a positive compensated substitution effect on labour supply lags
behind the negative pure income effect.
Two notable remarks are as follows. First, it is assumed in the above analysis
of income and substitution effects, interior solutions occur before and after increase in
wage rate, that is, it is conditional for positive labour force participation. Although it
is not indicated here, it can be demonstrated if the original solution becomes corner
one with no participation, then a sufficiently large wage increases, ceteris paribus,
could result in positive labour force participation, and reduction in nonlabour income,
ceteris paribus. Thus, participation decisions can also be evaluated for income and
substitution effects.
The way we write the gross, compensated substitution and pure income effects
of change in wage rate are in terms of calculus and in elasticity form 40
and this results
in the well-known Slutsky equation predominantly,
I
HH
P
H
P
H
UUL
gross
L
. (3.8)
40 Follow the theory of consumer demand as, for example, in R.G.D Allen (1938) and Angus Deaton
and John M. Muellbauer (1980).
82
Where, I am money income. The first term on the right-hand side of Eq. (3.8)
is the compensated substitution effect by holding the utility constant, and the second
term indicates the pure income effect. If one multiplies the complete expression in Eq.
(3.1) by PL/H and then multiplies and divides the income effect by I, so Slutsky
relation is obtained in elasticity form,
H
I
I
H
I
HP
H
P
P
H
H
PL
P
H L
UU
L
L
gross
L
....
(3.9)
It can be rewritten as
IHL
c
L
g SLHPHP .. (3.10)
Where SL is the share of labour in total money income and where the g and c
subscripts on substitution elasticities to gross and compensated changes,
correspondingly.41
The Neo-Classical analysis predicts that labour force status of an individual is
therefore determined in a two stage process. Firstly, an individual decides whether or
not to supply labour to the market or not. Secondly, whether he is employed or not, it
is assured by a combination of factors including labour demand (employers
preferences, skills, experience, education, marital status and sex), incentives to look
for employment rapidly and to accecpt any job opportunities. The theory has also its
drawbacks; it does not take into account the family members‟ interdependence and
their decision-making that it doesn‟t succeed or fail to promote constructivity (Van de
Brink, 1994).
3.3.2 Household Labour Supply42
In fact, generally, decision of labour supply is taken in the context of the
decision made by other household or family members. Killings-worth (1983) made a
distinction among three approaches that connect family membership to supply of
labour.
41 The expressions in Eqs (3.8)-(3.10) implicitly assume that interior solutions occur both before and
after the small change in PL. 42 see Berndt (1991).

83
It is assumed in male chauvinist model that wife takes into account her
husband‟s earnings in form of property or nonlabour income while taking labour
supply decisions, however the husband decides to supply his labour exclusively just
taking into account his own wage and actual non-labour income of family.43
The
property income is assumed to incorporate both incomes (labour and non-labour
income) of the husband. In second approach it is assumed that the existence of a
family or household aggregates utility function U = U (Y, L1, L2, -----, Ln), where Li is
the leisure which the ith individual of family consumes. This is the family utility
function and is maximized subject to a family budget constraint.44
In labour supply analysis, family utility approach has become familiar due to
fact that various renowned comparative statics are the consequences of framework of
individual utility maximization goes with little adaptation. The family utility function
approach shows four substitution effects (the response of labour supply of the ith
family member to a change in his or her own wage rate), but two cross-substitution
effects also occur, that involve the ith family member‟s labour supply response due to
a change in the jth family member‟s wage rate and vice versa.
Within the existence of aggregate family utility function, the compensated
cross-substitution effect of a change in the ith individual‟s wage rate on the member‟s
labour supply must be same as the effect of the jth member‟s wage rate on the ith
member‟s labour supply. Moreover, though these effects must be equal in magnitude,
and yet their signs can be either positive (indicative of substitutability) or negative
(complimentarily). However, because the pure income effects on the two family
members need not be the same, the gross (uncompensated) cross-substitution effects
necessarily are not equal. Hence the gross effect of a change in the wife‟s wage rate
on the husband‟s labour supply is not equal to the gross effect of a change in the
husband‟s wage rate on the wife‟s labour supply.
43 This choice of nomenclature is somewhat unfortunate, since while chauvinism is clearly undesirable,
this particular model might or might not be a reasonable description of household decision making. 44 For example the use of the male chauvinist model, see, among others, Bowen and Fineagan (1965,
1969) and Hausman (1981a).

84
The detailed view of a special case of the family utility function framework
was made by authors.45
It occurs when the compensated cross-substitution effects
equal zero for all members in the family. Such an illustration notifies change in the ith
member‟s wage rate which entails a pure income effect on the labour supply of the jth
individual. This signifies that the labour supply function of the jth family member
depends on his or her wage rate and on the sum of labour and non-labour income of
all other family members.46
The family utility function approach is commonly used in studies empirically
done on labour supply because of its analytical easiness. It is note worthy, yet, there
are numeral drawbacks in this framework. Since the aggregate utility function entails
that the family derives utility from consumption collectively, the distribution of goods
consumption does not matter, while this might make sense for family “public goods”.
Furthermore, the approach to family utility function is silent as to the process that
really makes an aggregate utility function in which all members of family are agreed
equally.
Marital status is considered important one in household labour supply models.
In this context, Gary Becker (1974, 1981, and 1988) makes an effort to endognize the
marital status, consumption, and the labour supply decisions of individuals jointly in
his latest work, but, at this level, the author has not developed a model which was
fully empirically implementable.
3.4 The Basic Theory of Human Capital
The human capital theory is a dominant economic theory of wage
determination. The theory was developed by Jocob Mincer (1957, 1958, and 1962),
Theodore Schultz (1960, 1961), Gary Becker (1962, 1964) and Blauge (1969). The
human capital theory in framework of neo-classicals concentrates that individuals
make investment by spending on education and training in order to enhance their
market skills, productivity and earnings. In the theory, the emphasis has been made on
45 see in Malcolm S. Cohen, Samuel A. Rea, and Robert I. Lerman (1970) and Orley Ashenfelter and
James J. Heckman (1974), 46 Applications of this model include Marvin Kosters (1966); Malcolm Cohen, SamRea, and Robert
Lerman (1970); Robert Hall (1973); Orley Ashenfelter and James Heckman (1974); and Jerry Hausman
and Paul Ruud (1984).
85
individual differences in years of education, lenth of the on the job training and those
important factors that induce individual to make comparatively more investment on
human capital than others.
Mincer (1958) presented a theoretical model in which implications for income
distributions of individual differences in investment in human capital have been
derived. He assumed the process of investment was subject to free choice i.e. training.
As the time spent in training found a delay of earnings to a later age, the rational
choice assumption indicated an equalization of present values of life-earnings at the
time the choice was made. Intra-occupational differences increased when human
capital investment included experience on the job. Age measured the obtainable
experience process along with biological growth and decline. The growth of
experience and hence of productivity showed increasing earnings which increased
with age, up to a point when biological decline started to influence productivity badly.
The differences in training caused the differences in earnings levels among
''occupations" in addition to the differences in slopes of life-paths of earnings among
occupations and these differences seemed systematic.
Mincer (1970) presented a theory of lifetime behavior of individuals. It was
stated that the distinction between longitudinal (cohort) analysis and coexistent (cross-
section) analysis would not matter in some special cases of a stationary economy, or
of an economy where the changes were "neutral" regarding categories adding the
human capital model. He argued that modifications which were introduced by secular
change must be considered when the models were used in cross-section.
Becker (1962) analyzed the investment in human capital and found that the
differences in earnings among persons, areas, or time periods were generally due to
differences in physical capital, technological knowledge, ability, or institutions. The
analyses showed that investment in human capital also had a vital influence on
observed earnings because earnings seemed net of investment costs and gross of
investment returns. Certainly, an appreciation of importance of human capital seemed
to resolve many else findings regarding earnings. However, observed earnings were
gross of the return on human capital were influenced by changes in the amount and
86
rate of return. A lot of human capital investment enhanced observed earnings both at
older ages, and at earlier ages.
The attention was paid on the job training (i.e. a specific kind of human
capital) because it usually emphasized on common effects to a general theory.
However, the theory had very vital implications such as earnings were gross of the
return on human capital; some persons may earn more as compared to others because
they spend more on their education. And, since talented persons tended to invest more
than others, the earnings distribution could be very unequal and even skewed, even if
"ability" was symmetrically and not too unequally distributed. The learning, both on
and off the job, and other activities had similar effects on observed earnings as do
education, training, and other traditional human capital investments. Furthermore,
human capital investment did not affect earnings because costs were paid and returns
were gathered by the firms, industries, or countries that used capital. Schultz (1960)
stated that education levels were aggregated, the proportion of total costs attributable
to earnings foregone tended to rise gradually because of more importance of
education at secondary and higher level in current years, a change that offsets the
decrease in the foregone-earnings proportion of high school education alone. He
further stated that spending on education as "investments" based on the behavior of
people looking for investment opportunities would not inconsistent with the
hypothesis i.e. rates of return to education were adequate larger as compared to the
rate of return to investments in physical capital to have "induced" the implicit larger
growth rate of such kind of human capital.
Blaug (1976a) argued that individuals make investment on themselves just for
the future gains, pecuniary and non-pecuniary. He further argued that well educated
population is a productive, ingenious, and inventive resource for both the growth and
wide-ranging growth. This indicated that human capital formation included the formal
and informal education, on-the-job training and „learning by doing‟ because all of
these made a contribution to enhance the people‟s economic capabilities (see
Chattopadhay, 2012).
Becker (1964) emphasized on human capital investments influencing an
individual's potential earnings and cognitive income. The investments in human
87
capital consisted of level of educational, on-the-job skills training, health care,
migration, and regional prices and income issues. The earnings tended to increase
with education and skill level of the individuals. He also discussed the costs and
returns of investments and social and private gains of individuals and compared them
based upon education as well as level of skill.
Schultz (1961) stated that investment in human capital benefits both the
individuals and society. The improvement can be brought out in the quality of human
efforts and its productivity can be increased. Investment in human capital increased
real earnings per worker. The human capital can be estimated by its yield relatively
than by its cost while any capability produced by human investment becomes a part of
the human agents and that‟s it can not be sold; it is however”in touch with the market
place and influences the wages and salaries which the human agents can earn. The
induced increased earnings were the yield on investment. In order to improve human
capabilities, the improvements in activities were necessary. These investments may
lead to improve the human capabilities: (1) health facilities and services incorporating
energies, and the strength and vitality; (2) On-the-job training, incorporating
apprenticeship of old style; (3) formally organized education at the elementary,
secondary and higher level; (4) adults study programmes i.e. protracted programs
particularly in agriculture; (5) individuals and families‟ migration to make adjustment
according to the changes in job chances.
His theorem indicated that on the job training decreased the worker‟s net
earnings at the beginning and enhanced their earnings afterward. In addition,
individuals spend time in searching for job opportunities and gathering information.
3.5 Theoretical ApproachesTowards the Urban Informal Sector
The theoretical literature in terms of the urban informal sector enlightens three
approaches. The precise explanation of these approaches is given below.
3.5.1 Dualistic Labour Market Approach
The dualistic view is that underdeveloping countries are catagorised into two different
sectors: One is modern and dynamic sector which is characterized by capitalist
method of production; and second is a marginal or „subsistence‟ sector overpowerd by
agriculture, characterized by pre-capitalist mothedos of production. The major
88
hypothesis was that the wage determination process in both the sectors was different.
Firstly, a theoretical model of development was presented by Lewis (1954) in a
dualistic economy. However, he based his model on Classical School foundations
having two sectors (i.e. agriculture and non-agriculture) with planned symmetrical
behavior for each one. He discussed the transformation of surplus labour from the
traditional sector and and its absorption in the modern industrial sector in order to
start the development process in an effective way. Fei and Ranis (1964) emphasized
upon the simultaneous growth of agriculture and industrial sectors and product
dualism on their organizational dualism.
Todaro (1969) model stated that people are migrated from rural to urban areas
inspite of unemployment in cities. Moreove, labour force participants, compared their
expected incomes for a given time limit in the urban sector with the prevalent average
rural incomes, and they are migrated if the former surpasses the later. The Harris-
Todaro (1970) model of migration process proposed that all migrants intended to get
employment eventually in urban modern sector employment but did not clarify the
movement of the participants of urban subsistence sector. The authors notioned that
intersectoral wage gap was influenced by reallocation of labour between the sectors
along with the probability of obtaining job in the formal sector. Fields (1975) traced
out that the migrants have three choices: a job in the formal sector, open urban
unemployment and a possibility of getting job in the urban informal sector. But
Banerjee (1983) showed that entrants in informal sector were immersed to Delhi due
to additional chances to find the informal sector work. The new migrants searching
for job in the formal sector took the informal sector as a temporary staging post.
3.5.2 Neo-liberal Approach
The Neo-liberal approach focused on the legal instruments influencing the
providence and existence of informal sector. The enterpreneures were attracted
towards informal sector due to prolonged registration procedures, difficult
administrative steps and the costs incured to make an enterprise legal. The role of
informal sector was looked upon as most advantageous and harmonized response of
economic units towards government-induced distortions i.e minimum wages and
excessive taxation policies (De Soto, 1989).
89
Rauch (1991) found the informal sector as a voluntary phenomenon of firms to
avail legal exemption benefit from a mandated minimum wage policy because it
distorted resources away from first best allocations. Loayza (1996) used an
endogenous growth model and found that informal economy tended to increase in
results of excessive taxes and regulations that were imposed by governments having
inability to implement compliance. Fortin et al. (1997) studied the effects of taxation
and wage controls in an informal sector in developing economy. He found that
significance of the informal sector, unemployment rate and efficiency costs were
increased due to increased tax rate on profits, in the payroll tax, and in the
government set wage rate. Sarte (2000) drew a connection between bureaucratic rent-
seeking, the informal economy, and economic growth. The increased costs of
operating out official laws caused informal sector disappear endogenously
(internally). An increase in minimum wages affected the urban formal sector
employment negatively excluding white-collar workers (Suryahadi, 2003).
3.5.3 Structural Articulation Approach
The focus of this approach is on the neo-liberal school. The urban informal
sector was distinguished into two parts i.e. modernizing dynamic and a traditional
stagnant one. The informal sector was a disadvantaged part of a dualistic labour
market and a dynamic sector tied by subcontract to the urban formal sector and
dualism looked in relation to wages that were exceeded the market clearing level
(Ranis and Stewart, 1999). Florez (2002) defined informality in dualistic approach in
which activities were made for subsistence purpose and for the purpose of drecreasing
costs of labour and attainment of capital accumulation.
Attanasio et al. (2003) worked on trade reforms and wage inequality and
found the influence of drastic tariff reduction on the wage distribution. The skill
premium increased due to skilled biased technological change. However, the sectors
with the largest reductions in tariffs were those with the sharpest increase in the share
of skilled workers. Regarding industry wage, premium diminished more in sectors
which faced large tariff reductions and the diminishing premium increased inequality.
The increasing size of informal sector was related to the increased foreign competition
i.e. sectors which experienced large tariff reductions and trade exposure enhanced
their informality in prior to the labour market reform. Overall, effect of the trade
90
reforms on wage distribution was trivial. The poor people employed in the informal
sector did not earn low incomes in the economy (Dasgupta, 2003). The informal
employment acted in response to the strength of enforcement and, perhaps corporate
tax rates (Ihring and Moe, 2004).
The informal employment was also considered a voluntary phenomenon. The
informal sector was distinguished into two sub-sectors i.e. the intermediate sector
which appeared as a reservoir of self-motivated entrepreneurs and the community of
poor comprised on large body of left behind and underemployed labour (House,1984).
The migrants and newcomers with less human and physical capital participated in the
labour market and started work to avoid their main requirement of being easy entrant
into the sector (Tokman, 1986). Fields (1990) devided the informal sector into two
segments i.e. upper-tier informal sector and „easy entry‟ ones. The mobility from
formal to informal sector and earnings differentials revealed the participants‟
willingness to work in the informal sector (Maloney, 1999).
3.6 Conclusion
We have pointed out different theoretical concepts concerning labour supply
decisions and labour choice in sector of employment. In this chapter, we have
discussed the Neo-classical theory of labour supply decision. The individual‟s labour
force participation decision and the hours supplied by the individual given that
participation are explained. Furthermore, we have described the household
participation decision and hours of labour supplied. We have also explained the basic
human capital theory. The theoretical approaches towards the urban informal sector
are also discussed. In conclusion, it is found that the theoretical approaches towards
urban informal sector and neoclassical theory of labour supply47
are the relevant and
suitable measures to determine the urban informal sector employment in Southern
Punjab, Pakistan. The Human capital theory by Becker also relates regarding earnings
determinants of the participants of urban informal sector. These theories have been
elaborated by various economists in their studies.
47see Gary Becker (1965), Jacob Mincer (1962), Shelly Lundberg (1985).
91
Chapter 4
LITERATURE REVIEW
4.1 Introduction
The informal sector absorbs bulk of such labour and hence reduces the
problem of unemployment or underemployment to a large extent in underdeveloped
countries as indicated or evidenced by theoretical and empirical literature. The effort
to highlight this problem has been made at national and international level and some
strategies are suggested to overcome this emerging issue. Moreover, this issue of
informal sector calls for further research for policy suggestions.
We point out the review of the informal sector and employment at national
and international level considering its importance. The present chapter is planned as
follows: Section 4.2 introduces the classic theories of growth and development and
informal employment. In section 4.3, we review the aspects of the urban informal
sector; its determinants, earnings determinants and impact on poverty or development
at international level. In section 4.4 we present the review of the literature concerning
different aspects at national level. Section 4.5 presents some concluding remarks.
4.2 Informal Employment and Classic Theories of Growth and
Development
In the 2nd
half of the 20th
century, the countries under colonial rule started the
development process. However, it started with the beginning of industrial revolution
in Western countries. Industrial revolution came in Britain between 1760 and 1820.
Capitalistic industrial economy took place of feudal agrarian economy among Britain
and Western coutries by characterizing a laissez-fair economy at intial stage of
industrial capitalism. Other European countries like France, Germany, and the new
World of the United States of America have experienced a similar industrial
revolution as that in Britain.
Adam Smith (1776) presented the theoretical base for such a philosophy of
laissez-fair economy. He argued that invisible hand of providence in the market
transformed the fruits of private entrepreneurs in search of self-interest into
production and supply of goods and services which society requires. The philosophy

92
of laissez-fair took a turn in favour of state intervention based in multi-justification.
Thus the monopoly legislation and its implementation provided the reason for the
emergency of monopolies and oligopolies.The solution of inequalities in form of
progressive taxation and other measures made case for redistribution of income and
wealth and eventually for guiding the welfare state. J. M. Keynes (1936) gave
suggestions for compensatory fiscal measures as a way to enhance income and output
and diminish high unemployment (business cycle which was the result of business
cycle and particularly Great Depression of 1930).
John Kenneth and Galbraith (1979) followed the Pigou‟s approach and
contrasted between private opulence and social squalor. Thus, the policy or
philosophy of state intervention aimed at the optimum use of resources and
maximization of consumer satisfaction. However, Malthus (1978) highlighted the
fundamental problem of imbalance between population growth and production. He
further argued that population control measures could be the way to overcome this
high population growth problem. Schumpeter (1995) focused on inventions and
innovations that were responsible for trade cycle and lead to or directed development
of capitalistic economies.
All these theories were explained by Classical and Neo-classical or even
Modern Economists. However, they did not illustrate theory of development
comprehensively.
The classic post-World II literature, on economic development has been
dominated by four energetic and provocative aspects of thought discusses the linear-
stages-of-growth model, theories and patterns of structural change, the international-
dependence revolution and neoclassical free-market counter-revolution. In current
years, an approach has emerged that is miscellaneous and draws on all of these classic
theories. The wide range of contending theories and approaches are presented in order
to study the economic development.
Walt W. Rostow was an American economist who presented „Stages of
growth‟ model of development.48
The author argued that process of
48 A theory of Economic Development, associated with the American Economic Historian Walt
W.Rostow, according to which a country passes through sequential stages in achieving development.
93
underdevelopment to development, whereby all the developed industrial nations of
the world transformed themselves from backwardness to prosperity, can be explained
in terms of stages of growth.49
In the linear stages model, emphasis is placed on
imperative role of saving and investment to enhance sustainable long-run growth. But
Rostow‟s historical theory did not explain development sufficiently.
Simon Kuznets (1959) explained the contribution of technology in
development so as to make capital productive. Almost underdeveloped countries are
fortunate enough to absorb such kind of productive technology. However, these
underdeveloped countries are endowed with abundant human capital especially
surplus labour and have to adopt labour-intensive technology. He argued that poor
countries should not needlessly take the responsibility in absorbing outdated
technology of the western countries and East European countries. Simultaneously,
underdeveloped countries should not absorb a capital intensive technology which is
viewed modern technology.The idea of labour-intensive technology for productive
use of surplus labour is important one for its significance or concentration among
economists in developed countries. R. Nurkse (1953) argued that labour force, that is
unemployed and underemployed, can be utilized for capital formation process start.
He further emphasized that skilled and unskilled manpower can be productively used
in order to produce capital assets in rural areas. The above illustration of
underdeveloped economies indicates the transformation of surplus labour into capital
assets.
While, capital formation with the use of appropriate technology and skilled,
provoked, dynamic population can lead to development (Guner Myrdal, 1968 and
John Galbraith, 1979). The vicious circle of poverty is considered the major cause of
underdevelopment and the underdeveloped counries are trapped in this demand side
and supply side vicious circle of poverty. The development and growth can be
achieved by eradicating this vicious circle of poverty. Rosenstein-Rodan (1964)
presented the Big Push Theory. The author viewed that big and comprehensive
investment in form of intensive agriculture and promotion proves helpful to bring
economic development. Development can beignified by a joint investment with a
49 see Todaro and Smith (2012).
94
number of backward and farward linkages and benefits of external economies, anemic
efforts towards development will prove worthless or ineffective.
The idea of joint investment in balanced and unbalanced growth theories was
given by Hirshman (1958). According to him, a comprehensive investment caused
unbalanced growth to start with, would eventually cause to investment opprtunties in
the complementary fields of activities and would ultimately excite wide ranging
economic growth and development.
Structural change theory50
emphasizes on the mechanism by which
underdeveloped economies transform their domestic economic structures from a
heavy to a more modern service economy. The Neo-Classical price and resource
allocation theory and modern econometrics is used to show how this transformation
process takes place. The “two-sector surplus labour” theoretical model of W. Arthur
Lewis and the “patterns of development” empirical analysis of Hollis B. Chenery and
his co-authors recognized the illustrations of structural change approach. The Lewis
two-sector model 51
of structural change depicts transfers of resources from low
productivity to high-productivity activities in the process of economic development
by analysing many linkages between traditional agriculture and modern industry and
illuminating recent growth experiences such as that of China ( see Todaro and Smith,
2012).
The Structural-Change model emphasises development as an exclusive
growth process and change with same main features in all countries. Yet, the model
does recognize that differences can be raised amongst countries development pattern,
depending on their particular set of circumstances (see Todaro and Smith, 2012).
In the period of the 1970s, International-Dependence models were supported
in result of growing dissatisfaction with both the stages and Structural-Change models
among intellectuals in developing countries. While this theory to a large degree went
out of favor during the 1980s and 1990s, as only some of its views have been adopted.
50 The hypothesis that underdevelopment is the result of underutilization of resources arising from
structural or institutional factors that has their origins in both domestic and international dualism.
Development therefore requires more than just accelerated capital formation. 51 The process of transforming is in such a way that the contribution to national income by the
manufacturing sector eventually surpasses the contribution by the agricultural sector.

95
The international-dependence theorists recognized the importance of the structure,
mechanism, work of world economy, and decisions made in developed world can
influence the lives of millions of people in third world. The similar applies to
arguments concerning the dualistic structures and the role that ruling elites in the
domestic economies of the developing world. Within this general approach there are
three major streams of thought: the neocolonial dependence model, the false paradigm
model, and the dualistic development thesis (see Todaro and Smith, 2012).
The first major stream entitled as Neo-colonial Dependence Model52
, is an
indirect outgrowth of Marxist. This model argued that the existence and continuance
of underdevelopment was most important to the historical evolution of a highly
unequal international capitalist system of relationship between rich country and poor
country (see Todaro and Smith, 2012).
During 1980s, when the conservative governments were in power in the
United States, Canada, Britain, and the West Germany, the Neo-classical counter-
revolution theory and policy were revitalized. The neoclassical counterrevolution
argued that poor resource allocation due to incorrect policies regarding prices and too
much state intervention by excessively active developing-nation governments caused
underdevelopment. This Neo-classical counter-revolution favoured supply-side macro
economics and privatization of state-owned corporations in developing countires, and
it stressed upon de-thronement of public-ownership, statist planning and govt-
regulations in underdeveploed countries (see Todaro and Smith, 2012).
Thus, the cornerstone of Neo-Classical free market theory is attached with the
liberalization (opening up) of domestic markets which will attract domestic and
foreign investment. Thus, the capital accumulation will enhance. In relation to GNP
growth, this is equalent to elevating domestic saving rates which will enhance capital
labour ratios and per capita incomes in capital poor developing countries. The Solow
Neo-Classical Growth Model53
in particular represented the seminal contribution to
the Neo-classical theory of growth and later received Robert Solow the Nobel Prize in
economics. It distinguishes itself from Harrod-Domar formulation by addition of
52 The main proposition of model is that underdevelopment exists in developing countries due to
continuing exploitative economic, political, and cultural policies of former colonial rulars towards less
developed countries. 53 see Todaro and Smith (2012).

96
labour, and introducing technology to the growth equation. In order to promote
growth along with equity in developing world, the Traditional Neo-Classical Growth
Theory discussed the unquestioning adulation of free markets and open economies
along with the universal disparagement (see Todaro and Smith, 2012).
4.3 Review of Empirical Evidence and Urban Informal Sector
This section reviews the empirical evidence on aspects of the informal sector
and the urban informal sector employment determinants. The literature on the
informal sector is characterized by terminological confusion. Theoretical literature on
the informal sector is commonly taken to show dualistic as well as Neo-liberal and
legalist approach in this research. We also review the literature regarding earnings
determinants in the urban informal sector. The present study also reviews empirical
evidence on the subject of the informal sector development and socio-economic
factors in support of the informal sector development at the national as well as at
international level. In the next paragraph, we will review some studies associated with
our topic. There is a diversity of literature on topic of the urban informal sector
development though we are reviewing a few imperative studies in order to support
this research.
Mazumdar (1976) examined the urban informal sector. The results showed
that there were disproportionally young and old participants in the informal sector.
Majority of the participants were female workers. Moreover, the participants of the
informal sector were possessed with formal education. The informal sector did not
prove the entry point to the rural migrants. The workers earned at very low level in
the informal sector. The participants were not the primary earners. The employment,
productivity and earnings trends indicated that migration function implicit in
probabilistic job search models exaggerated the rate of migration to the urban market,
and underplayed the role of actual economic performance in controling migration
over time.
Koo and Smith (1983) discussed the urban informal sector and migration to
city based on data from National Demographic Survey conducted in 1968. The
various factors were explored like migrants‟ participation, personal income, sex and
level of education which influenced the informal sector. The authors used sectoral
97
distribution and regression techniques. The results indicated that age, years of
education, and hours of work were positively associated with the personal earnings of
the participants. The sex and earnings of the informal sector workers were positively
associated. Findings also showed that rural migrants‟ earnings were lower in the
informal sector and this sector was tertiary. It was the informal sector which enabled
the rural migrants to participate in the informal occupations. The informal economies
provided continuous income opportunities predominantly to migrant women. Finally,
results concluded a great deal of overlap between participants‟ income in both the
(formal and informal) sector.
By using primary data, Tielhet-Waldorf and Waldorf (1983) explored the
earnings of the self-employed in an informal sector in Bangkok. The authors
examined the impact of years of experience in periods, previous experience, migrants‟
status, sex and region on the earnings of self-employed. OLS regression techniques
were used in the study. The results showed that self-employed workers noticeably
earned relatively higher average earnings than unskilled workers in the formal sector.
The result of the study also showed that level of education of participats was low
(primary). Analysis indicated that there were higher earnings of the self-employed
with primary level education. In conclusion, the recent migrants, almost all self-
employed were inclined to earn a smaller amount as compared to city born for that
time period.
Hill (1983) studied female labour force participation in developing and
developed countries based on Japanese data. The author used the multinomial logit
model. It was found that women did not regard the decision to work as identical to an
employee‟s decision to work. The increase in husband‟s wage certainly raised the
wife‟s inclination to work in the informal sector as family worker. It was concluded
that the option to work in family business along with the choice not to take part can
not be combined.
Okojie (984) studied female migrants in the urban labour market by collecting
data in 1980 in the survey of female Benin City of Nigeria. The explanatory variables
such as sex, marital status, religion, and education levels were included in the study.
The author used the regression estimates in the study. The results pointed out that
migrants took the urban informal sector as refuge. The evidence indicated that both

98
the migrant and non-migrant women, with their low education, were occupied in low
income jobs in the informal and formal sector. The results of study suggested that
employment opportunities should be increased in the urban areas and rural-urban
migration must be decreased on behalf of both female and male workers possessing
higher education.
House (1984) conducted a survey of the informal sector enterprises in mid
1977 in Nairobi. The author of study used the percentage distribution and ordinary
least square method. The results indicated that participants having low skill level
entered in the urban informal sector easily and the required amount of money to start
business was insignificant. Moreover, there was an influx of migrants in informal
sector in urban areas. The study concluded that the informal sector offered a
permanent way to urban existence, even at a bare survival. The study has given policy
suggestions about the maximization of development potential of the intermediate
sector and about lessening the size of the community of the poor at similar time.
Terrell (1989) analyzed the determinants of wages by using data from the
Labour Force Survey in Guatemala. The regression results indicate that there were
low and positive returns to education and experience. Positive relationship was also
found between education and earnings with large differentials. The result also found
the interindustry wage differential were limited to large groups (i.e. modern and
traditional). The returns to hours worked were found to be negative. Results found the
sex discrimination in the formal sector occupation among the wages of street vendors
and shop assistance. The variable years of schooling affected more wages of shop
assistants as compared to the earnings of street vendors. It was also found that
earnings of the street vendors were increased with the experience. Moreover, job
tenure did not determine the wages in either of these occupations. Finally, a negative
association was found between working hours and earnings of the street vendors.
Boyd (1990) examined the Black and Asian self-employment in large
metropolitan areas in United States by using micro data sample, U.S census Volumes,
and published sources. The explanatory variables were individual and personal
characteristics. The study used a logistic regression model. A positive relationship
was found between age, education and self-employment of Asians. The findings

99
indicated that Asians also used informal networks for guidance in business. However,
Blacks did not get benefit in business ownership due to lack of informal network
support.
Banergee (1993) examined the role of informal sector in migration process.
The data was collected by survey method from October 1975 to April 1976. The
author used earnings functions logit model and logit estimations of mobility between
sectors. It was found that mobility was very low from informal to formal sector. It
was also found that return to education and experience was equally rewarded in both
the sectors. The return to education and experience were high in the informal sector.
The main conclusion was that education of the workers determined mobility between
the sectors.
Aly and Quisi (1996) estimated socio-economic determinants influencing
women‟s decisions in labor market. The non-linear maximum likelihood function was
used in the study. The results found that women‟s monthly wage rate and their
education affected their working decisions in the labour force. However, variables
such as marital status, number of children under five years of age and their age
influenced their decisions negatively.
Funkhouser (1996) examined the employment patterns and earnings structures
by conducting household surveys in five Spanish-speaking countries of Central
America. Factors regarding age, years of education, marital status, sex, children less
than 10 and adults were used by author. The author of the study adopted the probit
model to estimate the informal sector employment. The results highlighted that there
were higher returns to a year of education in the informal sector in each country as
compared to most developed countries and gender differential was to a great extent in
informal sector. The results also showed that participants enjoyed the higher returns
due to labour market experience. Furthermore, it was found that heads were being
employed more in informal sector employment. As far as number of children is
concerned, workers were being employed more or less in informal sector employment
across countries in Central America. The workers having male children less than 10
years of age decreased their involvement in informal employment in some of the
countries. Married workers participated less in the informal sector employment.
100
The findings also indicated that informal sector employment increased due to
having female children less than 10 years and it decreased in Nicaroga in 1993 and in
Costa Rica in 1980, 1985 and 1991. The study concluded that the important
determinant of informal sector employment was level of development.
Borjas (1996) worked on self-employment experience of immigrants by using
data from U.S censuses of 1970 and 1980. The author used maximum likelihood logit
regressions in this study. The result showed that self-employment proved a vital
aspect of experience of the immigrants of the labour market. It was also found that
self-employment rates of immigrants were higher as compared to self-employment
rates of native-born male workers. The assimilation influenced positively the self-
employment rates. More immigrants adopt self-employment more often.
Loayza (1996) examined the determinants and effects of the informal sector
by using data from Latin American countries in the early 1990s. The author used an
endogenous growth model. Results showed that the informal economy tended to
increase in results of excessive taxes and regulations that were imposed by
governments having inability to implement compliance.
Fortin et al. (1997) studied the effects of taxation and wage controls in an
informal sector in developing economy. The authors applied a simple general
equilibrium model consistent with different parts in labour market. Results indicated
that the significance of the informal sector, unemployment rate and efficiency costs
were increased because of an expansion in the tax rate on profits, in the payroll tax,
and in the government set wage rate.
Samith and Metzger (1998) discussed the return to education among street
vendors. The authors used data drawn in 1994, survey of street vendors in Mexico.
The explanatory variables consisted of capital, capital association, hours worked per
year, hours worked per day, secondary education, beyond primary education,
experience, experience-squared, family worker, gender, merchandise and prepared
food. The study was based on the specification of earning function. Findings
indicated that there were significant positive returns to formal education among street
vendors. A positive relationship was found between capital investment and
educational attainment. The results also indicated an inverse association between

101
earnings and working hours per year. It was also found that earnings of the vendors
seemed to increase gradually.
Maloney (1999) worked on informality segmentation in urban labour market
in Mexico based on data from National urban employment survey. The author
estimated the earnings differentials and multinomial logit model was used in the
study. The author found a relationship between the formal and the informal sector.
The result showed that informal sector workers forcefully worked in the sector due to
inefficiencies and low productivity levels of the labour in developing countries. The
major conclusion was that mobility from formal to informal and earnings differentials
showed the participants‟ willingness to detain or engage them selves in the informal
sector.
Hout and Rosen (2000) studied the influence of family background and race
on self-employment in United States. Data were drawn from the General Social
Survey (GSC) made from1500 English speaking adults. By using a logistic regression
analysis, it was found that the self-employment rate among African, Americans and
Latinos whose fathers were self-employed was lower as compared to a European
ancestory average man whose father was not self-employed. Self-employment rates
were influenced by ancestry and immigration. The findings concluded that
individual‟s self employment was primarily influenced by the self-employment status
of his or her father or family background.
Sarte (2000) introduced a simple economic model and drew a connection
between bureaucratic rent-seeking, the informal economy, and economic growth. The
results showed that increased costs in respect of operating out official laws caused
informal sector disappear endogenously (internally).
Rosser et al. (2000) worked on income inequality and the informal economy
based on data which was collected from sixteen transition economies. The authors of
the study used the bivariate OLS regressions. Results highlighted that the
progressively larger informal economy tended to create more inequality because of
falling tax revenues. In conclusion, the social safety nets were weak due to
progressively informal economy and inequality was enhanced due to further informal
activity as social solidarity and trust.

102
Smith (2001) estimated the effects of human capital variables on earnings by
using 1991 population survey of United States. The personal characteristics, socio-
economic and demographic variables affected the earnings. The author estimated
three sets of regression equations. Findings indicated that wages were positive
function of education and training. It was also found that training was of great
importance to determine females‟ wages. The analysis estimated that the training and
earnings were positively correlated. A negative relationship was found between all
levels of education and earnings. The results highlighted that age and experience were
positively correlated with earnings. However, experience- squared and age-squared
were negatively associated with earnings. The results suggested that sex, age and
experience remarkably determined the earnings.
The determinants and entrepreneurial intention of immigrants were examined
by Raijman (2001). The household survey was conducted during 1994 by using
random clustered sample of villagers‟ households in Chicago. Socio-economic
characteristics affected the entrepreneurial intention of immigrants. Logistic
regression model of potential entrepreneurship was applied. Findings proved that self-
employment was relatively high in the community and social ties played a central role
in self-employment process. They emphasized having business on behalf of
individuals amongst family members to serve as role models. The people with meager
sources availed business ownership due to assistance. In addition, study results
confirmed that the household economic resources (financial investments) aspired the
entrepreneurs to launch business. The results suggested that policy to develop
community business must mull over both (financial and nonfinancial) factors.
The informal sector and rural-urban migration was analyzed by Meng (2001)
based on survey data set of 1504 rural-urban migrants of Chinese city in 1995. The
multinomial logit model was used to estimate the influence of individual‟s marital
status, sex, human capital variables, financial resources and occupation before
migration and family background on formal and informal sector employment. Results
revealed that individuals with higher labour market quality preferred to become self-
employed rather to seek other work. Male workers participated in wage as well as in
self-employment. Results concluded that the wage workers and self-employed were

103
comparatively better-off than those in the informal sector with regard to earnings
advantages.
Roberts (2001) investigated the factors that determined job choice of rural-
urban migrants. Data was collected in 1993 from individuals in the fifth sampling
survey of the floating population of Shanghai. The author of study attempted to show
the impact of socio-economic factors, region of origin and village-based networks.
The author used multinomial regression model to analyse the determinants. Results
highlighted that personal characteristics (age, gender, marital status, education and
region or origion) and village based networks motivated migrants into particular
occupations and destinations because nearly all young workers participated regularly
in menial work of construction and manual labour. The results also showed that
illiterate migrants participated more in the occupations of farming while their
participation was less in construction sector. Furthermore, returns to migrants‟
education were higher. Hence, study concluded that education and province of origin
determind the job choice signficantly.
Fan (2001) analysed the migration and returns in urban labour market of
China.The demographic variables, residential status, experience, ownership sector and
occupations were used as explanatory variables in the present study. The author used
the regression techniques. The results found that labour market was segmented as
indicated by the benefits. The results also found that permanent migrants availd
benefits from work in the labour market as compared to the recent or temporary
migrants. The major conclusion was that residential status was found as the most
important determinant of income and benefits of the workers. Moreover, income and
benefits were remarkably determined the returns in the labour market of urban China.
Returns to education and earnings differentials at different levels were
analysed by Wahba (2002) based on data taken from Egyptian Labour Force Sample
Survey (LFSS) conducted in October 1988. The author found that human capital
variables influenced the earnings in labour market. The extended earning function
method was used to estimate the returns to different levels of education. Results also
showed that there were higher returns to incremental level of education and however,
this was different from the pattern that commonly prevailed in most countries.
104
Gallaway and Bernasek (2002) identified the determinants of labour force
participation in formal or informal (wage and self-employment) sector for men and
women based on data from Family Life Survey for 1993 (IFLS) in Indonesia. The
authors used socio-ecomonic and demographic variables to determine sector of
employment. In this study, the multinomial logit model was used. The results
estimated that female informal sector employment was decreased with age. The
results revealed that education and child care helped the women to make decisions
with regard to time and place of work. Findings pointed out that persons with the
highest education levels had a preference to work in the wage or formal sector
employment while those possessing low human capital were forced to work in
informal sector. The results revealed that informal sector employment (both at home
without pay and with pay in labour market) was positively associated with number of
male adults. However, a negative relationship was found between number of male
adults and male female informal sector employment. The females work participation
at home increased due to an additional toddler and having an infant. The findings
suggested that women decided distinctly to occupy in the formal or informal sector.
Results confirmed that informal sector seemed inferior relative to formal sector.
Maternity leave policies, paid maternity leave policies to take care of infants and child
care arrangements to take care of infants and toddlers and women‟s and girls‟ access
to education were essential policy implications to increase women‟s participation in
paid-work.
Suharto (2002) examined the human development and the urban informal
sector among the street traders by using surveys at micro level in 1999 in Bandung,
Indonesia. Results illustrated that human development was estimated by economic
(i.e. household income and trading revenues), human capital (education, health and
housing facilities) and social capital (i.e. socio-cultural activities). These indicators
were all qualitative. Percentage distribution was used as the study was exploratory.
The results illustrated that overall, the street traders were seemed not poor as their
incomes were frequently higher than the official poverty line. The income of the few
street traders was relatively higher than low skilled workers in the formal and
unskilled construction sector. The results also revealed that many street traders lived
in a vulnerable condition unable to meet the costs of basic necessities. In addition,
105
these street traders did not seem to be poor who had sufficient formal education and
access to health services and housing facilities.
The relationship between urban poverty and labour force participation in
informal sector was examined by Odhiambo and Manda (2003). The data was
collected from various Welfare Monitoring Surveys in Kenya. Authors used logit
model in this study. Results observed that variables such as age, gender, family size,
education and the sector of employment influenced the poverty level or risk of being
poor. The study results showed that household heads without having initial formal
education were seemed to be poorer. The results also pointed out that there was a
positive relationship between poverty and labour force participation. However, the
households seemed to be poor. There was need to plan a strategy to improve the
productivity and incomes of the majority of poor informal sector workers. It was
suggested that the wide gender disparities should be reduced in labour force
participation.
Reddy (2003) examined the aspects of urban informal sector by utilizing
primary data from three urban areas in 2001 in Fiji. The author used the percentage
distribution and factor analysis technique. The workers, on average, had Primary level
education. The informal employment was high in urban area than some big cities of
underdeveloped countries. Results also found that informal enterprises incorporated
instantaneous family members and the informal sector activities required relatively
long working days and weeks. Moreover, workers had no access to credit facilities.
They had no contact with the national and municipal laws and regulations which
governed the conduct of business patterns in the state. The study suggested for an
urgent national level survey of informal sector to devise policy in a better way.
Odhiambo and Manda (2003) analysed the effect of human capital on earnings
by using data from Welfare Monitoring Survey (WMS) undertaken by the
Government of Kenya in 1994. The determinants of earnings such as education at
different levels, experience, sex and region were included. The Mincer (1974)
methodology was followed to estimate semi-logrithemic equations. Results found that
the earnings increased with education levels. The results also showed that human
capital externality increased the earnings and all the workers benefitted in the form of
higher earnings due to increased level of education. Furthermore, men were relatively
106
more advantaged than women participants in labour market. A positive relationship
was also found between household size and earnings.
Ozcan et al. (2003) discussed the issue of wage differences by gender, wage
and self-employment by using data from the 1994 income survey in Turkey. The
education, experience, age, marital status and sector of activity affected the earnings
of wage workers and self-employed. The authors adopted the OLS techniques. The
results were based on two- step Heckman procedure. The results also indicated
differences in both the employment (wage and self-employment) as well. The results
found that the returns to education were higher in the self-employment. In addition,
job experience, working hours per week and marital status contributed positively to
men employment. In contrast, job experience increased women‟s wages and working
hours reduced the women wages in urban Turkey.
Suryahadi (2003) evaluated the minimum wage policy and its impact on
employment in the urban formal sector by using data from the national labour force
surveys conducted annually by BPS in Indonesia. OLS estimation results showed that
an increase in minimum wages influenced the urban formal sector employment
negatively excluding white-collar workers.
Attanasio et al. (2003) worked on trade reforms and wage inequality by using
data of the household National survey from 1984, 1986, 1988, 1990, 1992, 1994,
1996 and 1998. The author found the influence of drastic tariff reduction of the 1980s
and 1990s on the wage distribution. The results showed that increase in skill premium
was primarily driven by skilled biased technological change. However, the sectors
with the largest reductions in tariffs were those with the sharpest increase in the share
of skilled workers.
The study results found that regarding industry wage, premium diminished
more in those sectors which faced large tariff cuts and this decreased premium caused
to inequality. It was also found that increasing size of informal sector was associated
to the enlarged foreign competition. Yet, increasing returns to education and
variations in industry premiums and informality alone did not entirely clarify the
increased observed wage inequality at that period. On the whole, influence of the
trade reforms on wage distribution was small.

107
The structural and behavioural characteristics of informal service employment
were discussed by Dasgupta (2003). The primary data source was used and survey
was conducted in New Delhi. Investment, earnings, returns to human capital, and
socio-economic characteristics were included as the explanatory variables. Regression
results indicated that employment in informal services sector did not require complex
skills yet experienced people were invoked to this employment. The result also
showed that workers entered into the informal service employment because of lack of
education. Furthermore, poor people strained in the informal service activities due to
lesser credit facilities. The study results concluded that lack of education and credit
facility determined workers towards the informal service employment while they did
not earn low incomes in the economy.
Ihrig and Moe (2004) examined a relationship between the tax policy and the
informal employment in Asia by developing a simple dynamic model. The model
reproduced an inverse and convex association between the informal employment and
a country‟s living standard. The study results made clear that informal employment
gave response to tax policies consistent with cross country data. Results suggested
that the informal employment acted in response to the strength of enforcement and,
perhaps corporate tax rates.
Blanchflower (2004) focused on self-employment by using world values
survey, 1981-1983 (ICPSR no. 9309) and world values survey, 1981-1984 and 1990-
1993 (ICPSR no 6160), along with data collected during 1995-1997. The probit
model techniques were applied in the study. The proportion of self-employment
across the OECD was remarkably higher for men and for older workers as compared
to younger workers. Results indicated that the probabilities of induction in the
informal employment were lower in Europe than United States. The main conclusion
of the study was that rates of self-employments were decreasing across the OECD
from 80 countries with the exception of UK and Newzealand.
Calves et al. (2004) assessed the changing pattern of youth employment in the
labour market based on National Representative Survey Data collected in 2000 in
Barkina Faso. The authors used descriptive techniques. Findings portrayed that people
with initial formal education participated in informal economy. The results showed
that urban informal sector provided exceedingly higher employment opportunities to

108
the young people with low formal education. The young age migrants entered the
labour market because of urbanization and unemployment and exacerbated the
competition in labour market. The policy implication was that the training
opportunities should be given especially school going young people to recreate the
education and employment relationship and to meet up the labour market demand for
creative and vibrant operators in informal labour market. In addition, the provision of
scholarships to encourage female school enrolment, vocational and technical training
facilities and loan facilities to prop up female informal entrepreneurship were required
to endorse equal access to young urban workers.
Bulutay and Tasti (2004) studied the informal sector in the Turkish labour
market by utilizing data from household labour force survey and SIS sources.
Analysis was based on the descriptive techniques. The result showed that informal
sector was overpowering.The results also indicated that earnings and wages of the
workers in the informal sector were low and self-employment rate was dominantly
high in the informal sector.
Guang and Zeng (2005) analyzed the migration as second best option based on
data from the Chinese Life History survey in China and United States in 1996.
Individual and household characteristics were included as explanatory variables. The
authors used the logistic regression model. Results indicated that workers were more
likely to be employed as non-farmer, migrant workers, wage workers and
entrepreneurs with age. Result showed that male workers participated more in non-
farm job and wage work. Result also found that migrant workers and those who had
non-farm job were married. Furthermore, migrant workers normally earned higher
income but they suffered from inferior work and living conditions. Finally, a large
number of Chinese migrated to the cities to avoid low status and unprofitable work in
grain cultivation.
Matya et al. (2005) analyzed socio-economic factors influencing people to
become fisherman around Lake Malombe. Primary as well as secondary sources were
used to collect the relevant data. The authors explored the relationship between socio-
economic factors like gender, age, marital status, family size, literacy level, land
holdings, access to credit and other income generating activity and decision to
become fishermen. The logistic regression model was used in this study. The study
109
results concluded that most important variables i.e. gender, access to credit, land
holding size and no other income generating activity influenced people to engage in
fishing industries. Results suggested that a multi-sectoral approach was required to
establish adult literacy institutions, family planning clinics to reduce the population
growth rate, to increase agricultural productivity and to enhance business
entrepreneurship to reduce effort in the lake.
Gindling and Terrell (2005) analyzed the effect of minimum wage on actual
wages in formal and informal sectors in Costa Rica. Using 12 years of micro data,
results demonstrated that legal minimum wages significantly affected the wages of
employees in very small ( five or lesser employees) and large firms in both the urban
and rural areas.
Pisani and Voskowitz (2005) studied the labour market for gardeners in South
Texas. The authors used the logistic regression model. Result indicated that gardeners
were Mexican by birth and nationality. The middle aged gardeners, having Middle
level education worked full time in gardening. The variables such as previous work
experience as a gardener, medical insurance and year around work as gardener were
most important variables that determined their employment. Results highlighted that
they were occupied in the gardening trade and their hourly wage was better as
compared to skilled occupations in the region. The study concluded that it was the
profession of gardening which materialized the dream of these workers to be able to
make their earnings through their favourite occupation.
Kim (2005) used a household survey to analyze the effect of poverty on
informal economy participation in Romania. The author used a simple theoretical
model. The results revealed that low income and a gap between desired and actual
income level forced the participants towards informal sector. Furthermore, individuals
persuaded for informal sector due to poverty.
Krstic and Sanfey (2006) investigated level of poverty and well-being among
the participants in the informal sector based on panel data from the living standards
measurement studies in Bosnia and Herzegovina. A Probit model was estimated to
determine individual and labour-force characteristics that were related with successful
transitions out of poverty. Results found that the workers in informal sector suffered
110
more from poverty than formal sector workers. Furthermore, there was found an
earning inequality in the informal sector. The study results indicated that the
participants in the informal sector were less satisfied as compared to all other groups
in the labour market. Generally, results concluded that informal sector represented
itself as an imperative coping strategy for the bulk of people yet the formal sector
provided much better opportunities for the uplift of their living standards.
Valodia et al. (2006) studied the low wage and informal employment based on
data taken from Labour Force Survey 2000 and 2004 in South Africa. The authors
used the descriptive technique. The participants in informal emloyment were black,
married and young in great number. Results found that men earned comparatively
higher income than women. The study results indicated that it was possible for the
participants with high education to obtain highly paid job. The study concluded that
workers with low human capital obtained more precarious employment. On the
whole, they were not a part of trade unions.
Paratap and Quintin (2006) investigated about the segmentation of labour
market in developing countries through a semi-parametric approach. The data were
drawn from Argentina‟s urban household survey from 1993 to 1995. The parametric
tests were adopted to examine the relationship between individual characteristics like
education level, gender, age and job characteristics i.e. establishment size, hours
worked and the informal sector. The results pointed out that on average 60% in the
establishments that hired 5 or lesser employees. The results showed that the female
informal sector employees were in high proportion. The results also indicated that on
average, the wages in the formal sector were higher than wages in the informal sector
and output in informal sector was observed about 10 or 15% of GDP in informal
sector in most developed economies. It was found that the tax burden, weak rule of
law, government corruption, and heavy bureaucracy alongwith registration, weak
security of property rights and the quality of the legal system changed the size of
the informal sector in the countries who have similar economic development
levels.
Mitra (2007) focused on the role of networks in getting jobs in urban labour
market. The research was based on a primary survey of 200 households in Delhi
slums in 2004-2005. The explanatory variables such as age, social capital in terms of
111
contact with relatives, villages and neighbors, members of the same caste group,
friends, colleagues, religious organization, educational categories, household size,
caste groups, gender differences, and access to political contact and availability of
property at the place of origin affected the participation of the informal sector
workers. The author of study used the binomial logit model. The results highlighted
that bulk of workers was engaged in the urban informal employment through various
informal channels or networks of information flows.
Reddy (2007) utilized primary data in order to examine the contribution of the
urban informal sector to create employment opportunities and to alleviate poverty in
Fiji‟s developing economy. Study results showed that education level of operators,
family labour involvement and experience played a central role to alleviate poverty in
developing economy. By using probit model, results found that workers in the
informal sector were educated at primary level and mostly family members were
involved in enterprises. It was also found that the participants experienced a
tremendous increase in incomes and assets in informal sector as compared to pre-
informal sector days. Findings also suggested that informal sector contributed
significantly to reduce poverty and to generate employment.
Jampaklay et al. (2007) examined the residential settings of migrants in
Thiland. The data were drawn from a survey of migrants from rural Nang Rong
district, Bangkok metropolitan area and the eastern Seaboard. The individual
characteristics, education, type of work, work place context, and migrant experience
were used as independent variables in the analysis. The logistic regression techniques
were made in the study. The regression results showed that migrants were culturally
different, socially unified, and organized around certain occupations and work place
settings. It was found that human capital along with employment situation
significantly influenced neighborhood co-region concentration. The result of co-
regression cluster showed no influence of duration on residence. Findings indicated
that high socio-economic status was related with migrants‟ residential integration with
majority group populations located in more rich and desirable communities. It was
also found that both the perspectives were supported around Isan clustering among
migrants. Finally, the results found a relationship between education and residence
along with a relationship between employment and residential settings.
112
Gunatilaka (2008) examined the nature, probability of employment and
determinants of wages by drawing data from the QLFS of 2006 in Sri Lanka. The
author found a relationship between demographic and occupational variables and
informal sector employment. The author used multinomial logit model to find out the
determinants of the informal sector employment. The results revealed that the
contributing family workers were more likely to be female and married. The results
also indicated that small business informal employees were facilitated in formal
enterprises by family ties and family labour. Furthermore, better educated attainment
decreased the probability of being employed in the informal sector employment. The
informal sector employment decreased with different education levels. As far as sex is
concerned, probability of being employed in informal sector tended to increase. The
study confirmed that precariousness was major characteristic of the informal
employment which favoured male rather female workers. Policy required dealing with
the issue of job creation by improving microenterprises employing half of informal
employees. The research required that emphasis should be laid on the costs and
benefits of formalization. Research and policy were required to deal with the factors
that restrict formal employment expansion in formal enterprises simultanously. The
restrictions on infrastructure and labour regulations were required to be noticed.
Baudar (2008) focused on immigrants‟ decisions to be self-employed based on
primary data from the survey of 509 Vancouver residents of predominantly Chinese
immigrants‟ neighborhood and South Asian immigrants during 2003 in Canada. The
author found a relationship between gender, language, place of residence, labour
status, occupation, class, school, continuous variables (i.e. age, household size and
years of education) and self-employment by using the Ordinal Logistic Regression.
The results indicated that origin and background of immigrants positively affected the
desire to become self-employed. The results also indicated that there was consistent
relationship between urban background and lower desire to be self-employed as
compared to rural background. Furthermore, females experienced lower opportunities
to be self-employed. It was concluded that urban or rural background was further
leading variable that determined entrepreneurship.
Based on British household survey data (BHSD) data, Mentzakis et al. (2008)
examined the determinants of co-residential informal care. The authors used

113
regression techniques. The result showed that the probability of the informal care
decision was lower with age. Result also revealed that probability of female care
given decision increased with household size. The main conclusion was that
participation in the labour market decreased the probability of care given decision.
Heckman et al. (2008) estimated the earnings functions and marginal internal
rates of returns for different levels of schooling to access the need to increase or
decrease expenditures on education by using data for born men taken from household
surveys in 1940-2000. The authors applied a general non-parametric approach to
estimate the rates of returns. The variables such as tuition costs, income taxes and
non-linearities in the earnings schooling, experience relationship were used. The
results showed that returns to college level education were also increasing. Result
also indicated that there were comparatively larger returns to graduation level
education than high school level education. However, both were observed increasing
with the passage of time.
Frost and Jones (2008) analyzed the returns to qualifications among urban
youth in Egypt by using data carried out from Egyptian labor market survey (ELMPS)
2006. The authors used explanatory variables such as human capital characteristics,
current experience, non-productivity related variables to measure the earnings. Study
was based on the standard Oxaca-Blinder model of wage decomposition with
mincerian human capital and experience term was used. The returns to skills training
in the informal sector employment were higher. Moreover, there were similar returns
to informal and formal work experience across employment groups.
Attia and Moawad (2009) examined the informal economy as an engine for
poverty reduction and development. Informal sector was characterized by low
productivity, low wages, poor working conditions and long working hours. Results
showed that people got many opportunities of jobs in the informal sector in society,
including the formal sector, with the goods and services. Some showed their
willingness to enter in this sector. The study concluded that bulk of the poor
participated in the informal sector in Egypt.
Mundalmen and Montes Rojas (2009) emphasized on self-employment and
micro-entrepreneurship as desired outcome by using data from urban household

114
surveys in 1995-2003. The authors analyzed the effect of explanatory variables which
included education, age, gender, a variable identifying household heads, firm size, a
public sector employment dummy, last period‟s wage (log hourly wage) and a
variable identifying those individuals who became unemployed in the survey in
between on self-employment and micro entreprenuership. Three sets of estimates
were made by using descriptive statistics, probit estimation and regression equation.
The result showed that the earnings of the workers in the informal sector were much
lower as compared to formal sector employees. Additionlly those job holders who at
present earned higher salaries desired for individuals having high human capital to
transit themselves as enterprenuers at a higher rate.
Schiitte (2009) aimed to highlight that the poverty and insecurity were
intricately intertwined with conditions of informality in Afghan cities. Data was
collected from fourty poor households in Kabul in relation to the informal sector.
Results revealed that the urban poor survived with livelihood risks all the way through
a range of the informal arrangements. The informal settlements were still not supplied
through basic amenities such as electricity, safe water supply and adequate sanitation
systems. Additionally, the people deprived from basic services had to face health
risks. Owing to high competition, they could not avail the opportunities in the
informal sector.
Wamuthenya (2010) examined the determinants of formal and informal sector
employment by using data from Labour Force Survey cross sectional data of 1986 and
1998. A multinomial Logit model was applied to indicate the relationship between
personal characteristics like age, level of education or years of schooling, marital
status and household headship and wages in the market and household characteristics
(such as child care responsibilities: number of young children below school-age, the
size of the household, and the presence of female relatives in a household) as well as
the socio-economic background, and formal and the informal sector employment. The
findings indicated that the urban formal sector employment, the informal sector
employment and unemployment increased with age in 1986. The study results also
found that male and female workers with low level of education were forced to work
in the informal sector while these possessing low level of education prefered to join
formal labour market. Furthermore, the old age people were more likely to be
115
employed in the formal and informal sector employment. It was also pointed out that
married people and men were inclined to informal sector. The results concluded that
working hours were unified and it was more flexible to combine care and productive
work in the informal sector.
Chunquize (2010) studied the contribution of the informal sector in
unemployment situations of Nigerian third world cities. The author adopted
methodological approach for reviews of multiple documents including published
books and journal articles. The different studies on aspects of the informal sector
around the world revealed the incapability of the formal (modern) sector employment
to absorb such an influx of job seekers. Findings illustrated that the small enterprises
contributed impressively in the informal sector of the Third World with regard to
employment in developing countries. Awareness about the potential of the sector was
important to decrease the problem of unemployment. Without the informal sector, the
unemployment situation would be worse. Consequently, the informal sector deserved
acknowledgement from politico-economic planners. The informal sector was taken as
a neglected sector and it got very little attention and assistance from the government.
Qui and Hudson (2010) explored the private returns to education by using data
from China Health and Nutrition Surveys (CHNS) in 1989, 1993, 1997 and 2000.
Factors that affected the returns to education were number of years in formal
education, potential experience, gender, sector of employment and regions. By using
the OLS technique, results highlighted that there were perceptible increase in rates of
return to education especially from 1997 to 2000. In addition, the returns to education
depended mainly on gender and sectors of employment. Moreover, the education
decreased the earnings gap. The results suggested higher productivity and marginal
productivity of labour productivity itself in Beijing and specifically Shanghai.
4.4 Literature Review of the Urban Informal Sector in Pakistan
In this section we have presented the review of literature in Pakistan. The
review is concerned with different aspects of urban informal sector in Pakistan. The
studies regarding urban informal sector, poverty and development are also presented
which give an important insight in order to understand the informal sector.
116
Guisinger et al. (1984) analysed the earnings, rates of return to education of
the participants in the informal sector in Pakistan by collecting data from a survey of
1000 households in Rawalpindi in Pakistan. The authors of study used the regression
model to analyze the influence of schooling and sector of employment on earnings.
The results indicated that there were low rates of return to schooling regarding rate of
return on physical capital. The rates of return to schooling were also low in other
developing countries.
Kazi (1987) observed the urbanization due to rural to urban migration, and
low rates of employment expansion in the modern sector and suggested the beginning
of the informal sector. The author used primary data in Rawalpindi and Lahore in
Pakistan. Percentage or mean average of age, schooling, source of acquisition and
monthly income have been shown. The results described that eighty nine percent of
the self-employed earned more than Rs.1500 as against Rs. 1100 earned by formal
sector employee. Findings showed that the earnings of the skilled self-employed in
the informal sector were greater than the earnings of skilled workers in the formal
sector. Moreover, the study suggested that the informal sector played a great role in
skill learning process in the economy by introducing a system of informal
apprenticeship as it was advantagous for both employer and apprentice.
Kozel and Alderman (1990) estimated the factors which determined work
participation and decisions of labour supply in urban areas of Pakistan economy. The
data was collected in 1986 under the auspices of international Food Policy Research
institute (IFPR) and Pakistan Institute of Development Economics (PIDE). Age, age-
square, dummy variables for the highest level of education achieved (primary, middle
school, secondary, university) and family structure were used as explanatory
variables. The authors made use of tobit and probit estimation technique. The
empirical results revealed that wage tended to increase and reached at the highest
level of 46 years. The results also found a negative relationship between age-squared
and total wages of the participants. Furthermore, the educated young males or almost
informal workers increased the job search for the extended family structure along with
the availability of remittances. The study results concluded that labour force
participation increased with an expansion in expected earnings and remuneration

117
definitely revealed discrepancies mainly caused by differences in human resource
capacity due to education and work experience.
Ali (1990) focused on problem of rural women in the informal sector and its
contribution to the rural non-formal sector. The study conducted a survey in six
villages of Multan district that were selected randomly. The results illustrated that the
social and cultural factors were not the hindrances to partake in economic activities
for prosperity and well being. The study results revealed that the economic factors
were more responsible for miserable condition of women engaged in rural areas and
were great hurdle for better utilization of their skills, efforts and time.
The earnings functions in Pakistan‟s urban informal sector were determined by
Burki and Abbas (1991) based on data from the survey of male self-employed in the
skill-intensive urban informal sector of Pakistan, conducted by the department of
Economics, Quaid-e-Azam university, Islamabad in 1989. The human capital
variables like schooling, experience and vocational training influenced the earnings.
The authors estimated the pure human capital earnings functions. The evidence
indicated that reward to human capital investment was extraordinarily analogous to
the existing reward in the formal sector of Pakistan. The important findings of study
were that education, vocational training and experience were positively related with
the earnings of those who stick to the urban informal sector of Pakistan.
Burki and Ubaidullah (1992) examined the earnings, training and urban
informal sector employment in Pakistan based on the survey data of Gujranwala city.
The study was based on earnings functions of workers. The authors used mean
average regarding earnings, training and employment. The evidence indicated that
earnings or wages of the workers in the informal sector were significantly higher as
compared to the earnings of government employees in the formal sector. Furthermore,
bulk of workers engaged in the informal sector was not recent migrants and informal
sector enhanced presence of its participants. The results also found that both groups
were equally advantageous by skill generation under ustad-shagird system. The study
suggested that there was a need to introduce some planned measures by the
government in order to promote this very important sector of the economy.
118
Ashraf and Ashraf (1993) used household income and expenditure survey data
in 1979 and 1985-86 to analyze the male-female earnings differentials in Pakistan.
Factors that affected the earnings were age, province of residence, education level and
industry. The study was based on the methodology of Oaxaca (1973) and Cotton
(1988). The results indicated that the gender earnings gap between 1979 and 1985-
1986, declined significantly. The results of the study also showed that age
significantly affected the earnings of both male and female in both the years. It was
very small earnings differential in inter-province in the case of NWFP-Sindh. The
coefficient estimate for Balochistan was statistically insignificant in 1979 but was
highly significant in 1985-86. The findings showed that workers earned at a lower rate
in manufacturing, electricity and construction sectors as compared to their agricultural
counterparts. The earnings increased with different levels of education and earnings
tended to increase with age but decreased with age-squared in Pakistan. Finally,
earnings and sector of employment or occupation were negatively as well as
positively associated.
Burki and Afaqi (1996) studied informal sector in Pakistan. This study
reviewed the existing literature on the informal sector of Pakistan. Results illustrated
that informal sector gained powerful importance due to its noteworthy growth and
positive effects on employment especially in urban areas during the last two decades.
Malik (1996) discussed urban poverty alleviation through development of the
informal sector. The data sources were ESCAP, State of Urbanization in Asia and the
pacific, 1993(ST/ESCAP/1300), 1993. The author analyzed the trends in the
incidence of urban poverty in selected developing countries of ESCAP region.
Findings demonstrated that the role of the informal sector was remarkable to alleviate
poverty, and to create employment and to generate income. Moreover, he emphasized
on the growth of workers‟ earnings and productivity in the informal sector. The crux
is that the informal sector expanded due to growing urbanization, insufficient jobs in
the formal private sector and curtailment of jobs in the public sector jobs. The author
emphasized that govt must solve the problems and constraints and formulate
strategies on the development of informal sector. The author suggested a holistic
approach to cope up with the multidimensional problems of the informal sector.

119
Kemal and Mehmood (1998) analyzed the characteristics of workers in the
urban informal sector of Pakistan. The study was based on the survey of urban
informal sector in four provinces of Pakistan conducted in 1992. The percentage
distribution of self-employment by their characteristics was shown. Results also
showed that some young persons joined the informal sector and stayed there till they
got employed in the formal sector. The self-employed of sizeable proportion took it as
a permanent activity. In addition, the urban informal sector was comprised above half
of workers with least secondary education. Findings indicated that only one third
entrepreneurs possessed similar education levels as that of their fathers. The study
also illustrated that a large proportion of the entrepreneurs possessed experience in
another field. In conclusion, the informal sector was characterized as permanent
activity of the educated and skilled people in the urban areas of Pakistan.
Sargana (1998) emphasized on the urban informal sector by conducting a
survey in Rawalpindi and Islamabad in Pakistan. The author demonstrated the impact
of factors such as years of schooling, experience and on the job training on earnings
of the workers in informal sector. The Mincerian model was estimated in this study.
The results of study indicated that income expanded due to increase in education and
experience. The regression results indicated that schooling payed extra or
supplementary to the self-employed than wage earners. The results also indicated that
earnings of informal sector workers increased due to an increase on the job training.
The results suggested the importance of human capital variable to enhance earnings of
the participants. Policy implication was that investment should be ensured on both
human and physical capital. The informal sector can be promoted to assist the poor
without any risk to rich and redistribution of the income. The results suggested that
more investment should be made to middle level education and there is a need to
launch schools in urban areas where the bulk of workers can avail the facility to much
extent. Moreover, measures should be taken to protect the workers from the whim of
police and other authorities in neighbourhood. Yet, the emterprises must be
responsible to pay the taxes.
Siddiqui and Siddiqui (1998) studied the decomposition of male-female
earnings differentials by using data from Household Income and Expenditure Survey
1993-94. The authors examined the impact of variables like age, age-squared, area
120
(urban / rural), number of days worked, dummy variables for provinces, and dummy
variables for different occupational categories, dummy variables for different
industrial categories and dummy variables for employment status on earnings. The
methodology of Oaxaca (1973) and Cotton (1988) was adopted. The results of
earnings functions showed that returns to schooling for male workers were higher and
female returns to schooling were also higher. The findings indicated that age, area,
provinces and employment status determined the earnings for both the gender. Results
revealed a high level of market disregard against female workers. The results also
indicated that old age females gained income more than their male counterparts.
Nasir (1998) discussed the determinants of personal earnings by utilizing the
National Labour Force Survey 1993-94 data in Pakistan. In this study, variables
consisting of educational categories, age, and its square terms, job training, regional
location, gender groups, occupational catagories and size of establishments
determined the earnings. The author of the study estimated the wage function by the
maximum likelihood method using probit estimates of wage participation. The results
demonstrated that returns to education were higher as consistent with the human
capital theory. Results also indicated that the age and education were crucial factors
that determined earnings and productivity. The author suggested that professions i.e.
agro-based industries and cottage industries shoud be encouraged to reduce the
regional earnings differential in rural areas. More incentives were recommended to
labour-intensive industries in order to absorb unemployed youth so far. The author
suggested policies to enhance human capital to ensure females‟ more participation
and enhanced employment opportunities. The low mark-up rate formal credit given to
females who launch businesses at micro level to facilitate the attenuate the burden of
domestic labour can make certain substantial increase in their earnings.
Nasir (2002) discussed human capital in Pakistan. The author used PIHS data,
in 1995 for gender disaggregated analysis. The important factors influencing the
earnings were education, experience, technical training, and numeracy skills. The
analysis based on mincerian model. The results also indicated that there was a positive
association between higher earnings and higher levels of education. The results also
indicated that literacy, numeracy and technical training made substantial increase in
males‟ earnings. The education played its part too in development process of country.
121
It also improved the productivity of workers which was considered an obligatory
component of growth. The study further concluded that earnings of male and female
workers were influenced noticeably by human capital. Policy implication in terms of
an urgent need to enhance the literacy and numeracy skills by providing education
(formal and informal) was suggested.
Naqvi and Shahnaz (2002) examined the women‟s participation decision in
economic activities by using data from Pakistan Integrated Household Survey (PIHS)
in 1998-99. The authors adopted probit and multinomial logit model in the study. The
study results indicated that education and age positively affected the women‟s
decision to take a part in economic activities. It was also found that married women
participated less in economic activities. Finally, results showed that economic
difficulties, number of children and household size influenced negatively the
women‟s decision.
Arif and Hamid (2009) recognised urbanization, city growth and quality of life
of women by utililizing both, the 2001 Pakistan Socio-Economic Survey (PSES) and
Pakistan Rural Household Survey PRHS undertaken by PIDE. Authors evaluated
quality of life regarding food security, health, wealth, housing, children‟s education
women‟s employment, and security. Results illustrated that migrant women due to
poverty preferred to be household informal sector workers and were satisfied. They
had better job opportunity, communication and facilities and the quality of life was
much improved than village. In addition, in urban areas, social services were easily
accessed in urban areas. These services were equally beneficial for both migrant and
non-migrant population. Employment opportunities along with access to social
services helped migrants to steadily improve their standards of living. The migrant
women lived in poor houses with little access to basic necessities and worked for low
wages in poor working condition. They became more empowered to manage their
household affairs and to feed their children.
Malik et al. (2010) investigated the relationship between socio-economic
variables and casual employment by using primary data. The authors used the logistic
regression model. The results revealed that age, education, closed relative‟s education,
assets and family setup reduced the probability of casual employment. The results
also pointed out that married and rural-dwellers participated more in casual

122
employment. The study suggested that govt should facilitate the participants with
tertiary education.
There are very few studies about the urban informal sector and characteristics
in Pakistan but still there is no research mode of the urban informal sector
employment at national level especially in Southern Punjab, Pakistan. Further,
estimation is different due to the areas of study, definition of the informal sector
employment and methodology. There is a need of national level survey using
scientific technique to have the fixed figures of the urban informal sector employment
in Pakistan.
4.5 Concluding Remarks
In this chapter, we have explained literature on some classic theories of
growth and development. We have also made a detailed view of some empirical
studies on urban informal sector and employment at national and international level.
The studies regarding earnings determinants in the urban informal sector are also
reviewed. Furthermore, the issues regarding development, poverty and the urban
informal sector are also taken into account. This review of literature highlights that
the urban informal sector employment is an emerging issues of research in labour
economics. We have observed that major findings of the studies are characteristics,
size, nature, determinants and earnings determinants of the urban informal sector.
These aspects and motivating factors are relevant with literature prevailing in Pakistan
economy. It can be concluded from the literature that however much research has
been done on the urban informal sector regarding earnings but still it requires more
research in some areas in the informal sector. It is noteworthy that there is a
deficiency in research on the probability of the informal sector employment in
Pakistan and especially in Southern Punjab.
The present study not only describes the characteristics, nature and size of the
informal sector but also analyzes the determinants for indulging in this sector.
Consequently, this study differentiates from previous studies as it is endowed with a
logical and comprehensive analysis of factors which influence the probability of
workers being employed in urban informal sector in detail. The present study not only
finds out the earnings determinants of the workers in the informal sector but also
123
reveals how much the participants possess economic, human and social capital. The
informal sector employment is higher in Pakistan and the urban informal sector is
playing an imperative role in employment creation, income generation and in the
development of the country.
124
Chapter 5
MEASURING URBAN INFORMAL SECTOR: SOME
BASIC ISSUES
5.1 Introduction
Urban informal sector has significance in employment creation, income
generation and economic development. Numerous researches have been made on
informal, urban informal sector and economic development issues at global level.
Many studies have been conducted on earnings determinants of the participants in the
urban informal sector in Pakistan. The present study assesses nature, size and the
probability of urban informal sector employment in Southern Punjab by using primary
data through household survey from Southern Punjab, Pakistan.
The present study of the urban informal sector generally depends on the
primary source of data collected from three divisions of southern Punjab by author
during July-December 2012. In the present study, we have used some qualitative and
quantitative techniques for preliminary and empirical analysis of the determinants of
urban informal sector employment in Southern Punjab, Pakistan.
This chapter is arranged as follows: In section 5.2 we explain a profile of the
selected study areas (i.e. Bahawalpur, Multan and Dera Ghazi Khan Divisions) of
Southern Punjab in detail. In section 5.3, we explain the issues relevant to sampling
design and questionnaires. The limitations during field survey are pointed out in
section 5.4. The determinants of the urban informal sector employment are explained
in detail in section 5.5. In section 5.6 the model and methodological issues concerning
descriptive data analysis and econometric specifications are shown. Finally, section
5.7 shows some concluding remarks.
5.2 Profile of the Study Areas
Urban informal sector is most important for employment creation, income
generation and poverty reduction in Pakistan. It contributes 71% to GDP of the
economy. A high proportion of labour force (rural-urban migrants and urban dwellers)
turns into the urban informal sector. There are 34 districts and nine divisions in
125
Punjab province. Three divisions such as Bahawalpur, Multan and Dera Ghazi Khan
are important and form integral part of Punjab Province which are chosen for research
purpose because the bulk of the rural-urban migrants are inhabited. These districts
enhance the growth potential of the informal sector and are developing. From each
three divisions, one district has been chosen. Further, two Tehsils have been selected
randomly from each district.
5.2.1 Bahawalpur Division
The district Bahawalpur forms one of the southern parts of the province of
Punjab. Ahmadpur East, Bahawalpur, Hasilpur, Khairpur Tamewali and Yazman are
the five sub divisions of the district. The total area of district Bahawalpur is about
24,830 sq. km. The very district is bounded on north by Multan, Lodhran and Vehari
districts, on east by Bahawalpur district and India, on the south also by India and on
the west by Rahim yar Khan and Muzaffargarh districts. From all of its sides, the
district is land locked. In the South and South-East, the Cholistan reaches to the
Indian border while in the north it turns parallel to the Southern part of Punjab plains
and river Setluj makes a common border with the Lodhran and Muzaffargarh districts.
There are three parts the riverain area, the plain area and the desert area of the district
Bahawalpur.
The census report of 1998 indicates that the climate of district Bahawalpur is
tremendously hot and dry in summer while it is cold and dry in winter. The annual
rain precipitation of 125 to 200 millimeters generally occurs during the monsoon
season in July and August. On average, there occurs 10-25 centimeters rainfall
because the district is at the tail of the Monsoon region. The Setluj River with its
length 176 kilometers from Head Islam to Head Panjnad flows in the North side of the
District.
Culturally, the life style of people is very simple. The women wear generally
Ghagra, Cotton suit and Chunni in desert areas. The villagers usually wear Chadar
and Kurta and Turban on their heads. The males use shalwar kameez and almost all
young men wear trousers and shirts in urban areas of the district. Nearly all the
people of district eat good and simple food.
126
The district has a population of 2.433 million or 2433091 as indicated by annual
average census report of district Bahawalpur that is issued in October 1999. On
average, rate of population growth is 3.07 percent in the district. The total area of the
district is 24830 sq. km with a population density of 98 persons per sq. km. The
average household size is about 6.8. Rural dwellers are almost 72.7 % of the total
population while those persons who live in urban areas are 665304 or 27.3% of the
total population of the district.
One Municipal Corporation, two Municipal Committees, one Cantonement
and four Town Committees are present. Total number of Mauzas is 1216. The
Muslims are 98.1 percent of total population. While the proportion of the Hindus and
the Christians is 0.9 and 0.6 percent points respectively. Siraiki is the major language
that represents 64.3 percent of the population, followed by Punjabi language spoken
by 28.4 percent of population. The proportion of the infants less than one year,
children under 5 years, children under 10 years, and those who are 15 years old is
observed 2.3 percent, 14.9 percent, 31.4 percent and 44.4 percent respectively of the
total population. The 50.7 percent population is above 18 years and 42.9 percent are
above 21 years, of the total population. The working age group i.e. 15-64 is
proportionately 52.3 percent and those who are over 65 year are 3.3 percent resulting
age dependency ratio of 91.2 percent. The proportion of never married is lower at 28
percent than the married of 66.2 percent of the population. The widowed and divorced
are 5.5 percent and 0.4 percent respectively.
The literacy rate of district Bahawalpur is observed 35%. The literacy rate is
higher at 57 percent in urban areas as compared to low literacy rate of 26 percent in
rural areas. The literacy rate for males is 44.9% while literacy rate for females is 24%.
Considering education level, 20% are below Primary, 32% have passed Primary
education, 20.8% percent have completed Middle level education, Matriculates are
16.5 %, and Intermediates are 5.2 percent. Those who have accomplished Graduation
and Master‟s level education are 3.1% and 1.4% respectively out of the total educated
population. A large number of populations are engaged in agriculture. The percentage
share of participants is 72 percent in agriculture, forestry, hunting and fishing
industries. The percentage share of workers in construction industries and community,
social and personal services industries and agriculture, forestry, hunting and fishing
127
industries is 26.4 percent and 22.0 percent respectively. Most important crops of
district are pulses, rice, sugarcane and grain.
The district census report of 1998, explains that the 49.3% is economically
active out of the male population, children less than 10 years are 30 percent, students
are 10.1 percent, share of domestic workers are 1.6 percent while landlord, property
owners, retired and disabled persons are 8.2 percent. There is higher absorption rate in
urban areas as compared to rural areas. The unemployment rate is 19.8 % (20 %
among male workers and 6.1 % among female workers).
While, the underemployment rate (19.3%) is low in rural areas than urban
areas which is 21.1%. The share of workers in agriculture and fishry is 44.7 percent.
While the share of elementary occupations and service workers, shop and market sale
workers and craft and related trade workers is 34.8 percent, 9.2 percent and 3.5
percent of the employed workers. The proportion of self-employed, private employed
and Government employed is 68 percent, 18 percent and 6.5 percent respectively out
of economically active population. 18.3 % are private employees and 6.5% are
Government employees. The unpaid family helpers are recorded as 6.3% of the
employed population. The district is well-known for its trade production, trade centre
and Bahawalpur chamber of commerce.
As far as, educational and health institutions are concerned, there are 797
Primary schools for males and 756 Primary schools are for females while private
registered schools are 138. For males and females, 80 and 85 Middle schools are
providing educational facilities respectively. There are 120 private registered Middle
schools. Females are given education by 13 community model schools and males by
100 Tanzeem schools. There are 273 masjid Maktab schools and 60 Arabic schools
are educating male students. The number of high schools for males is 77 and for
females are 45. There are 80 private registered high schools which provide education
to the students. The higher secondary schools for males and females are 4 and 3
respectively. Moreover, it is noted that there are two inter-colleges for females, 6
degree colleges for males and 3 for females and one commerce college in the district
Bahawalpur.

128
As regards professional and higher education, there are 3 commercial
institutes, 3 vocational institutes, one polytechnic institute, 3 elementary colleges, 2
medical colleges, 1 paramedical school, 1 nursing school and one university which are
facilitating the people with education and training in district Bahawalpur. Major
health institutions of this district are Bahawalpur Victoria Hospital, Juble Female
Hospital, Mission Hospital, Tehsil Headquarters Hospital Hailpur, Ahmad pur East,
Yazman and Khairpur Tamewali, Quaid-e-azam Medical College Bahawalpur, Tibia
College Bahawalpur, Homeopathy College Bahawalpur, Pera Medical School
Bahawalpur, and Nursing School Bahawalpur are medical teaching institutions.54
5.2.2 Multan Division
Multan division comprises four subdivisions such as Multan Contonment,
Multan Sadar, Shujabad, and Jalalpur Pirwala. The district Multan lies in a bend made
in the course of five confluent rivers. The very district is bounded in the east by
Lodhran and Khanewal districts, in the North by Khanewal district, in the South by
Bahawalpur district dividing the two districts by Setluj River between and on the
West by Chenab across Muzaffargarh district is situated. The total area of the district
is reported as 3,720 sq. km. The district comprises four tehsils such as Multan Saddar,
Multan city, Shujabad and Jalalpur Pirwala. The district can be divided in the riverine
(which is high barren area) and Utar that shows low water level.
The climate is dry and hot in summer and cold in winter. The annual rainfall is
normally recorded about 186 millimeters. The rain fall during monsoons is high while
rain is very rare in winter.
Culturally, man in rural areas wears a pag (turban) on his head and Kulla or
cap inside. It is observed that the waist coat or Majhal, a Chola or shirt and Chaddar
or plaid worn over the shoulders as a normal dress. However, the western dress is
used by educated class normally in towns. The women commonly wear Shalwar or
Pajama or Chola or Kurta in urban and in rural areas. Mostly women observe pardah.
The Multani people eat delecious food.
54 See District Census Report of Bahawalpur, Government of Pakistan, 1999, Islamabad.
129
The total population of the district Multan in 1998 is 3,116,851 as specified in
March, 1998. The annual average growth rate is 2.7 percent during this period in the
district. The area of district gives population density of 838 persons per square
kilometer. The urban population is 1,314,748 or 42.2 percent of the total population
which showed growth at an average rate of 2.9 percent for years 1981-98. There is a
one Municipal Corporation, one Municipal Committee, one Cantonment and three
town Committees. As it appears from 1998 Census, the population of Muslims is
dominant at 99.12 percent. The next higher percentage is of Christians with 0.62
percent, followed by Ahmadis 0.09 percent. There is a small number of other
minorities like Hindu (jati), scheduled castes etc. The majority of the population of
60.67 percent speaks Siraiki language and Punjabi language is spoken by 21.64
percent of the population. Urdu and Pushto speaking are 15.86 percent and 0.62
percent respectively. While other languages Sindhi, Balochi, Bravi and Dari etc are
also spoken.
According to the census report, sex ratio is recorded at 110 percent with 108
percent in rural area and 113 in urban areas in 1998. The District Census Report 1998
points out that the proportion of the infants less than one year is 2.3 percent, children
under 5 are 14.3 percent, children less than 10 years is 30.3 percent, under 15 years
are 43.6 percent of the total population. Those who are above 18 years observed 51.3
percent while those eligible for casting vote are 43.1 (21 years and above) percent of
the total population. The working age group i.e. 15 to 64 years makes share of 53.2
percent. The percentage share of the people who are over 65 years is 3.2 percent that
shows high dependency ratio of 87.9 percent. It is recorded that the percentage share
of never married and married is 30.7 percent and 63.4 percent respectively. While,
widowed and divorced are 5.6 percent and 0.4 percent accordingly.
According to Census report of 1998, there was small-scale industry in Multan
before independence. Since 1947 Multan has become an important center of industry
such as textile industry and other industries linked to the agricultural production of the
district like cotton-ginning and vegetable oil etc. There are 243 registered factories
having less than 100 employees in each while 17 registered factories having more
than 100 employees in each during the year 1996.
130
The district census report describes that the literacy ratio is 43.4 percent in
1998. The literacy ratio of males is observed 53.3 percent and of females is 32.3
percent. The literacy ratio is comparatively higher in urban areas than rural areas for
both males and for females. The census report measures enrolment ratio which is 34.9
percent with significant rural-urban differential for both gender. 18.6 percent are
below Primary, those persons who have passed Primary level education are 30.7
percent, 21.6 percent have completed Middle level education, those who have
accomplished Martriculation, Intermediae level education and Graduation level
education are 16.2 percent, 6.3 percents 4.1 percent respectively. The Post graduates
are 1.5 percent while 0.4 percent is diploma / certificate holders out of the total
educated population. As regards sex differential, males are comparatively more
educated and have higher education than females. The life time migrants are 5.0
percent of population of the district.
Taking into consideration the employment structure, the economically active
population is observed at 24.3 percent in district Multan. Of the total male population,
45.1 percent are economically active, while the ratio of percentage persons who are
not active is 54.9 percent, children under 10 years are 30.3 percent, students are 7.4
percent, and domestic workers are 32.6 percent. There are 5.3 percent land lords,
property owners, retired and disabled persons etc. The employment is at higher rate in
urban areas as compared to rural areas. The unemployment rate is 20.5 percent due to
high unemployment rate amongst males i.e. 21.0 percent.
In 1998 census report, 39.5 percent has elementary occupation; skilled
agricultural and fishery workers are 25.5 percent. While, service workers, shop and
market sales workers and craft related trade workers account for 17.6 percent and 5.1
percent respectively of the total employed persons. In 1998 census report, 33.6
percent are engaged in agriculture and forestry occupation of the district Multan. The
workers involved in hunting and fishing industries are 23.8 percent where 18.3 % are
working in construction industries and community, social and personal services
industries. In the district, the employed population is registered at 79.5 percent of total
economically active population. There are about 58 percent people working as self-
employed, 27.6 percent are employed as private employees and 6.8 percent are
government employees. While, unpaid family helpers are recorded as 5.3 percent. The

131
difference in proportions of employed is significant between the genders and the
urban and rural residences.
The census report highlights that there are 2,173 educational institutions
performing in district Multan, reporting education from the level of mosque / primary
upto post graduate level. In district Multan, there are 590 Primary schools for males
and 800 Primary schools are providing education to females. The Middle schools
giving education to males are 101 and 77 to females. There are 173 secondary schools
providing education to males while 38 secondary schools are giving education to
females. There are 8 higher secondary schools out of which 6 are for males and 2 are
for females. There are 7 intermediate and degree colleges for males and 3 for females.
In the district, only 376 mosque schools are educating males. Regarding health
institutes, Multan district is having a Civil Hospital and Nishtar Hospital attached
with Nishtar Medical College is also situated in Multan city. Two Tehsil headquarters
Hospitals are present; one in Shujabaed Tehsil and other is in Jalalpur Pirwala
Tehsil.55
5.2.3 Dera Ghazi Khan Division
Dera Ghazi Khan is also one district of Punjab Province. The district Dera
Ghazi Khan is bounded on the North by Dera Ismail Khan District of NWFP and its
adjoining Tribal Area, on the West by Musa Khel and Barkhan districts of
Baluchistan province, on the South by Rajanpur and on the east by Muzaffargarh and
Layyah separating the later two districts by river. The total area of the district is about
11,922 sq. km. The very district consists of two tehsils Dera Ghazi Khan and Taunsa
and one De-Excluded area with an area of 3,814, 3,769 and 5.339 sq. km
correspondingly. Its rural area comprises 826 mauzas. Regarding area, district Dera
Ghazi Khan is divided into mountain area which is in the west and the plain area is in
the east. The hills of the Suleman Mountains cover the western half of the district.
The source of cultivation is the spill of the river Indus.
In district Dera Ghazi Khan, climate is extremely dry in the same way in the
hills and plains in summer and winter. Generally, food and life style of people of the
55 See District Census report of Multan, Government of Pakistan, 1999, Islamabad.
132
district is very simple. In the Western parts, the male dress consists of white Pagri,
Masons, a loose Kurta and big Shalwar. The dress of women comprises Dopatta,
Kurta and big Shalwar. Cultivation and livestock breeding are sources of livelihood of
population.
According to the Census report of the District in 1999, the total population of
the district is 1,643,118 as detailed in March, 1998 with an intercensal percentage
increase of 74.0 since March, 1981 when it was 943,665 sq. km which gives
population density of 138 persons per sq.km. The urban population is 228,839 or 13.9
percent of the total population with speedily average growth rate of 3.8 percent for the
period of 1981-98. There is one Municipal Committee and one Town Committee in
Dera Ghazi Khan. The higher proportion of population is generally Muslims i.e 99.56
percent.
Moreover, Ahmadis are with 0.20 percentage points. The scheduled Castes
with 0.10 percent come after Ahmadis. The major language is Siraiki being spoken in
the district by 80.3 percent of the population. The Balochi language spoken by 14.3
percent comes after Siraiki, followed by Urdu 3.2 percent and Punjabi 1.3 percent
while others speak Sindhi, Pushto, Bravo, Dari etc.
The census report shows that sex ratio is 108 percent with high ratio of 108
percent in rural areas as compared to 107 percent in urban areas. In 1998 census
report, the proportion of the infants under one year are 2.5 percent, children less than
5 years are 17.5 percent, children less than 10 years are 35.6 percent, less than 15
years are 49.1 percent of the total population. The proportion of over 18 years
corresponds to 46.5 percent while those who are 21 years or above are 38.7 percent of
the total population. The proportion of working age group i.e. 15 to 64 years is traced
as 47.6 percent and over 65 years 3.3 percent which results in ratio of 110.1 percent.
The never married are 23.1 percent, 72.1 percent are married, 4.6 percent are
widowed and 0.2 percent are divorced as detailed in census report of 1998.
As far as literacy ratio is concerned, it is noted 30.6 percent (42.1 percent for
males and 18.1 percent for females) in district census report of 1998. The noted ratio
is higher in urban areas as compared to rural areas for both males and females.

133
The enrolment ratio is 23.0 percent as measured from 1998 Census data with
significant rural urban differential for both males and for females. The person whose
level of education is below Primary is 22.9 percent, 30.1 percent has passed Primary
level education, 20.6 percent have completed Middle level education, 15.0 percent
have accomplished Matriculation, 5.7 percent have passed Intermediate. While, those
who are Graduates and Post graduates are 3.2 percent and 1.6 percent rsespectively.
About 0.9 percent is diploma / certificate holders out of the educated population. As
regards sex differential males are more educated and have higher education than
females. The life time-migrants are recorded 23,921 or 1.5 percent of population of
the district.
According to the district census report of Dera Ghazi Khan 1998, the
economically active population is 23.8 percent of the total population or 37.0 percent
of the population is 10 years and over. Of the total male population, 45.1 percent are
economically active, while 54.9 percent are those who are not economically active.
The children under 10 years, students, domestic workers, land lords, property owners,
retired and disabled persons are 35.3 %, 9.6 %, 1.2 %, 8.9 % respectively.
The participation rate is enlarging in rural areas as compared to urban
dwellers. The unemployment rate in the district is 24.8 percent which is due to 25.2
percent of unemployment among males and 4.8 percent of unemployment among
female workers. The share of employed in agriculture, in forestry, in hunting and in
fishing industries, followed by construction and wholesale, retail trade, restaurant and
hotel industries and construction industries are observed i.e. 67.4 %, 11.3 %,11.1 %
respectively. The community social and personal services industries workers,
wholesale retail trade, restaurant and hotel industries participants and workers of
construction industries are 40.5%, 24.8% and 17.5 % respectively in urban areas.
As far as, employment status is concerned, 75.2 percent are registered as
employed out of the total population. More or less three-fourths as 72.6 percent are
self employed, 9.9 percent are working as private employees and 6.3 percent of the
working population is government employees. 10.2 percent of the workers are unpaid
family workers. A larger number of people are employed in government jobs, Semi
government and private concerns. The skilled labour consists of masons, carpenters,

134
blacksmiths and gold-smiths in district Dera Ghazi Khan. It is noted that 9 industrial
units at large scale and the district is famous for lacquered articles.
Regarding educational and health institutes, 1,405 primary schools, 142
middle schools, 99 high schools and 8 higher secondary schools are providing
educational facilities to the people. There is only 1 intermediate college and 4 degree
colleges are established for both males and females in Dera Ghazi Khan Division. As
for professional and higher education: 2 technology and polytechnic institutes, 12
commercial training institutes, 12 vocational institutes and one university sub-campus
facilitate the people of district Dera Ghazi Khan. The district census report 1998
illustrates that there are 6 hospitals with 305 beds, 35 dispensaries with 14 beds, 9
Rural Health Centers with 180 beds, 52 Basic Health Units with 8 beds along with
one T. B. Clinics, 34 Sub-health Centers and 6 Mother Care Health Centers medically
facilitate people of the district.56
5.3 Sources of Data and Sampling Design
Usually, data can be gathered for analysis testing hypothesis and answering
the research questions to conduct the research. The data can be obtained from three
sources such as primary, secondary and tertiary sources keeping research in view.
The primary data, firstly, makes available the information by the researcher for
variables which are required for the specific purpose of the study. Accordingly, we
collect primary data for the present research.
For current study work, data has been gathered through a survey conducted in
urban regions of Southern Punjab that cover three divisions: Bahawalpur, Multan and
Dera Ghazi Khan and urban areas of these districts. Further, from each division, (i.e.
Bahawalpur, Multan and Dera Ghazi Khan) two districts (i.e. Bahawalpur and
Hasilpur, Multan and Shujaabad and Dera Ghazi Khan and Tounsa Sharif) are
preferably chosen to get precise information. A large number of people are occupied
there in the urban informal sector to earn their livelihood.
The data is gathered or obtained randomly about household from the areas
selectecd for sample purpose. Consequently, random or stratified sampling is applied
56 District Census Report of Dera Ghazi Khan, Government of Pakistan, 1999, Islamabad.

135
within each stratum which is a tactic to improve representativeness of the sample and
to reduce sample error. We have developed a comprehensive questionnaire for this
research. Furthermore, interviews are taken according to the requirement.
The questionnaire for this survey incorporated 6 groups of questions (location,
household characteristics, characteristics of participants of the informal sector, sector
of employment, personal and other socio-economic factors, household and
geographical factors and development indicators) in which questions is binary or
qualitative in nature. Ordinary least square method (OLS), Logit model estimations
and HDI are constructed on the basis of this data. This survey is conducted in 2012 by
the author who interviewed 1506 urban households (i.e. 506 households from
Bahawalpur division, 513 from Multan division, and 487 from Dera Ghazi Khan) in
the urban areas of Southern Punjab. Location for the survey is extended crosswise the
colonies, blocks and mohalas.
We have considererd representative sample of formal and informal sector
employed in Southern Punjab. The types of sectors covered are trade, services,
manufacturing, transport and construction in case of males and trade, services and
manufacturing for females. The sample includes all working persons aged 18-64 in
the survey year. For this research, we use samples of both married and unmarried
urban male and female workers. The information is obtained by workers and their
households with the help of questionnaire based on multiple choices and open ended
questions. The questions are of qualitative and quantitative nature. The interviews are
taken in mother language of respondents.
Out of 1506, 934 respondents are males and 572 are females in each division.
Out of the total 1506 respondents 986 are from informal sector while the 520 are from
formal sector. The sample size in current study is comparatively large. Further, out of
total 986 respondents, 23.32 % belong to the trade sector, 40.67 % belong to services
sector, in the sample 26.98 % belong to the manufacturing sector, 5.37 % belong to
the transport sector and 3.65 % are construction workers. Almost 27.48 % of the
respondents are wage-earners and 53.7 percent are the informal self-employed, 6.7
percent are salaried workers, family workers are 4.6 percent. The domestic workers
are 1.2 % percent.

136
Further, income of the participants of the informal sector is taken in rupees on
weekly and monthly basis. Income in the form of kind is converted into cash at
market price.
The sample urban area in district Bahawalpur consists of geographic areas of
Tehsil headquarter Bahawalpur (Riaz Colony, Satellite town, Maila gali, Farid gate,
Model Town B block, Model Town C block, Islamia Colony, Bindra basti, Quaid-e-
Azam Colony, Cheema Town, Chirimar Mohala), Tehsil Headquarter Hasil Pur
(Ghareeb Mohala, Satellite town, Madina town, Darbar road, Jadid Colony and
Mehmood Colony).
The sample urban area in district Multan consists of geographic areas of Tehsil
headquarter Multan ( Rashid Abad, Wahdat Colony, Dolat Gate, Bohar Gate,
Gulgasht Colony, Shamsabad Colony), Tehsil Head Quarter Shujabad (Murad
Colony, Bodla Colony, Rajpoy Colony, Jinah Colony, Multani Darwaza, Islamia
Colony.
The sample urban areas in district Dera Ghazi Khan consists geographic areas
of Tehsil headquarter Dera Ghazi Khan (Satellite town, 46 Block, Kachi Abadi,Y
Block, and Khayaban-e-Sarwar), Tehsil headquarter Tounsa Sharif (Muhala Khawaja,
Muhala Khosa, Muhala Qaisrani, Muhala Shamsabad, Mahala Sikhani and Muhala
Lashari). The interviews are applied from main colonies and towns of the selected
urban areas. Furthermore, the sample is randomly drawn for each stratified location.
The dependent variable is “urban informal sector” which implies small-scale
non-agricultural activities producing and distributing goods and services consisting on
self-employed workers, own-account workers57
, unpaid family workers, domestic
workers, and wage58
and salaried workers in small firms employing less than five
workers except technical and professional occupations in urban areas of Southern
Punjab. The informal sector employment indicates an engagement in economic
activities that are unregulated and unrecorded. These economic activities are done by
both (male and female participants) in trade, services, manufacturing, transport and
construction sectors of informal sector.
57 The survey also includes those self-employed who work on own-account basis in their profession
with unpaid family worker. 58 The survey also includes part-time and casual workers.
137
The urban informal sector is major provider of employment and income to all
these categories. Thus, study identified the personal, household, demographic and
socio-economic factors of these groups that manage, promote, and determine this
sector in urban areas of Southern Punjab. These identifying variables are the age in
complete years, complete years of education, marital status, sex, formal training,
father‟s educational status, mother‟s educational status, family setup, household size,
dependency ratio, number of children, number of male adolescents, number of female
adolescents, household‟s value of assets, spouse participation in economic activities,
and rural-urban migrant. Several variables make obvious policy proposals to enhance
the growth potential of the urban informal sector employment in the economy.
5.4 Survey Limitations
A lot of problems are faced while conducting survey. The respondents were
reluctant to provide pertinent information regarding age, personal income, family
income, consumption, working hours, household‟s value of assets, and education
level. As regards females, they were reluctant to give information about the household
head‟s income, assets, household‟s value of assets and working hours. Even the
females had no accurate information about their ages. The respondents forcefully gave
complete informations of the family members regarding working hours and wages.
The present study endeavours to diminish the quantity of sampling error. The efforts
are also made to lessen the non-sampling errors taking into account circumstances and
financial conditions.
Few other variables which have an effect on the urban informal sector
employment are not incorporated in the current study due to some constraints. These
excluded variables want more research.
138
5.5 Determinants of the Formal and Informal Sectors Employment
in Urban Areas
The present study discusses the explanatory variables in order to determine the
probability of workers being employed in the urban informal sector. The explanatory
variables affecting the probability to participate in the informal sector include age
profile of the workers joining the informal sector employment, education level of the
participants of informal sector, gender, marital status, formal training of the workers,
education level of the parents, household size, family size, dependency ratio, number
of children, number of male adolescents, number of female adolescents, spouse
participation in economic activities, household‟s value of household assets, and rural-
urban migrants.
5.5.1 Age of the Participants
Age of the participants enhances the growth potential of employment in labour
market. Life-cycle hypothesis postulates that the persons allocate their time more to
work in younger and older age. Age of the people who participate in the informal
sector employment underlies some of the factors that are considered important to
influence their decision to join the informal sector. Two views can be presented about
age of workers involved in the informal sector. Firstly, if the relative participation of
young people is greater in informal sector, the very sector may probably be
considered a transition stage before opting for formal sector. Secondly, informal
sector may be considered as a desirable constant choice if there is a large participation
ratio of older persons in the informal sector (see Kemal and Mehmood, 1993).
Following studies have indicated that the decision of informal sector employment is
positively as well as negatively associated with age.
With age, the workers earned more in the informal sector (Boyed, 1990).
Wages were increased with the increase of age of the worker (Kozel and Alderman,
1990). Funkhouser (1996) examined that old age and young workers were more likely
to be employed in the informal sector employment. It was argued that some persons
participated in the informal sector at a quite early age and stayed there till their
induction in the formal sector (Kemal and Mahmood, 1998). An inverse relationship
139
between age and women informal sector employment was observed.59
The age was
negatively related with informal total and formal sector employment under
subsistence informal sector approach and positive with male employment (Florez,
2003). Guang and Zheng (2005) highlighted that non-farmers, migrant job workers,
wage workers and entrepreneurs were more likely to be employed with age. The
workers were more likely to be employed in the formal and informal sector
employment with age in 1986.60
The middle aged gardeners engaged themselves in
the profession of gardening (Pisani and Voskovitz, 2005). Baudar (2008) found a
positive association of self-employment and age.
The age of the workers can be incorporated as explanatory variable in order to
find out the relationship between age and informal sector employment. Here, we have
used the complete years of age to see the informal sector employment response. It is
predictable that the informal sector employment is positively as well as negatively
related with age.
5.5.2 Education
Schooling assures the quality of opportunity and increased social
responsibility. Education is a critical input in economic development. The
externalities which arise due to high literacy rate benefit the individuals having better
education. Consequently, improved human capabilities getting high education and
training are significant not only in its own right and also owe in the overall economic
growth of the economy, which in return diminishes poverty and enhances
empowerment of disadvantaged groups (Behrman, 1995).
Theoretically, there is a mixed effect of education on participation decision
and time allocation decision in labour market. Human capital theory hypothesized a
positive association of high income and output. Education level of the participants in
the labour market can work in two contradictory ways. For example, better educated
workers have a tendency to be more productive as their level of education implies to
improve the skills in the course of training however low education indicates increased
likelihood to participate in a business start-up as self-employed or as wage labourers
59 see Gallaway and Bernasek (2002). 60 see Wamuthenya (2010) study.
140
in informal urban sector. It is expected that there is a negative relationship between
level of education and informal sector employment. An increase in education is
related with a decrease in the probability of the informal sector employment.
The education influences the labour force and duration of work by income and
subsititution effects. Education level and work involvement are positively related.
Labor force participation and substitution effects are negatively related. By and large,
the net effect of education on work force involvement is based on which effect is
dominant. Almost studies showed strong subsititution effect in the following
studies.61
The returns to education were higher in the informal sector (Banergee, 1983).
Evidences demonstrated a positive association between years of education and self-
employment (Boyd, 1990 and Blaunchflower, 2004). Kemal and Mahmood (1998)
has characterized that the entrepreneurs and self-employed were educated people in
Pakistan.62
Funkhouser (1996) found that the low educated workers were more
involved in informal sector employment in Central America. The street vendors
gained positive returns to education (Samith and Metzger, 1998).
The educational attainment and capital investment were positively correlated
(Kemal and Mehmood, 1998). The workers were being employed more in the
informal sector with increasing years of schooling.63
The well-educated decided to
work as self-employed workers (Meng, 2001). Gallaway and Bernasek (2002) found a
positive link between primary education and males as well as females (both working
at home without pay and with pay in labour market) and negative relationship for
females in labour market. The authors further indicated that relationship between
junior high school education and male female informal sector employment (i.e. home
as well as market) but negative for males working in labour market. The negative
association was observed between informal sector employment (both working at
home and in labour market) for males and females and senior high school education
but positive relationship for female working at home. The study showed that there
61 see chapter 4 62 see Kemal and Mahmood (1998). 63 see Meng (2001).

141
was an inverse association between male female informal sector employment and
post-secondary education.
The majority of the entrepreneurs manning the small and medium enterprises
have passed primary and secondary school education (Mukras, 2003). It was found
that education and earnings were positively related in the informal sector (Smith,
2001). Low educated were forced to work in the informal service employment
(Dasgupta, 2003). Pisani and Voskovitz (2003) indicated that informal workers were
educated at middle level. Calves et al. (2004) illustrated that people having low
education participated more in the informal sector employment.
Evidence indicated that self-employed were more likely to be employed in the
informal sector (Marshal and Oliver, 2005; Avirgin, 2005). Mitra (2007) found the
low educated workers in the informal sector. Gunatilaka (2008) estimated that
workers with primary and secondary education participated more in the informal and
the formal sector employment in Sri Lanka. Mentzakis et al. (2008) sowed that
probability of care given decision decreased with the education. Wamuthenya (2010)
highlighted that urban informal sector employment increased with low education
levels.
Above mentioned studies have mixed effect of education on informal sector
employment, however, many studies showed strong substitution effects. It is expected
that informal sector employment is negatively related with the level of education. To
analyse a significant impact of education on informal sector employment in the
present study, we have used complete years of education. The influence of education
is also observed with the help of five dummies such as Middle, Middle, Intermediate,
Graduation and Master‟s or higher education. In the previous literature, the education
has shown contradicting effects on worker‟s participation in urban informal sector.
5.5.3 Gender
Sex or gender is one more factor which influences the decision to work in the
informal sector. Labour supply theory suggested that male workers are expected to be
involved more in labour activities in order to meet up the economic necessities of the
142
family as compared to female workers and this shows strong income effect. Hence, it
is suggested that, male workers may be hypothesized as positively related to informal
labour market. We have included the binary variable to find out the effects of sex or
gender on the informal sector employment. On the other hand, it is expected that the
probability of females working in the informal labour market was low because of
child care and household responsibilities.
Tokman (1989) argued that the females were less than the male participants in
low productivity jobs. Several studies explained that males were being engaged more
as self-employed (Boyd, 1990; Roberts, 2001and Guang and Zheng, 2005). Levin et
al. (1999) pointed out that women were less likely to be employed as wage earners as
compared to men. Pagnatario (2001) explained the informal sector as male dominant.
Meng (2001) found that males were being employed more as wage earners and were
less employed in self-employment.
Florez (2003) examined that sex and urban informal sector (dynamic) were
negatively correlated. Men were found more in the informal sector employment
(Ozcan et al., 2003). Calves et al. (2004) illustrated that people having low education
participated more in the informal sector employment. Pisani (2005) found the workers
into the profession of gardening. Gunatilaka (2008) showed a positive relationship
between sex and informal sector employment. Baudar (2008) has revealed that the
females were less likely to be self-employed.
There is found mixed literature or results of gender influence on informal
sector employment. So, we incorporate this explanatory variable as a binary choice in
this analysis.
5.5.4 Marital Status
Theoretically married people prefer to invoke more in economic activities.
Neo-Classical framework of labour supply puts forward that individual‟s act
rationally for maximization of their utility by willingly opting for jobs administered
by the basic condition that market wage rate exceeds reservation wage. Here, income
effect is greater than the substitution effect in their decision. Theoretically, there is a
mixed effect of marital status on workers‟ participation in labour market. As far as the
informal sector employment is concerned, the male informal employment is expected

143
to be positively as well as negatively associated with marital status. Generally,
married people prefer to work in the secure formal labour market. The married people
face additional responsibilities and if donot find job in formal sector ultimately get
invoked to informal sector. It is hypothesized that married workers, participate in the
informal sector more than other groups to accomplish family needs and to give bright
future to their family. The probability of male workers‟ participation in informal
sector is expected to be positively correlated. Concerning female participants, it is
expected that they have a less likeliness to enter into the informal labour market
because of child care at home and other responsibilities. However, married females
without children are more likely to participate in the informal sector.
Several studies demonstrate a positive relationship between marital status and
informal sector employment in urban areas (Funkhouser, 1996; Meng, 2001, and
Gunatilaka, 2008). Roberts (2001) found that sector of choice of rural labour migrants
to Shanghai was positively associated with marital status. Gaung and Zheng (2005)
analyzed that non-farm job and migrants were positively correlated with marital status
but there was a negative relationship between wage workers alongwith entrepreneurs
and marital status. Gunatilaka (2008) showed that the households were more likely to
be married in the informal sector. Wamuthenya (2010) examined that the married
participants found work in the informal sector.
We have included this variable as binary in our model in order to analyse its
effects on the informal sector employment.
5.5.5 Formal Training
People having some kind of formal training have more chances to join the labour
market with higher gains as predicted by human capital theory. The argument which
has been given to encourage the informal and formal sector activities is that normally
workers are unskilled or having low level of formal or informal training and informal
sector is considered as a refuge for people having low formal skills. This literature
consists of the contradictory views on skill level and urban informal sector. House
(1984) found that low skill level motivated the informal sector workers to work in
informal sector. Kemal and Mahmood (1998) found that a large number of self-
employed gained some kind of training in urban areas of Pakistan.

144
Meng (2001) found a positive relationship between total training days before
migration and wage as well as self-employment. Achary (2001) showed that migrants
were low / medium to the unskilled category workers. Smith (2001) found that
training and earnings of the workers were positively related. Self-employed
entrepreneurs possessed the skills (Meng, 2001). Calves et al. (2004) illustrated that
people having low education participated more in informal employment.
Marshall and Oliver (2005) defined that the skill was definitely indispensable
to the success of entrepreneurs in Indiana. Etherington and Simon (2005) found that
poor people were more often forced to work in the informal economy because of lack
of skills. Tornaroli (2007) examined that unskilled young people were engaged in
labour market as wage-earners in Latin America and the Caribbean. The returns to
skills training were high in the informal sector employment (Frost and Jones, 2008).
Our analysis is concerned with the negative association between formal
training and the informal sector employment in urban areas of Southern Punjab. To
analyze the impact of formal training on urban informal sector employment, the study
has included formal training as binary variable in our analysis.
5.5.6 Parents’ Educational Status
The Neo-classical labour supply theory explains that the family labour supply
decisions are interdependent. Family background of the informal workers, especially
father‟s education and mother‟s education proves helpful to determine the
intergenerational occupational mobility and growth potential of the informal sector.
Probability of informal sector employment is affected by the educational status of the
parents. Parents‟ education level has been used as dummy variables. Theoretically, it
is expected that informal sector employment is negatively related with parental
education. Assad et al. (2001) found a negative relationship between females
employed in casual and self-employment and husband‟s basic education.

145
5.5.7 Household Size
The variable “household size” is an essential factor in determining the urban
informal sector employment decision. Household size64
is, in general, taken into
account to be an indicator of dependents on the heads of household. As far as males
are concerned, it is expected that household size affects positively the informal sector
employment. Theoretically, two varying hypotheses can be formulated regarding the
effect of household size on informal sector involvement. Firstly, it signifies the
promotion of the informal sector due to manifold increase in labour supply. Secondly,
the more of making the family financially sound compels the head of large household
to opt informal sector. Household size is found to be positively influencing male
workers to involve in the informal sector employment.
For females‟ employment, the household size is expected to be inversely
related with the informal sector participation. Those females who belong to the large
family size, have more children and old people, allocate their more time for child care
and household responsibilities and have relatively less participation in work related
activities. It is hypothesized that the females have a less likelihood to engage in the
informal sector employment due to large household size.
Hayami (2006) shows a positive as well as a negative relationship between
household size and urban informal sector employment. The majority of both pickers
and collectors have the average family size of larger than five. Kumar and Aggarwal
(2003) argued that most of the self-employed of slum-population were with average
size of 5 members. Menzakis et al. (2008) found that probability of care given
decision increased with household size. The probability of female care given decision
increased with the increased household size. Wamuthenya (2010) found that
probability of the informal sector employment increased with household size in
Kenya in 1986 and 1998.
We have used the household size as a continuous variable in our models.
64 Children, females, male labourers and old age people.
146
5.5.8 Family Setup
Family setup (both joint and nuclear) plays a central role to join sector of
employment in urban labour market. It is expected that labour supply theory assumed
that the workers living in a joint family system have the possibility to participate in
the informal sector, to support and fulfill household necessities. On behalf of men, it
is expected that there is a negative relationship between male participants in informal
sector and joint family setup. Generally, male workers in joint family structure are
less likely to work because some other family members are also busy in earnings
activities and it is the strong substitution effect of extra income of other family
members which forces the head not to work anymore. Other argument is that in joint
family structure, male informal workers are more likely to participate because of
family labour supply involvement.
Conversely, female informal sector employment and joint family setup are
expected to be positively correlated. Almost female responsibilities are shared by
other family members and the strong income effect forces them to involve in earnings
activities at home or in the labour market. A negative relationship between extended
family and self-employment was found in all three models (see Boyd, 1999).
To evaluate the effects of family setup in determining the informal sector
employment, we use the binary variable in our models in the analysis.
5.5.9 Dependency Ratio
The dependency ratio has a substantial effect on participants of informal
labour market. Here, dependents are well thought-out persons who are below 15 years
of age and above 64 years. Dependency ratio is attained by dividing the number of
dependents by household size. Theoretically, it is expected that the dependency ratio
and participation in the informal sector employment are positively as well as
negatively correlated. The male informal sector participants have the tendency to join
informal sector because of high dependency ratio. However, in case of females, it is
assumed that there is an inverse relationship between female informal sector
employment and dependency ratio. Generally, females are less likely to engage in
employment in informal sector because of child care and household responsibilities of
147
the dependents. One more argument is that, unmarried females in the household are
expected to be positively correlated with the informal sector employment.
The present study has incorporated this variable as continuous variable to see
its impact on urban informal sector.
5.5.10 Number of Children (6-14)
The labour supply theory predicts that the number of children have a great
impact on the decision of household regarding choice of sector of employment or in
labour market. Theoretically, there are mixed effects. As far as males are concerned,
the presence of children of this age group can affect their decision to participate in the
informal sector. Some of the children in the family are pursuaded to informal work at
home as family helpers or in labour market or as child labourers. In this way, the male
heads will participate less due to strong substitution effect of extra income. This
indicates an inverse relationship of children and male informal sector employment.
Theoretically, it is argued that females having children (6-14) compratively
pay less care to them. Thus, this shows a positive relationship between sector of
employment and having children. It appears that the female informal sector workers
having more children above 6 years and below 15 years have more participation rate
in the informal sector employment. We have used this variable as continuous to find
the relationship. Having male children less than 10 years old, workers participated
less in the informal sector except in El Salvador in 1985 and in Hunduras in 1989.
However, they participated more in the informal sector employment with female
children less than 10 years age in Nicaroga in 1993 and in Costa Rica in 1980, 1985
and 1991.
5.5.11 Male Adolescents
Theoretically, it is argued that those households having male adolescents
dissuade from informal sector employment because the family labour supply
decisions are interdependent. Male adolescents can affect worker‟s decision
concerning participation in urban informal sector employment because some male
adolescent family members have chances to join the informal or formal sector. It is

148
expected that mostly household heads (males or females) spend less time at work
because there has been a ceteris paribus increase in household income, and because an
hour of male adolescent‟s labour now earns more income than before (relatively to an
hour of heads own time). In other words, there is a „cross-income effect‟ and a cross-
substitution effect on head‟s labour supply. The consequent twin- effects enable the
head to work less firstly because now the family will enjoy more leisure due to the
alleged increase in its income. Secondly, the heads will be inclined to substitute
better-paid labour time with low-paid toil. We include number of male adolescents as
a continuous variable.
Funkhouser (1996) found that workers participated more or less in the
informal sector with male and female children across countries. Gallaway and
Bernasek (2002) have revealed a positive link between number of male adults and
male and female informal sector employment (such as both at home without pay and
with pay in labour market) and negative relationship between male and female
informal sector employment (such as both with pay at home in labour market and with
out pay at home for females) except women in labour market.
Male adolescents inversely affect the urban informal sector employment
decision. It indicates that participants of the informal sector having more male
adolescents have a less participation rate in the informal urban sector employment.
5.5.12 Female Adolescents
Neoclassical labour supply theory argued that household males / females
having female adolescents rather participated more to join the economic activity. The
labour supply theory explains that the family labour supply decisions are
interdependent. However, female adolescents can affect workers‟ decision concerning
participation in the urban informal sector employment. It is argued that female
adolescents have the low opportunity to work and especially in the formal sector job,
so household heads have to fulfill female adolescent‟s requirements. In this way, they
join the informal labour market. Study presents a positive correlation between female
adolescents and the urban informal sector employment decision. It appears that the
informal workers having more female adolescets are more likely to join the urban
informal sector.

149
5.5.13 Spouse Participation in Economic Activities
It is assumed in Neo-classical labour supply theory that the family labour
supply decisions are interdependent. The spouse participation in economic activities
affects the urban informal sector employment. If male spouse involves himself in
earning activity, the resultant enhancement in his wage will cast both income and
substitution effect on his spouse‟ labour supply. It is forecasted that female spouse
will work less firstly due to an increase in her family income and secondly because of
per hour increase in her husband‟s income. In other words, there is a „cross-income
effect‟ and a cross-substitution effect on the wife‟s labour supply. The consequent
twin- effects enable her to work less firstly because now the family will enjoy more
leisure due to the alleged increase in its income and secondly, the husbands will be
inclined to substitute better-paid labour time with low-paid toil.
Consistent with the added worker effect, when male labourers lose their jobs
because of recession, female paticipants of the labour market might work in order to
offset the loss in the income of the family. Accordingly, this effect shows a positive
effect on employment in economic and business activities in result of loss on spouse
job. Theoretically, it is expected that spouse participation in economic activities is
positively associated with informal employment of added worker effect (see Brendt,
1991).
5.5.14 Household’s Value of Assets
The household‟s value of assets is an imperative economic factor that has
much influence on sector of choice in the labour market. All types of assets of
household such as tangible (i.e. land, shops, homes, plots, livestock population, etc)
physical (i.e. homes, machinery, vehicle and electrical goods) and financial (i.e. gold,
bank deposits, securities etc) are considered important and secure source of earnings.
Theoretically, it is argued that with an increase in the value of assets and property,
people are less willing to participate in economic activities because of strong
unearned income effect. Theoretically, ownership of assets makes the individuals
financially stronger through the un-earned income and workers prefer to leisure and
do not work anymore. There are mixed effects. We have used household‟s value of
150
assets as continuous variable to trace out the effects of value of assets on informal
urban sector employment.
Theoretically, it is expected that there is a positive or negative relationship
between household‟s value of assets and informal sector employment or value of
assets decreases the demand for labour supply. Raijman (2001) examined a positive
impact of economic resources (i.e. financial investments) on decision to start a
business. Assaad et al. (2000) found that probability of being employed as casual
worker increased with the household assets in Egypt. The self-employment was found
as an entrepreneurial strategy by people who have access to productive assets (Assad
et al., 2003).
5.5.15 Rural-Urban Migration
It is theorized that the rural-urban migration is the major determinant towards
growth of the urban informal activities and this sector is considered as a refuge for
rural migrants. Informal economies provide a wide range of income opportunities.
The informal sector is viewd as temporary opportunity for migrants as predicted by
most classical migration models or informal sector may play an important role in
economic development.65
The urban informal sector required low skills and
insufficient finance to establish the business. This suggested that the sector absorbed
mainly the recent rural migrants to the city (House, 1984).
The studies found a positive association of rural urban migrants and self-
employed in urban areas (Mukhopadhyay, 1998; Reddy et al. 2003 and Baudar,
2008). Little (1999) pointed out that the large number of migrants enhanced the
growth of petty trade in the sector. The author estimated that the rural-migrants and
informal sector employment were negatively associated with particular occupations
(Roberts, 2001). Study explored that the street vending was increasing with increasing
rural to urban migration in Khatmandu (Timalsina, 2007). Jampaklay (2007) has
examined the residential patterns of rural-urban migrants that were involved in factory
jobs and construction in Thailand. The authors demonstrated that the proportion of
female migrants was higher in the construction sector in India (Bhattacharyya and
Korinek (2007).
65see Todaro, (1969), Fields, (1975) and Mazumdar, (1976, 1977).

151
This explanatory variable is included as a binary variable such as rural-urban
migrants in our analysis.
5.5.16 Working Hours
It is theorized that the workers with more working hours can earn more in the
labour market. Almost workers in the informal sector allocate their time for work
more in order to earn more income and are willing to work more in the informal
economic activities. The strong income effect forces them to work more as their
earnings will increase. The working hours and earnings are expected to be positively
associated in urban informal sector.
5.6 Model and Methodological Issues
After the accomplishment of data collection, the analytical techniques are used to find
out results and conclusions. The informal sector employment can be determined
quantitatively and qualitatively. Though, present study made a qualitative and
quantitative analysis in order to determine the probability of the urban informal sector
employment in Southern Punjab, Pakistan.
5.6.1 A Descriptive Data Analysis
Conducting a household survey in urban areas of Southern Punjab, we analyse
the informal sctor employment discriptively in order to construct the quantitative
models to formulate null hypotheses against alternative hypothesis to test the
analytical work. The percentages of the participants in the informal and formal sector
employment are shown in descriptive or bivariate analysis.
5.6.2 A Multivariate Analysis of Urban Informal Sector Employment
We make a multivariate analysis of the factors that influence the probability of
participation in the urban informal sector employment. The diverse macroeconomic
and micro-economic factors are used to determine whether an individual engages into
diverse economic activities or not.66
A few of several factors influence labour supply
66 see Blundel, 1987

152
decisions. We have used the econometric methods to investigate the determinants of
urban informal sector employment in Southern Punjab. The regression analysis are
applied to see the influence on informal sector employment decision of a specific
household or individual‟s characteristics while keeping fixed all other characteristics.
A multivariate regression analysis is made in this econometric analysis. A
general function is as
Yi= f (X1, X2, X3…Xn) (5.1)
The dependent variable “Yi” shows probability of the informal sector
employment in the model. It is dichotomous in nature which takes value “1” or “0”
i.e. a qualitative variable and is incorporated in regression model as a dummy
variable. In this case the value “1” signifies the probability of being employed in the
urban informal sector. Contrarily, value “0” shows probability of not being employed
in the urban informal sector. The binary logit technique is used here. The variables,
for instance, X1, X2….Xn represent diverse socio-economic and demographic
variables.
We consider the simple model in the following.
Yi= β0+ β1X1i+ β2X2i+ β3X3i+ … ΒkXj+ ui (5.2)
Xj= is a set of independent variables where j= 1, 2….k.
These independent variables are age in complete years, complete years of
education, formal training, sex, marital status, father‟s education, mother‟s education,
family setup, household size, dependency ratio, number of children, number of male
adolescents, number of female adolescents, spouse participation in economic
activities, value of household‟s assets and rural-urban migrant variable.
ui = error term
The above model expresses the dichotomous Yi as a linear function of the
explanatory variable Xj, is called linear probability model. Though, linear probability
model which is used in binary choice dependent variable face a problem to generate
153
predicted values which may fall outside 0, 1 interval and may violate the basic tenets
of probability. The other problems are faced in the form of heteroscedacity and
generally lower R2 values.
Hence, it has been suggested for non linear probability models, (probit and
logit) models to outweigh the problems by using linear probability model (LPM).
These models make use of Maximum Likelihood Estimation (MLE) procedures. The
logit model, which is based on cumulative logistic probability function, is relatively
similar to the cumulative normal function and can be used easily for computation.
Both logit and probit are transformation such that a cumulative distribution is
estimated with LPM. Generally, the non-probability model is used for non-linear
maximum likelihood estimation. Both Logit and Probit models commonly provide
similar results for the same data among the non linear probability models.67
The effect
of one or more independent variables on dicotomus dependant variable can be
estimated by using logit model. 68
The present study is based on the binary logit model and (OLS) regression
analysis to estimate the probability of employment in the urban informal sector.
5.6.2.1 A Binary Logit Model
We analyse the determinants of urban informal sector employment by using
the binary logit model technique. However, similar existing models have been applied
for the informal sector and employment in developing and developed countries.
Funkhouser (1996) used probit model. The logistic regression model was used by
[Boyd (1990), Rosen (2000), Raijman (2001), Florez (2003), Reddy et al. (2003),
Guang & Zheng (2005)]. The logit model was used by [(Matiya et al. (2005); Istrate
(2007)]. Mentzakis et al. (2008) and Gunatilaka (2008) used the regression
techniques. All of these studies are concerned with work decision of informal sector
employment having binary variable or limited variables.
The Methodology of logistic model which we adopt in present research is
followed by Maddala (1983).
67 see Gujrati (1995). 68 see detail in Gujrati (1995), Kumenta (1986) and Green (1992).
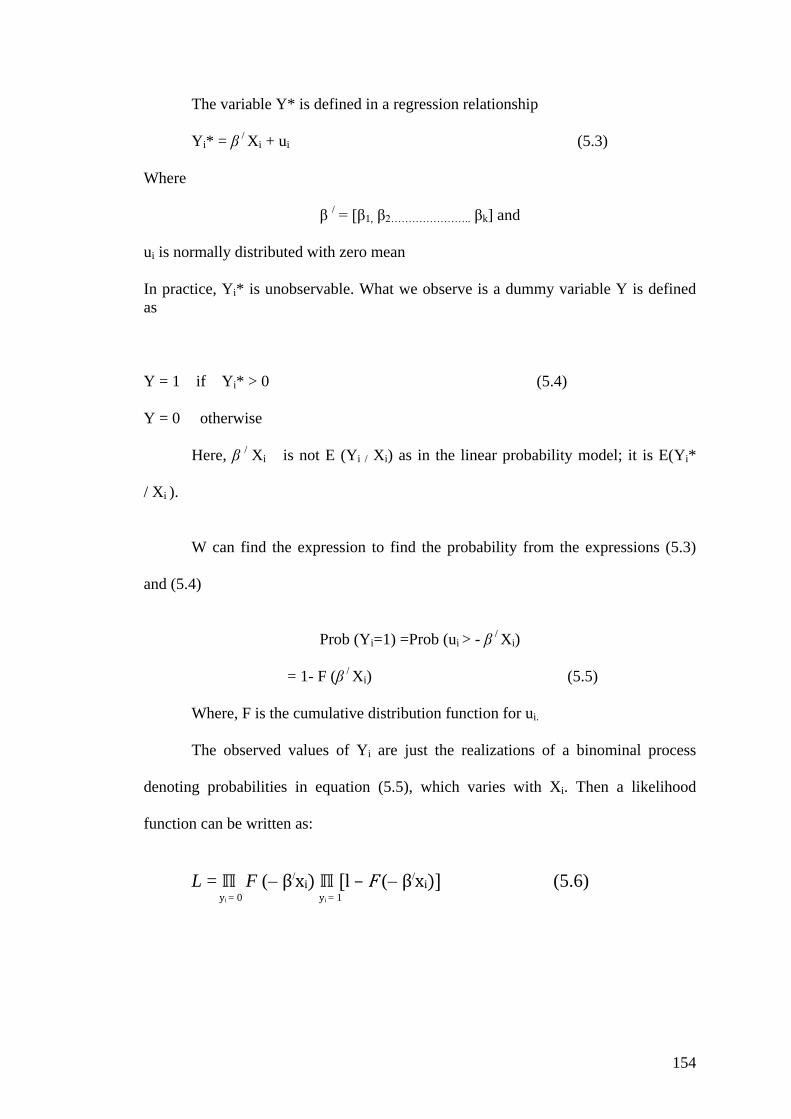
154
The variable Y* is defined in a regression relationship
Yi* = β /
Xi + ui (5.3)
Where
β / = [β1, β2………………….. βk] and
ui is normally distributed with zero mean
In practice, Yi* is unobservable. What we observe is a dummy variable Y is defined
as
Y = 1 if Yi* > 0 (5.4)
Y = 0 otherwise
Here, β /
Xi is not E (Yi / Xi) as in the linear probability model; it is E(Yi*
/ Xi ).
W can find the expression to find the probability from the expressions (5.3)
and (5.4)
Prob (Yi=1) =Prob (ui > - β /
Xi)
= 1- F (β /
Xi) (5.5)
Where, F is the cumulative distribution function for ui.
The observed values of Yi are just the realizations of a binominal process
denoting probabilities in equation (5.5), which varies with Xi. Then a likelihood
function can be written as:
L = ℿ F (– β/xi) ℿ [l – F (– β/xi)] (5.6) yi = 0 yi = 1

155
The functional form which is imposed on F in equation (5.6) is based on the
assumptions made about ui in equation (5.3). If the cumulative distribution of ui is the
logistic, we have the logit model. In this case
Hence
(5.7)
The equation basically shows the probability of being employed [pr (Yi =1)]
Here, is a closed form expression for F, because it does not contain integrals
explicitly. Not all distributions permit such a closed form expression.
Let Xik for the kth element of the vector of explanatory variables Xi, and let βk
be kth element of β. Then the derivatives for the probabilities given by the logit model
are
(5.8)
These derivatives are used to predict the effects of changes in one of the
independent variables on the probability of being employed.
5.6.2.2 Earnings Functions
The human capital theory has been presented in the economic literature with
the seminal work which Becker (1962) and Blaug (1969) done. Before they search
even, in 1957 and 1972, Jacob Mincer presented a theoretical model and emphasized
on human capital as central explanatory variable. In literature, it is also known as the
“Earnings Function” and has been applied in this study to measure the earnings
differentials in the urban informal sector of Southern Punjab, Pakistan. In case of
Pakistan, the authors like Burki and Abbas (1991); Burki and Ubaidullah (1992),
F (– β / Xi) =
exp (− 𝛽 / Xi)
1+exp ( − 𝛽/ Xi) =
1
1+exp ( 𝛽/ Xi)
1 – F (– β / Xi) =
exp ( 𝛽 / Xi)
1+exp ( 𝛽/ Xi)
𝜕
𝜕𝑋𝑖𝑘 L(𝑋𝑖
/β) =
exp ( 𝑋𝑖 /𝛽)
[1+exp ( 𝑋𝑖/ 𝛽)]2
βk

156
Sargana (1998) and Nasir (2002)] have used the same model to estimate the rates of
returns of human capital variables in the urban informal sector with small surveys. In
case of other countries, Manda et al. (2002) have used the same model. Whereas,
Kozel and Alderman (1990), Ashraf and Ashraf (1993), Wahba (2002), and Hudson
(2010) have extended the Mincerian earnings model (1974) to estimate the effect of
other variables on earnings in the urban informal sector by conducting small surveys.
Where
Yi= monthly earnings of the ith informal sector employed, Xi are ith explanatory
variables for ith informal sector employed and ui as random disturbance for ith
informal sector employed.
5.6.3 Specification of Employment Model
The specification of informal sector employment is given as follows.
5.6.3.1 General Model
Based on the general model which we specified in the previous section, we
estimate the logit model to evaluate the effects of socio-economic and demographic
variables on the urban informal sector employment.
UISE = f [AGY, EDY, SEX, MRS, FTD, FEDU, MEDU, FSP, HSIZ, DPNR,
NCHL, NMAD, NFAD, HVAT, SPN, RMGT]
In the above logit model, the dependent variable is urban informal sector
employment. The independent variables are age in complete years, complete years of
education, sex, marital status, formal training, father‟s education, mother‟s education,
household size, family setup, dependency ratio, number of children, number of male
adolescents, and number of female adolescents, household‟s value of assets, spouse
participation in economic activities and rural-urban migrant worker.
The model specified for urban informal sector employment is given as follows.
Ln Yi = β0 + 𝛴𝑖=0𝑘 𝑋𝑖 + 𝑢𝑖
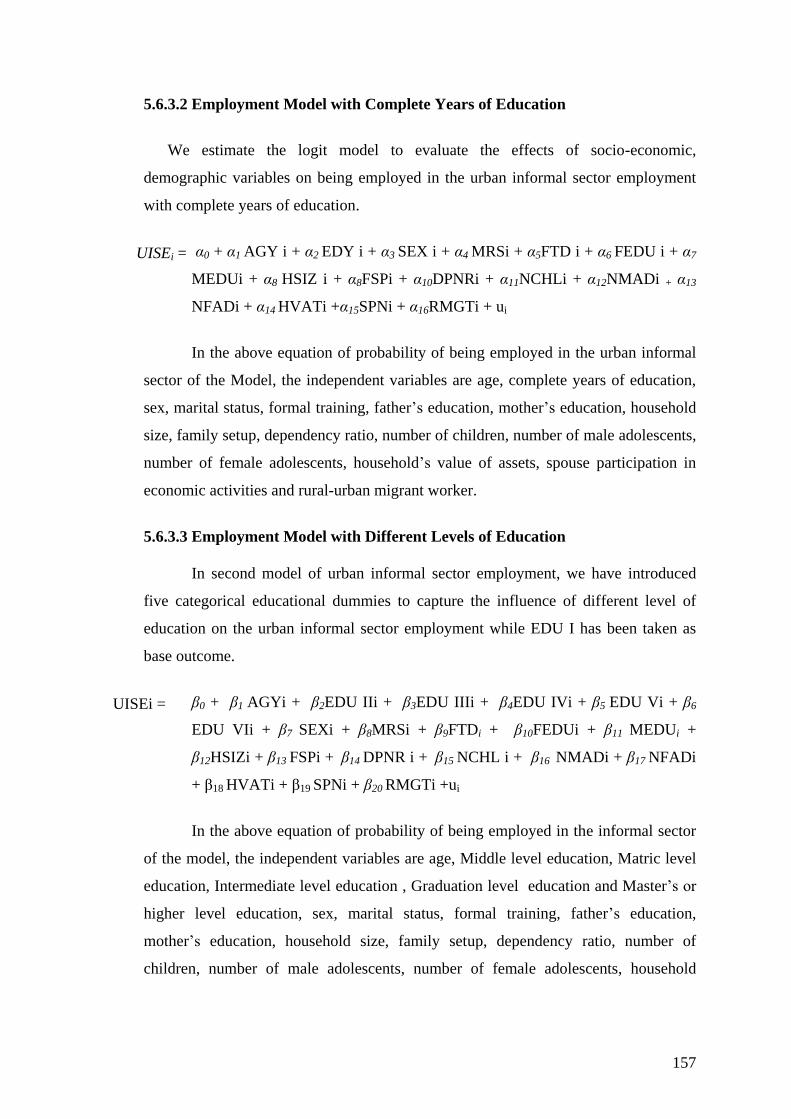
157
5.6.3.2 Employment Model with Complete Years of Education
We estimate the logit model to evaluate the effects of socio-economic,
demographic variables on being employed in the urban informal sector employment
with complete years of education.
α0 + α1 AGY i + α2 EDY i + α3 SEX i + α4 MRSi + α5FTD i + α6 FEDU i + α7
MEDUi + α8 HSIZ i + α8FSPi + α10DPNRi + α11NCHLi + α12NMADi + α13
NFADi + α14 HVATi +α15SPNi + α16RMGTi + ui
In the above equation of probability of being employed in the urban informal
sector of the Model, the independent variables are age, complete years of education,
sex, marital status, formal training, father‟s education, mother‟s education, household
size, family setup, dependency ratio, number of children, number of male adolescents,
number of female adolescents, household‟s value of assets, spouse participation in
economic activities and rural-urban migrant worker.
5.6.3.3 Employment Model with Different Levels of Education
In second model of urban informal sector employment, we have introduced
five categorical educational dummies to capture the influence of different level of
education on the urban informal sector employment while EDU I has been taken as
base outcome.
β0 + β1 AGYi + β2EDU IIi + β3EDU IIIi + β4EDU IVi + β5 EDU Vi + β6
EDU VIi + β7 SEXi + β8MRSi + β9FTDi + β10FEDUi + β11 MEDUi +
β12HSIZi + β13 FSPi + β14 DPNR i + β15 NCHL i + β16 NMADi + β17 NFADi
+ β18 HVATi + β19 SPNi + β20 RMGTi +ui
In the above equation of probability of being employed in the informal sector
of the model, the independent variables are age, Middle level education, Matric level
education, Intermediate level education , Graduation level education and Master‟s or
higher level education, sex, marital status, formal training, father‟s education,
mother‟s education, household size, family setup, dependency ratio, number of
children, number of male adolescents, number of female adolescents, household
UISEi =
UISEi =
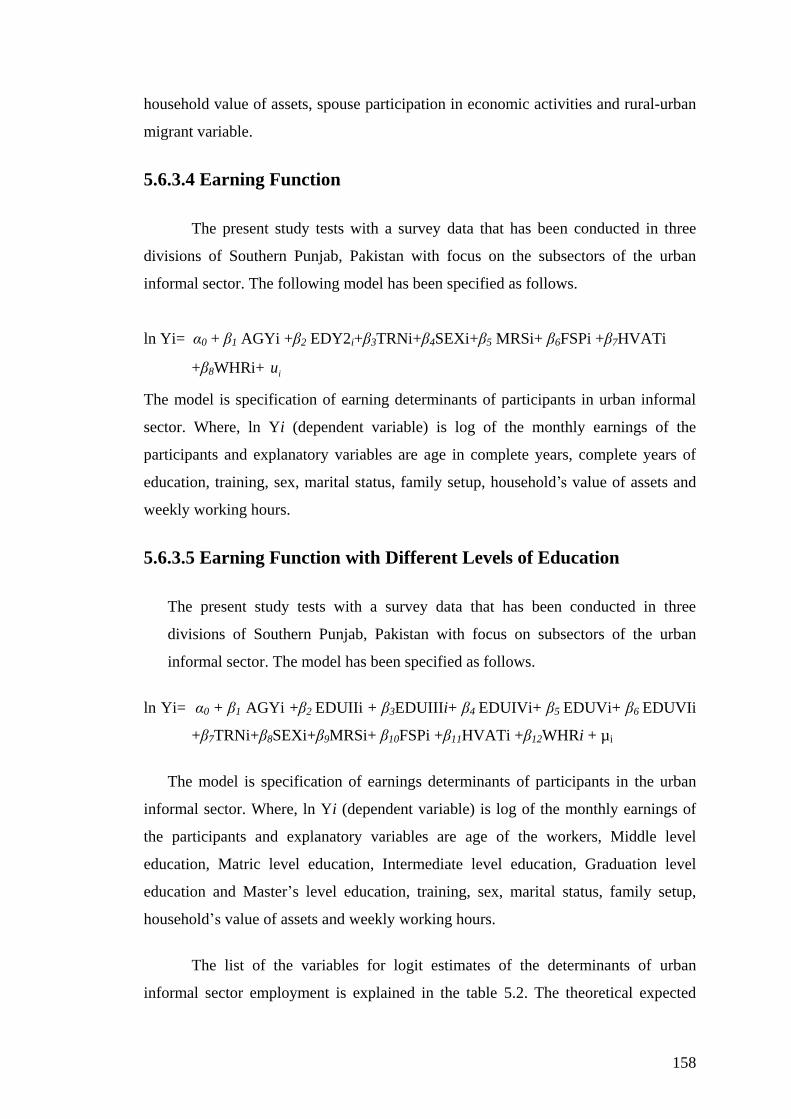
158
household value of assets, spouse participation in economic activities and rural-urban
migrant variable.
5.6.3.4 Earning Function
The present study tests with a survey data that has been conducted in three
divisions of Southern Punjab, Pakistan with focus on the subsectors of the urban
informal sector. The following model has been specified as follows.
ln Yi= α0 + β1 AGYi +β2 EDY2i+β3TRNi+β4SEXi+β5 MRSi+ β6FSPi +β7HVATi
+β8WHRi+ iu
The model is specification of earning determinants of participants in urban informal
sector. Where, ln Yi (dependent variable) is log of the monthly earnings of the
participants and explanatory variables are age in complete years, complete years of
education, training, sex, marital status, family setup, household‟s value of assets and
weekly working hours.
5.6.3.5 Earning Function with Different Levels of Education
The present study tests with a survey data that has been conducted in three
divisions of Southern Punjab, Pakistan with focus on subsectors of the urban
informal sector. The model has been specified as follows.
ln Yi= α0 + β1 AGYi +β2 EDUIIi + β3EDUIIIi+ β4 EDUIVi+ β5 EDUVi+ β6 EDUVIi
+β7TRNi+β8SEXi+β9MRSi+ β10FSPi +β11HVATi +β12WHRi + µi
The model is specification of earnings determinants of participants in the urban
informal sector. Where, ln Yi (dependent variable) is log of the monthly earnings of
the participants and explanatory variables are age of the workers, Middle level
education, Matric level education, Intermediate level education, Graduation level
education and Master‟s level education, training, sex, marital status, family setup,
household‟s value of assets and weekly working hours.
The list of the variables for logit estimates of the determinants of urban
informal sector employment is explained in the table 5.2. The theoretical expected

159
signs of described variables in table are also explained. The expected relationship
between urban informal sector employment and complete years of age, marital status,
number of children, and household‟s value of assets can be positive as well as
negative. It is hypothesized that probability of being employed in the informal sector
and formal training, education, parent‟s education, number of male adolescents and
rural-migrant worker is negative. Theoretically, the expected relationship between
informal sector employment, household size, and family setup, spouse participation in
economic activities, dependency ratio and female adolescents are positively
correlated.
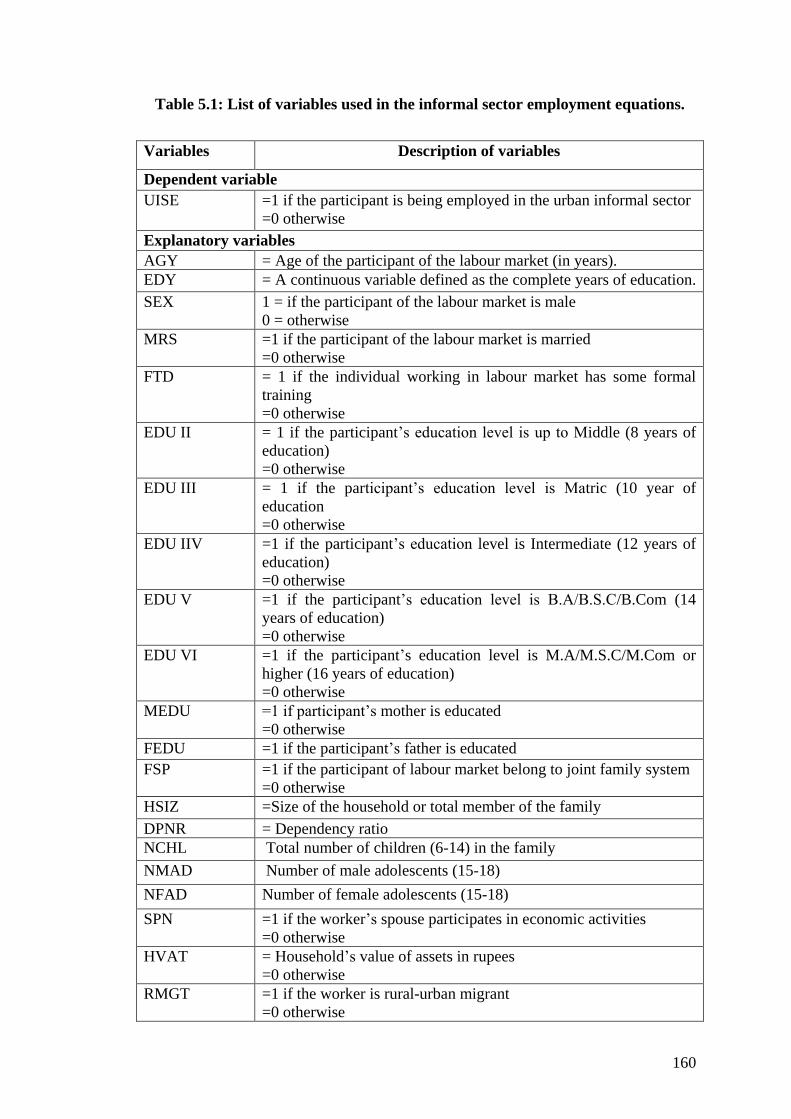
160
Table 5.1: List of variables used in the informal sector employment equations.
Variables Description of variables
Dependent variable
UISE =1 if the participant is being employed in the urban informal sector
=0 otherwise
Explanatory variables
AGY = Age of the participant of the labour market (in years).
EDY = A continuous variable defined as the complete years of education.
SEX 1 = if the participant of the labour market is male
0 = otherwise
MRS =1 if the participant of the labour market is married
=0 otherwise
FTD = 1 if the individual working in labour market has some formal
training
=0 otherwise
EDU II = 1 if the participant‟s education level is up to Middle (8 years of
education)
=0 otherwise
EDU III = 1 if the participant‟s education level is Matric (10 year of
education
=0 otherwise
EDU IIV =1 if the participant‟s education level is Intermediate (12 years of
education)
=0 otherwise
EDU V =1 if the participant‟s education level is B.A/B.S.C/B.Com (14
years of education)
=0 otherwise
EDU VI =1 if the participant‟s education level is M.A/M.S.C/M.Com or
higher (16 years of education)
=0 otherwise
MEDU =1 if participant‟s mother is educated
=0 otherwise
FEDU =1 if the participant‟s father is educated
FSP =1 if the participant of labour market belong to joint family system
=0 otherwise
HSIZ =Size of the household or total member of the family
DPNR = Dependency ratio
NCHL Total number of children (6-14) in the family
NMAD Number of male adolescents (15-18)
NFAD Number of female adolescents (15-18)
SPN =1 if the worker‟s spouse participates in economic activities
=0 otherwise
HVAT = Household‟s value of assets in rupees
=0 otherwise
RMGT =1 if the worker is rural-urban migrant
=0 otherwise
161
5.7 Concluding Remarks
In this chapter, an attempt has been made to explain the data collection
methods. The methodological issues are also discussed. We have conducted the
survey in urban areas of three divisions of Southern Punjab, Pakistan. Simple random
and stratified sampling techniques have been used to collect data from three districts
because these districts are generating more the informal employment opportunities in
Southern Punjab. Furthermore, we have convoluted the determinants regarding urban
informal sector employment in southern Punjab, Pakistan. It has also given the
complete construction of analytical techniques for studying the determinants of
informal sector employment in urban areas. In conclusion, the present study makes a
descriptive analysis of determinants of the urban informal sector employment by
using binary logit models.
162
Chapter 6
DESCRIPTIVE ANALYSIS OF URBAN INFORMAL AND
FORMAL SECTORS IN SOUTHERN PUNJAB,
PAKISTAN
6.1 Introduction
The informal sector is comparatively larger due to its role in creating
employment in the developing countries. Lesser employment opportunities in the
formal sector invoke people to adhere to the informal sector. A dominant proportion
of the urban population is working in the informal sector because the sector has the
potential to absorb the growing labour force. Therefore, informal sector plays its role
to tackle the problem of urban poverty and to enhance the income and productivity.
The development-oriented and job-promoting feature of the informal sector
can be understood by taking a detailed account of descriptive analysis of participants
of the informal urban sector. A descriptive study of the working people in the
informal sector assists in recognizing factors influencing workers‟ choice to indulge
into urban informal sector employment. Moreover, the knowledge of these factors
would enable the government in turn, to design policy programme to enhance the
growth potential of the urban informal sector.
In this section we present an overview of the informal and formal sector
employment in Southern Punjab in terms of its extent, nature and characteristics. In
the current study, a descriptive analysis of the determinants of employment in the
urban informal and formal sector of Southern Punjab, Pakistan is made. Especially,
pair-wise correlation matrix in section 6.2 of the present chapter is arranged. The
descriptive analysis of workers of both genders in the urban informal sector has also
been explained separately in section 6.3. The descriptive analysis of the determinants
of the urban informal sector employment for male workers is explained in section 6.4
and female participants in section 6.5. Finally, concluding remarks are given in
section 6.6.

163
6.2 Pair-wise Correlation Matrix
The above table indicates the pairwise correlation matrix of the explanatory
variables. This shows a relationship among explanatory variables. The correlation
matrix indicates that there is no multicolinearity among the explanatory variables.

164
Table No. 6.1 Pair Wise Correlation Matrix
AGY EDY MRS SEX FTD FEDU MEDU HSIZ DPNR FSP NFAD NMAD NCHL SPN VAT RMGT
AGY 1.00
EDY -0.20 1.00
MRS 0.37 -0.09 1.00
SEX 0.04 0.10 0.01 1.00
FTD -0.12 0.24 -0.06 -0.03 1.00
FEDU -0.20 0.34 -0.04 -0.02 0.17 1.00
MEDU -0.16 0.33 -0.07 -0.01 0.19 0.44 1.00
HSIZ 0.10 -0.16 0.00 0.08 -0.11 -0.12 -0.17 1.00
DPNR -0.08 -0.03 -0.04 0.06 0.00- -0.02 0.00 0.13 1.00
FSP 0.01 -0.11 -0.12 0.05 0.06 -0.09 -0.08 0.32 0.14 1.00
NFAD 0.22 -0.17 0.09 0.03 -0.18 -0.17 -0.17 0.32 -0.17 0.07 1.00
NMAD 0.12 -0.03 0.04 -0.02 -0.03 0.02 -0.05 0.19 -0.25 0.02 0.21 1.00
NCHL 0.02 -0.13 0.08 -0.01 -0.04 -0.09 -0.11 0.36 0.33 0.10 -0.04 -0.14 1.00
SPN 0.01 0.07 0.30 -0.21 0.06 0.08 0.13 -0.15 0.00 -0.16 -0.08 -0.02 -0.01 1.00
HVAT 0.09 0.10 0.08 -0.03 0.02 0.07 0.05 0.03 -0.03 -0.04 0.03 0.10 -0.09 0.06 1.00
RMGT -0.10 -0.03 -0.06 0.04 0.02 -0.06 -0.06 0.03 0.06 0.03 -0.01 -0.03 0.05 -0.06 -0.07 1.00
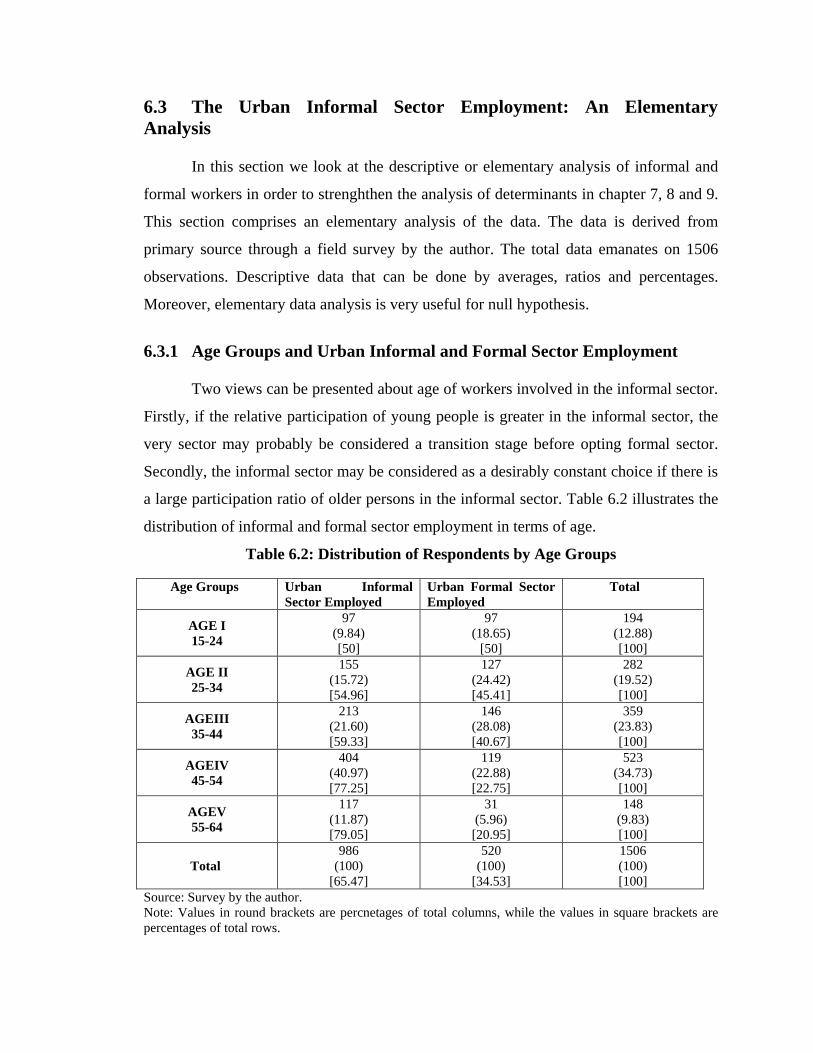
6.3 The Urban Informal Sector Employment: An Elementary
Analysis
In this section we look at the descriptive or elementary analysis of informal and
formal workers in order to strenghthen the analysis of determinants in chapter 7, 8 and 9.
This section comprises an elementary analysis of the data. The data is derived from
primary source through a field survey by the author. The total data emanates on 1506
observations. Descriptive data that can be done by averages, ratios and percentages.
Moreover, elementary data analysis is very useful for null hypothesis.
6.3.1 Age Groups and Urban Informal and Formal Sector Employment
Two views can be presented about age of workers involved in the informal sector.
Firstly, if the relative participation of young people is greater in the informal sector, the
very sector may probably be considered a transition stage before opting formal sector.
Secondly, the informal sector may be considered as a desirably constant choice if there is
a large participation ratio of older persons in the informal sector. Table 6.2 illustrates the
distribution of informal and formal sector employment in terms of age.
Table 6.2: Distribution of Respondents by Age Groups
Age Groups Urban Informal
Sector Employed
Urban Formal Sector
Employed
Total
AGE I
15-24
97
(9.84)
[50]
97
(18.65)
[50]
194
(12.88)
[100]
AGE II
25-34
155
(15.72)
[54.96]
127
(24.42)
[45.41]
282
(19.52)
[100]
AGEIII
35-44
213
(21.60)
[59.33]
146
(28.08)
[40.67]
359
(23.83)
[100]
AGEIV
45-54
404
(40.97)
[77.25]
119
(22.88)
[22.75]
523
(34.73)
[100]
AGEV
55-64
117
(11.87)
[79.05]
31
(5.96)
[20.95]
148
(9.83)
[100]
Total
986
(100)
[65.47]
520
(100)
[34.53]
1506
(100)
[100]
Source: Survey by the author.
Note: Values in round brackets are percnetages of total columns, while the values in square brackets are
percentages of total rows.

clxvi
Table (6.2) depicts an analysis of age of participants of the urban informal and
formal sector employment. It is shown that urban informal sector employment in the age
group 15-24 is 9.84% which is the lowest. However, the same is on the rise with 15.72 %
in the age group 25-34. Urban informal sector employment is observed 21.60 percent in
the age group 35-44. The results indicate that the age group 45-54 reserves the highest
participation rate of 40.97 %. Informal sector appears to favour older persons with nearly
half of the workers falling into this age group. Therefore, age group (55-64) of informal
sector employment is relatively low with 11.87 percent. Table shows a positive
relationship between age factor and informal sector employment up to the age group (45-
54). However, the age is inversely related with informal sector employment after the
noted age group. In general, the younger and older people are less likely to join urban
informal sector employment in Southern Punjab, Pakistan and this worth noticing fact
matches the life cycle hypothesis.69
6.3.2 Education Level and Urban Informal and Formal Sector Employment
It demonstrates the distribution of the informal as well as formal sector
employment respondents with education level in the table 6.3. The table shows that the
Primary level education of informal sector workers is 13.94 percent. The workers being
in the informal sector possess 23.27 percent Middle level education. The data shows that
a worker whose education level is up to Matric, their absorption rate is the highest at
32.71 percent in the informal economic activities. Results point out that informal sector is
particularly favoured by the workers having Matric level education. It also shows that
share of Graduates in the urban informal sector is 9.66 percent. The participation rate is
the lowest for persons having Master‟s level and higher degree 5.49 percent. The data
shows that there is a negative relationship between level of education and the participants
of the informal sector in the urban areas of Southern Punjab.
69 see Ando and Modigliani (1963)

clxvii
Table 6.3: Distribution of Respondents by Education Level
Level of Education Urban Informal
Sector Employed
Urban Formal Sector
Employ
Total
EDU I
Primary
127
(13.94)
[ 85.81]
21
(4.14)
[14.19]
148
(10.44)
[100]
EDU II
Middle
212
(23.27)
[89.08 ]
26
(5.13)
[10.92]
238
(16.78)
[100]
EDU III
Matric
298
(32.71)
[73.58]
107
(21.10)
[24.42]
405
(28.56)
[100]
EDU IV
Intermediate
136
(14.93)
[58.87]
95
(18.74)
[41.13]
231
(16.29)
[100]
EDU V
Graduation
88
(9.66)
[41.71]
123
(24.26)
[58.30]
211
(14.88)
[100]
EDU VI
Master’s or highr
50
(5.49)
[27.03]
135
(26.62)
[72.97]
185
(13.05)
[100]
Total
911
(100)
[64.25]
507
(100)
[35.75]
1418
(100)
[100]
Source: Survey by the author.
Note: Values in round brackets are percnetages of total columns, while the values in square brackets are
percentages of total rows.
6.3.3 Marital Status and Urban Informal and Formal Sector Employment
Marital status has been observed as the most significant factor in the favour of
joining the urban informalsector. It is argued that married people prefer to work more in
the formal or informal sector because of their financial responsibilities. Distribution of
both the formal and informal sector workers by marital status is revealed in table 6.4.
Table 6.4: Distribution of Respondents by Marital Status
Marital Status Urban Informal
Sector Employed
Urban Formal Sector
Employed Total
Married
732
(74.24)
[66.30]
372
(71.54)
[33.70]
1104
(73.31)
[100]
Unmarried
254
(25.76)
[63.18]
148
(28.46)
[36.82]
402
(26.69)
[100]
Total
986
(100)
[65.47]
520
(100)
[34.53]
1506
(100)
[100]
Source: Survey by the author.
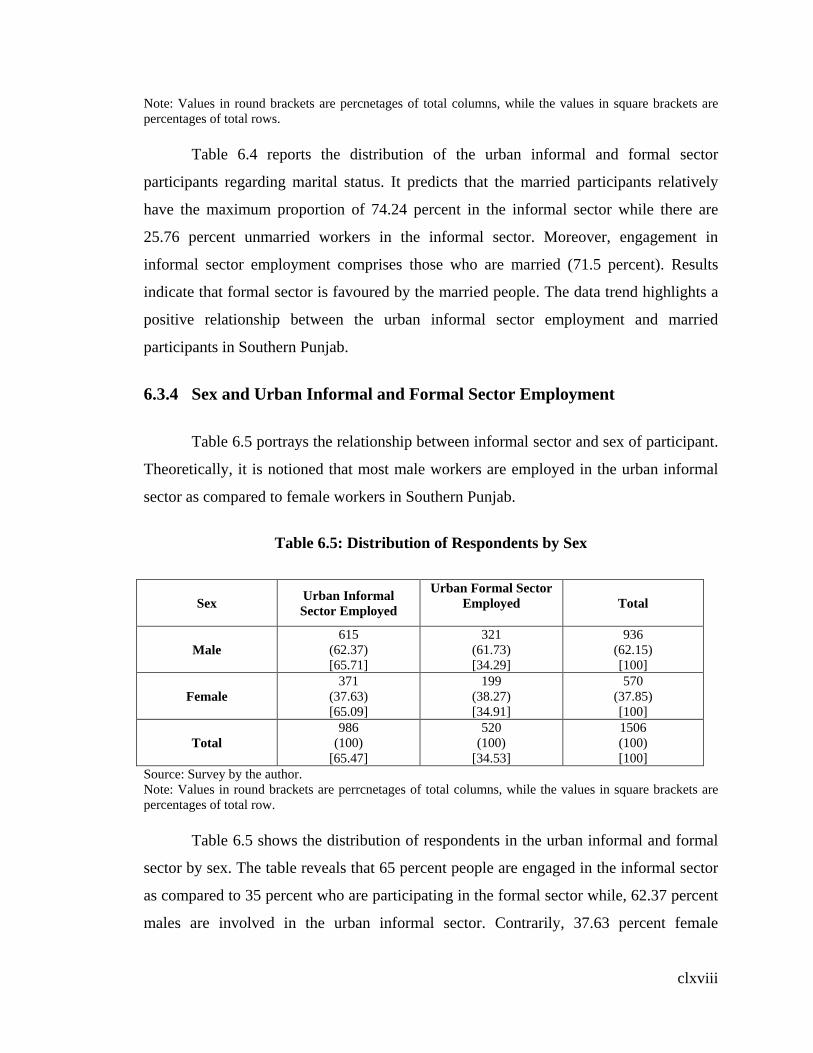
clxviii
Note: Values in round brackets are percnetages of total columns, while the values in square brackets are
percentages of total rows.
Table 6.4 reports the distribution of the urban informal and formal sector
participants regarding marital status. It predicts that the married participants relatively
have the maximum proportion of 74.24 percent in the informal sector while there are
25.76 percent unmarried workers in the informal sector. Moreover, engagement in
informal sector employment comprises those who are married (71.5 percent). Results
indicate that formal sector is favoured by the married people. The data trend highlights a
positive relationship between the urban informal sector employment and married
participants in Southern Punjab.
6.3.4 Sex and Urban Informal and Formal Sector Employment
Table 6.5 portrays the relationship between informal sector and sex of participant.
Theoretically, it is notioned that most male workers are employed in the urban informal
sector as compared to female workers in Southern Punjab.
Table 6.5: Distribution of Respondents by Sex
Sex Urban Informal
Sector Employed
Urban Formal Sector
Employed
Total
Male
615
(62.37)
[65.71]
321
(61.73)
[34.29]
936
(62.15)
[100]
Female
371
(37.63)
[65.09]
199
(38.27)
[34.91]
570
(37.85)
[100]
Total
986
(100)
[65.47]
520
(100)
[34.53]
1506
(100)
[100]
Source: Survey by the author.
Note: Values in round brackets are perrcnetages of total columns, while the values in square brackets are
percentages of total row.
Table 6.5 shows the distribution of respondents in the urban informal and formal
sector by sex. The table reveals that 65 percent people are engaged in the informal sector
as compared to 35 percent who are participating in the formal sector while, 62.37 percent
males are involved in the urban informal sector. Contrarily, 37.63 percent female
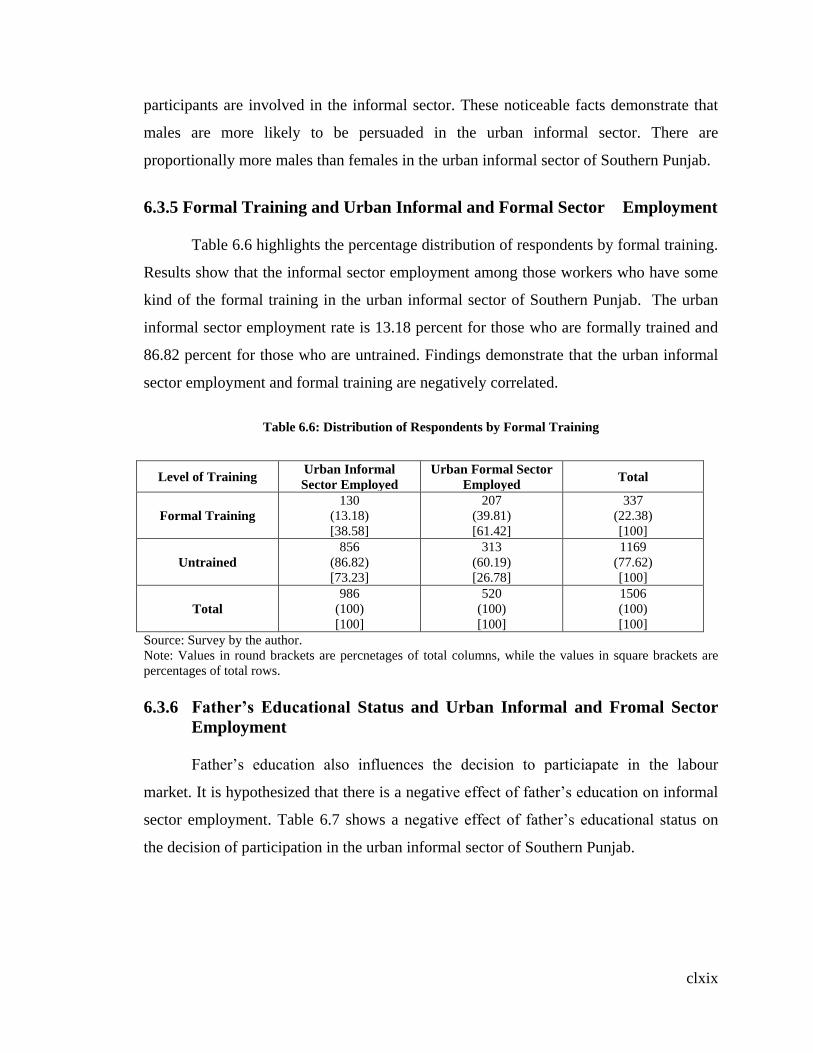
clxix
participants are involved in the informal sector. These noticeable facts demonstrate that
males are more likely to be persuaded in the urban informal sector. There are
proportionally more males than females in the urban informal sector of Southern Punjab.
6.3.5 Formal Training and Urban Informal and Formal Sector Employment
Table 6.6 highlights the percentage distribution of respondents by formal training.
Results show that the informal sector employment among those workers who have some
kind of the formal training in the urban informal sector of Southern Punjab. The urban
informal sector employment rate is 13.18 percent for those who are formally trained and
86.82 percent for those who are untrained. Findings demonstrate that the urban informal
sector employment and formal training are negatively correlated.
Table 6.6: Distribution of Respondents by Formal Training
Level of Training Urban Informal
Sector Employed
Urban Formal Sector
Employed Total
Formal Training
130
(13.18)
[38.58]
207
(39.81)
[61.42]
337
(22.38)
[100]
Untrained
856
(86.82)
[73.23]
313
(60.19)
[26.78]
1169
(77.62)
[100]
Total
986
(100)
[100]
520
(100)
[100]
1506
(100)
[100]
Source: Survey by the author.
Note: Values in round brackets are percnetages of total columns, while the values in square brackets are
percentages of total rows.
6.3.6 Father’s Educational Status and Urban Informal and Fromal Sector
Employment
Father‟s education also influences the decision to particiapate in the labour
market. It is hypothesized that there is a negative effect of father‟s education on informal
sector employment. Table 6.7 shows a negative effect of father‟s educational status on
the decision of participation in the urban informal sector of Southern Punjab.

clxx
Table 6.7: Distribution of Respondents by Father’s Educational Status
Father’s Educational
Status
Urban Informal
Sector Employed
Urban Formal Sector
Employed Total
Educated Father
345
(34.99)
[40.05]
373
(71.73)
[51.95]
718
(47.68)
[100]
Uneducated Father
641
(65.01)
[81.35]
147
(28.27)
[18.65]
788
(52.32)
[100]
Total
986
(100)
[100]
520
(100)
[100]
1506
(100)
[100]
Source: Survey by the author.
Note: Values in round brackets are percnetages of total columns, while the values in square brackets are
percentages of totl rows.
Results reflect that there are 65.01 percent of the informal sector workers whose
fathers are uneducated as compared to 34.99 percent of those participants whose fathers
are educated. The analysis concludes that father‟s education exerts a great impact on the
decision to work in the urban formal sector. Moreover, the workers are less likely to
participate in the urban informal sector of Southern Punjab whose fathers are educated.
6.3.7 Mother’s Educational Status and Urban Informal and Formal Sector
Employment
Mother‟s education is an important factor to determine the growth potential of the
urban informal and formal sectors of Sourhen Punjab. It is expected that those workers
whose mothers are educated are less likely to be engaged in the informal sector
employment. Our results confirm it.
Table 6.8: Distribution of Respondents by Mother’s Educational Status
Mother’s Educational
Status
Urban Informal
Sector Employed
Urban Formal Sector
Employed Total
Educated Mothers
179
(18.15)
[73.70]
288
(55.38)
[26.30]
467
(31.01)
[100]
Uneducated Mothers
807
(81.85)
[38.33]
232
(44.61)
[22.33]
1039
(68.99)
[100]
Total
986
(100)
[100]
520
(100)
[100]
1506
(100)
[100]
Source: Survey by the author.
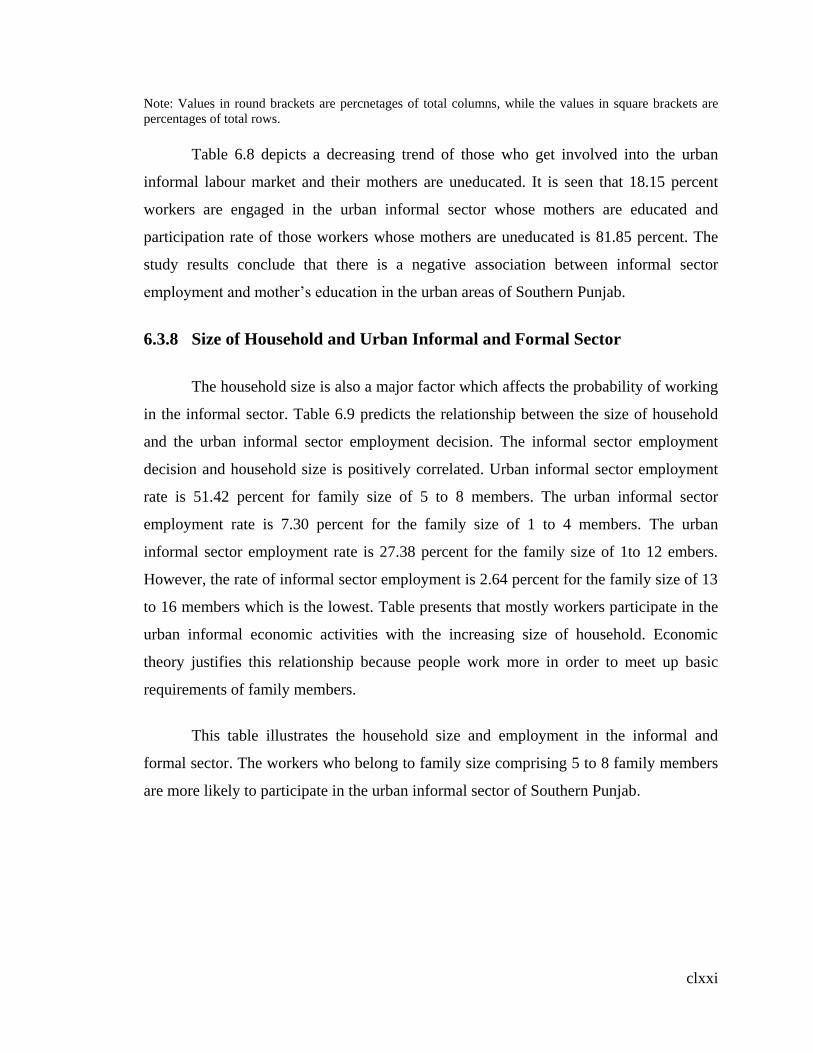
clxxi
Note: Values in round brackets are percnetages of total columns, while the values in square brackets are
percentages of total rows.
Table 6.8 depicts a decreasing trend of those who get involved into the urban
informal labour market and their mothers are uneducated. It is seen that 18.15 percent
workers are engaged in the urban informal sector whose mothers are educated and
participation rate of those workers whose mothers are uneducated is 81.85 percent. The
study results conclude that there is a negative association between informal sector
employment and mother‟s education in the urban areas of Southern Punjab.
6.3.8 Size of Household and Urban Informal and Formal Sector
The household size is also a major factor which affects the probability of working
in the informal sector. Table 6.9 predicts the relationship between the size of household
and the urban informal sector employment decision. The informal sector employment
decision and household size is positively correlated. Urban informal sector employment
rate is 51.42 percent for family size of 5 to 8 members. The urban informal sector
employment rate is 7.30 percent for the family size of 1 to 4 members. The urban
informal sector employment rate is 27.38 percent for the family size of 1to 12 embers.
However, the rate of informal sector employment is 2.64 percent for the family size of 13
to 16 members which is the lowest. Table presents that mostly workers participate in the
urban informal economic activities with the increasing size of household. Economic
theory justifies this relationship because people work more in order to meet up basic
requirements of family members.
This table illustrates the household size and employment in the informal and
formal sector. The workers who belong to family size comprising 5 to 8 family members
are more likely to participate in the urban informal sector of Southern Punjab.
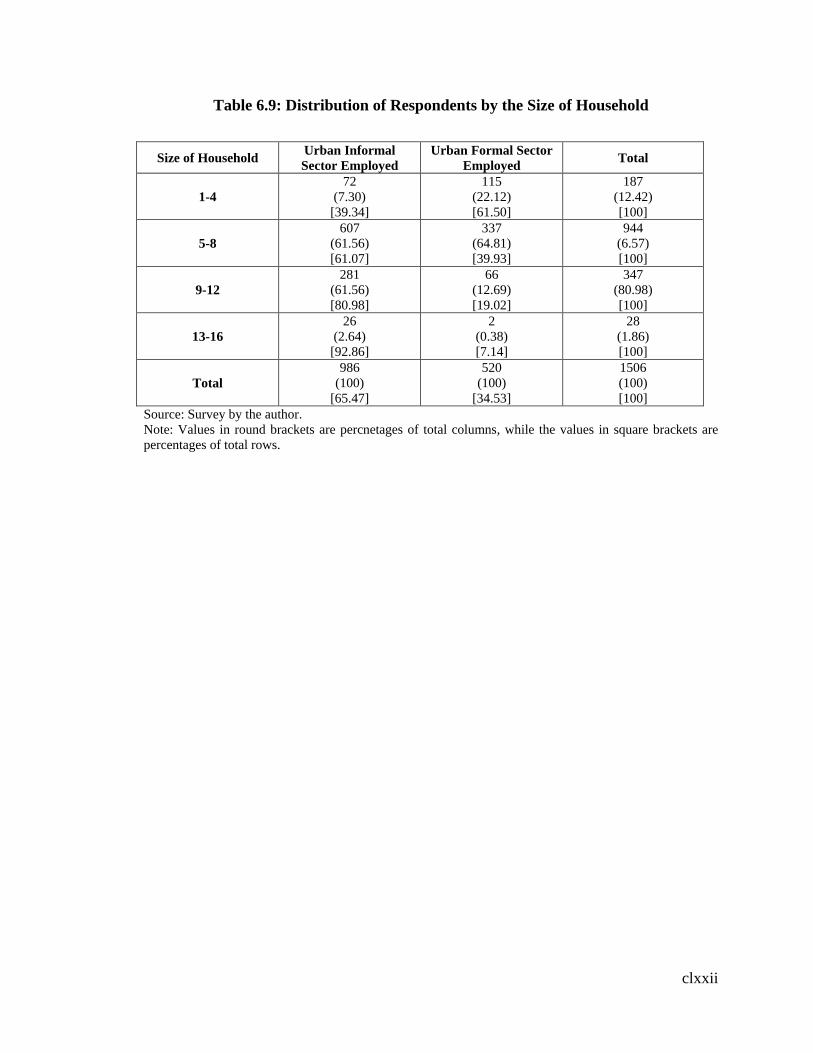
clxxii
Table 6.9: Distribution of Respondents by the Size of Household
Size of Household Urban Informal
Sector Employed
Urban Formal Sector
Employed Total
1-4
72
(7.30)
[39.34]
115
(22.12)
[61.50]
187
(12.42)
[100]
5-8
607
(61.56)
[61.07]
337
(64.81)
[39.93]
944
(6.57)
[100]
9-12
281
(61.56)
[80.98]
66
(12.69)
[19.02]
347
(80.98)
[100]
13-16
26
(2.64)
[92.86]
2
(0.38)
[7.14]
28
(1.86)
[100]
Total
986
(100)
[65.47]
520
(100)
[34.53]
1506
(100)
[100]
Source: Survey by the author.
Note: Values in round brackets are percnetages of total columns, while the values in square brackets are
percentages of total rows.

clxxiii
6.3.9 Number of Dependents and Urban Informal and Formal Sector
Employment
Table 6.10 illustrates the distribution of the informal and formal sector
participants and the dependency ratio. The informal workers are indulging into economic
activities due to increase in number of dependents.
Table 6.10: Distribution of Respondents by Number of Dependents
Number of
Dependents
Urban Informal Sector
Employed
Urban Formal Sector
Employed Total
1
68
(6.90)
[51.13]
65
(12.5)
[48.87]
133
(8.33)
[100]
2
172
(17.44)
[57.33]
128
(24.62)
[42.67]
300
(19.92)
[100]
3
205
(20.79)
[65.29]
109
(20.96)
[34.71]
314
(20.85)
[100]
4
176
(17.85)
[72.13]
68
(13.08)
[27.87]
244
(16.20)
[100]
5
128
(12.98)
[76.19]
40
(7.69)
[23.81]
168
(11.16)
[100]
6
86
(8.72)
[77.47]
25
(4.81)
[22.52)
111
(7.37)
[100]
7
47
(4.77)
[83.93]
9
(1.73)
[16.07]
56
(3.72)
[100]
8 and above
49
(4.97)
[84.48]
9
(1.73)
[15.51]
58
(3.85)
[100]
Total
986
(100)
[65.47]
520
(100)
[34.53]
1506
(100)
[100]
Source: Survey by the author.
Note: Values in round brackets are percnetages of total columns, while the values in square brackets are
percentages of total rows.
6.3.10 Family Setup and Urban Informal and Fromal Sector Employment
Family setup, nuclear or joint, also plays an important role in determining the
growth potential of the urban informal sector. Table 6.11 describes the distribution of the
formal and the informal sector employment by family setup. The table expresses a
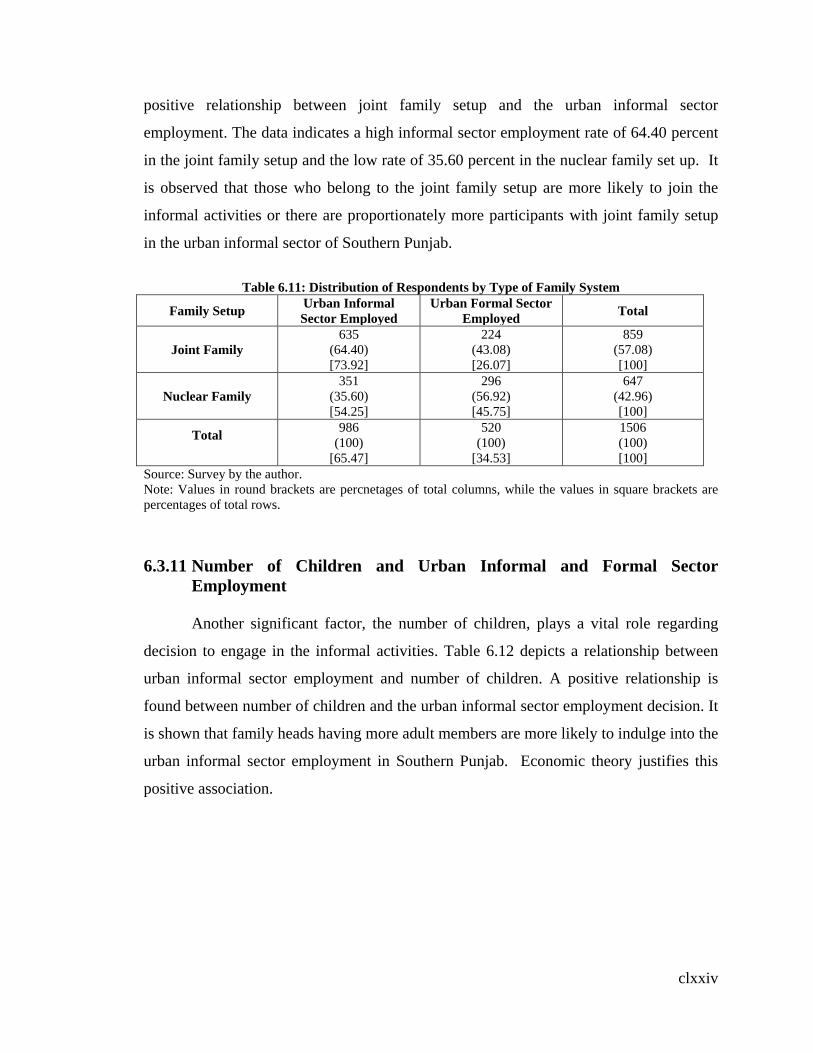
clxxiv
positive relationship between joint family setup and the urban informal sector
employment. The data indicates a high informal sector employment rate of 64.40 percent
in the joint family setup and the low rate of 35.60 percent in the nuclear family set up. It
is observed that those who belong to the joint family setup are more likely to join the
informal activities or there are proportionately more participants with joint family setup
in the urban informal sector of Southern Punjab.
Table 6.11: Distribution of Respondents by Type of Family System
Family Setup Urban Informal
Sector Employed
Urban Formal Sector
Employed Total
Joint Family
635
(64.40)
[73.92]
224
(43.08)
[26.07]
859
(57.08)
[100]
Nuclear Family
351
(35.60)
[54.25]
296
(56.92)
[45.75]
647
(42.96)
[100]
Total
986
(100)
[65.47]
520
(100)
[34.53]
1506
(100)
[100]
Source: Survey by the author.
Note: Values in round brackets are percnetages of total columns, while the values in square brackets are
percentages of total rows.
6.3.11 Number of Children and Urban Informal and Formal Sector
Employment
Another significant factor, the number of children, plays a vital role regarding
decision to engage in the informal activities. Table 6.12 depicts a relationship between
urban informal sector employment and number of children. A positive relationship is
found between number of children and the urban informal sector employment decision. It
is shown that family heads having more adult members are more likely to indulge into the
urban informal sector employment in Southern Punjab. Economic theory justifies this
positive association.

clxxv
Table 6.12 Distribution of Respondents by Number of Children
Number of Children Urban Informal
Sector Employed
Urban Formal Sector
Employed Total
0
252
(25.56)
[56.76]
192
(36.92)
[43.24]
444
(29.48)
[100]
1
122
(12.37)
[59.22]
84
(16.15)
[40.78]
206
(13.68)
[100]
2
228
(23.12)
[64.59]
125
(24.04)
[35.41]
353
(23.44)
[100]
3
166
(16.84)
[68.88]
75
(14.42)
[31.12]
241
(16.00)
[100]
4
126
(12.78)
[80.77]
30
(5.77)
[19.23]
156
(10.36)
[100]
5
71
(7.20)
[89.87]
8
(1.54)
[10.13]
79
(5.25)
[100]
6
17
(1.72)
[73.91]
6
(1.15)
[26.09]
23
(1.53)
[100]
7
4
(0.41)
[100]
0
(0)
[0]
4
(0.27)
[100]
Total
986
(100)
[65.47]
520
(100)
[34.53]
1506
(100)
[100]
Source: Survey by the author.
Note: Values in round brackets are percnetages of total columns, while the values in square brackets are
percentages of total rows.
6.3.12 Male Adolescents and Urban Informal and Formal Sector
Employment
Male adolescents also influence the decision to participate in the urban informal
sector employment. Table 6.13 shows a relationship between urban informal sector
employment and male adolescents. Data indicates a negative association between number
of male adolescents and the urban informal sector employment decision. It is observed
that the informal sector workers having more male adolescents are less likely to join the
urban informal sector in Southern Punjab.

clxxvi

clxxvii
Table 6.13: Distribution of Respondents byNumber of Male Adolescents
Number of Male
Adolescents
Urban Informal
Sector Employed
Urban Formal Sector
Employed Total
0
582
(59.03)
[66.29]
296
(56.92)
[100]
878
(58.30)
[100]
1
239
(24.24)
[68.29]
111
(21.35)
[31.71]
350
(23.24)
[100]
2
127
(12.88)
[60.77]
82
(15.77)
[39.23]
209
(13.88)
[100]
3
29
(2.94)
[58]
21
(4.04)
[42]
50
(3.32)
[100]
4
6
(0.61)
[37.5]
10
(1.92)
[62.5]
16
(1.06)
[100]
5
3
(0.30)
[100]
0
(0)
[0]
3
(0.20)
[100]
Total
986
(100)
[65.47]
520
(100)
[34.52]
1506
(100)
[100]
Source: Survey by the author.
Note: Values in round brackets are percnetages of total columns, while the values in square brackets are
percentages of total rows.
6.3.13 Female Adolescents and Urban Informal and Fromal Sector
Employment
Presence of female adolescents is also an imperative factor that has an effect on
worker‟s decision concerning the urban informal sector. Table 6.14 illustrates a
relationship between the urban informal and formal sector employment and female
adolescents. Data shows that there is a negative relationship between female adolescents
and the urban informal sector employment decision. It is pointed out that people with
more female adolescents have more chances to participate in the urban informal sector of
Southern Punjab.

clxxviii
Table 6.14: Distribution of Respondents by Number of Female Adolescents
Number of Female
Adolescents
Urban Informal
Sector Employed
Urban Formal Sector
Employed Total
0
404
(40.97)
[55.12]
329
(63.27)
[44.88]
733
(48.67)
[100]
1
172
(17.44)
[61.87]
106
(20.38)
[38.13]
278
(18.46)
[100]
2
246
(24.95)
[78.10]
69
(13.27)
[21.90]
315
(20.92)
[100]
3
129
(13.08)
[90.21]
14
(2.69)
[9.79]
143
(9.50)
[100]
4
32
(3.25)
[94.12]
2
(0.38)
[5.88]
34
(2.26)
[100]
Above 4
3
(0.30)
[100]
0
(0)
[0]
3
(0.20)
[100]
Total
986
(100)
[65.47]
520
(100)
[34.53]
1506
(100)
[100]
Source: Survey by the author.
Note: Values in round brackets are percnetages of total columns, while the values in square brackets are
percentages of total rows.
6.3.14 Spouse Working and Urban Informal and Formal Sector Employment
Spouse participation in economic activities negatively influences the choice of
participation in the urban informal sector employment. It is hypothesized if the spouses
are working in the informal sector economic activities, then their counterparts are less
likely to participate in the urban informal sector employment. The findings of the study
support the theory.
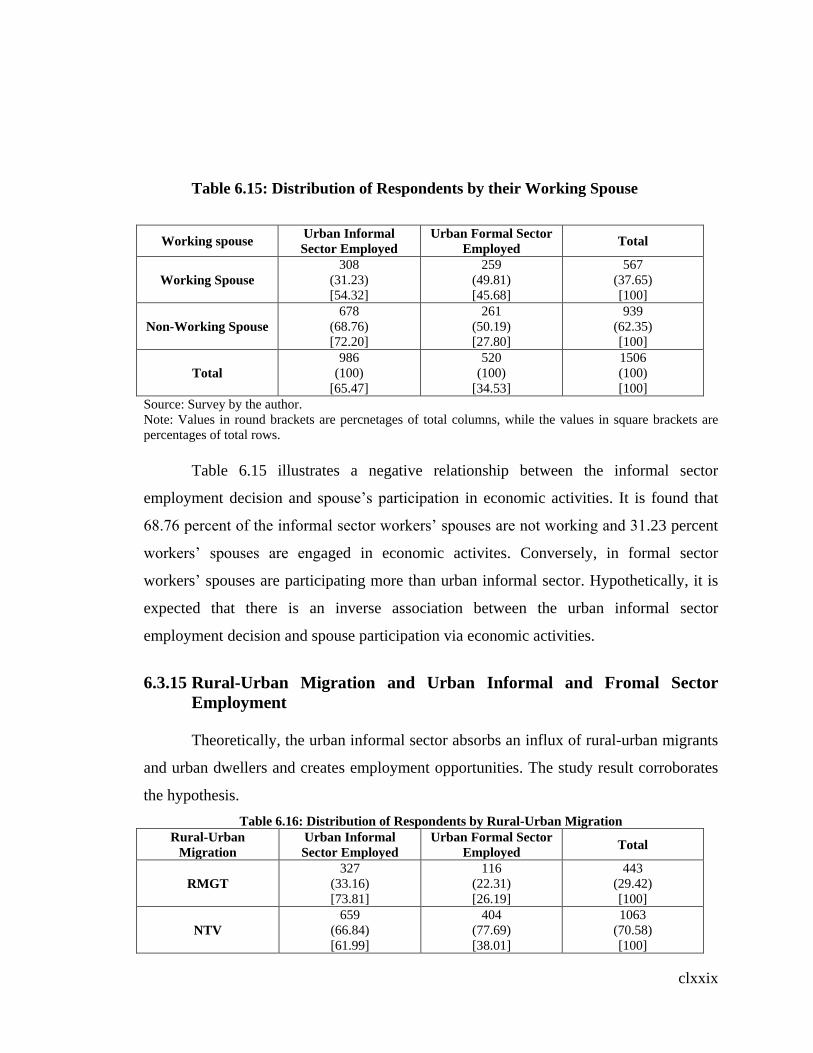
clxxix
Table 6.15: Distribution of Respondents by their Working Spouse
Working spouse Urban Informal
Sector Employed
Urban Formal Sector
Employed Total
Working Spouse
308
(31.23)
[54.32]
259
(49.81)
[45.68]
567
(37.65)
[100]
Non-Working Spouse
678
(68.76)
[72.20]
261
(50.19)
[27.80]
939
(62.35)
[100]
Total
986
(100)
[65.47]
520
(100)
[34.53]
1506
(100)
[100]
Source: Survey by the author.
Note: Values in round brackets are percnetages of total columns, while the values in square brackets are
percentages of total rows.
Table 6.15 illustrates a negative relationship between the informal sector
employment decision and spouse‟s participation in economic activities. It is found that
68.76 percent of the informal sector workers‟ spouses are not working and 31.23 percent
workers‟ spouses are engaged in economic activites. Conversely, in formal sector
workers‟ spouses are participating more than urban informal sector. Hypothetically, it is
expected that there is an inverse association between the urban informal sector
employment decision and spouse participation via economic activities.
6.3.15 Rural-Urban Migration and Urban Informal and Fromal Sector
Employment
Theoretically, the urban informal sector absorbs an influx of rural-urban migrants
and urban dwellers and creates employment opportunities. The study result corroborates
the hypothesis.
Table 6.16: Distribution of Respondents by Rural-Urban Migration
Rural-Urban
Migration
Urban Informal
Sector Employed
Urban Formal Sector
Employed Total
RMGT
327
(33.16)
[73.81]
116
(22.31)
[26.19]
443
(29.42)
[100]
NTV
659
(66.84)
[61.99]
404
(77.69)
[38.01]
1063
(70.58)
[100]

clxxx
Total
986
(100)
[65.47]
520
(100)
[34.53]
1506
(100)
[100]
Source: Survey by the author.
Note: Values in round brackets are percnetages of total columns, while the values in square brackets are
percentages of total rows.
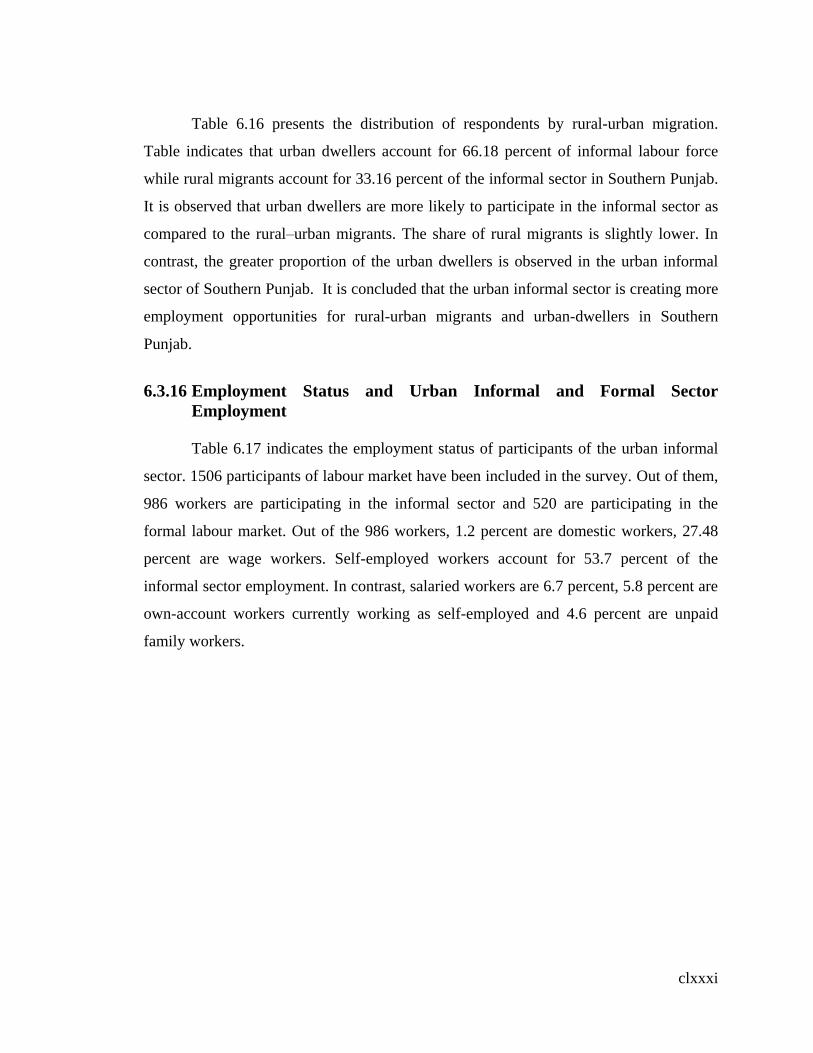
clxxxi
Table 6.16 presents the distribution of respondents by rural-urban migration.
Table indicates that urban dwellers account for 66.18 percent of informal labour force
while rural migrants account for 33.16 percent of the informal sector in Southern Punjab.
It is observed that urban dwellers are more likely to participate in the informal sector as
compared to the rural–urban migrants. The share of rural migrants is slightly lower. In
contrast, the greater proportion of the urban dwellers is observed in the urban informal
sector of Southern Punjab. It is concluded that the urban informal sector is creating more
employment opportunities for rural-urban migrants and urban-dwellers in Southern
Punjab.
6.3.16 Employment Status and Urban Informal and Formal Sector
Employment
Table 6.17 indicates the employment status of participants of the urban informal
sector. 1506 participants of labour market have been included in the survey. Out of them,
986 workers are participating in the informal sector and 520 are participating in the
formal labour market. Out of the 986 workers, 1.2 percent are domestic workers, 27.48
percent are wage workers. Self-employed workers account for 53.7 percent of the
informal sector employment. In contrast, salaried workers are 6.7 percent, 5.8 percent are
own-account workers currently working as self-employed and 4.6 percent are unpaid
family workers.
clxxxii
Table 6.17 Distribution of Respondents by Sector of Employment Status
Employment Status Participants
Formal Sector Employed 520
(34.53)
Informal Sector Employed
986
(65.47)
Domestic Workers
18
(1.2)
Wage Workers
271
(27.48)
Self-employed
529
(53.7)
Salaried workers
66
(6.7)
Own account Workers
57
(5.8)
Unpaid Family Workers
45
(4.6)
Total 1506
Source: Field Survey by the author.
Note: Values are percnetages of total columns.
6.3.17 Sector of Employment and Urban Informal Sector Emloyment
Table 6.18 portrays the distribution of workers in terms of sector of employment.
Out of the 986 participants of the informal sector, 23.32 percent are working in the trade
sector, 40.67 percent are working in the services sector. Service providers make up bulk
of the urban informal sector. The highest proportion of the participants is found in the
services sector. The 2nd
highest percentage of workers is found in the manufacturing
sector. Transport workers account for 5.37 percent of the informal sector employed. The
contribution of construction sector is 3.65 percent which is the lowest in the survey.

clxxxiii
Table 6.18 Distribution of Respndents by Sector of Employment
Sector of Employment Participants
Trade 230
(23.32)
Services 401
(40.67)
Manufacturing 266
(26.98)
Transport 53
(5.37)
Construction 36
(3.65)
Total 986
Source: Survey by the author
Note: Values are percnetages of total columns.
6.3.18 Working Hours and Urban Informal Sector Employment
Table 6.19 presents the working hours of those who are involved in the urban
informal sector. The proportion of the workers who work less than 15 hours in a week is
about 1.3 %. The 11.6 % male informal workers are engaged in 15-24 hours. It is also
observed that 27.4 % participants of the urban informal sector work 48 hours in a week
and 19.8 % of the workers work more than 56 hours in a week.
Table 6.19: Distribution of Respondents by Working Hours
Working Hours Participants
Less than 15 13
(1.3)
15-24 Hours 114
(11.6)
25-34 Hours 139
(14.1)
35-41 Hours 119
(12.1)
42-48 Hours 270
(27.4)
49-55 Hours 136
(13.8)
56 Hours and above 195
(19.8)
Total 986
Source: Survey by the author
Note: Values in round brackets are percnetages of total columns.

clxxxiv
clxxxv
6.4 Descriptive Analysis of Urban Male Informal and Formal
Sector in Southern Punjab, Pakistan
In this section, we present the descriptive analysis of determinants of male
informal and formal sector employment. Mostly males, being household heads, have to
contribute more in informal labour market because they have to fulfill the household
responsibilities. In this section, we will discuss the various socio-economic and
demographic factors of male participants of the urban informal and formal sector
employment in Southern Punjab, Pakistan. It is essential to take a detailed account of the
determinants of urban male informal sector participants descriptively to understand the
development-oriented and job-promoting character of the informal sector. A study of the
descriptive analysis of male urban informal sector workers assists to know the factors
which influence male individual‟s choice to engage in this sector. The analysis will make
it possible for policy makers to formulate or design policies regarding participants in
informal sector.
6.4.1 Age Groups and Urban Male Informal and Formal Sector
Employment
Age plays a positive role in determining the growth potential of informal and
formal sector employment. Data reflects that employment rate for male informal sector
workers are very low at early and higher age groups. Male informal sector employment is
observed to be diminishing in early and old age.
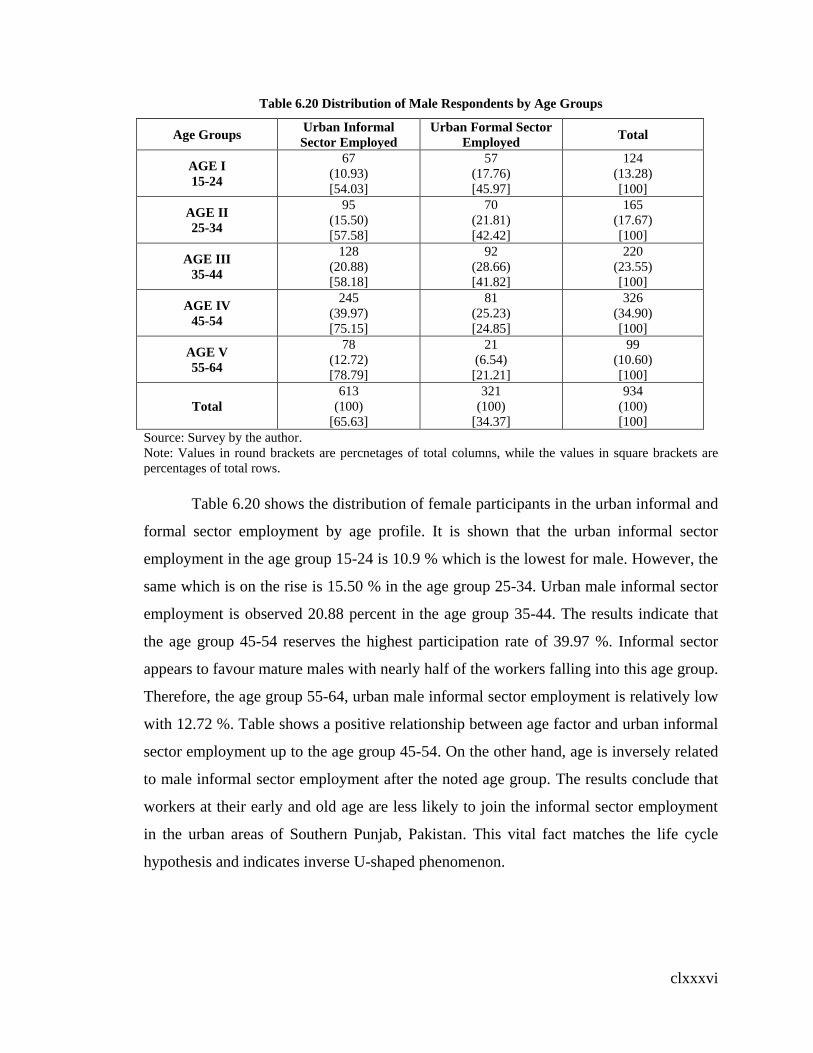
clxxxvi
Table 6.20 Distribution of Male Respondents by Age Groups
Age Groups Urban Informal
Sector Employed
Urban Formal Sector
Employed Total
AGE I
15-24
67
(10.93)
[54.03]
57
(17.76)
[45.97]
124
(13.28)
[100]
AGE II
25-34
95
(15.50)
[57.58]
70
(21.81)
[42.42]
165
(17.67)
[100]
AGE III
35-44
128
(20.88)
[58.18]
92
(28.66)
[41.82]
220
(23.55)
[100]
AGE IV
45-54
245
(39.97)
[75.15]
81
(25.23)
[24.85]
326
(34.90)
[100]
AGE V
55-64
78
(12.72)
[78.79]
21
(6.54)
[21.21]
99
(10.60)
[100]
Total
613
(100)
[65.63]
321
(100)
[34.37]
934
(100)
[100]
Source: Survey by the author.
Note: Values in round brackets are percnetages of total columns, while the values in square brackets are
percentages of total rows.
Table 6.20 shows the distribution of female participants in the urban informal and
formal sector employment by age profile. It is shown that the urban informal sector
employment in the age group 15-24 is 10.9 % which is the lowest for male. However, the
same which is on the rise is 15.50 % in the age group 25-34. Urban male informal sector
employment is observed 20.88 percent in the age group 35-44. The results indicate that
the age group 45-54 reserves the highest participation rate of 39.97 %. Informal sector
appears to favour mature males with nearly half of the workers falling into this age group.
Therefore, the age group 55-64, urban male informal sector employment is relatively low
with 12.72 %. Table shows a positive relationship between age factor and urban informal
sector employment up to the age group 45-54. On the other hand, age is inversely related
to male informal sector employment after the noted age group. The results conclude that
workers at their early and old age are less likely to join the informal sector employment
in the urban areas of Southern Punjab, Pakistan. This vital fact matches the life cycle
hypothesis and indicates inverse U-shaped phenomenon.

clxxxvii
6.4.2 Education and Urban Male Informal and Formal Sector Employment
Education is an imperative factor in determining the participation in sector of
employment. It is postulated that education and the urban informal sector employment
decision are negatively correlated. The study results confirm the hypothesis and show the
distribution of male participants of the informal and formal sector by education level in
given table 6.21.
Table 6.21 Distribution of Male Respondents by Level of Education
Level of Education Urban Informal
Sector Employed
Urban Formal Sector
Employed Total
EDU I
Primary
57
(9.66)
[79.17]
15
(4.77)
[20.83]
72
(7.96)
[100]
EDU II
Middle
137
(23.22)
[88.96]
17
(5.41)
[11.04]
154
(17.04)
[100]
EDU III
Matric
209
(35.42)
[74.91]
70
(22.29)
[25.09]
279
(30.86)
[100]
EDU IV
Intermediate
98
(16.61)
[60.87]
63
(20.06)
[39.13]
161
(17.81)
[100]
EDU V
Graduation
61
(10.34)
[43.57]
79
(25.16)
[56.43]
140
(15.49)
[100]
EDU VI
Mastr’s or higher
Education
28
(4.75)
[28.57]
70
(22.29)
[71.43]
98
(10.84)
[100]
Total
590
(100)
[65.27]
314
(100)
[34.73]
904
(100)
[100]
Source: Survey by the author.
Note: Values in round brackets are percnetages of total columns, while the values in square brackets are
percentages of total rows.
The table 6.21 demonstrates a negative relationship between male informal and
formal sector employment and education level. It is observed that the informal sector
employment decreases with an increase in the education level of the participants. There is
highest proportion of the informal sector participants who have Matric level education
which is 35 percent. Result also indicates the 2nd
highest level of education is the Middle
level. As the educational level increases, the percentages of male informal sector
employment decreases. Our findings indicate that the lowest level of education is

clxxxviii
Master‟s level. Results conclude that males possessing higher education level are inclined
to the urban formal labour market of Southern Punjab.
6.4.3 Marital Status and Male Informal and Formal Sector Employment
A further factor, marital status also determines the decision of participation in
sector of employment. It is expected that married people contribute more in economic
activities due to financial responsibility. A positive relationship is established between
male informal sector employment and marital status in urban areas of Southern Punjab in
the following table.
Table 6.22: Distribution of Male Respondents by Marital Status
Marital Status Urban Informal
Sector Employed
Urban Formal Sector
Employed Total
Married
454
(74.06)
[65.89]
235
(73.21)
[34.11]
689
(73.77)
[100]
Unmarried
159
(25.94)
[64.90]
86
(26.79)
[35.10]
245
(26.23)
[100]
Total
613
(100)
[65.63]
321
(100)
[34.37]
934
(100)
[100]
Source: Survey by the author.
Note: Values in round brackets are percnetages of total columns, while the values in square brackets are
percentages of total rows.
In fact, there is highest proportion of 74.06 percent of married male workers who
joined the informal sector indicated by table 6.22. Contrarily, 25.94 percent unmarried
are observed working in the informal sector. Study portrays a positive relationship
between marital status and male informal sector employment rate. It is concluded that
married people are more likely to involve themselves in employment as compared to
unmarried persons in the urban informal sector of Southern Punjab.
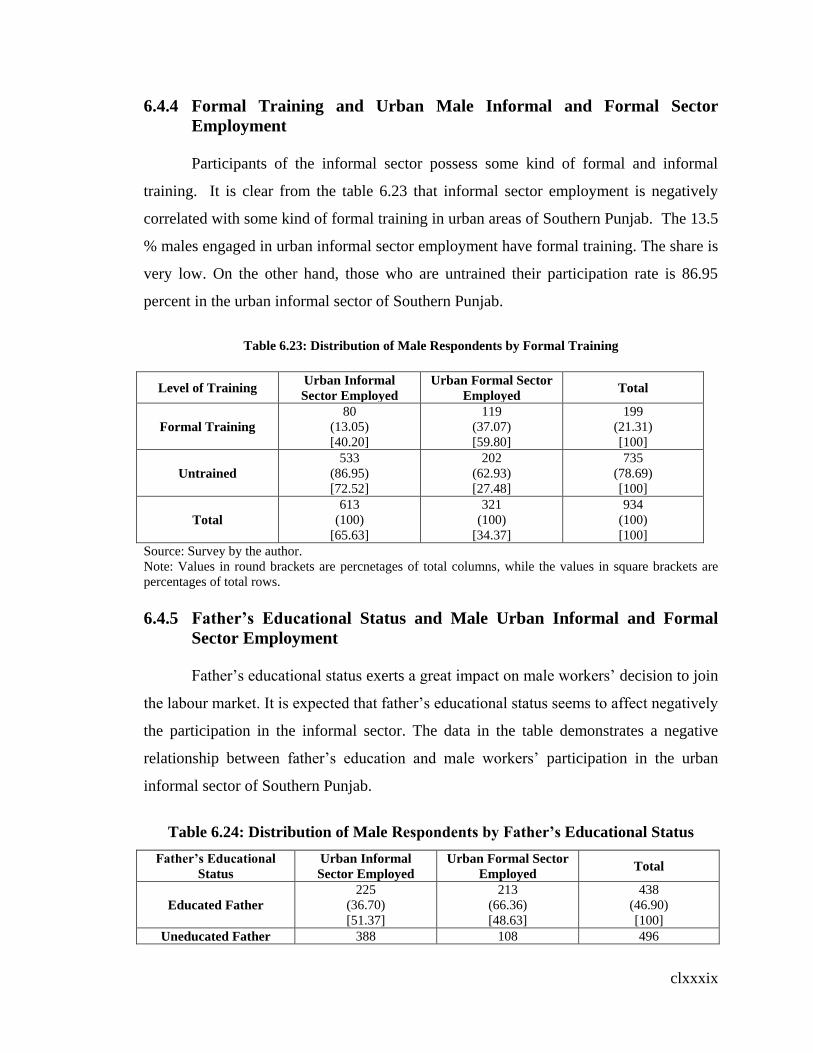
clxxxix
6.4.4 Formal Training and Urban Male Informal and Formal Sector
Employment
Participants of the informal sector possess some kind of formal and informal
training. It is clear from the table 6.23 that informal sector employment is negatively
correlated with some kind of formal training in urban areas of Southern Punjab. The 13.5
% males engaged in urban informal sector employment have formal training. The share is
very low. On the other hand, those who are untrained their participation rate is 86.95
percent in the urban informal sector of Southern Punjab.
Table 6.23: Distribution of Male Respondents by Formal Training
Level of Training Urban Informal
Sector Employed
Urban Formal Sector
Employed Total
Formal Training
80
(13.05)
[40.20]
119
(37.07)
[59.80]
199
(21.31)
[100]
Untrained
533
(86.95)
[72.52]
202
(62.93)
[27.48]
735
(78.69)
[100]
Total
613
(100)
[65.63]
321
(100)
[34.37]
934
(100)
[100]
Source: Survey by the author.
Note: Values in round brackets are percnetages of total columns, while the values in square brackets are
percentages of total rows.
6.4.5 Father’s Educational Status and Male Urban Informal and Formal
Sector Employment
Father‟s educational status exerts a great impact on male workers‟ decision to join
the labour market. It is expected that father‟s educational status seems to affect negatively
the participation in the informal sector. The data in the table demonstrates a negative
relationship between father‟s education and male workers‟ participation in the urban
informal sector of Southern Punjab.
Table 6.24: Distribution of Male Respondents by Father’s Educational Status
Father’s Educational
Status
Urban Informal
Sector Employed
Urban Formal Sector
Employed Total
Educated Father
225
(36.70)
[51.37]
213
(66.36)
[48.63]
438
(46.90)
[100]
Uneducated Father 388 108 496
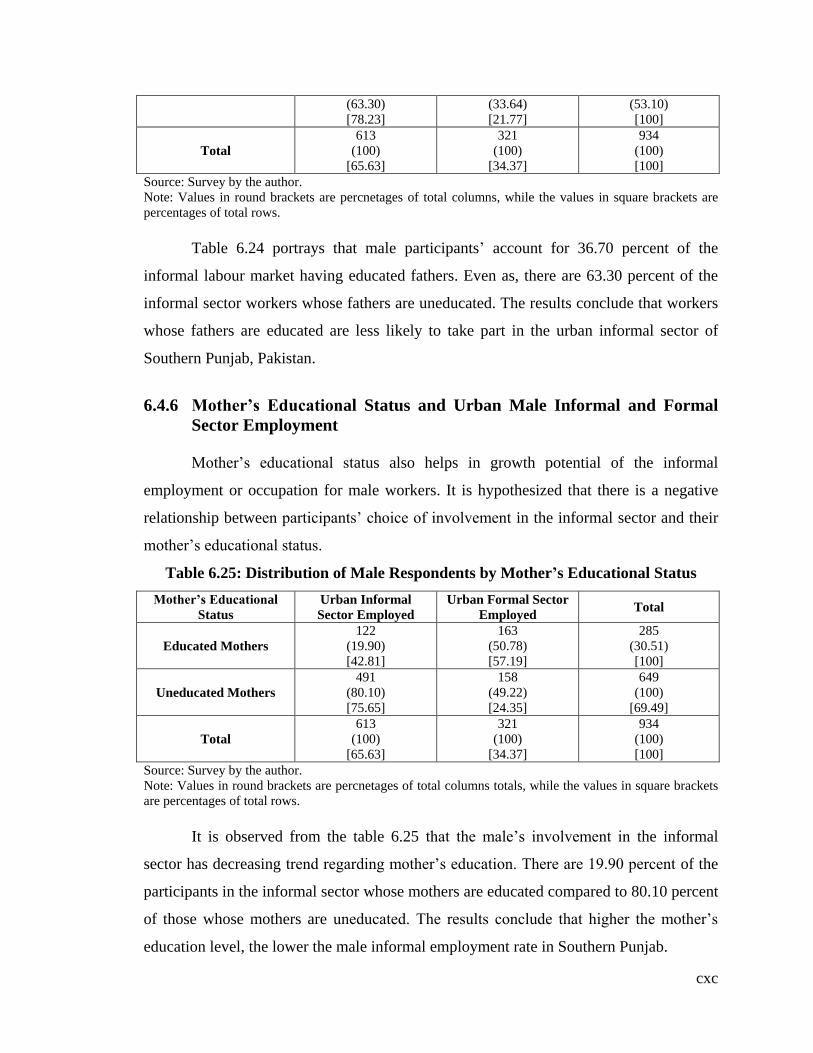
cxc
(63.30)
[78.23]
(33.64)
[21.77]
(53.10)
[100]
Total
613
(100)
[65.63]
321
(100)
[34.37]
934
(100)
[100]
Source: Survey by the author.
Note: Values in round brackets are percnetages of total columns, while the values in square brackets are
percentages of total rows.
Table 6.24 portrays that male participants‟ account for 36.70 percent of the
informal labour market having educated fathers. Even as, there are 63.30 percent of the
informal sector workers whose fathers are uneducated. The results conclude that workers
whose fathers are educated are less likely to take part in the urban informal sector of
Southern Punjab, Pakistan.
6.4.6 Mother’s Educational Status and Urban Male Informal and Formal
Sector Employment
Mother‟s educational status also helps in growth potential of the informal
employment or occupation for male workers. It is hypothesized that there is a negative
relationship between participants‟ choice of involvement in the informal sector and their
mother‟s educational status.
Table 6.25: Distribution of Male Respondents by Mother’s Educational Status
Mother’s Educational
Status
Urban Informal
Sector Employed
Urban Formal Sector
Employed Total
Educated Mothers
122
(19.90)
[42.81]
163
(50.78)
[57.19]
285
(30.51)
[100]
Uneducated Mothers
491
(80.10)
[75.65]
158
(49.22)
[24.35]
649
(100)
[69.49]
Total
613
(100)
[65.63]
321
(100)
[34.37]
934
(100)
[100]
Source: Survey by the author.
Note: Values in round brackets are percnetages of total columns totals, while the values in square brackets
are percentages of total rows.
It is observed from the table 6.25 that the male‟s involvement in the informal
sector has decreasing trend regarding mother‟s education. There are 19.90 percent of the
participants in the informal sector whose mothers are educated compared to 80.10 percent
of those whose mothers are uneducated. The results conclude that higher the mother‟s
education level, the lower the male informal employment rate in Southern Punjab.

cxci
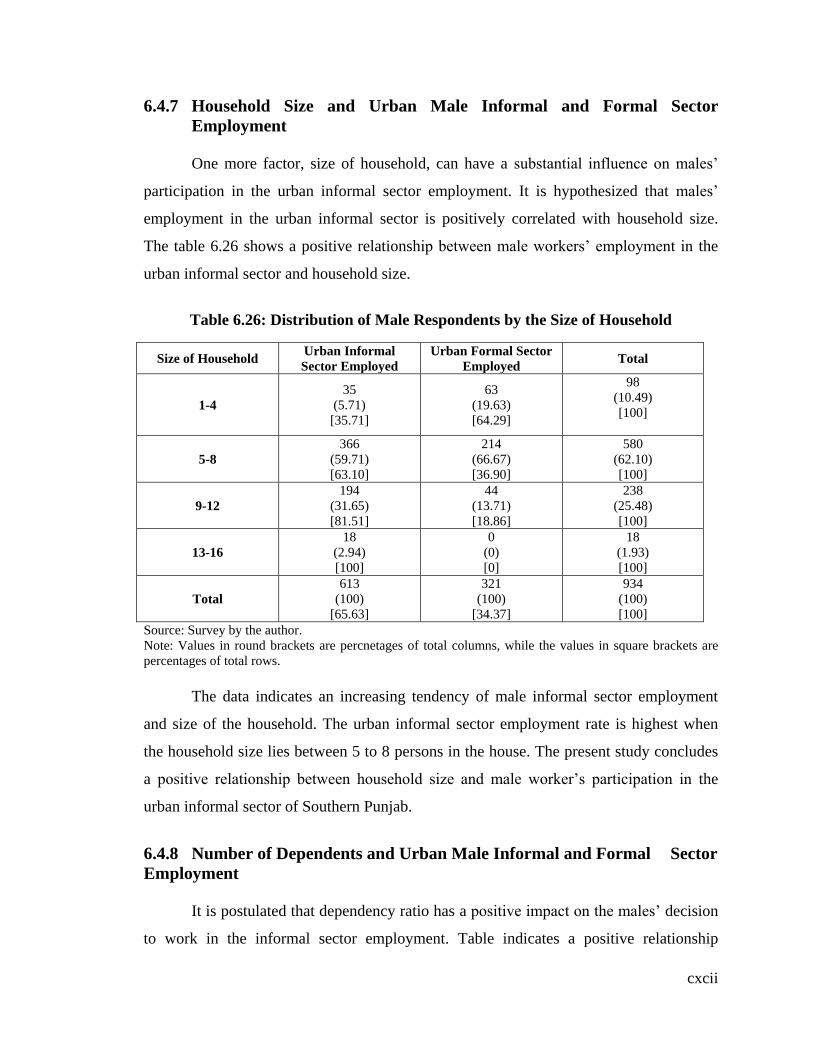
cxcii
6.4.7 Household Size and Urban Male Informal and Formal Sector
Employment
One more factor, size of household, can have a substantial influence on males‟
participation in the urban informal sector employment. It is hypothesized that males‟
employment in the urban informal sector is positively correlated with household size.
The table 6.26 shows a positive relationship between male workers‟ employment in the
urban informal sector and household size.
Table 6.26: Distribution of Male Respondents by the Size of Household
Size of Household Urban Informal
Sector Employed
Urban Formal Sector
Employed Total
1-4
35
(5.71)
[35.71]
63
(19.63)
[64.29]
98
(10.49)
[100]
5-8
366
(59.71)
[63.10]
214
(66.67)
[36.90]
580
(62.10)
[100]
9-12
194
(31.65)
[81.51]
44
(13.71)
[18.86]
238
(25.48)
[100]
13-16
18
(2.94)
[100]
0
(0)
[0]
18
(1.93)
[100]
Total
613
(100)
[65.63]
321
(100)
[34.37]
934
(100)
[100]
Source: Survey by the author.
Note: Values in round brackets are percnetages of total columns, while the values in square brackets are
percentages of total rows.
The data indicates an increasing tendency of male informal sector employment
and size of the household. The urban informal sector employment rate is highest when
the household size lies between 5 to 8 persons in the house. The present study concludes
a positive relationship between household size and male worker‟s participation in the
urban informal sector of Southern Punjab.
6.4.8 Number of Dependents and Urban Male Informal and Formal Sector
Employment
It is postulated that dependency ratio has a positive impact on the males‟ decision
to work in the informal sector employment. Table indicates a positive relationship
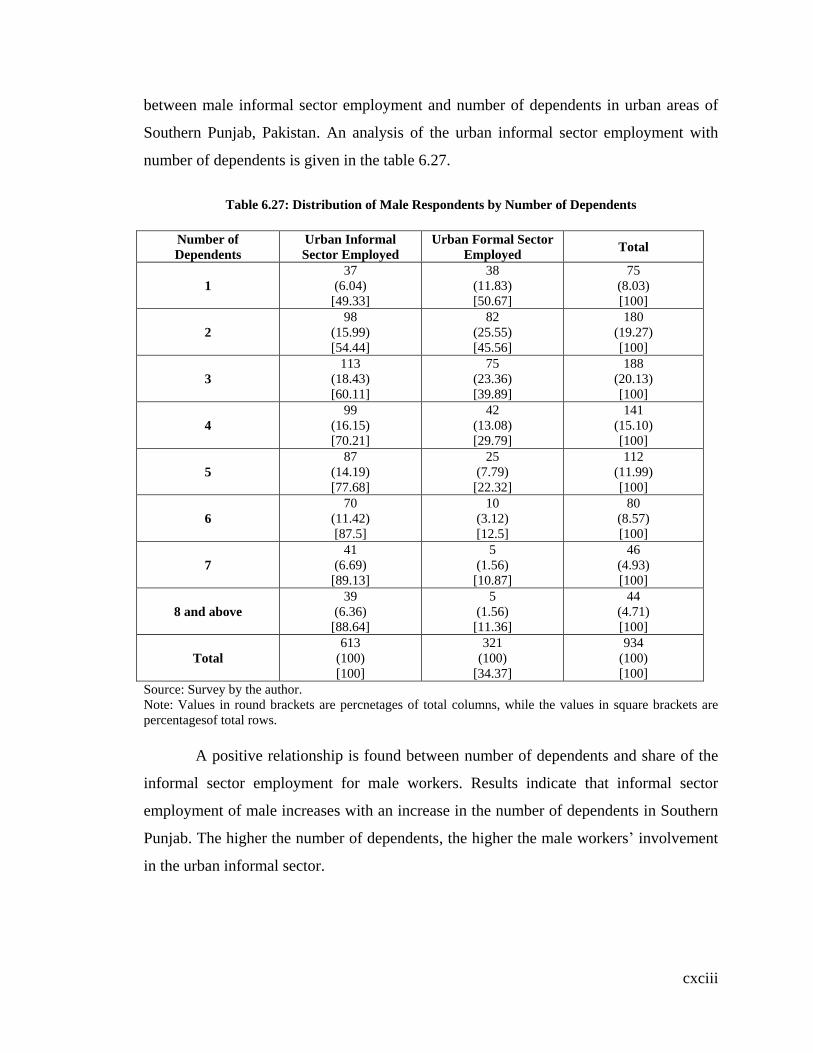
cxciii
between male informal sector employment and number of dependents in urban areas of
Southern Punjab, Pakistan. An analysis of the urban informal sector employment with
number of dependents is given in the table 6.27.
Table 6.27: Distribution of Male Respondents by Number of Dependents
Number of
Dependents
Urban Informal
Sector Employed
Urban Formal Sector
Employed Total
1
37
(6.04)
[49.33]
38
(11.83)
[50.67]
75
(8.03)
[100]
2
98
(15.99)
[54.44]
82
(25.55)
[45.56]
180
(19.27)
[100]
3
113
(18.43)
[60.11]
75
(23.36)
[39.89]
188
(20.13)
[100]
4
99
(16.15)
[70.21]
42
(13.08)
[29.79]
141
(15.10)
[100]
5
87
(14.19)
[77.68]
25
(7.79)
[22.32]
112
(11.99)
[100]
6
70
(11.42)
[87.5]
10
(3.12)
[12.5]
80
(8.57)
[100]
7
41
(6.69)
[89.13]
5
(1.56)
[10.87]
46
(4.93)
[100]
8 and above
39
(6.36)
[88.64]
5
(1.56)
[11.36]
44
(4.71)
[100]
Total
613
(100)
[100]
321
(100)
[34.37]
934
(100)
[100]
Source: Survey by the author.
Note: Values in round brackets are percnetages of total columns, while the values in square brackets are
percentagesof total rows.
A positive relationship is found between number of dependents and share of the
informal sector employment for male workers. Results indicate that informal sector
employment of male increases with an increase in the number of dependents in Southern
Punjab. The higher the number of dependents, the higher the male workers‟ involvement
in the urban informal sector.
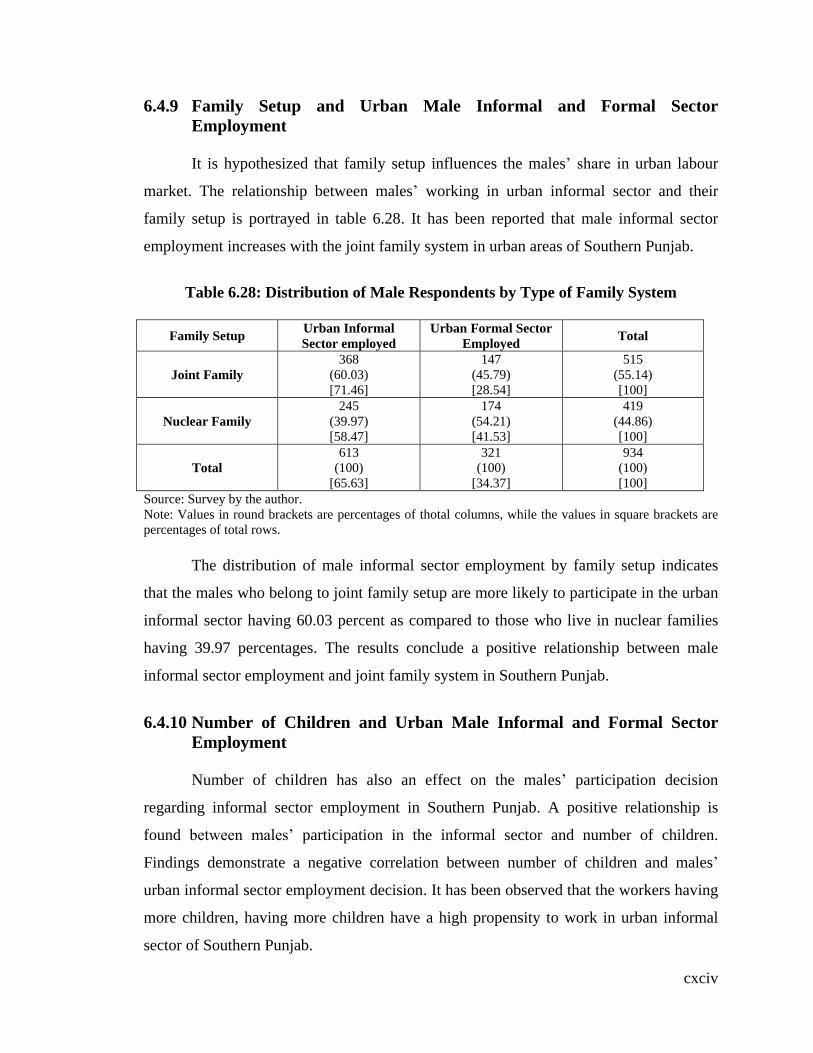
cxciv
6.4.9 Family Setup and Urban Male Informal and Formal Sector
Employment
It is hypothesized that family setup influences the males‟ share in urban labour
market. The relationship between males‟ working in urban informal sector and their
family setup is portrayed in table 6.28. It has been reported that male informal sector
employment increases with the joint family system in urban areas of Southern Punjab.
Table 6.28: Distribution of Male Respondents by Type of Family System
Family Setup Urban Informal
Sector employed
Urban Formal Sector
Employed Total
Joint Family
368
(60.03)
[71.46]
147
(45.79)
[28.54]
515
(55.14)
[100]
Nuclear Family
245
(39.97)
[58.47]
174
(54.21)
[41.53]
419
(44.86)
[100]
Total
613
(100)
[65.63]
321
(100)
[34.37]
934
(100)
[100]
Source: Survey by the author.
Note: Values in round brackets are percentages of thotal columns, while the values in square brackets are
percentages of total rows.
The distribution of male informal sector employment by family setup indicates
that the males who belong to joint family setup are more likely to participate in the urban
informal sector having 60.03 percent as compared to those who live in nuclear families
having 39.97 percentages. The results conclude a positive relationship between male
informal sector employment and joint family system in Southern Punjab.
6.4.10 Number of Children and Urban Male Informal and Formal Sector
Employment
Number of children has also an effect on the males‟ participation decision
regarding informal sector employment in Southern Punjab. A positive relationship is
found between males‟ participation in the informal sector and number of children.
Findings demonstrate a negative correlation between number of children and males‟
urban informal sector employment decision. It has been observed that the workers having
more children, having more children have a high propensity to work in urban informal
sector of Southern Punjab.

cxcv
Table 6.29: Distribution of Male Respondents by Number of Children
Number of Children Urban Informal
Sector Employed
Urban Formal Sector
Employed Total
0
161
(26.26)
[60.98]
103
(32.09)
[39.01]
264
(28.27)
[100]
1
84
(13.70)
[58.74]
59
(18.38)
[41.26]
143
(15.31)
[100]
2
147
(23.98)
[64.47]
81
(25.23)
[35.53]
228
(24.41)
[100]
3
93
(15.17)
[64.58]
51
(15.89)
[35.42]
144
(15.42)
[100]
4
73
(11.91)
[78.49]
20
(6.23)
[21.51]
93
(9.96)
[100]
5
40
(6.53)
[90.91]
4
(1.25)
[9.09]
44
(4.71)
[100]
6
12
(1.96)
[80]
3
(0.93)
[20]
15
(1.61)
[100]
7
3
(0.49)
[100]
0
(0)
[0]
3
(0.32)
[100]
Total
613
(100)
[65.63]
321
(100)
[34.37]
934
(100)
[100]
Source: Survey by the author.
Note: Values in round brackets are percnetages of total columns, while the values in square brackets are
percentages of total rows.
6.4.11 Male Adolescents and Male Informal and Formal Sector Employment
Having male adolescents is another factor which helps regarding participation
decision in relation to the urban informal sector of Southern Punjab. Table 6.30 expresses
the relationship between males‟ contribution in the urban informal sector and the
presence of male adolescents. Study presents a negative association between male
adolescents and the informal sector employment decision. The study concludes that the
informal sector workers having more male adolescents have a less likelihood in the urban
informal sector of Southern Punjab.
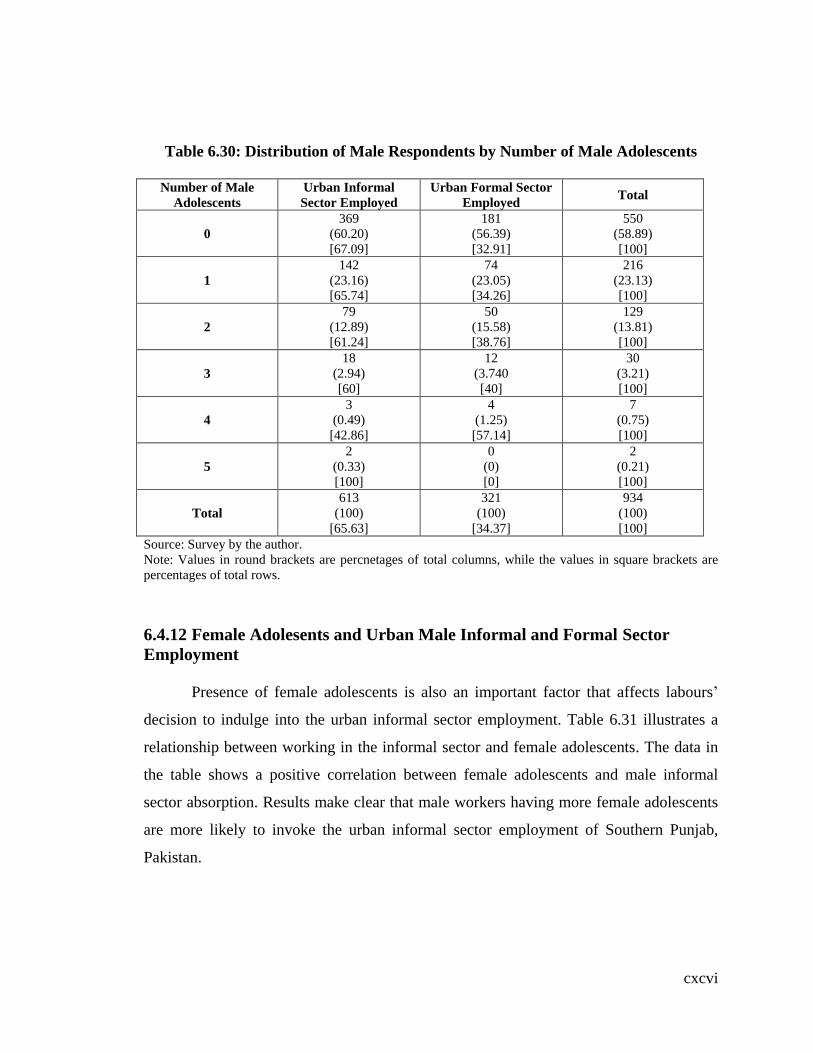
cxcvi
Table 6.30: Distribution of Male Respondents by Number of Male Adolescents
Number of Male
Adolescents
Urban Informal
Sector Employed
Urban Formal Sector
Employed Total
0
369
(60.20)
[67.09]
181
(56.39)
[32.91]
550
(58.89)
[100]
1
142
(23.16)
[65.74]
74
(23.05)
[34.26]
216
(23.13)
[100]
2
79
(12.89)
[61.24]
50
(15.58)
[38.76]
129
(13.81)
[100]
3
18
(2.94)
[60]
12
(3.740
[40]
30
(3.21)
[100]
4
3
(0.49)
[42.86]
4
(1.25)
[57.14]
7
(0.75)
[100]
5
2
(0.33)
[100]
0
(0)
[0]
2
(0.21)
[100]
Total
613
(100)
[65.63]
321
(100)
[34.37]
934
(100)
[100]
Source: Survey by the author.
Note: Values in round brackets are percnetages of total columns, while the values in square brackets are
percentages of total rows.
6.4.12 Female Adolesents and Urban Male Informal and Formal Sector
Employment
Presence of female adolescents is also an important factor that affects labours‟
decision to indulge into the urban informal sector employment. Table 6.31 illustrates a
relationship between working in the informal sector and female adolescents. The data in
the table shows a positive correlation between female adolescents and male informal
sector absorption. Results make clear that male workers having more female adolescents
are more likely to invoke the urban informal sector employment of Southern Punjab,
Pakistan.

cxcvii
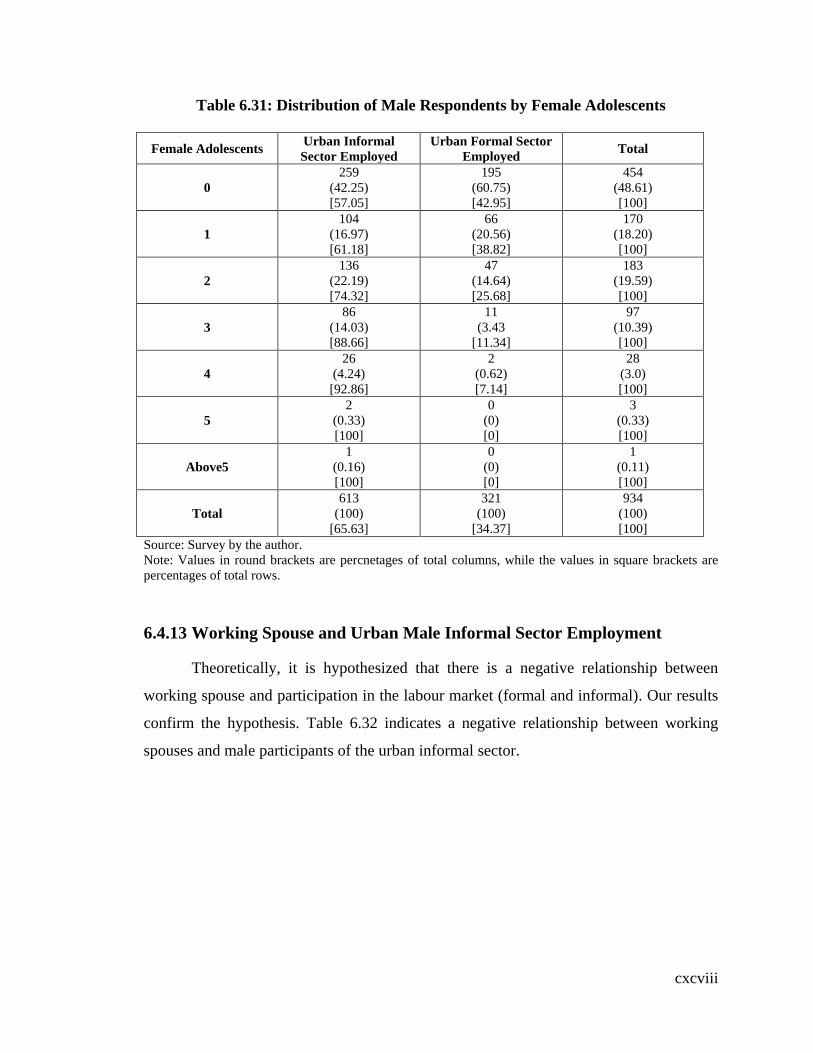
cxcviii
Table 6.31: Distribution of Male Respondents by Female Adolescents
Female Adolescents Urban Informal
Sector Employed
Urban Formal Sector
Employed Total
0
259
(42.25)
[57.05]
195
(60.75)
[42.95]
454
(48.61)
[100]
1
104
(16.97)
[61.18]
66
(20.56)
[38.82]
170
(18.20)
[100]
2
136
(22.19)
[74.32]
47
(14.64)
[25.68]
183
(19.59)
[100]
3
86
(14.03)
[88.66]
11
(3.43
[11.34]
97
(10.39)
[100]
4
26
(4.24)
[92.86]
2
(0.62)
[7.14]
28
(3.0)
[100]
5
2
(0.33)
[100]
0
(0)
[0]
3
(0.33)
[100]
Above5
1
(0.16)
[100]
0
(0)
[0]
1
(0.11)
[100]
Total
613
(100)
[65.63]
321
(100)
[34.37]
934
(100)
[100]
Source: Survey by the author.
Note: Values in round brackets are percnetages of total columns, while the values in square brackets are
percentages of total rows.
6.4.13 Working Spouse and Urban Male Informal Sector Employment
Theoretically, it is hypothesized that there is a negative relationship between
working spouse and participation in the labour market (formal and informal). Our results
confirm the hypothesis. Table 6.32 indicates a negative relationship between working
spouses and male participants of the urban informal sector.
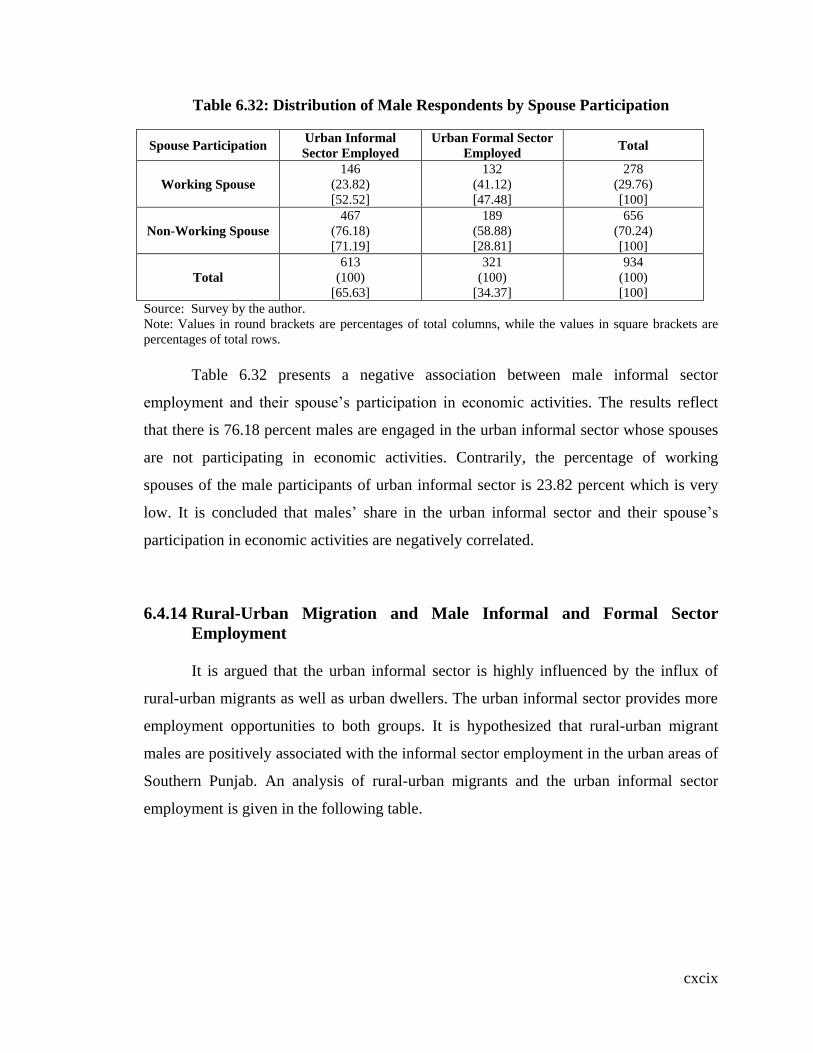
cxcix
Table 6.32: Distribution of Male Respondents by Spouse Participation
Spouse Participation Urban Informal
Sector Employed
Urban Formal Sector
Employed Total
Working Spouse
146
(23.82)
[52.52]
132
(41.12)
[47.48]
278
(29.76)
[100]
Non-Working Spouse
467
(76.18)
[71.19]
189
(58.88)
[28.81]
656
(70.24)
[100]
Total
613
(100)
[65.63]
321
(100)
[34.37]
934
(100)
[100]
Source: Survey by the author.
Note: Values in round brackets are percentages of total columns, while the values in square brackets are
percentages of total rows.
Table 6.32 presents a negative association between male informal sector
employment and their spouse‟s participation in economic activities. The results reflect
that there is 76.18 percent males are engaged in the urban informal sector whose spouses
are not participating in economic activities. Contrarily, the percentage of working
spouses of the male participants of urban informal sector is 23.82 percent which is very
low. It is concluded that males‟ share in the urban informal sector and their spouse‟s
participation in economic activities are negatively correlated.
6.4.14 Rural-Urban Migration and Male Informal and Formal Sector
Employment
It is argued that the urban informal sector is highly influenced by the influx of
rural-urban migrants as well as urban dwellers. The urban informal sector provides more
employment opportunities to both groups. It is hypothesized that rural-urban migrant
males are positively associated with the informal sector employment in the urban areas of
Southern Punjab. An analysis of rural-urban migrants and the urban informal sector
employment is given in the following table.
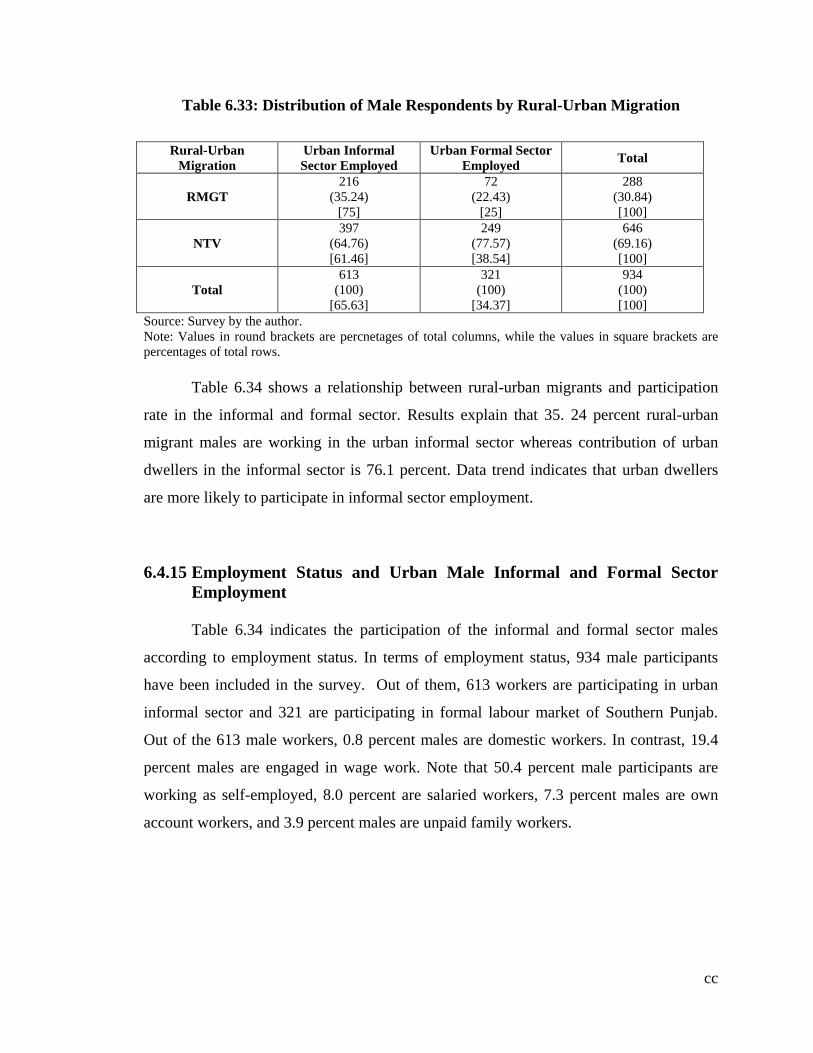
cc
Table 6.33: Distribution of Male Respondents by Rural-Urban Migration
Rural-Urban
Migration
Urban Informal
Sector Employed
Urban Formal Sector
Employed Total
RMGT
216
(35.24)
[75]
72
(22.43)
[25]
288
(30.84)
[100]
NTV
397
(64.76)
[61.46]
249
(77.57)
[38.54]
646
(69.16)
[100]
Total
613
(100)
[65.63]
321
(100)
[34.37]
934
(100)
[100]
Source: Survey by the author.
Note: Values in round brackets are percnetages of total columns, while the values in square brackets are
percentages of total rows.
Table 6.34 shows a relationship between rural-urban migrants and participation
rate in the informal and formal sector. Results explain that 35. 24 percent rural-urban
migrant males are working in the urban informal sector whereas contribution of urban
dwellers in the informal sector is 76.1 percent. Data trend indicates that urban dwellers
are more likely to participate in informal sector employment.
6.4.15 Employment Status and Urban Male Informal and Formal Sector
Employment
Table 6.34 indicates the participation of the informal and formal sector males
according to employment status. In terms of employment status, 934 male participants
have been included in the survey. Out of them, 613 workers are participating in urban
informal sector and 321 are participating in formal labour market of Southern Punjab.
Out of the 613 male workers, 0.8 percent males are domestic workers. In contrast, 19.4
percent males are engaged in wage work. Note that 50.4 percent male participants are
working as self-employed, 8.0 percent are salaried workers, 7.3 percent males are own
account workers, and 3.9 percent males are unpaid family workers.

cci
Table 6.34 Distribution of Male Respondents by Employment Status
Employment Status Participants
Formal Sector Employed 321
Informal Sector Employed 613
Domestic Workers 5
(0.8)
Wage Workers 180
(29.36)
Self-employed 310
(50.4)
Salaried workers 49
(8.0)
Own account Workers 45
(7.3)
Unpaid Family Workers 24
(3.9)
Total 613
Source: Field Survey by the author.
Note: Values in round brackets are percentages of total columns.
6.4.16 Sector of Employment and Urban Male Informal Sector Employment
Table 6.35 reveals the distribution of male participants in the informal and formal
sector. Out of 613 participants of the informal sector, 28.38 percent males are working in
the trade sector. The highest proportion of the male participants is 33.77 percent which is
found in the services sector. The contribution of male workers is 23.65 percent in
manufacturing sector. Generally, 8.48 percent of males are employed in the transport
sector. The contribution of male workers in construction sector is 5.87 percent which is
lowest in the survey.
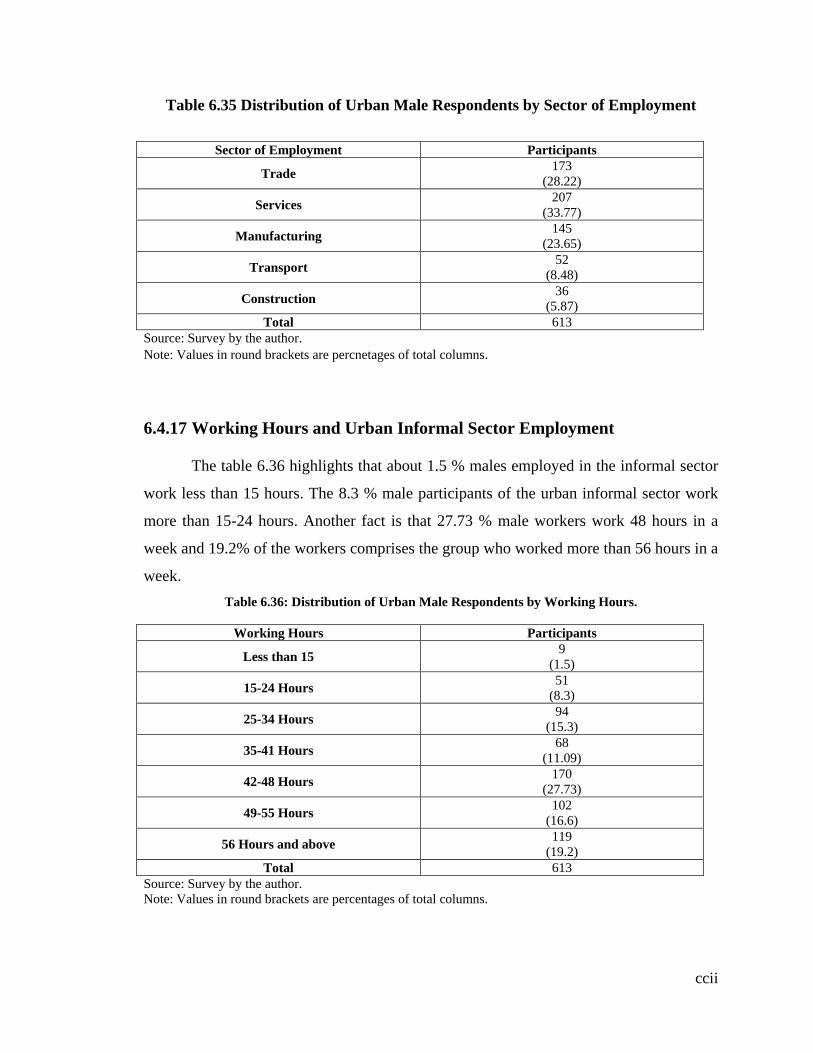
ccii
Table 6.35 Distribution of Urban Male Respondents by Sector of Employment
Sector of Employment Participants
Trade 173
(28.22)
Services 207
(33.77)
Manufacturing 145
(23.65)
Transport 52
(8.48)
Construction 36
(5.87)
Total 613
Source: Survey by the author.
Note: Values in round brackets are percnetages of total columns.
6.4.17 Working Hours and Urban Informal Sector Employment
The table 6.36 highlights that about 1.5 % males employed in the informal sector
work less than 15 hours. The 8.3 % male participants of the urban informal sector work
more than 15-24 hours. Another fact is that 27.73 % male workers work 48 hours in a
week and 19.2% of the workers comprises the group who worked more than 56 hours in a
week.
Table 6.36: Distribution of Urban Male Respondents by Working Hours.
Working Hours Participants
Less than 15 9
(1.5)
15-24 Hours 51
(8.3)
25-34 Hours 94
(15.3)
35-41 Hours 68
(11.09)
42-48 Hours 170
(27.73)
49-55 Hours 102
(16.6)
56 Hours and above 119
(19.2)
Total 613
Source: Survey by the author.
Note: Values in round brackets are percentages of total columns.
cciii
6.5 Descriptive Analysis of Urban Female Informal and Formal
Sector Employment in Southern Punjab, Pakistan.
This section decribes the descriptive analysis of female workers involved in the
urban informal sector of Southern Punjab, Pakistan. The data for the current study are
derived from primary source which is collected from urban areas of Southern Punjab. The
household survey is conducted and information is obtained from 514 females
amalgamating the informal sector. A descriptive analysis is made to discern the share of
female workers in the urban informal sector of Southern Punjab, Pakistan. In order to
understand the development-oriented and job-promoting character of informal sector, it is
imperative to take a detailed account of the characteristics of participants of the urban
informal sector who manage this sector. A study of the characteristics of the female
participants of the informal sector assists in order to identify the factors which influence
their choice to employ in this sector.
6.5.1 Age Groups and Urban Female Informal and Formal Sector
Employment
It is expected that age groups and females‟ employment in the urban informal
sector are highly associated. It is argued that the people are engaged highly in the urban
informal activities in young and old age groups. The present study ascertains a
relationship between age group and females‟ participation in the urban informal sector of
Southern Punjab.
Table 6.37 reveals an analysis of females by age group distribution of urban
informal and formal sector employment in southern Punjab. It is shown that female
participants of the informal sector in the age group 15-24 are 8.04 % which is the lowest.
However, the same is on the rise with 10.09% in the age group 25-34. Female informal
sector employment is observed 22.79 percent in the age group 35-44. The results indicate
that the age group 45-54 reserves the highest participation rate of 42.64 %. The urban
informal sector appears to favour older female with nearly half of the workers falling into
this age group. As far as the age group 55-64 is concerned, females‟ participation is
relatively low with percentage of 10.46. Table shows a positive relationship between age
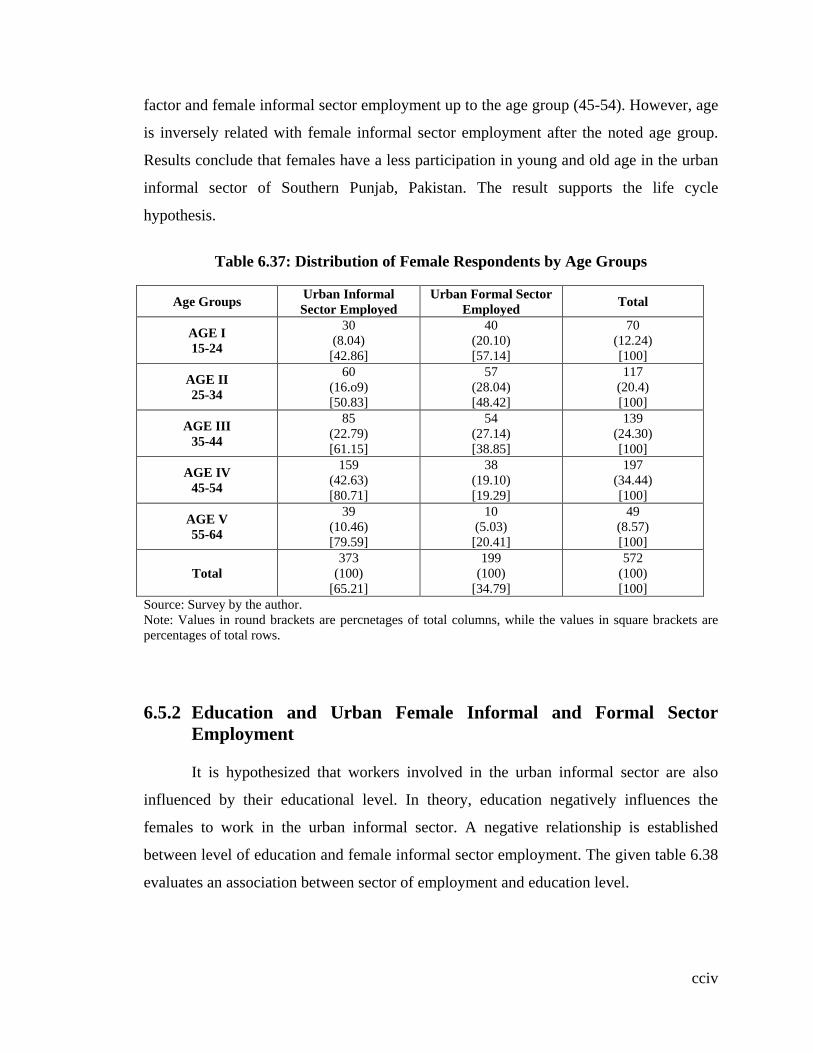
cciv
factor and female informal sector employment up to the age group (45-54). However, age
is inversely related with female informal sector employment after the noted age group.
Results conclude that females have a less participation in young and old age in the urban
informal sector of Southern Punjab, Pakistan. The result supports the life cycle
hypothesis.
Table 6.37: Distribution of Female Respondents by Age Groups
Age Groups Urban Informal
Sector Employed
Urban Formal Sector
Employed Total
AGE I
15-24
30
(8.04)
[42.86]
40
(20.10)
[57.14]
70
(12.24)
[100]
AGE II
25-34
60
(16.o9)
[50.83]
57
(28.04)
[48.42]
117
(20.4)
[100]
AGE III
35-44
85
(22.79)
[61.15]
54
(27.14)
[38.85]
139
(24.30)
[100]
AGE IV
45-54
159
(42.63)
[80.71]
38
(19.10)
[19.29]
197
(34.44)
[100]
AGE V
55-64
39
(10.46)
[79.59]
10
(5.03)
[20.41]
49
(8.57)
[100]
Total
373
(100)
[65.21]
199
(100)
[34.79]
572
(100)
[100]
Source: Survey by the author.
Note: Values in round brackets are percnetages of total columns, while the values in square brackets are
percentages of total rows.
6.5.2 Education and Urban Female Informal and Formal Sector
Employment
It is hypothesized that workers involved in the urban informal sector are also
influenced by their educational level. In theory, education negatively influences the
females to work in the urban informal sector. A negative relationship is established
between level of education and female informal sector employment. The given table 6.38
evaluates an association between sector of employment and education level.

ccv
Table 6.38: Distribution of Female Respondents by Education
Level of Education Urban Informal
Sector Employed
Urban Formal Sector
Employed Total
EDUI
Primary
70
(21.81)
[92.11]
6
(3.31)
[7.89]
76
(14.79)
[100]
EDUII
Middle
75
(23.36)
[89.29]
9
(4.97)
[10.71]
84
(16.34)
[100]
EDUIII
Matric
89
(27.73)
[70.63]
37
(20.44)
[29.37]
126
(24.51)
[100]
EDUIV
Intermediate
38
(11.83)
[54.29]
32
(17.68)
[45.71]
70
(13.62)
[100]
EDUV
Graduation
27
(8.41)
[38.03]
44
(24.31)
[61.97]
71
(13.81)
[100]
EDUVI
Master’s or higher
Education
22
(6.85)
[25.29]
65
(35.91)
[74.71]
87
(16.93)
[100]
Total
321
(100)
[62.45]
181
(100)
[35.21]
514
(100)
[100]
Source: Survey by the author.
Note: Values in round brackets are percnetages of total columns, while the values in square brackets are
percentages of total rows.
Table 6.38 implies the distribution of female participants regarding formal and
informal sector employment and their education level. The study analysis indicates that
the female participants of the informal sector and education levels are negatively
correlated. Results show a decreasing trend of females in the urban informal sector with
the increasing education level.The results also point out that there is highest proportion of
female participants whose education level is up to Matric, which is 27.73 percent. The
share of those workers whose level of education is up to Primary is 21.81 perecnt.
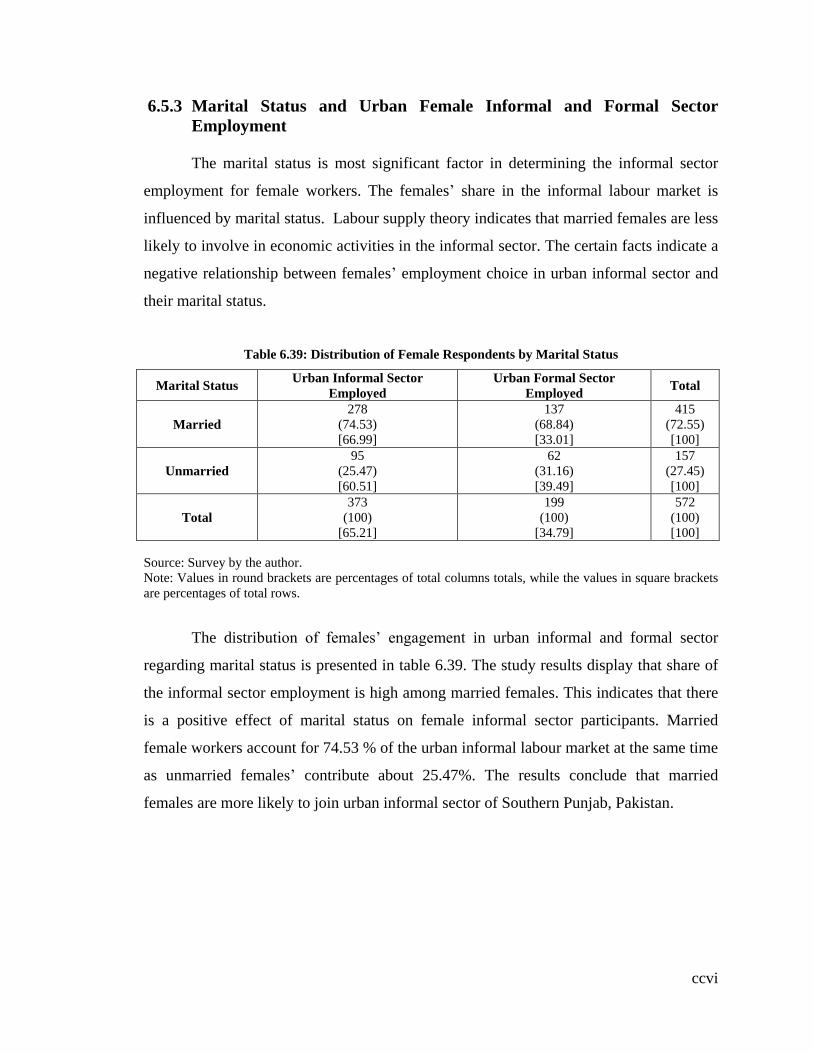
ccvi
6.5.3 Marital Status and Urban Female Informal and Formal Sector
Employment
The marital status is most significant factor in determining the informal sector
employment for female workers. The females‟ share in the informal labour market is
influenced by marital status. Labour supply theory indicates that married females are less
likely to involve in economic activities in the informal sector. The certain facts indicate a
negative relationship between females‟ employment choice in urban informal sector and
their marital status.
Table 6.39: Distribution of Female Respondents by Marital Status
Marital Status Urban Informal Sector
Employed
Urban Formal Sector
Employed Total
Married
278
(74.53)
[66.99]
137
(68.84)
[33.01]
415
(72.55)
[100]
Unmarried
95
(25.47)
[60.51]
62
(31.16)
[39.49]
157
(27.45)
[100]
Total
373
(100)
[65.21]
199
(100)
[34.79]
572
(100)
[100]
Source: Survey by the author.
Note: Values in round brackets are percentages of total columns totals, while the values in square brackets
are percentages of total rows.
The distribution of females‟ engagement in urban informal and formal sector
regarding marital status is presented in table 6.39. The study results display that share of
the informal sector employment is high among married females. This indicates that there
is a positive effect of marital status on female informal sector participants. Married
female workers account for 74.53 % of the urban informal labour market at the same time
as unmarried females‟ contribute about 25.47%. The results conclude that married
females are more likely to join urban informal sector of Southern Punjab, Pakistan.
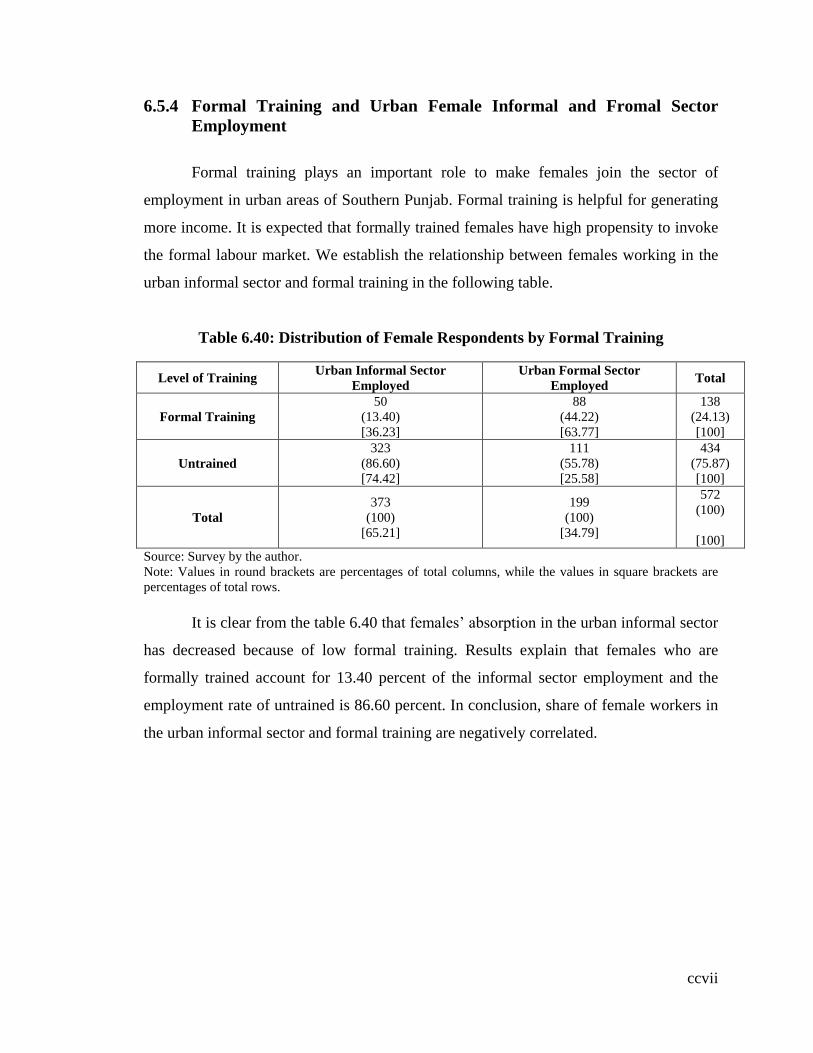
ccvii
6.5.4 Formal Training and Urban Female Informal and Fromal Sector
Employment
Formal training plays an important role to make females join the sector of
employment in urban areas of Southern Punjab. Formal training is helpful for generating
more income. It is expected that formally trained females have high propensity to invoke
the formal labour market. We establish the relationship between females working in the
urban informal sector and formal training in the following table.
Table 6.40: Distribution of Female Respondents by Formal Training
Level of Training Urban Informal Sector
Employed
Urban Formal Sector
Employed Total
Formal Training
50
(13.40)
[36.23]
88
(44.22)
[63.77]
138
(24.13)
[100]
Untrained
323
(86.60)
[74.42]
111
(55.78)
[25.58]
434
(75.87)
[100]
Total
373
(100)
[65.21]
199
(100)
[34.79]
572
(100)
[100]
Source: Survey by the author.
Note: Values in round brackets are percentages of total columns, while the values in square brackets are
percentages of total rows.
It is clear from the table 6.40 that females‟ absorption in the urban informal sector
has decreased because of low formal training. Results explain that females who are
formally trained account for 13.40 percent of the informal sector employment and the
employment rate of untrained is 86.60 percent. In conclusion, share of female workers in
the urban informal sector and formal training are negatively correlated.

ccviii
6.5.5 Father’s Educational Status and Urban Female Informal and
Formal Sector Employment
Education level of father helps in determining the decision to adhere to sector of
employment for female workers. Theoretically, father‟s educational status and females‟
contribution in the urban informal sector are negatively associated. The following table
describes a relationship between the females working in urban informal sector and their
educated fathers.
Table 6.41: Distribution of Female Respondents by Father’s Education Status
Father’s Educational
Status
Urban Informal
Sector Employed
Urban Formal Sector
Employed Total
Educated Father
120
(32.17)
[42.86]
160
(80.40)
[57.14]
280
(48.95)
[100]
Uneducated Father
253
(67.83)
[86.64]
39
(19.60)
[13.36]
292
(51.05)
[100]
Total
373
(100
[65.21]
199
(100)
[34.79]
572
(100)
[100]
Source: Survey by the author.
Note: Values in round brackets are percentages of total columns, while the values in square brackets are
percentages of total rows.
Table 6.41 presents distribution of female‟s informal and formal sector
employment by the presence of fathers‟ education. It is observed that education of father
is negatively correlated to the females‟ participation in the informal sector. Results
confirm that there are 32.17 % of female participants of the urban informal sector whose
fathers are educated as compared to 67.83 % of those female participants whose fathers
are uneducated. This trend indicates that the females whose fathers are uneducated are
more likely to participate in the urban informal sector of Southern Punjab. Results
conclude a negative association between father‟s education and choice of the urban
informal sector employment in Southern Punjab.
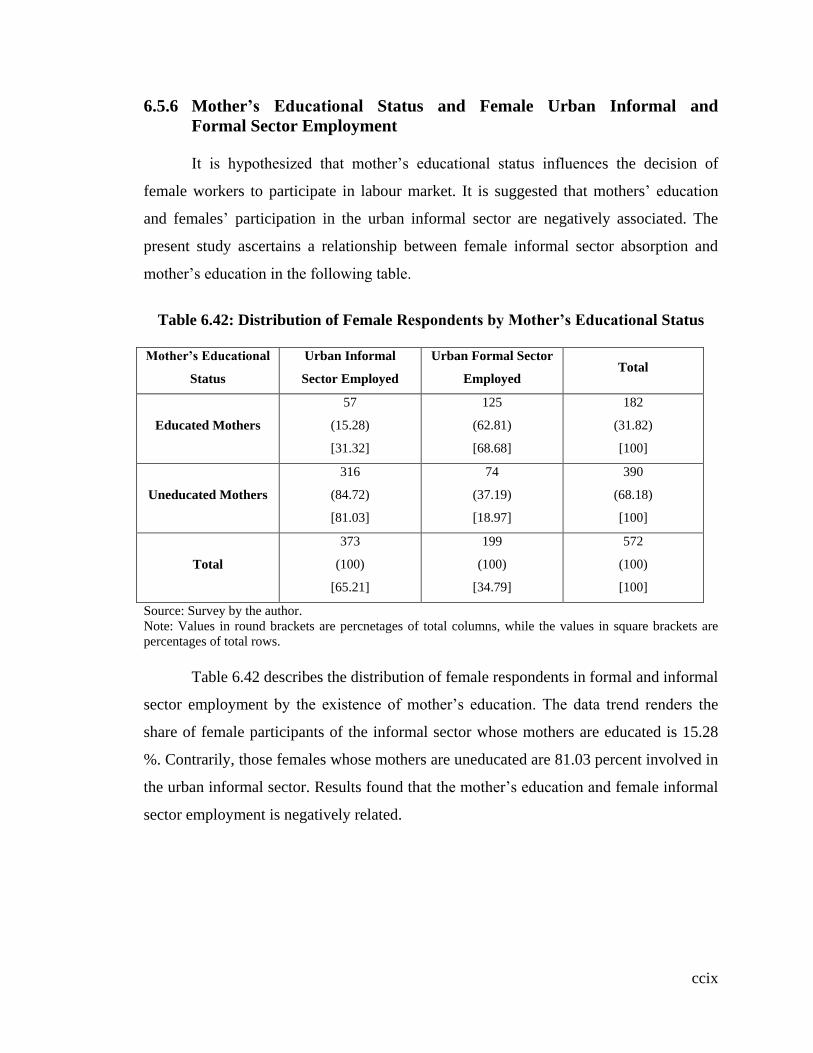
ccix
6.5.6 Mother’s Educational Status and Female Urban Informal and
Formal Sector Employment
It is hypothesized that mother‟s educational status influences the decision of
female workers to participate in labour market. It is suggested that mothers‟ education
and females‟ participation in the urban informal sector are negatively associated. The
present study ascertains a relationship between female informal sector absorption and
mother‟s education in the following table.
Table 6.42: Distribution of Female Respondents by Mother’s Educational Status
Mother’s Educational
Status
Urban Informal
Sector Employed
Urban Formal Sector
Employed Total
Educated Mothers
57
(15.28)
[31.32]
125
(62.81)
[68.68]
182
(31.82)
[100]
Uneducated Mothers
316
(84.72)
[81.03]
74
(37.19)
[18.97]
390
(68.18)
[100]
Total
373
(100)
[65.21]
199
(100)
[34.79]
572
(100)
[100]
Source: Survey by the author.
Note: Values in round brackets are percnetages of total columns, while the values in square brackets are
percentages of total rows.
Table 6.42 describes the distribution of female respondents in formal and informal
sector employment by the existence of mother‟s education. The data trend renders the
share of female participants of the informal sector whose mothers are educated is 15.28
%. Contrarily, those females whose mothers are uneducated are 81.03 percent involved in
the urban informal sector. Results found that the mother‟s education and female informal
sector employment is negatively related.
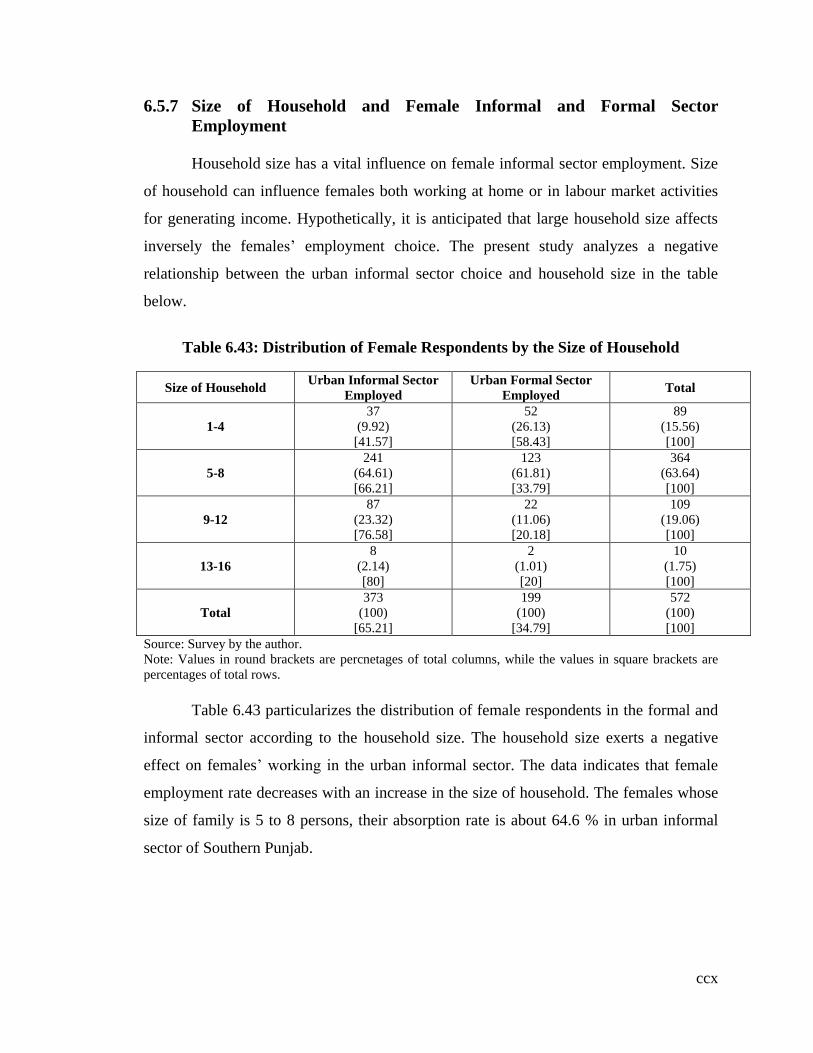
ccx
6.5.7 Size of Household and Female Informal and Formal Sector
Employment
Household size has a vital influence on female informal sector employment. Size
of household can influence females both working at home or in labour market activities
for generating income. Hypothetically, it is anticipated that large household size affects
inversely the females‟ employment choice. The present study analyzes a negative
relationship between the urban informal sector choice and household size in the table
below.
Table 6.43: Distribution of Female Respondents by the Size of Household
Size of Household Urban Informal Sector
Employed
Urban Formal Sector
Employed Total
1-4
37
(9.92)
[41.57]
52
(26.13)
[58.43]
89
(15.56)
[100]
5-8
241
(64.61)
[66.21]
123
(61.81)
[33.79]
364
(63.64)
[100]
9-12
87
(23.32)
[76.58]
22
(11.06)
[20.18]
109
(19.06)
[100]
13-16
8
(2.14)
[80]
2
(1.01)
[20]
10
(1.75)
[100]
Total
373
(100)
[65.21]
199
(100)
[34.79]
572
(100)
[100]
Source: Survey by the author.
Note: Values in round brackets are percnetages of total columns, while the values in square brackets are
percentages of total rows.
Table 6.43 particularizes the distribution of female respondents in the formal and
informal sector according to the household size. The household size exerts a negative
effect on females‟ working in the urban informal sector. The data indicates that female
employment rate decreases with an increase in the size of household. The females whose
size of family is 5 to 8 persons, their absorption rate is about 64.6 % in urban informal
sector of Southern Punjab.
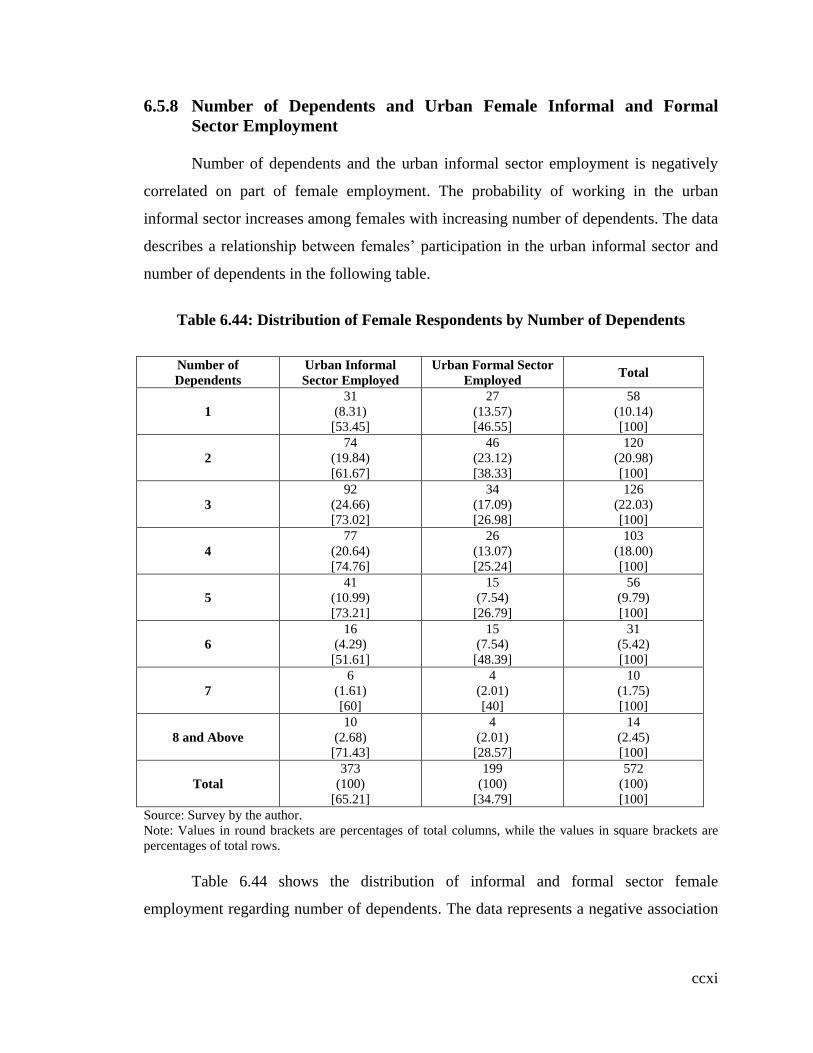
ccxi
6.5.8 Number of Dependents and Urban Female Informal and Formal
Sector Employment
Number of dependents and the urban informal sector employment is negatively
correlated on part of female employment. The probability of working in the urban
informal sector increases among females with increasing number of dependents. The data
describes a relationship between females‟ participation in the urban informal sector and
number of dependents in the following table.
Table 6.44: Distribution of Female Respondents by Number of Dependents
Number of
Dependents
Urban Informal
Sector Employed
Urban Formal Sector
Employed Total
1
31
(8.31)
[53.45]
27
(13.57)
[46.55]
58
(10.14)
[100]
2
74
(19.84)
[61.67]
46
(23.12)
[38.33]
120
(20.98)
[100]
3
92
(24.66)
[73.02]
34
(17.09)
[26.98]
126
(22.03)
[100]
4
77
(20.64)
[74.76]
26
(13.07)
[25.24]
103
(18.00)
[100]
5
41
(10.99)
[73.21]
15
(7.54)
[26.79]
56
(9.79)
[100]
6
16
(4.29)
[51.61]
15
(7.54)
[48.39]
31
(5.42)
[100]
7
6
(1.61)
[60]
4
(2.01)
[40]
10
(1.75)
[100]
8 and Above
10
(2.68)
[71.43]
4
(2.01)
[28.57]
14
(2.45)
[100]
Total
373
(100)
[65.21]
199
(100)
[34.79]
572
(100)
[100]
Source: Survey by the author.
Note: Values in round brackets are percentages of total columns, while the values in square brackets are
percentages of total rows.
Table 6.44 shows the distribution of informal and formal sector female
employment regarding number of dependents. The data represents a negative association
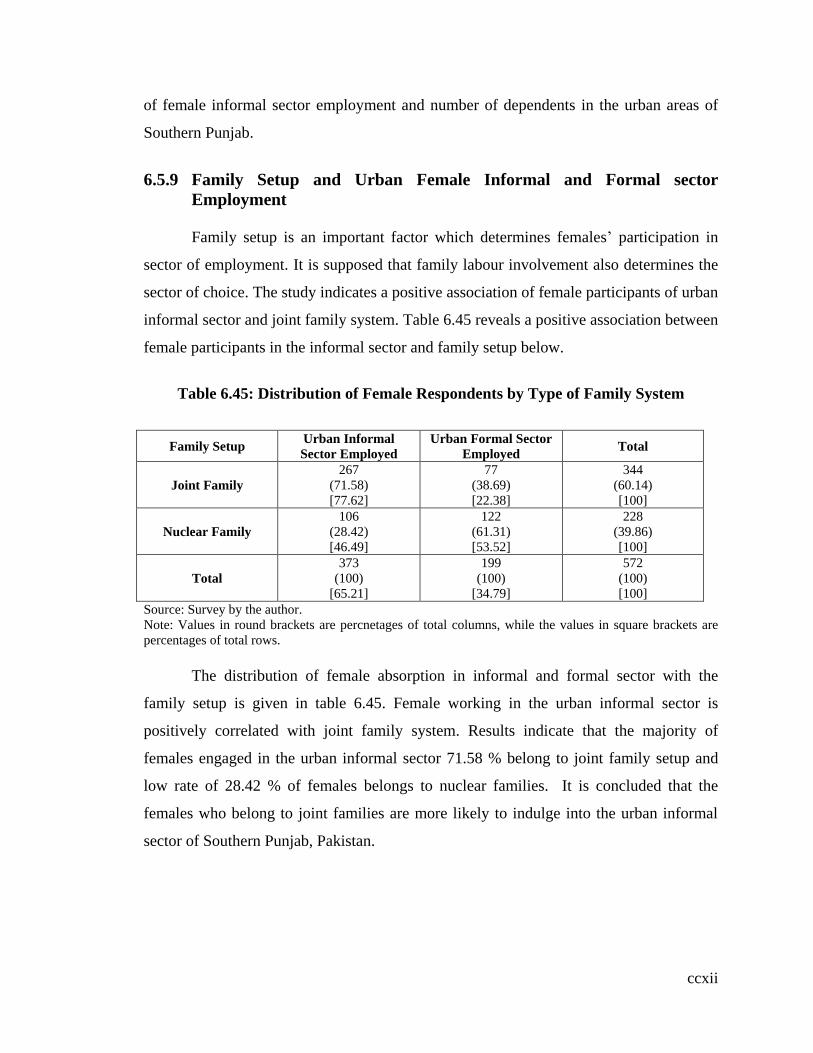
ccxii
of female informal sector employment and number of dependents in the urban areas of
Southern Punjab.
6.5.9 Family Setup and Urban Female Informal and Formal sector
Employment
Family setup is an important factor which determines females‟ participation in
sector of employment. It is supposed that family labour involvement also determines the
sector of choice. The study indicates a positive association of female participants of urban
informal sector and joint family system. Table 6.45 reveals a positive association between
female participants in the informal sector and family setup below.
Table 6.45: Distribution of Female Respondents by Type of Family System
Family Setup Urban Informal
Sector Employed
Urban Formal Sector
Employed Total
Joint Family
267
(71.58)
[77.62]
77
(38.69)
[22.38]
344
(60.14)
[100]
Nuclear Family
106
(28.42)
[46.49]
122
(61.31)
[53.52]
228
(39.86)
[100]
Total
373
(100)
[65.21]
199
(100)
[34.79]
572
(100)
[100]
Source: Survey by the author.
Note: Values in round brackets are percnetages of total columns, while the values in square brackets are
percentages of total rows.
The distribution of female absorption in informal and formal sector with the
family setup is given in table 6.45. Female working in the urban informal sector is
positively correlated with joint family system. Results indicate that the majority of
females engaged in the urban informal sector 71.58 % belong to joint family setup and
low rate of 28.42 % of females belongs to nuclear families. It is concluded that the
females who belong to joint families are more likely to indulge into the urban informal
sector of Southern Punjab, Pakistan.
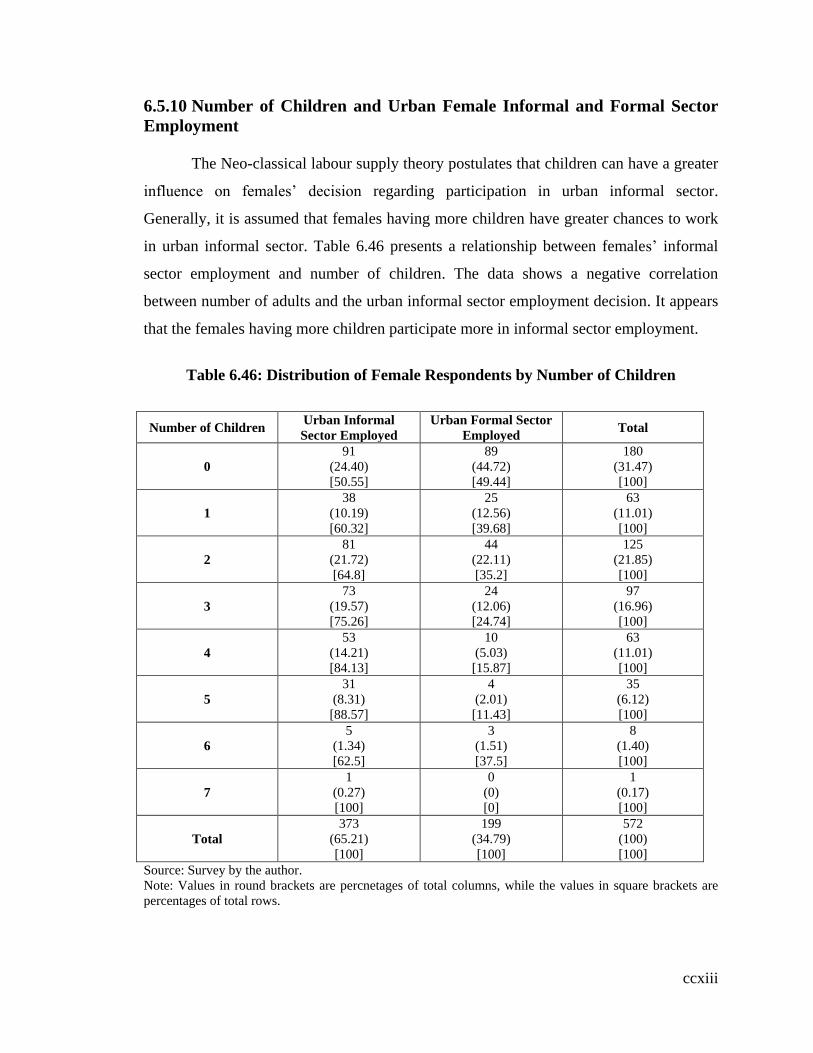
ccxiii
6.5.10 Number of Children and Urban Female Informal and Formal Sector
Employment
The Neo-classical labour supply theory postulates that children can have a greater
influence on females‟ decision regarding participation in urban informal sector.
Generally, it is assumed that females having more children have greater chances to work
in urban informal sector. Table 6.46 presents a relationship between females‟ informal
sector employment and number of children. The data shows a negative correlation
between number of adults and the urban informal sector employment decision. It appears
that the females having more children participate more in informal sector employment.
Table 6.46: Distribution of Female Respondents by Number of Children
Number of Children Urban Informal
Sector Employed
Urban Formal Sector
Employed Total
0
91
(24.40)
[50.55]
89
(44.72)
[49.44]
180
(31.47)
[100]
1
38
(10.19)
[60.32]
25
(12.56)
[39.68]
63
(11.01)
[100]
2
81
(21.72)
[64.8]
44
(22.11)
[35.2]
125
(21.85)
[100]
3
73
(19.57)
[75.26]
24
(12.06)
[24.74]
97
(16.96)
[100]
4
53
(14.21)
[84.13]
10
(5.03)
[15.87]
63
(11.01)
[100]
5
31
(8.31)
[88.57]
4
(2.01)
[11.43]
35
(6.12)
[100]
6
5
(1.34)
[62.5]
3
(1.51)
[37.5]
8
(1.40)
[100]
7
1
(0.27)
[100]
0
(0)
[0]
1
(0.17)
[100]
Total
373
(65.21)
[100]
199
(34.79)
[100]
572
(100)
[100]
Source: Survey by the author.
Note: Values in round brackets are percnetages of total columns, while the values in square brackets are
percentages of total rows.
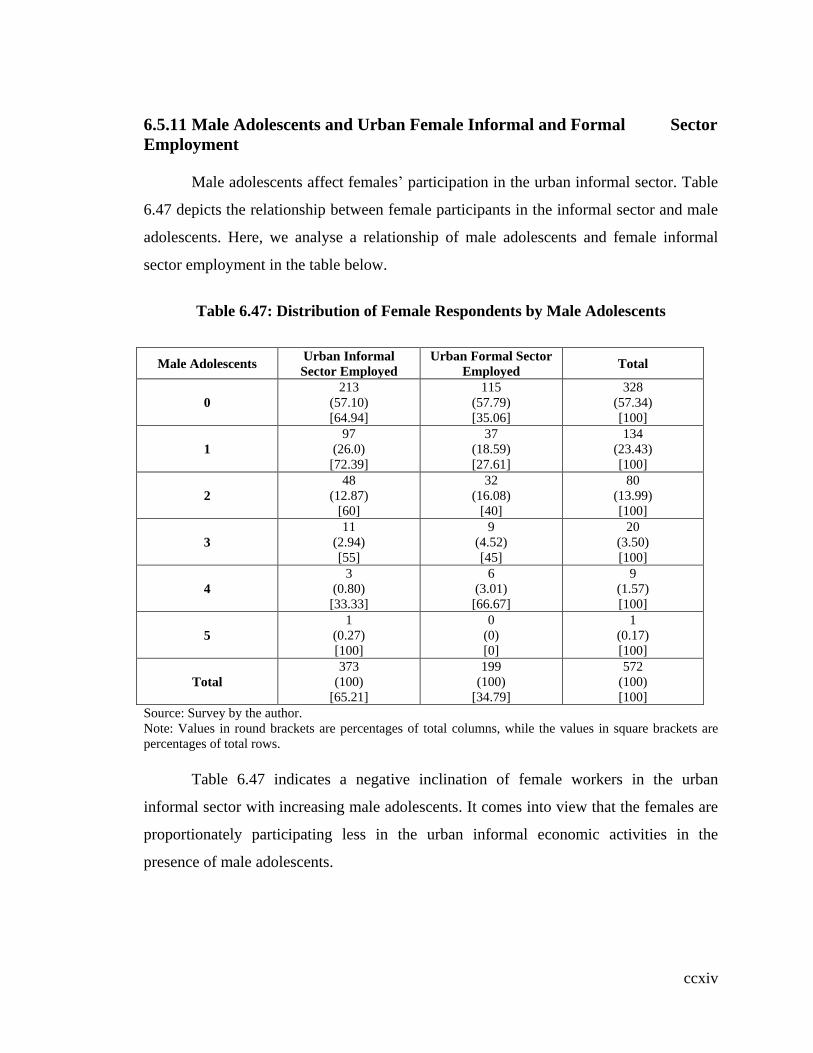
ccxiv
6.5.11 Male Adolescents and Urban Female Informal and Formal Sector
Employment
Male adolescents affect females‟ participation in the urban informal sector. Table
6.47 depicts the relationship between female participants in the informal sector and male
adolescents. Here, we analyse a relationship of male adolescents and female informal
sector employment in the table below.
Table 6.47: Distribution of Female Respondents by Male Adolescents
Male Adolescents Urban Informal
Sector Employed
Urban Formal Sector
Employed Total
0
213
(57.10)
[64.94]
115
(57.79)
[35.06]
328
(57.34)
[100]
1
97
(26.0)
[72.39]
37
(18.59)
[27.61]
134
(23.43)
[100]
2
48
(12.87)
[60]
32
(16.08)
[40]
80
(13.99)
[100]
3
11
(2.94)
[55]
9
(4.52)
[45]
20
(3.50)
[100]
4
3
(0.80)
[33.33]
6
(3.01)
[66.67]
9
(1.57)
[100]
5
1
(0.27)
[100]
0
(0)
[0]
1
(0.17)
[100]
Total
373
(100)
[65.21]
199
(100)
[34.79]
572
(100)
[100]
Source: Survey by the author.
Note: Values in round brackets are percentages of total columns, while the values in square brackets are
percentages of total rows.
Table 6.47 indicates a negative inclination of female workers in the urban
informal sector with increasing male adolescents. It comes into view that the females are
proportionately participating less in the urban informal economic activities in the
presence of male adolescents.

ccxv
6.5.12 Female Adolescents and Urban Female Informal and Formal Sector
Employment
It is put forward in labour supply theory that female adolescents affect females‟
decision in the urban informal sector. We setup a relationship between informal sector
involvement among female workers and female adolescents. Study presents a positive
correlation between female adolescents and urban informal sector employment decision
in Southern Punjab. It is clear from the table that female workers having more female
adolescents are more likely to involve in the urban informal sector to contribute in
household expenses.
Table 6.48: Distribution of Female Respondents by Female Adolescents
Female Adolescents Urban Informal
Sector Employed
Urban Formal Sector
Employed Total
0
145
(38.87)
[51.97]
134
(67.34)
[40.03]
279
(48.78)
[100]
1
68
(18.23)
[62.96]
40
(20.10)
[37.04]
108
(18.88)
[100]
2
110
(29.49)
[83.33]
22
(11.06)
[16.67]
132
(23.08)
[100]
3
43
(11.53)
[93.48]
3
(1.51)
[6.52]
46
(8.04)
[100]
4
6
(1.61)
[100]
0
(0)
[0]
6
(1.05)
[100]
5 and Above
1
(0.27)
[100]
0
(0)
[0]
1
(0.17)
[100]
Total
373
(100)
[65.73]
199
(1000
[34.79]
572
(100)
[100]
Source: Survey by the author.
Note: Values in round brackets are percentages of total columns, while the values in square brackets are
percentages of total rows.
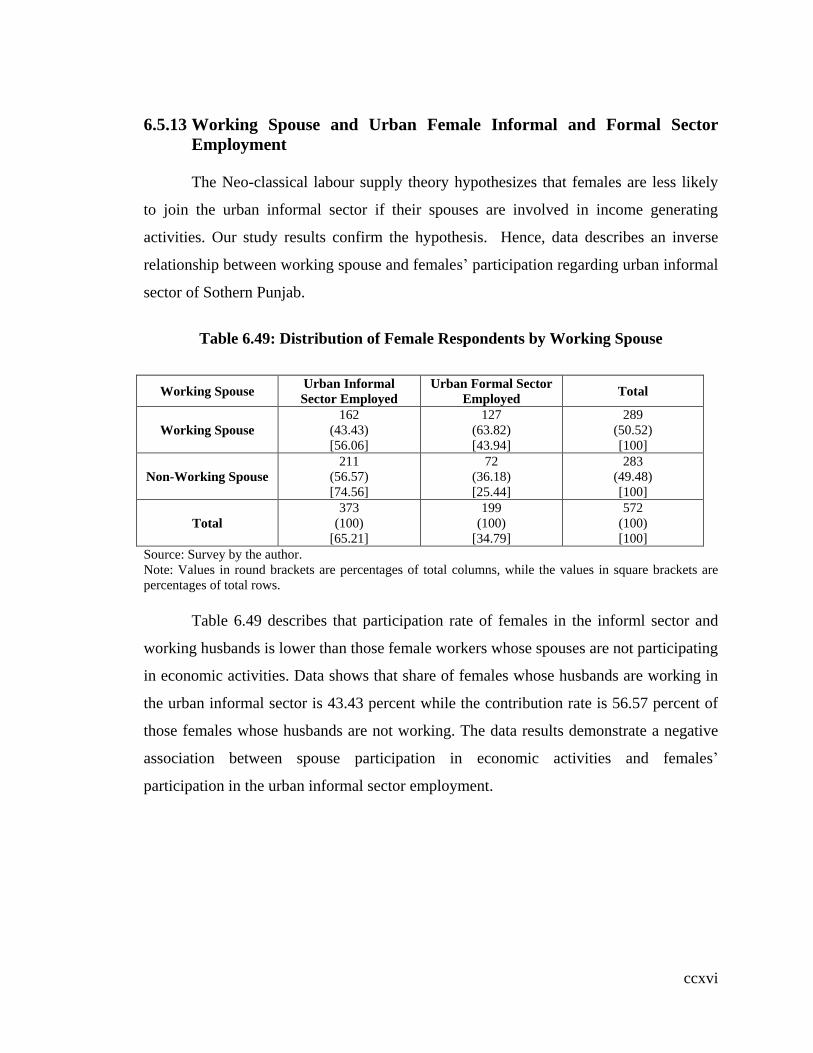
ccxvi
6.5.13 Working Spouse and Urban Female Informal and Formal Sector
Employment
The Neo-classical labour supply theory hypothesizes that females are less likely
to join the urban informal sector if their spouses are involved in income generating
activities. Our study results confirm the hypothesis. Hence, data describes an inverse
relationship between working spouse and females‟ participation regarding urban informal
sector of Sothern Punjab.
Table 6.49: Distribution of Female Respondents by Working Spouse
Working Spouse Urban Informal
Sector Employed
Urban Formal Sector
Employed Total
Working Spouse
162
(43.43)
[56.06]
127
(63.82)
[43.94]
289
(50.52)
[100]
Non-Working Spouse
211
(56.57)
[74.56]
72
(36.18)
[25.44]
283
(49.48)
[100]
Total
373
(100)
[65.21]
199
(100)
[34.79]
572
(100)
[100]
Source: Survey by the author.
Note: Values in round brackets are percentages of total columns, while the values in square brackets are
percentages of total rows.
Table 6.49 describes that participation rate of females in the informl sector and
working husbands is lower than those female workers whose spouses are not participating
in economic activities. Data shows that share of females whose husbands are working in
the urban informal sector is 43.43 percent while the contribution rate is 56.57 percent of
those females whose husbands are not working. The data results demonstrate a negative
association between spouse participation in economic activities and females‟
participation in the urban informal sector employment.
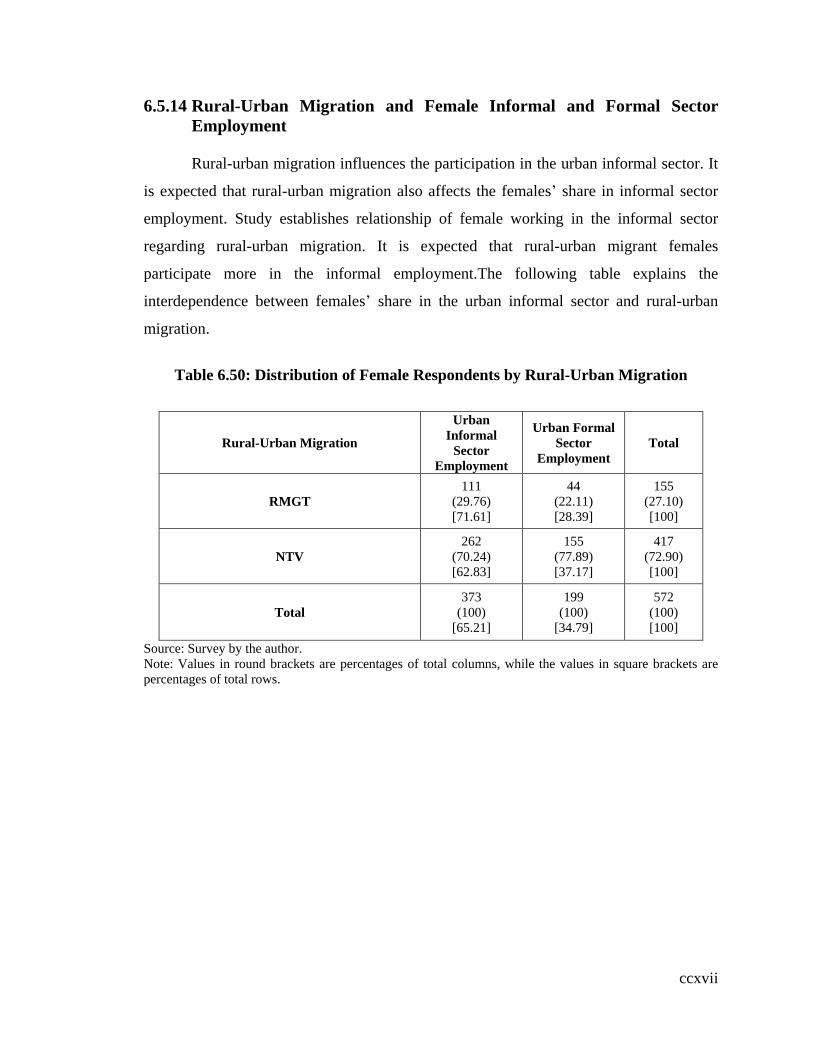
ccxvii
6.5.14 Rural-Urban Migration and Female Informal and Formal Sector
Employment
Rural-urban migration influences the participation in the urban informal sector. It
is expected that rural-urban migration also affects the females‟ share in informal sector
employment. Study establishes relationship of female working in the informal sector
regarding rural-urban migration. It is expected that rural-urban migrant females
participate more in the informal employment.The following table explains the
interdependence between females‟ share in the urban informal sector and rural-urban
migration.
Table 6.50: Distribution of Female Respondents by Rural-Urban Migration
Rural-Urban Migration
Urban
Informal
Sector
Employment
Urban Formal
Sector
Employment
Total
RMGT
111
(29.76)
[71.61]
44
(22.11)
[28.39]
155
(27.10)
[100]
NTV
262
(70.24)
[62.83]
155
(77.89)
[37.17]
417
(72.90)
[100]
Total
373
(100)
[65.21]
199
(100)
[34.79]
572
(100)
[100]
Source: Survey by the author.
Note: Values in round brackets are percentages of total columns, while the values in square brackets are
percentages of total rows.
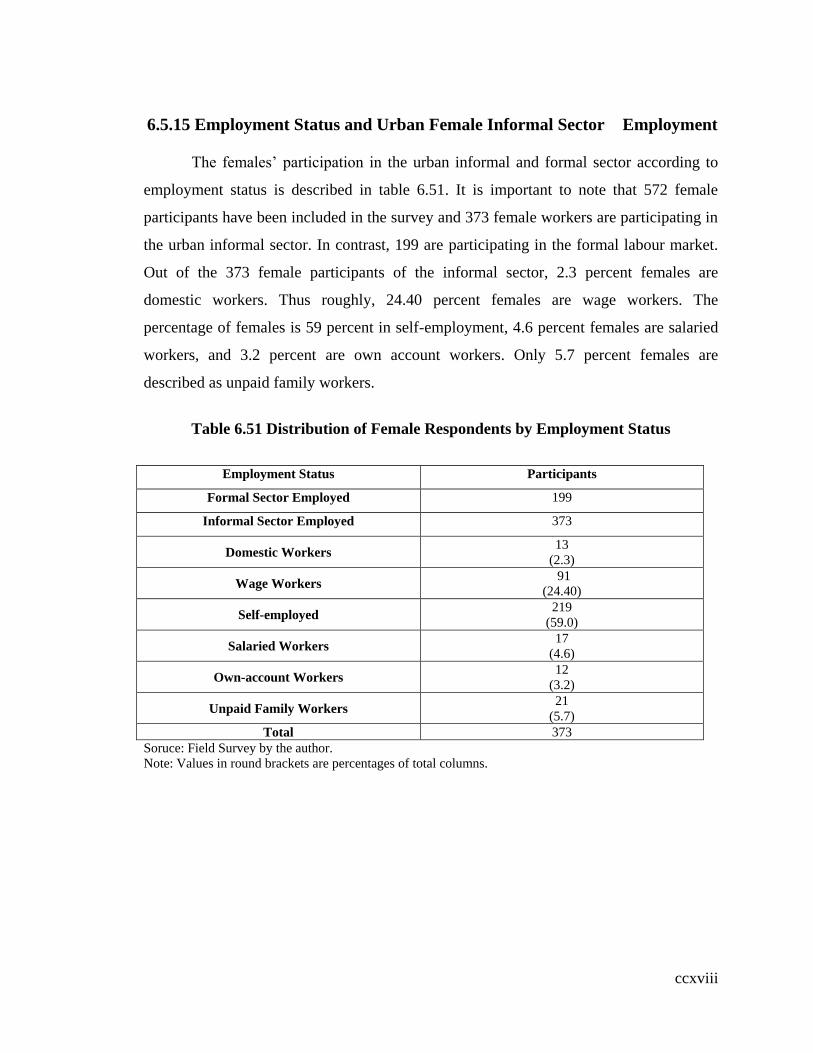
ccxviii
6.5.15 Employment Status and Urban Female Informal Sector Employment
The females‟ participation in the urban informal and formal sector according to
employment status is described in table 6.51. It is important to note that 572 female
participants have been included in the survey and 373 female workers are participating in
the urban informal sector. In contrast, 199 are participating in the formal labour market.
Out of the 373 female participants of the informal sector, 2.3 percent females are
domestic workers. Thus roughly, 24.40 percent females are wage workers. The
percentage of females is 59 percent in self-employment, 4.6 percent females are salaried
workers, and 3.2 percent are own account workers. Only 5.7 percent females are
described as unpaid family workers.
Table 6.51 Distribution of Female Respondents by Employment Status
Employment Status Participants
Formal Sector Employed 199
Informal Sector Employed 373
Domestic Workers 13
(2.3)
Wage Workers 91
(24.40)
Self-employed 219
(59.0)
Salaried Workers 17
(4.6)
Own-account Workers 12
(3.2)
Unpaid Family Workers 21
(5.7)
Total 373
Soruce: Field Survey by the author.
Note: Values in round brackets are percentages of total columns.
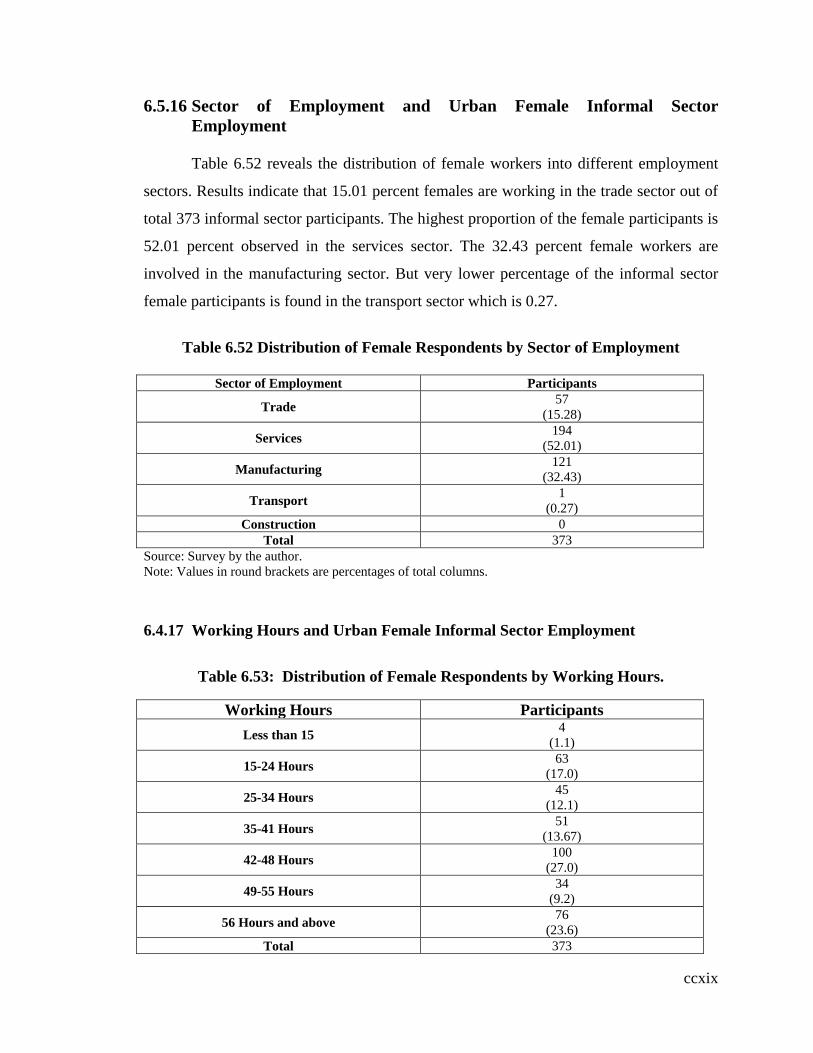
ccxix
6.5.16 Sector of Employment and Urban Female Informal Sector
Employment
Table 6.52 reveals the distribution of female workers into different employment
sectors. Results indicate that 15.01 percent females are working in the trade sector out of
total 373 informal sector participants. The highest proportion of the female participants is
52.01 percent observed in the services sector. The 32.43 percent female workers are
involved in the manufacturing sector. But very lower percentage of the informal sector
female participants is found in the transport sector which is 0.27.
Table 6.52 Distribution of Female Respondents by Sector of Employment
Sector of Employment Participants
Trade 57
(15.28)
Services 194
(52.01)
Manufacturing 121
(32.43)
Transport 1
(0.27)
Construction 0
Total 373
Source: Survey by the author.
Note: Values in round brackets are percentages of total columns.
6.4.17 Working Hours and Urban Female Informal Sector Employment
Table 6.53: Distribution of Female Respondents by Working Hours.
Working Hours Participants
Less than 15 4
(1.1)
15-24 Hours 63
(17.0)
25-34 Hours 45
(12.1)
35-41 Hours 51
(13.67)
42-48 Hours 100
(27.0)
49-55 Hours 34
(9.2)
56 Hours and above 76
(23.6)
Total 373
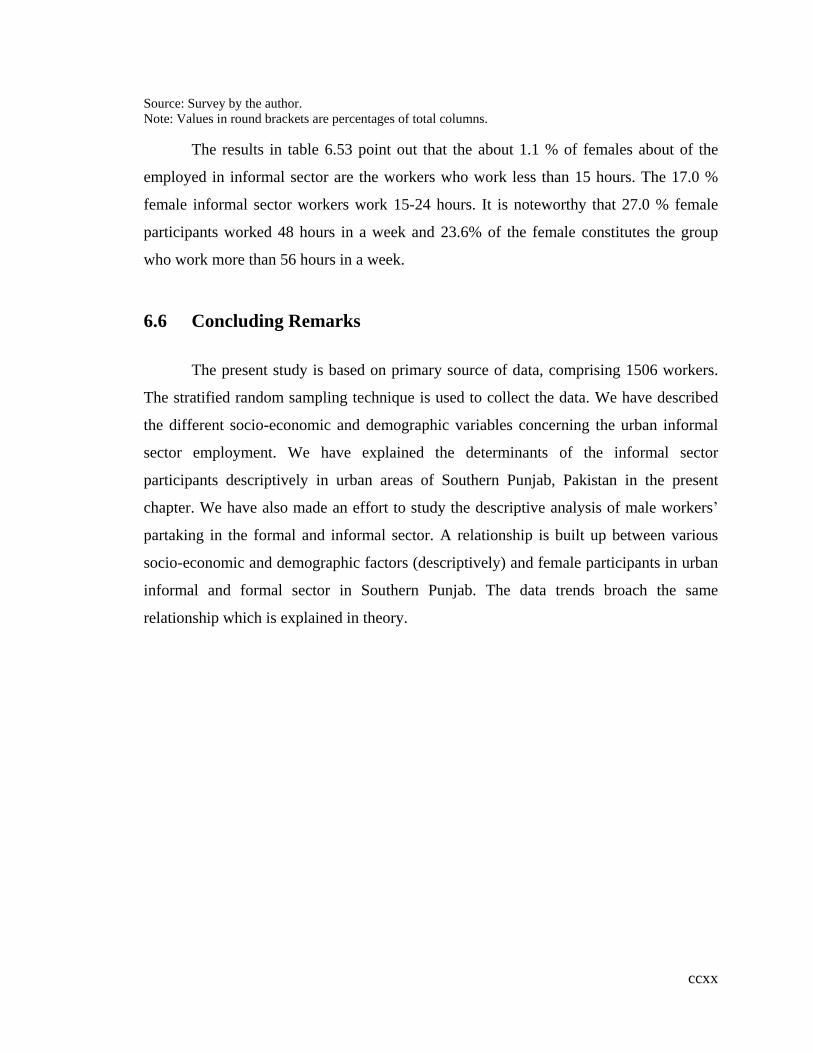
ccxx
Source: Survey by the author.
Note: Values in round brackets are percentages of total columns.
The results in table 6.53 point out that the about 1.1 % of females about of the
employed in informal sector are the workers who work less than 15 hours. The 17.0 %
female informal sector workers work 15-24 hours. It is noteworthy that 27.0 % female
participants worked 48 hours in a week and 23.6% of the female constitutes the group
who work more than 56 hours in a week.
6.6 Concluding Remarks
The present study is based on primary source of data, comprising 1506 workers.
The stratified random sampling technique is used to collect the data. We have described
the different socio-economic and demographic variables concerning the urban informal
sector employment. We have explained the determinants of the informal sector
participants descriptively in urban areas of Southern Punjab, Pakistan in the present
chapter. We have also made an effort to study the descriptive analysis of male workers‟
partaking in the formal and informal sector. A relationship is built up between various
socio-economic and demographic factors (descriptively) and female participants in urban
informal and formal sector in Southern Punjab. The data trends broach the same
relationship which is explained in theory.
ccxxi
Chapter 7
DETERMINANTS OF URBAN INFORMAL SECTOR
EMPLOYMENT: AN ANALYSIS
7.1 Introduction
The informal sector plays a pivotal role in employment creation, production and
income generation in the economy of Pakistan. This sector absorbs rapidly growing urban
labour force with high population growth and urbanization. The objectives of Pakistan
economy are economic growth, increase in per capita income, economic stability,
elimination of poverty and decreasing unemployment etc. Inspite of rapid growth of
GDP, it is requisite to enhance more adequate employment opportunities in order to
decrease unemployment and poverty which are the key challenges being faced by the
people. Moreover, there is a need for an allocation of resources towards the capital
intensive activities and adoption of highly capital intensive techniques which generate
relatively less employment opportunities.
We discuss the motives regarding decision to indulge into informal sector
particularly in the urban areas of Southern Punjab, Pakistan. The existing study is an
endeavour to highlight the socio-economic factors for determining the role of informal
sector for providing employment jobs, income growth and poverty reduction and
development in urban areas of Southern Punjab, Pakistan.
Particularly, the present chapter is arranged as followed. The econometric analysis
of the determinants of the urban informal sector employment in Southern Punjab is
explained in section 7.2 which takes into consideration total sample. We have also
analyzed the determinants of the urban informal sector employment in district
Bahawalpur in section 7.3. The determinants of the urban informal sector employment in
district Multan have also been explained in section 7.4. We also describe determinants of
the urban informal sector employment in district Dera Ghazi Khan in section 7.5. Finally,
we explain concluding remarks in the section 7.6.
ccxxii
7.2 Estimates of Binary Logit Model in Southern Punjab
We estimate binary logit models of determinants of the informal sector
employment in the urban areas of Southern Punjab, Pakistan. After that we have split the
sample into urban areas of three districts such as Bahawalpur, Multan and Dera Ghazi
Khan in order to see the impact of explanatory variables on the urban informal sector
employment with complete yet with different levels of education. We have made an
overall analysis of determinants of the urban informal sector employment in Southern
Punjab with complete years of education. We have also checked the influence of different
education levels on the urban informal sector employment in Southern Punjab.
Tables 7.1 and 7.2 present the binary logit estimates of urban informal sector
employment considering the total sample in Southern Punjab, Pakistan. Each table
contains four columns which illuminate explanatory variables, the estimated parameters,
their asymptotic z-statistic and marginal effects correspondingly. The intercept term in
the binary logit equation is positive and statistically significant. In many of the cases,
intercept term has no economic meaning or interpretation; it just highlights the average
effect of all other variables on explained variables that are omitted. Marginal effects show
the probability derivatives at the mean of independent variables. The probability
derivative indicates the change in probability due to one unit change in a given
explanatory variable after keeping all other variables as constant.
Two views can be presented about the age of workers involved in the informal
sector. Firstly, if the relative participation of young people is greater in the informal
sector, the very sector may probably be considered as a transition stage before opting
formal sector. Secondly, informal sector may be taken as a desirable constant choice if
there is a large participation ratio of older persons in the informal sector. Age is
considered an imperative factor which affects the workers‟ choice of participation in the
urban informal sector employment in Southern Punjab. In the binary logit models of the
urban informal sector employment, age in complete years is used as an explanatory
variable. The coefficient of complete years of age (AGY) is found to be positive and

ccxxiii
statistically significant. The probability of participation in the urban informal sector
increases by 0.4 percentage points respectively as a result of
one year increase in age of the worker. Results indicate that older people have a higher
likelihood of being engaged in the urban informal sector. It can be accounted for that the
workers are apt to work in the urban informal sector due to insufficiency of jobs in the
formal sector in Southern Punjab. Moreover, lack of higher education for govt jobs is one
of major reasons for relatively increased employment in the urban informal sector
because private sector employment is more operational than strategic level. The results
conclude that the urban informal sector absorbs people with increasing age in Southern
Punjab. Our results are similar to Funchouser‟s (1996) findings.
The probability of working in the urban informal sector employment diminishes
by about 3.7 percent points because of an increase in one year of education. Findings
demonstrate that education of the worker decreases the probability of being employed in
the urban informal sector. The negative marginal effect may indicate that participants
possessing higher education level do not commensurate in the urban informal sector in
Southern Punjab. Similar results are found in Funkhouser‟s (1996) findings.
Education is a critical input in economic development (Behrman, 1995).
Theoretically, education level of the participants in the labour market can play two
different roles. For instance, more educated workers tend to be more fertile as their
education serves as an impetus in enhancing their skill via training. On the other hand,
low education increases the probability of involvement in the informal sector. Education
of workers (EDY) is included as a categorical variable adding five categories (non-formal
education is taken as base category) in model II. Result reveals that the coefficient of
Middle level education is positive and statistically insignificant. Those who are working
in the urban informal sector encompassing initial formal education (EDU II) are unable to
find formal employment in Southern Punjab. The coefficient of Matric level education
(EDU III) is negative and statistically insignificant. The probability of being employed in
the informal sector of those with Matric level education (EDU III) is 1.7 percentage
points more than the excluded category. The coefficient of Intermediate level education
(EDU IV) has a negative sign. The probability of being employed in the informal sector

ccxxiv
of those with Graduation and Master‟s level education or higher is 23.6 and about 37
percentage points respectively less than the excluded category. Results conclude that
participants with high level of education in the labour market are less likely to join the
urban informal sector and are inclined to the formal sector. It also owes to that other
factors such as human capital and informal skills are not more essential for the urban
informal sector employment than such a high education level. Results conclude that level
of education and the informal sector employment are negatively associated in urban areas
of Southern Punjab. The findings are consistent as studies by Funkhouser (1996) and
Florez (2003).
Marital status (MRS) plays a pivotal role in determining work participation in the
urban informal sector. The coefficient of marital status (MRS) is positive and has
statistically insignificant influence on choice of participation in the urban informal sector
employment. Married persons are more likely to be employed in urban informal sector as
compared to single persons. It also owes to that generally married persons are household
heads and they are leaned to switch over the code from the informal to formal labour
market which is secure and lucrative source of livelihood. Moreover, formal sector can
not absorb the influx of people in urban areas of Southern Punjab, Pakistan. Ultimately, a
large number of participants with their low formal education are forced to opt for
relatively accessible informal sector employment. Furthermore, early marriages hinder
education and ultimately, they are forced to opt for relatively accessible urban informal
sector employment. The positive marginal effect in the informal sector may mean that
married persons easily find work in the informal sector with unfixed working hours
where it is more flexible to perform care and productive work.
The sex (SEX) is another significant factor which compels people to join the
labour market. The sex of the participants in the urban informal sector has significant
impacts on the informal employment in both logit models. The probability of indulging
into informal sector employment decreases by about 5.7 and 8.2 percentage points
respectively in result of one additional informal male worker. The argument is that male
participants‟ harldy accept the urban informal sector employment because it does not
commensurate with their level of human capital. Moreover, the level of jobs relates more
ccxxv
to less educated participants who are more available as female workers in Southern
Punjab. Findings are similar with Florez‟s (2003) study results.
The initial education level is considered as a poor indicator of the skills of the
informal sector worker. To acquire occupation-specific knowledge is important to
enhance productivity in the form of on the job training. Majority of the informal sector
workers has insufficiency with regard to formal training skills. The coefficient of formal
training (FTD) is significantly negative in both logit models. The probability of being
employed in the urban informal sector employment decreases by 23.1 and 24.4
percentage points respectively due to an increase of one unit in formal training. The
possible outcome of the fact is that formal training increases their efficiency. The
negative marginal effect shows that the participants hardly accept the informal sector
employment with formal training because it does not commensurate with their high
formal skills. Additionally, formal training is appropriate for the formal sector job. It is
concluded that informal sector does not require the formal training. The study results
conclude that the urban informal sector absorbs those participants having less formal
training.
One more crucial factor is the family background of workers in the urban
informal sector, particularly father‟s education and mother‟s education which influences
negatively the decision to work in the informal sector. Theoretically, it is hypothesized
that the workers are unlikely to join the urban informal sector whose parents are
educated. The study results corroborate the hypothesis in the urban informal sector of
Southern Punjab, Pakistan. Two dichotomous variables (i.e. educated father and educated
mother) are used to observe how the probability of the urban informal sector employment
is influenced by these variables. The coefficients of variables father‟s education (FEDU)
and mother‟s education (MEDU) are negative and highly significant. The probability of
being employed in the urban informal sector decreases by 14.9 and 15.6 percentage
points respectively due to one unit increase in father‟s education (FEDU). The probability
of workers being involved in the informal sector decreses by 20.1 and about 20.4
percentage points respectively due to one unit increase in mothers‟ education. The
economic cause of this inverse relationship is that educated parents can afford higher
ccxxvi
educational facilities to their children which result in the development of formal labour
market of Southern Punjab. There is a negative association between parents‟ education
and employment in the urban informal sector. The results conclude that the participants
whose parents are uneducated are more likely to be employed in the urban informal
sector of Southern Punjab.
In addition, size of the household (HSIZ) is, in general, taken into account as an
indicator of dependents on the head of household and it also exerts an effect on
employment in urban labour market. Theoretically, two varying hypotheses can be
formulated regarding the effect of household size on the informal sector involvement.
Firstly, it signifies the promotion of informal sector due to manifold increase in labour
supply. Secondly, the motive of making the family financially sound compels the head of
large household to opt for informal sector. Household size is found to be positively
influencing people for their involvement in the informal sector employment. The results
highlight that coefficients of (HSIZ) are positive and have significant effect on the
informal sector employment models. When the household size increases by one, the
participants are more likely to be included in the urban informal sector by about 2.9 and
3.1 percentage points respectively in Southern Punjab. For certain reason a family head
has to work more to earn more to support a large family. The study concludes that there is
a positive association between household size and the urban informal sector of Southern
Punjab. The large household size motivates people for the informal sector employment
for their better livelihood.
Labour supply theory postulates that the family labour supply decisions are
interdependent. The coefficient of dependency ratio (DPNR) is positive and has
statistically significant effects. The probability of participation in the urban informal
sector employment increases by 12.3 and 12.2 percentage points respectively due to one
unit increase in dependency ratio. This can also be reason that most of the time, family
head (himself/herself) assumes the responsibility to support his/her family. In other cases,
family members motivate or force him/her to participate in the informal economic
activities. The results conclude that growth of the urban informal sector of Southern
Punjab increases with an increase in dependency ratio.

ccxxvii
It is expected that workers having joint family systems join urban informal labour
market to make the family financially sound. Results found that the family setup (FSP)
exerts a positive and significant influence on the urban informal sector employment.
Workers living in joint family setup are about 11.1 and 11.7 percentage points more
likely to be employed in the informal sector. The possible reason exists that majority of
the family members lack quality skill or higher education due to financial pressures, so
they have more inclination towards the urban informal sector. The urban informal sector
employment enhances joint family participation because of the financial attraction that it
renders to them. The results conclude that urban informal sector increases with joint
family setup in Southern Punjab.
Number of Children (NCHL) also affects the decision regarding choice of sector
of employment. So, there is a positive relationship between presence of adult children
and the informal sector employment in both logit models. Findings demonstrate that an
addition of one child decreases the probability of workers being employed in the informal
sector by 2.4 and about 2.1 percentage points respectively as compared to formal sector
employment. The fact is that hoseholds pay compartively lessened care to adult family
members and to household responsibilities. Our results are supported by Funkhouser‟s
(1996) study results.
The next variable is about having male adolescents (NMAD). The probability of
workers being employed in the urban informal sector employment decreases by 7.9 and
about 8.5 percentage points respectively due to an addition of one male adolescent at
home. The coefficient indicates negative and significant influences. Theoretically, it is
argued that those households who have male adolescents don‟t get involved into urban
informal employment because their family labour supply decisions are interdependent.
Male adolescents can affect worker‟s decisions regarding participation in the urban
informal sector because some male adolescents have the chances to earn. It is also argued
that strong substitution effect of better-paid labour time for that of male adolescent
induces workers to have less participation in the urban informal sector. In this society,
parents think that it is time to reap the benefits of the toil they did for their children.
Moreover, working adolescents force parents to stop working any more in old age and the
ccxxviii
parents are too old to work for livelihood. Results conclude that presence of male
adolescents reduces the probability of workers for being employed in the urban informal
sector of Southern Punjab.
Analysis indicates that the coefficients of the variable female adolescents (NFAD)
are positive and statistically significant in logit models. An addition of one female
adolescent in family increases the probability of worker‟s participation in the urban
informal sector about 9.5 and 9 percentage points respectively as compared to formal
sector. Households having female adolescents are more inclined to the urban informal
sector because family labour supply decisions are interdependent. The positive marginal
effect may indicate that female adolescents heve less likelihood in economic activities
due to some social and religious constraints and household heads participate more in
economic activities in informal labour market where jobs are more open according to
their skills to fulfill their female adolescents necessities. Having more female adolscents
is yet another determinant which influences the parents‟ inclusion in the urban informal
sector employment. Same results are found in Funkhouser‟s (1996) findings.
The Neo-classical labour supply theory postulates that the family labour supply
decisions are interdependent. There is a negative association between informal sector
employment and spouse‟s participation in economic activities. The coefficient of spouse
participation (SPN) in economic activities is negative and highly significant at 1 percent
level of significance. Due to one unit increase in spouse participation in economic
activities diminishes the probability of the informal sector workers by 12.5 percentage
points as compared to the formal sector workers. The participants, whose counterparts
indulge in income generating activities, are less likely to partake in the urban informal
sector in Southern Punjab. The possible outcome of the fact is that spouses of the
participants in labour market are self-contented and strong substitution effect (of leisure
and not to work) dissuades them not to work in the urban informal sector anymore. In this
way the partners of the working spouses are reluctant to work anymore. It is concluded
that higher the spouse participation in economic activities, the lower the absorption in the
urban informal sector of Southern Punjab.
ccxxix
Theoretically, it is expected that value of assets makes workers more affluent and
economically stable all the way through the un-earned income. Findings indicate that the
coefficients of the value of household‟s assets (HVAT) are negative and highly
significant. It is argued that strong substitution effect of unearned income forces the
participants to stop working and they do so due to increase in the value of financial
assets. Another argument may be that some families having enough financial resources
temporarily stop working to enjoy the benefits of those extra pennies. Illiteracy may be
one of the factors for not investing those extra financial resources inside business (in
portfolio or otherwise) to have a back-up plan against rainy days.
Rural-urban migration plays a decisive role in determining the employment
decision in urban labour market. It is argued that urban informal sector provides more
earnings opportunities to both the rural-urban migrants and urban dwellers. Study results
highlight a positive association between informal sector employment and rural-urban
migration. The rural-urban migration has a large impact on the probability of being
employed in the urban informal sector as presented in dualistic approach for informality.
The probability of being employed in the urban informal sector increases by about 12.7
and 12 percentage points respectively because of one additional rural-urban migrant
worker in the urban areas of Southern Punjab. These results of the study conclude that
urban informal sector of Southern Punjab creates more employment opportunities to the
rural-urban migrants who with low formal education can not find job in the formal sector.
The urge of employment in the urban informal sector is high due to influx of rural-urban
migrants who come to earn high wages or incomes and low jobs in the formal sector in
urban areas of southern Punjab, Pakistan.
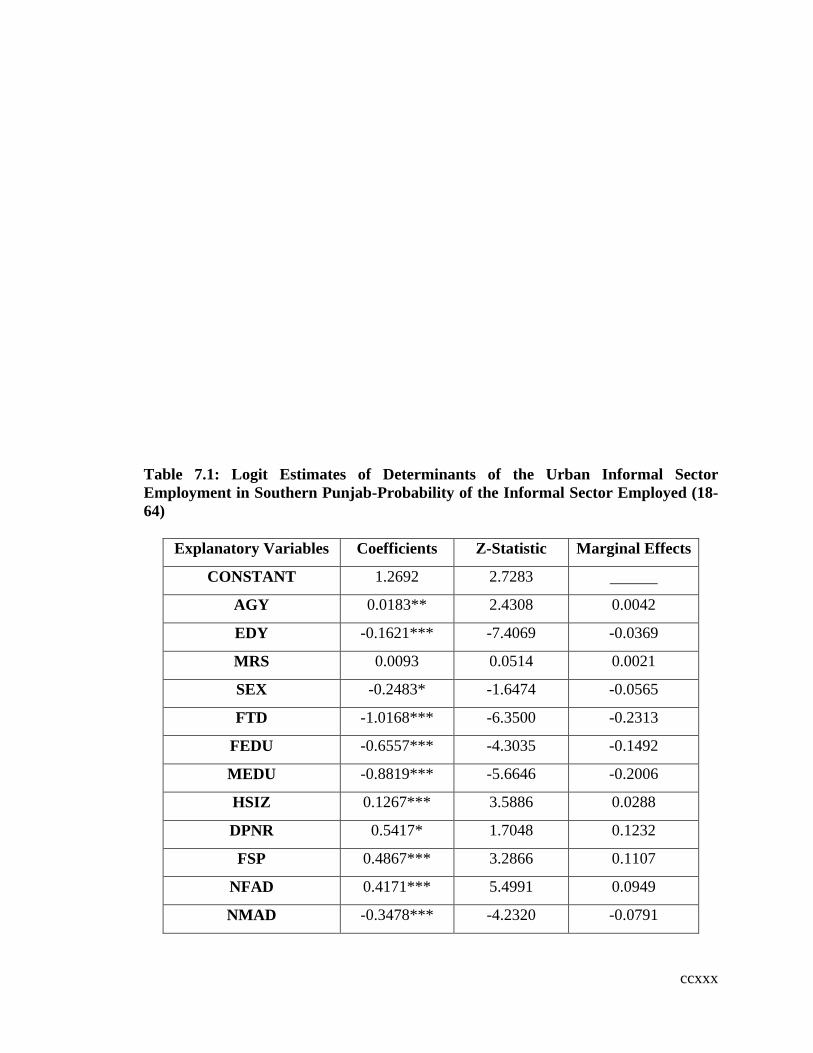
ccxxx
Table 7.1: Logit Estimates of Determinants of the Urban Informal Sector
Employment in Southern Punjab-Probability of the Informal Sector Employed (18-
64)
Explanatory Variables Coefficients Z-Statistic Marginal Effects
CONSTANT 1.2692 2.7283
AGY 0.0183** 2.4308 0.0042
EDY -0.1621*** -7.4069 -0.0369
MRS 0.0093 0.0514 0.0021
SEX -0.2483* -1.6474 -0.0565
FTD -1.0168*** -6.3500 -0.2313
FEDU -0.6557*** -4.3035 -0.1492
MEDU -0.8819*** -5.6646 -0.2006
HSIZ 0.1267*** 3.5886 0.0288
DPNR 0.5417* 1.7048 0.1232
FSP 0.4867*** 3.2866 0.1107
NFAD 0.4171*** 5.4991 0.0949
NMAD -0.3478*** -4.2320 -0.0791
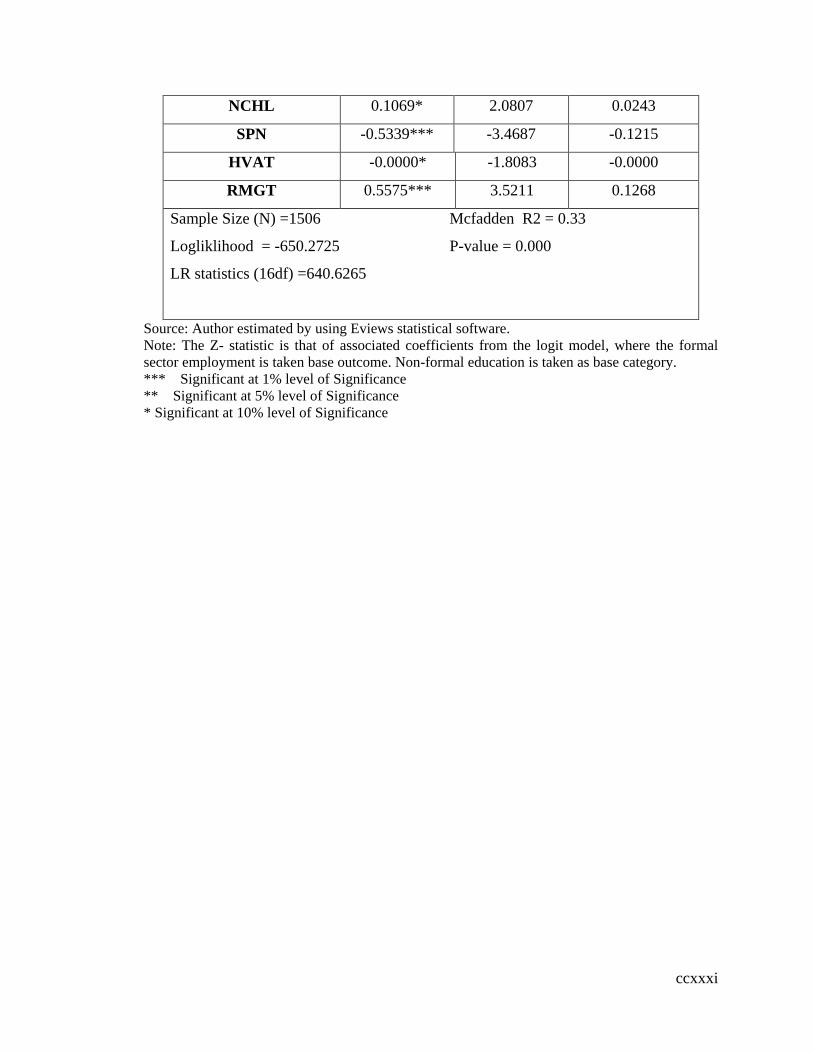
ccxxxi
NCHL 0.1069* 2.0807 0.0243
SPN -0.5339*** -3.4687 -0.1215
HVAT -0.0000* -1.8083 -0.0000
RMGT 0.5575*** 3.5211 0.1268
Sample Size (N) =1506 Mcfadden R2 = 0.33
Logliklihood = -650.2725 P-value = 0.000
LR statistics (16df) =640.6265
Source: Author estimated by using Eviews statistical software.
Note: The Z- statistic is that of associated coefficients from the logit model, where the formal
sector employment is taken base outcome. Non-formal education is taken as base category.
*** Significant at 1% level of Significance
** Significant at 5% level of Significance
* Significant at 10% level of Significance

ccxxxii
Table 7.2: Logit Estimates of Determinants of the Urban Informal Sector
Employment in Southern Punjab with Different Levels of Education-Probability of
the Informal Sector Employed (18-64)
Explanatory Variables Coefficients Z-Statistics Marginal Effects
CONSTANT -0.0402 -0.0897
AGY 0.0188** 2.4571 0.0043
EDU II 0.7718** 2.4415 0.1756
EDU III -0.0761 -0.3037 -0.0173
EDU IV -0.4552* -1.7002 -0.1036
EDU V -1.0376*** -3.8059 0.2361
EDU VI -1.6246*** -5.6148 -0.3696
MRS 0.0364 0.1944 0.0083
SEX -0.3614** -2.3239 -0.0822
FTD -1.0747*** -6.5494 -0.2445
FEDU -0.6854*** -4.4085 -0.1559
MEDU -0.8957*** -5.6399 -0.2038
HSIZ 0.1372*** 3.8037 0.0312
DPNR 0.5376* 1.6486 0.1223
FSP 0.5125*** 3.4057 0.1166
NFAD 0.3959*** 5.1346 0.0901
NMAD -0.3717*** -4.4608 -0.0846
NCHL 0.0902* 1.7165 0.0205
SPN -0.5510*** -3.5156 -0.1254
HVAT -0.0000* -1.7298 -0.0000
RMGT 0.5280*** 3.2628 0.1201
Sample Size (N) =1506 Mcfadden R2= 0.35
Log Likelihood = -634.2498 LR statistics (20df) = 672.6718
P-value =0.000
Source: Auther estimated by using Eviews statistical software.
Note: The Z- statistic is that of associated coefficients from the logit model, where the formal sector
eployment is taken as base outcome. Non-formal education is taken as the base category.
*** Significant at 1% level of Significance
** Significant at 5% level of Significance

ccxxxiii
* Significant at 10% level of Significance
7.3 Estimates of Binary Logit Model in Bahawalpur District
Firstly, we have made an overall analysis of determinants of the urban informal
sector employment with complete years of education in district Bahawalpur.
Furthermore, the influence of different levels of education on the urban informal sector
employment is analyzed in district Bahawalpur.
The binary logit estimates of the informal sector employment in district
Bahawalpur are presented in the tables 7.3 and 7.4. The intercept terms in both of the
tables indicate positive sign and are insignificant. The explanatory variables, the
estimated parameters, their asymptotic z-statistic and marginal effects are demonstrated
in each table respectively. The insignificant impact of the intercept term on the urban
informal sector employment decision describes that the explanatory variables existing in
the model are adequate to determine the informal sector employment. The marginal
effects imply the change in the urban informal sector employment for a unit change in the
formal sector employment.
Age of workers motivates them to participate in the informal sector. In this way, it
is important for their choice of employment sector. Two views can be presented about
age of participants in the informal sector. Firstly, if the relative sharing of young people
is greater in the informal sector, the very sector may be considered a transition stage
before opting formal sector. Secondly, informal sector may be considered as a desirable
constant choice if there is a large involvement ratio of older persons in the informal
sector (see Kemal and Mehmood, 1993).
We have included this explanatory variable in complete years. The results indicate
that age exerts a positive and statistically significant effect on the probability of being
employed in the urban informal sector (about 0.1 and 0.1 %) percentage points
respectively which is cause of an increase in one year age of worker. The reason is that
formal sector cannot absorb all the persons with their low formal education. Generally,
ccxxxiv
participants with their low human capital take this sector as permanent activity and
engage themselves in this informal sector in their old age. It is concluded that mature
people with their initial basic education are more likely to pursuade an accessible
informal sector employment which best suits their skills. So, the urban informal sector is
a permanent source of earnings not the temporary or refuge for the unemployed or
underemployed in district Bahawalpur. Our results are similar to Funkhouser‟s (1996)
findings.
Education is an essential factor in determining the sector of employment. In the
logit model I, education steadily reduces the probability of the urban informal sector
employment in district Bahawalpur. The study has included complete years of education
(EDY) as an explanatory variable. The coefficient of the complete years of education
(EDY) is found to be negative and highly significant. The probability of inclination in the
informal sector diminishes by about 3.1 percentage points due to an increase in one year
of education of the worker. The results highlight that highly educated people are less
likely to contribute in the urban informal sector employment because it is not appropriate
with their high human capital. This result coincides with the facts and findings from other
studies such as Funkhouser (1996) and Florez (2003) in relation to education.
Education level of the participants in the labour market can play two different
roles: For instance, more educated workers tend to be more fertile as their education
serves as an impetus to enhance their skill via training. On the other hand, low education
increases the probability of involvement in the informal sector. Education reduces the
probability of participation in the urban informal sector of district Bahawalpur.
Participants‟ level of education is also incorporated as a categorical variable through five
categories (considering non-formal education as reference category). In relation to effect
of education on the urban informal sector employment, the co-efficient of Middle level
(EDU II) education is observed to be positive and has significant impact on work
participation in the urban informal sector. Results indicate that participants with low
formal education are incapable to get formal sector job. The coefficients of Matric level
education (EDU III), Intermediate (EDU IV) level education and Graduation level

ccxxxv
education (EDU V) have insignificant positive effect on probability of being included in
the urban informal sector. The coefficient of Master‟s level education or higher (EDU VI)
is found to be negative and has significant effect. The Graduation (EDU V) and Master‟s
or high level education (EDU VI) exert a zero effect, while both the levels of education
are unimportant for the informal sector employment. The result coincides with the
evidence from studies by Florez (2003) in relation to level of education. The economic
interpretation of this negative influence of higher education on the informal sector
employment may be that the workers with higher education invoke to more formal sector
employment. The results in relation to education reflect the classical theory of production
and have close similarity with law of diminishing returns. It means that when the level of
education increases, the marginal urban informal sector employment gets down.
Generally, marital status (MRS) affects participation decision in sector of
employment. The present study found a positive and statistically insignificant
relationship of urban informal sector employment and marital status. The possible reason
can be that, by and large, less educated couple is inclined to join the urban formal sector
employment which is nearby for their survival in this society or to fulfill requirements.
The sex (SEX) is an added important factor which determines the participation in
labour market. The sex of workers has negative and significant impacts on probabilities
of being employed in urban informal sector. The probability of being inducted in the
urban informal sector decreases by about 11.6 and 12.11 percentage points respectively
because of an increase of one additional male worker. Male workers hardly engage
themselves in the urban informal sector because of the informal work commensuration
with their level of education. So, the male workers are switching out from the informal
sector and moving towards the formal sector which is an important and lucrative source
of earning. In addition, the level of jobs more relates to less educated participants who are
more available as female workers in district Bahawalpur. Findings are consistent with
Florez‟s (2003) results.
It is expected that persons take part in the informal sector whose formal skill level
(FTD) is low. The findings indicate a negative relationship between formal training and

ccxxxvi
probability of the informal sector employment. The coefficient of formal training
signifies a negative and highly significant impact on workers‟ inclusion in informal sector
of district Bahawalpur. The individuals with 21.8 and about 23 percentage points are less
likely to be employed in the urban informal sector as compared to those in the formal
sector. This observable fact owes to higher earnings in the formal labour market as
formal skill enhances the efficiency to utilize the skills and provides opportunities to
work in a better way. Moreover, according to dualistic labour market approach, the
informal sector doesn‟t require high skills.
Parents‟education helps in determining the growth potential of informal labour
market. Findings indicate that the workers are less likely to participate in the informal
sector whose parents are literate. The coefficients of (FEDU) are negative and
statistically significant. The probability of being employed in the urban informal sector
decreases by 16.5 and 16.8 percentage points respectively due to an increase of one unit
in the (FEDU). The probability of being employed in the urban informal sector falls by
about 18.6 and 18.4 percentage points due to an increase of one unit in (MEDU)
respectively. It can be justified that the educated parents guide their children in attaining
higher education and better career counseling to move towards appropriate, secure and
well-paid formal labour market for better utilization of their skills. Hence, possibility of
joining the urban informal sector has increased in district Bahawalpur.
Theoretically, two varying hypotheses can be formulated regarding the effect of
household size on the informal sector involvement. Firstly, it signifies the promotion of
the informal sector due to manifold increase in labour supply. Secondly, the motive of
making the family financially sound compels the head of large household to opt informal
sector. It has been recognized that household size is found to be positively influencing
people to invoke into urban informal sector. The coefficient of (HSIZ) is found to be
positive and statistically significant. When the family size increases by one, workers are
by 5.8 and about 5.7 percentage points respectively more likely to be employed in the
informal sector as compared to the formal sector employment. The economic rationale of
this positive trend is that household heads with their low human capabilities in result of
financial pressure are leaned to work in urban informal sector.

ccxxxvii
Labour supply theory indicates that the family labour supply decisions are
mutually dependent. The coefficients of dependency ratio (DPNR) are positive and
statistically insignificant. The results conclude that persons having more dependents
being employed more into the formal sector in order to support the household increasing
expenditures.
Influence of joint family structure (FSP) on participation decision can not be
neglected. It is noted that urge to work is low in the joint family system because of strong
substitution effect of leisure. Whereas, in the present study, the case is reverse because of
family labour involvement in the informal setup. The study results show that the joint
family setup has positive and significant impact on the probability of being employed in
the urban informal sector. The probability of being employed in urban informal sector
increases by about 12.3 and 13.6 percentage points respectively due to one unit increase
in joint family set up. Approximately family members with lack of quality education opt
to work in the urban informal sector in order to make the family financially sound.
Participants in the labour market also consider the number of children in their
decisions. Theoretically, persons having children up to 9 to 14 years of age join the
urban informal sector. Findings bring to light that the number of children (NCHL) has
positive and insignificant impacts on the urban informal sector employment in both
tables.
The presence of male adolescents (NMAD) has an effect on working participants
in urban labour market. The coefficients of number of adolescents are found to be
significantly negative. The probability of finding urban informal sector employment
dwindles by 13.7 and 13.5 percentage points respectively due to an addition of one male
adolescent at home. Some male adolescents have chances to earn in formal or informal
sector. Hence, this strong substitution effect of better-paid labour time for that of male
adolescents stimulates workers to have a less eagerness in urban informal sector. There
are similar results found with Funkhouser‟s (1996) findings.

ccxxxviii
In labour supply theory, it is argued that households having female adolescents
(NFAD) have a preference to work in the informal activity due to interdependence of
family members‟ decisions. Findings highlight that the coefficients of female adolescents
are positive and significant. The probability of working in the informal sector increases
by 12.9 and about 12.5 percentage points due to an increase of one additional female
adolescent in the family. The female adolscents have low enthusiasm to work due to
social and religious constraints. As a result, parents have to fulfill female adolescents‟
requirements. This phenomenon encourages the parents to join the urban informal sector
in district Bahawalpur. Our findings are consistent with Funkhouser‟s (1996) results.
Hypothetically, the spouse participation in economic activities (SPN) is
negatively related with the choice of work in the labour market. Hence, it reduces the
probability of finding work in the urban informal sector. The coefficients bring to bear
negative and significant effect on informal sector eployment. It also owes to the strong
substitution effect of not to work and prefer leisure. Generally, the spouses of the
participants in the urban informal sector allocate more time to leisure in district
Bahawalpur.
An increase in the value of assets has an enlarge effect on the sector of
employment choice. It is argued that people prefer leisure and stop working on an
increase in value of financial assets. Findings indicate that the coefficients of the
household value of assets (HVAT) are negative and highly significant at 1 percent level
of significance. The probability of the urban informal sector decreases with an increase in
(HVAT). The strong substitution effect is greater than the low income effect. In this way,
participants are reluctant to work or invest more in the urban informal sector in district
Bahawalpur.
The rural-urban migration is one more significant variable that has a large impact
on the probability of being employed in the urban informal sector. The probability of
workers‟ participation increases by about 14.2 and 13.8 percentage points respectively
due to one additional rural-urban migrant worker. These results of the study indicate that
the probability of insertion in the informal sector is high in urban areas where surplus
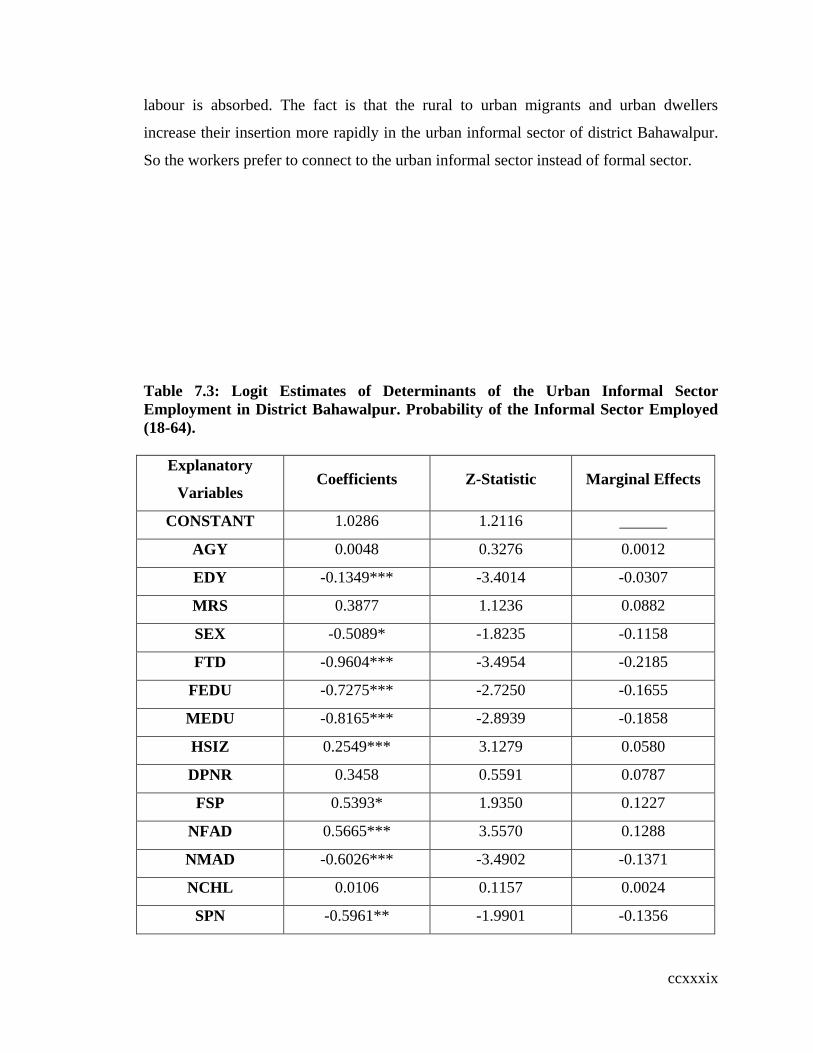
ccxxxix
labour is absorbed. The fact is that the rural to urban migrants and urban dwellers
increase their insertion more rapidly in the urban informal sector of district Bahawalpur.
So the workers prefer to connect to the urban informal sector instead of formal sector.
Table 7.3: Logit Estimates of Determinants of the Urban Informal Sector
Employment in District Bahawalpur. Probability of the Informal Sector Employed
(18-64).
Explanatory
Variables Coefficients Z-Statistic Marginal Effects
CONSTANT 1.0286 1.2116
AGY 0.0048 0.3276 0.0012
EDY -0.1349*** -3.4014 -0.0307
MRS 0.3877 1.1236 0.0882
SEX -0.5089* -1.8235 -0.1158
FTD -0.9604*** -3.4954 -0.2185
FEDU -0.7275*** -2.7250 -0.1655
MEDU -0.8165*** -2.8939 -0.1858
HSIZ 0.2549*** 3.1279 0.0580
DPNR 0.3458 0.5591 0.0787
FSP 0.5393* 1.9350 0.1227
NFAD 0.5665*** 3.5570 0.1288
NMAD -0.6026*** -3.4902 -0.1371
NCHL 0.0106 0.1157 0.0024
SPN -0.5961** -1.9901 -0.1356
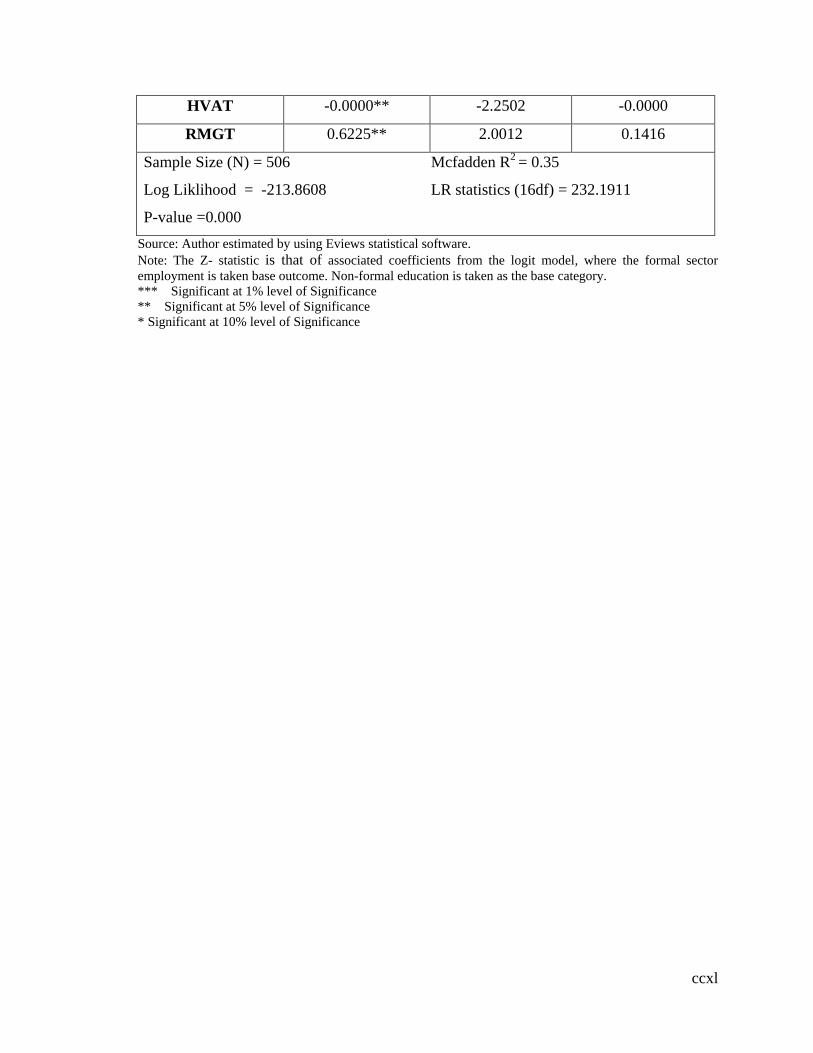
ccxl
HVAT -0.0000** -2.2502 -0.0000
RMGT 0.6225** 2.0012 0.1416
Sample Size (N) = 506 Mcfadden R2 = 0.35
Log Liklihood = -213.8608 LR statistics (16df) = 232.1911
P-value =0.000
Source: Author estimated by using Eviews statistical software.
Note: The Z- statistic is that of associated coefficients from the logit model, where the formal sector
employment is taken base outcome. Non-formal education is taken as the base category.
*** Significant at 1% level of Significance
** Significant at 5% level of Significance
* Significant at 10% level of Significance
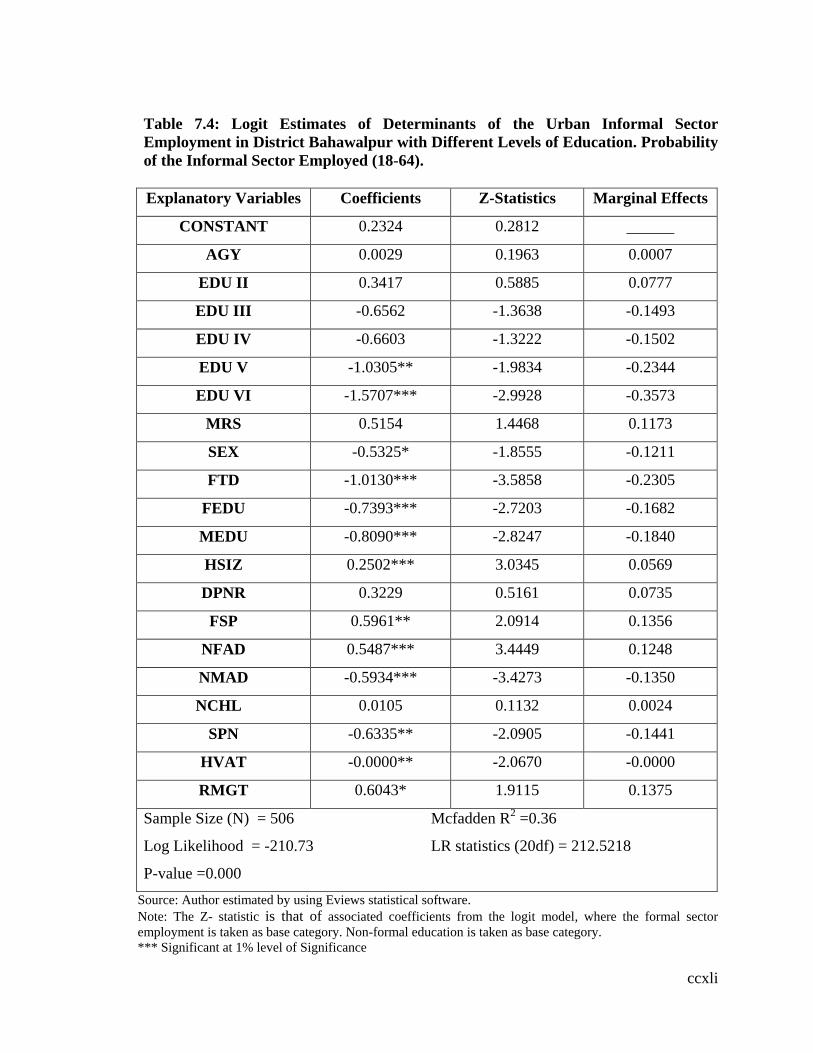
ccxli
Table 7.4: Logit Estimates of Determinants of the Urban Informal Sector
Employment in District Bahawalpur with Different Levels of Education. Probability
of the Informal Sector Employed (18-64).
Explanatory Variables Coefficients Z-Statistics Marginal Effects
CONSTANT 0.2324 0.2812
AGY 0.0029 0.1963 0.0007
EDU II 0.3417 0.5885 0.0777
EDU III -0.6562 -1.3638 -0.1493
EDU IV -0.6603 -1.3222 -0.1502
EDU V -1.0305** -1.9834 -0.2344
EDU VI -1.5707*** -2.9928 -0.3573
MRS 0.5154 1.4468 0.1173
SEX -0.5325* -1.8555 -0.1211
FTD -1.0130*** -3.5858 -0.2305
FEDU -0.7393*** -2.7203 -0.1682
MEDU -0.8090*** -2.8247 -0.1840
HSIZ 0.2502*** 3.0345 0.0569
DPNR 0.3229 0.5161 0.0735
FSP 0.5961** 2.0914 0.1356
NFAD 0.5487*** 3.4449 0.1248
NMAD -0.5934*** -3.4273 -0.1350
NCHL 0.0105 0.1132 0.0024
SPN -0.6335** -2.0905 -0.1441
HVAT -0.0000** -2.0670 -0.0000
RMGT 0.6043* 1.9115 0.1375
Sample Size (N) = 506 Mcfadden R2 =0.36
Log Likelihood = -210.73 LR statistics (20df) = 212.5218
P-value =0.000
Source: Author estimated by using Eviews statistical software.
Note: The Z- statistic is that of associated coefficients from the logit model, where the formal sector
employment is taken as base category. Non-formal education is taken as base category.
*** Significant at 1% level of Significance
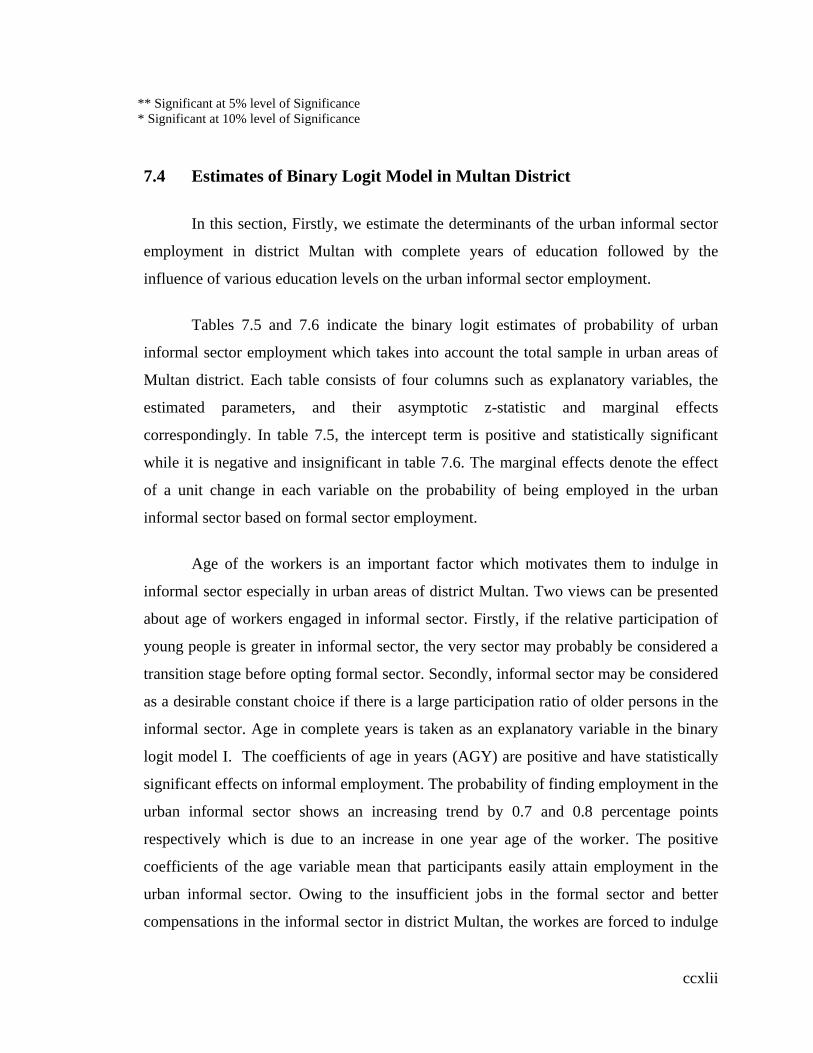
ccxlii
** Significant at 5% level of Significance
* Significant at 10% level of Significance
7.4 Estimates of Binary Logit Model in Multan District
In this section, Firstly, we estimate the determinants of the urban informal sector
employment in district Multan with complete years of education followed by the
influence of various education levels on the urban informal sector employment.
Tables 7.5 and 7.6 indicate the binary logit estimates of probability of urban
informal sector employment which takes into account the total sample in urban areas of
Multan district. Each table consists of four columns such as explanatory variables, the
estimated parameters, and their asymptotic z-statistic and marginal effects
correspondingly. In table 7.5, the intercept term is positive and statistically significant
while it is negative and insignificant in table 7.6. The marginal effects denote the effect
of a unit change in each variable on the probability of being employed in the urban
informal sector based on formal sector employment.
Age of the workers is an important factor which motivates them to indulge in
informal sector especially in urban areas of district Multan. Two views can be presented
about age of workers engaged in informal sector. Firstly, if the relative participation of
young people is greater in informal sector, the very sector may probably be considered a
transition stage before opting formal sector. Secondly, informal sector may be considered
as a desirable constant choice if there is a large participation ratio of older persons in the
informal sector. Age in complete years is taken as an explanatory variable in the binary
logit model I. The coefficients of age in years (AGY) are positive and have statistically
significant effects on informal employment. The probability of finding employment in the
urban informal sector shows an increasing trend by 0.7 and 0.8 percentage points
respectively which is due to an increase in one year age of the worker. The positive
coefficients of the age variable mean that participants easily attain employment in the
urban informal sector. Owing to the insufficient jobs in the formal sector and better
compensations in the informal sector in district Multan, the workes are forced to indulge

ccxliii
in accessible urban informal sector as compared to formal sector. Our findings are similar
with Funkhouser (1996) findings.
Education is the most important factor in determining an employment decision.
Education increases the efficiency and productivity. The complete years of education
(EDY) decreases the probability of urban informal sector employment. The probability of
the informal sector employment diminishes by 4.1 percentage points due to one year
increase in education of the worker. It may also be due to that most fortunate workers
with high human capital easily find a job in the formal sector. The reason of it is that the
urban informal sector absorbs less educated people in district Multan. This confirms
similar findings by Funkhouser (1996) in relation to complete years of education.
Education level of the participants in the labour market can play two different
roles. For instance, more educated workers tend to be more fertile as their education
serves as an impetus in enhancing their skill via training. On the other hand, low
education increases the probability of involvement in the urban informal sector. In order
to see the effect of education on urban informal sector employment, level of the
education of workers (EDY) is incorporated as a categorical variable using five
categories (non-formal education is taken as base category) in binary logit model II.
The coefficient of Middle level education (EDU II) is positive and statistically
significant. The probability of being employed in the informal sector of those with
Middle level education is 28.20 percentage points more than the formal sector
employment. Participants with low formal education are unable to get formal
employment in public as well as in private sector. So, they are occupied in the urban
informal sector. The coefficients of Matric level education (EDU III) and Intermediate
level education (EDU IV) are positive but the results are statistically insignificant. The
coefficient of Master‟s or higher level education (EDU VI) is found to be negative and
statistically significant. The probability of being employed in the informal sector of those
with Master‟s level education is less by about 30.8 percentage points as compared to the
formal sector.

ccxliv
This phenomenon indicates that educated people comparatively are more prone to
the formal sector. Results in relation to impact of different education levels on informal
sector employment replicate the classical theory of production and have close similarity
with law of diminishing returns. The trend indicates that the level of education increases,
the marginal informal sector employment gets down.
The findings highlight that the coefficient of marital status (MRS) is negative and
statistically significant. The probability of involvement in the informal sector reduces by
13 percentage points due to an addition of one married worker. The reason behind this
decline is that mostly married workers possessing high human capital are inclined to join
lucrative formal labour market in order to meet their needs and to secure better future of
their children. Our findings are consistent with Funkhouser‟s (1996) findings.
The sex (SEX) is another important factor which compels people to join the
labour market. The coefficient of sex variable is negative in both the tables. However, the
results are insignificant. The possible outcome of the fact is that male workers easily
obtain employment in the modern formal economy in stead of female workers.
Almost informal sector workers have less formal training but have some kind of
informal training. The coefficients of the formal training (FTD) are negative and highly
significant in binary logit models. One unit increase in formal training increases the
probability of the informal sector participation by 21.4 and 24.4 percentage points
respectively. This can be accounted for that with formal skill workers lean to switch over
the code from the informal to the formal labour market because psychologically a person
works with a better motivation when he gets to know the way of doing it in best way with
enhanced efficiency. Results conclude that formal training has less influence on the urban
informal sector of Multan.
The family background of the participants of the urban informal sector, especially
parents‟ education negatively affects the urban informal sector employment. In theory,
the notion is that workers are more likely to join the labour market whose parents are
educated. The study results are different in this analysis. The coefficients of father‟s
ccxlv
education (FEDU) are negative and statistically significant in the urban informal sector
employment models. The workers whose fathers are educated are less likely to be
employed in the informal sector by14.6 and about 16.2 percentage points respectively as
compared to the formal sector. The coefficients of (MEDU) are negative and highly
significant. The participants, whose mothers are educated, are less likely to be employed
in the informal sector by about 20.4 and 22.4 percentage points respectively as compared
to the formal sector. The decreasing trends indicate that the educated parents can afford
higher educational facilities to their children which result in the development of formal
sector.
Theoretically, two varying hypotheses can be formulated in relation to the effect
of household size on the informal sector involvement. Firstly, it signifies the promotion
of the informal sector due to manifold increase in labour supply. Secondly, the motive of
making the family financially sound motivates the head of large household to opt
informal sector. The household size is found to be positively influencing people for their
engagement in urban informal sector. The probability of being employed in the urban
informal sector increases by 27.7 percentage points respectively in table 7.6 as a result of
one member increase in HSIZ. The possible outcome of the fact is that workers have a
higher likeliness of working in informal sector in order to improve the overall living
standard of family and to make the family financially sound.
Regarding family setup (FSP), it is argued that in joint family structure the
workers participate in the informal sector to support financially and fulfill family
requirements. Family setup has positive and significant impact on work participation in
urban informal sector. The participants who belong to joint family setup are 10.2 and
about 11.5 percentage points more likely to be employed in the urban informal sector.
This positive impact is due to high family labour involvement and financial
responsibility. The results point out that the urban informal sector increases the joint
family participation because of the financial attraction that it renders to them in district
Multan. The family members and supply of labour in the form of family helpers also
determine and promote the growth potential of the urban informal sector in district
ccxlvi
Multan. Moreover, workers who lack quality education intend to opt for the urban
informal sector employment.
Labour supply theory explains the interdependent family labour supply decisions.
The results show that the coefficients of (DPNR) are positive and have insignificant
effect on informal sector employment in the urban areas of district Multan.
According to Neo-classical labour supply theory, people having children from the
age group of 6 to 14 do not need to look after them, and they participate more in informal
economic activities. The probability of involvement in the informal sector shows an
increasing trend by 35.3 and 29.6 percentage points respectively for an addition of one
child at home. Results conclude that the informal sector and number of children are
positively correlated. The positive marginal effects may indicate that parents of these
children have to do more informal work to meet up high educational expenses of their
children. Results are consistent with Funkhouser‟s (1996) study results.
The estimates reveal that the coefficients of number of male adolescents are
negative and have significant effect on employment in both models. The probability of
individual‟s participation in the urban informal sector decreases by about 5.1 and about
5.8 percentage points respectively due to an addition of male adolescent at home.
Theoretically, it is argued that the households having male adolescent don‟t get involved
into economic activities because family labour supply decisions are interdependent. The
possible reason may exist that some male adolescents have chances to earn and the family
labour income increases. It is the strong substitution effect of better-paid labour time for
that of male adolescents which dissuades workers from more work in informal economic
employment. Moreover, the urban informal sector increases the joint family participation
because of the financial attraction that it rendered to them. Similar results are found in
Funkhouser‟s (1996) study.
Results show that the coefficient of female adolescents (NMAD) is positive and
highly significant. An addition of one female adolescent increases the probability of
being employed by 7.5 and about 7.6 percentage points respectively. Hypothetically, it is

ccxlvii
argued that household heads having female adolescents engage them in urban informal
sector because family labour supply decisions are interdependent. It is also argued that
parents are generally less educated that‟s why they are unable to provide better education
to female adolescents and heads pursuade to join the informal labour market to meet up
female adolescents‟s requirements and expenses. It also owes to that these female
adolsecents who dissuade to work in income generating activities because of social,
religious and economic constraints. This encourages parents to stick to the urban informal
sector in order to fulfill female adolescents‟requirements. Having more female
adolescents is yet another determinant which influences the parents‟ inclusion in the
urban informal sector employment. Our findings are consistent with Funkhouser‟s (1996)
study findings.
The Neo-classical theory of labour supply postulates that the family labour supply
decisions are interdependent. Results found that the spouse participation in economic
activities (SPN) shows a decreasing trend in the probabilities of finding urban informal
sector employment in district Multan. But the coefficients are negative and results are
statistically insignificant in the analysis.
The estimates in table 7.5 highlight that the household value of assets (HVAT)
also affects the informal sector employment decision. Theoretically, it has been argued
that increase in the value of assets will increase the unearned income. This increased
income stabilizes the workers financially and discourages them for unnecessary
investment or work. Findings demonstrate that the coefficients of the value of
household‟s assets (HVAT) are positive and prove to be insignificant determinant.
Rural-urban migration (RMGT) is another significant variable influencing the
informal sector employment in district Multan. The probability of employment in the
informal sector rises by about 14.7 and 15.2 percentage points respectively in support of
an addition of one migrant worker. Results conclude that workers induced by higher
wages in the formal or urban informal sector have to join the informal sector of district
Multan. So, the probability of workers in the urban informal sector increases instead of
formal sector. It is concluded that the urban informal sector is also the sector of migrants

ccxlviii
or the urban informal sector absorbs rural-urban migrants and enables rural-urban
migrants for productive work in district Multan.

ccxlix
Table 7.5: Logit Estimates of Determinants of the Urban Informal Sector
Employment in District Multan-Probability of the Informal Sector Employed (18-
64).
Explanatory
Variables Coefficients Z-Statistic Marginal Effects
CONSTANT 1.2450 1.6301
AGY 0.0313*** 2.4757 0.0072
EDY -0.1799*** -4.5753 -0.0414
MRS -0.5001 -1.5923 -0.1152
SEX -0.0460 -0.1793 -0.0106
FTD -0.9288*** -3.5022 -0.2140
FEDU -0.6350** -2.4049 -0.1463
MEDU -0.8833*** -3.4989 -0.2035
HSIZ 0.0961 1.6171 0.0221
DPNR 0.3884 0.6498 0.0895
FSP 0.4437** 1.8485 0.1022
NFAD 0.3262*** 2.6675 0.0752
NMAD -0.2205* -1.7808 -0.0508
NCHL 0.1532* 1.7530 0.0353
SPN -0.3165 -1.3294 -0.0729
HVAT -0.0000 -0.3141 -0.0000
RMGT 0.6361** 2.4332 0.1466
Sample Size (N) = 512 Mcfadden R2 =
0.30
Log Liklihood = -235.5585 LR Statistics (16df) =199.8925
P-value = 0.000
Source: Author estimated by using Eviews statistical software.
Note: The Z- statistic is that of associated coefficients from the logit model, where the formal sector
employment is taken as base category. Non-formal education year is taken as base category.
*** Significant at 1% level of Significance
** Significant at 5% level of Significance
* Significant at 10% level of Significance

ccl
Table 7.6: Logit Estimates of Determinants of the Urban Informal Sector
Employment in district Multan with Different Levels of Education - Probability of
the Informal Sector Employed (18-64).
Explanatory Variables Coefficients Z-Statistics Marginal Effects
CONSTANT -0.7155 -0.9692
AGY 0.0351*** 2.7124 0.0081
EDU II 1.2240** 2.1922 0.2820
EDU III 0.3388 0.7962 0.0781
EDU IV -0.1961 -0.4165 -0.2756
EDU V -0.7055 -1.5237 -0.6125
EDU VI -1.3364** -2.7359 -0.3079
MRS -0.5660* -1.7358 -0.1304
SEX -0.1380 -0.5210 -0.0318
FTD -1.0595*** -3.8234 -0.2441
FED -0.7023** -2.5746 -0.1618
MED -0.9735*** -3.7110 -0.2243
HSIZ 0.1201** 1.9373 0.0277
DPNR 0.3637 0.5907 0.0838
FSP 0.4987** 2.0279 0.1149
NFAD 0.3294*** 2.6353 0.0759
NMAD -0.2529** -2.0083 -0.0583
NCHLD 0.1285 1.4345 0.0296
SPN -0.2945 -1.2095 -0.0679
HVAT -0.0000 -0.3595 -0.0000
RMGT 0.6592** 2.4715 0.1519
Sample Size (N) =512 Mcfadden R2 =
0.32
Log Likelihood = -229.2439 LR statistics (20 df) = 212.5218
P-value = 0.000
Source: Author estimated by using Eviews statistical software.

ccli
Note: The Z-statistic is that of associated coefficients from the logit model, where formal employment is
taken as taken as base outcome. Non-formal education is taken as base category.
*** Significant at 1% level of Significance
** Significant at 5% level of Significance
* Significant at 10% level of Significance
cclii
7.5 Estimates of Binary Logit Model in Dera Ghazi Khan District
In this section we analyze the determinants of the urban informal sector
employment in district Dera Ghazi Khan with complete year of education and different
levels of education to estimate their impact on the urban informal sector employment.
In this study, tables 7.7 and 7.8 highlight the binary logit estimates of informal
sector employment by considering total sample in urban areas in district Dera Ghazi
Khan. Four columns of the tables make explanatory variables clear, the estimated
parameters, their asymptotic Z-Statistic and marginal effects correspondingly. The
intercept term is positive and statistically significant in table 7.7 while it is positive and
insignificant in table 7.8. The marginal effects indicate the effect of a unit change in each
variable on the probability of being in urban informal sector employment relative to the
base category (formal employment).
Two views can be presented about age of workers involved in the informal sector.
Firstly, if the relative participation of young people is greater in informal sector, the very
sector may probably be considered a transition stage before opting formal sector.
Secondly, informal sector may be considered as a desirable constant choice if there is a
large participation ratio of older persons in the informal sector. In the urban informal
employment model of Dera Ghazi Khan, complete years of age is taken as an explanatory
variable. The coefficient of complete years (AGY) is found to be positive and statistically
significant in both models. In table 7.7, the probability of being exerted in the urban
informal sector shows an increasing trend by 0.4 percent points due to one year increase
of age of the worker. On the other hand, the coefficient of complete year of age is
positive but statistically insignificant in table 7.8. It owes to the people possessing low
formal education easily find employment in urban informal sector in their older age
instead of involving in the formal sector of district Dera Ghazi Khan. Moreover, due to
insufficiency of the formal sector jobs, they stick to the informal sector employment and
stay there for longer period of time.

ccliii
Education level of workers is yet another variable which determines the job
choice in labour market. We have used complete years of education as an explanatory
variable. Results indicate that education slowly but surely diminish the probability of
working in the urban informal sector. The coefficient of the complete years of education
(EDY) is negative and highly significant. An increase in one year of education diminishes
the contribution in the informal sector employment by about 3.8 percentage points. The
reason for this decreasing participation is that workers switch out from informal sector
towards the formal labour market that is more profitable. The results may be related to
the expected role of the informal sector under approaches of the informal sector, it is
expected that the sector is a disadvantaged sector with low human capital. The result
coincides with the evidence from Funkhouser‟s (1996) in relation to education.
Education level of the participants in the labour market can play two different
roles. For instance, more educated workers tend to be more fertile as their education
serves as an impetus in enhancing their skill via training. On the other hand, low
education increases the probability of involvement in the informal sector. In binary logit
model II, the education level of workers (EDY) is incorportaed as a categorical variable
with five categories (non-formal education being the base category). The probability of
being employed in the informal sector of those with Matric level education is 16.9
percent more than the excluded category. The coefficient of Middle level education
(EDU III) is positive and statistically significant. The coefficient of Intermediate level
education (EDU IV) is negative and has insignificant effect on employment in urban
informal sector. The probability of Graduation level education (EDU V) decreases by
about 31.8 percent for an increase of one unit change in the Graduation level. The
coefficient of Master‟s or higher level education (EDU VI) is found to be negative and
significant. The probability of being employed in the informal sector of those with
Master‟s or higher level education is less by 58.6 percentage points as compared to
formal sector employment. This declining trend highlights the importance of the formal
sector in the urban areas of district Dera Ghazi Khan. Infact, human capital and or simple
skills (or none) are more essential for urban informal sector employment than high
education level. Informal sector employment results based on education reflect the

ccliv
classical theory of production and they are similar with law of diminishing returns. It
means that the level of education increases and the marginal urban informal sector
employment gets down. The findings match with Florez‟s (2003) study results.
The study results indicate that the coefficient of marital status (MRS) is positive
and has insignificant effects on employment in urban informal sector in both models. The
economic justification is that the formal sector is not capable to absorb the workers with
formal education and ultimately mostly couples are apt to join an accessible informal
sector employment in order to meet up their needs. Additionally, geographical
immobility may also be the reason to detain in this sector.
The sex (SEX) is another important factor which compels people to work in the
labour market. The results found the negative and insignificant coefficients of the
variable sex in urban informal sector of district Dera Ghazi Khan. This can be accounted
for that the male workers may not accept low-paid informal sector employment because it
does not commensurate with their human capital. On the other hand, the informal sector
may prefer female workers because the nature of work requires low formal education.
This confirms the similar findings by Florez‟s (2003) study results.
Nearly informal sector workers have less formal training but possess some kind of
informal training. The coefficient of formal training (FTD) is found to be negative and
highly significant. The probability of finding the urban informal sector employment
decreases by about 27.8 and 27.5 percentage points respectively due to an increase of one
unit in formal training of the workers. The reason can be that formal diploma and degree
holders preferably invoke formal labour market for proper utilization of their skills in
district Dera Ghazi Khan.
The labour supply theory predicts that the workers are more likely to join the
labour market whose parents are educated. The findings of the present study are different.
The estimates show that the coefficients of father‟s education (FEDU) are negative and
statistically significant. The probability of being employed in the informal sector falls by
about 18.1 and 17.2 percentage points for an increase of one unit in (FEDU) respectively.
cclv
The coefficients of mother‟s education (MEDU) variable are found to be negative and
highly significant. The probability of contribution in the urban informal sector decreases
by about 17.6 and about 16.4 percent respectively for an addition of one educated mother.
The results show that the educated parents provide higher education to their children
which result in the development of lucrative formal sector. Results conclude that
participants‟, whose parents are educated, are less likely to join the urban informal sector
employment in district Dera Ghazi Khan.
In theory, it is argued that those workers who belong to joint family setup (FSP)
join the urban informal employment to fulfill family requirements and to stablize the
family financially. Family setup has a positive and an insignificant impact on probabilty
of insertion in the urban informal sector.
Theoretically, two varying hypotheses can be formulated regarding the effect of
household size on the informal sector involvement. Firstly, it signifies the promotion of
informal sector due to manifold increase in labour supply. Secondly, the motive of
making the family financially strong compels the head of large household to invoke to
informal sector. The results describe that the coefficient of HSIZ is positive and has
significant effect on work participation in the informal sector in both models. When the
household size increases by one, the workers are about 2.3 and 2.5 percentage points
respectively more likely to be employed in the informal sector in district Dera Ghazi
Khan. Results conclude that workers are more likely to participate in the urban informal
sector with large household size in order to improve the overall living standard of the
family or to nourish the every child in house.
Dependency ratio (DPNR) is also important one which is deemed to participate in
the informal sector. The notion is that family labour supply decisions are interdependent.
The results reveal that the coefficients of dependency ratio (DPNR) are positive and have
insignificant influence on joining the urban informal sector in district Dera Ghazi Khan.
According to labour supply theory, people having number of children from 9 to
14 are more likely to participate in formal or informal labour market because of low
cclvi
household responsibilities. Findings show that the number of children (NCHL) has a
positive and insignificant impact on informal sector employment decision. The results
indicate the phenomenon of child labour.
The variable „number of male adolescents‟ (NMAD) is also expected to influence
the urban informal sector employment decision. The coefficient of male adolescent
(NMAD) is found to be negative and has statistically significant influence. The informal
sector employment diminishes by about 8.3 and 9 percentage points respectively due to
one additional male adolscent. The reason behind this low participation is that the strong
substitution effect of better-earnings of male adolescents deters heads to participate in the
urban informal sector. Furthermore, to reap the benefits of toil they did for their male
adolscents, the parents stop working. Results make clear that presence of male adolescent
decreases the probability of workers being employed in the urban informal sector in Dera
Ghazi Khan.
A female adolescent (NFAD) is an important factor which determines the
participation in labour market. The coefficients of number of female adolescents are
found to be positive and statistically significant. The participants are more likely to be
employed in the informal sector by about 9.1 and 7.7 percentage points respectively due
to an increase of one additional female adolescent. Theoretically, it is argued that
households having female adolescent prefer to work more in the urban informal sector
because some female adolescents have to look after the household responsibilities and
cannot involve in productive work. Approximately females are less likely to participate in
work related activities due to low formal education, social and economic constrictions. In
this way, the heads have to fulfill female adolescents‟ basic requirements. Having more
female adolscents is yet another determinant which influences the parents‟ inclusion in
the urban informal sector employment in district Dera Ghazi Khan.
The family labour supply decisions are interdependent as predicted by the labour
supply theory. Spouse‟s participation in economic activities (SPN) reduces the
probability of urban informal sector employment. The probability of being inducted in
the informal sector decreases by 20.4 and about 20.2 percentage point respectively due to
cclvii
one unit increase in spouse participation in economic activities. The reason can be that
spouses of the participants of labour market allocate their time to leisure and participate
less in economic activities because of increase of family income. It is concluded that
spouse participation in economic activities may decrease the probability of working in the
urban informal sector. Moreover, informal sector in the urban areas of Dera Ghazi Khan
shows the retrenchment with the increase of spouse participation in economic activities.
The labour supply theory predicts that the household‟s value of assets (HVAT)
affects the participation decision regarding sector of employment. Findings point out that
the coefficients of the household‟s value of assets (HVAT) are negative and statically
insignificant. The strong substitution effect of unearned income induces the workers less
likely to allocate less time to the urban informal sector.
It is assumed that rural-urban migration (RMGT) affects the urban informal sector
employment. The study results confirm the hypothesis. The probability of the urban
informal sector involvement rises by 7.5 percentage points due to an addition of one
rural-urban migrant worker in the urban areas, the coefficient of rural-urban migrant
variable (RMGT) is found to be positive although there are insignificant effects on urban
informal sector in district Dera Ghazi Khan. Thus, the sector enables workers for
productive work. The study results conclude that informal employment is creating more
employment in urban areas of Dera Ghazi Khan due to high rural-urban migration rate
and wage differential and getting employment opportunities in the formal sector is
probable.

cclviii
Table 7.7: Logit Estimates of Determinants of the Urban Informal Sector
Employment in District Dera Ghazi Khan - Probability of the Informal Sector
Employed (18-64).
Explanatory
Variables Coefficients Z-Statistic Marginal Effects
CONSTANT 1.3670 1.5145
AGY 0.0197 1.4304 0.0043
EDY -0.1737*** -4.2389 -0.0378
MRS 0.2537 0.7677 0.0552
SEX -0.1781 -0.6155 -0.0388
FTD -1.2773*** -3.8918 -0.2779
FED -0.8321*** -2.8314 -0.1811
MED -0.8085*** -2.6908 -0.1759
HSIZ 0.1036* 1.7769 0.0225
DPNR 0.7958 1.4363 0.1732
FSP 0.3613 1.2669 0.0786
NFAD 0.4174*** 3.1602 0.0908
NMAD -0.3808*** -2.5490 -0.0829
NCHL 0.1557 1.5135 0.0339
SPN -0.9390*** -3.2085 -0.2043
HVAT -0.0000 -0.5607 -0.0000
RMGT 0.3458 1.2176 0.0752
Sample Size (N) = 487 Mcfadden R2 =
0.38
Log Liklihood = -188.0803 LR statistic (16df) = 230.0525
P-value = 0.000
Source: Author estimated by using Eviews statistical software.
Note: The Z- statistic is that of associated coefficients from the logit model, where formal sector
employment is taken as base outcome. Non-formal education is taken as the base category.
*** Significant at 1% level of Significance
** Significant at 5% level of Significance
* Significant at 10% level of Significanc
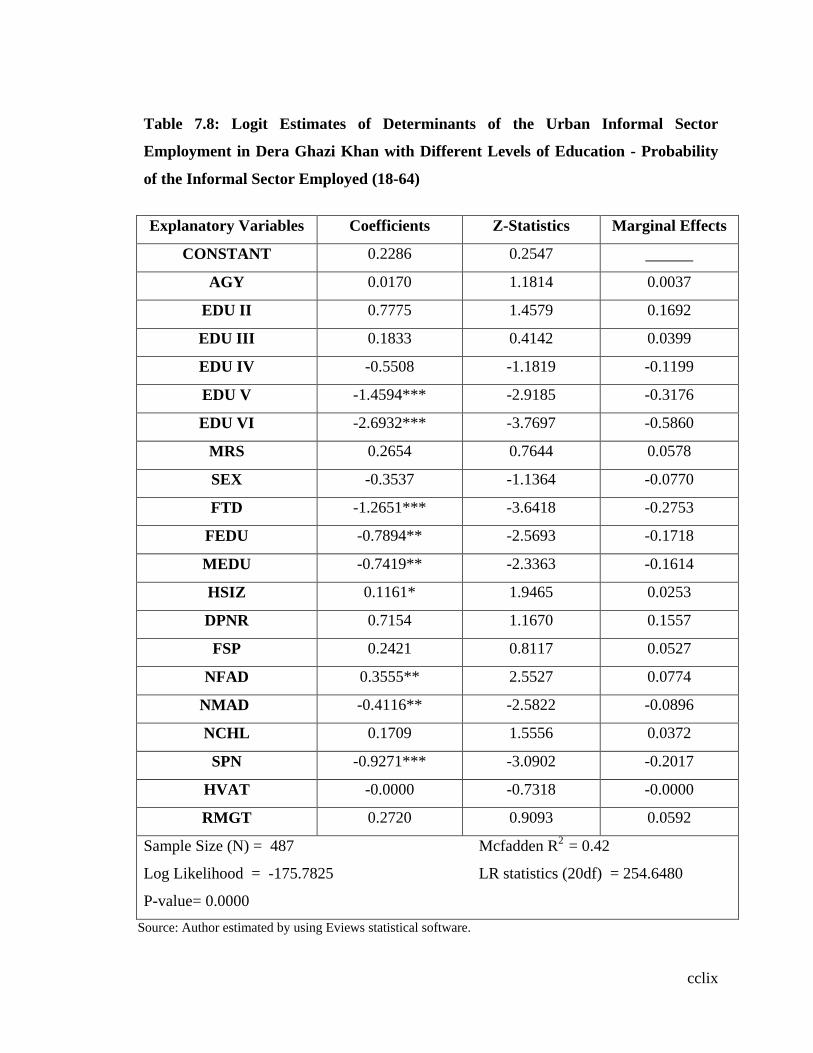
cclix
Table 7.8: Logit Estimates of Determinants of the Urban Informal Sector
Employment in Dera Ghazi Khan with Different Levels of Education - Probability
of the Informal Sector Employed (18-64)
Explanatory Variables Coefficients Z-Statistics Marginal Effects
CONSTANT 0.2286 0.2547
AGY 0.0170 1.1814 0.0037
EDU II 0.7775 1.4579 0.1692
EDU III 0.1833 0.4142 0.0399
EDU IV -0.5508 -1.1819 -0.1199
EDU V -1.4594*** -2.9185 -0.3176
EDU VI -2.6932*** -3.7697 -0.5860
MRS 0.2654 0.7644 0.0578
SEX -0.3537 -1.1364 -0.0770
FTD -1.2651*** -3.6418 -0.2753
FEDU -0.7894** -2.5693 -0.1718
MEDU -0.7419** -2.3363 -0.1614
HSIZ 0.1161* 1.9465 0.0253
DPNR 0.7154 1.1670 0.1557
FSP 0.2421 0.8117 0.0527
NFAD 0.3555** 2.5527 0.0774
NMAD -0.4116** -2.5822 -0.0896
NCHL 0.1709 1.5556 0.0372
SPN -0.9271*** -3.0902 -0.2017
HVAT -0.0000 -0.7318 -0.0000
RMGT 0.2720 0.9093 0.0592
Sample Size (N) = 487 Mcfadden R2
= 0.42
Log Likelihood = -175.7825 LR statistics (20df) = 254.6480
P-value= 0.0000
Source: Author estimated by using Eviews statistical software.
cclx
Note: The Z- statistic is that of associated coefficients from the logit model, where formal sector
employment is taken base outcome. Non-formal education is taken as the base category.
*** Significant at 1% level of Significance
** Significant at 5% level of Significance
* Significant at 10% level of Significance
7.6 Concluding Remarks
We have used econometric analysis to investigate the determinants of the urban
informal sector employment in this chapter. A binary logit model is applied in the present
study. The analysis of current study is based on stratified random sample of 1506
informal and formal sector participants in urban areas of Southern Punjab. The analysis
has also been made in Southern Punjab as well as separately in each division with
different sample sizes. Most of the explanatory variables produce different results at
various levels of analysis in this study. In Southern Punjab, all of the variables i.e. age of
worker (AGE), their complete years of education (EDY), gender (SEX), formal training
(FTD), parental education (FEDU), (MEDU), household size (HSIZ), dependency ratio
(DPNR), family setup (FSP), number of female adolescents (NFAD), number of male
adolescents (NMAD), number of children (NCHL), spouse participation in economic
activities (SPN), household‟s value of assets (HVAT), and rural-urban migrat variable
(RMGT) are highly significant factors except the variable marital status (MRS) which is
positive but highly insignificant. Furthermore, level of education i.e. education up to
Middle (EDU II), Intermediate (EDU IV), Graduation (EDU V), and Master‟s or higher
levels (EDU VI) appear significant except Matric level education (EDU III) which is
found insignificant. All these significant variables of the informal sector employment in
the urban areas of Southern Punjab have correct sign and cope up with the theoretical
foundation.
The study results of district Bahawalpur are somewhat different. Age of the
respondents (AGY), the household dependency ratio (DRN) and number of children
(NCHLD) are found to be insignificant in logit models. Regarding level of education,
Middle (EDU II), Matric (EDU II) and Intermediate (EDU IV) are insignificant in district
Bahawalpur.

cclxi
In Multan district, the study results of urban informal employment model I
highlight that male sex (SEX), the marital status(MRS), household size (HSIZ) the
household dependency ratio (DPNR), spouse participation in economic activities (SPN)
and household‟s value of assets (VAT) are found to be insignificant. While number of
children (NCHL) affects insignificantly the informal employment decision in model II.
Whereas, Matric level education (EDU III) Intermediate level education (EDU IV) and
Graduation level education (EDU V) are the insignificant factors in determining informal
employment work in district Multan.
In model I of urban informal sector employment of district Dera Ghazi Khan,
marital status (MRS) is positive and insignificant. The sex (SEX) of the workers has
insignificant effects. The household dependency ratio (DPNR) and family setup (FSP),
the household‟s value of assets (HVAT) and rural-urban migrant variable (RMGT) are
found to be insignificant in urban informal sector employment of district Dera Ghazi
Khan. The result of model II demonstrates the insignificant effect of age of the workers
(AGY) on their informal work decision. The results of Matric (EDU III) and Intermediate
level education (EDU IV) are also insignificant. Again marital status (MRS) is found to
be positive and has insignificant effects. Moreover, number of children (NCHL) also
affects insignificantly the informal employment decision in model II.

cclxii
Chapter 8
EARNINGS DERTERMINANTS, DEVELOPMENT AND
URBAN INFORMAL SECTOR: AN ANALYSIS
8.1 Introduction
The bulk of work force invoke informal sector for employment due to limited
capacity of formal sector to generate employment opportunities. However, labour gets
relatively low productivity in the informal sector. Informal sector requires to be promoted
to absorb surplus labour, while an attempt needs to be made to enhance the productivity
of labour in the informal sector to protect the workers against exploitation (Kemal and
Mehmood, 1993).
There is an association between poverty and informality. The pessimistic viewed
informal sector as marginal and subsistence activities, where the productivity and
earnings of workers are low. Additionally the participants of the informal sector access
low social protection and their working conditions are low (ESCAP, 2006).
In Pakistan, poverty remains prevalent inspite of impressive economic growth.
This prevalent is due to low growth in the productivity, macro-economic instability, and
structural adjustment not taking care for poor and external shocks. Though some
programmes are in process to diminish poverty, however these programmes are
unaccessable to the poor. More efforts can be made in this area which has a high scope to
explore more completely the potential for social safety net programmes. The profitable
employment opportunities must be created for destitute classes both in rural areas and
urban slums. However, there is a need to implement policies to promote an effective and
equitable growth pattern (Mahmood, 1999).
In this chapter, we examine the earnings determinants of participants in the urban
informal sector of three divisions of Southern Punjab such as Bahawalpur, Multan and
Dera Ghazi Khan in section 8.2. The Human Development and the urban informal sector

cclxiii
in three divisions of Southern Punjab, Pakistan is described in section 8.3. Finally,
concluding remarks are given in section 8.4.
cclxiv
8.2 Estimates of Earnings Functions of the Participants in Urban Informal
Sector in Southern Punjab
In this section we look at the earnings determinants for the participants of the
urban informal sector in Southern Punjab. We also split the analysis into three districts
such as Bahawalpur, Multan and Dera Ghazi Khan.
Tables 8.1 and 8.2 present the results of determinants of workers‟ earnings in the
urban informal sector of Southern Punjab. Each table contains three columns that indicate
explanatory variables, coefficients and t-statistics. Generally impact of age, years of
education, training facilility, sex, marital status, and family structure, household‟s value
of assets and weekly working hours are checked by using simple Ordinary Least Square
regressions on monthly earnings of the urban informal sector workers.
Age is an important factor which determines the earnings potential of workers of
the urban informal sector. Theoretically, it is expected that earnings increase with age and
indicate a positive relationship. The results show that income is an increasing function of
age of participants of the informal sector. Our study shows that coefficient of
participant‟s age is positive and statistically significant at 5 % level of significance. The
study results conclude that age directs or guides for higher returns.
Education is a critical input into economic development (Behrman, 1995).
Education is assumed to be a passport to good jobs and it icreases the efficiency. The
coefficient of complete years of education (EDY) is highly significant at 1 percent level
of significance. A positive relationhip is found between years of education and earnings
of the participants in the urban informal sector of Southern Punjab. This shows that
attainment of education leads to higher earnings of the participants of the urban informal
sector in Southern Punjab. The results support studies by Burki and Abbas (1991),
Funkhouser (1996) and Sargana (1998).
Human capital theory hypothesizes that better-educated workers have a
propensity to be more productive and able to perform functionally more sophisticated
jobs as compared to those workers who have less formal education. By using the binary
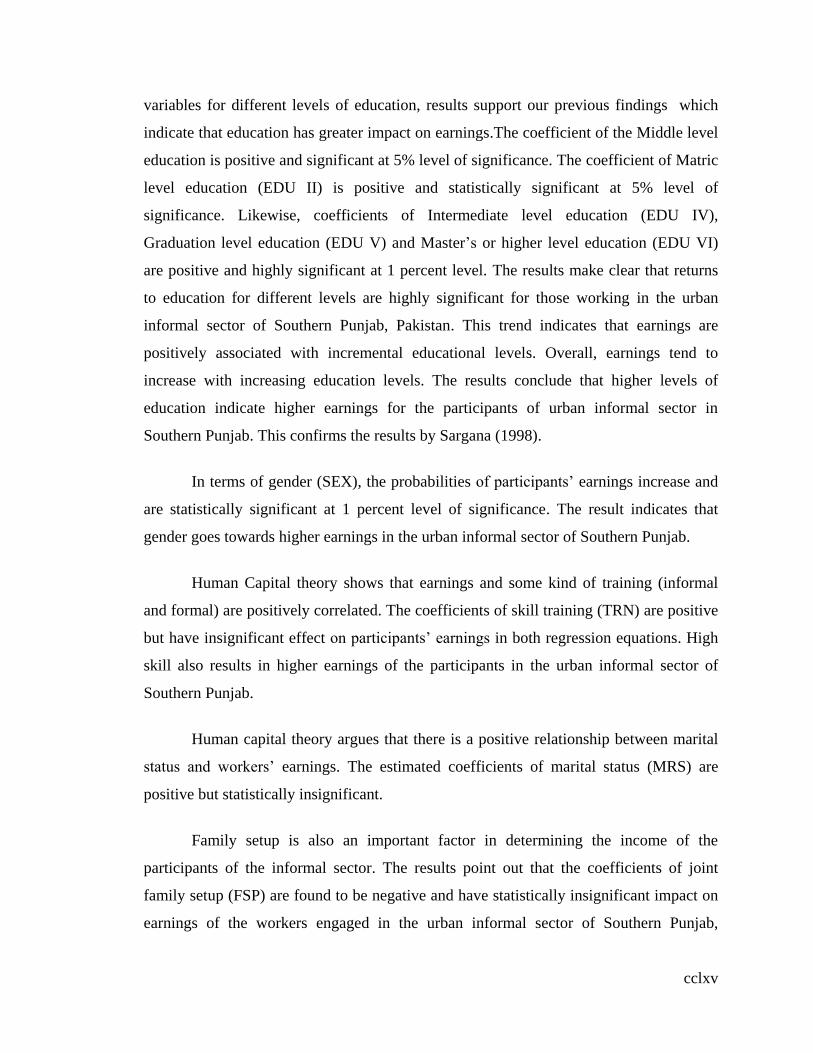
cclxv
variables for different levels of education, results support our previous findings which
indicate that education has greater impact on earnings.The coefficient of the Middle level
education is positive and significant at 5% level of significance. The coefficient of Matric
level education (EDU II) is positive and statistically significant at 5% level of
significance. Likewise, coefficients of Intermediate level education (EDU IV),
Graduation level education (EDU V) and Master‟s or higher level education (EDU VI)
are positive and highly significant at 1 percent level. The results make clear that returns
to education for different levels are highly significant for those working in the urban
informal sector of Southern Punjab, Pakistan. This trend indicates that earnings are
positively associated with incremental educational levels. Overall, earnings tend to
increase with increasing education levels. The results conclude that higher levels of
education indicate higher earnings for the participants of urban informal sector in
Southern Punjab. This confirms the results by Sargana (1998).
In terms of gender (SEX), the probabilities of participants‟ earnings increase and
are statistically significant at 1 percent level of significance. The result indicates that
gender goes towards higher earnings in the urban informal sector of Southern Punjab.
Human Capital theory shows that earnings and some kind of training (informal
and formal) are positively correlated. The coefficients of skill training (TRN) are positive
but have insignificant effect on participants‟ earnings in both regression equations. High
skill also results in higher earnings of the participants in the urban informal sector of
Southern Punjab.
Human capital theory argues that there is a positive relationship between marital
status and workers‟ earnings. The estimated coefficients of marital status (MRS) are
positive but statistically insignificant.
Family setup is also an important factor in determining the income of the
participants of the informal sector. The results point out that the coefficients of joint
family setup (FSP) are found to be negative and have statistically insignificant impact on
earnings of the workers engaged in the urban informal sector of Southern Punjab,

cclxvi
Pakistan. It indicates that earnings returns decrease due to an increase in joint family
setup. The possible reason may be the increasing family expenditures.
It is postulated that there is a positive association between working hours and
earnings of the participants of labour market. The findings indicate that coefficients of
the variable working hours (WHR) are also positive and highly significant at 1 percent
level of significance. It indicates that an increase in working hours directs the higher
earnings of the workers in urban informal sector employment of Southern Punjab. The
study results support studies by House (1984), Smith and Metzger (1998) and Dasgupta
(2003).
Theoretically, there is a negative relationship between earnings and household‟s
value of assets in the labour market. However, our results are positive. The variable value
of assets is included by obtaining from all types of financial and physical assets. We have
used all types of assets. In both the regression models, the results highlight that the
coefficients of the variable household value of assets (HVAT) are also positive and
highly significant at one percent level. The study results also show a positive relationship
between increase in value of assets and earnings of the participants of urban informal
sector.
Table 8.1: Earnings Functions of the Participants in the Urban Informal Sector in
Southern Punjab
Variables Coefficients t-statistics
C 3.0136 45.3219
AGY 0.00272** 2.3803
EDY 0.0275*** 9.1022
TRN 0.0102 0.4438
SEX 0.3738*** 14.4282
MRS 0.0317 1.1599
FSP -0.0017 -0.0706
HVAT 0.0000*** 11.2816
WHR 0.0041*** 5.3059
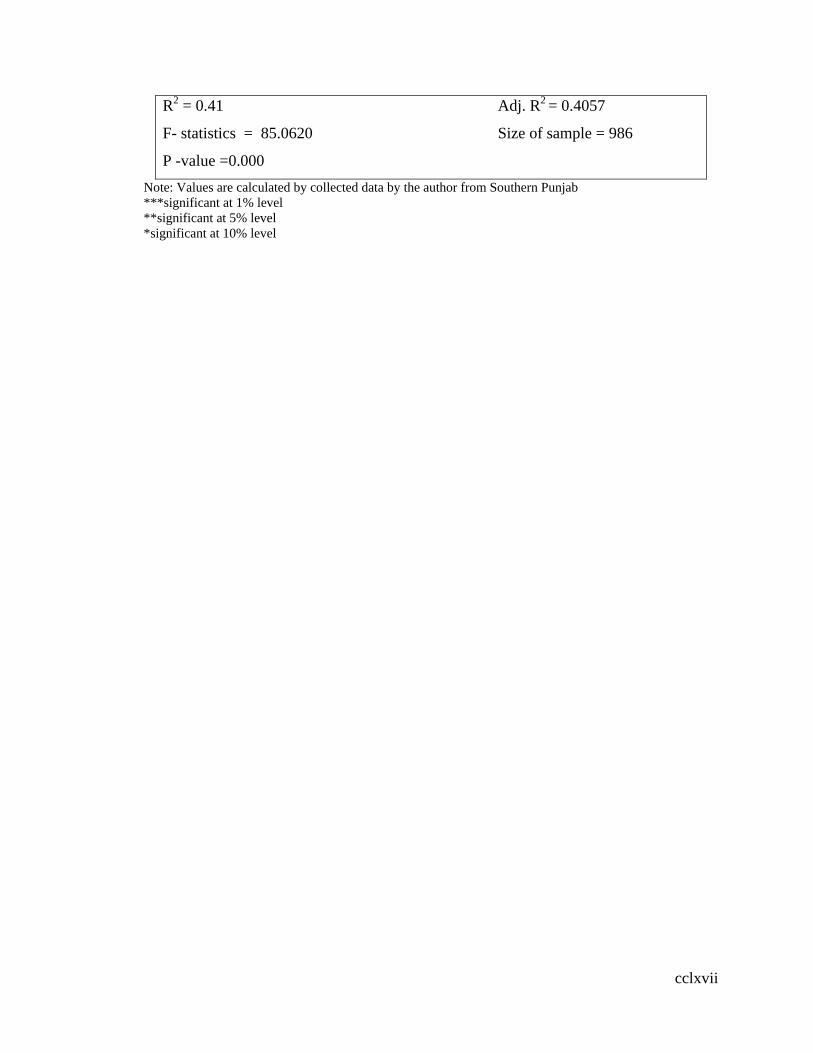
cclxvii
R2 = 0.41 Adj. R
2 = 0.4057
F- statistics = 85.0620 Size of sample = 986
P -value =0.000
Note: Values are calculated by collected data by the author from Southern Punjab
***significant at 1% level
**significant at 5% level
*significant at 10% level
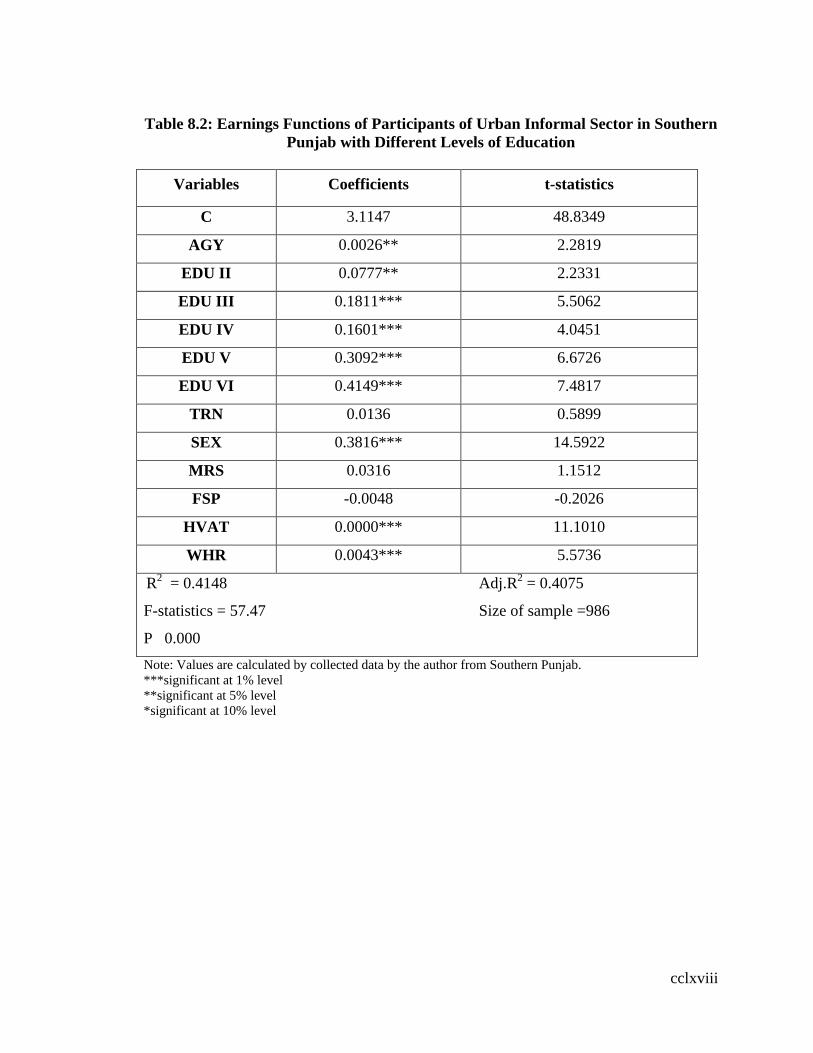
cclxviii
Table 8.2: Earnings Functions of Participants of Urban Informal Sector in Southern
Punjab with Different Levels of Education
Variables Coefficients t-statistics
C 3.1147 48.8349
AGY 0.0026** 2.2819
EDU II 0.0777** 2.2331
EDU III 0.1811*** 5.5062
EDU IV 0.1601*** 4.0451
EDU V 0.3092*** 6.6726
EDU VI 0.4149*** 7.4817
TRN 0.0136 0.5899
SEX 0.3816*** 14.5922
MRS 0.0316 1.1512
FSP -0.0048 -0.2026
HVAT 0.0000*** 11.1010
WHR 0.0043*** 5.5736
R
2 = 0.4148 Adj.R
2 = 0.4075
F-statistics = 57.47 Size of sample =986
P 0.000
Note: Values are calculated by collected data by the author from Southern Punjab.
***significant at 1% level
**significant at 5% level
*significant at 10% level
cclxix
8.2.1 Estimates of Earnings Functions of Participants in Urban Informal
Sector in District Bahawalpur
We present results of earnings determinants of participants of the urban informal
sector regarding district Bahawalpur with complete years of education as well as with
different levels of education in this section.
The tables 8.3 and 8.4 incorporate the results of earnings determinants of informal
sector employed workers. Each table contains three columns that indicate explanatory
variables, coefficients and t-statistics. Results in tables 8.3 and 8.4 reveal that all human
capital variables are highly significant.
Age is an imperative factor for the income of workers of the urban informal
sector. Theoretically, there is found a positive correlation between age and earnings. The
results show that income is an increasing function of age in both the regression models.
Findings indicate that the coefficients of age (AGY) are positive and have statistically
insignificant impact on the earnings of those persons engaged in the urban informal
sector of district Bahawalpur.
On the other hand, coefficient of complete years of education (EDY) is positive
and statistically significant. Higher education of the informal sector participants directs to
higher returns of the workers engaged in the urban informal sector of Southern Punjab,
Pakistan. Our findings are supported by Burki and Abbas (1991), Funkhouser (1996),
Sargana (1998).
We have also used dummy variables for different level of education in order to
check the impact on earnings. The coefficient of Matric (EDU II) level education is
positive but statistically significant at 1 % level of significance. While the coefficients of
Intermediate level education (EDU III) and Graduation level education (EDU IV) are
positively significant at 5 % level of significance. The coefficient of Master‟s or higher
level education (EDU V) is positive and highly significant at 1 % percent level of
significance in the analysis. Our study results in table 8.4 seem to suggest that informal
sector workers gain higher earnings with different level of education or there is positive

cclxx
association between earnings and different levels of education of the participants in the
urban informal sector of district Bahawalpur. This trend indicates the positive association
of earnings and incremental levels of education. Our findings are similar with results by
Sargana (1998).
Human capital theory highlights that there is a positive association between
training and earnings of the workers in labour market. The coefficients regarding training
skills (TRN) are positive but have statistiacally insignificant impact on income of
workers in both regression models.
The variable “SEX” is pivotal in determining the earnings potential. Results
indicate that the coefficients of sex are highly significant at 1 % percent level of
significance. There is found a positive relationship between earnings and workers‟
participation in the urban informal sector employment in district Bahawalpur. However,
the relatonship is highly significant at 1 percent level of significance.
It is expected that married workers‟ participation rate is high in labour market.
The estimated coefficients of marital status (MRS) imply 0.10 percent increase in
earnings for each additional married person in regression model II. Result in table 8.4
shows that dummy variable for on the marital status (MRS) is significant at 5 percent
level of significance. Comparatively, married workers have higher returns in urban
informal sector of Bahawalpur. Results conclude that earnings increase with more
inclusion of married workers in urban informal sector in district Bahawalpur.
While the coefficients of family setup (FSP) are insignificant in both the
regression equations. Theoretically, it is supposed that working hours have positive
influence on earnings in the labour market. Our results indicate that coefficients of the
variable working hours (WHR) are also positive and have highly significant impact on
income of the participants of the urban informal sector of district Bahawalpur. This
shows that earnings of the informal sector workers increase with an increase of working
hours. This confirms the similar results by House (1984), Smith and Metzger (1998) and
Dasgupta (2003).
cclxxi
Assets are considered as a financial security. There is a positive relartionship
between household‟s value of assets and earnings of the participants in the urban
informal sector. Results indicate that coefficient of household‟s assets (HVAT) are also
positive and highly significant. The earnings of the workers increase with an increase in
their value of assets in the urban informal sector of Bahawalpur.
In conclusion, education of the participants is an essential and strong source of
variation in their earnings. A positive association with education level and earnings
confirm the hypothesis that education is an investment that has good returns in urban
informal sector of district Bahawalpur. By and large, it can be concluded that all human
capital variables and other socio-economic variables like sex, marital status, household‟s
value of assets and working hours are significant determinants of earnings and growth
potential of the urban informal sector in district Bahawalpur.
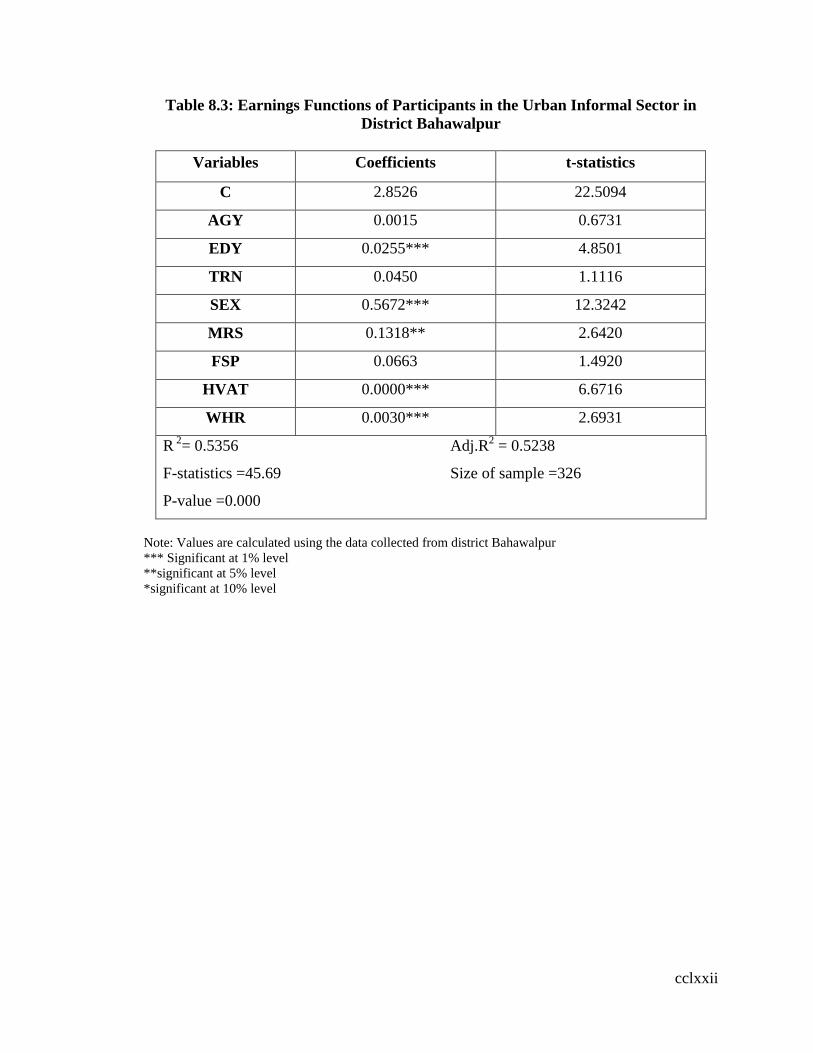
cclxxii
Table 8.3: Earnings Functions of Participants in the Urban Informal Sector in
District Bahawalpur
Variables Coefficients t-statistics
C 2.8526 22.5094
AGY 0.0015 0.6731
EDY 0.0255*** 4.8501
TRN 0.0450 1.1116
SEX 0.5672*** 12.3242
MRS 0.1318** 2.6420
FSP 0.0663 1.4920
HVAT 0.0000*** 6.6716
WHR 0.0030*** 2.6931
R 2= 0.5356 Adj.R
2 = 0.5238
F-statistics =45.69 Size of sample =326
P-value =0.000
Note: Values are calculated using the data collected from district Bahawalpur
*** Significant at 1% level
**significant at 5% level
*significant at 10% level
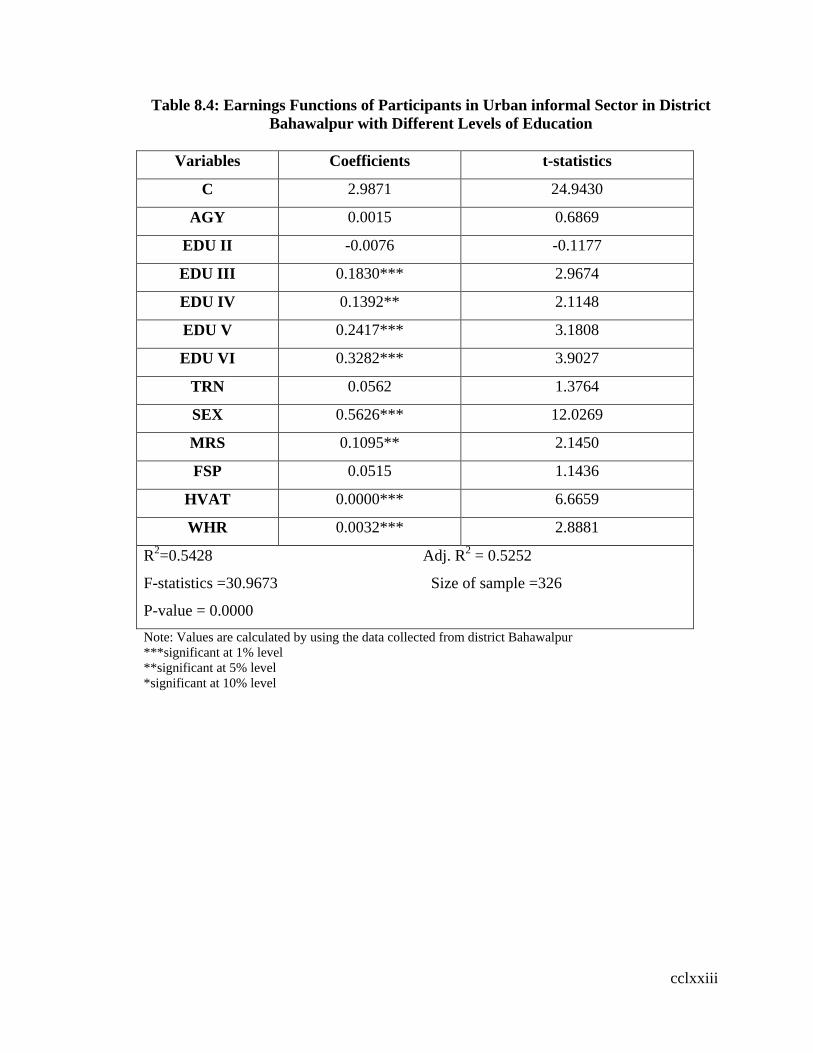
cclxxiii
Table 8.4: Earnings Functions of Participants in Urban informal Sector in District
Bahawalpur with Different Levels of Education
Variables Coefficients t-statistics
C 2.9871 24.9430
AGY 0.0015 0.6869
EDU II -0.0076 -0.1177
EDU III 0.1830*** 2.9674
EDU IV 0.1392** 2.1148
EDU V 0.2417*** 3.1808
EDU VI 0.3282*** 3.9027
TRN 0.0562 1.3764
SEX 0.5626*** 12.0269
MRS 0.1095** 2.1450
FSP 0.0515 1.1436
HVAT 0.0000*** 6.6659
WHR 0.0032*** 2.8881
R2=0.5428 Adj. R
2 = 0.5252
F-statistics =30.9673 Size of sample =326
P-value = 0.0000
Note: Values are calculated by using the data collected from district Bahawalpur
***significant at 1% level
**significant at 5% level
*significant at 10% level
cclxxiv
8.2.2 Estimates of Earnings Functions of Participants in Urban
Informal Sector in District Multan
In this section, we present results of earnings determinants of the informal sector
participants in district Multan. The analysis is concluded with complete years of
education and with different levels of education.
The tables 8.5 and 8.6 indicate the results of earnings determinants of the informal
sector employed workers. Each table contains three columns that indicate explanatory
variables, coefficients and t-statistics. The relationship of explanatory variables is
checked by using simple Ordinary Least Square regression on monthly earnings of
participants of the urban informal sector.
It is theorized that age and earnings of workers in labour market are positively
correlated. Our findings confirm the theory. The study results show that there is a positive
relationship between age and income of those workers who are involved in the urban
informal sector. Findings indicate that the impact of additional year of age (AGY) on
earnings is highly significant at 1 percent. The result highlights that there is a positive
relationship between age and earnings returns of the workers in the urban informal sector
of district Multan. Old age participants of the urban informal sector have higher returns.
Human capital theory hypothesizes that better-educated workers are more
productive and carry out sophisticated jobs as compared to those workers who have less
formal training. Study results highlight that higher returns owe to seniority of the
participants. The coefficient of completed years of education (EDY) is highly significant
at 1 percent level of significance for workers in urban informal sector. Our findings are
consistent with results by Burki and Abbas (1991), Funkhouser (1996) and Sargana
(1998).
Results in table 8.6 indicate that all human capital variables are highly significant. The
effects of different education levels on earnings are described in table 8.6. The results
point out that returns to education for different levels are positive and highly significant
cclxxv
at 1 % and 5% level of significance for the informal sector workers in district Multan.
This trend indicates that earnings are positively associated with incremental educational
levels of the participants of urban informal sector. Earnings tend to increase as the level
of educational attainment increases. Our findings are similar with results by Sargana
(1998).
Human capital theory hypothesizes that earnings and training (TRN) are
positively correlated. Our findings confirm the theory. The coefficients of the variable
(TRN) are positive and significant at 5% level of significance. Findings support Burki
and Abbas‟s (1991), Burki and Ubaidullah‟s (1992) and Nasir‟s (1998) study results.
In table 8.5 and 8.6, the coefficients of sex are highly significant at 1 % percent
level of significance. Findings demonstrate that male gender earns higher returns in the
urban informal sector of district Multan.
It is expected that married persons (MRS) are more likely to work in order to
increase their earnings. However, the estimated coefficients of the variable marital status
are negative and statistically insignificant.
Whereas, the coefficients of family setup (FSP) are negative and insignificant.
Results indicate that joint family system causes lower earnings of the participants of the
urban informal sector. Results show that coefficients of the variable working hours
(WHR) are also positive and highly significant at 1 percent level of significance. Higher
earnings are the result of higher working hours of the workers involving into the urban
informal sector of district Multan. Our results are corroborated by Smith and Metzger
(1998) and Dasgupta (2003).
The study indicates that household‟s value of assets guides to lower earnings in
the labour market. However, our results demonstrate the positive and highly significant
coefficients of the variable household‟s value of assets (HVAT). An increase in value of
assets leads to higher earnings for the workers engaged in the urban informal sector of
cclxxvi
district Multan. The results reveal that returns of informal sector participants increase
with the increase in working hours and value of assets.
The findings conclude that education of the participants is an essential and strong
source of variation for earnings. The positive association of human capital varibles and
earnings confirm the hypothesis that human capital variables have good returns in urban
informal labour market. Overall, it can be concluded that all human capital variables and
other socio-economic variables such as sex, skill training, household‟s value of assets and
working hours are positive and significantly affect the earnings of the participants of the
informal sector in urban areas of district Multan.

cclxxvii
Table 8.5: Earnings Functions of Urban Informal Sector Participants in District
Multan
Variables Coefficients t-statistics
C 2.8975 30.8614
AGY 0.0080*** 4.2197
EDY 0.0287*** 5.8504
TRN 0.1066*** 2.8366
SEX 0.2953*** 7.1083
MRS -0.0697 -1.5557
FSP -0.0540 -1.4578
HVAT 0.0000*** 5.0658
WHR 0.0047*** 3.4551
R2 = 0.4826 Adj. R
2= 0.4695
F-statistics = 36.96 Size of Sample =326
P-value = 0.000
Note: Values are calculated using the data collected from district Multan
***significant at 1% level
**significant at 5% level
*significant at 10% level
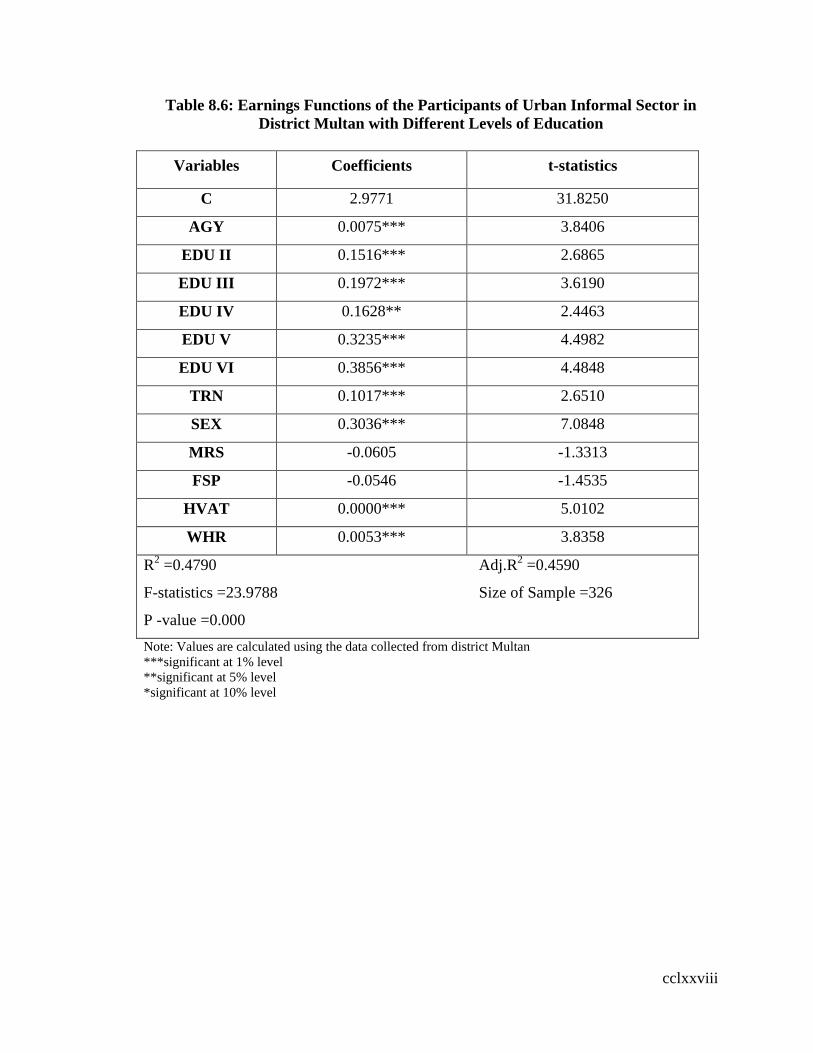
cclxxviii
Table 8.6: Earnings Functions of the Participants of Urban Informal Sector in
District Multan with Different Levels of Education
Variables Coefficients t-statistics
C 2.9771 31.8250
AGY 0.0075*** 3.8406
EDU II 0.1516*** 2.6865
EDU III 0.1972*** 3.6190
EDU IV 0.1628** 2.4463
EDU V 0.3235*** 4.4982
EDU VI 0.3856*** 4.4848
TRN 0.1017*** 2.6510
SEX 0.3036*** 7.0848
MRS -0.0605 -1.3313
FSP -0.0546 -1.4535
HVAT 0.0000*** 5.0102
WHR 0.0053*** 3.8358
R2 =0.4790 Adj.R
2 =0.4590
F-statistics =23.9788 Size of Sample =326
P -value =0.000
Note: Values are calculated using the data collected from district Multan
***significant at 1% level
**significant at 5% level
*significant at 10% level
cclxxix
8.2.3 Estimates of Earnings Functions of Participants in Urban Informal
Sector in District Dera Ghazi Khan
We show the earnings functions of participants in the urban informal sector in
district Dera Ghazi Khan in this section. We have used complete years of education and
different levels of education to see the influence on monthly earnings of the workers.
Tables 8.7 and 8.8 represent the results of earnings functions of informal sector workers.
Each table contains explanatory variables, coefficients and t-statistics. The study used
Ordinary Least Square regressions on the monthly earnings of the participants of the
urban informal sector. Results reveal that all human capital variables are highly
significant.
Age factor also determines the growth potential of earnings of urban informal
sector workers. Results highlight that the coefficients of age (AGY) are positive and have
insignificant influence on earnings of the urban informal sector participants in district
Dera Ghazi Khan.
Human capital theory argues that education and income of workers in labour
market are positively correlated. The study results also predict that income is an
increasing function of education. Education is an important investment in human capital
for development. The coefficient of complete years of education (EDY) is highly
significant at 1 percent level of significance in regression model I. Result suggests that
higher earnings are found to be positively associated with higher level of education. Our
findings support the results by Burki and Abbas (1991), Funkhouser (1996), and Sargana
(1998).
The effects of different education levels on earnings are described in Table 8.8.
Results in equation table 8.8 indicate that all human capital variables are highly
significant. The results reveal that returns to education for different levels are positive
and highly significant at 10 % while 1 % level of significance for those working in the
urban informal sector of district Dera Ghazi Khan. This shows that earnings are tended to

cclxxx
increase as the level of educational attainment increases. Our results are supported by
Funkhouser (1996) and Sargana (1998).
The results indicate that the coefficients of training skill are negative and are
statistically insignificant in both the regression equations.
The results point out that coefficients of sex (SEX) are highly significant at 1 %
percent level of significance in regression equations. Gender (SEX) has higher returns in
the urban informal sector of district Dera Ghazi Khan.
Furthermore, the estimated coefficients of dummy variable on the marital status
(MRS) are positive and insignificant for each additional married worker in both the
models. The results reveal that the coefficients of family setup variable (FSP) are found
to be positive and have insignificant influence on earnings of the participants of the urban
informal sector in regression models.
The working hours (WHR) is an increasing function of earnings of participants in
the urban informal sector. Results show that variable „working hours‟ has significantly
positive effects on earnings of the urban informal sector participants. The earnings
increase with the working hours as indicated by the positive and significant coefficients
at 5 percent level of significance. This study findings support the results by House
(1984), Smith and Metzger (1998) and Dasgupta (2003).
The household‟s value of assets (HVAT) is an increasing function of earnings in
the urban informal sector in both models. The study results conclude that coefficients of
household‟s value of assets are positive and have highly significant effect on earnings of
the workers. Findings demonstrate that there is a positive correlation between
household‟s value of assets and earnings of those working in urban informal sector.
The study results conclude that education of the participants is an essential and
strong source of variation for earnings. This positive association of education and
earnings confirm the hypothesis that education is investment that has good returns in
labour market. Overall, results conclude that all human capital variables and other socio
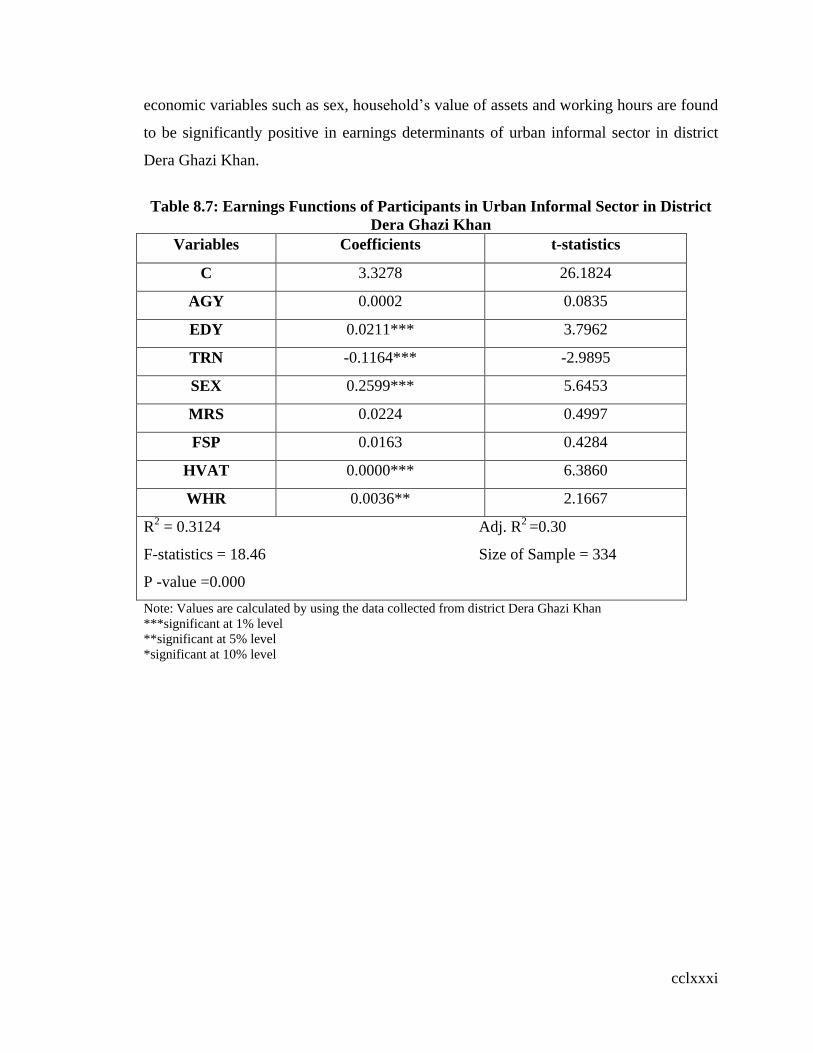
cclxxxi
economic variables such as sex, household‟s value of assets and working hours are found
to be significantly positive in earnings determinants of urban informal sector in district
Dera Ghazi Khan.
Table 8.7: Earnings Functions of Participants in Urban Informal Sector in District
Dera Ghazi Khan
Variables Coefficients t-statistics
C 3.3278 26.1824
AGY 0.0002 0.0835
EDY 0.0211*** 3.7962
TRN -0.1164*** -2.9895
SEX 0.2599*** 5.6453
MRS 0.0224 0.4997
FSP 0.0163 0.4284
HVAT 0.0000*** 6.3860
WHR 0.0036** 2.1667
R2 = 0.3124 Adj. R
2 =0.30
F-statistics = 18.46 Size of Sample = 334
P -value =0.000
Note: Values are calculated by using the data collected from district Dera Ghazi Khan
***significant at 1% level
**significant at 5% level
*significant at 10% level

cclxxxii
Table 8.8: Estimates of Earnings Functions of Participants of Urban Informal
Sector in District Dera Ghazi Khan with Different Levels of Education
Variables Coefficients t-statistics
C 3.3834 27.8714
AGY 0.0002 0.1084
EDU II 0.0974* 1.6829
EDU III 0.1468*** 2.6802
EDU IV 0.1915*** 2.6876
EDU V 0.2667*** 2.8282
EDU VI 0.5381*** 3.4263
TRN -0.1185*** -3.0410
SEX 0.2627*** 5.6987
MRS 0.0185 0.4113
FSP 0.0147 0.3857
HVAT 0.0000*** 6.4603
WHR 0.0036** 2.1393
R2 = 0.32 Adj. R
2= 0.2988
F-Statistics =12.82 Size of sample =334
P-value = 0.000
Note: Values are calculated by using the data collected from distric Dera Ghazi Khan
***significant at 1% level
**significant at 5% level
*significant at 10% level
cclxxxiii
8.3 Human Development and Urban Informal Sector
The informal sector reduces unemployment by creating more employment
opportunities and generating incomes. However, it it is essential to enhance more the
income and productivity of the informal sector workers.
The living standards of participants of urban informal sector examine the
association between them and poverty rests on human development perspective. The
United Nations Development Programme adopted human development approach in 1990
which basically argues that people are the real assets of a nation and thus the
development should center to expand their choices by creating “an enabling environment
to enjoy long, healthy, and creative lives”( see UNDP,1990). The approach then makes a
detailed view in order to define and develop the Human Development Index (HDI).
The definition of human development is very broad (see UNDP, 1990; Ranis and
Stewart, 1999; Suharto, 2002). The Human Development Index (HDI) is defined and
developed based on this approach. This idex goes to measure interrelated and unweighted
aspects of economic (e.g income), education (e.g literacy rate), health (e.g life
expectancy), and socio-political (e.g social participation, freedom of speech, multiparty
system) determinants of development in order to make cross-country comparisons.70
The measures mentioned above are narrowed empirically in order to explore the
informal sector‟s participants‟ level of trrhuman development. So, present research takes
into account the indicators of human development of workers (engaged in the urban
informal sector) that comprise economic, human and social capital. The participants of
the urban informal sector are categorized as “poor” or “not poor” depending on
economic, human and social capital.
In this study, we explain the economic, human and social capital of participants of
the urban informal sector in Souhern Punjab, Pakistan and separately in three districts
such as Bahawalpur, Multan and Dera Ghazi khan in Southern Punjab, Pakistan.
70 see Suharto (2002).
cclxxxiv
8.3.1 Development and Urban Informal Sector in Southern Punjab
In this section, we explain economic, human and social capital as indicators of
development of workers involved in the urban informal sector in Southern Punjab,
Pakistan.
8.3.1. I. Economic Capital and Urban Informal Sector
Economic capital consists of participants and households incomes. Household
income also shows a standard of living of inmates in the urban informal sector. We have
used poverty line to estimate the ability of informal sector workers in fulfilling basic
necessities and thus get close to the idea of absolute or extreme poverty. The participants
in the informal sector are classified as poor and non-poor. 1st group is classified as poor if
the monthly income is below the basic poverty line. 2nd
group is classified as non-poor
because they earn monthly higher than the poverty line. Here, monthly income of
workers and households‟ income are used to gauge the poverty line. The poverty and
informal employment are considerably associated by classifying it into two groups on the
basis of characterization of poverty line.
Group one: The poor workers are defined as those workers whose monthly
income is below poverty line of Rs.3750. They are poor as their income is below the
poverty line. Based on participant‟s income, 16.9 percent of workers in urban informal
sector are in this category in Southern Punjab. Based on households‟ income, 72.7
percent of the households are in this this category in Southern Punjab. They are poor as
their financial condition is below the poverty line.
Group two: The non-poor informal sector workers are are defined as those
workers whose monthly income is higher than Rs.3750. Depending on the criteria of
workers income, the number of participants is grouped as the „non-poor” workers having
percentage of 83.1 total specified population. The number of households is grouped as
the non-poor having percentage of 27.3.
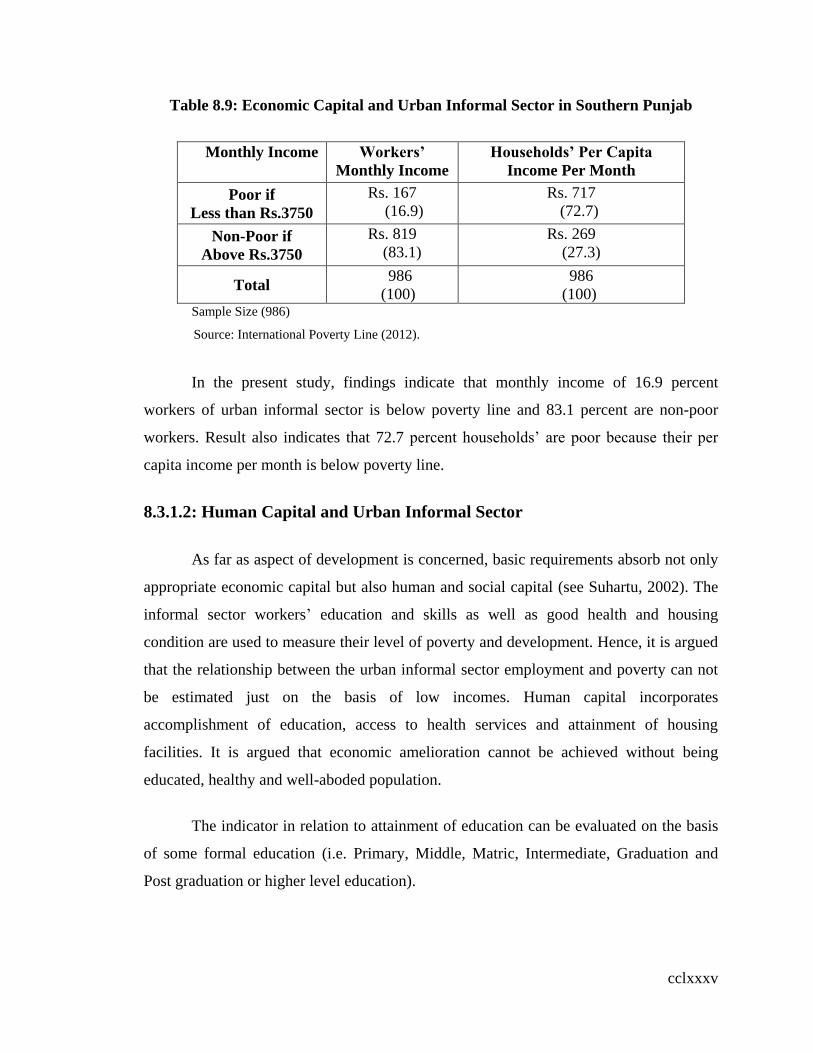
cclxxxv
Table 8.9: Economic Capital and Urban Informal Sector in Southern Punjab
Monthly Income Workers’
Monthly Income
Households’ Per Capita
Income Per Month
Poor if
Less than Rs.3750
Rs. 167
(16.9)
Rs. 717
(72.7)
Non-Poor if
Above Rs.3750
Rs. 819
(83.1)
Rs. 269
(27.3)
Total 986
(100)
986
(100) Sample Size (986)
Source: International Poverty Line (2012).
In the present study, findings indicate that monthly income of 16.9 percent
workers of urban informal sector is below poverty line and 83.1 percent are non-poor
workers. Result also indicates that 72.7 percent households‟ are poor because their per
capita income per month is below poverty line.
8.3.1.2: Human Capital and Urban Informal Sector
As far as aspect of development is concerned, basic requirements absorb not only
appropriate economic capital but also human and social capital (see Suhartu, 2002). The
informal sector workers‟ education and skills as well as good health and housing
condition are used to measure their level of poverty and development. Hence, it is argued
that the relationship between the urban informal sector employment and poverty can not
be estimated just on the basis of low incomes. Human capital incorporates
accomplishment of education, access to health services and attainment of housing
facilities. It is argued that economic amelioration cannot be achieved without being
educated, healthy and well-aboded population.
The indicator in relation to attainment of education can be evaluated on the basis
of some formal education (i.e. Primary, Middle, Matric, Intermediate, Graduation and
Post graduation or higher level education).
cclxxxvi
The indicators in terms of health accessibility can be measured by availing health
services or medical facilities. These facilities can be ranged between high quality
treatment to low quality treatment such as doctor, hospital, health centre, and others
(traditional healer or self-treatment). Higher utilization of these facilities signifies a high
living standard which in turn indicates development. The indicators about access to
health can be gauged by the utilization of health services or medical facilities.
Theoretically, high utilization of these medical facilities specifies the standardized access
to health facilities enabling participants to treat health-related problems at nominal cost of
medical treatment available or approachable there. This, therefore, decreases the inclines
to decrease life expectancy. In this way, higher level of utilization of these facilities
reveals high development (see Suhartu, 2002).
Another important aspect of human capital is availability of passable housing
facilities, such as clean water supply, toilet facilities with a septic tank, electricity, and a
constructed floor. These facilities are significant ingredients of human well-being. An
access to these facilities indicates high living standard and human development in the
urban informal sector of Southern Punjab.
In the present study, education, health and housing facilities have been taken into
account as essential human capital for further economic and social development of the
participants of the urban informal sector of Southern Punjab. The table highlights the
level of human capital of participants with respect to access to education, health services
and housing facilities. Generally, findings highlight that informal sector workers have
sufficient access to such human capital.
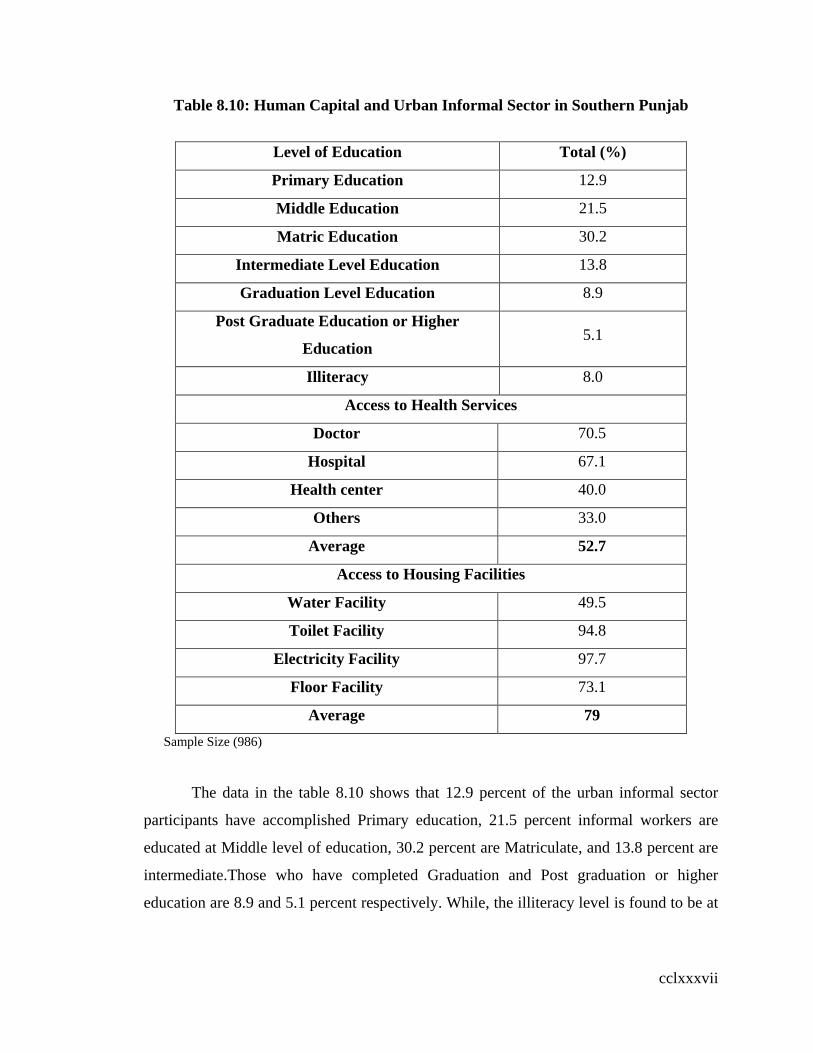
cclxxxvii
Table 8.10: Human Capital and Urban Informal Sector in Southern Punjab
Level of Education Total (%)
Primary Education 12.9
Middle Education 21.5
Matric Education 30.2
Intermediate Level Education 13.8
Graduation Level Education 8.9
Post Graduate Education or Higher
Education 5.1
Illiteracy 8.0
Access to Health Services
Doctor 70.5
Hospital 67.1
Health center 40.0
Others 33.0
Average 52.7
Access to Housing Facilities
Water Facility 49.5
Toilet Facility 94.8
Electricity Facility 97.7
Floor Facility 73.1
Average 79
Sample Size (986)
The data in the table 8.10 shows that 12.9 percent of the urban informal sector
participants have accomplished Primary education, 21.5 percent informal workers are
educated at Middle level of education, 30.2 percent are Matriculate, and 13.8 percent are
intermediate.Those who have completed Graduation and Post graduation or higher
education are 8.9 and 5.1 percent respectively. While, the illiteracy level is found to be at
cclxxxviii
8.0 percent among the participants of the urban informal sector in Southern Punjab.The
study results are corroborated by Suharto (2002).
It is concluded that the highest level of education attained ranges such as 30.2
percent for Matriculates, 21.5 percent for Middle level education and 13.8 percent for
higher secondary level education, 8.9 percent for Intermediate and 5.1 percent for
Master‟s level education or higher education for participants in urban informal sector in
Southern Punjab. Higher level education highlights the development of the workers who
are indebted in urban informal sector. Results are corroborated by Suharto (2002).
The data illustrates that 70.5 percent of the urban informal workers get medical
treatment from doctors when they suffer illness, 67.1 percent approach to hospital and 40
percent avail a health centre. The later indicates a miscellaneous option of procurement of
sickness from traditional healer or self medication (using medicine not prescribed by a
doctor). Those having self-medication imply 33.2 percent.
The study results demonstrate that the higher level of utilization of doctors and
hospitals shows higher human capital. Theoretically, high utilization of these medical
facilities reveals the optimal access of health facilities which enable people to cure
health-related illness in improved way. Results conclude that 52.7 percent of participants
of urban informal sector have availed health facilities in Southern Punjab. The results are
corroborated by Suharto (2002).
Another essential aspect of human capital is the availability of adequate housing
facilities, such as clean water supply, toilet facilities with a septic tank, electricity and a
constructed floor. These facilities are considerable starts of human well-being. Better
housing facilities decrease vulnerability to diseases (see Suhartu, 2002).
This study found that the proportion of informal workers‟ shelter is provided with
housing facilities showing inadequacy. The results estimate that overall 79 percent of the
informal sector participants‟ houses are furnished with each of the facilities mentioned
above. 49.5 percent informal sector workers have access to wholesome drinking water,
94.8 percent have access the toilet facility and 97.7 percent are electrified. There are still
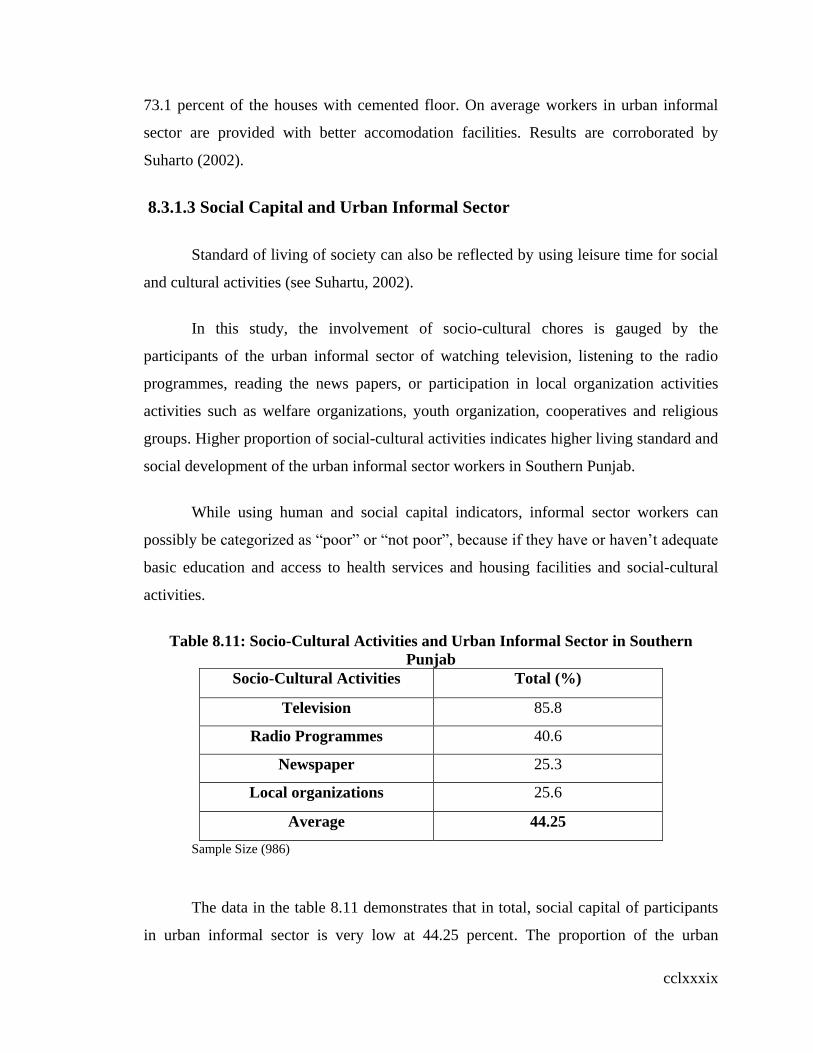
cclxxxix
73.1 percent of the houses with cemented floor. On average workers in urban informal
sector are provided with better accomodation facilities. Results are corroborated by
Suharto (2002).
8.3.1.3 Social Capital and Urban Informal Sector
Standard of living of society can also be reflected by using leisure time for social
and cultural activities (see Suhartu, 2002).
In this study, the involvement of socio-cultural chores is gauged by the
participants of the urban informal sector of watching television, listening to the radio
programmes, reading the news papers, or participation in local organization activities
activities such as welfare organizations, youth organization, cooperatives and religious
groups. Higher proportion of social-cultural activities indicates higher living standard and
social development of the urban informal sector workers in Southern Punjab.
While using human and social capital indicators, informal sector workers can
possibly be categorized as “poor” or “not poor”, because if they have or haven‟t adequate
basic education and access to health services and housing facilities and social-cultural
activities.
Table 8.11: Socio-Cultural Activities and Urban Informal Sector in Southern
Punjab
Socio-Cultural Activities Total (%)
Television 85.8
Radio Programmes 40.6
Newspaper 25.3
Local organizations 25.6
Average 44.25
Sample Size (986)
The data in the table 8.11 demonstrates that in total, social capital of participants
in urban informal sector is very low at 44.25 percent. The proportion of the urban

ccxc
informal sector participants having access to social cultural activities is relatively better.
The results found that 85.8 percent of the informal sector workers watch television, 40.6
percent listen to the radio programmes. Results make clear that 25.3 percent workers read
newspapers and 25.6 percent of them participate to the local organizations.
8.3.2 Development and Urban informal Sector in District
Bahawalpur
In this section, we describe the economic, human and social capital of participants
of the urban informal sector in district Bahawalpur.
8.3.2.1 Economic Capital and Urban Informal Sector
Using the survey data of district Bahawalpur, we measure the monthly income of
the workers involved in the urban informal sector. In order to gauge the relationship
between poverty and the urban informal sector employment, we categorize the
participants into two groups: poor and non-poor on the basis of characterization of
poverty line.
Group one: The poor workers are refered as those, who earn below Rs. 3750
monthly. They are poor because their income is below the poverty line. Based on
workers‟ income, 21.2 percent of the workers are found in this category. Based on
households‟ income, 67.2 percent of the households are found in this category.
Group two: The non-poor informal sector workers are defined as those, whose
monthly earnings are higher than Rs. 3750. The data indicates that “non-poor” workers
account for 78.8 percent of the total sampled population. Result also shows that non-poor
households account for 32.8 percent.
The study findings seem to show that 21.2 percent of workers in the urban
informal sector are living below poverty line in district Bahawalpur. It is also found that
67.2 percents of the households‟ are living below poverty line in Southern Punjab
Pakistan.

ccxci
Table 8.12: Economic Capital and Urban Informal Sector in District Bahawalpur
Monthly Income
Workers’
Income per
Month
Households’ Per
Capita Income Per
Month
Poor if
Less than Rs.3750
Rs. 69
(21.2)
Rs. 219
(67.2)
Non-Poor if
Above Rs.3750
Rs. 257
(78.8)
Rs. 107
(32.8)
Total 326
(100)
326
(100)
Smple Size (326)
Source: International Poverty Line (2012).
8.3.2.2 Human Capital and Urban Informal Sector
Education, health and housing have been taken as fundamental measures. These
facilities can be ranged between high quality treatment to low quality treatment such as
doctor, hospital, health centre, and others (traditional healer or self-treatment). Higher
utilization of these facilities signifies a high living standard which in return indicates
development. The indicators about access to health can be gauged by the utilization of
health services or medical facilities. The human capital of the participants can also be
measured by the availability of sufficient housing facilities, such as clean water supply,
toilet facilities with a septic tank, electricity, and a constructed floor. In this way, higher
level of utilization of these facilities denotes high development of those who contribute in
the urban informal sector.
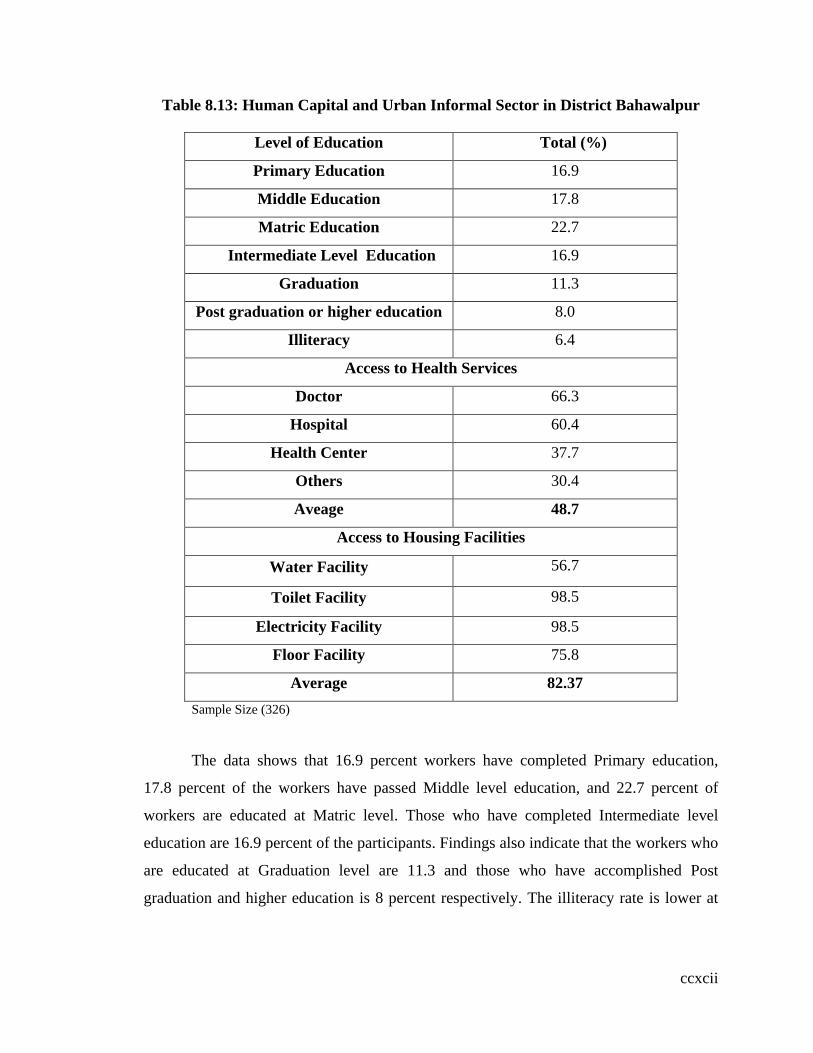
ccxcii
Table 8.13: Human Capital and Urban Informal Sector in District Bahawalpur
Level of Education Total (%)
Primary Education 16.9
Middle Education 17.8
Matric Education 22.7
Intermediate Level Education 16.9
Graduation 11.3
Post graduation or higher education 8.0
Illiteracy 6.4
Access to Health Services
Doctor 66.3
Hospital 60.4
Health Center 37.7
Others 30.4
Aveage 48.7
Access to Housing Facilities
Water Facility 56.7
Toilet Facility 98.5
Electricity Facility 98.5
Floor Facility 75.8
Average 82.37
Sample Size (326)
The data shows that 16.9 percent workers have completed Primary education,
17.8 percent of the workers have passed Middle level education, and 22.7 percent of
workers are educated at Matric level. Those who have completed Intermediate level
education are 16.9 percent of the participants. Findings also indicate that the workers who
are educated at Graduation level are 11.3 and those who have accomplished Post
graduation and higher education is 8 percent respectively. The illiteracy rate is lower at
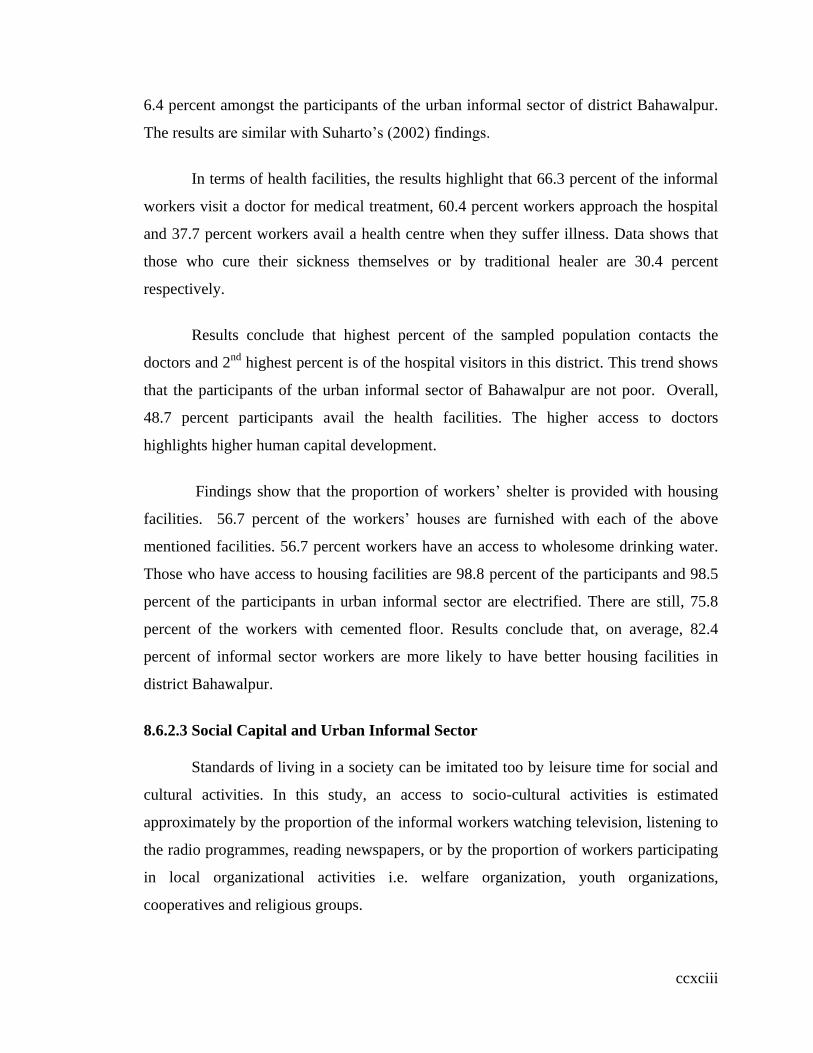
ccxciii
6.4 percent amongst the participants of the urban informal sector of district Bahawalpur.
The results are similar with Suharto‟s (2002) findings.
In terms of health facilities, the results highlight that 66.3 percent of the informal
workers visit a doctor for medical treatment, 60.4 percent workers approach the hospital
and 37.7 percent workers avail a health centre when they suffer illness. Data shows that
those who cure their sickness themselves or by traditional healer are 30.4 percent
respectively.
Results conclude that highest percent of the sampled population contacts the
doctors and 2nd
highest percent is of the hospital visitors in this district. This trend shows
that the participants of the urban informal sector of Bahawalpur are not poor. Overall,
48.7 percent participants avail the health facilities. The higher access to doctors
highlights higher human capital development.
Findings show that the proportion of workers‟ shelter is provided with housing
facilities. 56.7 percent of the workers‟ houses are furnished with each of the above
mentioned facilities. 56.7 percent workers have an access to wholesome drinking water.
Those who have access to housing facilities are 98.8 percent of the participants and 98.5
percent of the participants in urban informal sector are electrified. There are still, 75.8
percent of the workers with cemented floor. Results conclude that, on average, 82.4
percent of informal sector workers are more likely to have better housing facilities in
district Bahawalpur.
8.6.2.3 Social Capital and Urban Informal Sector
Standards of living in a society can be imitated too by leisure time for social and
cultural activities. In this study, an access to socio-cultural activities is estimated
approximately by the proportion of the informal workers watching television, listening to
the radio programmes, reading newspapers, or by the proportion of workers participating
in local organizational activities i.e. welfare organization, youth organizations,
cooperatives and religious groups.
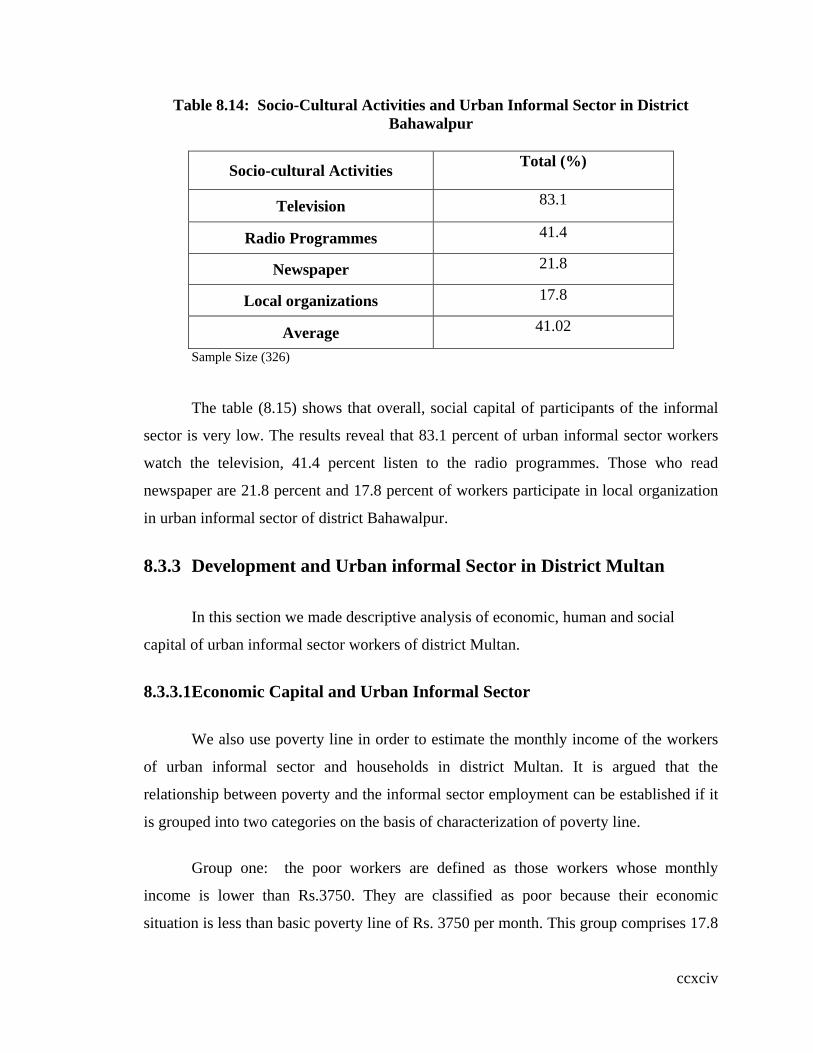
ccxciv
Table 8.14: Socio-Cultural Activities and Urban Informal Sector in District
Bahawalpur
Socio-cultural Activities Total (%)
Television 83.1
Radio Programmes 41.4
Newspaper 21.8
Local organizations 17.8
Average 41.02
Sample Size (326)
The table (8.15) shows that overall, social capital of participants of the informal
sector is very low. The results reveal that 83.1 percent of urban informal sector workers
watch the television, 41.4 percent listen to the radio programmes. Those who read
newspaper are 21.8 percent and 17.8 percent of workers participate in local organization
in urban informal sector of district Bahawalpur.
8.3.3 Development and Urban informal Sector in District Multan
In this section we made descriptive analysis of economic, human and social
capital of urban informal sector workers of district Multan.
8.3.3.1 Economic Capital and Urban Informal Sector
We also use poverty line in order to estimate the monthly income of the workers
of urban informal sector and households in district Multan. It is argued that the
relationship between poverty and the informal sector employment can be established if it
is grouped into two categories on the basis of characterization of poverty line.
Group one: the poor workers are defined as those workers whose monthly
income is lower than Rs.3750. They are classified as poor because their economic
situation is less than basic poverty line of Rs. 3750 per month. This group comprises 17.8

ccxcv
percent of the workers respectively. Result also indicates that 73.9 percent households are
poor in district Multan because their per capita income per month is below the poverty
line of Rs.3750.
Group two: The non-poor workers are defined as those workers whose monthly
earnings exceed Rs.3750. Based on participant‟s income “non-poor” participants are 82.2
percent of the total sampled population in district Multan. The non-poor households are
about 26.1 percent in district Multan.
Table 8.15: Economic Capital and Urban Informal Sector in District Multan
Monthly Income
Workers
Monthly
Income
Houesolds’ Per
Capita Income Per
Month
Poor if
Less than Rs.3750
Rs. 58
(17.8)
Rs. 241
(73.9)
Non-poor if
Above Rs.3750
Rs. 267
(82.2)
Rs. 85
(26.1)
Total 326
(100)
326
(100)
Sample Size (326)
Source: International Poverty Line (2012).
On the basis of such an official poverty line, it is concluded that 17.8 percent of
workers‟ monthly income is below the poverty line. It is also found that 73.9 percent of
the households‟ per capita income per month is below poverty line.
8.3.3.2: Human Capital and Urban Informal Sector
The level of education, health accessibility and housing facilities has been
considered as crucial human capital for economic and social development. The indicators
regarding attainment of education is evaluated on the basis of some formal education (i.e.
Primary, Middle, Matric, Intermediate, Graduation and Post graduation or higher
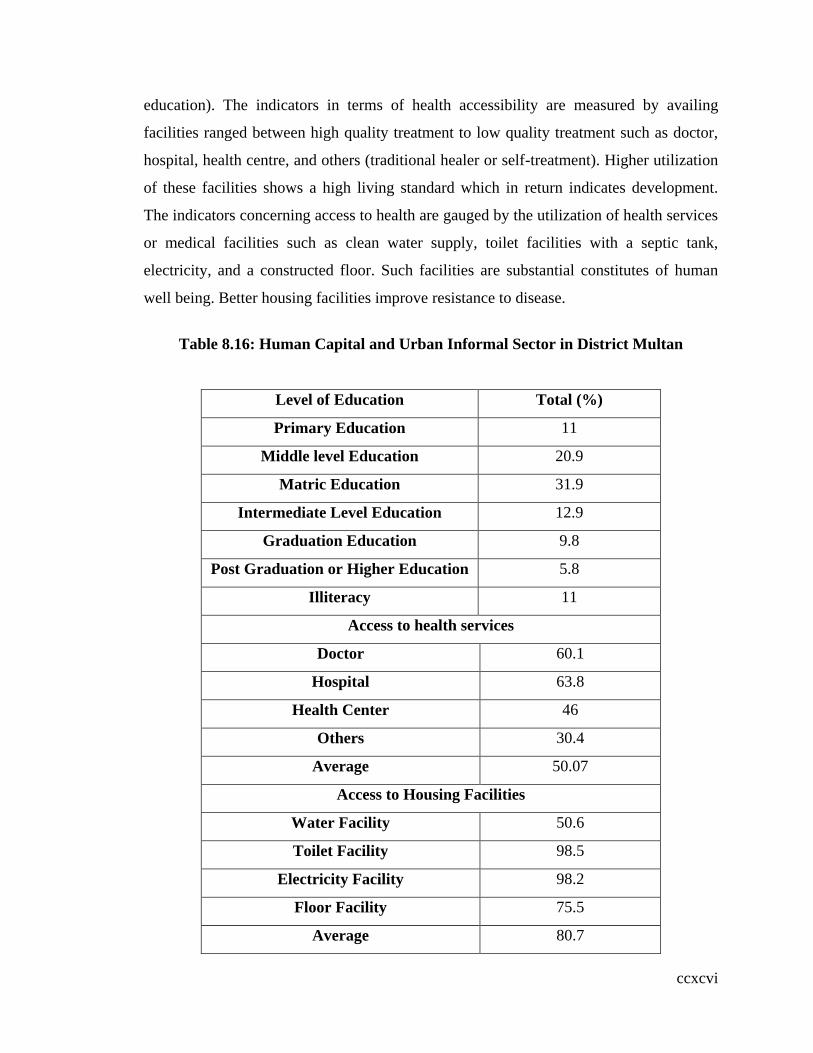
ccxcvi
education). The indicators in terms of health accessibility are measured by availing
facilities ranged between high quality treatment to low quality treatment such as doctor,
hospital, health centre, and others (traditional healer or self-treatment). Higher utilization
of these facilities shows a high living standard which in return indicates development.
The indicators concerning access to health are gauged by the utilization of health services
or medical facilities such as clean water supply, toilet facilities with a septic tank,
electricity, and a constructed floor. Such facilities are substantial constitutes of human
well being. Better housing facilities improve resistance to disease.
Table 8.16: Human Capital and Urban Informal Sector in District Multan
Level of Education Total (%)
Primary Education 11
Middle level Education 20.9
Matric Education 31.9
Intermediate Level Education 12.9
Graduation Education 9.8
Post Graduation or Higher Education 5.8
Illiteracy 11
Access to health services
Doctor 60.1
Hospital 63.8
Health Center 46
Others 30.4
Average 50.07
Access to Housing Facilities
Water Facility 50.6
Toilet Facility 98.5
Electricity Facility 98.2
Floor Facility 75.5
Average 80.7
ccxcvii
Sample Size (326)
The results illustrate that 11 percent of the workers have achieved Primary level
education, 20.9 percent informal workers have accomplished Middle level education, and
31.9 percent are Matriculate. 12.9 percent are Intermediate. It also indicates that
GraduateS and Post graduates or highly educated participants of urban informl sector are
9.8 and 5.8 percent correspondingly. 11 percent are illiterate among the participants of
the urban informal sector in district Multan.
Regarding access to health services, the findings show that 60.1 percent of the
workers get medical treatment from doctor in case of illness, 63.8 percent avail the
hospital and 46 percent approach a health centre. Those who prefer self treatment or
consult traditional healer are 30.4 percent. In the present study, higher utilization of
hospitals shows higher expenditures by the government on health.
Results reveal that the proportion of workers provided with housing facilities
appears to be adequate. Overall, 80.7 percent of the participants are provided with each of
these health-related facilities. 50 percent have access to wholesome drinking water, 98.5
percent have access to toilet facility, and 98.2 percent are electrified. There are still, 75.5
percent of the houses with cemented floor. On average, informal sector workers are more
likely to have better housing facilities in disrict Multan.
8.3.3.4 Social Capital and Urban Informal Sector
The leisure time for social and cultural activities can be used to gauge the living
standard of a society. We measure the access to socio-cultural activities approximately by
the participants watching television, listening to the radio programmes, reading
newspapers and by the proportion of workers participating in local organization activities
i.e. welfare organization, youth organizations, cooperatives and religious groups.
Table 8.17: Socio-Cultural Activities and Urban Informal Sector in District Multan
Socio-Cultural Activities Total (%)

ccxcviii
Television 81.9
Radio Programmes 44.5
Newspaper 27.3
Local Organizations 21.8
Average 43.9
Sample Size (986)
The result in table 8.17 shows that the social capital of participants of urban
informal sector is very low. The proportion of those workers who have availed socio-
cultural activities is relatively better. The results highlight that 81.9 percent informal
workers watch television, 44.5 percent listen to the radio programmes. Results also show
that 27.3 percent read newspapers and 21.8 percent of participants involve in local
organization in the urban informal sector of district Multan.
8.3.4 Development and Urban informal Sector in District Dera Ghazi
Khan
In this section we describe the economic, human and social capital involved in
urban informal sector of district Dera Ghazi Khan.
8.3.4.1 Economic Capital and Urban Informal Sector
Participants‟ and households‟ income is used to measure their living standard in
urban informal sector in district Dera Ghazi Khan. Poverty line is also used to measure
the economic capital of the urban informal sector participants. Here, monthly earnings of
urban informal sector workers and households‟ per capita income per month are used to
check the relationship between poverty and the urban informal sector employment. The
relationship between poverty and urban informal sector employment is adequaltly
established by grouping the participants into two groups.
Group one: The poor are regarded as those workers whose monthly income is
below Rs. 3750. They are poor because their monthly income is less than the poverty line

ccxcix
(Rs.3750). Based on participants‟ income, 11.9 percent of the informal sector workers are
poor. Result also indicates that 76.9 percent of the households are poor in district Dera
Ghazi Khan.
Group two: The non-poor informal sector workers are defined as those having
monthly income above poverty line of Rs. 3750. The “non-poor” workers are 88.1
percent of the total sampled population in district Dera Ghazi Khan. The “non-poor”
households are 23.1 percent in district Dera Ghazi Khan.
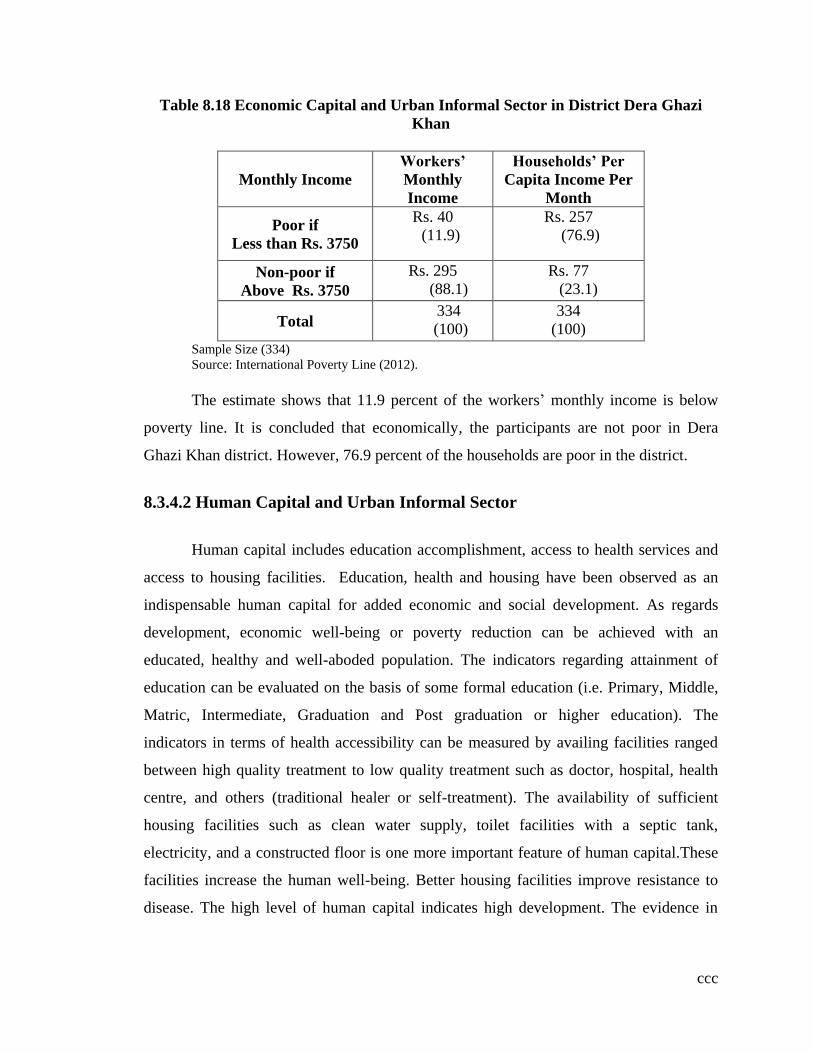
ccc
Table 8.18 Economic Capital and Urban Informal Sector in District Dera Ghazi
Khan
Monthly Income
Workers’
Monthly
Income
Households’ Per
Capita Income Per
Month
Poor if
Less than Rs. 3750
Rs. 40
(11.9)
Rs. 257
(76.9)
Non-poor if
Above Rs. 3750
Rs. 295
(88.1)
Rs. 77
(23.1)
Total 334
(100)
334
(100)
Sample Size (334)
Source: International Poverty Line (2012).
The estimate shows that 11.9 percent of the workers‟ monthly income is below
poverty line. It is concluded that economically, the participants are not poor in Dera
Ghazi Khan district. However, 76.9 percent of the households are poor in the district.
8.3.4.2 Human Capital and Urban Informal Sector
Human capital includes education accomplishment, access to health services and
access to housing facilities. Education, health and housing have been observed as an
indispensable human capital for added economic and social development. As regards
development, economic well-being or poverty reduction can be achieved with an
educated, healthy and well-aboded population. The indicators regarding attainment of
education can be evaluated on the basis of some formal education (i.e. Primary, Middle,
Matric, Intermediate, Graduation and Post graduation or higher education). The
indicators in terms of health accessibility can be measured by availing facilities ranged
between high quality treatment to low quality treatment such as doctor, hospital, health
centre, and others (traditional healer or self-treatment). The availability of sufficient
housing facilities such as clean water supply, toilet facilities with a septic tank,
electricity, and a constructed floor is one more important feature of human capital.These
facilities increase the human well-being. Better housing facilities improve resistance to
disease. The high level of human capital indicates high development. The evidence in

ccci
table shows that workers have an adequate access to such human capital in district Dera
Ghazi Khan.
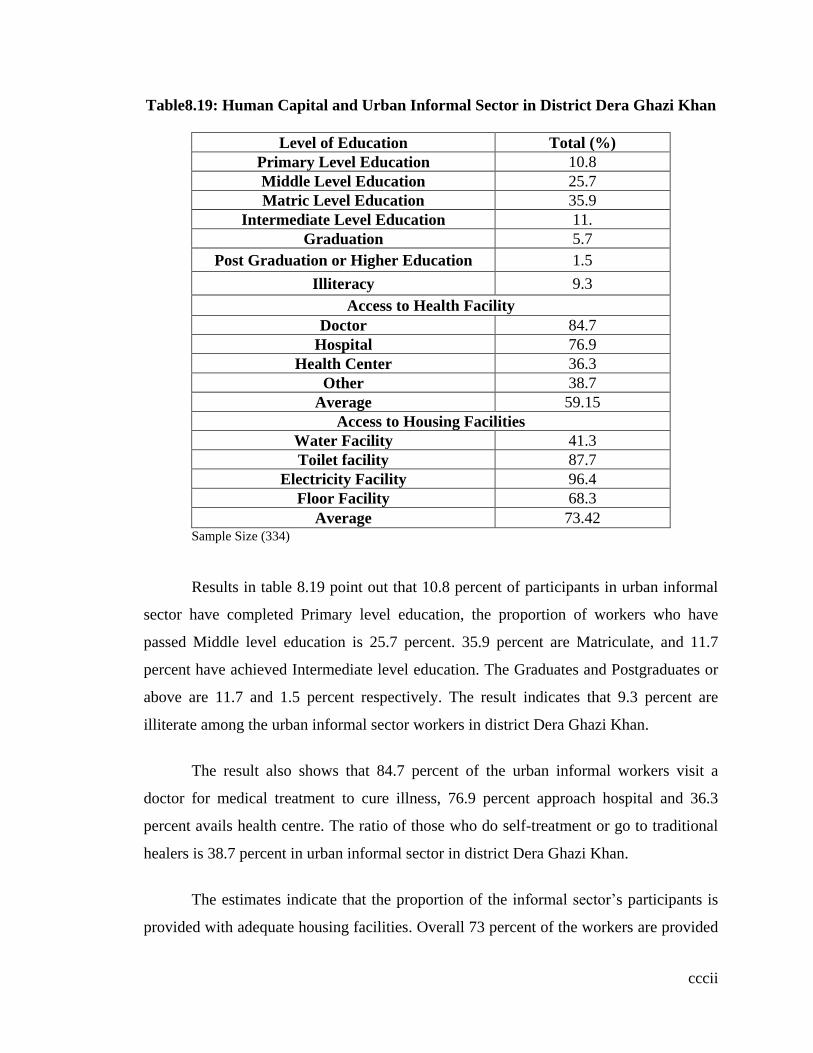
cccii
Table8.19: Human Capital and Urban Informal Sector in District Dera Ghazi Khan
Level of Education Total (%)
Primary Level Education 10.8
Middle Level Education 25.7
Matric Level Education 35.9
Intermediate Level Education 11.
Graduation 5.7
Post Graduation or Higher Education 1.5
Illiteracy 9.3
Access to Health Facility
Doctor 84.7
Hospital 76.9
Health Center 36.3
Other 38.7
Average 59.15
Access to Housing Facilities
Water Facility 41.3
Toilet facility 87.7
Electricity Facility 96.4
Floor Facility 68.3
Average 73.42 Sample Size (334)
Results in table 8.19 point out that 10.8 percent of participants in urban informal
sector have completed Primary level education, the proportion of workers who have
passed Middle level education is 25.7 percent. 35.9 percent are Matriculate, and 11.7
percent have achieved Intermediate level education. The Graduates and Postgraduates or
above are 11.7 and 1.5 percent respectively. The result indicates that 9.3 percent are
illiterate among the urban informal sector workers in district Dera Ghazi Khan.
The result also shows that 84.7 percent of the urban informal workers visit a
doctor for medical treatment to cure illness, 76.9 percent approach hospital and 36.3
percent avails health centre. The ratio of those who do self-treatment or go to traditional
healers is 38.7 percent in urban informal sector in district Dera Ghazi Khan.
The estimates indicate that the proportion of the informal sector‟s participants is
provided with adequate housing facilities. Overall 73 percent of the workers are provided

ccciii
with each of these facilities. 41.3 percent have access to wholesome drinking water, 87.7
percent have an access to toilet facility, and 96.4 percent are electrified and 68.3 percent
of the workers are furnished with constructed floor. On average, informal sector workers
are more likely to have better housing facilities.
8.3.4.4 Social Capital and Urban Informal Sector
Social capital covers access to social institutions as indicated by the participation
in socio-cultural activities. Standard of living of workers can also be revealed by using
their time for social and cultural activities.
Here, the access to socio-cultural activities is measured approximately by the
proportion of urban informal workers watching television, listening to the radio or radio
programmes, reading the news papers and participation in local organization activities.
Higher proportion of socio-cultural activities specifies high living standard and social
development of informal sector workers.
Table 8.20: Socio-Cultural Activities and Urban Informal Sector in District Dera
Ghazi Khan
Socio-cultural Activities Total (%)
Television 92.2
Radio Programmes 35.9
Newspaper 26.6
Local organizations 36.9
Average 47.9
Sample Size (334)
Table 8.20 illustrates that the social capital of participants of urban informal
sector is very low at 47.9 percent in Dera Ghazi Khazi Khan. The proportion of those
participating in the informal sector having access to social cultural activities is relatively
better. The estimates highlight that 92.2 percent informal sector participants watch the
television. The findings indicate that 35.9 percent workers listen to the radio
programmes, 26.6 percent read newspapers and 36.9 percent of them participate to the
local organizations.
ccciv
8.4 Concluding Remarks
Results regarding earnings determinants of total sample size and separately in
each division are also elaborated. In Southern Punjab, age of the informal sector workers
(AGY), complete years of education (EDY), sex (SEX), working hours (WHR) and
household‟s value of assets (HVAT) are found to be significantly positive factors in
determining the earnings of the informal sector workers. The returns to earnings from all
levels of education are also found to be positive and significant in the regression
equations.
Results of earnings determinants of the participants in the urban informal sector of
district Bahawalpur are also presented. The coefficients of complete years of education
(EDY), marital status (MRS), working hours (WHR) and household‟s value of assets
(HVAT) are found to be significant and increasing functions of earnings. The Matric
level education (EDU III), Intermediate level education (EDU IV), Graduation (EDUV)
and Master‟s or higher level education (EDU VI) valriables are found to be positively
significant.
The estimate indicates that the coefficients of complete years of age (AGY),
complete year of education (EDY), skill training (TRA), working hours (WHR) and
household‟s value of assets (HVAT) are observed to be significant and positive in
determining the earnings in Multan district. These variables are increasing functions of
earnings in the urban informal sector. The Matric level education (EDU III), Intermediate
level education (EDU IV), Graduation (EDU V) and Master‟s or higher level educations
(EDU VI) are positively significant. The results of all levels of education are positive and
significant. This indicates that earnings of participants of the urban informal sector
increase with increasing level of education.
In district Dera Ghazi Khan, coefficients of complete years of education (EDY),
sex of the workers (SEX), training facility (TRN), working hours (WHR) and
household‟s value of assets (HVAT) are statistically significant and positive. The Middle

cccv
level education (EDU II), Matric level education (EDU III), Intermediate level education
(EDU IV), Graduation (EDU V) and Master‟s or higher level education (EDU VI) makes
clear the positive significant effects. The results of all levels of education are positive and
significant. These variables are the increasing functions of informal workers‟ earnings.
In Southern Punjab, the group of poor workers is on average 16.9 percent and
83.11 percent of the sample consists of “non-poor” workers engaged in urban informal
sector. High economic capital shows development of the participants of the urban
informal sector. However, 72.7 percent of the households are living below poverty line in
Southern Punjab. An adequate level of human capital is observed among the informal
sector workers of Southern Punjab, Pakistan. On average, 52.7 percent of the workers
have access to health facilities and 79 percent of the workers have availed some housing
facilities. This higher utilization of human capital indicates high living standard of
employed in the urban informal sector. As regards social capital, 44.25 percent of the
workers are participating in socio-cultural activities in Southern Punjab. This low human
capital indicates low development regarding socio-cultural activities. Collectively,
development indicators show high development in urban informal sector of Southern
Punjab, Pakistan.
In district Bahawalpur, on average, the poor workers group is observed 21.2
percent and 78.8 percent of the sample comprises “non-poor” workers working in urban
informal sector. 67.2 percent housholds are poor in district Bahawalpur. An adequate
level of human capital is also observed among the informal sector workers. On average,
48.7 percent of the workers have access to health facilities and 82.37 percent of the
workers in the urban informal sector have availed some housing facilities in district
Bahawalpur. This higher utilization of human capital demonstrates high living standard
of the participants of the informal sector. In terms of social capital, 41.02 percent of the
workers are taking part in socio-cultural activities. This low social capital indicates low
development regarding socio-cultural activities. On the whole, economic, human and
social development indicators show development of the participants of urban informal
sector in district Bahawalpur.
cccvi
The estimates reveal that 17.8 percent of workers are observed poor, while 82.2
percent are “non-poor” in the urban informal sector of district Multan. The estimate
shows that 73.9 percent households are poor in district Multan. Among the urban
informal workers, an adequate level of human capital is also observed. On average, 50.7
percent of the workers have access to health facilities and 80.7 percent of the workers in
the urban informal sector of Multan have availed some housing facilities. This higher
utilization of human capital reveals high living standard of the participants of urban
informal sector. As far as social capital is concerned, 43.9 percent of the informal sector
participants are partaking in socio-cultural activities. This low social capital indicates low
development regarding socio-cultural activities. By and large, development indictors
refer to economic, human and social indicators show development of those who
contribute in the urban informal sector of Bahawalpur district.
Findings show that 11.9 percent of workers are observed to be poor in the urban
informal sector of district Dera Ghazi Khan. The proportion of “non-poor” is 88.1 percent
in the urban informal sector. The estimate indicates that 76.9 percent of the households
are included as poor in district Dera Ghazi Khan. The participants have an adequate level
of education in the urban informal sector. The participants of urban informal sector who
have access to health facilities are 59.15 percent of the sample and 73.49 percent of the
workers have availed housing facilities. The result indicates higher utilization of human
capital that reveals high living standard of the participants involved in the urban informal
sector. Results conclude that low social capital such as 47.9 percent among the informal
sector participants, which indicates low development in terms of socio-cultural activities.
The development indictors such as economic, human and social indicators show high
level of development in the urban informal sector of district Dera Ghazi Khan.

cccvii

cccviii
Chapter 9
GENDER EMPLOYMENT IN URBAN INFORMAL
SECTOR: A COMPARISON
9.1 Introduction
Informal sector essentially creates employment for participants of both genders
(i.e. males and females) in the labour market. In this chapter, we investigate the
determinants of urban informal sector employment for both (males and females) and
gender comparison in three divisions of Southern Punjab. Informal sector plays a pivotal
role in the development of Pakistan economy. The informal sector employment
essentially absorbs 73.8 percent of Pakistan‟s total labour force. In both rural (76.3
percent to 76.5 percent) and urban areas (from 70.4 percent to 71.2 percent) the
percentage of the informal sector participants has increased. The share of women is
disproportionally high in the urban informal sector employment in Pakistan economy
(Govt. of Pakistan Economic Survey, 2011-12).
Females are extensively increased in informal sector employment rather than male
workers in Southern Punjab, Pakistan. In the present chapter, we discuss the various
socio-economic and demographic factors that motivate the male and female workers to
participate and promote the growth potential of urban informal sector of Southern Punjab
The chapter is organized as: In section 9.2, we analyse gender employment in
urban informal sector and comparison by using econometric techniques in Southern
Punjab, Pakistan. In section 9.3, we estimate the urban informal sector employment of
both genders and make comparison in district Bahawalpur. The section 9.4 describes the
informal sector employment for both genders and comparison in district Multan. Section
9.5 elaborates urban informal sector employment of (both genders) and comparison in
district Dera Ghazi Khan. Finally, concluding remarks are presented in section 9.6.

cccix
9.2 Binary Logit Estimates of Determinants of Gender Employment and
Comparison in Urban Informal Sector in Southern Punjab
In this section, an analysis of the determinants of gender employment in urban
informal sector is shown in Southern Punjab, Pakistan. Howerever, we split the analysis
in three Districts (i.e. Bahawalpur, Multan and Dera Ghazi Khan) in next sections. The
study has used a binary logit model in order to analyze the determinants of gender
employment in the informal sector and comparison with complete years of education and
with different levels of education in urban areas of Southern Punjab.
Tables 9.1 and 9.2 give the logit estimates of the determinants of urban male and
female informal sector employment. The estimated parameters, their asymptotic z-
statistic and marginal effects for both male and for female workers are given in three
columns of the tables. The intercept terms in the urban informal sector employment
equation are positive and statistically insignificant in table 9.1 of male sample while it is
significant and negative in table 9.2. In female sample, the intercept terms are positively
significant. The marginal effect represents the effect of a unit change in each variable on
the probability of being employed in the urban informal sector employment relative to the
base category that is formal employment.
Age of the people motivates some of the factors influencing their decision of
participation towards urban informal labour market. Two views can be presented about
age of workers involved in the informal sector. Firstly, if the relative participation of
young people is greater in informal sector, the very sector may probably be considered as
a transition stage before opting formal sector. Secondly, informal sector may be
considered as a desirably constant choice if there is a large participation ratio of older
persons in the informal sector (see Kemal and Mehmood, 1993). Age of the workers is
used in completed years as an explanatory variable in the informal sector employment
models. Males‟ estimates show that the coefficients of complete years of age (AGY) are
found to be positive and have statistically significant influence on informal employment.
The probability of male workers being employed in the urban informal sector increases
by 0.5 percentage points due to one year increase of age of male worker. This owes to
cccx
that the formal sector can not absorb these male workers with low formal education and
ultimately they have to join an accessible urban informal sector employment in order to
earn their livelihood. The results conclude that mature male workers with low formal
education and high experience have a higher likelihood to determine the urban informal
sector employment in Southern Punjab.
Female informal sector employment is also affected by age. The coefficients of
the variable age (AGY) are again positive but the study results are statistically
insignificant. The positive marginal effects may indicate that almost females have to pay
relatively lessened child care and household responsibilities in old age and participate
more in the urban informal sector employment. This may also argue that young females
have the potential or spirit to involve more in economic activities especially in the formal
sector. The results conclude that male workers with increasing age easily persuade urban
informal sector employment in Southern Punjab.
Education is a critical input in economic development (Behrman, 1995).
Theoretically, education level of the labour market participants can play two different
roles. For instance, more educated workers tend to be more fertile as their education
serves as an impetus in enhancing their skills via training. On the other hand, low
education increases the probability of involvement in the informal sector. Results
highlight that education diminishes the probability of the urban informal sector
employment for both male and female samples. In model I of informal sector
employment, we have used complete years of education as an explanatory variable.
Between two models, the coefficient of years of education (EDY) is negative and highly
significant. The male and female workers are less likely to be employed in the informal
sector by 3.3 and about 4.6 percentage points respectively due to one year increase in
their education. The results indicate that probability of female workers being employed in
the informal sector comparatively falls at faster rate by 1.3 percentage points than the
male workers due to one year increase of education. We have observed in the analysis
that probability of female employment in informal sector declines at faster rate rather
than male participants. Economically, it can be justified that highly educated workers
especially females are inclined to urban formal labour market of Southern Punjab which

cccxi
is more lucrative and permanent source of income. This confirms similar findings by
Florez‟s (2003).

cccxii
In table 9.2 of male sample, education level of participants (EDY) is included as a
categorical variable with five categories (non-formal education is taken as base category)
to see its influence on the urban informal sector employment. Results highlight that the
coefficient of Middle level education (EDU II) is observed to be positive and statistically
significant. The probability of male workers being employed in the urban informal sector
of those with Middle level education (EDU II) is 4.5 percentage points more than the
non-formal education. The probability of male workers being employed in the informal
sector of those with Matric leve education is 9.6 percent more than the excluded catagory.
The reason can be that more male workers with initial basic education are engaged in the
urban informal sector. The coefficients of Intermediate (EDU IV), Graduation (EDU V)
and Master‟s or higher level education (EDU VI) are found to be negative and have
significant impact on males‟ urban informal sector employment. The economic
interpretation of this negative influence of education on the informal sector employment
can be that the high education of the male workers dissuades them to work in the urban
informal sector and they move towards profitable formal sector employment in Southern
Punjab.
Concerning females‟ employment, the coefficient of Matric level education (EDU
III) is negative but has insignificant effect on probability of employment in the urban
informal sector. The coefficients of Intermediate (EDU IV), Graduation (EDU V) and
Master‟s or higher education (EDU VI) for female workers are observed to be negative
and highly significant. Findings show that female workers with more (22.2 and 27.1)
percentage points are less likely to be involved in the informal sector as compred to male
workers. The results points out that participants especially females of Southern Punjab
are relatively less likely to join the urban informal sector having high level of education.
It can be justified that highly professional educated females have comparatively more
opportunities to get formal employment than less educated females. The results reflect
the classical theory of production and are also closely related with law of diminishing
returns. The level of education increases, the marginal informal sector employment falls.
The study results may relate to the expected role of the informal sector with low capital
accumulation.
cccxiii
The married male persons are more likely to be employed in the urban informal
sector comparatively unmarried male workers. The estimates reveal that marital status
(MRS) has also an effect on choice of sector of employment. The coefficients of marital
status (MRS) are found to be positive and have statistically insignificant impact on male
informal sector employment. Infact, male participants hardly accept informal
employment as it does not commensurate with their high level of education or quality
skill. Furthermore, mostly males are risk averser and are inclined to switch over the code
from the informal to formal labour market.
The female estimates in table 9.1 indicate a positive but insignificant impact on
their participation in the urban informal sector employment. The possible outcome of the
fact is that female workers are moving towards formal sector to earn better. However, the
coefficient of marital status is negative and has insignificant influence on female informal
sector employment in table 9.2. The reason can be that it is not easy for married female
workers to engage themselves in child care along with household responsibilities and
informal work involvement in Southern Punjab. Overall, marital status does not
significantly influence the informal sector employment.
The results indicate that the urban informal sector workers have less formal
training but have some kind of informal training. The coefficients of formal training
(FTD) for males are inverse and highly significant. The probability of being employed in
the urban informal sector decreases by about 22.3 and 22.2 percentage points
respectively. An increase of one unit in the formal training decreases the probability of
female workers being employed in informal sector by 26.8 and 29.5 percentage points
respectively. Results also trace out that there is a decrease of more 4.5 and 7.3 percentage
points in the probability of female workers engaged in the informal sector as compared to
male participants due to one unit increase in formal training. It also owes to those male
and female participants who possess formal training have a preference to stick to formal
labour market to explore their capabilities in a better way. It is concluded that higher the
formal training, lower the informal sector employment in Southern Punjab.
cccxiv
Family background of the people joining urban informal sector (i.e. father‟s
education and mother‟s education) helps in growth potential of urban informal sector in
Southern Punjab. Theoretically, it is predictable that the workers are less likely to
participate in the urban informal sector, whose parents are educated. The results of the
study confirm the hypothesis. In the current study, we have included two dichotomous
variables (i.e. educated father and educated mother) to observe the influence of parents‟
education on male as well as on female workers in the urban informal sector. In tables 9.1
and 9.2, the coefficients of father‟s education (FEDU) are negative and statistically
highly significant. The probability of male workers being employed in urban informal
sector shows a declining trend by about 14.3 and 14.8 percentage points respectively due
to one unit increase in father‟s education (FEDU).
It is also expected that the female workers whose parents are educated are less
likely to incline to the unskilled informal sector jobs. The study results are similar as
hypothesized. The coefficients of father‟s education for female workers are negative and
highly significant. One unit increase in father‟s education decreases the probability of
female informal workers by 17.5 and 18.3 percentage points respectively. Findings
indicate that female participation in the urban informal sector relatively drops more about
3.2 and 4.5 percent as compared to male workers in both models.
The coefficient of mother‟s education (MEDU) is negative and highly significan.
Male workers whose mothers are uneducated are less likely to be employed in the
informal sector by about 14.9 and 14.7 percentage points as compared to the formal
sector. The results also indicate that probability of informal sector employment
diminishes by 31.3 and about 33 percentage points for female informal sector workers
respectively in the urban informal sector employment in Southern Punjab.
There is high decrease of 16.4 and 18.3 percent in the probability of female
workers being employed in the informal sector from an educated mother. This can also be
the reason that the educated parents provide higher educational facilities and better career
counseling to their male and especially female children. In this society, educated parents
feel importance of female education more and the formal labour market is more secure
cccxv
and riskless for female absorption as compared to the urban informal sector. The findings
highlight that more female workers with increasing education of their parents are less
likely to participate in the urban informal sector of Southern Punjab.
Theoretically, two varying hypotheses can be formulated regarding the effect of
household size on the informal sector involvement. Firstly, it signifies the promotion of
informal sector due to manifold increase in labour supply. Secondly, the motive of
making the family financially sound compels the head of large household to opt urban
informal sector. The analyses highlight that the coefficients of household size variable
(HSIZ) are positive andstatistically significant. The probability of male workers
employed in urban informal sector increases by 5.5 and about 5.10 percentage points
respectively as a result of one additional member in the house (HSIZ). The male
participants with large household size are more likely to join the urban informal sector in
Southern Punjab. The economic reason being that male household heads have no choice
except to work more in urban informal sector.The study results conclude that the informal
sector employment increases with an increase of household size in urban areas of
Southern Punjab.
Contrarily, the coefficients of the variable household size (HSIZ) are negative.
However, the study results are statistically insignificant. The noticeable fact may also be
that the females have to look after the children and household responsibilities and they
have a less likeliness to engage in the urban informal sector with the responsibility of
large household size. Findings conclude that urban informal sector is a sector with
females having low household size.
The dependency ratio (DPNR) is another factor affecting the decision to work in
urban formal and informal sector employment. The coefficients of (DPNR) are positive
and highly significant for urban male informal sector employment. Results conclude that
dependency ratio is the main reason for male workers to persuade urban informal sector
in Southern Punjab. It can be accounted for that mostly male family heads assume the
responsibility themselves to prop up the family. In other cases, family members motivate

cccxvi
or force the male head to indulge into an employment in the urban informal sector which
is accessible according to their human capital.
Contrarily, the coefficients of dependency ratio (DPNR) for females are negative
and have insignificant effect on the urban informal sector employment in Southern
Punjab. It may be argued that females are less expected to contribute in the urban
informal sector due to more dependency burden of child care and household
responsibilities. However, female workers mange both the domestic work along with
informal sector works in Southern Punjab.
The results demonstrate that family setup (FSP) has a positive and insignificant
impact on males‟ participation in the urban informal sector. It can be justified that the
males living in joint family system do not work and prefer leisure and it is the strong
substitution effect which forces them. Another argument is that high family labour
supply or involvement in form of family helpers determines the employment in the urban
informal sector.
For female employment, joint family setup (FSP) is highly significant and affects
positively the decision of participation in the urban informal sector. The coefficients of
family setup (FSP) for females are positive and highly significant. The workers who
belong to joint family setup are more likely to be employed by about 30.5 and about 30.1
percentage points respectively as compared to the formal sector. The noteworthy fact is
that females living in joint family system have more extra working hours to carry out
informal activities because domestic issues are shared by other family members. Family
labour supply is also one of the determinants for this high participation. Consequently,
females are more likely to be employed in urban informal sector with joint family setup
in Southern Punjab.
The result points out that the coefficients of number of children (NCHL) variable
are negative. The results are statistically insignificant in both the equations. Theoretically,
the male workers, having more children, are less likely to participate in the urban
informal economic activities due to strong substitution effect of extra earnings of the

cccxvii
children. The phenomenon of child labour can also be the determinant of this decreasing
males‟ employment trend. Moreover, workers have to work in accessible informal sector
to fulfill children‟ requirements.
cccxviii
Results show that having children (NCHL) significantly increases the probability
of urban female informal sector employment. The probability of females‟ participation in
informal sector increases by about 7.9 and 8.0 percentages points respectively due to an
increase of one additional child in the family. Theory shows that the female workers
having more children participate less in the informal employment. However, the results
show that workers having children in the age group 6-14 particpate more in the urban
informal sector employment either because to fulfill their requirements and expenses or
mothers of the children pay comparatively lessened care to adult family members. Our
findings are similar with Funkhouser‟s (1996) study results.
Next variable is having male adolescents (NMAD). The participants are about 8.8
and 10.1 percentage points less likely to be engaged in the informal sector respectively
because of an addition of one male adolescent at home. The coefficients of male
adolescent are negative and highly significant. Results also indicate that the coefficients
of male adolescents are negative and statistically significant for female analysis. The
probability of female informal sector employment decreases by about 7.1 and 6.9
percentage points respectively by one additional male adolescent in the family.
However, probability of female informal sector employment is comparatively
lower by 1.8 and 3.2 percentage points due to an addition of one male adolescent or male
worker‟s participation decreases more by 1.8 and 3.2 percent due to an additional male
adolescent. This can be the reason that the male adolescents have more chances to find
out formal or informal sector employment to fulfill family needs to secure their future.
The male heads as well as especially mothers participate less in economic activities due
to a strong substitution effect of extra earnings of the male adolescents in the house. The
results conclude that male as well as female household heads are less likely to be engaged
in the urban informal sector with male adolescent in Southern Punjab.
The results highlight that male participants of informal sector are more likely to
be employed by about 6.9 and 6.0 percentage points respectively because of an addition
of one more female adolscent (NFAD) at home. The coefficients of female adolescent
variable are found to be positive. The results are highly significant in Southern Punjab.
cccxix
Likewise, the coefficients of female adolescents are positive and significant for urban
female informal sector employment in both equations. The probability of female workers
increases by about 16 percentage points respectively due to an increase of one female
adolescent at home. The probability of female participants of the informal sector
increases by 10.1 and 10 percentage points respectively more than male participants.
Results highlight that female adolescents are engaged less in market as well as the formal
sector employment due to socio-economic constraints. In this way, the participation rate
of urban male and female informal sector employment increases in order to contribute to
family expenses. The results conclude that workers participate more in economic
activities in the presence of female adolescents. Having more female adolescents is yet
another determinant which influences the parents‟ inclusion in the urban informal sector
and increases the growth potential of the urban informal sector employment in Southern
Punjab.
It has been noticed in male sample that the spouse participation (SPN) in
economic activities decreases the probability of working in the informal sector by 13.9
and 14.4 percentage points respectively due to one unit increase in spouse participation in
earning activity. The reason can be that the male workers allocate less time to work due
to the extra income earned by spouses.
Relativity of female spouse participation in economic activities (SPN), results
reveal that the spouse‟ participation in economic activities reduces the probability of
female urban informal employment. However, the results are insignificant.
The household‟s value of assets can also affect the choice to work or not to work
in the urban informal labour market. It is expected that an increase in value of assets may
decrease the participation in labour market. The study results confirm the hypothesis. It
has been observed that the coefficients of value of household‟s assets (HVAT) are
negative and statistically insignificant. Results also demonstrate that the coefficients of
value of assets (HVAT) for females are negative and significant at 5 percent level of
significance. The probability of female working in urban informal sector decreases with
an increase in (HVAT). The reason possibly exists that the female workers dissuade to
cccxx
work due to increase in unearned income. Another argument is that, illiteracy may be one
of the factors in this society for not investing those extra financial resources in side
business (in portfolio or otherwise) to have a back-up plan against rainy days.
The notion is that rural-urban migration (RMGT) also determines the probability
of participation in the urban informal sector in Southern Punjab. An increase of one rural-
urban worker increases the probability of male workers being employed in the informal
sector by 13.4 and 12.7 percentage points due to an addition of one rural-urban migrant
worker in urban areas of Southern Punjab. Female estimates show that the probability of
being employed in the urban informal sector increases by about 11.3 percentage points
due to one additional rural-urban migrant worker in the urban areas of Southern Punjab.
Our results reveal that there is a small increase of 2.1 and 2.4 percentage points in the
probability of males being employed in the informal sector due to an additional rural-
urban migrant as compared to female workers. The study results conclude that the
probability of participation in the urban informal sector is high in Southern Punjab,
Pakistan and the rural to urban migration increases rapidly due to rural urban wage
differential but the probability of getting employment opportunities in the formal sector is
low as compared to migration rate. Consequently, the workers especially males are lean
to work in the urban informal labour market rather than to work in the urban formal
sector. Results conclude that urban informal sector create more employment
opportunities for the rural-urban migrants with low education and indicates high
absorption and growth potential in Southern Punjab.

cccxxi
Table 9.1: Logit Estimates of Determinants of Gender Employment in Urban
Informal Sector in Southern Punjab. Probability of Informal Sector Employed (18-
64)
Male Female
Explanatory
Variables Coefficients Z-statistic
Marginal
Effects Coefficients Z-statistics
Marginal
Effects
CONSTANT 0.2603 0.4729 3.1290 3.5422
AGY 0.0213** 2.2992 0.0048 0.0043 0.3082 0.0010
EDY -0.1458*** -5.0741 -0.0332 -0.2016*** -5.3921 -0.0459
MRS -0.0201 -0.0899 -0.0046 0.0246 0.0744 0.0055
FTD -0.9782*** -4.8386 -0.2225 -1.1798*** -4.1246 -0.2684
FEDU -0.6271*** -3.4121 -0.1427 -0.7698*** -2.6307 -0.1751
MEDU -0.6544*** -3.4034 -0.1489 -1.3739*** -4.7526 -0.3126
HSIZ 0.2419*** 5.2913 0.0550 -0.0757 -1.2285 -0.0172
DPNR 0.7842** 2.0490 0.1784 -0.1140 -0.1832 -0.0259
FSP 0.0245 0.1338 0.0056 1.3416*** 4.7238 0.3052
NFAD 0.3018*** 3.4285 0.0687 0.7027*** 4.3610 0.1599
NMAD -0.3844*** -3.6324 -0.0875 -0.3114** -2.1271 -0.0708
NCHL -0.0245 -0.3864 -0.0056 0.3468*** 3.5111 0.0789
SPN -0.6120*** -3.2040 -0.1392 -0.2869 -1.0613 -0.0653
HVAT -0.0000 -0.7384 -0.0000 -0.0000** -2.1034 -0.0000
RMGT 0.5892*** 3.0316 0.1340 0.4962* 1.6632 0.1129
Sample Size (N) = 934 Sample Size (N)= 572
Log Liklihood = -433.3446 Logliklihood = -194.3233
LR Statistics (15df) = 335.2722 LR Statistis (15df) = 350.5357
Mcfadden R2 = 0.28 Mcfadden R
2 = 0.47
P-value = 0.000 P-value = 0.000
Source: Author estimated by using Eviews statistical software.
Note: The z- statistic is that of the associated coefficients from the logit model, where formal sector employment is
taken as base outcome. Non-formal education is taken as base category.
*** Significant at 1% level of Significance
** Significant at 5% level of Significance
* Significant at 10% level of Significance
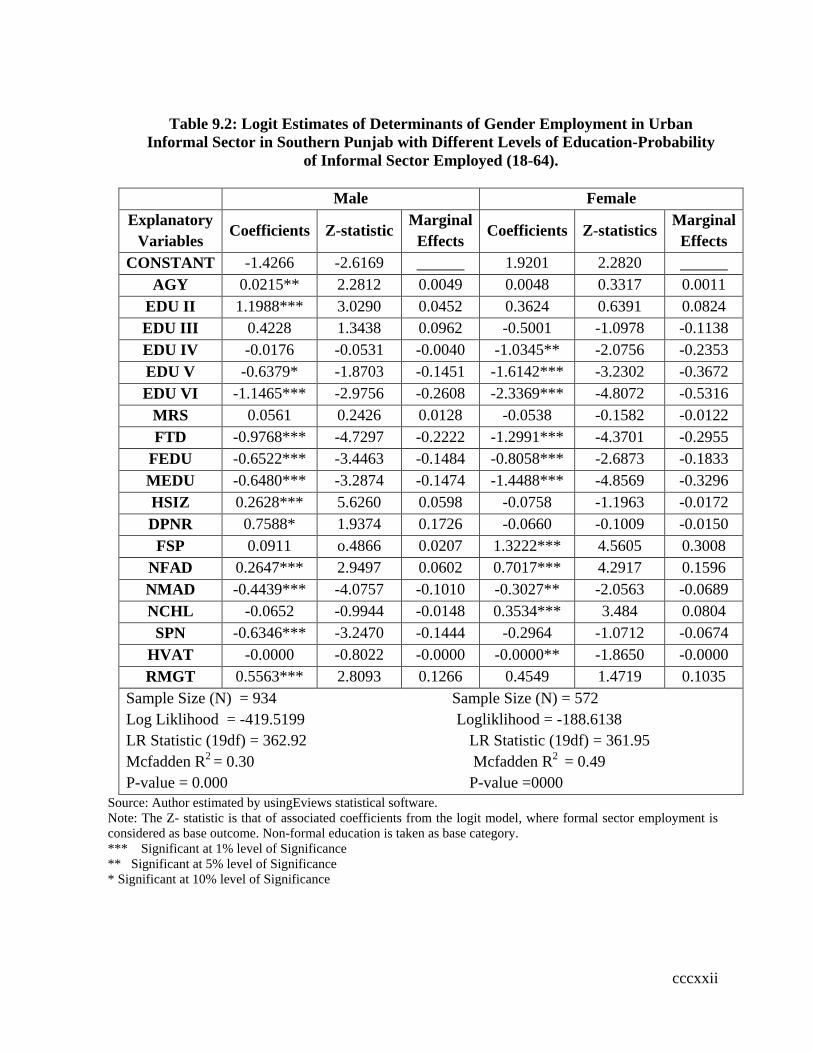
cccxxii
Table 9.2: Logit Estimates of Determinants of Gender Employment in Urban
Informal Sector in Southern Punjab with Different Levels of Education-Probability
of Informal Sector Employed (18-64).
Male Female
Explanatory
Variables Coefficients Z-statistic
Marginal
Effects Coefficients Z-statistics
Marginal
Effects
CONSTANT -1.4266 -2.6169 1.9201 2.2820
AGY 0.0215** 2.2812 0.0049 0.0048 0.3317 0.0011
EDU II 1.1988*** 3.0290 0.0452 0.3624 0.6391 0.0824
EDU III 0.4228 1.3438 0.0962 -0.5001 -1.0978 -0.1138
EDU IV -0.0176 -0.0531 -0.0040 -1.0345** -2.0756 -0.2353
EDU V -0.6379* -1.8703 -0.1451 -1.6142*** -3.2302 -0.3672
EDU VI -1.1465*** -2.9756 -0.2608 -2.3369*** -4.8072 -0.5316
MRS 0.0561 0.2426 0.0128 -0.0538 -0.1582 -0.0122
FTD -0.9768*** -4.7297 -0.2222 -1.2991*** -4.3701 -0.2955
FEDU -0.6522*** -3.4463 -0.1484 -0.8058*** -2.6873 -0.1833
MEDU -0.6480*** -3.2874 -0.1474 -1.4488*** -4.8569 -0.3296
HSIZ 0.2628*** 5.6260 0.0598 -0.0758 -1.1963 -0.0172
DPNR 0.7588* 1.9374 0.1726 -0.0660 -0.1009 -0.0150
FSP 0.0911 o.4866 0.0207 1.3222*** 4.5605 0.3008
NFAD 0.2647*** 2.9497 0.0602 0.7017*** 4.2917 0.1596
NMAD -0.4439*** -4.0757 -0.1010 -0.3027** -2.0563 -0.0689
NCHL -0.0652 -0.9944 -0.0148 0.3534*** 3.484 0.0804
SPN -0.6346*** -3.2470 -0.1444 -0.2964 -1.0712 -0.0674
HVAT -0.0000 -0.8022 -0.0000 -0.0000** -1.8650 -0.0000
RMGT 0.5563*** 2.8093 0.1266 0.4549 1.4719 0.1035
Sample Size (N) = 934 Sample Size (N) = 572
Log Liklihood = -419.5199 Logliklihood = -188.6138
LR Statistic (19df) = 362.92 LR Statistic (19df) = 361.95
Mcfadden R2 = 0.30 Mcfadden R
2 = 0.49
P-value = 0.000 P-value =0000
Source: Author estimated by usingEviews statistical software.
Note: The Z- statistic is that of associated coefficients from the logit model, where formal sector employment is
considered as base outcome. Non-formal education is taken as base category.
*** Significant at 1% level of Significance
** Significant at 5% level of Significance
* Significant at 10% level of Significance

cccxxiii
9.3 Binary Logit Estimates of Determinants of Gender Employment
and Comparison in Urban Informal Sector in
District Bahawalpur
In this section, we made an analysis of determinants of employment of both the
genders in comparison with respect to district Bahawalpur. The study utilizes the binary
logit model analysis. The impact of complete years of education as well as different
levels of education is checked on urban informal sector employment.
The logit estimates of the determinants of gender employment in the urban
informal sector are shown in the tables 9.3 and 9.4 with three sets of numbers such as
estimated parameters, their asymptotic z-statistic and marginal effects for both male and
female participants in both tables. The intercept term in the informal sector employment
equation is negative and statistically insignificant in model I while it is statistically
significant in model II. The very term is positively significant in both logit models of
female analysis. The marginal effects show the effect of a one unit change in each
variable on the probability of participation in the urban informal sector employment
relative to the base category of formal sector employment.
Two views can be presented about age of workers involved in the informal sector.
Firstly, if the relative participation of young people is greater in informal sector, the very
sector may probably be considered a transition stage before opting formal sector.
Secondly, the informal sector may be considered as a desirable constant choice if there is
a large participation ratio of older persons in the informal sector. Age of the people
motivates some of the factors influencing their decision to enter in the urban informal
sector. Age of household in complete years is used as an explanatory variable in both
analyses. The estimates show that the coefficients of complete years of age (AGY) for
male workers are positive and statistically insignificant. The analysis indicates that
persons having high education or human capital determine the formal sector employment
in district Bahawalpur.
cccxxiv
Concerning with female employment, age also influences the decision to enter
urban informal sector. The coefficients of age (AGY) for females‟ employment are
negative and found to be insignificant. The possible outcome of this fact is that females
hardly involve into the urban formal sector employment and almost young females with
quality education are forced to work in the urban informal sector employment due to
social constraints. The study results conclude that the urban informal sector is a sector
with low human capital accumulation in district Bahawalpur.
Education level of the participants in the labour market can play two different
roles. For instance, more educated workers tend to be more fertile as their education
serves as an impetus in enhancing their skill via training. On the other hand, low
education increases the probability of involvement in the urban informal sector.
Our study results highlight that education reduces the probability of being
inducted in the urban informal sector of district Bahawalpur. The results point out that the
coefficient of complete years of education (EDY) is negative and statistically
insignificant. The reason can be that male participants with low education are forced to
work in the informal sector of district Bahawalpur.
The study results specify that education steadily reduces the probability of
females being engaged in the informal sector. The coefficient of complete years of
education (EDY) for female employment is negative and highly significant. The
probability of female participants being inducted in the urban informal sector
employment falls by 4 percentage points due to an increase of one year of education. The
comparison between the genders points out that probability of 2.1 percent of female
participants of the informal sector drop which is more than the male workers in model I
due to one year increase in education of the worker. The possible reason may be that
highly educated female workers aspire for well-paid formal sector employment as
compared to male workers. The study results highlight that the informal sector absorbs
the low educated people in district Bahawalpur. Our results are consistent with Florez‟s
(2003) findings.
cccxxv
In table 9.4, education level of the participants (EDY) is incorporated as a
categorical variable with five categories (non-formal education is considered as base
category) to check the influence of education on urban informal sector employment. The
coefficient of Middle level education (EDU II) is positive and statistically insignificant.
While the coefficients of Matric level education (EDU III), Intermediate level education
(EDU IV), Graduation level education (EDUV) and Master‟s or higher level education
(EDU VI) are found to be negative. However, these results are insignificant. The
economic interpretation for this fact is that the workers with high education have more
opportunities to get formal sector employment and the informal sector involves workers
having basic education. The results are associated with the classical theory of production
and they have similarity with law of diminishing returns. The results indicate that as the
level of education increases, the marginal urban informal sector employment falls in
district Bahawalpur.
The females estimate indicates that the coefficient of Middle level education
(EDU II) is positive and insignificant. Results show that there is a negative impact of
Matric level education (EDUIII), Intermediate level education (EDUIV) but these results
are insignificant. However, coefficient of Graduation level education (EDUV) and
Master‟s level education (EDUVI) are found to be negative and statistically significant.
The probability of female workers being employed in informal sector with Graduation
and Master‟s level or high education is 34.6 and 40 percentage points less than the
excluded category. The economic interpretation of this negative influence of education on
informal sector employment can be that female workers with initial basic education
engage themselves in earning activities domestically or on pay in the informal sector in
Bahawalpur. The study results conclude that the informal sector absorbs the workers with
low capital accumulation.
Marital status (MRS) also affects the choice to work in labour market. The
married people are more likely to join the urban informal sector than rather unmarried
male workers. The coefficients of marital status (MRS) for male worker are positive and
statistically insignificant. Infact, workers move towards the the formal sector which is
more important source of earnings. The coefficient of marital status for female worker

cccxxvi
(MRS) is positive and statistically significant at 5 percent level of significance. The
positive marginal effect (ME) may signify that married females with basic education
easily attach to informal sector work with unfixed working hours and to fulfill productive
work and child care responsibility. Another argument is that some social and economic
constraints compel these females to work in urban informal sector.
The findings reveal that the coefficients of the formal training (FTD) for male
employment are found to be negative and highly significant. The male workers are being
employed in urban informal sector by 21.6 and 22.1 percentage points respectively due to
one unit increase in the formal training. Similarly, the coefficients of formal training
(FTD) for female participants are negative and highly significant. The female workers
with formal training are less likely to be employed in the informal sector by about 27.5
and 28.4 percent respectively as compared to the formal sector. The participants (male
and female) having degrees and formal diplomas are lean to formal labour market. Our
results point out that there is a high decrease of 5.9 and 6.3 percent points in the
probability of females‟ induction in the urban informal sector because of an addition of
one unit in formal training as compared to male workers. This negative influence
specifies that the formally trained workers especially females are really interested to get
the certain jobs done in a certain way from those people trained for the purpose in the
formal sector.
Parents‟ educational status also affects the decision to work in labour market. The
notion is that those workers whose parents are educated are less likely to partake into
urban informal sector employment. In the current study, we have included binary
variables to observe the influence of parent‟s education on the informal sector
employment. The coefficients of father‟s education (FEDU) for male workers are
negative and highly significant. The probability of males‟ being employed in the urban
informal sector diminishes by about 21.9 and 22.6 percentage points respectively due to
one unit increase in (FEDU). The fact is that whatever information parents especially
fathers get to know about brilliant careers, they enforce it upon their children considering
their interests. Hence, the probability of formal sector employment increases. For female

cccxxvii
sample, the coefficients of father‟s education (FEDU) are negative and statistically
insignificant.
cccxxviii
The analysis points out that the coefficients of mother‟s education (MEDU) for
male workers are also negative and statistically insignificant. For female analysis,
coefficients of mother‟s education (MEDU) are negative and have significant effects on
probability of being employed in the urban informal sector. The probability of female‟s
participation in urban informal sector decreases by 37.4 and 38.4 percentage points
respectively for one unit increase in mother‟s education. In this society, educated mothers
think about better career of their children and suggest that the formal sector employment
is more worthwhile as compared to the urban informal sector employment. Thus, higher
the parents‟ education, lower the male and female informal sector participation in district
Bahawalpur.
Theoretically, two varying hypotheses can be formulated regarding the effect of
household size on informal sector involvement. Firstly, it signifies the promotion of the
informal sector due to manifold increase in labour supply. Secondly, the motive of
making the family financially sound compels the head of large household to opt informal
sector. The results point out that the coefficients of household size (HSIZ) are positive
and have statistically significant effect on the urban informal sector employment. The
participation of male informal sector employed increases by 11 and 10.8 percentage
points respectively as a result of one additional worker in the house. The positive
marginal effects may indicate that large household size makes it obligatory for household
heads to work more in accessible urban informal sector to improve the overall living
standard of family. Hence, workers are forced to indulge in easily available employment
in the urban informal sector.
Household size is also important variable that determine the decision to
participate in the labour market. The results reveal that the coefficients of HSIZ are
negative and have statistically insignificant impact on females being employed in the
urban informal sector. Results conclude that male participants having large household
size are being employed more in urban informal sector.
Dependency ratio (DPNR) is another factor which influences the male workers‟
participation in the urban informal sector of district Bahawalpur. The coefficients of
cccxxix
dependency ratio (DPNR) for males‟ employment are found to be positive and
insignificant. The coefficient of dependency ratio (DPNR) for females‟ employment is
positive and insignificant in table 9.3, while, the coefficient of (DPNR) is negative and
insignificant for females‟ employment in table 9.4. The results may conclude that
dependency ratio has no influence on males and females urban informal sector
employment in district Bahawalpur.
In addition, family setup (FSP) variable has a positive and insignificant impact on
males‟ participation in the urban informal sector. However, an increase of one unit in
joint family setup increases the probability of females being incorporated in the urban
informal sector by about 22.6 and about 22 percentage points respectively. Our results
point out that those females who belong to joint family setup contribute more in the urban
informal sector to share family financial burden by involving in child care and productive
work at a same time. Consequently, the contribution of female workers in the urban
informal sector increases in district Bahawalpur.
Another variable i.e. number of children is also important in determining the
participation decision in the sector of employment. The results highlight that the number
of children (NCHL) are inversely associated with informal sector employment for male
workers. However, the study results are insignificant. Theoretically, the male workers
having more children do not participate more in informal economic activities due to
strong substitution effect of leisure. However, to fulfill their children‟s needs and
requirements, they have to work in the informal sctor. Results also indicate that
coefficients of number of children (6-14) variable are positive and insignificant.
Theoretically, female workers having more children of this age group work more in
informal economic activities to fulfill their requirements and expenses. Moreover, the
parents of these children pay comparatively lessened care to these children in the family.
However, some of the female workers with children in the house do not work in the
informal sector.
Results reveal that having male adolescents (NMAD) decreases the probability of
male participants in the informal sector employment by about 21.4 and 21.7 percentge
cccxxx
points. The coefficients of male adolescents are negative and statistically highly
significant. The possible outcome of the fact is that male adolescents increase household
income by working for pay in the formal and informal sector and male heads dissuade to
occupy in urban informal sector. It is the strong substitution effect, which forces the
parents to work due to extra money which is earned by their male adolescents. Results
point out that the coefficients of female adolescents (NFAD) are negative and
insignificant. The result indicates that informal employment for male decreases the
probability of being employed in the urban informal sector from an additional male
adolescent. The results conclude that both male and female participants participate less in
the urban informal sector in the presence of male adolescents.
Number of female adolescents (NFAD) also influences the decision to participate
in the urban informal sector in district Bahawalpur. The results highlight that male
workers employment in the urban informal sector increases by 12.5 and about 12.2
percentage points respectively because of one additional female adolescent at home. The
coefficients of number of female adolescents are positive and statistically significant in
the equation of male informal sector employment. The females with low education are
devoid of getting employment in the formal sector due to certain limitations. Another
argument is that they have to perform household responsibilities, so parents‟ especially
male heads are occupied there in accessible urban informal sector employment for their
better living standard. The coefficients of number of female adolescent variable (NFAD)
are positive and significant for female employment analysis. The probability of females‟
participation tends to increase by 20.3 and about 19.8 percentage points respectively
because of one additional female adolescent. The result makes clear that female
participants are 7.8 and 7.6 percent more inducted in urban informal sector in the
presence of female adolescents as compared to male workers. The reason of positive
partiality may be that female adolescents participants with low human capital cannot
access to formal sector employment and the female heads are forced to determine the
informal sector employment for their better living standard of female adolescents. Results
conclude that higher the female adolescents, the higher the probability of both genders in
the urban informal sector of district Bahawalpur.
cccxxxi
Spouse‟s participation (SPN) in economic activities has also an effect on the
urban informal sector employment. The male workers have less participation in informal
sector by 21.0 and about 20.7 percentage points respectively because of one unit increase
in spouse participation in earnings activities. While, females estimate reveal negative
influence of spouse‟s participation in economic activities. However, the results are found
to be insignificant. Our study results reveal that probability of males in informal
employment comparatively drops more likely than female informal sector employment
due to one unit increase in spouse participation in economic activities. The reason can be
that male workers‟ allocate less time to informal work due to strong income effect.
The coefficients of the household‟s value of assets (HVAT) are negative and
insignificant in males‟ employment analysis. Likewise, the coefficients of household‟s
value of assets (HVAT) are negative. The results are highly significant. An increase in
the value of assets diminishes the probability of females‟ induction in urban informal
sector employment. The reason possibly exists that the female workers due to the strong
substitution effect of not working and prefer leisure are less likely to involve in the urban
informal earnings activities with an increase in household‟s value of assets. Results show
that an increase in value of assets reduces the chances of females‟ participation in the
urban informal sector. It is argued that participants stop working on an increase in value
of financial assets. The reason can be that majority of females include poor households
whose life remains hand to mouth most of the time. This situation makes them habitual to
a non-progressive mentality. If they get enough financial resources, they temporarily stop
working to enjoy the benefits of those extra pennies. It may also be the reason that with
lack of basic education, they are reluctant to invest anymore.
The rural-urban migration (RMGT) is significant factor which has an influence on
sector of employment. Rural-urban migrant (RMGT) workers are occupied in the urban
informal sector. The coefficient of variable rural-urban migrant is positive and
statistically significant in male employment analysis. The probability of workers being
employed more in the informal sector increases by about 25 percentage points due to an
increase of one aditional rural-urban migrant worker as compared to formal sector
employed workers. The coefficients of migrant female informal sector workers are
cccxxxii
positive though the results are insignificant. The reason can be that migrant female
workers can find job in the formal sector. Findings indicate that urban informal sector
absorbs more male migrant workers as compared to female workers. Results conclude
that the urge of urban male informal employment to saturate the labour is high in district
Bahawalpur.
This is due to the fact that the male rural to urban migration increases due to rural-
urban wage differential but the probability of getting employment opportunities in formal
sector is low as compared to migration rate.
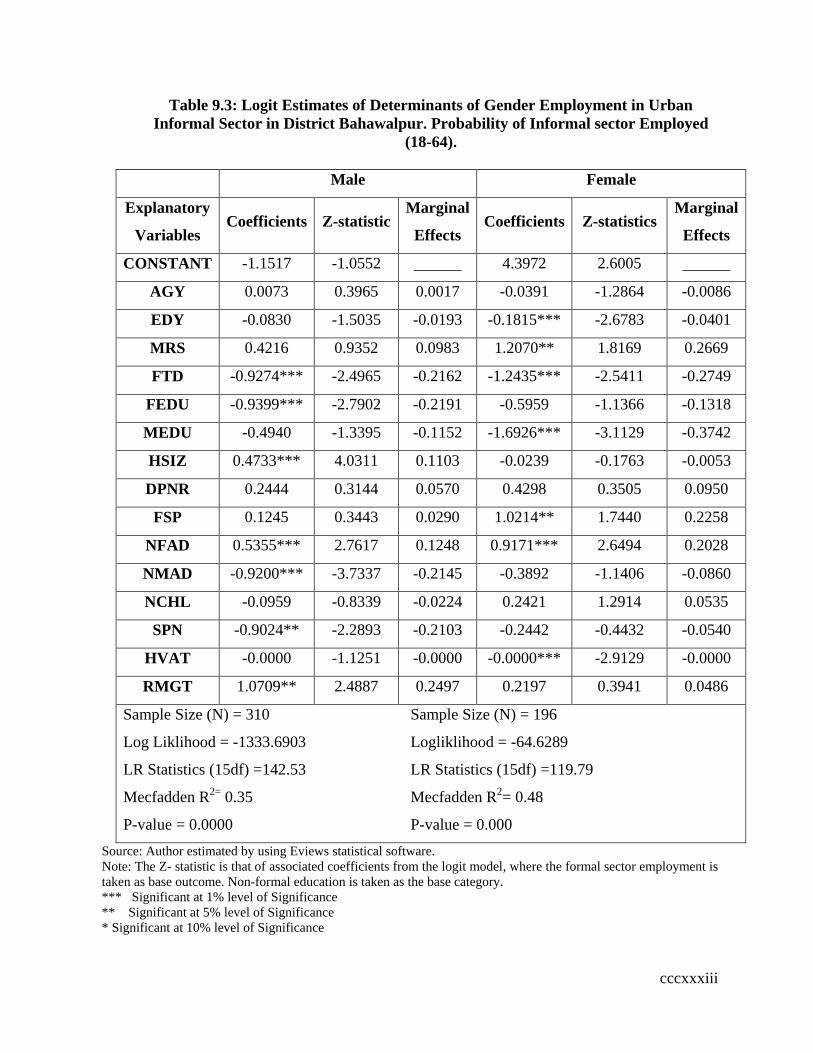
cccxxxiii
Table 9.3: Logit Estimates of Determinants of Gender Employment in Urban
Informal Sector in District Bahawalpur. Probability of Informal sector Employed
(18-64).
Male Female
Explanatory
Variables Coefficients Z-statistic
Marginal
Effects Coefficients Z-statistics
Marginal
Effects
CONSTANT -1.1517 -1.0552 4.3972 2.6005
AGY 0.0073 0.3965 0.0017 -0.0391 -1.2864 -0.0086
EDY -0.0830 -1.5035 -0.0193 -0.1815*** -2.6783 -0.0401
MRS 0.4216 0.9352 0.0983 1.2070** 1.8169 0.2669
FTD -0.9274*** -2.4965 -0.2162 -1.2435*** -2.5411 -0.2749
FEDU -0.9399*** -2.7902 -0.2191 -0.5959 -1.1366 -0.1318
MEDU -0.4940 -1.3395 -0.1152 -1.6926*** -3.1129 -0.3742
HSIZ 0.4733*** 4.0311 0.1103 -0.0239 -0.1763 -0.0053
DPNR 0.2444 0.3144 0.0570 0.4298 0.3505 0.0950
FSP 0.1245 0.3443 0.0290 1.0214** 1.7440 0.2258
NFAD 0.5355*** 2.7617 0.1248 0.9171*** 2.6494 0.2028
NMAD -0.9200*** -3.7337 -0.2145 -0.3892 -1.1406 -0.0860
NCHL -0.0959 -0.8339 -0.0224 0.2421 1.2914 0.0535
SPN -0.9024** -2.2893 -0.2103 -0.2442 -0.4432 -0.0540
HVAT -0.0000 -1.1251 -0.0000 -0.0000*** -2.9129 -0.0000
RMGT 1.0709** 2.4887 0.2497 0.2197 0.3941 0.0486
Sample Size (N) = 310 Sample Size (N) = 196
Log Liklihood = -1333.6903 Logliklihood = -64.6289
LR Statistics (15df) =142.53 LR Statistics (15df) =119.79
Mecfadden R2=
0.35 Mecfadden R2= 0.48
P-value = 0.0000 P-value = 0.000
Source: Author estimated by using Eviews statistical software.
Note: The Z- statistic is that of associated coefficients from the logit model, where the formal sector employment is
taken as base outcome. Non-formal education is taken as the base category.
*** Significant at 1% level of Significance
** Significant at 5% level of Significance
* Significant at 10% level of Significance
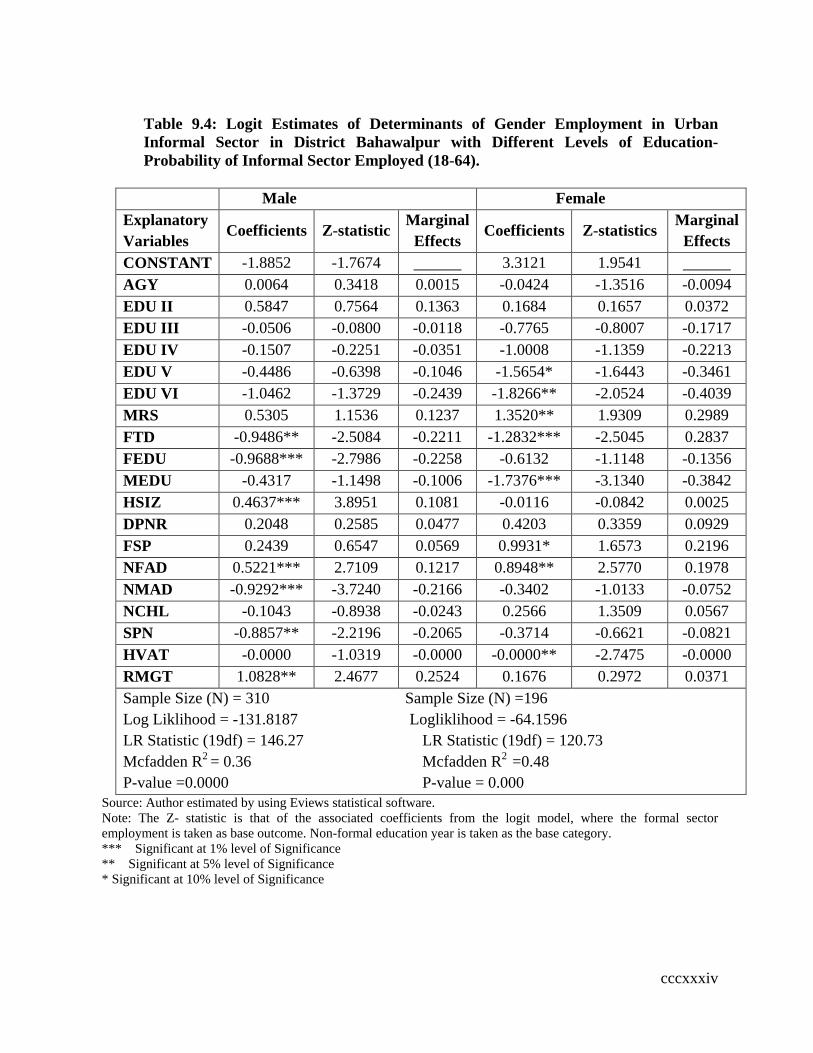
cccxxxiv
Table 9.4: Logit Estimates of Determinants of Gender Employment in Urban
Informal Sector in District Bahawalpur with Different Levels of Education-
Probability of Informal Sector Employed (18-64).
Male Female
Explanatory
Variables Coefficients Z-statistic
Marginal
Effects Coefficients Z-statistics
Marginal
Effects
CONSTANT -1.8852 -1.7674 3.3121 1.9541
AGY 0.0064 0.3418 0.0015 -0.0424 -1.3516 -0.0094
EDU II 0.5847 0.7564 0.1363 0.1684 0.1657 0.0372
EDU III -0.0506 -0.0800 -0.0118 -0.7765 -0.8007 -0.1717
EDU IV -0.1507 -0.2251 -0.0351 -1.0008 -1.1359 -0.2213
EDU V -0.4486 -0.6398 -0.1046 -1.5654* -1.6443 -0.3461
EDU VI -1.0462 -1.3729 -0.2439 -1.8266** -2.0524 -0.4039
MRS 0.5305 1.1536 0.1237 1.3520** 1.9309 0.2989
FTD -0.9486** -2.5084 -0.2211 -1.2832*** -2.5045 0.2837
FEDU -0.9688*** -2.7986 -0.2258 -0.6132 -1.1148 -0.1356
MEDU -0.4317 -1.1498 -0.1006 -1.7376*** -3.1340 -0.3842
HSIZ 0.4637*** 3.8951 0.1081 -0.0116 -0.0842 0.0025
DPNR 0.2048 0.2585 0.0477 0.4203 0.3359 0.0929
FSP 0.2439 0.6547 0.0569 0.9931* 1.6573 0.2196
NFAD 0.5221*** 2.7109 0.1217 0.8948** 2.5770 0.1978
NMAD -0.9292*** -3.7240 -0.2166 -0.3402 -1.0133 -0.0752
NCHL -0.1043 -0.8938 -0.0243 0.2566 1.3509 0.0567
SPN -0.8857** -2.2196 -0.2065 -0.3714 -0.6621 -0.0821
HVAT -0.0000 -1.0319 -0.0000 -0.0000** -2.7475 -0.0000
RMGT 1.0828** 2.4677 0.2524 0.1676 0.2972 0.0371
Sample Size (N) = 310 Sample Size (N) =196
Log Liklihood = -131.8187 Logliklihood = -64.1596
LR Statistic (19df) = 146.27 LR Statistic (19df) = 120.73
Mcfadden R2 = 0.36 Mcfadden R
2 =0.48
P-value =0.0000 P-value = 0.000
Source: Author estimated by using Eviews statistical software.
Note: The Z- statistic is that of the associated coefficients from the logit model, where the formal sector
employment is taken as base outcome. Non-formal education year is taken as the base category.
*** Significant at 1% level of Significance
** Significant at 5% level of Significance
* Significant at 10% level of Significance

cccxxxv
9.4 Binary Logit Estimates of Determinants of Gender Employment
and Comparison in Urban Informal Sector in District
Multan
In this section, an analysis of determinants of gender employment in the urban informal
sector and comparison is examined in district Multan with complete years of education.
The impact of different education levels on gender employment in the urban informal
sector is also estimated in district Multan. Here, a binary logit model is used to evaluate
the determinants of gender employment in the urban informal sector and comparison
regarding different levels of education in district Multan.
Tables 9.5 and 9.6 give the binary logit estimates of determinants of gender
employment in the urban informal sector and comparison with three sets of numbers as
estimated parameters, their asymptotic z-statistic and marginal effects for male as well as
for female analysis. The intercept terms are positive and statistically significant in tables
9.5 and 9.6 in male analysis while it is positively significant in females‟ employment in
table 9.5 and insignificant in table 9.6. The marginal effects indicate the effect of a unit
change in each variable on the probability of participation in the urban informal sector
employment relative to the base category of formal sector employment.
Age of the participants of labour market influences their decision. Two views can
be presented about age of workers involved in the urban informal sector. Firstly, if the
relative participation of young people is greater in the informal sector, the very sector
may probably be considered a transition stage before opting formal sector. Secondly,
informal sector may be considered as a desirable constant choice if there is a large
participation ratio of older persons in urban informal sector. We have used complete
years of age as an explanatory variable in informal sector employment model for both
male and female workers in district Multan. The coefficients of variable age (AGY) are
positive and statistically significant. The probability of male workers being engaged in
the informal employment increases by 0.8 and about 1 percentage points for one year

cccxxxvi
increase of age of the informal sector worker. The reason can be that people enter into
urban informal sector at early age and stay there
for long time period in district Multan. The lack of higher education for formal sector job
is one of the reasons for relatively increased employment in urban informal sector of
district Multan.
Resutls found that the coefficients of complete years of age (AGY) for female
employment are observed to be positive and statistically insignificant. The positive
marginal effects draw attention to that probability of female participants being employed
in the urban informal sector increases. It is because that the female workers in their old
age have low dependency of household responsibilities. Furthermore, lack of higher
education compels these females to occupy the urban informal sector. Overall, it is
concluded that female workers with high education are moving towards the urban formal
sector which is very important and lucrative source of earnings in district Multan.
Another factor “education” is an important one as it makes a way to enter into
sector of employment. We have used complete years of education as an explanatory
variable for the urban informal sector employment in table 9.5. For males‟ employment
analysis, the coefficient of complete years of education (EDY) seems to be negative and
statistically significant. The probability of male workers being employed in the informal
sector falls by 3.3 percentage points as a result of one year increase in education of the
worker. The possible outcome of the fact is that male workers having high education
prefer to work in the formal sector.
For females estimate, it is observed that education reduces the probability of
informal sector employment. The result indicates that coefficient of the complete years of
education (EDY) is negative and highly significant. One year increase in education
reduces the probability of females working in urban informal sector by 6.6 percentage
points. Our results indicate that probability of females‟ employment in urban informal
sector drops by 3.3 percent at faster rate than male workers due to one year increase in
education. Results possibly conclude that labourious and diligent females with high

cccxxxvii
education enter into more profitable formal labour market in district Multan. The similar
results are found in Florez‟s (2003) study findings.

cccxxxviii
In table 9.6 of the informal sector employment, education level of workers (EDY)
is included as a categorical variable with five categories (non-formal education as a base
category) in order to check the relationship between education levels and informal sector
employment. The results highlight that the coefficients of Middle level education (EDU
II) and Matric level education (EDU III) for males‟ employment are significantly
positive. The reason of this positive impact is that male workers with basic education
seek refuge in urban informal sector. The coefficient of Intermediate level education
(EDU IV) is positive but the result is statistically insignificant. While the coefficients of
Graduation level education (EDU V) and Master‟s or higher level education (EDU VI) is
found to be negative and insignificant. The economic interpretation of this negative
influence of higher education level on informal sector employment can be that the male
participants of labour market are switching over the code from the informal to the formal
sector due to rising high level education. Since this sector is viewed as permanent and
secure source of living.
Concerning female employment, the coefficient of Middle level education (EDU
II) is found to be positive. However, the result is insignificant. The result points out that
the negative impact of Matric level (EDU III) education and Intermediate level education
(EDU IV) are insignificant. While the coefficients of Graduation level education (EDU
V) and Master‟s or higher level education (EDU VI) are negative and statistically
significant. The probability of being employed in the informal sector of those with
Graduation and Master‟s level education decreases by about 42.4 and 60.7 percentage
points respectively as compared to the non-formal education. Furthermore, females‟
incorporation with high education increases the formal sector employment. Females are
reluctant to employ themselves in the urban informal sector due to lack of economic and
social capital. The study results may relate to the expected role of informal sector with
low capital accumulation.
Marital status (MRS) is an important factor which affects the participation
decision in labour market. The analyses shows that married male workers are less likely
to join the urban informal sector as compared to unmarried male workers. The
coefficients of marital status (MRS) are negative and statistically insignificant. It can be
cccxxxix
argued that married are working in the informal sector to fulfill their basic needs and to
make the family financially sound in district Multan.
The results point out that the coefficients of marital status (MRS) for female
workers are negative. The probability of female participants in informal sector decreases
by 24.2 percentage point respectively in table 9.6 in result of an increase of one married
female worker. The evidence reveals that married females are comparatively 10.3 percent
more employed in the urban informal sector of district Multan. The possible outcome of
the fact is that working in the urban informal sector is thought to be risky and the higher
preference is given to the more secure and riskless formal labour market. The study
results conclude that urban informal sector is not the sector of married female workers in
district Multan. Our findings are similar to Funkhouser‟s (1996) results.
Findings highlight that the urban informal sector participants have less formal
training (FTD). Most participants have some kind of informal training. The coefficients
of formal training (FTD) for male workers are negative and highly significant. The
probability of males‟ working in urban informal sector falls by about 21.6 and 24.3
percent because of one unit increase in formal training. However, the coefficients of
formal training are negative and insignificant for females‟ employment. Our results
conclude that male workers are comparatively more likely to be employed in the formal
sector having formal training. The urban informal sector employment does not require the
formal skills. To utilize the capabilities and skills with better match, male workers having
formal training and skills tend to incline towards the formal labour market in district
Multan.
Presence of parent‟s educational status influences the probability of participation
in urban informal sector in district Multan. Theoretically, it is predictable that those
workers, whose parents are well-educated, are, reluctant to participate towards menial
jobs in the urban informal sector. Findings confirm the hypothesis. On the part of male
employment analysis, the coefficients of variable father‟s education (FED) are negative
and statistically insignificant. Some of the male workers have to work in the informal
sector.
cccxl
In addition to another reason, parents‟ educational status also affects the females
being employed in the urban informal sector. In theory, it is expected that the female
workers whose parents are educated are less likely to incline towards the urban informal
sector. The probability of working in the urban informal sector diminishes by 24.3 and
27.2 percentage points respectively due to one unit increase in father‟s education
(FEDU).
The coefficients of mother‟s education (MEDU) are significantly negative. The
male workers‟ participation in the informal sector decreases about 15.2 and 15.1
percentage points respectively as a result of one unit increase in mothers‟ education. The
female workers whose mothers are uneducated are about 36.4 and about 40.3 percentage
points less likely to be engaged in the urban informal sector as compared to those whose
mothers are educated. Findings also point out that more females 21.2 and 25.2 percent
points are less likely to be engaged in the urban informal sector of district Multan as
compared to male workers. The reason probably exists that the educated parents
especially mothers provide higher educational opportunities to their children which lead
to development of the formal sector employment in district Multan. The results conclude
that higher the parents‟ education, lower the female employment in informal sector in
district Multan.
The results show that the coefficients of household size (HSIZ) are positive and
have significant effect on males‟ participation in the urban informal sector. When
household size increases by one, the male participants are more likely to be employed in
the urban informal sector by 5.5 and 6.5 percentage points respectively as compared to
the formal sector employment. In order to improve the overall living standard of the
family members, heads decide on to work more in accessible urban informal sector jobs.
The results conclude that male workers with large household size are more likely to be
employed in the urban informal sector in district Multan.
Concerning females‟ employment, household size has different effect on the
decision of working in urban informal sector. The coefficients of (HSIZ) are negative and
statistically insignificant. Theoreically, it is argued that females dissuade from economic

cccxli
activities in the presence of large household size or it becomes difficult for females to
engage in productive work instead of care work for large household size. The results
conclude that some of the females having more potential are working in the informal
sector with increased household size. Our findings reveal that male participants with
large household size are more likely to be engaged in the informal sector of district
Multan.
Dependency ratio (DPNR) is one important factor which motivates the
participants in the urban informal sector employment in district Multan. The coefficients
of dependency ratio (DPNR) for male workers are found to be positive and statistically
insignificant.
Though, the coefficients of (DPNR) are negative and statistically insignificant for
female urban informal sector employment. The dependency ratio has not significant
influence on growth potential of the urban informal sector in district Multan. The
insignificant results conclude that dependency ratio exerts no influence on males and
females urban informal sector employment in district Multan.
Family setup (FSP) helps to increase the growth potential of urban informal sector
employment. Results demonstrate that the coefficients of family setup (FSP) are found to
be negative and statistically insignificant in male analyses. On the part of females‟
employment, the results are different. The coefficients of family setup are positive and
highly significant for female informal employment.
The probability of female informal workers increases by 37.8 and 34.8
percentage points respectively as a result of one unit increase in joint family setup. The
possible outcome of the fact is that the females belonging to joint family system have
more additional working hours for informal activities (both market as well as home-
based) because domestic issues are contributed by other family members. Thus, urban
female informal sector employment increases due to joint family setup in district Multan.
The variable number of children of 6 -14 years old is also important to decide to
work in the sector of employment. Number of children (NCHL) also affects the urban
cccxlii
informal sector employment. The results point towards the fact that the number of
children variable (NCHL) has a negative and insignificant impact on males‟ working in
the urban informal sector employment. Theoretically, the workers having more these
children participate less in economic activities due to expected unearned income from
these children. The argument is that there is an increasing tendency of child labour in
district Multan.
It is hypothesized that the number of children variable (NCHL) has a positive and
significant impact on female workers‟ participation in urban informal sector. The
probability of female workers being engaged in the urban informal sector is curtailed by
10.4 and about 10.1 percentage points respectively by an increase of one additional child.
Theory shows that the female workers having more children from 6 to 14 participate
more in economic activities to accomplish their basic needs and to contribute family
expenses. Moreover, the mothers of children pay comparatively lessened care to these
children because they are free from household responsibilities in district Multan. Results
support Funkhouser‟s (1996) findings.
The variable number of male adolescents is important in determining the informal
sector employment. The male participants are less likely to be engaged in informal sector
by 7.4 percent respectively in table 9.6 due to an addition of one child in the family. The
coefficients of number of male adolescents (NMAD) are negative. On the other hand, the
coefficients of male adolescents‟ variable are negative and statistically insignificant for
female employment in the urban informal sector of district Multan.
Results seem to suggest that male participants are less likely to be involved in the
informal work as compared to female workers from an additional male adolescent. The
reason possibly exists that mostly male adolescents allocate their time in economic
activities to increase family income. Male household heads are less likely to participate
in the informal sector due to strong substitution effect of increased income of the male
adolescent.

cccxliii
The estimates for males make obvious that the probability of working in urban
informal sector increases because of an addition of one female adolescent (NFAD) at
home. The coefficient of female adolescent is positive but statistically insignificant in
table 9.5. Female adolescents (NFAD) variable influences the decision to work in labour
market. The coefficient of number of female adolescent is positive and significant in male
informal workers‟ analysis in table 9.6.
However the results reveal that the coefficients of number of female adolescent
(NFAD) for females‟ employment are positive and statistically significant. The females
are being inducted into informal sector by 12.4 and 13.2 percentage points as a result of
one additional female adolescent. It also owes to that female adolescents having low
formal education are faced with social constraints. It becomes obligatory for the parents
to work in the urban informal sector employment for the better living standard of their
female adolescents.
It has been noted that the spouse‟s participation in economic activities (SPN)
decreases the probability of urban male workers participation in the informal sector. The
study results are negative and have insignificant effects on employment. Relativity of
spouse participation in economic activities (SPN), the coefficients of spouse participation
in economic activities are positive and statistically insignificant. The insignificant results
point out that influence of spouse participation in economic activities on informal
employment is worthless in district Multan.
Household‟s value of assets (HVAT) has an important effect on the sector of
employment. The coefficients of the household‟s value of assets (HVAT) are negative
and statistically insignificant. The probable reason exists that some low educated workers
with their non-progressive mentality are unenthusiastic to invest extra financial resources
due to uncertainty. Results also indicate that the coefficients of the value of household‟s
assets (HVAT) for females‟ employment are positive and statistically insignificant.
Rural-urban migration (RMGT) also affects urban informal sector employment
decision in district Multan. An addition of one male rural-urban migrant worker in

cccxliv
informal sector increases the probability of male informal workers by 17.3 and 18.7
percentage points. The coefficients of rural to urban migration for female workers are
found to be positive. However, results exert insignificant effects.
These results conclude that the male informal employment is high or expands in
urban areas of district Multan Pakistan. It is because that informal sector is expanding
due to rural-urban migration, rural urban wage differential and low chance of
employment opportunities in formal sector.

cccxlv
The results may correlate with the expected role of the urban informal sector that
the sector is the refuge for rural migrants in the urban areas in district Multan.
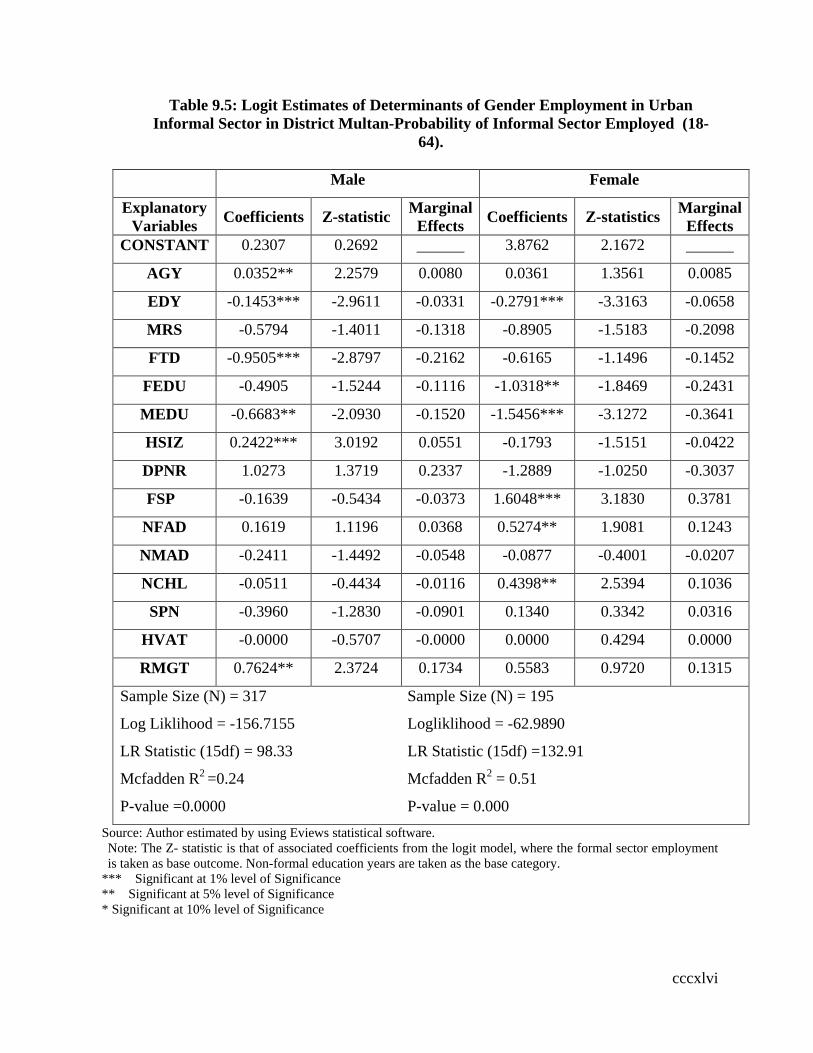
cccxlvi
Table 9.5: Logit Estimates of Determinants of Gender Employment in Urban
Informal Sector in District Multan-Probability of Informal Sector Employed (18-
64).
Male Female
Explanatory
Variables Coefficients Z-statistic
Marginal
Effects Coefficients Z-statistics
Marginal
Effects
CONSTANT 0.2307 0.2692 3.8762 2.1672
AGY 0.0352** 2.2579 0.0080 0.0361 1.3561 0.0085
EDY -0.1453*** -2.9611 -0.0331 -0.2791*** -3.3163 -0.0658
MRS -0.5794 -1.4011 -0.1318 -0.8905 -1.5183 -0.2098
FTD -0.9505*** -2.8797 -0.2162 -0.6165 -1.1496 -0.1452
FEDU -0.4905 -1.5244 -0.1116 -1.0318** -1.8469 -0.2431
MEDU -0.6683** -2.0930 -0.1520 -1.5456*** -3.1272 -0.3641
HSIZ 0.2422*** 3.0192 0.0551 -0.1793 -1.5151 -0.0422
DPNR 1.0273 1.3719 0.2337 -1.2889 -1.0250 -0.3037
FSP -0.1639 -0.5434 -0.0373 1.6048*** 3.1830 0.3781
NFAD 0.1619 1.1196 0.0368 0.5274** 1.9081 0.1243
NMAD -0.2411 -1.4492 -0.0548 -0.0877 -0.4001 -0.0207
NCHL -0.0511 -0.4434 -0.0116 0.4398** 2.5394 0.1036
SPN -0.3960 -1.2830 -0.0901 0.1340 0.3342 0.0316
HVAT -0.0000 -0.5707 -0.0000 0.0000 0.4294 0.0000
RMGT 0.7624** 2.3724 0.1734 0.5583 0.9720 0.1315
Sample Size (N) = 317 Sample Size (N) = 195
Log Liklihood = -156.7155 Logliklihood = -62.9890
LR Statistic (15df) = 98.33 LR Statistic (15df) =132.91
Mcfadden R2 =0.24 Mcfadden R
2 = 0.51
P-value =0.0000 P-value = 0.000
Source: Author estimated by using Eviews statistical software.
Note: The Z- statistic is that of associated coefficients from the logit model, where the formal sector employment
is taken as base outcome. Non-formal education years are taken as the base category.
*** Significant at 1% level of Significance
** Significant at 5% level of Significance
* Significant at 10% level of Significance

cccxlvii
Table 9.6: Logit Estimates of Determinants of Gender Employment in Urban
Informal Sector in District Multan with Different Levels of Education- Probability
of Informal sector Employed (18-64).
Male Female
Explanatory
Variables
Coefficients Z-statistic Marginal
Effects
Coefficients Z-statistics Marginal
Effects
CONSTANT -2.1355 -2.3658 1.9734 1.1941
AGY 0.0425*** 2.5705 0.0097 0.0352 1.3120 0.0083
EDU II 1.7606*** 2.6285 0.4005 0.5112 0.4029 0.1204
EDU III 1.0030** 1.9328 0.2284 -0.6085 -0.6049 -0.1434
EDU IV 0.4261 0.7743 0.0969 -1.7383 -1.4549 -0.4095
EDU V -0.3128 -0.5573 -0.0712 -1.8002* -1.6369 -0.4241
EDU VI -0.7184 -1.1647 -0.1634 -2.5783** -2.4164 -0.6074
MRS -0.6088 -1.3935 -0.1385 -1.0290* -1.6819 -0.2424
FTD -1.0701*** -3.1063 -0.2434 -0.7037 -1.2772 -0.1658
FEDU -0.5446 -1.6111 -0.1239 -1.1549** -1.9585 -0.2721
MEDU -0.6655** -2.0155 -0.1514 -1.7093*** -3.2821 -0.4027
HSIZ 0.2874*** 3.3629 0.0654 -0.1774 -1.4499 -0.0180
DPNR -0.8155 -1.0497 -0.1855 -1.0510 -0.8068 -0.2476
FSP -0.0654 -0.2090 -0.0149 1.4781*** 2.8193 0.3482
NFAD 0.1593 1.0603 0.0362 0.5620** 2.0118 0.1324
NMAD -0.3229** -1.8984 -0.0735 -0.0669 -0.2924 -0.0158
NCHL -0.1193 -0.9786 -0.0271 0.4281** 2.4157 0.1009
SPN -0.4037 -1.2630 -0.0918 0.1786 0.4283 0.0421
HVAT -0.0000 -0.4864 -0.0000 0.0000 0.6389 0.0000
RMGT 0.8234** 2.4946 0.1873 0.3887 0.6538 0.0916
Sample Size (N) = 317 Sample Size (N) = 195
Log Liklihood = -148.9947 Logliklihood = -61.8465
LR Statistic (19df) = 113.77 LR Statistic (19df) =135.19
Mcfadden R2 = 0.28 Mcfadden R
2 = 0.52
P-value = 0.000 P-value = 0.000
Source: Author estimated by using Eviews statistical software.
Note: The Z- statistic is that of the associated coefficients from the logit model, where the formal sector
employment is taken as the base outcome. Non-formal education is taken as base category.
*** Significant at 1% level of Significance
** Significant at 5% level of Significance
* Significant at 10% level of Significance

cccxlviii
9.5 Binary Logit Estimates of Determinants of Gender Employment
and Comparison in Urban informal Sector in District Dera Ghazi
Khan
In this section, an analysis of the determinants of gender employment in the urban
informal sector and comparison is examined in district Dera Ghazi Khan. We have made
a choice of binary logit model in order to analyze the influence of explanatory variables
on gender employment with complete years of education and with different levels of
education.
Tables 9.7 and 9.8 present the logit estimates of the determinants of male and
female informal sector employment. Three sets of numbers are shown in three columns
which are estimated parameters, their asymptotic z-statistic and marginal effects for both
the models (male and female). The intercept term in the urban informal sector
employment equation for males is positive and statistically insignificant but negative and
insignificant in table 9.8. In female employment analyses, the intercept terms are
positively significant. The marginal effects indicate that the effect of a unit change in
each variable on the urban informal sector employment relative to the base category that
is formal sector employment.
Two views are presented about age of workers involved in the informal sector.
Firstly, if the relative participation of young people is greater in informal sector, the very
sector may probably be considered a transition stage before opting for formal sector.
Secondly, the informal sector may be considered as a desirable constant choice if there is
a large participation ratio of older persons in the informal sector. Age is another
important matter which affects participants‟ choice in labour market. The coefficients of
complete years of age (AGY) for male workers are found to be positive. However, study
results are statistically insignificant. In old age, increased experience of male workers‟
with initial basic education motivates them to engage in informal sector employment.

cccxlix
Female participants of urban informal sector are also affected by their age (AGY).
The results indicate that the coefficients of years of age (AGY) appear to be positive and
statistically insignificant. The possible reason can be that female workers with high
formal education and high experience easily find out work in the formal sector in district
Dera Ghazi Khan.
Theoretically, education level of the participants in the labour market can play
two different roles: For instance, more educated workers tend to be more fertile because
their education serves as an impetus in enhancing their skill via training. On the other
hand, low education increases the probability of involvement in the urban informal
sector. We have used complete years of education as an explanatory variable in this
study. Results found that the coefficient of the complete years of education for both the
genders is (EDY) significantly negative. The probability of males‟ participation in the
urban informal sector falls by about 4.2 percentage points as a result of an increase of one
year in education of the worker. The trend shows that the level of education increases, the
marginal informal sector employment falls. The probability of female workers being
employed in the urban informal sector drops by 63.4 percentage points as a result of an
increase of one year in education. Findings indicate that females‟ employment decreases
more by 58.2 percentage points due to an increase of one year age of the worker.
Consequently, male participants with higher education are employmed more in the formal
sector employment which is well-paid.
In model II, education level of workers (EDY) is added as a categorical variable
with five categories (non-formal education is taken as base category). The results point
out that the coefficient of Middle level education (EDU II) is positive and has significant
effect on participation in the urban informal sector. The coefficient of Matric level
education (EDU III) is positive and statistically insignificant. The coefficient of
Intermediate level education (EDU IV) exerts a negative effect. The coefficient for
Graduation level education (EDU V) is negative and significantly affects the male
participants in the urban informal sector. The coefficient of Master‟s or higher level
education (EDU VI) appears to be negative and statistically significant.

cccl
For female informal sector employment, the coefficients of Middle level
education (EDU II) and Matric levels education (EDU III) are positive. However, the
study results are statistically insignificant. The results also reveal that coefficient of
Intermediate level education (EDU IV) is negative and insignificant. The coefficient of
Graduation level education (EDU V) is negative. The coefficient of Master‟s or higher
level education (EDU VI) is found to be negative and statistically significant. The results
conclude that the urban informal sector absorbs the low educated workers (male and
female) in district Dera Ghazi Khan.
The results demonstrate that the coefficients of marital status (MRS) for male
participants are positive. However, the study results are statistically insignificant in the
analysis. The bulk of married male workers possibly having high formal education join
the formal sector in order to meet up their family necessities. Female estimates show that
the coefficients of marital status (MRS) are negative and statistically insignificant. The
married females are less willing to employ themselves into the formal economic activities
due to performance of household obligations and responsibilities in district Dera Ghazi
Khan.
Formal training (FTD) has a greater impact on the urban informal sector in district
Dera Ghazi Khan. The coefficients of formal training prove to be negative and highly
significant. The male participants are less likely to be employed in the urban informal
sector by 23.2 and 19 percentage points respectively because of an increase of one unit in
formal training. Equally, the coefficient of formal training is negative and highly
significant for female informal sector employment. The probability of female workers
diminishes by about 46.7 and 54.1 percent due to an increase of one unit in formal
training. The study findings indicate that females‟ participation relatively decreases at
faster rate by 23.5 and 35 percentage points respectively in informal sector as compared
to male participants. It owes to that many workers especially female desire to occupy the
formal sector for proper utilization of their formal skills and where they are satisfied to
perform their responsibility in a better way. Results conclude that higher the formal
training, lower the urban male and female informal sector employment in district Dera
Ghazi Khan.

cccli
In addition to another reason, parents‟ education helps to determine the growth
potential of the workers in the urban informal sector. It is predictable that the workers are
less likely to engage themselves in urban informal sector, whose parents are educated.
The results highlight that coefficients of father‟s education (FED) seem to be negative
and statistically significant for male workers. The probability of males‟ working in urban
informal sector diminishes by about 13.8 and 14 percentage points respectively due to
one unit increase in father‟s education (FEDU). Parental education also affects the urban
female informal sector employment decision. The coefficients of father‟s education
(FEDU) are negative and statistically significant in table 9.7. The probability diminishes
by about 24 percentage points respectively in table 9.8 due to one unit increase in father‟s
education (FEDU) in female analysis. Findings show that 14.5 percent more female
workers are less being inducted into the urban informal sector because of one unit
increase in father‟s education.
Results also indicate that coefficients of mother‟s education (MEDU) are found to
be negative and statistically significant. Results show that one unit increase in mother‟s
education reduces the probability of male workers‟ involvement in urban informal sector
by 15.8 and about 15.6 percent respectively due to one unit increase in (MEDU). The
results also point out that coefficient of mother‟s education (MEDU) for male participants
is negative and highly significant in model II.
The coefficients of mother‟s education (MEDU) are found to be negative and
significant in model I. The probability of females‟ employment decreases by 29
percentage points due to one unit increase in mother‟s education. However, the
probability of female workers being employed in the urban informal sector falls about
13.9 percentage points more than male participation rate due to one unit increase in
mothers‟ education. Infact, the educated parents or mothers provide higher education to
their children and suggest for beneficial formal sector jobs to secure their future. The
results conclude that urban male and female informal sector employment decreases in the
presence of educated parents in district Dera Ghazi Khan.

ccclii
Theoretically, two varying hypotheses can be formulated regarding the effect of
household size on informal sector involvement. Firstly, it signifies the promotion of the
informal sector due to manifold increase in labour supply. Secondly, the motive of
making the family financially sound compels the head of large household to opt informal
sector. The results indicate that household size (HSIZ) positively affects the decision to
work informally. The coefficients of (HSIZ) exert positive and significant effect on
males‟ involvment in the urban informal sector. One additional member in the house
increases the male work participation by 3.2 and about 4.1 percentage points respectively.
It also owes to that the basic necessities of family members force the male heads to call
upon more in the urban informal sector employment. Results conclude that male urban
informal sector is a sector with large household size in district Dera Ghazi Khan.
Different from males‟ results, the household size has a negative impact on
females‟ contribution in the urban informal sector. The results indicate that the
coefficients of varible HSIZ are negative and have insignificant effect on females‟
informal sector employment. It may also be due to that females with large household size
also participate in the informal employment as they have to fulfill the family members‟s
needs in district Dera Ghazi Khan.
Dependency ratio (DPNR) affects positively the male worker‟s participation
decision in the urban informal sector. The coefficients of dependency ratio (DPNR) for
male paricipants are positive and statistically insignificant. The estimates point out that
the coefficients of dependency ratio (DPNR) seem to be negative and are statistically
insignificant.
Results show that coefficients of family setup (FSP) are negative and statistically
insignificant. Male workers living in joint family setup are less likely to participate in the
informal earning activities. This trend is due to strong substitution effect of more leisure
and less work.
However, coefficient of family setup has a positive and highly significant
influence on females‟ informal sector employment. The workers who belong to joint
cccliii
family setup are being employed in the informal sector by about 41.6 and 42.7 percentage
points respectively as compared to the formal sector. The possible outcome of the fact is
that females living in joint family system have more extra working hours to work in the
urban informal activities because there are other family members to share the household
responsibilities. As a result, females are occupied more in the urban informal sector
employment. The results conclude that higher the joint family set up, higher the female
employment in the informal sector in district Dera Ghazi Khan.

cccliv
The result highlights that the number of children variable (NCHL) has a positive
and insignificant impact on males‟ participation in the urban informal sector employment.
Results also indicate that number of children (NCHL) have a positive and significant
impact on females informal sector participation decision. The females are being invoked
more in the informal sector by 10.2 and 14 percentage points for an increase of one
additional child. The results make clear that female participants are more likely to be
engaged in the urban informal sector in the presence of children as compared to male
workers. The results indicate that the females pay relatively lessened care or look after
the children and they indulge in the urban informal economic activities to cope up their
basic needs. Findings support the Funkhouser‟s (1996) results.
Next variable is about having male adolescents (NMAD). The male workers‟
participation in the informal sector diminishes by about 7 and 9.7 percentage points due
to an addition of one more male adolescent. The coefficients of the variable number of
male adolescents (NMAD) are negative and statistically significant. The females are
being employed less in the informal sector by 16.6 percentage points for an increase of
one male adolescent in both models. Our study results reveal that there is 9.6 and 6.9
percent more decline in female participation for an additional male adolescent. The
participants or female participants dissuade to work to any further extent due to increased
unearned income of the male adolescent. The results conclude that contribution in the
urban informal sector and numberof male adolescents are inversely correlated in Dera
Ghazi Khan. Results are similar with Funkhouer‟s (1996) findings.
The noteworthy result in table 9.7 point out that probability of males‟ induction in
the urban informal sector increases by 6.8 percentage points because of an addition of
one female adolescent (NFAD) at home. The result indicates that the coefficient of
number of female adolescent is positive and statistically insignificant in table 9.8. For
females‟ employment, the probability increases because of an addition of one female
adolescent at home. The results also indicate that the coefficients of female adolescents
are positive and highly significant. The female workers are being employed in the urban
informal sector by about 22.9 and 26.2 percentage points respectively due to an addition
of one female adolescent. The study findings highlight that females are 16.1 and 3.9

ccclv
percent more likely to be involved in the urban informal sector because of one additional
female adolescent as compared to male workers. In order to support family and to bear
the expenditures of female adolescents, the parents especially females are enthusiastic to
work in an accessible urban informal sector. The results conclude that presence of female
adolescent increases the growth potential of urban informal sector employment in district
Dera Ghazi Khan. In this way the prospectus of the urban informal sector employment
increases.
The result in table 9.7 highlights that the coefficient of spouse participation in
economic activities (SPN) is found to be negative and statistically significant at 5 percent
level of significance. The result in table 9.8 indicates that spouse‟s participation in
economic activities (SPN) decreases the urban male informal sector employment by 15.9
percentage points. It has been observed that the spouse‟s participation in economic
activities decreases the likelihood of urban male informal sector employment by 16.5
percentage points. Relativity of spouse participation in economic activities, results also
indicate that the spouse‟s participation in economic activities reduces the probability of
urban female participants of the informal sector by 22 and 24.5 percentage points. The
evidences show the 5.5 and 8.6 percent more falls in female employment due to one unit
increase in spouse involvement in economic activities as compared to male workers. If
the spouses are working in earnings activities, the female workers are less probable to
work due to less awareness, insufficient jobs according to the level of education in the
formal labour market. There are the social or religious constrictions that expect the
female spouses to provide more care to children and to perform household
responsibilities.
Household‟s value of assets (HVAT) has a positive and insignificant impact on
male informal sector employment as indicated by the positive coefficients in both
equations. However, the coefficients of the household‟s value of assets (HVAT) are
observed inverse and insignificant for female workers. It is argued that the females invest
more the extra financial resources due to uncertainty.
ccclvi
In terms of effect of rural-urban migration (RMGT), the coefficients of rural-
urban migrant variable are found to be positive and statistically insignificant for males
working in the urban informal sector. These results conclude that the strength of informal
employment is not high in urban areas of district Dera Ghazi Khan. While the
coefficients for female migrant workers are positive and statistically insignificant. These
results conclude that the informal sector is can not absorb more migrants due to high
rural-urban migration, high rural urban wage differential and low probability of getting
employment opportunities in the formal sector.
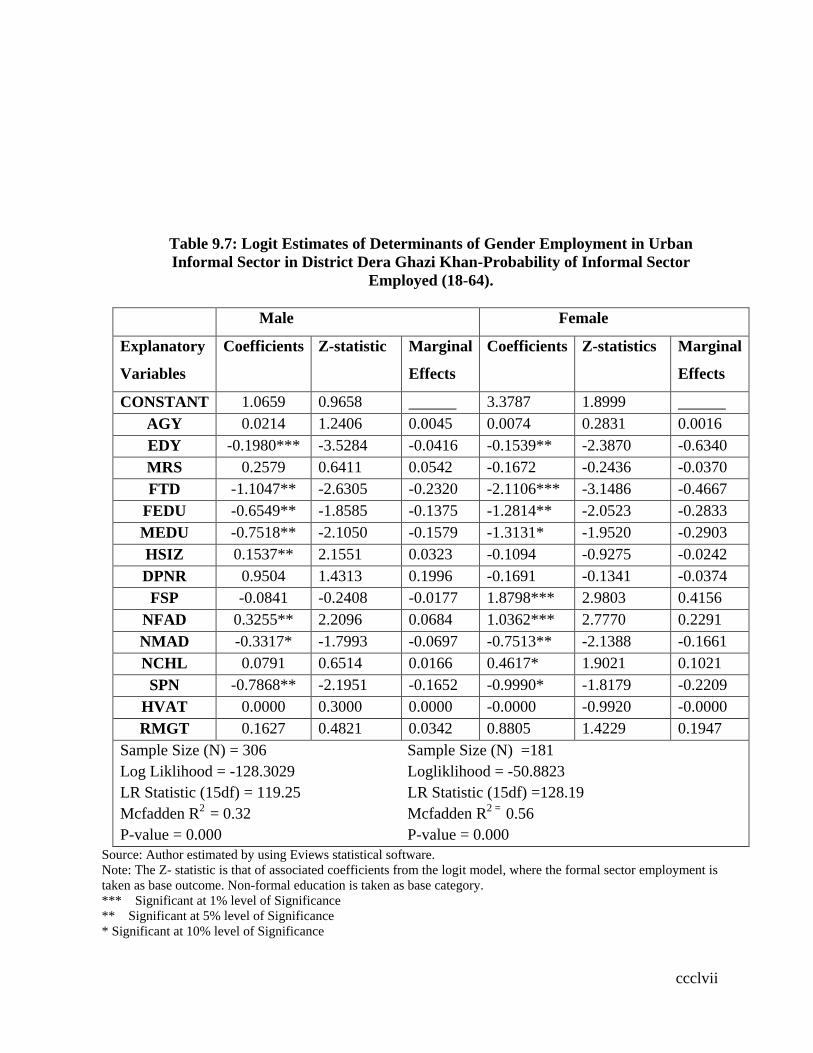
ccclvii
Table 9.7: Logit Estimates of Determinants of Gender Employment in Urban
Informal Sector in District Dera Ghazi Khan-Probability of Informal Sector
Employed (18-64).
Male Female
Explanatory
Variables
Coefficients Z-statistic Marginal
Effects
Coefficients Z-statistics Marginal
Effects
CONSTANT 1.0659 0.9658 3.3787 1.8999
AGY 0.0214 1.2406 0.0045 0.0074 0.2831 0.0016
EDY -0.1980*** -3.5284 -0.0416 -0.1539** -2.3870 -0.6340
MRS 0.2579 0.6411 0.0542 -0.1672 -0.2436 -0.0370
FTD -1.1047** -2.6305 -0.2320 -2.1106*** -3.1486 -0.4667
FEDU -0.6549** -1.8585 -0.1375 -1.2814** -2.0523 -0.2833
MEDU -0.7518** -2.1050 -0.1579 -1.3131* -1.9520 -0.2903
HSIZ 0.1537** 2.1551 0.0323 -0.1094 -0.9275 -0.0242
DPNR 0.9504 1.4313 0.1996 -0.1691 -0.1341 -0.0374
FSP -0.0841 -0.2408 -0.0177 1.8798*** 2.9803 0.4156
NFAD 0.3255** 2.2096 0.0684 1.0362*** 2.7770 0.2291
NMAD -0.3317* -1.7993 -0.0697 -0.7513** -2.1388 -0.1661
NCHL 0.0791 0.6514 0.0166 0.4617* 1.9021 0.1021
SPN -0.7868** -2.1951 -0.1652 -0.9990* -1.8179 -0.2209
HVAT 0.0000 0.3000 0.0000 -0.0000 -0.9920 -0.0000
RMGT 0.1627 0.4821 0.0342 0.8805 1.4229 0.1947
Sample Size (N) = 306 Sample Size (N) =181
Log Liklihood = -128.3029 Logliklihood = -50.8823
LR Statistic (15df) = 119.25 LR Statistic (15df) =128.19
Mcfadden R2
= 0.32 Mcfadden R2 =
0.56
P-value = 0.000 P-value = 0.000
Source: Author estimated by using Eviews statistical software.
Note: The Z- statistic is that of associated coefficients from the logit model, where the formal sector employment is
taken as base outcome. Non-formal education is taken as base category.
*** Significant at 1% level of Significance
** Significant at 5% level of Significance
* Significant at 10% level of Significance
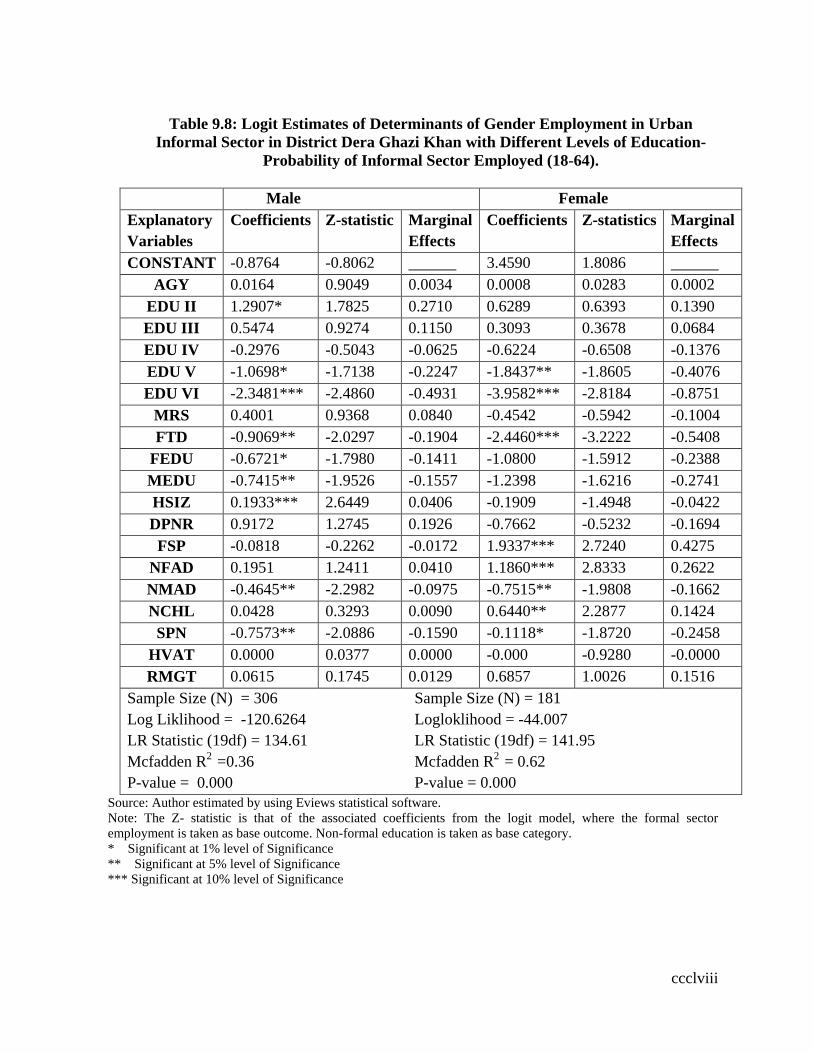
ccclviii
Table 9.8: Logit Estimates of Determinants of Gender Employment in Urban
Informal Sector in District Dera Ghazi Khan with Different Levels of Education-
Probability of Informal Sector Employed (18-64).
Male Female
Explanatory
Variables
Coefficients Z-statistic Marginal
Effects
Coefficients Z-statistics Marginal
Effects
CONSTANT -0.8764 -0.8062 3.4590 1.8086
AGY 0.0164 0.9049 0.0034 0.0008 0.0283 0.0002
EDU II 1.2907* 1.7825 0.2710 0.6289 0.6393 0.1390
EDU III 0.5474 0.9274 0.1150 0.3093 0.3678 0.0684
EDU IV -0.2976 -0.5043 -0.0625 -0.6224 -0.6508 -0.1376
EDU V -1.0698* -1.7138 -0.2247 -1.8437** -1.8605 -0.4076
EDU VI -2.3481*** -2.4860 -0.4931 -3.9582*** -2.8184 -0.8751
MRS 0.4001 0.9368 0.0840 -0.4542 -0.5942 -0.1004
FTD -0.9069** -2.0297 -0.1904 -2.4460*** -3.2222 -0.5408
FEDU -0.6721* -1.7980 -0.1411 -1.0800 -1.5912 -0.2388
MEDU -0.7415** -1.9526 -0.1557 -1.2398 -1.6216 -0.2741
HSIZ 0.1933*** 2.6449 0.0406 -0.1909 -1.4948 -0.0422
DPNR 0.9172 1.2745 0.1926 -0.7662 -0.5232 -0.1694
FSP -0.0818 -0.2262 -0.0172 1.9337*** 2.7240 0.4275
NFAD 0.1951 1.2411 0.0410 1.1860*** 2.8333 0.2622
NMAD -0.4645** -2.2982 -0.0975 -0.7515** -1.9808 -0.1662
NCHL 0.0428 0.3293 0.0090 0.6440** 2.2877 0.1424
SPN -0.7573** -2.0886 -0.1590 -0.1118* -1.8720 -0.2458
HVAT 0.0000 0.0377 0.0000 -0.000 -0.9280 -0.0000
RMGT 0.0615 0.1745 0.0129 0.6857 1.0026 0.1516
Sample Size (N) = 306 Sample Size (N) = 181
Log Liklihood = -120.6264 Logloklihood = -44.007
LR Statistic (19df) = 134.61 LR Statistic (19df) = 141.95
Mcfadden R2
=0.36 Mcfadden R2
= 0.62
P-value = 0.000 P-value = 0.000
Source: Author estimated by using Eviews statistical software.
Note: The Z- statistic is that of the associated coefficients from the logit model, where the formal sector
employment is taken as base outcome. Non-formal education is taken as base category.
* Significant at 1% level of Significance
** Significant at 5% level of Significance
*** Significant at 10% level of Significance

ccclix
9.6 Concluding Remarks
The gist of this chapter is that we have done an econometric analysis of gender
employment and comparison in the urban informal sector of Southern Punjab, Pakistan.
We have used the binary logit model for this analysis. The analysis of present study is
based on stratified random sample of 1506 participants of labour market. Out of which,
934 are male and 572 are female workers in the informal and formal sector. The study
has found that that most of the explanatory variables produce different results at different
levels of analysis.
In the analysis of Southern Punjab, age of the male workers has a positive trend in
participating in the urban informal sector. The education (EDY) appears to be negative
and highly significant factor in determining the growth potential of informal sector
employment. The Middle level education (EDUC II) is significant and positively
correlated with the participation in urban informal sector employment. Graduation (EDU
V) and Master‟s or higher education (EDU VI), formal training (FTD), mother‟s
education (MEDU), father‟s education (FEDU), number of male adolescents (NMAD),
and spouse participation in economic activities (SPN) negatively affect the male informal
sector participants. The household size (HSIZ), dependency ratio (DPNR), number of
female adolescents (NFAD) and rural-urban migrants (RMGT) have significantly
positive influence on the decision of males‟ employment in the urban informal sector of
Southern Punjab. The presence of these variables increases the growth potential of the
urban informal sector.
On the part of female employment, the age (AGY) has a positive but insignificant
effect on urban informal sector employment. The complete years of education (EDY)
affect negatively the female worker‟s involvement regarding urban informal sector. The
Intermediate level education (EDU IV), Graduation level education (EDU V) and
Master‟s or higher level education (EDU VI) variables are found to be negative and
highly significant. The effect of marital status is observed to be negative and statistically
insignificant. Formal training (FTD), father‟s education (FEDU) and mother‟s education
(MEDU) have a negative and significant impact on the probability of being employed in
ccclx
the urban informal sector. Family setup (FSP) and number of female adolescents (NFAD)
variables are highly significant factors in determining the female informal sector
employment. The influence of household‟s value of assets (HVAT) on female informal
sector employment is found to be negative and statistically significant. The rural-urban
migrant (RMGT) variable is also positively correlated with urban female informal sector
employment and enhances the growth potential of the urban informal sector in Southern
Punjab, Pakistan.
In district Bahawalpur, the males‟ estimate demonstrates that complete years of
age affects positively although the results are insignificant. Contrarily, the education
seems negative and highly significant factor in determining the males‟ insertion in urban
informal sector. Master‟s or higher level education (EDUVI), formal training (FTD),
father‟s education (FEDU), number of male adolescents (NMAD) and spouse
participation in economic activities (SPN) negatively affects the male workers‟
absorption in the urban informal sector. Furthermore, the household size (HSIZ) strongly
and positively affects the male participants in urban informal sector employment. The
number of female adolescents (NFAD) and rural-urban migrants (RMGT) variable
positively and significantly influence the decision of males‟ participation in urban
informal sector in district Bahawalpur.
While the female results indicate that, age (AGY) has a negative and insignificant
impact on urban informal sector employment. The complete years of education (EDY)
affect negatively the female worker‟s participation in the urban informal sector. In
addition, Graduation level education (EDU V) and Master‟s or higher level education
(EDU VI) variables are found to be negative and highly significant for female informal
sector workers. The effect of marital status is positive and insignificant at 5 % level.
Formal training (FTD), mother‟s education (MEDU) and household‟s value of assets
(HVAT) have a negative and highly significant impact on probability of female being
employed in the urban informal sector employment. Family setup (FSP) and number of
female adolesents (NFAD) affects positively the females‟ participation decision in the
urban informal sector in district Bahawalpur.

ccclxi
In district Multan, the complete years of age (AGY) has a positive but
insignificant influence on male worker‟s participation in urban informal sector. The
coefficient of education in complete years (EDY) gives the negative impression. Middle
(EDU II) level education and Matric level education (EDU III) are positively correlated
with participation decision in the urban informal sector. The effect of marital status
(MRS) on informal sector employment is negative. Formal training (FTD), mother‟s
education (MED), number of male adolescents (NMAD) negatively affect the males‟
incorporation in the urban informal sector. Moreover, household size (HSIZ) strongly
positively affects male participants to work in the urban informal sector.The rural-urban
migrant (RMGT) variable positively and significantly influences the urban informal
labour market of district Multan.
The results also indicate that the complete years of education (EDY) has a
negative and highly significant effect on the female workers‟ participation concerning
urban informal sector. Results show that Graduation level education (EDU V) and
Master‟s or higher level education (EDU VI) variables are found to be significantly
negative for the female employment in the urban informal sector. The effect of marital
status is negative and insignificant at 10 % level of significance. Father‟s education
(FEDU) and mother‟s education (MEDU) have negative and highly significant impact on
females‟ inclusion in the urban informal sector. On the contrary, family setup (FSP) and
number of female adolescents (NFAD) affects positively the urban female informal
sector employment in district Bahawalpur.
The empirical results of district Dera Ghazi Khan highlight that the influence of
education (EDY) is negative and highly significant factor for the urban male informal
sector employment. The Middle level education (EDU II) is positively associated with
the urban informal sector employment. The effect of marital status (MRS) on the
probability of inclusion in the urban male informal sector is positive and insignificant.
Formal training (FTD), father‟s education (FEDU), mother‟s education (MEDU), number
of male adolescents (NMAD) and spouse participation in economic activities (SPN)
negatively affect the males‟ involvement in the urban informal sector. Moreover, the

ccclxii
household size (HSIZ) is positively associated with the urban male informal sector
employment.
The effect of education (EDY) on females‟ insertion in urban informal sector
seems to be negative. In terms of level of education, Graduation (EDU V) and Master‟s
or higher level education (EDU VI) are negative and significant for urban female
informal sector participants. The coefficient of formal training (FTD) is observed
negative and highly significant. Father‟s education (FEDU), mother‟s education (MEDU)
and household size (HSIZ) and spouse participation in economic activities (SPN) have a
negative and significant impact on females‟ employment in the urban informal sector in
model I. However, family setup (FSP) and number of female adolescents (NFAD)
variables affects positively the females‟ contribution in the urban informal sector of
district Dera Ghazi Khan. The results are highly significant.

ccclxiii
Chapter 10
CONCLUSIONS AND POLICY RECOMMENDATIONS
In this research, the employment patterns and the earnings structure and
development are recognized by conducting a survey of three districts of Southern Punjab,
Pakistan. This is one of the first studies of cross districts comparisons in order to examine
contending views on the urban informal sector, determinants of the urban informal sector
employment, earnings determinants as well as impact on the development of participants.
The urban informal sector is a noteworthy part of the labour force in each of three
districts. The clear results of our findings of the informal sector confirm the previous
findings which have been made by conducting smaller surveys. Our findings indicate that
the urban informal sector is disproportionally youngest, the oldest, the least educated, the
sector of female workers and migrants as well. Additionally, it is observed that the urban
informal sector employment is closely associated with household composition for both
the genders (males and females). Each district has noteworthy returns to human capital
variables in the urban informal sector. Additionally, development of participants of urban
informal sector is gauged by economic, human and social capital. By and large, the
workers are not the poorest in the urban informal sector of Southern Punjab, Pakistan.
However, they are economically poor at household level. The participants have enhanced
the growth potential of urban informal sector employment in Southern Punjab.
The urban informal sector employment has been viewed for an empirical
investigation by using descriptive statistics and binary logit model techniques in Southern
Punjab and separately in three divisions of Southern Punjab. We have also viewed
earnings determinants empirically by employing ordinary least square estimation. For
this, the primary data is collected by the author through stratified random sampling
technique. In the past, studies on urban informal sector employment have been largely
narrowed in their scope in investigating some of the aspects of urban informal sector and
determinants of urban informal sector employment. The conclusion has been given
comprehensively at the end of each chapter previously.
ccclxiv
In chapter 6, we have made a descriptive analysis of factors of workers
considering total, male and female participants of the urban informal and formal sector.
The analysis of the total sample of Southern Punjab and of different districts separately
has been enlarged by examining the determinants of probability of finding employment in
the urban informal sector in chapter 7. In chapter 8, we have examined the earnings
determinants of participants of the urban informal sector and their development. In
chapter 9, logit model is used to analyse the socio-economic and demographic factors of
males and females involved in the urban informal sector employment and their
comparison is also made.
We have explained the determinants of workers‟ participation in the urban
informal sector in Southern Punjab, Pakistan in chapter 6. The determinants of urban
informal sector employment have been examined by employing a descriptive data
analysis. In the descriptive data analysis, a relationship is built up between various socio-
economic and demographic factors and male informal sector employment in the urban
areas of Southern Punjab. Furthermore, an analysis of the determinants regarding
females‟ working in the informal sector has been made by employing descriptive data
analysis. Here, a relationship is established between various factors and urban informal
sector employment in Southern Punjab, Pakistan.
In chapter 7, we have used econometric analysis to investigate the determinants of
urban informal sector employment. A binary logit model is applied. The analysis of
current study is based on simple random and stratified random sampling of 1506 informal
sector participants in the urban areas of Southern Punjab. The analysis has also been
made separately in each division with different sample size. In chapter 7, the results
indicate that all of the variables such as age of participants (AGY), their complete years
of education (EDY), sex (SEX), formal training (FTD), parental education (FEDU),
(MEDU), household size (HSIZ), dependency ratio (DPNR), family setup (FSP), number
of female adolescents (NFAD), number of male adolescents (NMAD), number of
children (NCHL), spouse participation (SPN), household‟s value of assets (HVAT), and
rural-urban migrants (RMGT) are highly significant factors except the variable marital
status (MRS) which is positive but highly insignificant in model I. In addition, level of
ccclxv
education such as education up to Middle (EDUC II), Intermediate (EDU IV), Graduation
(EDUC V), and Master‟s or higher level education (EDU VI) appear to be significant
except Matric level education (EDU III) which is found positive and insignificant. All
these significant variables of the urban informal sector employment in Southern Punjab
have correct sign that match the theoretical foundation.
The study results suggest that age of the respondents (AGY), their marital status
(MRS), the household dependency ratio (DPNR) and number of children (NCHL) are
found insignificant factors in model I in district Bahawalpur. While marital status affects
positively and significantly the informal sector employment decision in model II.
Considering the level of education, Middle level education (EDU II), Matric level
education (EDU II) and Intermediate level education (EDU IV) are insignificant factors
in district Bahawalpur. The results conclude that urban informal sector of district
Bahawalpur is a sector of people having low formal education and low formal training.
Moreover, it is sector of female workers and the workers of uneducated parents. The
informal sector is also sector of those workers who have large family size, who belong to
the joint family setup and it absorbs the migrant workers also. Moreover, the workers
participate less in the informal sector with spouse participation in economic activities,
number of male adolescents and with an increase in household value of assets. The
results are similar as hypothesized by the Neo-classical theory and approaches of the
urban informal sector.
In district Multan, the study results of urban informal employment model I
highlight that sex (SEX), the household dependency ratio (DPNR), spouse participation
in economic activities (SPN) and the household‟s value of assets (HVAT) are found to be
statistically insignificant variables. While, variable number of children (NCHL) affects
insignificantly the urban informal employment decision in model II. Whereas, Matric
level education (EDU III) and Intermediate level education (EDU IV) are observed to be
insignificant factors in urban informal employment in district Multan. The findings
conclude that the urban informal sector of district Multan is sector of aged people with
low education. The workers having low formal training are involved in the urban
informal sector employment. The workers of uneducated parents are engaged in the urban
ccclxvi
informal sector. The urban informal sector is also observed as sector of those workers
who have large family size and who belong to the joint family setup. Additionally, the
workers have a lower likelihood of participating in the informal sector with spouse
participation and male adolescents. The parents of children and number of female
adolescents are also engaged in this sector and finally, it is the sector of migrant workers
as well.
In informal sector employment model I, marital status is seemed as positive and
insignificant. The sex (SEX), dependency ratio (DPNR), family setup (FSP), the
household‟s value of assets (HVAT) and rural-urban migrants (RMGT) demonstrate the
insignificant effect on the urban informal sector employment in district Dera Ghazi Khan.
The result in model II makes obvious the insignificant influence of age of the workers
(AGY) on their induction in urban informal sector. The result of Matric (EDUIII) and
Intermediate level education (EDU IV) are also insignificant. Again marital status (MRS)
is positive and statistically insignificant. The results of sex (SEX) of the workers have an
insignificant effect on employment. The dependency ratio (DPNR) family setup (FSP),
the household‟s value of assets (HVAT) and rural-urban migrants‟ variable (RMGT) are
also insignificant in total analysis. Whereas, Matric level education (EDU III) and
Intermediate level education (EDU IV) are found to be insignificant factors in urban
informal employment in district Multan. In the light of findings in urban informal sector
of district Dera Ghazi Khan, it is concluded that urban informal sector is comprises
educated workers with low formal training and it is the sector of the workers of
uneducated parents. The urban informal sector is found as a sector of those workers who
have large family size and who belong to the joint family setup. The parents of children
and female adolescents are also engaged in this sector. In addition, the workers are found
to be less likely incorporated in urban informal sector with spouse participation and male
adolescents. The results are similar as theorized by the neo-classical theory and
approaches of the urban informal sector.
In chapter 8, age of the informal sector workers (AGY), the education in complete
years (EDY), sex (SEX), working hours (WHR) and household‟s value of assets (HVAT)
are found to be positive and significant factors that increase the earnings or returns of

ccclxvii
workers of urban informal sector in Southern Punjab. The returns to earnings from all
levels of education are also found to be positive and significant.
Results of earnings determinants of urban informal sector participants in district
Bahawalpur are also presented. The coefficients of complete year of education (EDY),
marital status (MRS), family setup (FSY), working hours (WHR) and household‟s value
of assets (HVAT) are observed to be significant and are increasing functions of earnings.
The variables such as Matric level education (EDU III), Intermediate level education
(EDU IV), Graduation (EDU V) and Master‟s or higher level education (EDU VI) are the
important positive significant factors.
In district Multan, the coefficients of age (AGY), complete year of education
(EDY), training (TRN), working hours (WHR) and value of assets (VAT) are seemed to
be significant and positive. These variables are increasing functions of earnings. The
variables such as Matric level education (EDU III), Intermediate level education (EDU
IV), Graduation (EDU V) and Master‟s or higher level education (EDU VI) are positively
significant. The results of all education levels are positive and significant. This indicates
that earnings increase with increasing levels of education of the participants of the urban
informal sector in district Multan.
In district Dera Ghazi Khan, coefficients of complete years of education (EDY),
sex of the worker (SEX), working hours (WHR) and household‟s value of assets (HVAT)
are found to be significant and positive factors. These variables are indicating increasing
returns in urban informal sector employment. The Middle level education (EDU II),
Matric level education (EDU III), Intermediate level education (EDU IV), Graduation
(EDU V) and Master‟s or higher level education (EDU VI) make clear the positive
significant effects. The results of all education levels are positively significant. These
variables are positively associated with earnings of participants of urban informal sector.
In Southern Punjab, the workers who are included as poor or their income is
below poverty line are 16.9 percent. The “non-poor” group is on average 83.1 percent in
urban informal sector. High economic capital shows development of the participants in
ccclxviii
urban informal sector. However, 72.7 percent of the households are poor in Southern
Punjab because their per capita income is below poverty line. A sufficient level of human
capital is observed among the urban informal sector participants in Southern Punjab,
Pakistan. On average, 52.7 percent of the workers have an access to health facilities and
79 percent of the workers have availed some housing facilities. This higher utilization of
human capital indicate high living standard of those who are the part of urban informal
sector. As regards social capital, 44.3 percent of the workers are participating in socio-
cultural activities in Southern Punjab and this indicates low development regarding socio-
cultural activities of the participants. By and large, development indicators show
development of participants of urban informal sector in Southern Punjab.
In district Bahawalpur, the workers who are included as poor are 21.2 percent
because their income is below poverty line. On average, the “non-poor” group is
estimated about 78.8 percent are in urban informal sector. This high economic capital
shows development of the urban informal sector workers. On average, poor households
are 67.2 percent in district Bahawalpur. Results indicate an adequate level of human
capital among the informal sector workers. On average, 48.7 percent of the workers have
an access to health facilities and 82.4 percent of the workers have availed some housing
facilities in district Bahawalpur. This higher utilization of human capital makes clear high
living standard of the workers of urban informal sector. In terms of social capital, 41.02
percent of the workers are engaging in socio-cultural activities. This low social capital
shows low development in terms of socio-cultural activities. The study concludes that on
the whole economic, human and social development indicators highlight development of
participants of urban informal sector of district Bahawalpur.
The study results demonstrate that 17.8 percent of workers are observed as poor
and 82.2 percent are “non-poor” in the urban informal sector of district Multan. The
results indicate that high economic capital highlights the high development level of the
participants in urban informal sector. However, result highlights that 73.9 percent
households are poor in district Multan. Among the urban informal workers, an adequate
level of human capital is also noted. Findings reveal that on average, 50.7 percent of the
workers have access to health facilities and 80.7 percent of the participants have availed
ccclxix
some housing facilities in district Multan. This higher utilization of human capital reveals
high living standard of the participants of urban informal sector. Regarding social capital,
43.9 percent of the urban informal sector participants are observed to be engaged in
socio-cultural activities. This low social capital indicates low development regarding
socio-cultural activities. On the whole, development indictors such as economic, human
and social indicators show development in the urban informal sector of district
Bahawalpur.
The study results reflect that 11.9 percent of the urban informal sector participants
are observed as poor in district Dera Ghazi Khan. The share of “non-poor” group is 88.1
percent. The results indicate high economic capital and development among urban
informal sector participants. It is found that 76.9 percent of the households are poor in
district Dera Ghazi Khan.The results also show that participants have an adequate level of
education in urban informal sector employment. The urban informal sector workers with
access to health facilities are observed at 59.2 percent of the sample and 73.49 percent of
the workers have availed housing facilities. The result indicates high living standard in
terms of higher utilization of human capital of participants in urban informal sector.
Results reveal low social capital such as 47.9 percent among the informal sector
participants, which shows low development in terms of socio-cultural activities. The
development indictors such as economic, human and social indicators show a high level
of development of the urban informal sector in Dera Ghazi Khan.
In chapter 9, we have done an econometric analysis for male and female
participants of urban areas of informal sector in Southern Punjab, Pakistan and separately
in each division. We have used the binary logit model for the said analysis. The analysis
of present study is based on simple random and stratified random sample of 1506
workers. Out of which, 934 are male workers and 572 are female participants of urban
informal and formal sector. The study has revealed that most of the explanatory variables
produce different results at different levels of analysis.
In an analysis of Southern Punjab, age of male participants has a positive trend in
joining the urban informal sector. While, education has a negative influence and is a

ccclxx
highly significant factor in determining the urban informal sector employment. Middle
level education (EDU II) and Matric level education (EDU III) variables are also
significant and positively correlated with the participation in urban informal sector.
Graduation level education (EDU V) and Master‟s or higher level education (EDU VI),
formal training (FTD), mother‟s education (MEDU), father‟s education (FEDU), number
of male adolescents (NMAD), and spouse participation in economic activities (SPN)
negatively affect male participants in the urban informal sector. The workers with high
education have a lower likelihood of working in the urban informal sector and those
participants who are formally trained are working more in the formal sector. Thus, urban
informal sector is a sector of the low educated with low formal training. The household
size (HSIZ), dependency ratio (DPNR), number of female adolescents (NFADS) and
rural-urban migrants (RMGT) variable positively and significantly influence the decision
of males‟ insertion into urban informal sector employment. Moreover, informal sector is
absorbing those who are rural-urban migrants and who have a large household size
especially with number of female adolescents.
Concerning females‟ employment, age has a positive but insignificant effect on
the urban informal sector employment participation. The complete years of education
(EDY) affects negatively the females‟ participation in urban informal sector. Whereas,
variables such as Intermediate (EDU IV), Graduation (EDU V) and Master‟s or higher
level education (EDU VI) are found negatively influencing the decision of participation
in the urban informal sector employment. The study results are highly significant. The
results conclude that females with low formal education are engaged in urban informal
sector of Southern Punjab. The highly educated are more likely to be engaged in the
formal labour maret. The effect of marital status (MRS) is negative and insignificant.
Formal training (FTD), father‟s education (FEDU) and mother‟s education (MEDU)
variables influence negatively the female employment. The results conclude that the
workers having formal training are less likely to be engaged in the informal sector while,
the proportion is higher for those having educated parents. Family setup (FSP) and
number of female adolescents (NFAD) is highly significant factor in determining the
females‟ participation in urban informal sector. The influence of household‟s value of

ccclxxi
assets (HVAT) on probability of the urban informal sector employment is found to be
negative and statistically significant. The rural-urban migratns (RMGT) variable is also
positively correlated with urban female informal sector employment in Southern Punjab.
The female migrants are being employed more in urban informal sector of Southern
Punjab, Pakistan.
By comparing the results of both the genders, results show that educated females
involved in the urban informal sector comparatively face more declines in their
absorption as compared to males‟ employment. Female workers‟ inclusion in informal
sector falls relatively more than male workers due to high formal training. Those female
workers, whose mothers are educated, are relatively less likely to be inducted in informal
sector as compared to male participants. Having male adolescents reduces the female
workers‟ participation more than the male workers in the urban informal sector of
Southern Punjab. The number of female adolescents leads to increase the females‟
absorption in the informal sector more than the male participants. The female workers
whose spouses are also working relatively reduces partaking in the informal sector more
than the male workers. Male migrants are being employed more in the urban informal
sector as compared to female workers.
In district Bahawalpur, the males‟ employment analysis demonstrates that
complete years of age affects positively although the result is insignificant. Contrarily,
education seems to be a negative and a highly significant factor in determining the urban
male informal sector employment. Master‟s or higher level education (EDU VI), formal
training (FTD), father‟s education (FEDU), male adolescents (NMAD), and spouse
participation in economic activities (SPN) negatively affect the urban male informal
sector participants. In the light of results, it is argued that higher education, parental
education and presence of male adolescents dissuade workers to enter into the urban
informal sector. Additionally, the household size (HSIZ) strongly and positively increases
involvement in the urban informal sector. The number of female adolescents (NFAD) and
rural-urban migrants (RMGT) variable positively and significantly affect the decision of
males‟ participation in urban informal sector.
ccclxxii
For female sample, results indicate that age has a negative and insignificant effect
on the urban informal sector employment. The complete years of education (EDY)
negatively affects the females‟ participation pertaining to the urban informal sector.
Considering the effect of level of education, Graduation (EDU V) and Master‟s or higher
level education (EDU VI) are found to be negatively correlated and statistically highly
significant. The effect of marital status (MRS) is positive and insignificant at 5 % level.
Formal training (FTD), mother‟s education (MEDU) and household‟s value of assets
(HVAT) variables are negative and have highly significant impact on female urban
informal sector employment. Family setup (FSP) and number of female adolescents
(NFAD) positively affects the urban female informal sector employment in district
Bahawalpur.
The comparison makes clear that the female workers with rising age have less
participation in the urban informal sector as compared to male participants. Our results
point out that those female wokers who belong to joint family setup are working more in
the urban informal sector of Southern Punjab as compared to male workers. Formally
trained female participants have comparatively less participation in informal sector than
male participants. Having adult members‟ increases rather more the probability of female
informal employment as compared to male participants. Male workers of the informal
sector show a decreasing trend of being employed in the urban informal sector from an
additional male adolescent. The results reflect that female participants are being inducted
more in urban informal sector in the presence of female adolescents as compared to male
workers. Our study results reveal that male informal sector employment is quite more
likely to be decreased than female employment. The comparison is that urban informal
sector absorbs more male migrants as compared to female workers.
In district Multan, the complete years of age has a positive significant impact on
urban male informal sector employment. The complete years of education gives a
negative impression and is highly significant factor in determining the male informal
sector employment. Middle level education (EDU II) and Matric level education (EDU
III) are positively correlated to urban informal sector employment. The effect of marital
status (MRS) on the probability of working in urban informal sector is negative. In
ccclxxiii
conclusion, married couples switch from informal sector towards formal sector. Formal
training (FTD), father‟s education (FEDU), mother‟s education (MEDU) and number of
male adolescents (NMAD) negatively affect the urban male informal sector workers. In
addition, the household size (HSIZ) strongly affects the participation decision. The
results conclude that the urban informal sector absorbs those who have large household
size. The rural-urban migrant (RMGT) variable positively and significantly affects the
decision of male participants in the urban informal sector of district Multan. The results
show that potential of urban informal sector to absorb the rural-urban migrants is high.
The estimates reveal that age has a negative and highly significant impact on the
female worker‟s participation in relation to urban informal sector. Whereas, Intermediate
level education (EDU IV), Graduation level education (EDU V) and Master‟s or higher
level education (EDU VI) variables are negative and significantly determined factors in
female informal employment. The effect of marital status is negative and insignificant at
10 % level of significance. Father‟s education (FEDU), mother‟s education (MEDU) and
household size (HSIZ) have a negative and a highly significant impact on female
employment in the urban informal sector. Contrarily, family setup (FSP) and number of
female adolescents (NFAD) affect positively the urban female informal sector
employment in district Bahawalpur. The results conclude that urban informal sector is
endowed with male and female workers possessing low formal education. In addition,
female workers with a joint family setup are also working more in the urban informal
sector of district Multan.
By comparing the results of both the genders, it is found that educated females
contribute less in the informal sector as compared to male workers. The married females
comparatively have less contribution in the urban informal sector of district Multan. Our
results conclude that male workers are rather more likely to be employed in formal sector
employment. It is also found that female participants having educated parents have less
participation and more involvement in the formal sector as compared to male participants
of the informal sector. Our findings reveal that male workers are more likely to be
engaged in the informal sector having large household size as compared to female
workers. It seems that male participants are somewhat less likely to be involved in
ccclxxiv
informal work as compared to female workers from additional male adolescents. Our
results conclude that spouse participation in economic activities has not significant
influence on male as well as female informal sector employment in district Multan. The
study results point out that male workers have a relatively lower participation in the urban
informal sector due to increase in household‟s value of assets as compared to female
workers.
In district Dera Ghazi Khan, the empirical results highlight that the influence of
education is negative and a highly significant factor for male analysis. For male
employment, Middle level education (EDU II) is positively correlated with urban male
informal sector employment. The male workers with initial basic education can work
easily in the urban informal sector of district Dera Ghazi khan. The effect of marital
status (MRS) on the probability of inclusion in the urban informal sector is positive and
insignificant in males‟ employment. The results indicate a negative and a highly
significant effect of formal training (FTD) on males‟ partaking in the urban informal
sector. Father‟s education (FEDU), mother‟s education (MEDU), number of male
adolescents (NMAD) and spouse participation in economic activities (SPN) negatively
affect the urban male informal sector employment decision. The findings of the study
conclude that urban informal sector is a sector of workers, whose parents are uneducated,
have low formal training and whose spouses are working less in economic activities.
Moreover, the household size (HSIZ) is positively associated with the urban male
informal sector workers. The sector also absorbs the workers having large household size.
Results also conclude that education (EDY) negatively influences the female
participants in the urban informal sector. Graduation (EDU V) and Master‟s or higher
level education (EDU VI) variables are found to be negative and significant. The results
reveal that females with basic formal education are compelled to work in the urban
informal sector and participants who possess high human capital stimulate to work in the
formal labour market. Formal training (FTD), father‟s education (FEDU), mother‟s
education (MEDU) household size (HSIZ) and spouse participation in economic
activities (SPN) have a negative and statistically significant impact on probability of
females being incorporated in the urban informal sector. Those female participants whose
ccclxxv
parents are educated are less likely to be employed in the urban informal sector.
Moreover, the females with large household size and with contribution of the
counterparts have a less likelihood of participation in the urban informal sector. However,
family setup (FSP) and number of female adolescent (NFAD) variables affects positively
the females‟ partaking in the urban informal sector employment in district Bahawalpur.
The results are highly significant.
The comparison makes clear that more females are moving towards the urban
formal sector with their increased age than male workers in Dera Ghazi Khan. The study
findings indicate that females‟ participation in informal sector reduces relatively more as
compared to male participants. As compared to male workers, the female whose fathers‟
are educated show less participation in the informal sector employment. Having children
rather increases the contribution of female workers in urban informal sector. An
additional male adolescent also reduces the females‟ involvement in the urban informal
sector as compared to male workers. However, presence of female adolescents relatively
increases the working probability. The findings show that there is a comparatively higher
decline in females‟ employment due to one unit increase in spouse involvement in
economic activities in the urban informal sector of district Dera Ghazi Khan.
Policy Recommendations
In Pakistan, the informal sector is not only large but also growing rapidly. It
requires to be promoted by generating employment opportunities and removing
constraints on them due to its potential to create opportunities. The participants are
without protection against exploitation in the informal sector in terms of low wages and
longer hours of work coresspondingly. The urban infromal sector seems to encourage the
child labour and thus confines human capital accumulation in Pakistan‟s economy.
The study results demonstrate the mixed effect of complete years of age,
education, and marital status on the urban informal sector participants as well. The study
results indicate that mostly workers are being employed more in the urban informal
sector employment with increasing age. The possible reason may be that insufficient jobs

ccclxxvi
in the formal sector and low human capital compel them to work in urban informal
sector. So, Govt should provide more jobs in the formal sector provide more educational
facilities to these workers with their low formal education.
The study results highlight the negative role of education in the urban informal
sector in Southern Punjab. Highly educated are moving towards the formal sector
whereas, for those workers with their initial basic education, it becomes obligatory to
participate in the urban informal sector. There is a need of strong mobilization and
convincing policies regarding higher education to the informal sector participants.
Regarding sex, majority of the male workers having high education hardly invoke
urban informal sector. There is a high presence of females in the urban informal sector
employment with their basic education.
Taking into account the above discussion, the subsequent policy implications are
going over the main points as followed:
1 There is a need to direct efforts to enhance literacy status of participants in the
urban informal sector and to make them legal literate.
2 Government should provide more jobs in the urban formal sector and provide
more education to these workers with their low formal education.
3 More vocational and technical training institutes should be established in rural as
well as urban areas as an enduring solution towards poverty alleviation in
Southern Punjab.
4 There is a serious need of more tertiary and higher education especially in urban
areas of Southern Punjab.
5 There is a serious necessity of a well-planned/organized planning and policy
making to urge participants in the urban informal sector on elevating their
education level and also to encourage their children for better education.
6 Higher education should be made accessible for all and sundry.

ccclxxvii
7 Females are more prone to working in the informal sector than the formal sector,
thus Public policy should favour women in this preference by enhancing their
opportunities in the urban informal sector in Southern Punjab.
8 More labour-intensive and small industries should be established in both rural and
urban areas of Southern Punjab.
9 Strong policies should be devised to ensure more investment in order to increase
the growth potential of the urban informal sector in Southern Punjab.
10 In order to decrease instability, Govt should decrease the factors that contribute to
instbality to encourage the business.
11 Besides introducing family planning programmes, the families consisting of more
members should be encouraged and persuaded to work.
12 Rural-urban wage differentials must be eliminated. In rural areas facilities should
be increased to avoid the influx of migrants to urban areas and deterioration of
informal sector employment in Southern Punjab.
13 Research and policy need to address the factor that confines the expansion of
formal employment in formal enterprises. Furthermore, infrastructure constraints
and labour regulations impact merit attention.
14 Maximum possible efforts should be directed to ensure health, housing and other
maximum facilities at work place and efforts must ensure sufficient social
security safety-nets in the from of supply of credit, medical facilities and other
benefits to formal sector participants.
15 The concerning authorities should keenly exert attention to improve the policy for
minimum wage laws and regulation for labour.
Thus, the present study is an endeavour to elucidate the various socio-economic
and demographic factors of participants in order to determine the employment, earnings
and development in the urban informal sector and enhance the growth potential of urban
informal sector employment in Southern Punjab. Although, many copious aspects are to
be explored yet a few critical points are mentioned in this research. More attention is
required to improve the growth potential of the urban informal sector. There is a serious
ccclxxviii
necessity of nationwide survey to formulate comprehensive a policy on urban informal
sector.
ccclxxix
REFERENCES
Ademu, W. A. (2006), “The Informal Sector and Employment Generation in Nigeria: The
Role of Credit”, Paper Presented at the Annual Conference of Nigerian Economic
Society (NES), Calabar, Nigeria.
Ahmad, E and Abdul Sattar (2007), “Awareness and Demand of Safe Drinking Water
Practices”, Working Paper No. 21, Pakistan Institute of Development Economics,
Islamabad.
Alen, R.G.D. (1938), Mathematical Analysis of Economists, London: Macmillan.
Ali, K. (2001), Pakistan: The Political Economy of Human Resource Development,
Vanguard Books (PVT) Ltd, Lahore.
Ali, K. (1990), “Problems of Working Women in the Rural Informal Sector of Multan
District”, Pakistan Economic and Social Review, 28(2), 89-104.
Aly, Y. H and I, A. Quisi (1996), “Determinants of Women Labour Force Participation in
Kuwait: A Logit Analysis”, Middle East Business and Economic Review, 8(2), 1-
9.
Avirgan, T., Bivens, L.J. and S. Gammage (eds.) (2005), “Good Jobs, Bad Jobs, No Jobs
– Labor Markets and Informal Work in Egypt, El Salvador, India, Russia, and
South Africa”, Economic Policy Institute, Washington.
Amemiya, T. (1981), “Qualitative Response Models: A Survey”, Journal of Economic
Literature, 19(4), 1483-1536.
ccclxxx
Amin, N. A. T. M. (1987), “The Role of the Informal Sector in Economic Development:
Some Evidence from Dhaka, Bangladesh”, International Labour Review, 126(5),
611-625.
Appleton, S and Teal, F. (1998), “Human Capital and Economic Development: A
Background Paper Prepared for the African Development Report 1998.
Arif, G. M and Hamid, S. (2009), “Urbanization, City Growth, and Quality Of Life in
Pakistan”, European Journal of Social Sciences, 10(2), 196-215.
Arimah, B.C. (2001), “Nature and Determinants of the Linkages between Informal and
Formal Sector Enterprises in Nigeria”, African Development Review, 13(1), 114–
144.
Ashenfelter, O and James, J. H. (1974), “The Estimation of Income and Subsititution
Effects in a Model of Family Labour Supply”, Econometrica, 42(1), 73-86.
Ashraf, J. and Ashraf, B. (1993), “An Analysis of the Male-female Earnings Differentials
in Pakistan”, Pakistan Development Review, 32(4), 895-904,
Assad, R; Ei-Hamidi, F and Ahmed, A. U. (2003), “The Determinants of Employment
Status in Egypt”, FCND Discussion Paper No. 88, International Food Policy
Research Institute, Egypt.
Attanasio, O, Goldberg, P. K & Pavcnik, N. (2003), “Trade Reforms and Wage
Inequality in Colombia”, Journal of Development Economics, 74(2), 331-366.
Attia, Moawad. S. (2009), “The Informal Economy as an Engine for Poverty Reduction
and Development in Egypt”, MRPA Paper No. 13034, 1-31.
ccclxxxi
Avirgan, T; Bivens, J and Gammage, S. (2005), “Good Jobs, Bad Jobs, No Jobs: Labour
Markets and Informal Work in Egypt, El Salvador, India Russia and South
Africa”, Economic policy Institute. Available at: www.epinet.org.
Banerjee, B. (1983), “The Role of Informal Sector in the Migration Process: A Test of
Probabilistic Migration Models and Labour Market Segmentation for India”,
Oxford Economic Papers, 35(3), 399-422.
Banuri, T., Kemal, A. R and Mumtaz, K. (Eds) (1997), “Just Development: Beyond
Adjustment with a Human Face”, Oxford University Press, Karachi.
Bauder, H. (2008), “Explaining Attitudes towards Self-Employment among Immigrants”,
A Canadian Case Study Journal Compilation, IOM International Migration,
46(2), 109-133.
Beal, J. (1997), “Assessing and Responding to Urban Poverty: Lessons from Pakistan”,
IDS Bulletin, 28(2), 58-67.
Becker, G. S. (1962), “Investment in Human Capital: A Theoretical Analysis”, Journal of
Political Economy, 70(5), 9-49.
Becker, G. S. (1965), “A Theory of Allocation of Time”, Economic Journal, 75(299),
493-517.
Becker, G. S. (1974), “A Theory of Marriage in Theodore W.Schultz, ed., Economics of
Family”, Chicago: University of Chicago Press, 293-344.
Becker, Gary. S. (1988), “Family Economics and Macro Behaviour”, American
Economic Review, 78(1), 1-13.
ccclxxxii
Becker, Gary. S. (1964), Human Capital, A Theoretical and Empirical Analysis with
Special Reference to Education, New York: National Bureau of Economic
Research.
Becker, G. S. (1981), A Treatise on the Family, Cambridge, Mass.: Harvard University
Press.
Becker, K. F. (2004), “Facts Finding Study: The Informal Economy”, Swedish
International Development Agency.
Behrman, J. R. (1995), “Pakistan: Human Resource Development and Economics Growth
into the Next Century”, Background Paper for Pakistan 2010, Washington: The
World Bank.
Berndt, E. R. (1991), The Practice of Econometrics: Classic and Contemporary,
Reading. Addition-Wesley Publishing Company.
Bhattacharyya, S. K and Korinek, K. (2007), “Opportunities and Vulnerabilities of
Female Migrants in Construction Work in India”, Asian and Pacific Migration
Journal, 16 (4), 511-531.
Blanchflower, D. (2004), “Self-Employment. More May Not Be Better”, Swedish
Economic Policy Review, 11(2), 15-74.
Blaug, M. (1969), Economics of Education 2, London: Richard Clay Ltd.
Blaug, Mark (ed) (1976a), “The Empirical Status of Human Capital Theory: A Slightly of
Human Capital Theory: A Slightly Jaundiced Survey”, Journal of Economic
Literature, 14(3), 827-55.
Blomqvist, A. G. (1978), “Urban Job Creation and Unemployment in LDCs: Todaro vs.
Harris and Todaro”, Journal of Development Economics, 5(1), 3-18.
ccclxxxiii
Blundell, R (ed.), (1987), “Specification Testing in Limited and Discrete Dependent
Variable Models”, Journal of Econometrics, 34(1/2), 1-4.
Boquier, Phillipe. (2005), “Informal Sector Verses Informal Contracts in Nairobi,
Kenya”, IRD Document d travail D, A. Available at: www.dial.prd.fr.
Borjas, G. (1986), “The Self-employment Experience of Immigrants”, Journal of Human
Resource, 21, 485-456.
Bowen, W. G. and T, Alderich, F. (1965), “Labour Force Participation and
Unemployment in Arthur M. Ross, ed., Employment Policy and Labour Market”,
Berkeley, Calif.: University of California Press, pp.115-161.
Bowen, William. G. and Finegan, T. A. (1969), The Economics of Labour Force
Participation, Princeton, N.J.: Princeton University Press.
Boyd, R. L. (1990), “Black and Asian Self-Employment in Large Metropolitan Areas: A
Comparative Analysis,” Society for the Study of Social Problems”, 37(2), 258-
274.
Breman, J. (1976), “A Dualistic Labour System: A Critique of the „Informal Sector
Concept”, Economic and Plitical Weekly, 11 (48), 1870-1876.
Bulutay, T and Tasti, E. (2004), “Informal Sector in the Turkish Labour Market”,
Discussion Paper No. 22, Turkish Economic Association.
Burki, A. A and Abbas, Q. (1991), “Earnings Functions in Pakistan‟s Urban Informal
Sector: A Case Study”, The Pakistan Development Review, 30 (4), 695-706.
Burki, A. A. and Ubaidullah (1992), “Earnings, Training, and Employment in
Gujranwala‟s Urban Informal Sector: Evolution or involution?”, Pakistan
Economic and Social Review, 30(1), 49-66.
ccclxxxiv
Burki, A.A and Afaqi, U. (1996), “Pakistan‟s Informal Sector: Review of Evidence and
Policies Issues”, Pakistan Journal of Applied Economics, 12(1), 1-30.
Burki, A. A. (1990a), “Urban Informal Sector in Pakistan: Some Selected Issues”, Sixth
Annual Generally Meeting of the Pakistan Society of Development Economist.
Islamabad. Pakistan Institute of Development Economics.
Calves, A. and Schoumaker, B. (2004), “Deteriorating Economic Context and Changing
Patterns of Youth Employment in Urban Burkina Faso”, World Development,
32(8), 1341-1354.
Cavalcanti, C. (1981), “Employment, Production and Income Distribution in the Informal
Urban Sector of the Northeast: The Case of Salvador”, Bahia Luso-Brazilian
Review, 18(1), 139-154.
Chattopadhay, S. (2012), Education and Economics: Disciplinary Evolution and Policy
Discourse, Oxford University Press.
Chen, M. A. (2001), “Women in the Informal Sector: A Global Picture, the Global
Movement”, SAIS Review, 21(1), 1-10.
Chenery, H. B et al. (1974), Redistribution with Growth, London: Oxford University
Press.
Chickering, A. L and Salahdine, M. (1991), “The Silent Revolution: The Informal Sector
in Five Asian and Near Eastern Countries”, International Center for Economic
Growth.
Chaudhuri, T. D. (1989), “A Theoretical Analysis of the Informal Sector, World
Development, 17(3), 351-355.

ccclxxxv
Chowdhury, U. (2006), Informal Sector in a Developing Economy, Anmol Publication
PVT, LTD, India.
Chukuezi, C. O. (2010), “Urban Informal Sector and Unemployment in Third World
Cities: The Situation in Nigeria”, Asian Social Science, 6(8), 1-131.
Cohen, D and Prusak, L. (2001), “In Good Company: How Social Capital Makes
Organizations Work”, Cambridge: Harvard Business Press.
Cohen, M. S., Samuel A. Rea, and Robert I. Lerman (1970), “A Micro Model of Labour
Supply”, Washington, D.C.: U.S. Bureau of Labour Statistics, BLS Staff Paper
No.4.
Cole, W. E and Sander, R. D. (1985), “Internal Migration and Urban Employment in the
Third World”, American Economic Review, 75(3), 481-494.
Coleman, J. (1990), „Foundations of Social Theory’. Cambridge Mass: Harward
University Press.
Dasgupta, S. (2003), “Structural and Behavioral Characteristics of Informal Service
Employment: Evidence from a Survey in New Delhi”, Journal of Development
Studies, 39 (3), 51-80.
Desoto, H. (1989), The Other Path: The Invisible Resolution in the Third World, New
York: Harper and Row.
Denis, Goulet. (1971), The Cruel Choice: A new Concept in the Theory of Development,
New York: Atheneum.
Doan, R. M. (1992), “Differentiation and the Informal Sector in Amman, Jordan”,
International Journal of Middle East Studies, 24(1), 27-38.
ccclxxxvi
Ebrahim, G.J. (1984), “Health Care and the Urban Poor”, in Richards, P.J and Thomson,
A. M (1984), Basic Needs and Urban Poor: The Provision of Communal
Services, International Labor Organization.
Economic and Social Commission for Asia and the Pacific (ESCAP), 2006, “Poverty and
the Informal Sector: Role of the Informal Sector in Poverty Reduction”, Third
session. Available at: www.unescap.org.
Etherington, K and Simon, D. (1996), “Paratransit and Employment in Phnom Penh: the
Dynamics and Development Potential of Cyclo Riding)”, Journal of Transport
Geography, 4(1), 37-53.
Ehrenberg, R. G and Smith, R. S. (1985), Modern Labor Economics: Theory and Public
Policy, Fifth Edition Harper Collins College Publishers.
Fakuchi, T. (1998), “A Simulation Analysis of the Urban Informal Sector”, Developing
Economies, Xxxvi, 225-56.
Fan, C. C. (2001), “Migration and Labour Market Returns in Urban China: Results from
a Recent Survey in Guangzhou”, Environment and Planning, 33, 479-508.
Fie, J. C.H and Ranis, G. (1964), Development of the Labour Surplus Economy, Theory
and Policy, Homewood, III: Irwin.
Fields, G. S. (1975), “Rural-Urban Migration, Urban Unemployment and
Underemployment, and Job-Search Activity in LDCs”, Journal of Development
Economics, 2 (1975), 165-187.
Fields, G. S. (1990), “Labour Market Modelling and the Urban Informal Sector: Theory
and Evidence in D.Tumham, B.Salome, and A.Schwarz, eds, The Informal Sector
Revisted (Paris: Organization for Economic Cooperation and Development
(OECD).
ccclxxxvii
Fields, G. (1988), “Employment and Economic Growth in Costa Rica”, World
Development, 16(2), 1493-1509.
Freire, P. (1990), Pedagogy of the Oppressed, New York: Continum.
Florez, E.C. (2003), “Migration and Urban Informal Sector in Colombia”, Paper Prepared
for Conference on African Migration in Comparative Perspective, Johannesburg,
South Africa.
Fortin, B; Marceau, N and Savard, L. (1997), “Taxation, Wage Controls and the Informal
Sector”, Journal of Public Economics, 66(2), 293-312.
Frost and Jon (2008), “Returns to Qualification in Informal Employment: A Study of
Urban Youth and in Egypt. MPRA Paper No. 12599.
Funkhouser, E. (1996), “The Urban Informal Sector in Central America: Household
Survey Evidence”, World Development, 24(11), 1737-1751.
Galbraith, J. k. (1979), The Nature of Mass Poverty, Cambridge: Harvard University
Press.
Gallaway, T. H. and Bernasek, A. (2002), “Gender and Informal Sector Employment in
Indonesia”, Journal of Economic Issues, 36(2), 313-321.
Grootaert, C and Bastelaer, T. (2001), “Understading and Measuring Social Capital”,
Initiative Working Paper No .24.The World Bank, Social Development Family
Environmentally and Socially Sustainable Development.
Ghayur, S. (1993), “Employment Pattern and Extent of Underutilization of Manpower in
Burani Areas of Pakistan”, Pakistan Development Review, 30(4), 1225-1233.

ccclxxxviii
Ghosh, P.K ed. (1984), Third World Development: A Basic Needs Approach, Westport,
Conn: Green-Wood Press.
Gindling, T. H and Terrell, K. (2005), “The Effect of Minimum Wages on Actual Wages
in Formal and Informal Sectors in Costa Rica”, World Development, 33(11),
1905-1921.
Goulet, D. (1971), The Cruel Choice: A New Concept in Theory of Development, New
York: Atheneum, 1971.
Government of Pakistan (1998), “District Census Report of Bahawalpur”, Population
Census Organization, Statistics Division, Government of Pakistan, Islamabad.
Government of Pakistan, (1998), “District Census Report of Dera Ghazi Khan,”
Population Census Organization, Statistics Division, Government of Pakistan,
Islamabad.
Government of Pakistan, (1998), “District Census Report of Multan”, Population Census
Organization, Statistics Division, Government of Pakistan, Islamabad.
Government of Pakistan (2007), “Pakistan Economic Survey”, Ministry of Finance,
Government of Pakistan, Islamabad.
Government of Pakistan (2009), “Pakistan Economic Survey”, Ministry of Finance,
Government of Pakistan, Islamabad.
Government of Pakistan (2010), Pakistan Economic Survey, Ministry of Finance,
Government of Pakistan, Islamabad.
Government of Pakistan (2011), “Pakistan Economic Survey”, Ministry of Finance,
Government of Pakistan, Islamabad.
ccclxxxix
Government of Pakistan (2012-2013), “Pakistan Economic Survey”, Ministry of Finance,
Government of Pakistan, Islamabad.
Government of Pakistan (2005-2006), “Labour Force Survey 2005-2006”, Federal
Bureau of Statistics, Statistical Division, Islamabad.
Government of Pakistan (2011-2012), “Labour Force Survey 2011-12”, Federal Bureau
of Statistics, Statistical Division, Islamabad.
Grant, U. (2008), “Opportunity and Exploitation in Urban Labour Markets‟, ODI Briefing
Paper No 44: London, UK.
Gronau, R. (1973b), “Human Production: A Forgotten Industry”, Review of Economics
and Statistics, 62(5), 408-415.
Gronau, R. (1986), “Home Production: A Survey Chapter 4 in Orley Ahsenfelter and
Richard Layard, eds., Handbook of Labour Economics,” Vol. 1, New York:
Elsvier Sciences BV, pp. 273-304.
Guang, L and Zheng, L. (2005), “Migration as the Second Best Option: Local Power and
Off-farm Employment”, China Quarterly, 181, 22-45.
Gujrati, D.N. (1995), Basic Econometrics, Third Edition, New York: Mcgraw Hill, Inc.
Gunatilaka, R. (2008), “Informal Employment in Sri Lanka: Nature, Probability of
Employment and Determinants of Wages”, Prepared for ILO Colombo Version,
ILO Asia-Pacific Working Series.
Hall, Robert E. (1973), “Wages, Income and Hours of Work in the U.S. Labour Force”,
“in Glen C. Cain and Harold W. Watts, eds., Income Maintenance and Labour
Supply, Chicago: Rand Mcmally.102-162.

cccxc
Harris, J. R. and Todaro, M. P (1970), “Migration, Unemployment and Development: A
Theoretical Analysis”, American Economic Review, 60(1), 126–142.
Hart, K. (1971), “Informal Income Opportunities and Urban Employment in Ghana‟, in
Jolly, R et al. (eds), Third World Employment: Problems and Strategy, Penguin,
Harmondsworth.
Hart, j. K. (1973), “Informal Income Opportunities and Urban Employment in Ghana”,
Journal of Modern African Studies, 11(1), 61-89.
Hausman, J. A. (1981a), “Labour Supply, “in Henry J. Aaron and Joseph A. Peechman,
eds., How Taxes Affect Economic Behaviour”, Washington, D.C.: The Brookings
Institution, pp. 27-72.
Hayami, Y; Dikshit, A. K. and Mishra, S. N. (2006), “Waste Pickers and Collectors in
Delhi Poverty and Environment in an Urban Informal Sector”, Journal of
Department Studies, 42(1), 41-69.
Heckman, J. J. (1979), “Sample Selection Bias as a Specification Error,” Econometrica,
47(1), 153-162.
Heckman, J. J; Lane J. Lachner, L. J and Todd, P. E. (2008), “Earnings Functions and
Rates of Return”, Working Paper No. 13780, National Bureau of Economic
Research.
Heckman, J. J. (1974b), “Shadow Prices, Market Wages and Labour Supply”,
Econometricica, 42(4), 679-694.
Henley, Anrew, Arabsheibani. G. Reza and Carneiro, G. Franciso (2006), “On Defining
and Measuring the Informal Sector”, IZA Disccussion Paper No. 2473.
cccxci
Hill, A. M. (1983), “Female Labour Force Participation in Developing and Developed
Countries--Consideration of Informal Sector,” Review of Economics and
Statistics, 65(3), 459-468.
Hirshman, A. O. (1958), The Strategy of Economic Development, Yales University Press.
House, W. J. (1984), “Nairobi‟s Informal Sector: Dynamic Entrepreneurs or Surplus
Labour?”, Economic Development and Cultural Change, 32(2), 277–302.
Hout, M. and Rosen, H. (2000), “Self-employment, Family Background, and Race”,
Journal of Human Resources, 35(4), 670-692.
Husman, J. A. and Paul, R. (1984), “Family Labour Supply With Taxes”, American
Economic Review, 74 (2), 242-248.
Hussmanns, R. and Farhad, M. (2001), Statistical Definition of the Informal Sector-
International Standards and National Practices. Available at: www.gdrc.org.
Ihrig, J. and Moe, K. (2004), “Lurking in the Shadows: The Informal Sector and
Government Policy”, Journal of Development Economics, 73(2), 541–557.
International Labour Organization (1972), Employment, Incomes and Equality: A
Strategy for Increasing Productive Employment in Kenya. ILO, Geneva.
International Labour Organization (2000), Very Child Counts, International Labour
Office, Geneva.
cccxcii
International Labour Organization (2002a), Decent Work in the Informal Economy
International Labour Office, Geneva.
International Labour Organization (2002), Women and Men in the Informal Economy, A
Statistical picture, International Labour Office, Geneva.
International Labour Organization (2005), Facts on Child Labour. Available at:
www.ilo.org.
Charmes, J. (2002), “Estimations and Survey Methods for the Informal Sector, University
of Versailles-St Quentin en Yvelines, Centre of Economics and Ethics for
Environment and Development.
Jampaklay, A; Korinek, k and Entwisle, B. (2007), “Residential Clustering among Nang
Rong Migrants in Urban Settings of Thailand”, Asian and Pacific Migration
journal, 16(4), 485-510.
Jones, P (1997), “The Impact of Minimum Wage Legislation in Developing Countries
Where Coverage is Incomplete”, WPS/98-2, Centre for the Study of African
Economies, Institute of Economics and Statistics, University of Oxford.
Jutting, J; J, Perlevliet and T, Xeniogiani (2008), “Informal Employment Re-loaded”,
Institute of Development Studies, (IDS) Bulletin, 39(2), 28-37.
Kazi, S. (1987), “Skill Formation, Employment and Earnings in the Urban Informal
Sector”, The Pakistan Development Review, XXVI (4), 711-719.
Kemal, A. R and Mahmood, Z. (1998), “Characteristics of the Workers In the Urban
Informal Sector of Pakistan”, Research Report No 160, Pakistan Institute of
Development Economics, Islamabad, pp. 1-25.
cccxciii
Kemal, A. R and Mehmood, Z. (1993), “The Urban Informal Sector of Pakistan: Some
Stylized Facts”, Research Report No.161, Pakistan Institute of Development
Economics, Islamabad.
Kemal, A. R and Mehmood, Z. (1993), “Labour Absorption in the Informal Sector and
Economic Growth in Pakistan”, Informal Sector Study No. 2, Pakistan Institute of
Development Economics, Islamabad.
Kementa, J. (1971), “Elements of Econometrics”, London: Macmillan Publishing
Company.
Keynes, J. M. (1936), The General Theory of Employment, Interest and Money,
Macmillan Cambridge University Press.U.S. A.
Killingworth, M. R. (1983), “Labour Supply”, New York: Cambridge University Press.
Kim, B. (2005), “Poverty and Informal Economy Participation”, Economics of
Transition, 13(1), 163-185.
Kirke, J and Arther, J. (1984), “Water Supply Issues”, in Richards, P. J and Thomson, A.
M (1984), Basic Needs and Urban Poor: The Provision of Communal Services,
International Labor Organization.
Koo, H and Smith, P. C. (1983), “Migration, the Urban Informal Sector, and Earnings in
the Philppines”, Socialogical Quarterly, 24(2), 219-232.
Kosters, Marvin (1966), “Income and Substitution Effects in a Family Labour Supply
Model,” Santa Monica, Calif.: Rand Corporation, Report No. 3339.
Kozel, V and Alderman, H. (1990), “Factors Determining Work Participation and Labour
Supply Decisions in Pakistan‟s Urban Areas”, Pakistan Development Review,
29(1), 1-18.

cccxciv
Krstic, G and Sanfey P. (2006), “Mobility, Poverty and Well–Being among the
Informally Employed in Bosnia and Herzegovina”, Economic Systems, 31(3),
311-335.
Kumar, N and Aggarwal, S. C. (2003), “Patterns of Consumption and Poverty in Delhi
Slums”, Economic and Political Weekly, 38(50), 5294-5300.
Kuznets, S. (1959), Six Lectures on Economic Growth. Glencoe, Free Press.
Levin, Carol. E., Marie, T. Ruel, Saul, S. Morris, Daniel, G. Maxwell, Margaret, Armar-
Klemesu and Clement, A. (1999), “Working Women in an Urban Setting:
Traders, Vendors and Food Security in Accra”, World Development, 27(11), 33-
47.
Lewis, Arthur. W. (1954), “Economic Development with Unlimited Supplies of Labour,
Manchester School”, 22(154), 139-191.
Lewis, H. Gregg (1957), “Hours of Work and Hours of Leisure”, Proceedings of the
Industrial Relations Research Association, pp.196-206.
Lewis, W. Arthur (1995), Theory of Economic Growth, Homeland: Irwin.
Loayza, Norman. V. (1996), “The Economics of the Informal Sector: A Simple Model
and Some Empirical Evidence from Latin America”, Carnegie-Rochester
Conference Series on Public Policy, 45, 129-162.
Lundberg, S. (1985), “The Added Worker Effect”, Journal of Labour Economics, 3(1),
Supplement, Part 1, 11-37.
cccxcv
Machlup, F. (1982), “Issues in the Theory of Human Capital: Education as Investment”,
Pakistan Development Review, 21(1), 1-9.
Mandelman, F.S and Montes-Rojas, G.V. (2009), “Is Self-Employment and Micro –
Entrepreneurship a Desired Outcome?” World Development, 20(10), 1-9.
Mahmood, Z. (1998), “A Social Sector Strategy for Pakistan”, Research Report No.163,
Pakistan Institute of Development Economics, Islamabad.
Malik, M. H. (1996), “Urban Poverty Alleviation through Development of the Informal
Sector”, Asia Pacific Development Journal, 3(2), 31-48.
Malik, S. J. and Nazli, H. (1999), “Population, Employment and the State of Human
Resources, Oxford University Press, Karachi,” pp. 328-373.
Malik, S., Faridi, M. Z, Hussain, S. and Shoukat, M (2010), “Socio-Economic Factors
Affecting Casual-Employment in Pakistan: An Empirical Analysis”, European
Journal of Economics, Finance and Administrative Sciences, 20, 127-138.
Maloney, W. (1999), “Does Informality Imply Segmentation in urban Labour Markets?
Evidence from Sectoral Transitions in Mexico”, World Bank Economic Review,
13(2), 275-302.
Manda, D. K; Mwabu, G; Kimenyi, M. S. (2002), “Human Capital Externalities and
Returns to Education in Kenya”, Kipra Discussion Paper No.13, Social Sector
Division, Kenya Institute for Public Policy Research and Analysis.
Mentzakis, E; mcmee, P and Ryan, M. (2008), “Who Cares and How Much: Exploring
the Determinants of Co-residential Informal Care”, Review of the Economics of
Household, 7(3), 283-303.
cccxcvi
Marcelli, E. A. (2004), “Unauthorized Mexican Immigration, Day Labour and other
Lower-Wage Informal Employment in California”, Regional Studies, 38, 1-13.
Marshall, M. I and Oliver, W. N. (2005), “The Effects of Human, Financial, and Social
Capital on the Entrepreneurial Process for Entrepreneurs for Indiana”, Paper
Prepared for presentation at the Allied Social Science Associations Annual
Meeting Philade Phia, Pennsylavama.
Matiya, G; Wakabayashi, Y; Ng‟on‟Ola, D and Takenounchi, N. (2005), “A Logit
Analysis of Socio-economic Factors Influencing People to Become Fisherman
around Lake Malombe in Malawi”, Journal of Applied Science Research, 1(1),
18-23.
Mazumdar, D. (1976), “The Urban Informal Sector”, World Development, 4(8), 655-679.
McGee, T. G. (1973), “Peasants in the Cities: A Paradox, A Most Ingenious Paradox”,
Human Organization, 32(2), 135–142.
Mddala, G. S. (1983), Limited Dependent and Qualitative Variables in Econometrics,
Canbridge, England: Cambridge University Press”, Econometric Society
Monographs No. 3.
Meier, G. M. (1970), Leading Issues in Economic Development, 2nd
Ed. Oxford: Oxford
University Press.
Meng, X. (2001), “The Informal Sector and Rural –Urban Migration: A Chinese Case
Study”, Asian Economic journal, 15(5), 71-89.
Merrick, T. W. (1976), “Employment and Earnings in the Informal Sector in Brazil: The
Case of Belo Horizonte”, Journal of Development Areas, 10(3), 337-354.
cccxcvii
Mincer, J. (1958), “Investment in Human Capital and Personal Investment in Human
Capital and Personal Income Distribution”, Journal of Political Economy, 66(4),
281-302.
Mincer, J. (1963), “Market Prices, Opportunity Costs, and Income Effects”, in Carl
Christ, ed., Measurement in Economics: Essays in Honor of Yehuda Grun-field,”
Stanford, Calif.: Stanford University Press, pp. 67-82.
Mincer, J. (1962), “Labour Force Participation of Married Women: A Study of Labour
Supply,” in H. Gregg Lewis, ed., Aspects of Labour Economics, Princeton, N.J.:
Princeton University Press, pp.63-97.
Mincer, J. (1970), “The Distribution of Labour Incomes: A Survey with Special
Reference to the Human Capital Approach”, Journal of Economic Literature,
8(1), 1-26.
Mitra, A. (2008), “Social Capital, Livelihood and Upward Mobility”, Habitat
International,” 32(2), 261-269.
Mukhopadhy, I. (1998), “Calcutta‟s Informal Sector: Changing Pattern of Labour Use”,
Economic and Political Weekly, 33(47/48), 3075-3080.
Mukras, M. S. (2003), “Poverty Reduction through Small and Medium Enterprises”,
Botswana Journal of Studies, 17(2), 58-69.
Nadvi, K. M. (1990), “Employment Creation in Urban Microenterprises in the
Manufacturing Sector in Pakistan”, Pakistan Employment and Manpower
Strategies and Policies Project (Pak/88/007).
Nasir, Z. M. (1998), “Determinants of Personal Earnings in Pakistan: Findings from the
Labour Force Survey 1993-94”, Pakistan Development Review, 37(3), 251-274.

cccxcviii
Nasir, Z.M. (2002), “Returns to Human Capital in Pakistan: A Gender Disaggregated
Analysis”, Pakistan Development Review, 41(1), 1-28.
Naqvi, Z. F and Lubna, S. (2001), “How Do Women Decide to Work in Pakistan”?
Pakistan Development Review, 41(4), part II: 495-513.
Nurkse, R. (1953), Problems of Capital Formation in underdeveloped countries, Oxford
University Press, New York.
Odhiambo, W. and Manda, D. K. (2003), “Urban Poverty and Labour Force Participation
in Kenya”, Kenya Institute for Public Policy Research and Analysis (KIPRA),
Paper to be presented at the World Bank Research Symposium Washington D.C.
Okojie, E, E. C. (1984), “Female Migrants in the Urban Labour Market Benin City
Nigeria”, Canadian Association of African Studies, 18(3), 547-562.
Ozcan, Y; Ucdogruk, S and Ozcan, M. K. (2003), “Wage differences by Gender, Wage
and Self-employment in Urban Turkey”, Journal of Economic Cooperation,
24(1), 1-24.
Pagnataro, M. B. O. (2001), “The Informal Sector in Venezuela: Catalyst or Hindrance
for Poverty Reduction”, Poverty Project Papers Vol. 2, Association Civil Para la
Promocion de Estodios Sociales
Pagés, C and Stampini, M. (2007), “No Education, No Good Jobs? Evidence on the
Relationship Between Education and Labour Market Segmentation”, Discussion
Paper No. 3187, Institute for the Study of Labour.
Pakistan Millinnium Development Goals Report (2013), Ministry of Planning
Development of Pakistan Reforms, Government of Pakistan.
cccxcix
Peattie, L. R. (1980), “Anthropological Perspective on the Concepts of Dualism: The
Informal Sector and Marginalities in Developing Urban Economies”,
International Regional Science Review, 5, 1-31.
Little, Peter. O. (1999), “Selling to Eat: Petty Trade and Traders in Peri-urban Areas of
Sub-Saharan Africa”, A Research Paper Presented for the Broadening Access and
Strengthening Input Market Systems- Collaborative Research Support Programme
(BASIS-CRSP), Institute for Development Anthropology.
Pisani, Mi. J, and Yoskowitz, D. W. (2005), “Grass, Sweat, and Sun: An Exploratory
Study of the Labour Market for Gardeners in South Texas”, Social Sience
Quarterly, 86(1), 229-251.
Pradhan, M and Soest, V. A. (1995), “Formal and Informal Sector Employment in Urban
Areas of Bolivia”, Labour Economics, 2, 275-297.
Pratap, S and Quintin, E. (2006), “Are Labour Markets Segmented in Developing
Countries? A Semi Parametric Approach”, European Economic Review, 50, 1817-
1841.
Putnam, R. (1993), Making Democracy Work: Civic Traditions in Modern Italy.
Princeton: Princeton University Press.
Qiu, T and Hudson, J. (2010), “Private Returns to Education in Urban China”, Econ
Change Restruct, 43, 131-150.
Quijano, A. (1974), “The Marginal Pole of the Economy and the Marginalized Labour
Force”, Economy and Society, 3(4), 393–428.
Raijman, R. (2001), “Determinants of Entrepreneurial Intentions: Mexican Immigrants
in Chicago”, Journal of Socio- Economics, 30(5), 393-411.
cd
Rama, M. (1994), “Flexibility in Sri Lanka's Labour Market”, Policy Research Working
Paper No.1262, Washington DC: The World Bank.
Ranis, G and Stewart, F. (1995), “V-Goods and the Role of the Urban Informal Sector in
Development”, Working Paper No. 85.
Rauch, J. (1991), “Modellng the Informal Sector Formally”, Journal of Development
Economics, 35(1), 33-47.
Reddy, M. (2007), “Modeling Poverty Dimensions of Urban Informal Sector Operators in
a Developing Economy”, European Journal of Development Research, 19(3),
459-479.
Reddy, M; Naidu, V. and Mohanty, M. (2003), “The Urban Informal Sector in Fiji”, Fiji
Institute of Applied Studies, 1(1), 127-154.
Richardson (1984), “The Role of Informal Sector in Developing Countries: An
Overview”, RDD, 5, 3-55.
Roberts, D. K. (2001), “The Determinants of Job Choice by Rural Labor Migrants in
Shanghais”, China Economic Review, 12 (1), 15-39.
Rosenstein-Rodan, P. N. (1964), Capital Formation and Economic Development,
London: Aleen and Unwin.
Rosser, J. B; Jo, Marina V. R and Ahmad, E. (1999), “Income, Inequality and Informal
Economy in Transition Economies”, Journal of Comparative Economics, 28(1),
156-171.
Richardson, H. W. (1987), “The Costs of Urbanization in Developing Countries”,
Economic Development and Cultural Change,” 30(3), 625-648.
cdi
Rostow, W. W. (1960), The Stages of Economic Growth: A Non-communist Manifesto,
London: Cambridge University Press.
Sandefur, J. (2006), “Explaining the Trend towards Informal Employment in Africa:
Evidence from Manufacturing Sector”, Center for the Studies of African
Economies, Oxford University.
Sargana, M. A. (1998), “The Urban Informal Sector in an Adjusting Economy: The Case
of Pakistan”, Pakistan Development Review, 37(4), 11-27.
Sarte, P. D. G. (2000), “Informality and Rent-seeking Bureaucracies in a Model of Long-
run Growth,” Journal of Monetary Economics, 46(1), 173-197.
Sawaminanthan, M. (1991), “Understanding the Informal Sector: A Survey”, Working
Paper No. 95, World Institute for Development Economics Research of the
United Nations.
Schiitte, S. ﴾2009﴿, “Informal Insecurity in Urban Afghanistan”, Iranian Studies, 42(3),
465-491.
Schmpeter, J. A. (1995), Theory of Economic Development: An Inquiry into Profit,
Credit, Interest, and Capital the Business Cycle, Social Science Classic Series.
Schultz, T. W. (1960), “Capital Formation by Education”, Journal of Political
Economy, 68(6), 571-583.
Schultz, T.W. (1961), “Investment in Human Capital. American Economic Review,”
51(1), 1-17.
Sethuraman, S. V. (1976), “The Urban Informal Sector, Concept, Measurement and
Policy”, International Labour Review, 114(1), 69-81.

cdii
Siddiqui, R and Siddiqui, R. (1998), “A Decomposition of Male-female Differentials”,
Pakistan Development Review, 37(4), 885-898.
Smith, A. (1776), The Wealth of Nations, London: J. M. Dent and Sons, Reprinted in
1937 as the Cannan edition by The Modern Library, Random House, New York.
Smith, P.A. & Metzger, M.R. (1998), “The Returns to Education: Street Vendors in
Mexico”, World Development, 26(2), 289-296.
Solow, R. M. (1956), “A Contribution to the Theory of Economic Growth”, Quarterly
Journal of Economics, 70 (1), 65-94.
Suharto, EDI (2002), “Human Development and the Urban Informal Sector in Bandung,
Indonesia: The Poverty Issue”, New Zealand Journal of Asian Studies, 4(2), 115-
133.
Suryahadi, A; Widyanti, W; Perwira, D and Sumarto, S. (2003), “Minimum Wage Policy
and its Act on Employment in the Urban Formal Sector”, Bulletin of Indonesian
Economic Studies, 39(1), 29-50.
Tielhet-Waldorf, S. and Waldorf, W. H. (1983), “Earnings of the Self-employed in an
Informal Sector: A Case Study of Bangkok”, Economic Development and
Cultural Change, 31(3), 587-60.
Terrell, K. (1989), “An Analysis of the Wage Structure in Guanatimala City”, Journal of
Developing Areas, 23(3), 405-423.
Todaro, Michael. P. (1969), “A Model of Labor Migration and Urban Unemployment in
Less Developed Countries”, American Economic Review, 59(1), 138-148.
Todaro, M. P and Smith, S. C. (2012), Economic Development, 11th
Edition
Manufactured in the United States of America.
cdiii
Tokman, V. E. (1989), “Policies for Heterogeneous Informal Sector in Latin America”,
World Development, 17(7), 1067-1076.
Tokman, V. E. (1986), “The Informal Sector: Fifteen Years Later”, Paper Presented at
Conference. The Comparative Study of the Informal Sector: Harper‟s Ferry, West
Virginia.
Tokman, V. M. (2007), “The Informal Economy, Insecurity and Social Cohesion in Latin
America, International Labour Review, 146, 81-107.
Tornarolli, L and Gasparini, L. (2007), “Labour Informality in Latin America and the
Caribbean: Patterns and Trends from Household Survey Microdata”, Documento
de Trabajo Nro.46. CEDLAS, Universidad Nacional de La Plata.
United Nations Development Programme (1996), Human Development Report, New
York: Oxford University Press.
United Nations Development Programme (1990), Human Development Report, New
York: Oxford University Press.
United Nations Economic Commission for Africa (1990), Handbook of Manpower
Planning in Africa, Addis Ababa, and UNECA.
UNDP (United Nations Development Programme) (1994), Human Development Report,
New York: Oxford University Press.
United Nations Economic Commission for Africa (1990), Handbook of Manpower
United Nations, Report on the World Social Situation.
cdiv
Valodia, I; Lebani, L and Skinner, C. (2005), “Low-waged and Informal Employment in
South Africa Transformation”, Critical Perspectives in Southern Africa, 60, 90-
126.
Yeh, S. (1984), “Urban Low Income Housing in South East Asia”, in Richards, P.J and
Thomson, A. M (1984), Basic Needs and Urban Poor: The Provision of
Communal Services, International Labor Organization.
Yue, S. (2004), “The Challenge of the Informal Work in the Philippines, ILO”. Sub
Regional Office South-East Asia and the Pacific Manila, Philippines.
Wahba, J. (2002), “The Returns to Education and Regional Earnings Differentials in
Egypt”, Discussion Papers in Economics and Econometrics. Available at:
http://www/soton.ac.uk.
Wamuthenya, R. W. (2010), “Determinants of Employment in Formal and Informal
Sector of the Urban Areas of Kenya”, AERC Research Paper No. 194, African
Economic Research Consortium, Nairobi.
Weeks, J. (1975), “Policies for Expanding Employment in the Informal Urban Sector of
Developing Countries”, International Labour Review, 3(1), 1-13.

cdv
APPENDIX A
FORMAT OF QUESTIONNAIRE
A: Location Southern Punjab:
Tehsil Colony/ Mohala /Ward
Date District
Name
Place of birth: 1: Urban 2: Rural
Name of the household head:
1: When did you migrate from rural to urban area?
2: How much time have you spent in urban area?
B: Characteristics of Formal and Informal Sectors
1: Single: 2: Ownership of premises
3: Age of the firm
4: Working hours
How many hours did you actually work last week? (in one or more jobs or own business)
/how many hours do you usually work per week?
5: Working conditions
C: Household Characteristics
Sr.# Name Sex Age Education Occupation Weekly/Monthly
Income
1
2
3
4
5
6
D: Characteristics of Respondents:
1: Name
2: Sex
Male (1) Female (2)

cdvi
3: Age 4: Education
5: Marital Status a) Married b) Unmarried
6: Sector of Employment: a) Formal b) Informal
Indicate the category of occupation:
b1) Domestic worker b2) Self-employed
b3) Unpaid family worker b4) Own account worker
b5) Wage worker
b6) Salaried worker
E: Spouse Characteristics
1: Age: 2: Education:
3: Occupation: 4: Weekly/ Monthly Income:
5: Hours of Work/day
6: Benefits
7: Hours spent on children
8: Hours Spent on domestic activities
F: Economic condition
1: Farm Size
1) What is the size of land you own? (in Acres)
2) Of the total how much is your own land? (in Acres)
3) How much of the total land is jointly owned (in Acres)
4: Household properties
1) Ownership of land
No. of acreage Value
Other assets
1) No. of shops Value
2) No.of houses Value
3) No. of plots Value
4) No.of animals Value
5) Other assets Value
6) Do you have financial asseets?

cdvii
7) Value of the financial assets

cdviii
5. Do you have some kind of skill training?
If yes?
1. Formal
a) Vocational
b) Technical
c) Politechnique
d) Other
2. Informal
6. How many years have you been working as informal
worker?_______________________
7. How did you join the urban informal sector?
1. Referrals by friends 2. Referrals by relatives 3. Own choice
8. Do you have access to credit?
1. Shopkeeper 2. NGO 3. Family member 4. Bank
9: Location of the place of work
Where is your current or last place of work located?
10: Are you affected by major disease?
If yes
1. Sugar 2. Blood pressure 3. Heart disease 4. Eyesight problem
5. T.B Lings 6. Any other (specify)
11. Do you pay tax?
If Yes?
1. Income tax 2.Professional tax 3. Transportation fee
12. Distance_______________________
I: Human Development Indicators
1. Economic Capital
1.1 Worker‟s Income per month_____________________
1.2 Households‟ income per month_____________________________
2. Human Capital
1. Education Facilities:

cdix
(1) No schooling (2) Primary (3) Middle (4) Matric (5) Intermediate (6) Graduation
(7) Master‟s or higher
3. Health Facilities
Do you visit a doctor to cure illness? Yes/No
Do you approach the hospital when feel sick? Yes/No
Do you avail the health center in case of illness? Yes/No
Do you use traditional healer or self-treatment to cure
sickness? Yes/No
4. Access to Housing Facilities:
Do you avail the facility of clean water supply? Yes/No
Do you have a toilet with a septic tank? Yes/No
Are you electrified? Yes/No
Do you have constructed floor? Yes/No
5. Socio-cultural Activities
Do you have access to socio-cultural activities?
Do you have the benefit of watching Television? Yes/No
Do you listen to the Radio Programmes? Yes/ No
Do you read the newspaper? Yes/No
Do you partake in local organizations? Yes/No