structure sensitivity of the methanation reaction: -induced co...
TRANSCRIPT
Journal of Catalysis 255 (2008) 6–19
www.elsevier.com/locate/jcat
Structure sensitivity of the methanation reaction:H2-induced CO dissociation on nickel surfaces
M.P. Andersson a, F. Abild-Pedersen a, I.N. Remediakis a, T. Bligaard a, G. Jones a, J. Engbæk b,O. Lytken b, S. Horch a, J.H. Nielsen b, J. Sehested c, J.R. Rostrup-Nielsen c, J.K. Nørskov a,
I. Chorkendorff b,∗
a Center for Atomic-scale Materials Design (CAMD), Department of Physics, Nano-DTU, Building 307, Technical University of Denmark,2800 Kgs. Lyngby, Denmark
b Center for Individual Nanoparticle Functionality (CINF), Department of Physics, Nano-DTU, Building 312, Technical University of Denmark,2800 Kgs. Lyngby, Denmark
c Haldor Topsøe A/S, Nymøllevej 55, 2800 Kgs. Lyngby, Denmark
Received 19 October 2007; revised 19 December 2007; accepted 28 December 2007
Available online 15 February 2008
Abstract
The dissociation of CO serves both as a model test reaction on single crystals and as a relevant reaction step for industrial methanation. Wecombined extensive density functional theory calculations, ultra-high vacuum experiments on well-defined single crystals, and catalytic activitymeasurements on supported catalysts in a study of the dissociation mechanism of CO on Ni surfaces. We found that this process is highly structure-sensitive and also is sensitive to the presence of hydrogen: Under ultra-high vacuum, with no hydrogen present, the dissociation proceeds througha direct route in which only undercoordinated sites (e.g., steps) are active. Under methanation conditions, the dissociation also proceeds mostfavorably over undercoordinated sites, but through a COH species.© 2008 Elsevier Inc. All rights reserved.
Keywords: Methanation; CO dissociation; Nickel catalyst; DFT
1. Introduction
The catalytic methanation reaction, CO + 3H2 → CH4 +H2O, has attracted considerable interest since it was reportedby Sabatier [1]. This reaction is used in various industrialprocesses, including the removal of oxo-compounds (COx) inthe feed gas for the ammonia synthesis [2], in connection withgasification of coal, where it can be used to produce methanefrom synthesis gas [3], and in relation to Fischer–Tropsch syn-thesis [4]. Another motivation for understanding this processin detail is purely scientific: It is one of the simplest catalyticreactions and serves as a test bed for our fundamental under-standing of heterogeneous catalysis. Pioneering work by Good-man et al. [5–7] made the first comparison between surface
* Corresponding author.E-mail address: [email protected] (I. Chorkendorff).
science single-crystal experiments [5] and supported Ni cata-lysts [8]. One of the conclusions from this work was that themethanation process proceeds with comparable rates per Niatom on Ni(111) and Ni(100), as well as on supported Ni cat-alysts. It thus appears from these experiments that the reactionis structure-insensitive, whereas the reverse reaction, the steamreforming process, is structure-sensitive [9–13].
In this work, we address the influence of the surface struc-ture on the CO activation on Ni. In general, the geometry oftransition metal surface sites can have a profound impact onthe dissociation probability of diatomic molecules. For exam-ple, NO has been found to dissociate preferentially on stepson Ru(0001) surfaces [14]. The same is true for N2 dissocia-tion, for which both theory and experiments have demonstrateda very large difference in reactivity between close packed sur-faces and steps, corresponding to a difference in activationenergy for dissociation of >1 eV [15,16]. Density functionaltheory (DFT) calculations have shown this to be true in nu-
0021-9517/$ – see front matter © 2008 Elsevier Inc. All rights reserved.doi:10.1016/j.jcat.2007.12.016

M.P. Andersson et al. / Journal of Catalysis 255 (2008) 6–19 7
merous cases [17–21], indicating that the step site should playan important role both in model systems and for supportednanoparticles [17].
When it comes to CO dissociation in low-pressure regime,Yates and coworkers elegantly used isotopic scrambling intemperature-programmed desorption (TPD) experiments on12C16O and 13C18O on stepped Ru(109) under ultra-high vac-uum (UHV) to demonstrate that CO dissociates only throughthe β-state related to steps [22,23], not on the flat Ru(0001)surface [24]. The same techniques were used in a study ofCO dissociation on Ni(111), which found that CO desorbedrather than dissociated during a TPD experiment [25]. This isin agreement with previous work demonstrating no dissociationafter TPD experiments on Ni(511) and Ni(100) by Benndorfand Meyer [26] and Goodman et al. [27], respectively. In con-trast to these results, Nakano et al. used scanning tunnelingmicroscopy (STM) to study the dissociation of CO on severalstepped Ni(111) surfaces [28–30] and found that CO dissoci-ated readily at 400 K [29]. This finding was also demonstratedby Lauritsen et al. using STM [31]. Based on these findings,it is obvious that the details of CO dissociation on Ni surfacesunder UHV remain incompletely understood.
The conclusion that CO dissociation does not occur on Niduring TPD experiments [25–27], which is supported by thedata presented later in this paper, indicates that the barrier fordissociation is larger than for desorption; that is, the dissocia-tion barrier is > ∼1.2 eV [32,33]. This is in disagreement withthe activation energies as low as 1.0–1.1 eV found in studies ofthe kinetics of the methanation over both single crystals and cat-alysts at higher pressures [5–8,34,35]. Although there seems tobe a reasonable consensus on the overall activation energy forthe methanation reaction, this is not the case for the mechanism.Numerous works on supported nickel catalysts have consideredthe kinetics and the mechanism of the methanation process. Forexample, Coenen and co-workers [36] made an extensive studyof the methanation reaction and evaluated several mechanisms;they found an excellent description by a model in which CHx
hydrogenation was assumed to be the rate-limiting step (RLS)and CO and hydrogen dissociation was assumed in equilibrium.This work was followed by a study by Klose and Baerns [37],who claimed that earlier work suffered from transport limita-tions and concluded that the RLS is hydrogenation of CH2. Butthese mechanisms were completely abandoned in a later workby Coenen et al. [38], who, through isotope labeling, deter-mined that no scrambling occurred between labeled 12C18O and13C16O [38] in the reaction mixture, thus proving the assump-tion of equilibrated dissociative adsorption of CO invalid. Theseauthors instead introduced a new model that had been proposedearlier by Van Ho and Harriott [39] in which hydrogen-assistedCO dissociation was assumed to be the RLS. The predictions bythe new model were in good agreement with the experimentaldata; thus, Coenen et al. concluded that either the CO or COHdissociation step could be the RLS [38]. DFT calculations sup-port this picture [20,40]. In addition, Sehested et al. found thatthe methanation rate has a very low prefactor along with a lowactivation energy (1.01 eV) [35]. This is in very good agree-ment with the work on the methanation reaction by Goodman
and co-workers [5–7], who also observed such low prefactorsand low activation energies of 1.07 eV both on single crystalsand in comparison with rates measured on supported catalystsby Vannice [8,34]. In the single-crystal studies, only small dif-ferences (amounting to a factor of two) were found among theNi(111) surface, the more open Ni(100) surface, and supportedNi catalysts. Because similar rates were found for the Ru(001)and Ru(110) surfaces [6,41] the reaction was deemed to bestructure-insensitive, and the RLS was suggested to be an in-terplay of carbide deposition by the disproportionation reactionand carbide hydrogenation.
In this paper, we develop a consistent picture that describesthe UHV results as well as the high-pressure catalyst data bothqualitatively and semiquantitatively. This is obtained throughDFT calculations, surface science experiments under UHV con-ditions, and comparison with experimental data reported hereand in the literature on the methanation reaction.
2. DFT calculations
We performed DFT calculations on numerous differentmodel surfaces displaying close-packed facets, steps, kinks, anddouble-step-sites modeling the edge sites on a finite size parti-cle. Each surface is modeled by a slab with a thickness of threeclose-packed layers. Convergence was checked by also per-forming the DFT calculations for six instead of three Ni(111)layers. This led to a lowering of the barriers by only 0.03 eV.The adsorbates and the topmost Ni layer were allowed to relaxfully in all configurations, and the calculations were performedwith spin polarization included. All transition state energieswere determined by increasing the bond lengths between C andO (for CO dissociation), C and OH (for C–OH dissociation),and CH and O (for HC–O dissociation) in small steps until asaddle point was reached.
All calculations were done using a plane-wave pseudopoten-tial code and the RPBE exchange correlation functional [42].Because we need to compare our results quantitatively to ex-perimental findings, we included a recently proposed correctionscheme [43,44]. We did this to avoid the well-known problemof overbinding when using DFT in combination with the gener-alized gradient approximation (GGA), which gives wrong siteassignment for CO adsorption for many metals [45,46]. Thiscorrection is applied to all CO adsorption energies (and henceto all initial state energies for CO dissociation).
First, we considered in some detail Ni(111) surfaces withdifferent defects. Figs. 1–4 display the results of the DFT calcu-lations for four cases of CO dissociation: at low CO coverage,at low CO coverage with hydrogen present, at high CO cov-erage, and at high CO coverage with hydrogen present. DFTresults for these four cases are collected in Table 1. The differ-ent surface structures are indexed using a letter (A–H).
Figs. 1 and 2 show (at low CO coverage), energies of theinitial state of CO, the transition state, and the final state with-out and with the presence of hydrogen, respectively. Variousdifferent dissociation sites were considered (Table 1). At lowCO coverage without hydrogen present, it was found that COadsorbs most favorably over the kink site (see the insert in
8 M.P. Andersson et al. / Journal of Catalysis 255 (2008) 6–19
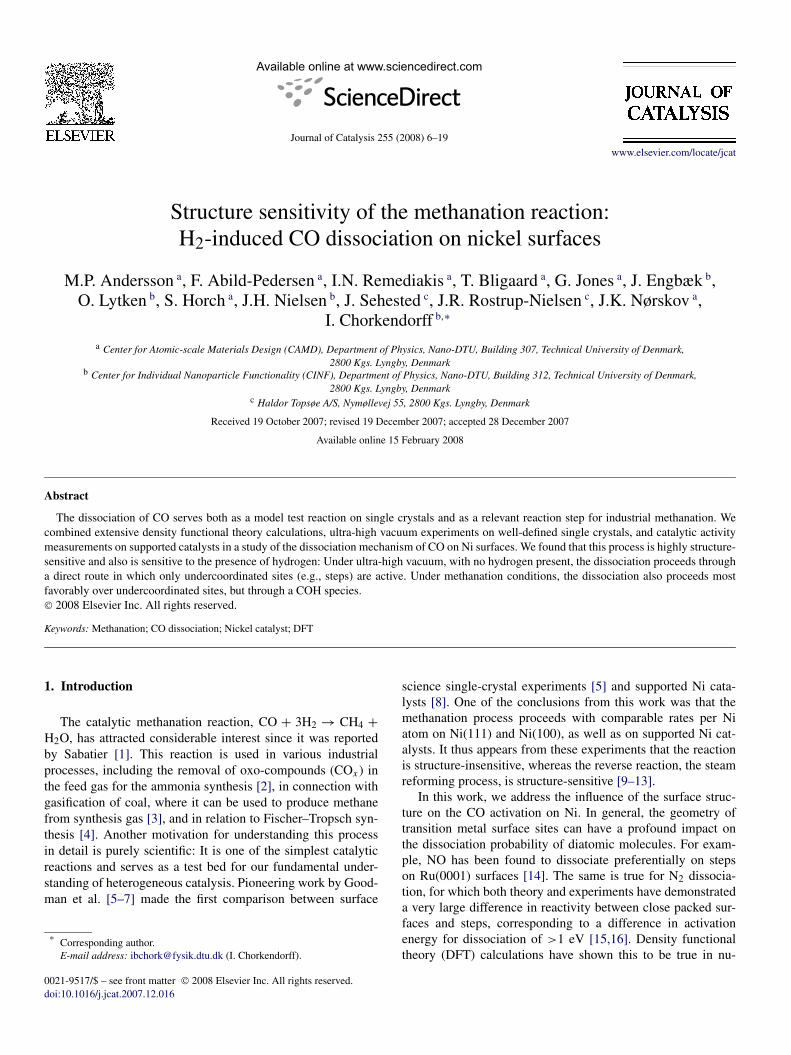
Fig. 1. Energy diagram for CO dissociation on Ni at low CO coverage cor-responding to UHV conditions, showing CO adsorption and dissociation forvarious surface step- and edge structures (solid lines). The different structuresinvestigated are nickel terrace sites, single steps, kinks and double steps. Eachbarrier is associated with an index referring to the actual surface structures,intermediates, and activation energies; notation is explained in Table 1. All re-sults for double step structures and the Ni(100) are shown as dashed lines sincethese structures do not exist on a flat Ni(111) surface with only monatomicsteps as seen in the STM images, see Fig. 9. The disproportionation reaction(Boudouard reaction) on the Ni(211) step is shown in green. The reaction routewith the lowest reaction barrier (1.77 eV) under UHV conditions is pure COdissociation on a Ni(321) surface (kink site, E1) and is shown with a bold line.The configuration of the CO molecule (carbon atom is black, oxygen atom isred) is shown along with the kink site for the initial and transition states. (Forinterpretation of the references to color in this figure legend the reader is re-ferred to the web version of this article.)
Fig. 3. Energy diagram for CO dissociation on Ni at high CO coverage (com-pare with Fig. 1). The most favorable reaction site is the double step site (D3)with an activation barrier of 1.92 eV only slightly higher than the barrier forCO dissociation at low pressures (1.7–1.9 eV). The transition state for the D3structure is shown in the insert.
Fig. 2. Energy diagram for CO dissociation on Ni at low CO coverage, in thepresence of H (compare with Fig. 1). Two mechanisms are considered: H in-duced dissociation via a COH intermediate (red) and via a HCO intermediate(blue). All results for double step structures are again shown as dashed lines.These structures do not exist on a flat Ni(111) surface with only monatomicsteps as seen in the STM images, see Fig. 9. The activation is most favor-able via COH over a kink site (1.22 eV, E2), but other undercoordinated sitesare also active, see Table 1. The transition state for the E2 structure is shownin the insert (hydrogen atoms are white). (For interpretation of the referencesto color in this figure legend the reader is referred to the web version of thisarticle.)
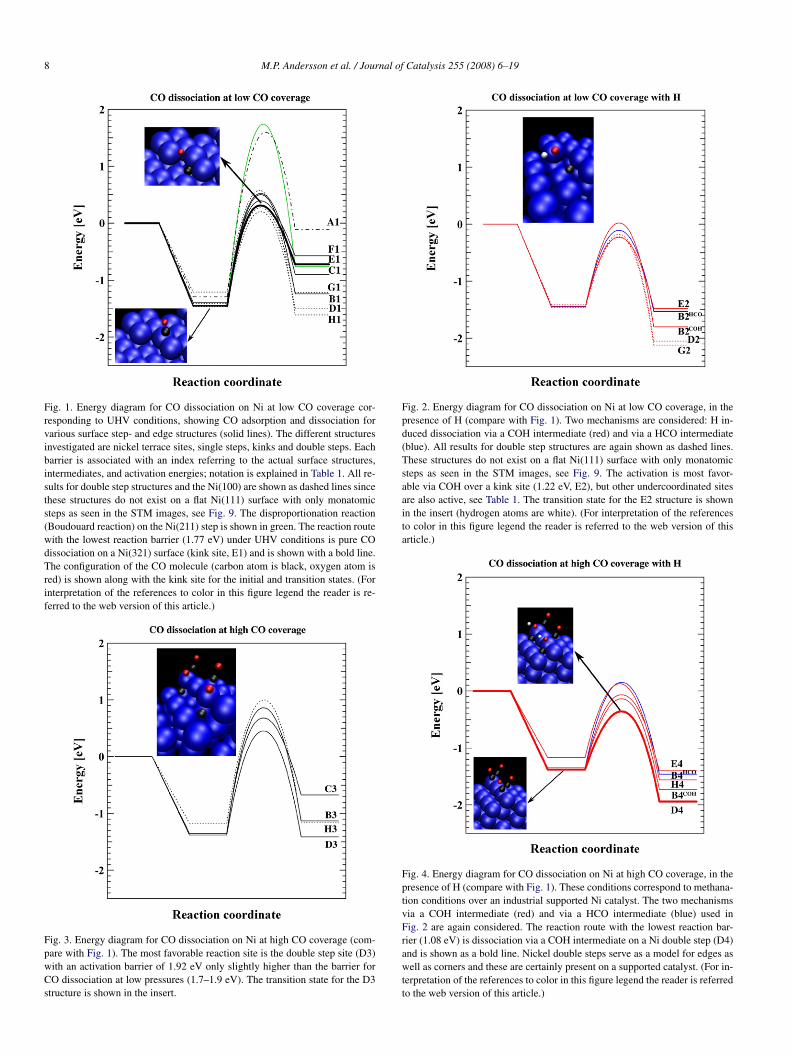
Fig. 4. Energy diagram for CO dissociation on Ni at high CO coverage, in thepresence of H (compare with Fig. 1). These conditions correspond to methana-tion conditions over an industrial supported Ni catalyst. The two mechanismsvia a COH intermediate (red) and via a HCO intermediate (blue) used inFig. 2 are again considered. The reaction route with the lowest reaction bar-rier (1.08 eV) is dissociation via a COH intermediate on a Ni double step (D4)and is shown as a bold line. Nickel double steps serve as a model for edges aswell as corners and these are certainly present on a supported catalyst. (For in-terpretation of the references to color in this figure legend the reader is referredto the web version of this article.)

M.P. Andersson et al. / Journal of Catalysis 255 (2008) 6–19 9
Fig. 1), which also offers a favorable transition state geom-etry for CO dissociation (see the insert) with an activationenergy of 1.77 eV (Table 1, E1). At a double step, the acti-vation energy was even lower (1.66 eV, D1), and at an ordi-nary step with no kinks, it was 1.91–1.94 eV (C1, B1). Thisshould be compared with an activation energy for CO dissoci-ation of 2.85 eV (A1) on a terrace site on Ni(111). Some othersites investigated displayed intermediate barrier heights (seeTable 1). Because it also has been suggested that CO can disso-ciate through a disproportionation reaction [5], this possibility
was considered on step sites as well; this led to an activationenergy of 3.2 eV, and thus this pathway was not considered fur-ther.
We conclude that in the absence of H, CO dissociation at de-fects with low coordination number was strongly favored overthe close-packed Ni(111) surface and that the activation energyat the defects had a value of 1.7–1.9 eV. Furthermore, the tran-sition state energy was located above the CO gas-phase energy,suggesting that CO will primarily desorb rather than dissociatein a TPD experiment.
Table 1Collection of the calculated activation energies for the CO dissociation on a number of different surface structures. In order to visualize the details of the surfacestructure, only parts of the unit cell used for the calculation are shown here. The calculations consider low and high CO coverages and the absence and presence ofhydrogen. The various reaction ensembles are indexed using a letter (A–H), describing the type of active site, and a number (1–4), describing the various reactionconditions, as explained in the table. This notation is used throughout the paper, in particular in Figs. 1–4. The values for E1 and D4 are shown in bold, as these arethe relevant structures and activation energies for comparison to the UHV experiments and the methanation experiments, respectively
CO dissociation Ea (eV)
1low θCO
2low θCO with H
3high θCO
4high θCO with H
A 2.85 – – –
(111) terrace
B 1.941.33 (via HCO)
1.46 (via COH)2.30
1.59 (via HCO)
1.30 (via COH)
(211) step
C 1.91 – 2.12 –
(221) step
D 1.66 1.24 (via COH) 1.92 1.08 (via COH)
(311) double step
E 1.77 1.22 (via COH) – 1.37 (via COH)
(321) kink
F 1.87 – – –
(431) kink
G 1.68 1.23 (via COH) – –
(511) double step
H 1.87 1.21 (via COH) 2.17 1.29 (via COH)
(100) terrace

10 M.P. Andersson et al. / Journal of Catalysis 255 (2008) 6–19
Fig. 5. The phase diagram shows the calculated edge configuration with the lowest free energy under various hydrogen and carbon monoxide pressures at 500 K. Allenergies are calculated using a two atom wide unit cell corresponding to Ni(211). The nearest neighbor interactions are taken into account via this approximation,and the entropy for gas phase species is included using standard formulas and the entropy for surface species is approximated using the harmonic vibrational entropy.Zero point energies are also included in the calculation of enthalpies. UHV and methanation conditions are indicated in the figure with grey areas. A black linebetween two or three different phases corresponds to an equal mixture of the neighboring phases whereas the grey lines are drawn parallel to the black lines andindicates that 75% of the surface is covered with the majority phase far from any triple point.
Investigating the effect of hydrogen first at low CO cover-ages (and pressures) requires knowledge of CO and H cover-age at the reactive step site. Consequently, we constructed aphase diagram of the most dominant surface step configura-tion on Ni(211) (with a unit cell two atoms wide) as a func-tion of CO and H2 pressures through a statistical mechanicsapproach (Fig. 5). A temperature of 500 K (a typical metha-nation reaction temperature) was used. All entropies were cal-culated from the molecular partition functions. For gas-phasespecies, we included translational, rotational, and vibrationaldegrees of freedom and used standard thermodynamic expres-sions. Adsorbates were assumed to be tightly bound, and thusonly vibrational degrees of freedom, again calculated usingstandard thermodynamic expressions, were included in the par-tition function. The harmonic approximation was used for allvibrations, and the zero-point energies thus obtained were in-cluded in the enthalpies. The relevant conditions for a UHVexperiment and for the methanation reaction are indicated.
The phase diagram shows low H coverage at UHV con-ditions. For example, at a CO pressure of 6.7 × 10⁻⁹ atm(6.7 × 10⁻⁶ mbar) as used in the UHV experiment presentedlater in this paper, the calculated CO coverage is 0.02 and theH coverage is 10−5. Fig. 2 shows the effect of hydrogen on thedissociation barrier of CO. Even though the H insertion mech-anisms (via COH or HCO) have a lower effective activationenergy (Ea,COH = ETransition state − ECO ads. − (1/2)EH2 gas) of1.22 eV (E2) than without hydrogen (1.77 eV for a kink site;E1), the free energy barrier is substantially higher due to thelarge loss of entropy at the very low hydrogen pressure; seethe discussion that follows. This means that the calculations
suggest only a negligible effect of hydrogen in typical UHVexperiments of CO dissociation. This is further confirmed byour experiments here and by previous work that attempted tohydrogenate CO with atomic hydrogen on Ru(109) without suc-cess [47].
At higher CO pressures corresponding to the region of thephase diagram in Fig. 5 in which the CO coverage along thestep is close to 1 and the hydrogen coverage is close to 0, theCO molecule adsorbs most favorably in the bridge site at thesteps. In this high CO coverage limit, dissociation barriers forCO are only slightly higher than the barriers in the low coveragelimit (1.9–2.1 eV vs 1.7–1.9 eV; Fig. 3 and Table 1). Note thatthe site below the step has a considerably lower CO adsorptionenergy (by 0.45 eV, excluding CO–CO repulsion) than at thetop of the step, and would be empty at the temperatures andpressures considered in Fig. 5.
The dissociation of CO at methanation conditions also in-volves high pressures of H2, and, as discussed previously, it ispossible that the presence of hydrogen could result in a lowerbarrier for dissociating CO. A reaction pathway over a COH in-termediate was also recently suggested as an important routefor the partial oxidation of methane over Rh(111) [48]. There-fore, we consider an additional type of mechanism in which thetransition state for CO dissociation is stabilized by hydrogen(see Fig. 4) and thus the CO first reacts with adsorbed hydro-gen, forming a COH intermediate, which then offers a loweractivation barrier for the C–O bond dissociation. Two types ofintermediates—the carbon–hydroxyl C–OH (red lines) and theformyl HC–O (blue lines)—are considered. We find that on adouble-stepped Ni surface modeling an edge on a nanoparticle
M.P. Andersson et al. / Journal of Catalysis 255 (2008) 6–19 11
(as shown in the insert in Fig. 4), hydrogen reduces the bar-rier significantly by causing C–O bond stretching as the CO–Hintermediate forms. The resulting effective activation energy,Ea,COH (defined above), is only 1.08 eV (Table 1, D4). At an or-dinary step, it is a little higher, 1.30 eV (Table 1, B4). We alsonote that the hydrogenated HCO and COH intermediates areeasily formed on nickel with activation barriers of ca. 0.8 eV,well below the desorption energy of CO of 1.24 eV [33], sug-gesting that COH can be considered in chemical equilibriumwith adsorbed CO and H (and thus with gas-phase CO and H2)under methanation conditions. We would not expect COH tobe present on the surface in detectable amounts. We estimatedthe free energy difference between adsorbed COH and adsorbedCO and H2 in the gas phase as 0.7 eV. The resulting COHcoverage (at 500 K) was <10−7 ML. We have not found anyexperimental identification of the adsorbed COH in the litera-ture.
The activation of CO (by direct dissociation or via COH)is a key reaction step in the methanation reaction, and, as dis-cussed in the Introduction, whether it is the RLS remains anopen question. We can address this question computationallyin the following way. We calculate the standard free energy ofall relevant states (including transition states) in the reaction, asshown in Fig. 6. In such a free-energy diagram, the point withthe highest (free) energy defines the slowest reaction step (atstandard pressures). Fig. 6 shows the steps involving CO ac-tivation and the highest barrier for C hydrogenation (the lastone forming CH4) at different temperatures. The standard freeenergies for gas-phase species are calculated using statisticalthermodynamics for a classical ideal gas. The Gibbs free en-ergy for gas-phase species A at temperature T and pressure P
is given by
GP,TA = EA + EZPE + �H 0,T − T ST + RT ln
(P
P 0
),
where EA is the energy of gas-phase species A, EZPE is thezero-point energy, �H 0,T is the enthalpy change going from0 K to temperature T , ST is the entropy at temperature T , R
is the universal gas constant, and P 0 is the standard pressure(taken to be 1 bar). A similar expression describes the free en-ergy of species A adsorbed on a metal M,
GP,TA∗ = EA∗ + EZPE + �U0,T − T ST .
Here EA∗ = EA/M − EM, and the enthalpy change is replacedby a change in internal energy, �U0,T . Gas-phase entropiesare taken from standard tables [49]. In the transition states, allreal frequencies are included; thus, activation free energies giverates directly in harmonic transition state theory as
r = kBT
hexp
(�Ga
kBT
).
The vibrational frequencies used to determine EZPE, �U0,T ,and ST are also calculated using DFT; the results are givenin Table 2. Two cases are shown in Fig. 6: at low CO cover-age, where direct dissociation is dominant and hydrogenationcan occur at the steps (a), and at high CO coverage, where
Fig. 6. Contracted free energy diagrams modeling the methanation reaction ona Ni(211) surface (Table 1, B) with low and high CO coverages at differenttemperatures (the 550 K diagram is shown lowest of the four and the 850 Kis shown highest). The figure (a) shows the dissociation of CO in the low COcoverage regime. One clearly observes CO dissociation to be rate-limiting upto temperatures of at least 850 K. The figure (b) shows the dissociation in thehigh coverage regime. Here CO dissociation via COH is rate-limiting up untiltemperatures just below 850 K.
the process through COH is dominant and hydrogenation isblocked at the steps and must occur on the terraces (b).
Fig. 6 shows that at low temperatures, CO activation is theRLS in both processes. At higher temperatures (above thoseused in the methanation process), carbon hydrogenation be-comes the RLS. This shift in RLS can explain a large part of thediscrepancies among the various experimental studies, as wediscuss later. For the moment, we conclude that the calculations

12 M.P. Andersson et al. / Journal of Catalysis 255 (2008) 6–19
Table 2The table shows vibrational data for the relevant intermediates in the metha-nation reaction. All data have been calculated using DFT except for the gasphase species here the vibrational frequencies were taken from Ref. [49]. Both�H and �S for the gas phase species have been calculated using the Shomateequation, for which the parameters can be found in Ref. [49]
Species Vibrational modes (1/cm)
CO∗ 1888 346 323287 214 160
COH∗ 3761 1254 1080456 435 385200 148 142
CH∗3 3092 3007 2519
1385 1262 1200592 562 410204 195 86
CH∗ TS3 3094 3021 2224
1937 1442 13121287 948 809441 200 170139 105
CO∗ TS 579 516 453449 363
COH∗ TS 3799 704 637579 498 296216 131
CH4(g) 3019 2917 15341306
CO(g) 2169.81H2(g) 4401.21
support the notion that under typical methanation conditions,CO activation (through COH) is the RLS.
All of the results presented so far are for species adsorbed onthe step edge only. On a real nanoparticle catalyst, however, ad-sorption on the facets adjacent to the active edge site also couldhave a significant affect. Consequently, we investigated CO dis-sociation (via the COH intermediate) on the Ni(311) doublestep with full CO coverage along the step and either CO or Hco-adsorbed on the (100) facet. The activation energy turnedout to be only weakly influenced by the presence of CO or Hon the adjacent (100) facet and to change by −0.02 eV withco-adsorbed CO and by +0.04 eV with co-adsorbed H. Thus,coverages of up to 0.5 of CO and/or H on the (100) facets ishighly unlikely to have a major influence on the dissociationrate of CO on the active site.
For completeness, we also considered CO activation onNi(100) surfaces (H1–4 in Table 1). At low CO coverage, thebarriers for CO activation with or without H are as low as at thesteps on Ni(111). The energy of the transition state, as well asthe energy of the initial state for CO dissociation, is ∼0.2 eVhigher than at the double step on Ni(111) (D1); in fact, thegeometries are very similar, the main difference being that atthe double step, the step atoms have higher lying d-states andhence interact stronger with the CO. On the other hand, at thehighest coverage possible at the CO partial pressures relevantto methanation (half a monolayer), the barrier for direct COdissociation on Ni(100) is high (2.17 eV; see H3 in Table 1).The COH mechanism has a low barrier on Ni(100) even athigh CO coverage (H4 in Table 1). But this surface cannot ad-sorb H atoms at these coverages. This is illustrated in Fig. 7,which shows that at high CO coverage, the Ni(100) and Ni(111)
Fig. 7. Calculated hydrogen coverage on Ni at conditions relevant for the methanation reaction as a function of the hydrogen adsorption energy. At steps, the Hcoverage can be large even at high CO coverages whereas the H coverage is very low on the (111) and (100) surfaces. Carbon atoms are shown grey, hydrogen white,oxygen red, and Ni surface atoms blue. (For interpretation of the references to color in this figure legend the reader is referred to the web version of this article.)
M.P. Andersson et al. / Journal of Catalysis 255 (2008) 6–19 13
surfaces will have very low H coverage due to repulsive interac-tions with the CO. The repulsive interaction also manifests itselfin a much higher barrier for H2 dissociation on the CO coveredNi(100) surface (1.9 eV) making H2 dissociation rate limitingand thereby blocking the COH route under methanation con-ditions. We note that the steps and edges have no problems interms of access to co-adsorbed H (see Fig. 7).
3. UHV experiments
To experimentally investigate the dissociation of CO on awell-defined model system, a Ni(14 13 13) single crystal wasused. The surface consisted of (111) terraces with an averagewidth of approximately 26 atomic rows, separated by mono-atomic steps with (100) facets. The step density was approxi-mately 4 ± 0.5%. The crystal (supplied by Metal Crystals andOxides Ltd.) was 10 mm in diameter. Sample preparation andreactivity measurements were done in an UHV apparatus asdescribed in Ref. [12]. In recent studies, we found that evenremote amounts of nickel carbonyl [Ni(CO)4] can act as highlyactive reaction centers and thus have a dramatic effect on sur-face reactivity [32]. Thus, we took great care to avoid the pres-ence of nickel carbonyls on the surface, by passing the CO gasfirst through a copper coil heated to 373 K and then throughanother copper coil loaded with zeolite cooled to the tempera-ture of liquid nitrogen, as suggested by Yates [50]. Furthermore,the tube leading to the leak valve was made of copper, and theCO purification system was pumped out with a turbo pump be-tween the CO doses. The CO purification system is filled withCO only immediately before dosing and only to a low pressure,because carbonyl formation is strongly pressure-dependent. Re-ducing the time that CO is in the tube after purification furtherlimits possible nickel carbonyl formation through contact withthe two stainless steel valves. We found that careful cleaning ofthe CO as described above was necessary to avoid adsorptionof nickel carbonyls on the surface.
The CO was dosed at 500 K. To achieve very accurate mea-surements of amounts down to 0.005 ML, we used titrationof the adsorbed carbon with oxygen followed by TPD, as de-scribed previously [12].
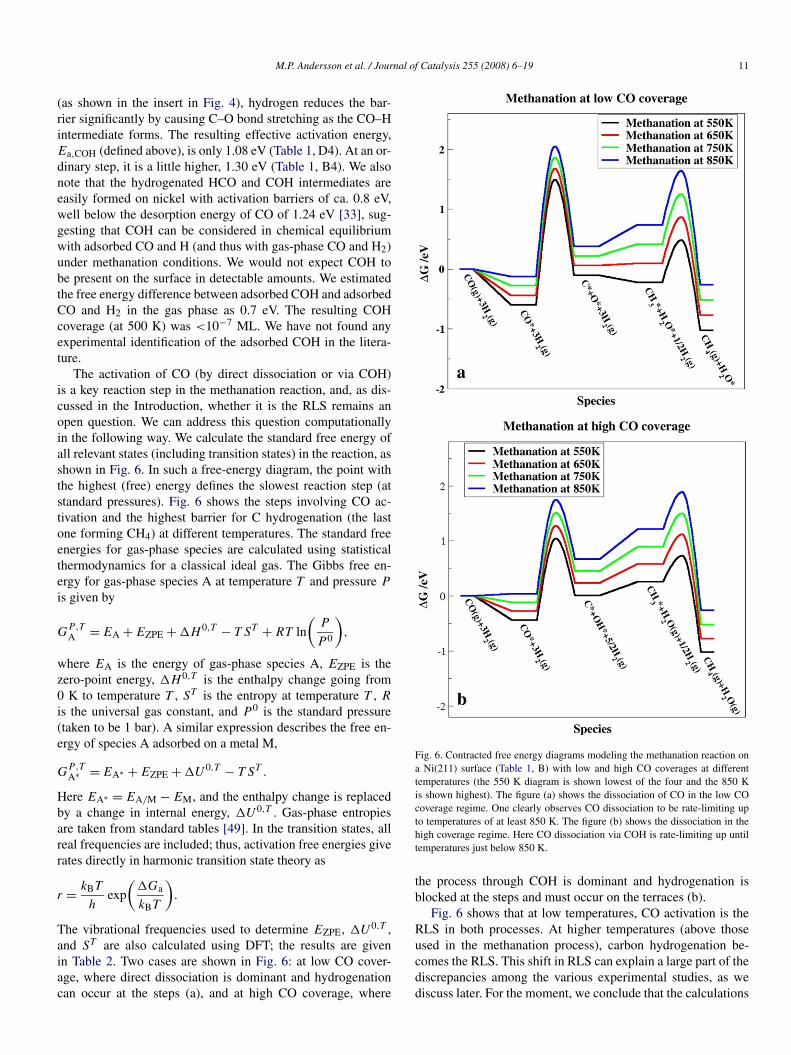
Fig. 8 shows carbon uptake curves as a function of COexposure on the clean and modified surfaces precovered with0.05 ML sulfur. The insert illustrates the effect of adding sul-fur to the surface. Clearly, adding even small amounts of sulfurhas a dramatic effect on the surface reactivity. Slightly morethan 0.03 ML of sulfur was needed fully poison the surface,but taking into account the uncertainties of the step densityand the coverage determination, this value could easily vary byas much as ±0.01 ML. Previous studies have clearly shownthat sulfur preferentially bonds to the steps [12]; this findinghas also been supported by STM investigations [31]. Adding0.05 ML of sulfur (with a step density of only 0.04) ensuredthat the steps were completely blocked, which completely de-activated the surface. This suggests that at UHV conditions, theundercoordinated steps or kink sites are the only active sites fordissociating CO.
Fig. 8. Experimentally determined carbon coverage on Ni(14 13 13) as a func-tion of CO exposure at 500 K (1 L = 1.33 × 10⁻⁶ mbar s), for a clean surfacewith exposed steps (circles) and a surface precovered with 0.05 ML sulfur toblock the steps (squares). The insert shows the carbon deposition as a functionof sulfur coverage for repeated doses at 6.7×10⁻⁶ mbar CO at 500 K. The car-bon uptake beyond 0.03 ML is probably due to incomplete poisoning of stepsalong the rim of the crystal where a much higher density is expected. The ef-fect of adding hydrogen is observed to enhance the CO dissociation rate. Seetext for discussion.
For the surfaces on which the active steps sites are avail-able, the activation barrier for CO dissociation can be estimatedfrom the uptake curves given in Fig. 8. The initial rates of car-bon uptake were 1.3 × 10⁻⁵ ML/s for the clean surface and2.2 × 10−7 ML/s for the sulfur-covered surface, respectively.Assuming a simple first-order dissociation process, the activa-tion energy can be given as
(1)Ea = −kBT · ln
(r
0.04υθCO
),
where kB = 1.381 × 10⁻²³ J/K is the Boltzman constant, T =500 K is the applied temperature, r is the reaction rate, υ isthe pre-exponential factor (we assume a standard value of1013 s−1), 0.04 is the approximate density of steps on our sur-face, and θCO is the coverage of CO along the step. Based onthe DFT calculations of the CO coverage along the step as re-ported in the phase diagram in Fig. 5, a value of 0.02 wasfound for the step coverages at the pressures used in the ex-periment, which, using Eq. (1), gives an activation barrier of1.5 eV. If instead the CO step coverage were estimated fromthe experimentally determined desorption energy of 1.24 eVfrom Ref. [33], then the CO coverage on the step would be0.2 (incoming CO flux at 300 K), and the activation energy,again using Eq. (1), would be 1.6 eV. The C-uptake was alsomeasured at p = 1.3 × 10⁻⁶ mbar, yielding an initial rate of3.3 × 10−6 ML/s, similarly leading to activation energies of1.5 and 1.6 eV, because the coverages will adjust accordingly.These values are in good agreement with the DFT values of1.7–1.9 eV found for CO dissociation at low-coordinated sitesat low CO coverage.
To investigate the influence of H2 under the UHV condi-tions, we also studied various CO exposures in a background

14 M.P. Andersson et al. / Journal of Catalysis 255 (2008) 6–19
Fig. 9. STM images of atomic steps on a Ni(111) single crystal after different CO exposures at 500 K. All images are recorded in constant current mode with imagesizes of 3400 × 5000 Å (insert to the left: 220 × 700 Å). The exposures were 5.8 L (a) (p = 3 × 10⁻⁷ mbar) and 289 L (b) (p = 4 × 10⁻⁵ mbar), respectively. Nocarbon is seen on the terraces in both cases, and carbon in the form of carbide is only seen in (b) along the steps. The carbide island is clearly seen in the enlargedinsert in (b).
of hydrogen. The experimental setup allowed dosing of CO ina background of H2 only up to 3.6 × 10⁻⁶ mbar. Nevertheless,an increase in the initial CO dissociation rate on clean Ni of 1.7was observed. Dosing H2 alone (not shown) did not lead to anycarbon deposits, as expected; thus, a cooperative effect indeedcould be the origin of this effect, as we discuss later.
To further substantiate the calculated and experimentallymeasured high value for the barrier for CO dissociation, weperformed STM measurements on a Ni(111) single crystal. TheCO gas was carefully purified in a procedure similar to the ex-periments reported in Fig. 8. CO was dosed with all filamentsturned off to avoid dissociation of CO on the filaments. A mag-netron was used to monitor the pressure.
Dosing CO at 400 K after careful precautions were takento avoid the presence of nickel carbonyl, Ni(CO)4, in the COgas used for dosing and subsequently investigating the surfaceby STM, we were unable to reproduce the results reported byNakano et al. [28] and Lauritsen et al. [31], who found thatCO dissociated at the steps at this temperature. Thus, no dis-sociation products were observed in this work after exposureat 400 K [32]. However, we did observe some dissociation at500 K (Fig. 9), in agreement with the observations of Nakanoet al., who reported a somewhat higher rate at this tempera-ture [29,30]. After dosing the CO at different pressures andexposure times at temperatures around 500 K, the sample wasallowed to cool to room temperature, at which point STM im-ages were obtained (see Fig. 9; details of the step are shownin the inserts). After a low exposure of CO (5.8 L), no orvery little carbide was formed on the surface, and then onlyalong the steps. After higher exposures (289 L), carbide is-lands formed at the upper step edge, but no carbide was seenon the terraces. These findings are also clearly in agreementwith the DFT results indicating that only undercoordinated siteswere active for the CO dissociation and also reasonably in linewith the measured carbon uptake shown in Fig. 8. The carbonformed at the step is expected to grow carbidic islands nucleat-ing along the steps, similar to the results of ethylene exposure
on Ni(111) investigated by STM [51] and further supported byDFT [52].
4. High-pressure experiments
We now consider high-pressure experiments for the metha-nation reaction. We followed previous kinetic analysis [35] andthe DFT calculations [40] in analyzing the results, assumingthat the CO(H) dissociation step is the RLS. We tested the twomain conclusions from the DFT results at high CO pressures:The reaction site is an undercoordinated site, and the affect ofhydrogen is instrumental in the methanation reaction.
The experiment was performed on supported nickel particlesunder realistic methanation conditions at much higher pressuresthan those applied in the experiments shown in Fig. 8. The reac-tion site was investigated by correlating the rate of methanationof CO per Ni mass with the average nickel particle diameter, d .In this method, the activity will scale with the number of ac-tive sites, and if these are the surface atoms on the facets ofthe particles, then the activity will scale with 1/d for the rela-tive large particle sizes used here. This is the situation termed“structure insensitive” by Boudart: “The TOF under fixed con-ditions does not depend or depends only slightly on surfacecrystalline anisotropy as expressed on clusters of varying sizeor on single crystals exposing different faces” [53]. If the activesites are on the edge, then scaling with (1/d)2 will be expected,and, finally, if the active site is on corner-like sites, then the scal-ing will be with (1/d)3. Kink sites may also scale by (1/d)3,because the number of kink sites in the lowest-energy configu-ration of a nickel particle is affected by the fact that the numberof atoms in the particle do normally not match the number ofatoms in a regular particle shape. Thus, the number of kink sitesdoes not change much with particle size, resulting in a scalingfactor for kinks of (1/d)3.
The data given in Ref. [54] were reanalyzed to determinethe scaling factor between methanation activity and nickel par-ticle size for a nickel methanation catalyst (MCR-2X, Haldor

M.P. Andersson et al. / Journal of Catalysis 255 (2008) 6–19 15
Fig. 10. Measurements of the relative rate of CO methanation activity per Nicatalyst mass plotted as a function of the inverse particle size, d , for a seriesof nickel catalysts. The methanation reaction is measured in 1% CO in H2 at523 K and a total pressure of 1 bar. Note that both axes are logarithmic. It isseen that the measurements (black circles) are best described by an exponentof 2.6, which is in between exponents expected for steps and kinks, suggestingthat the reaction is structure sensitive, and that the highly under-coordinatedsites are the active sites for the methanation reaction.
Topsøe A/S). The catalyst was initially aged at 600 ◦C forup to 8450 h in an equilibrated synthesis gas mixture, as de-scribed in more detail previously [54]. After aging, the nickelsurface areas of the catalyst samples were determined by hy-drogen chemisorption at 298 K assuming H/Ni = 1 and a Niarea of ANi = 6.5 × 10⁻²⁰ m2 [55]. The rates of CO metha-nation at 523 K (1% CO in H2) were obtained as describedpreviously [9]. Nickel surface areas can be converted to aver-age nickel particle diameters assuming a simple particle shape,resulting in
(2)dNi (Å) = 68.2XNi (wt%)
ANi (m2 g−1),
where XNi is the amount of Ni per catalyst weight (in %) andANi is the measured Ni surface area per catalyst weight.
Fig. 10 plots the measured relative rates of methanation perNi mass as a function of (1/d). Note that both axes are loga-rithmic, and thus the slope contains information on the type ofreaction site. The plot shows that the measured relative metha-nation activities and (1/d) are proportional. The slope of thebest linear fit to the data is 2.6, suggesting that undercoordi-nated sites such as steps and edges (slope of two) and kinks andcorners (slope of three) dominate the observed activity. Thus,the data in Fig. 10 indicate that atomic terraces are inactive formethanation, whereas undercoordinated surface sites are active.This observation supports the conclusions from the DFT calcu-lations and single-crystal measurements that methanation is ahighly structure-sensitive reaction. We discuss the effect of hy-drogen on the rate in the next section.
5. Discussion
Our experiments under UHV conditions suggest that the bar-rier for CO dissociation is much lower on steps/defects than
on the terrace (experiments, 1.5–1.6 eV; DFT, 1.7–1.9 eV) andthat the barrier is always higher than the barrier for desorp-tion (1.2 eV). Thus, no dissociation would be expected duringa TPD experiment if the CO were carefully cleaned for impuri-ties, such as nickel carbonyls.
Turning now to the observed activation energies and effect ofhydrogen during the methanation reaction, we need to comparethe kinetics for the situations in which CO dissociation is theRLS and in which a COH species is the RLS. If we assumethat the methanation reaction is rate-limited by CO dissociation,then a simple model would comprise the following steps:
Quasi-equilibrium: COg + � ↔ CO� and
(3)COg + ∗ ↔ CO∗ and CO∗ + � ↔ CO� + ∗,
and
(4)RLS at step sites: CO�+�→C� + O�.
Here ∗, �, and � denote adsorption sites on the terrace, the up-per step/edge, and the lower step/edge site, respectively. TheCO adsorbed on the upper step/edge sites naturally will be inequilibrium with the CO adsorbed on the terrace sites, but be-cause the barrier for dissociation is much higher on the terrace,only dissociation on the edge sites are considered in Eq. (4).As discussed earlier, the empty site below the step/edge site de-noted � adsorbs CO and hydrogen weakly (−0.45 eV) whenCO is sitting on the upper site and thus can be consideredapproximately empty and available when the molecule is disso-ciating. The oxo-compound will occupy the upper site while thecarbon will occupy the lower site, from which it either will behydrogenated or will diffuse into the upper terrace and nucleateinto a carbide island, as demonstrated by STM. Equation (4)would lead to a (forward) methanation rate determined solelyby the CO dissociation rate and the coverage of CO on the edgesites, θCO,
(5)r = kCOdissθCOθ� ∼= kCO
dissθCO,
where kCOdiss is the reaction rate constant for the RLS. Accord-
ing to the phase diagram in Fig. 5, the surface is expected to bedominated by adsorbed CO under methanation conditions, andthe reaction order in CO is indeed observed to be negative forCO pressures above a few mbar [8,34,56], because under suchconditions, CO will block the lower step/edge sites and surfacesites for H2 adsorption, for example. At the high pressures usedunder methanation conditions, the negative reaction order forCO (if any) will lead to higher activation energy for the CO dis-sociation compared with that measured under UHV conditionsand no significant dependence on the hydrogen, which bindsweakly compared with CO. Therefore, the mechanism specifiedin Eqs. (4) and (5) is not relevant for methanation conditions,because the barrier for direct CO dissociation is far too high(1.5–1.8 eV) and will only become higher when the blockingalso is considered.
We now investigate the effect of hydrogen present at higherpressures. This opens up the possibility that CO reacts througha COH intermediate formed from adsorbed CO and H. If weassume that the following reaction is in equilibrium on the edge

16 M.P. Andersson et al. / Journal of Catalysis 255 (2008) 6–19
sites,
(6)Quasi-equilibrium: (1/2)H2 + CO� ↔ COH�,
then the coverage of COH on the edge can be found as
(7)θCOH = KCOH↔CO�+(1/2)H2
√PH2θCO,
where KCOH↔CO�+(1/2)H2 is the equilibrium constant for thereaction in Eq. (6). The RLS now becomes the dissociation ofCOH instead of CO, as was the case in Eq. (4),
(8)RLS: COH� + � → C� + HO�.
The rate of carbon formation can now be written as
(9)r = kCOHdiss · θCOH · θ� ≈ kCOH
diss · θCOH,
where kCOHdiss is the rate constant for the dissociation in Eq. (8)
over an edge site. The coverage of free neighbor sites below thestep/edge (�) is assumed to be close to 1 for the same reasonsas before. Inserting Eq. (7) into Eq. (9) gives
(10)r ≈ kCOHdiss · KCOH↔CO�+(1/2)H2
√PH2θCO.
The rate is seen to be half-order in hydrogen. The equilibriumconstant, KCOH↔CO�+(1/2)H2 , can be expressed as
KCOH↔CO�+(1/2)H2 = exp
(−�GCOH↔CO�+(1/2)H2
kBT
)
= exp
(−�HCOH↔CO�+(1/2)H2
kBT
)
(11)× exp
(�SCOH↔CO�+(1/2)H2
kB
),
where kB is the Boltzmann factor, T is the temperature,�HCOH↔CO�+(1/2)H2 is the enthalpy change, and�SCOH↔CO�+(1/2)H2 is the entropy change for Eq. (6). Theenthalpy can be written as
(12)�HCOH↔CO�+(1/2)H2 = �HCOH − �HCO − 1
2�HH2,
and the entropy can be written as
(13)�SCOH↔CO�+(1/2)H2 = �SCOH − �SCO − 1
2�SH2 .
The rate constant for the RLS, kCOHdiss , also can be split up in a
similar manner as the equilibrium constant,
kCOHdiss = kBT
hexp
(−�Ediss
kBT
)exp
(�Sdiss
T
)
(14)∼= kBT
hexp
(−(�HCOHTS − �HCOH)
kBT
),
where h is Planck’s constant, �Ediss = �HCOHTS − �HCOHis the energy difference between the COH in the transitionstate, COHTS, and the adsorbed COH species on the edge, and�Sdiss = �SCOHTS − �SCOH ∼= 0, because there is no reason toexpect any large difference in degrees of freedom for the twostates.
Inserting Eqs. (11)–(14) into Eq. (10), the expression for therate of COH dissociation from Eq. (8) becomes
r ≈ kBT
hexp
(−(�HCOHTS − �HCO − (1/2)�HH2)
kBT
)
(15)× exp
(�SCOH↔CO�+(1/2)H2
kB
)√PH2θCO.
Because �HCOH cancels as the COH intermediate is assumedin equilibrium, the energy difference (�HCOHTS − �HCO −(1/2)�HH2) is exactly that estimated through the DFT calcula-tions earlier: Ea,COH = ETransition state −ECO ads.−(1/2)EH2 gas.Here the lowest barrier was found to be 1.08 eV for dissociationof COH on an edge site. Inserting this, we get
r ≈[kBT
hexp
(�SCOH↔CO�+(1/2)H2
kB
)]
× √PH2θCO
(−Ea,COH
kBT
)
= υ√
PH2θCO exp
(−Ea,COH
kBT
)
(16)= (υ∗θactive sites
)√PH2θCO exp
(−Ea,COH
kBT
),
where υ is introduced as the prefactor and υ∗ as the prefactorper active site. This PH2 dependence has indeed been reportedin the literature for a gas mixture of 0.9% CO in H2 when in-creasing total pressure in the range of 25–100 bar [57], whereasthe reaction order was smaller for pressures <25 bar. To es-timate the reaction order in CO, we again consider the rategiven in Eq. (9), this time maintaining θ�. By inserting therelevant expressions for θCO and θ� into the definition of the re-action order (nCO ≡ PCO(∂ ln r+/∂PCO)), we find that nCO =1 − θCO� − θCO� ∼= −θCO�, giving rise to an only slightlynegative reaction order in CO, because, as mentioned earlier,the CO molecule is much more weakly bonded at the lowerstep site. This is consistent with findings of Vannice [8,34] ofslightly negative exponents (−0.3 to −0.5) for CO partial pres-sure and positive exponents for hydrogen partial pressure (0.6to 0.8) at around 1 bar. Similar data were reported by Baerns etal. [37] and Harriott et al. [38], with a small negative order inCO pressure and a somewhat higher positive order for hydro-gen, resulting in a small overall positive reaction order of thetotal pressure (0–0.5). This seems to be the general picture, butthere are substantial variations in these results. Consequently,we refrain from providing further details on the reaction or-der here, but nonetheless do speculate that the slightly negativeeffect of CO can be ascribed to a blocking of the surface byadsorbed CO on the lower step edge site, whereas a hydrogenexponent >0.5 can be ascribed to removal of carbon, which isknown to poison the surface, particularly at low hydrogen pres-sures [5,6]. The role of carbon poisoning is discussed in theAppendix A.
The mechanism proposed here predicts a low prefactor dueto the entropy loss shown in Eq. (6). The entropy change canbe found from DFT calculations by inserting the following intoEq. (13):
�SCO–COH = �SCOH − �SCO∗ − 1
2�SH2
(17)= 27.0 − 32.8 − 57.9 = −63.7 J/(mol K),

M.P. Andersson et al. / Journal of Catalysis 255 (2008) 6–19 17
resulting in a value for the prefactor of υ = υ∗ = 4.9×10⁹ s−1.The activation energy is Ea,COH = 1.08 eV, as found by DFTand reported in Fig. 4 for activation through the COH complex.
From measurements on supported Ni catalysts, Sehestedet al. [35] found a prefactor of υ = 2.0 × 10⁸ s−1 and Ediss =1.01 eV when calculated at the reaction conditions (PH2 =1.37 bar and PCO = 0.028 bar). Taking into account the num-ber of active sites relative to the total number of surface sites(estimated experimentally as 0.05 [35]), the prefactor on a peractive site basis becomes υ∗ = 4.0 × 10⁹ s−1 [see Eq. (16)], inexcellent agreement with these model predictions.
Goodman et al. [5] measured methanation rates on a Ni(100)single crystal (and similar data on Ni(111) [6]) and found ratesof 1 s−1 for PH2 = 0.128 bar and PCO = 0.032 bar at 650 K.The prefactor was determined to be υ = 5.3 × 10⁸ s−1, andan activation energy of 103 kJ/mol (Ediss = 1.07 eV) can bederived [5–7,41]. Here it is assumed that all of the surface ter-race atoms on the front and back sides of the single crystal arecontributing to the reaction. It is seen that the prefactor com-pares well with the value from the model prediction and theexperimental data on the Ni catalyst described above [35] if adefect density of 10% on the single crystal surface is assumed.This may seem a rather high value when considering that theNi(100) was polished on both sides, with 1–2% defects being arealistic estimate [15]. Keep in mind, however, that in those ex-periments, the surface atoms on the rim of the crystal and thesurface close to the rim edges (which are always less well de-fined) contributed to the reaction, as did the wires for supportingand heating the crystal, which were also made of Ni [5]. Giventhese considerations, an overall defect density of 10% is notan unrealistic estimate. Note that DFT predicted a low barrierheight of 1.08 eV for the double steps (D4) but a barrier heightof 1.3 eV for the single steps, quite close in energy (BCOH
4 ).Using Eq. (16), we can estimate the expected hydrogen
enhancement on the CO dissociation during the UHV exper-iment shown in Fig. 8. Using a partial pressure of PH2 =3.6 × 10⁻⁸ bar and a CO coverage of 0.2 ML on the step, wefind a rate of 1 × 10⁻⁷ ML/s, which is roughly a factor of 200less than the rate enhancement observed. Therefore, our mea-sured rate enhancement must come from another mechanism.One possibility is that hydrogen helps remove oxygen from thedissociated CO and thereby frees steps for the simple CO dis-sociation. The oxygen is usually removed by CO to form CO2.Previous experiments performed by Alstrup et al. [58] showedthat the hydrogenation of adsorbed carbon is rather slow at lowpressures of hydrogen (i.e., <1 mbar) but becomes significantat higher pressures and proceeds with an exponent >1, and thuswill be much faster than the CO dissociation at elevated pres-sures discussed earlier. Unfortunately, studying the effects ofhigher hydrogen pressures in the UHV setup used in this studywas not possible.
Based on the foregoing comparisons, we can conclude thatthere is excellent agreement between experimental rate datafrom both single crystals and supported catalysts and a relativesimple model in which the reactivity will always be completelydominated by defect sites due to the large difference in activa-tion energy between, for instance, step sites and terrace sites.
Goodman and co-workers [5–7] found that the rate of metha-nation was roughly the same on Ni(111) and (100), similar (persurface area) to that of supported catalysts. In later work, Kel-ley and Goodman studied ruthenium [6,41] and found that themethanation rate was the same on Ru(001) and Ru(110) as onNi, suggesting that the measured rate depends on a delicate bal-ance between carbide formation and carbide hydrogenation onthe surface. We agree with that conclusion in the sense that car-bide removal eventually will be rate-limiting at a sufficientlylow hydrogen-to-CO ratio and particularly at low pressures asused in previous studies [5,6,41] (also see Appendix A). Weargue, however, that at higher pressures and at temperaturesreasonable for the methanation process, the reaction is rate lim-ited by COH dissociation. If the hydrogenation of depositedcarbon were rate-limiting, it would be in disagreement withboth the energy diagram calculated by DFT in the present workand the isotope scrambling experiments of Coenen et al. [38].Similarly, if direct CO dissociation were rate-limiting, it wouldbe in conflict with the present results from DFT, single-crystalexperiments, and catalyst measurements. The COH intermedi-ate suggested by DFT calculations is in agreement with earlierwork, in which the evidence was rather circumstantial, however[38,39].
The most plausible explanation for the apparent structure-insensitivity of the earlier single-crystal studies is that the reac-tion is so structure-sensitive that only certain defects can con-tribute to the measured rates, and the defect density is similarfor different samples. This also offers an excellent explanationfor the very strong poisoning observed by Goodman and co-workers when adding small amounts of sulfur to the surface [6].How a single sulfur atom can influence up to 8–10 nickel atomshas long been puzzling, because electronic screening is knownto reduce such effects to smaller scales; however, this can bereadily understood when, for example, only atomic steps areactive, as can be concluded from Fig. 8. CO dissociation is sim-ilar to N2 dissociation, for which UHV experiments found thatdifferent Ru single crystal surfaces had the same rates of dis-sociation [59]. Later DFT calculations and UHV experimentsproved that steps completely control the reactivity [15], a con-clusion also consistent with the experiments on different single-crystal surfaces.
The present work emphasizes the need for high-pressure ex-periments on well-defined systems consisting of single crystalsin which the composition of surface sites is controlled and, forexample, the rim of the crystal and the heating support can beeliminated. This work, currently in progress, poses a substantialexperimental challenge.
6. Summary and conclusions
We have provided evidence based on DFT calculations, car-bon uptake, and STM experiments indicating that steps are theprimary active sites for CO dissociation on clean Ni(111) sur-faces. No dissociation was observed over closely packed Niatoms on the terraces. Experimentally, the barrier over a stepsite under UHV conditions was found to be 1.5–1.6 eV. Thisis in good agreement with DFT studies that found values of

18 M.P. Andersson et al. / Journal of Catalysis 255 (2008) 6–19
1.7–1.9 eV over an undercoordinated site on the Ni surface. Allvalues exceed the desorption energy of CO (previously foundto be 1.2 eV), in agreement with the fact that no CO dissocia-tion was observed during TPD when the gas was appropriatelycleaned. When including the effect of hydrogen present undermethanation conditions, a different transition state was foundthat involves dissociation through a COH species. In this case,the barriers were 1.08 eV for edges/double steps and 1.3 eVfor steps, values that are in excellent agreement with previousmeasurements of the methanation reaction that found activa-tion energies of 1.01 eV for supported catalysts and 1.08 eVfor single crystals. Correlations of methanation activity withthe particle size of supported Ni catalysts support the charac-terization of the reaction site as an undercoordinated surfacesite. Furthermore, the proposed reaction mechanism with theCOH intermediate resulted in a square root dependence of thehydrogen pressure, in agreement with literature findings at highpressure. Our results, largely summarized in Fig. 6, show thatfor pressures and temperatures appropriate for the methanationreaction, dissociation of a COH intermediate on step/edge siteis the RLS. The difference in the reaction mechanism underUHV and methanation conditions clearly demonstrates the im-portance of combining surface science techniques with ab initiocalculations when bridging the pressure gap.
Acknowledgments
The authors thank J.T. Yates for his critical review of themanuscript. M.P.A. and F.A-P. were supported by the DanishResearch Agency (grant 26-04-0047). M.P.A. was supported bya Marie Curie fellowship (EU grant MEIF-CT-2004-011121).The DFT calculations were performed with support from theDanish Center for Scientific Computing (grant HDW-1103-06).CINF is funded by the Danish National Research Foundation.CAMD is funded by the Lundbeck Foundation.
Appendix A
In several earlier works on both real catalysts [60] and sin-gle crystals [5–7,41], poisoning by carbon was observed whenthe hydrogen pressure relative to the CO pressure was too lowto ensure sufficiently rapid removal of the formed carbon byhydrogen. For instance, Goodman et al. reported that the metha-nation rate correlates inversely with the amount of carbide mea-sured on the surface after experiments at 625 K at pressuresof 1–2000 mbar [6,41]. The carbide coverage measured afternon-Arrhenius behavior at low pressure rose up to 0.25 MLat 1.3 mbar but remained rather constant, at around 0.05 ML,when measured after Arrhenius behavior [41]. It can be specu-lated that this low level does not reflect the level under reactionconditions, but rather that the crystal has an even lower cov-erage of carbon under the Arrhenius conditions, whereas theobserved carbon is deposited as the reactants are pumped out.Nevertheless, it is clear that deposition of large amounts of car-bon on the surface will eventually poison the steps; however,as shown in Fig. 9, the carbon agglomerates into carbide is-lands and does not decorate the steps at low coverage, as, for
instance, sulfur does [12,31]. Thus, carbon is not expected tobe an efficient poison for the methanation process.
Moreover, several studies on the hydrogenation of carbonon Ni have clearly indicated that the hydrogenation rate due tolack of hydrogen eventually becomes rate-limiting. It has beenspeculated that this may be the origin of the observed lack ofstructure sensitivity [61]; however, this phenomenon likely willbe of importance only at very low hydrogen pressures or at hightemperatures, as shown in Fig. 6. To elucidate this, we createda very simple model assuming that the carbon coverage at thesteps is determined by a carbide formation rate given by thedissociation rate derived in Eq. (16) and a carbide removal ratedetermined by a hydrogenation rate. The hydrogenation rate isextracted from the work of Alstrup et al. [58], who found thatthe rate is basically temperature-independent around 500 K,whereas the reaction order in hydrogen is 1.7 in the pressureregime of 0.5–13 mbar and is given by
(18)rHyd = 54 · P 1.7H2
(ML carbon
s
)
at saturation coverage. It is assumed that this rate is a good de-scription of what is occurring at the steps.
With this, we can set up the following equations assumingsteady state:
dθC
dt= 0 = rdiss-COH(1 − θC) − rHydθC ⇒
(19)rCH4 = rdiss-COH(1 − θC) = rdiss-COHrHyd/(rdiss-COH)
1 + rHyd/(rdiss-COH),
where θC is the carbon coverage at the step and it is assumedthat a step site is available as long as it is not covered by carbon.
Fig. 11. Comparison between the experimental data obtained on Ni(100) [5,6] and the present model where carbon poisoning is taken into account. Theabsolute values are only quantitatively in agreement for the higher pressureswhile larger deviations are observed for lower pressures. Note, however, thatthe model captures qualitatively the onset of carbide poisoning of the stepsalthough it is not taking the formation of islands into account.
M.P. Andersson et al. / Journal of Catalysis 255 (2008) 6–19 19
rdiss–COH is given by Eq. (16). To keep things simple, the modeldoes not include island formation.
The resulting rates are then depicted in an Arrhenius plotin Fig. 11, allowing a comparison to the experimental data ofGoodman et al. [5]. It is obvious that our data do not fit theexperimental rates quantitatively, especially for the low pres-sures, because our dissociation rate is dependent on hydro-gen pressure. However, the qualitative trends are in very goodagreement, demonstrating the poisoning of carbon when thehydrogenation rate cannot keep up with the dissociation rate,leading to deviations from the Arrhenius behavior at highertemperatures, especially at low pressure. Obviously, the carbonpoisoning will not be a problem at realistic pressures and attemperatures that are kept low for thermodynamic reasons.
References
[1] P. Sabatier, J.B. Senderens, C. R. Acad. Sci. Paris 134 (1902) 514.[2] I. Chorkendorff, H. Niemantsverdriet, Wiley–VCH, Weinheim, ISBN 978-
3-527-31672-4, 2007.[3] A. Harms, B. Høhlein, E. Jørn, A. Skov, Oil Gas J. 78 (1980) 120.[4] M. Dry, Appl. Catal. A Gen. 276 (2004) 1.[5] D.W. Goodman, R.D. Kelley, T.E. Madey, J.T. Yates Jr., J. Catal. 63 (1980)
226.[6] R.D. Kelley, D.W. Goodman, The Chemical Physics of Solid Surfaces and
Heterogeneous Catalysis, Fundamental Studies of Heterogeneous Cataly-sis, vol. 4, Elsevier Science Publishers, Amsterdam, 1982.
[7] D.W. Goodman, Acc. Chem. Res. 17 (1984) 194.[8] M.A. Vannice, J. Catal. 44 (1976) 152.[9] J.R. Rostrup-Nielsen, in: J.R. Anderson, M. Boudart (Eds.), Catalysis Sci-
ence and Technology, Springer-Verlag, Berlin, 1984.[10] T.P. Beebe Jr., D.W. Goodman, B.D. Kay, J.T. Yates Jr., J. Chem. Phys. 87
(1987) 2305.[11] J.H. Larsen, I. Chorkendorff, Surf. Sci. Rep. 35 (1999) 163.[12] F. Abild-Pedersen, O. Lytken, J. Engbæk, G. Nielsen, I. Chorkendorff, J.K.
Nørskov, Surf. Sci. 590 (2005) 127.[13] J. Wei, E. Iglesia, J. Catal. 224 (2004) 370.[14] T. Zambelli, J. Wintterlin, J. Trost, G. Ertl, Science 273 (1996) 1688.[15] S. Dahl, A. Logadottir, R.C. Egeberg, J.H. Larsen, I. Chorkendorff, E.
Törnqvist, J.K. Nørskov, Phys. Rev. Lett. 83 (1999) 1814.[16] Y.K. Kim, G.A. Morgan, J.T. Yates, Surf. Sci. 598 (2005) 14.[17] M. Mavrikakis, M. Bäumer, H.J. Freund, J.K. Nørskov, Catal. Lett. 81
(2002) 153.[18] I.M. Ciobica, R. van Santen, J. Phys. Chem. B 107 (2003) 3808.[19] B. Hammer, Phys. Rev. Lett. 83 (1999) 3681.[20] H.S. Bengaard, J.K. Nørskov, J. Sehested, B.S. Clausen, L.P. Nielsen,
A.M. Molenbroek, J.R. Rostrup-Nielsen, J. Catal. 209 (2002) 365.[21] T. Bligaard, J.K. Nørskov, S. Dahl, J. Matthiesen, C.H. Christensen, J. Se-
hested, J. Catal. 224 (2004) 206.[22] T. Zubkov, G.A. Morgan Jr., J.T. Yates Jr., Chem. Phys. Lett. 362 (2002)
181.[23] T. Zubkov, G.A. Morgan Jr., J.T. Yates Jr., O. Kuhlert, M. Lisowski,
R. Schillinger, D. Fick, H.J. Janch, Surf. Sci. 625 (2003) 57.[24] H. Pfnur, P. Feulner, D. Menzel, J. Chem. Phys. 79 (1983) 4613.
[25] L. Ng, K.J. Uram, Z. Xu, P.L. Jones, J.T. Yates Jr., J. Chem. Phys. 86(1987) 6523.
[26] C. Benndorf, L. Meyer, Surf. Sci. 251–252 (1991) 872.[27] D.W. Goodman, R.D. Kelley, T.E. Madey, J.M. White, J. Catal. 64 (1980)
479.[28] H. Nakano, S. Kawakami, T. Fujitani, J. Nakamura, Surf. Sci. 295 (2000)
454.[29] H. Nakano, J. Nakamura, Surf. Sci. 341 (2001) 482.[30] H. Nakano, J. Ogawa, J. Nakamura, Surf. Sci. 514 (2002) 256.[31] J.V. Lauritsen, R.T. Vang, F. Besenbacher, Catal. Today 111 (2006) 34–
43.[32] J. Engbæk, O. Lytken, J.H. Nielsen, I. Chorkendorff, Surf. Sci. 602 (2008)
733.[33] E. Bjørgum, D. Chen, M.G. Bakken, K.O. Christensen, A. Holmen,
O. Lytken, I. Chorkendorff, J. Phys. Chem. 109 (2005) 2360.[34] M.A. Vannice, J. Catal. 37 (1975) 449.[35] J. Sehested, S. Dahl, J. Jacobsen, J.R. Rostrup-Nielsen, J. Phys. Chem.
B 109 (2005) 2432.[36] R.Z.C. van Meerten, J.G. Villenbroek, M.H.J.M. de Croon, P.F.M.T. van
Nisselroy, J.W.E. Coenen, Appl. Catal. 3 (1982) 29.[37] J. Klose, M. Baerns, J. Catal. 85 (1984) 105.[38] J.W.E. Coenen, P.F.M.T. van Niesselroy, M.H.J.M. de Croon, P.F.H.A. van
Dooren, R.Z.C. van Meerten, Appl. Catal. 25 (1986) 1.[39] S. Van Ho, P. Harriott, J. Catal. 64 (1980) 272.[40] M.P. Andersson, T. Bligaard, A. Kustov, K.E. Larsen, J. Greeley, T. Johan-
nessen, C.H. Christensen, J.K. Nørskov, J. Catal. 239 (2006) 501.[41] R.D. Kelley, D.W. Goodman, Surf. Sci. 123 (1982) L743.[42] B. Hammer, L.B. Hansen, J.K. Nørskov, Phys. Rev. B 59 (1999) 7413.[43] F. Abild-Pedersen, M.P. Andersson, Surf. Sci. 601 (7) (2007) 1747.[44] S. Mason, I. Grinberg, A. Rappe, Phys. Rev. 69 (2004) 161401.[45] P.J. Feibelmann, B. Hammer, J.K. Nørskov, F. Wagner, M. Scheffler,
R. Stumpf, R. Watwe, J.A. Dumesic, J. Phys. Chem. B 105 (2001) 4018.[46] G. Kresse, A. Gil, P. Sautet, Phys. Rev. 68 (2003) 73401.[47] G.A. Morgan Jr., D.C. Sorescu, T. Zubkov, J.T. Yates Jr., J. Phys. Chem.
B 108 (2004) 3614.[48] O.R. Inderwildi, S.J. Jenkins, D.A. King, J. Am. Chem. Soc. 129 (2007)
1751.[49] D.L. Lide (Ed.), CRC Handbook of Physics and Chemistry, 77th
ed., Academic Press, London, 1997, and NIST Chemistry web-book,http://webbook.nist.gov/chemistry/.
[50] J.T. Yates Jr., Experimental Innovations in Surface Science, Springer, NewYork, 1998.
[51] R.T. Vang, K. Honkala, S. Dahl, E.K. Vestergaard, J. Schnadt, E. Lægs-gaard, B.S. Clausen, J.K. Nørskov, F. Besenbacher, Surf. Sci. 600 (2006)66–77.
[52] M.P. Andersson, F. Abild-Pedersen, Surf. Sci. 601 (3) (2007) 649.[53] M. Boudart, Chem. Rev. 95 (1995) 661.[54] J.R. Rostrup-Nielsen, K. Pedersen, J. Sehested, Appl. Catal. A Gen. 330
(2007) 134.[55] J.R. Rostrup-Nielsen, Steam Reforming Catalysts, Danish Technical
Press, Copenhagen, 1975.[56] P. Schoubye, J. Catal. 14 (1969) 238.[57] P. Schoubye, J. Catal. 18 (1970) 118.[58] I. Alstrup, I. Chorkendorff, S. Ulmann, Surf. Sci. 293 (1993) 133.[59] K. Jacobi, H. Dietrich, G. Ertl, Appl. Surf. Sci. 121 (1997) 558.[60] M.A. Vannice, R.L. Garten, J. Catal. 50 (1979) 236.[61] H. Hirano, K. Tanaka, J. Catal. 133 (1992) 461.