stakeholder-focused cost-benefit analysis in the water …pubs.iied.org/pdfs/16523iied.pdf ·...
TRANSCRIPT
Stakeholder-focused cost-benefit analysis in the water sectorSynthesis report
Synthesis Report January 2013
Rodney Lunduka, Mintewab Bezabih and Abrar Chaudhury
www.iied.org
© A
rjun
Dha
kall

StAkehoLdeR-foCuSed CoSt-Benefit AnALySiS in the wAteR SeCtoR : SyntheSiS RepoRt
Contact:
Dr R. W. Lunduka, International Institute for Environment and Development (IIED)
Email: [email protected]
Citation:
Lunduka, R.W., Bezabih, M. and Chaudhury, A. (2012). Stakeholder-focused cost benefit analysis in the water sector: A synthesis report.
International Institute for Environment and Development (IIED), London, UK.
This synthesis report is submitted as part of the Economics of Climate Change in the Water Sector project funded by the International
Development Research Centre (IDRC) and coordinated by the International Institute for Environment and Development (IIED).
An accompanying guidance report can also be found at http://pubs.iied.org/16523IIED.html
For further information please visit http://www.iied.org/economics-climate-change-adaptation-water-sector
First published by the International Institute for Environment and Development (UK) in 2012
Copyright © International Institute for Environment and Development
All rights reserved
For a full list of publications please contact:
International Institute for Environment and Development (IIED)
80-86 Gray’s Inn Road, London, WC1X 8NH
Tel: +44 (0)20 3463 7399
Fax: +44 (0)20 3514 9055
www.iied.org/pubs
Disclaimer:
All omissions and inaccuracies in this document are the responsibility of the authors. The views expressed do not necessarily represent
those of the institutions involved, nor do they necessarily represent official policies of the donors.
Acknowledgements
The authors are very grateful for the support provided by the International Development Research Centre (IDRC), and the cooperation
and assistance of Mark Redwood, who deserves special thanks. Credit is also due to Muyeye Chambwera, Denise Loga, Saleemul Huq,
Simon Anderson, Enamul Haque, Arjun Dhakal, Javier Gonzales Iwanciw, Mohamed Boughlala, Laura de Bresser, Kate Lee, Steve Bass,
Alastair Bradstock, Helena Wright and Corrine Baulcomb for their guidance and advice.

1tABLe of ContentS
Table of ContentsAcronyms and abbreviations 2
Tables, figures and images 3
Executive summary 4
1 Introduction 6
2 Conceptual framework 8
Step 1: Identifying the impacts of climate change 8
Step 2: Identifying stakeholders 9
Step 3: Identifying adaptation strategies 9
Step 4: Measuring costs and benefits 10
4.1 Evaluating the monetary costs of adaptation 10
4.2 Evaluating the monetary benefits of adaptation 10
4.3 Estimating non-monetary costs and benefits 11
4.4 Methods used to evaluate an adaptation
strategy 11
Analytical methods 11
4.5 Uncertainty, discount rates and time horizons
of adaptation projects 13
4.6 Sensitivity analysis 14
Step 5: Ground truthing costs, benefits and stakeholder
willingness to pay for the costs of adaptation 14
3 Case studies 15
3.1 Case study 1: Khulna City, Bangladesh 15
3.1.1 Climate change and its impacts 15
3.1.2 Adaptation strategies 16
3.1.3 Data collection and analysis 16
3.1.4 Results of the stakeholder-focused CBA 17
3.2 Case study 2: The effect of melting glaciers on
urban water provision in Bolivia 19
3.2.1 Climate change and its impacts 19
3.2.2 Adaptation strategies 20
3.2.3 Data collection and analysis 21
3.2.4 Results of the stakeholder-focused CBA 21
3.3 Case study 3: Lake Chilwa catchment, Malawi 23
3.3.1 Climate change and its impact 23
3.3.2 Available adaptation strategies 25
3.3.3 Data collection and analysis 25
3.3.4 Results of the stakeholder-focused CBA 26
3.4 Case study 4: Conversion from surface to drip
irrigation in Morocco 28
3.4.1 Climate change and its impacts 28
3.4.2 Adaptation strategies 28
3.4.3 Data collection and analysis 29
3.4.4 Results of the stakeholder-focused CBA 29
3.5 Case study 5: Rupa Watershed, Kaski, Nepal 30
3.5.1 Climate change and its impacts 30
3.5.2 Adaptation strategies 32
3.5.3 Data collection and analysis 32
3.5.4 Results of the stakeholder-focused CBA 33
4 Synthesis 36
4.1 Methodological approach 36
4.2 Identifying the impacts of climate change 36
4.3 Stakeholder selection 37
4.4 Identifying adaptation strategies 37
4.5 Measuring CBA 38
4.6 Ground truthing in stakeholder-focused CBA 38
4.7 Capacity building 39
5 Conclusion 40
6 References 41

2 StAkehoLdeR-foCuSed CoSt-Benefit AnALySiS in the wAteR SeCtoR : SyntheSiS RepoRt
Acronyms and abbreviationsAMC Action in Mountain Community Nepal
CBA Cost-benefit analysis
CBO Community-based organisation
CGIAR Consultative Group on International Agricultural
Research Centres
FGD Focus group discussions
GCM Global Climate Modelling
GMP Green Morocco Plan
IIED International Institute for Environment and
Development
IRR Internal rate of return
KII Key informant interviews
MOE Ministry of Environment
NAPA National Adaptation Programme of Action
NGO Non-governmental organisation
NPV Net Present Value
RRA Rapid Rural Appraisal
SLD Shared learning dialogue

3tABLeS, figuReS And iMAgeS
tables, figures and imagesTable 1: The four main categories of stakeholder 9
Table 2: Cost of land/natural resources 12
Table 3: Cost of capital 12
Table 4: Net present value 13
Table 5: Stakeholder-focused CBA of the 22
new Peñas dam
Table 6: Stakeholder-focused CBA of reduced water 23
losses from pipelines
Table 7: Stakeholders in Lake Chilwa catchment 25
Table 8: Water saved after conversion to drip irrigation 30
in the Tadla perimeter (m3 per ha)
Table 9: Current and planned adaptation measures 32
Table 10: Present value of costs and benefits over a 34
30-year period
Table 11: Environmental CBA 34
Table 12: Stakeholder expectations of project costs 35
and benefits
Table 13: Stakeholder perceptions of cost sharing 35
(based on their understanding of the
distribution of benefits)
Image 1: Current water logging in Khulna 15
Image 2: Pura landscape showing the glacier 20
almost gone
Image 3: Grass growing as a result of increased 24
siltation in the lake
Figure 1: 2050 flood pattern in Khulna city 15
Figure 2: Framework for CBA of adaptation measures 17
in Khulna city
Figure 3: Project benefits based on stakeholder 18
preferences
Figure 4: Climate adaptation costs by stakeholder 18
and by type of adaptation
Figure 5: Project adaptation cost by stakeholder 19
Figure 6: Trends in glacier surface in the Tuni and 19
Condoriri watersheds
Figure 7: Water level trends in Lake Chilwa since 1948 24
Figure 8: Impacts and responses to climate change 24
Figure 9: Data collection methods, levels and findings 26
Figure 10: Stakeholder rankings of 27
(i) the cost of irrigation and SWC technologies;
(ii) the benefits of irrigation and SWC
technologies; (iii) the costs and benefits of
combined irrigation and SWC technologies;
iv) the costs and benefits of fish and bird
sanctuary patrols
Figure 11: NPV trends for separate and combined 28
adaptation strategies
Figure 12: Effects of drip irrigation on annual 30
citrus yields (t/ha)

4 StAkehoLdeR-foCuSed CoSt-Benefit AnALySiS in the wAteR SeCtoR : SyntheSiS RepoRt
executive summaryAccurate cost benefit analysis of climate change adaptation actions is not only critical in designing effective local-level adaptation
strategies, but also for generating information that feeds into national and global climate policy agreements. One of the main
challenges of this type of CBA is accommodating the wide-ranging impacts of climate change on diverse individuals and groups.
While some adaptations provide public benefits, such as protecting coastal areas from rising sea levels, many others generate
more private gains for individuals, firms or a consortia of these actors.
In addition, the process of identifying and calculating the future impacts of climate change is primarily driven by climate
projections. It is important to remember that scientifically drawn climate projections are inherently uncertain as they are based on
historical data and rely on certain fundamental assumptions. Historical data on low- and middle-income countries are often not
available, and are of questionable reliability and accuracy where they are available. Because of this gap, scientific data generally
needs to be supplemented with local knowledge, which can be obtained from different stakeholders, including local communities,
to allow meaningful conclusions to be drawn. The main limitation is that stakeholders are unlikely to be able to conceive the
longer-term implications and uncertainties associated with climate change. However, they provide very important and reliable past
trends.
In the water sector, where resources extend across geographical and political boundaries, adaptation often involves decisions
and actions by multiple stakeholders with differing shares in the costs and benefits of these initiatives. Hence the need for an
economic approach that takes account of the distributional aspects of adaptation: stakeholder-focused CBA. In this context,
economics is not only useful in assessing the returns from investment, but also in facilitating dialogue among stakeholders as they
seek solutions that address their diverse needs and interests.
In this study, we develop a stakeholder-based approach to CBA that involves primary stakeholders throughout the process from
identifying adaptation strategies to assessing how their costs and benefits are distributed. Five case studies from representative
low- and middle-income countries were selected to pilot the approach:
1) Bolivia (Latin America). This study looked at how stakeholders identify and prioritise adaptation strategies for domestic and
industrial water supplies in urban areas, and assessed the monetary and non-monetary costs and benefits of the prioritised
options.
2) Morocco (African Sahel). The monetary and non-monetary costs and benefits to different stakeholders generated by
changing from surface to drip irrigation systems are examined.
3) Malawi (sub-Saharan Africa). This study focused on an autonomous adaptation strategy to internalise the costs and
benefits of irrigation, and its effects on the fishery and bird sectors in a wetland catchment.
4) Bangladesh (lowland southern Asia). The main issue here was how different stakeholders weight the cost and benefits of
adaptation strategies, and how this weighting can be used to adjust the costs and benefits of each option.
5) Nepal (highland southern Asia). This study looked at the way that stakeholders identify and prioritise adaptation strategies,
and how their willingness to pay for them is influenced by the perceived costs and benefits of each strategy.

5exeCutive SuMMARy
All of the case studies generated evidence on the costs and benefits of adaptation. Their findings are summarised below.
n Discussions with stakeholders about adaptation options were informed by scientific climate analysis and local experience.
However there was a gap between the theoretical considerations and the practical realities on the ground, and no clear
separation between adaptation to climate change and coping with current climate variability. It seems that hard adaptation
options generally deal with climate change, while autonomous actions cope with existing variability and development
deficits. The fact that both are needed makes it difficult for stakeholders to separate them out in the analyses. The same
applies to development, as the adaptation actions suggested in Nepal, Bangladesh, Malawi and Morocco are all necessary
for both development and climate adaptation.
n Non-monetary benefits are highly significant, particularly for local households and the environment. Including different
stakeholder groups in the analysis helps identify benefits that are not directly captured in conventional CBA. For instance,
more than 50 per cent of the water saved by switching to drip irrigation in Morocco will increase long-term groundwater
levels; while incorporating soil and water conservation technologies into irrigation in Malawi benefits fisheries and birds,
as there is less siltation in the lake and better long-term yields reduce the need to hunt birds. Monetary costs are easily
estimated where a project involves capital investments such as dam building, but it is difficult to estimate the cost of
processes like capacity building. Costs and benefits are estimated over a 30-year period. Although the country teams
varied the discount rate according to the conditions on the ground and the type of project concerned, we were able to
compare the case studies and evaluate the performance of the stakeholder-focused approach by converting the costs into
US dollars and applying a midrange discount rate of 6 per cent across all five case studies.
n The benefits of adaptation for specific stakeholders could be maximised by giving them access to appropriate
technologies. For example, the Net Present Value (NPV) of drip irrigation for small-scale farmers in Morocco could be
improved if they had the technology to extend drip irrigation to food crops, rather than limiting it to cash crops as is
currently the case. Smallholder farmers are faced with a liquidity constraint to access such a technology. Reducing such a
constraint through subsidies not only benefits the small-scale farmers, but other stakeholders in the area too, including the
environment. This gives them greater parity with large-scale farmers who allocate more land to cash crops, and fare better
in the economic analyses.
n Most capital costs for infrastructure and suchlike are borne by government and external funding agencies, while local
communities and the private sector tend to carry operational costs and the cost of private capital assets such as
appropriate fishing gear, irrigation equipment, adaptive tourist facilities, etc. This tends to mean that total costs (at least
at start-up) are weighted towards public stakeholders, as in Bolivia, Bangladesh and Nepal, where local communities and
the private sector expect public stakeholders to invest in infrastructures. The payback periods for investment in local-level
capital equipment are relatively short (as in Malawi); in cases like Morocco where adaptation technology is already publicly
funded, it needs to be appropriately targeted to maximise the benefits for all stakeholders.
n A key challenge in all of the case studies was integrating the costs and benefits for different stakeholders into a common
framework in a way that can inform decision-making. This issue was addressed at various stages of the project, starting
with a compound cost-benefit assessment that covered all stakeholders, followed by separating the costs and benefits for
different stakeholders in order to inform the process in which they debated which options to pursue. In one case (Nepal)
their willingness to pay for the costs of adaptation was measured. The value of this approach lies in enabling stakeholders
to reach an informed consensus based on analysis that takes account of both monetary and non-monetary benefits.
n Engaging researchers and stakeholders in the economic analyses is an effective means of building capacity at various
levels. For example, the junior researchers supporting the case study leaders in Bolivia, Malawi and Bangladesh were
women who were studying or working at university, while country researchers broadened their skills by posting updates of
their work on the project website.
6 StAkehoLdeR-foCuSed CoSt-Benefit AnALySiS in the wAteR SeCtoR : SyntheSiS RepoRt
1 introductionAccurate CBA (CBA) of climate change adaptation actions is not only critical in designing effective local-level adaptation
strategies, but also for generating information that feeds into national and global climate policy agreements. Identifying which
effects of climate change are relevant to particular sectors and formulating adaptive response options is also useful for developing
local action plans, which in turn support informed future responses (Sachs et al., 1999; Stage, 2010). It is important to quantify
the impacts of climate change in order to formulate appropriate adaptation measures and ensure that there is genuine local and
national participation in global climate change agreements (Cao, 2010; Timmins, 2006).
The diverse impacts that climate change has on a wide range of individuals and groups present a particular challenge for CBA of
adaptation actions. The literature on this topic identifies several reasons why stakeholder-based adaptation is needed in low- and
middle-income countries. The first is the need for equity in stakeholder adaptation. Parry et al. (2009) note that climate change
has a disproportionate impact on vulnerable populations, many of whom are poor. Therefore, it is important for adaptation planners
to consider both the net benefits of adaptation and the way that the costs and benefits of adaptation options are distributed. In
addition, steps must be taken to identify and help the poor and most vulnerable - including seeking their views on adaptation
priorities and ensuring an enabling environment (World Bank 2010a).
The second compelling reason for adopting a stakeholder-focused approach is the importance of qualitative CBA in climate
adaptation; stakeholder-based CBA is flexible enough to accommodate the qualitative aspects of this tool. Quantitative CBA
tends to dominate other types of economic analysis, but is widely criticised in climate policy as too simplistic for complex climate-
economy analysis (van den Bergh, 1999).
The third reason why stakeholder-based CBA is suitable for climate change adaptation studies relates to a particular (and
particularly important) aspect of climate adaptation: public goods. These are difficult to measure and attribute, and consequently
tend to be left out of conventional CBA. Adaptive responses that protect public goods from the adverse impacts of climate
change and variability will generate benefits that are external to private agents. It is also worth noting that information about future
climate patterns and the benefits and costs of adaptation options has some of the attributes of a public good (Leary, 1999).
Fourthly, stakeholder-focused CBA is justified by the need to look beyond climate change policy and incorporate other aspects of
the economy. Addressing the many barriers to effective adaptation requires a comprehensive and dynamic policy approach that
covers a range of issues at various levels. Climate risk management, for example, ranges from farmers’ understanding of changing
risk profiles to establishing efficient markets that facilitate effective response strategies. A crucial component of this approach
is the implementation of adaptation assessment frameworks that are relevant, robust and easily operated by all stakeholders,
practitioners, policy-makers and scientists (World Bank, 2010a).
The final reason is that most of the real costs of adaptation will be borne by the affected communities and households themselves,
despite the best efforts of government and other external donors. Stakeholder-focused CBA helps people understand what those
costs are likely to be, and to seek potential sources of external funding.
While our analysis is the first comprehensive application of stakeholder-based CBA in a formal study, different aspects of the
approach have been considered and applied in previous studies. Fankhauser (1996) and Leary (1999) pioneered the evaluation
of the benefits and costs of adaptation to climate change, proposing a general framework that would be applicable to a wide
range of adaptation responses. The World Bank (2010a) used a bottom-up approach to assess climate change response
strategies in agricultural systems in three Latin American countries, arguing that involving farmers, farmer organisations,
agronomists, technical experts, extension workers and other stakeholders in identifying and prioritising response options increased

7intRoduCtion
the feasibility and success of the chosen adaptation measures. However, this exercise stopped short of evaluating the net merits
of the chosen adaptation action for each group of stakeholders.
The case studies in this report evaluates the net benefits from each of the stakeholders and how they affect each other. This
is important because it has enabled the different adaptation methods to be evaluated, and assessed their net benefits, hence
providing a platform for how to prioritise them.
A study by Parry et al. (2009) suggests that imbalances in the distribution of net benefits between stakeholder groups can be
addressed by assigning different weights to different groups. They maintain that the distributional impacts of adaptation options
can be fairly addressed by weighting different costs and benefits according to who receives the benefits and who bears the cost.
While this approach constitutes a step forward in considering whether the costs and benefits of adaptation are shared fairly, it
does not explicitly include stakeholder negotiations on the assignment of costs and benefits.
Stakeholder-based CBA fulfils a number of purposes. It can be used to:
a) Identify and prioritise adaptation strategies
b) Adjust the costs and benefits of adaptation, using weights that stakeholders assign to different adaptation strategies
c) Identify and internalise costs and benefits
d) Identify and include the non-monetary costs and benefits of adaptation actions
e) Facilitate negotiations among different stakeholders who would otherwise not interact with each other.
In this study, we develop a stakeholder-based approach to CBA that involves primary stakeholders throughout the process from
identifying adaptation strategies to assessing the distribution of their costs and benefits. Five case studies from representative
low- and middle-income countries were selected to pilot the approach:
1) Bolivia (Latin America). This study looked at how stakeholders can identify and prioritise adaptation strategies for domestic
and industrial water supplies in urban areas, and assessed the monetary and non-monetary cost and benefits of the
prioritised options.
2) Morocco (African Sahel). The monetary and non-monetary costs and benefits of changing from surface to drip irrigation
systems are examined for different stakeholders.
3) Malawi (sub-Saharan Africa). This study focused on an autonomous adaptation strategy to internalise the costs and
benefits of irrigation, and its effects on the fishery and bird sectors in a wetland catchment.
4) Bangladesh (lowland southern Asia). The main issue here was how different stakeholders weight their costs and benefits,
and how this weighting can be used to adjust the costs and benefits of adaptation strategies.
5) Nepal (highland southern Asia). This study looked at the way that stakeholders identify and prioritise adaptation strategies,
and how the perceived costs and benefits of these strategies affect stakeholders’ willingness to pay for them.
Accompanying country reports and a guidance report can be found at http://www.iied.org/economics-climate-change-adaptation-
water-sector

8 StAkehoLdeR-foCuSed CoSt-Benefit AnALySiS in the wAteR SeCtoR : SyntheSiS RepoRt
2 Conceptual framework
This section presents the framework for stakeholder-based CBA of climate adaptation options. The first step in this approach is to
specify the impacts of climate change that need to be addressed and identify a set of suitable adaptation strategies for doing so.
The second step involves identifying the groups, individuals and institutions that are believed to be mainly affected by the climate
change scenario and likely to bear the costs and benefits of the adaptation strategy or strategies. The third step is to prioritise
the adaptation strategies according to criteria set by the stakeholders, and narrow them down to the most suitable options. In the
fourth step, monetary and non-monetary costs and benefits are ascribed to different aspects of the priority adaptation strategy;
while the final step determines how the costs and benefits of adaptation are distributed between stakeholders, and how much
each stakeholder is willing to pay for particular strategies.
A template for financial CBA and the associated data requirements is provided at the end of the section.
Steps Actions
Step 1: Identify the impacts of climate change
Step 2: Identify stakeholders
Step 3: Identify adaptation strategies
Step 4: Measure costs and benefits
Step 5: Ground-truth the costs and benefits, and stakeholders’ willingness to pay for the costs of adaptation
Step 1: Identifying the impacts of climate change
By its very nature, climate change is global and has wide-ranging implications for every imaginable aspect of life. Therefore,
the rational first step in the CBA of a climate change adaptation project is to define the impacts of climate change on a certain
location and particular economic sector (agriculture, water etc.). It is essential to understand the scope of the climate change
scenario in order to frame an adaptation strategy and consider possible alternative options. This involves defining the geographical
area and main economic sector concerned, identifying baselines and looking at various climatic predictions.
One of the most important aspects of estimating the costs and benefits of adaptation options is setting the baseline, which defines
what would happen to the main variables if the climate did not change. This is particularly difficult because adaptation assessments
have to look into the future and predict levels of development and social change in a given period. Some researchers advocate the
use of multiple baselines to accommodate the uncertainties involved in estimating the costs and benefits of adaptation and evaluating
adaptation options (Parry et al., 2009; World Bank, 2009b). The next challenge is to identify climatic projections. This normally
involves choosing two or more climate scenarios to capture the widest possible range of climate model predictions (World Bank,
2009b), a step that entails looking at past climate data in close collaboration with climate change modellers.
The purpose of this step is to ensure that all the adaptation strategies covered by the analysis are designed to address the
impacts of climate change. Where adaptation strategies have yet to be identified, this step provides information that can be used
to generate adaptation actions with stakeholders.
9ConCeptuAL fRAMewoRk
The possible impacts of climate change are identified on the basis of likely future climate patterns. Such information is usually
general, relating to a whole country or region, and is rarely specific to the area covered by a case study
Step 2: Identifying stakeholders
It is important to identify the stakeholders concerned to ensure that everyone’s interests are represented in the collaborative
process, data collection and analyses. The extent to which all stakeholders are identified and their interests taken on board will
largely determine the acceptability and sustainability of any adaptation actions.
The term ‘stakeholder’ refers to all significant groups or entities that are likely to be directly or indirectly affected by climate
change, take part in adaptation and be affected by adaptation actions (see Bryson, 2003, and other sources for formal definitions
of the term). The extent to which stakeholder groups are disaggregated into upstream and downstream groups, livestock farmers
and crop producers, male- and female-headed households, national and local governments, etc., depends on the extent to which
their interests differ. Greater disaggregation obviously entails additional engagement and analysis.
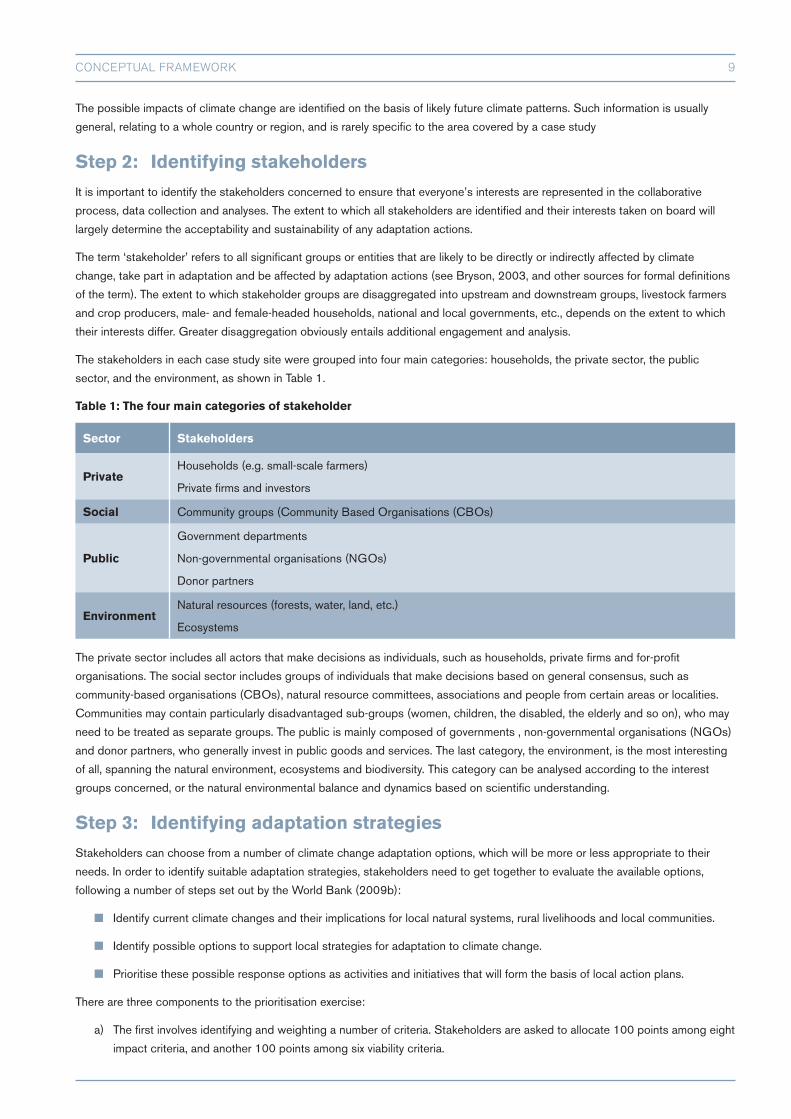
The stakeholders in each case study site were grouped into four main categories: households, the private sector, the public
sector, and the environment, as shown in Table 1.
Table 1: The four main categories of stakeholder
Sector Stakeholders
PrivateHouseholds (e.g. small-scale farmers)
Private firms and investors
Social Community groups (Community Based Organisations (CBOs)
Public
Government departments
Non-governmental organisations (NGOs)
Donor partners
EnvironmentNatural resources (forests, water, land, etc.)
Ecosystems
The private sector includes all actors that make decisions as individuals, such as households, private firms and for-profit
organisations. The social sector includes groups of individuals that make decisions based on general consensus, such as
community-based organisations (CBOs), natural resource committees, associations and people from certain areas or localities.
Communities may contain particularly disadvantaged sub-groups (women, children, the disabled, the elderly and so on), who may
need to be treated as separate groups. The public is mainly composed of governments , non-governmental organisations (NGOs)
and donor partners, who generally invest in public goods and services. The last category, the environment, is the most interesting
of all, spanning the natural environment, ecosystems and biodiversity. This category can be analysed according to the interest
groups concerned, or the natural environmental balance and dynamics based on scientific understanding.
Step 3: Identifying adaptation strategies
Stakeholders can choose from a number of climate change adaptation options, which will be more or less appropriate to their
needs. In order to identify suitable adaptation strategies, stakeholders need to get together to evaluate the available options,
following a number of steps set out by the World Bank (2009b):
n Identify current climate changes and their implications for local natural systems, rural livelihoods and local communities.
n Identify possible options to support local strategies for adaptation to climate change.
n Prioritise these possible response options as activities and initiatives that will form the basis of local action plans.
There are three components to the prioritisation exercise:
a) The first involves identifying and weighting a number of criteria. Stakeholders are asked to allocate 100 points among eight
impact criteria, and another 100 points among six viability criteria.

10 StAkehoLdeR-foCuSed CoSt-Benefit AnALySiS in the wAteR SeCtoR : SyntheSiS RepoRt
b) The next step is to determine the characteristics of each response option, in order to develop a profile of each option
identified by stakeholders that includes information on:
(i) the underlying need for the response option
(ii) technical characteristics
(iii) a rough indication of the associated costs and benefits.
c) The third and final step is to apply the impact and viability criteria to each response option and assign values to them,
to generate a final prioritised ranking of the response options. Participants are given a matrix and asked to value each
response option on a scale from 1 to 10, according to the extent to which they think it addresses each criterion.
These ratings are then weighted according to a previously agreed system, with 50 per cent of the overall score proportionately
assigned to the impact criteria and 50 per cent to the viability criteria, providing a final ranking of the possible adaptation options.
Another popular approach to identifying adaptation options is rapid rural appraisal (RRA). This methodology is used in a wide
range of project evaluation exercises,and was originally devised for the Farming Systems Research and Extension, promoted
by the Consultative Group on International Agricultural Research Centres (CGIAR). It was developed to counteract the
disadvantages of more traditional research methods such as the time taken to produce results, the high cost of formal surveys,
and the unreliability of data due to non-sampling errors. Rapid rural appraisal provides a bridge between formal surveys and
unstructured research methods such as in-depth interviews, focus groups and observation studies. In low- and middle-income
countries it is sometimes difficult to apply the standard market research techniques employed elsewhere due to a lack of baseline
data, poor facilities for market research (no sampling frames, relatively low literacy among many target populations, lack of
trained enumerators) and low awareness of the need for market research. RRA can help overcome these and other limitations by
mapping the strategy options identified by stakeholders and identifying the most feasible and plausible strategies for detailed and
quantitative evaluation.
The methods used to identify adaptation alternatives in the five case studies in this project can be seen as a combination of RRA
and the priority ranking advocated by the World Bank (2009b). It is worth pointing out that most of the adaptation actions that are
identified will entail (short-term) adaptation to climate variability rather than (longer-term) adaptation to climate change.
Step 4: Measuring costs and benefits
Having identified the optimal adaptation strategy, the next step is to evaluate its economic merit. This is done by using qualitative
and quantitative methods to establish a rough estimate of the costs and benefits for all stakeholders, as individuals and as a
group. It is important to understand various aspects of the costs and benefits before embarking on this evaluation.
4.1 Evaluating the monetary costs of adaptation
The concept of costing adaptation is based on comparisons between a future world without climate change and a future world
with climate change. Each of the actions required to adapt to the new conditions caused by climate change will have certain costs
attached (World Bank, 2009d), which are generally estimated by major economic sectors (Parry et al., 2009). The methods used
for stakeholder-focused CBA need to be tailored to assess the qualitative and quantitative costs borne by different stakeholders,
which may differ within and between groups. These case studies assess the range of costs that households have already incurred
in adapting to climate-related hazards and how much money and what resources institutions need to help households adapt
to particular hazards. These estimates are then used to judge how much investment or aid governments or donors will need to
provide to promote particular adaptation interventions in rural areas. The information collected from stakeholder interviews is
cross-checked with information from focus group discussions (FGD) and expert interviews.
4.2 Evaluating the monetary benefits of adaptation
A standard way of estimating the benefits of adaptation to climate change is to calculate the expected impacts of climate change
without adaptation and the expected damage avoided through adaptation. The gross benefit of adaptation is the difference
between the expected damage caused by climate change with and without adaptation. The uncertainty surrounding climate
change and its impacts makes estimating the costs and benefits of adaptation a very complex and somewhat arbitrary process, in
addition to the challenges associated with evaluating physical and ecological changes in monetary terms (World Bank, 2009d).

11intRoduCtion
4.3 Estimating non-monetary costs and benefits
Because projects inevitably generate costs and benefits that extend beyond their direct beneficiaries, it is important to examine
their non-monetary costs and benefits as well as their economic value. While the negative impacts of certain climate-related
events on human lives, livelihoods and ecosystems cannot be monetised, they have financial implications that may amplify or
reduce the positive or negative effects of a project. This suggests that non-monetary costs and benefits may determine whether
a project is actually worthwhile in the eyes of all stakeholders (for instance, whether a climate change adaptation project will have
the expected significant positive effects on surrounding ecosystems).
4.4 Methods used to evaluate an adaptation strategy
The most popular method for quantitative evaluation of a project’s net worth is to calculate its NPV. Other non-market aspects
such as social and environmental benefits and costs are evaluated qualitatively.
Net Present Value is the difference between the discounted value of the future benefits and costs associated with a project,
calculated at a required rate. The higher the NPV, the more economically viable the project, as it means that it is earning at that
rate plus a bit extra. If the NPV is negative, the project is not economically viable. The cost-benefit ratio is the ratio between the
present value of a project’s benefits and the present value of its costs. The higher the cost-benefit ratio, the more economically
viable the project, as it means that it is earning more than the required rate of return. For example, a cost-benefit ratio of 1.04
means that for every dollar spent on a project, the benefits generated are valued at $1.04. The Internal Rate of Return is the
break-even discount rate at which the present value of a project’s benefits equals the present value of its costs. The higher the
internal rate of return, the more economically attractive the project.
A project needs to generate positive net benefits to be economically worthwhile; in other words, the discounted value of its
benefits needs to exceed the discounted value of its costs. This is equivalent to a NPV greater than zero, and an internal rate of
return higher than the capital costs.
Analytical methods
For the purposes of financial evaluation, a project is viewed as a commercial entity whose objective is to maximise private profits.
Its success in doing so is judged by analysing its annual income and expenditure. The major benefit component in NPV analysis
is the annual financial flows, or annual revenue earned. The capital cost of an adaptation project represents the time stream of
investment over its lifetime. Investment expenditure in any year may include the purchase of capital goods, cost of acquiring land,
and payments for skilled and unskilled labour and material inputs for project construction. Operating and maintenance costs
include annual expenditure on energy, material inputs for maintenance and payments for skilled and unskilled labour. Investment
goods and material inputs used by the project are evaluated at market prices, with the commodity market price taken as the
producer price plus commodity tax minus commodity subsidy.
The NPV is calculated using the following formula:
where n= the lifetime of the project and i= any given year.
The internal rate of return is iteratively computed by setting the NPV value equal to zero. In order to calculate the internal rate of
return, the equation above is modified to:
An iterative solver is used to compute the internal rate of return, using arbitrary starting values in Excel or other solvers.
CBA of a planned climate change adaptation project could use discounted cash flow analysis at discount rates of 6 per cent
(market interest rate) and 50 per cent (average time preference derived from experimental field surveys in numerous low- and
middle-income countries (Yesuf and Bluffstone, 2009). Although project lifetimes vary, a 30-year period can be used as a baseline.

12 StAkehoLdeR-foCuSed CoSt-Benefit AnALySiS in the wAteR SeCtoR : SyntheSiS RepoRt
Data requirements
Information on income and expenditure is needed to analyse annual cash flows for cost-benefit assessments.
It should be noted that many of these figures will be based on assumptions.
Costs
The major cost component is expenditure on materials and labour, which is directly included in accounting costs. Other,
opportunity costs are discussed below.
1. Opportunity costs of land acquisition and preparation
Most pre-production costs are associated with acquiring and clearing land for the planned operation and setting up the facilities.
It may be assumed that land for this kind of investment is acquired through long-term leases, and that leases and licences account
for most of the acquisition costs.
Table 2: Cost of land/natural resources
Item Total Unit costCost of funding
(Interest rate %)Yearly cost of funding
Land acquisition (per ha)
Cost of installing the facility
2. Cost of capital/funding
It is assumed that the funds required for investment are obtained by borrowing a lump sum (to cover start-up costs) from a
commercial bank at a market interest rate, which is given at 6 per cent. It is assumed that operational expenses are covered by
internal finances.
Table 3: Cost of capital
Item Total Unit costCost of funding
(Interest rate %)Total cost of funding

13ConCeptuAL fRAMewoRk
Table 4: Net present value
Project year 0 1 2 ….. N
BENEFITS
Amount or quantity of output (irrigation water, etc.)
Price
Benefit flow (price*quantity)
COST
Sunk cost (cost of capital and land)
Variable cost
Cost flow (variable cost +sunk cost)
NET REVENUE
Net benefit flow (revenue flow–cost flow)
NPV
Discount rate (6 per cent)
Discounted net benefit flow
Net Present Value of adaptation project (simple sum of discounted net benefit flow)
4.5. Uncertainty, discount rates and time horizons of adaptation projects
Before assessing the costs and benefits of an adaptation project, it is important to identify three critical dimensions of the
initiative:
a) First, the degree to which uncertainty can be incorporated into the assessment. There will inevitably be considerable
uncertainty about each phase in the chain of climate cause and effect: greenhouse gas emissions, effects on climate,
ecological and hydrological consequences, social and economic responses, impacts on human health and world-wide
welfare distribution (Van Den Bergh, 1999). Because uncertainty about the future impacts of climate change makes it
difficult to identify the best adaptation options, adaptation measures need to be designed in a flexible manner so that their
respective costs and benefits can be reported with a given margin for uncertainty (Parry et al., 2009).
b) The second critical parameter is the discount rate that will be used to convert benefit and cost streams into their equivalent
present values. Present values are very sensitive to discount rates and assumptions about their consistency over time.
Applying a range of discount rates allows planners to test the validity of results and ensure that the chosen discount rate
is not close to a tipping point that reverses the decision, in which case further analysis is required (Parry et al., 2009).
Discount rates for projects with short time horizons (20 to 30 years) should not be controversial, as the costs and benefits
of adaptation measures are usually felt within a reasonably short time, and the ancillary benefits of investments make
projects similar to other public investments (World Bank, 2009d).
c) Lastly, the time horizon of the evaluation is directly linked to the discount rate. This horizon depends on the lifespan of
the options under consideration. The lifespan of infrastructure projects like dams and roads ranges from 50 to 70 years;
therefore, all costs, including investment and maintenance costs and the benefits and expected impacts of climate change
over the entire period, should be taken into account when assessing these options. By contrast, plans for adaptation to
the health impacts of climate change can take a short- to medium-term view (five to 20 years) which can subsequently be
extended to cover longer periods if necessary (Parry et al., 2009).

14 StAkehoLdeR-foCuSed CoSt-Benefit AnALySiS in the wAteR SeCtoR : SyntheSiS RepoRt
4.6 Sensitivity analysis
This type of analysis assesses the sensitivity of NPV values to changes in the discount rate, project lifespan and prices. If the NPV
values were computed using a discount rate of 6 per cent over 25 years, the sensitivity of the discounted present value of net
benefits could be calculated by reducing the discount rate to 5 per cent. Further sensitivity analyses can be conducted by varying
parameters such as price, tax, subsidies and input values.
Step 5: Ground truthing costs, benefits and stakeholder willingness to pay for the costs of adaptation
It is important to ground truth various variables in order to balance local perceptions against academic or expert assessments of
environmental change, costs and benefits. This is to ensure that every element of the stakeholder-focused CBA is relevant and
meaningful to the stakeholders who will be involved in implementing adaptation actions and wherever possible, supported by
objectively verified information.
This is a difficult balance to strike when trying to predict the costs and benefits associated with future climate change because
knowledge and behaviour based on previous climate patterns may not fit future climatic conditions. It all depends on the extent
and speed with which climate change occurs.
There are four main categories of information needed to ground truth stakeholder-focused CBA:
(i) assumptions about stakeholder preferences for different types of adaptation actions and strategies;
(ii) the list and magnitude of relevant costs and benefits identified by various stakeholders and/or researchers;
(iii) the type, magnitude and timing of expected/existing changes caused by climate change (depending on whether the analysis is
a retrospective or prospective valuation of adaptation actions);
(iv) the efficacy of the adaptation actions in addressing these climatic changes.
These four types of information are vital for an accurate assessment of costs and benefits, and to consolidate stakeholder
engagement or negotiations on the development and implementation of adaptation measures.

15CASe StudieS
3 Case studies
3.1 Case study 1: Khulna City, Bangladesh
3.1.1 Climate change and its impacts
Khulna is the third-largest city in Bangladesh, covering about 45 km2 of land in the southwestern coastal region. It is bounded
by the three rivers of Bhairab-Rupsha to the east, Khudi Khal-Mayur to the west, and Harintana Khal to the south, all of which are
affected by tidal waves.
In 2001 Khulna had a population of around 2 million and an annual growth rate of 2 per cent (last available census report). About
46 per cent of land in the city is now built up, with around 15 per cent of this put to industrial use, 5 per cent under commercial
use and the rest used for residential and other purposes. Non-built-up areas are used for agriculture and fisheries. The whole
metropolitan area is approximately 2.5 metres above the mean sea level. Its drainage system is linked to the western Mayur River
as a result of local topography and low-lying areas are often waterlogged due to natural flooding and mismanagement of the
drainage infrastructure (see figure 1).
Predicted climate events for Khulna city under future IPCC scenarios A and B show that average monthly temperatures will rise
by 1.7°C by 2050 and annual rainfall will increase by 5 per cent, while rainfall intensity (4.3mm/hr) will increase by 4.2 to 5.9
times per year. In addition to rising sea levels, floods are expected to increase and cover almost the whole Khulna area. Figure 1
indicates that nearly 26 of the city’s 31 wards are likely to be inundated if the model’s predictions are correct.
Figure 1: 2050 flood pattern in Khulna city Image 1: Current water logging in Khulna
Source: Asian Development Bank, 2011

16 StAkehoLdeR-foCuSed CoSt-Benefit AnALySiS in the wAteR SeCtoR : SyntheSiS RepoRt
The city’s drainage system is expected to be severely affected by floods as it faces the threat of rising sea levels, higher
precipitation in the city area, and increased inflows of water due to rising water levels in surrounding rivers. Moreover, these rivers
serve as the main drainage channels for the south-west of the country.
3.1.2 Adaptation strategies
These climate change predictions were used to forecast future drainage blocking in Khulna city, and prepare an adaptation plan
to mitigate the effects of climate change on the lives and livelihoods of its millions of inhabitants. Predicted climate events indicate
that the most severe impacts will be felt after 2030 and that adaptation plans should reconsider the design and management
of urban infrastructures. The predictions also suggest that the city should realign its institutions in order to develop an effective
strategy to combat the effects of climate change. This case study, which is based on these predictions, looks into the effect of
stakeholder-focused analysis on the CBA of proposed adaptation strategies.
For the purposes of this analysis, adaptation activities were classified into four groups:
a) Structural – construction of infrastructures.
b) Maintenance – maintaining existing infrastructure in order to deal with climate risks.
c) Managerial – requiring changes in the overall management of the city and the roles played by individuals, communities and
government institutions.
d) Awareness – informing communities and households how to deal with climate risks.
3.1.3 Data collection and analysis
The main research activities revolved around understanding the different preferences for adaptation measures expressed by
various stakeholders in response to the climate change scenario for Khulna city. The stakeholders involved in this study were
divided into four groups:
a) Private stakeholders: residents likely to be affected by climate change in the city
b) Public stakeholders: government offices representing the public interest
c) Community stakeholders: NGOs and other CBOs such as mosques, temples, schools, etc.
d) Environmental stakeholders: represented by NGOs, researchers, academics and environmental pressure groups.
The study used semi-structured interviews, FGDs and primary survey tools to reach out to the different groups. Semi-structured,
in-depth interviews were conducted with various government offices; a FGD with local stakeholders discussed community and
environmental issues; and a primary household survey was conducted to ensure that individuals and businesses were covered.
Discussion meetings focused on the various adaptation strategies adopted by different stakeholders. This enabled the research
team to develop an idea of the type of adaptation strategies being planned and implemented by different groups, and provided the
basis for the survey questionnaire.
Analytical framework for stakeholder-based analysis
CBA can be used to analyse the net welfare gain from a project and select the best project for a particular purpose. It usually
includes analysis of the direct and indirect benefits and costs of a project under different market conditions and institutional
regimes. When considering the net benefits of climate change adaptation practices, we hypothesised that stakeholders in
adaptation interventions vary, and that they derive different benefits from the interventions. Adaptation costs are divided into
several segments to reflect the different costs incurred by private individuals and enterprises, public institutions, and communities.
The benefits of each adaptation strategy also differ between stakeholder groups. CBA usually adds these benefits and costs in
monetary terms, assuming that all households derive the same benefits from a particular adaptation action. Yet it can be argued
that different stakeholders may attach different ‘values’ to the same monetary unit of benefits. In other words, 1 dollar benefit
17CASe StudieS
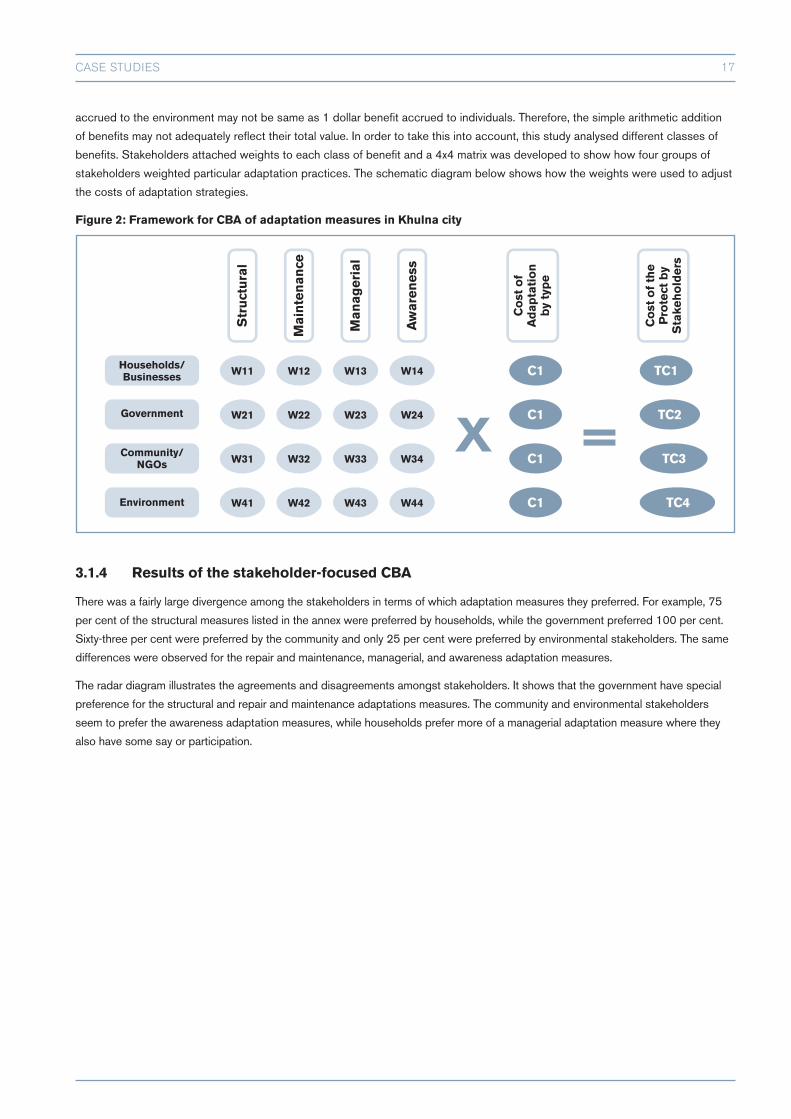
accrued to the environment may not be same as 1 dollar benefit accrued to individuals. Therefore, the simple arithmetic addition
of benefits may not adequately reflect their total value. In order to take this into account, this study analysed different classes of
benefits. Stakeholders attached weights to each class of benefit and a 4x4 matrix was developed to show how four groups of
stakeholders weighted particular adaptation practices. The schematic diagram below shows how the weights were used to adjust
the costs of adaptation strategies.
Figure 2: Framework for CBA of adaptation measures in Khulna city
Households/Businesses
Government
Community/NGOs
Environment
W11
W41
W31
W21
Str
uct
ura
l
W12
W42
W32
W22
Mai
nte
nan
ce
W13
W43
W33
W23
Man
ager
ial
W14
W44
W34
W24A
war
enes
s
X
C1
Co
st o
fA
dap
tati
on
by
typ
e
C1
C1
C1=
TC1
Co
st o
f th
eP
rote
ct b
yS
take
ho
lder
s
TC2
TC4
TC3
3.1.4 Results of the stakeholder-focused CBA
There was a fairly large divergence among the stakeholders in terms of which adaptation measures they preferred. For example, 75
per cent of the structural measures listed in the annex were preferred by households, while the government preferred 100 per cent.
Sixty-three per cent were preferred by the community and only 25 per cent were preferred by environmental stakeholders. The same
differences were observed for the repair and maintenance, managerial, and awareness adaptation measures.
The radar diagram illustrates the agreements and disagreements amongst stakeholders. It shows that the government have special
preference for the structural and repair and maintenance adaptations measures. The community and environmental stakeholders
seem to prefer the awareness adaptation measures, while households prefer more of a managerial adaptation measure where they
also have some say or participation.

18 StAkehoLdeR-foCuSed CoSt-Benefit AnALySiS in the wAteR SeCtoR : SyntheSiS RepoRt
Figure 3: Project benefits based on stakeholder preferences
Source: FGDs, in-depth interviews, 2010-11
Using the cost of adaptations provided in the Asia Development Bank (ADB) study, Figure 4 shows that the government prefers the
most costly options while environmental stakeholders prefer the least costly adaptation options. It also shows how the set of adaptation
options differs by stakeholder. This clearly justifies the use of stakeholder-based CBA for climate-related adaptation projects.
Figure 4: Climate adaptation costs by stakeholder and by type of adaptation
Source: Author’s calculation
Figure 5 summarises the cost based on each of the stakeholders. Public authorities favour the most expensive measures followed by
the private sector, the community and the environmental stakeholders. It is also evident that while structural adaptation measures are
preferred by the government or public agencies, community and environmental groups preferred the awareness type of adaptation
measures. Such understanding of preference and cost can ensure acceptability and hence sustainability of adaptation projects.

19CASe StudieS
Figure 5: Project adaptation cost by stakeholder
Source: Author’s calculation
3.2 Case study 2: The effect of melting glaciers on urban water provision in Bolivia
3.2.1 Climate change and its impacts
Melting glaciers in the Bolivian Altiplano have been the focus of climate change discussions for the past two decades, as 20 per
cent of the Andean glaciers is located in Bolivia, providing important reservoirs for the cities of La Paz and El Alto and irrigation
in the rural highlands. A number of publications are now available on the hydrology of glacier basins and the potential impacts
of glacial retreat on the availability and sustainability of water resources. The major concern among water practitioners is the
observation that the climate is becoming more erratic, and that greater uncertainty places an additional burden on water demands
and future design systems. Some 80 per cent of the glaciers in the Bolivian tropical Andes are melting. Many have already
disappeared and it is estimated that the Tuni-Condoriri system, which is important for water provision in the cities of La Paz and el
Alto, will disappear between 2025 and 2045 (see Figure 6).
Figure 6: Trends in glacier surface in the Tuni and Condoriri watersheds
Source: Instituto Boliviano de la Montaña Source: IHH-UMSA, IRD

20 StAkehoLdeR-foCuSed CoSt-Benefit AnALySiS in the wAteR SeCtoR : SyntheSiS RepoRt
Image 2: Pura landscape showing the glacier almost gone
Source: Instituto Boliviano de la Montaña
Even though climate trends and future scenarios are not well understood, it is clear that changes in rainfall patterns, delays in the
start of the rainy season in many parts of the country, and increasingly frequent extreme rain events are stressing water provision
systems, increasing levels of sediment in dams, damaging infrastructures, pipelines and drainage and sanitation systems, and
reducing the lifespan and effectiveness of infrastructure projects.
The Bolivian government has initiated various pilot activities to address the potential risks associated with glacial retreat, with
support from multilateral banks and international cooperation agencies. These include the construction of urgently needed
infrastructures to reduce potential risk and improve the reliability of water systems.
3.2.2 Adaptation strategies
Jeschke (2009) used a comprehensive study of the Zongo basin to identify different categories of adaptation measures in the
northern Altiplano. Government adaptation interventions to date have revolved around the following strategies:
a) Climate proofing to strengthen the resilience of local populations, ecosystems and economies to the impacts of glacier retreat.
b) Water storage in the wet season to replace the glaciers’ declining capacity to provide natural regulation; rainwater
cropping and storage systems.
c) Water management and water conservation to ensure the sustainable and efficient use of water in the tropical Andes,
thereby reducing demand.
d) Research, monitoring and risk management. The likelihood of natural disasters in the tropical Andes is expected to increase
considerably due to glacial retreat and the intensification of the hydrological cycle (see Painter, 2007, for example).
Other environmentally driven proposals include the sustainable use of ground water and afforestation measures to enhance
infiltration levels, conserving grass and peatlands to ensure sound management, reduce pressure from cattle and avoid the
exploitation of peatlands, and cleaning Cohana Bay in Lake Titicaca. Following discussions with decision-makers from the Ministry
of Environment PRAA project and a workshop held in February 2012, the project team selected two options to be evaluated in
more detail through multi-stakeholder CBA: constructing a dam and increasing efficiency in the water delivery system.
1) Constructing a new dam. The Bolivian government needs to evaluate this option as a means of satisfying the growing
demand for water and tackling the increasing water shortages caused by climate change. We chose the construction of
the new Peñas dam in the Batallas district 60 kilometres from La Paz and El Alto for our case study. The construction of
the dam has major implications in a rural district where the two principal livelihoods (agriculture and dairy) compete for
water, and demand outstrips supply.

21CASe StudieS
The proposed 15 million m3 dam is mainly designed to complement the current water system in La Paz and El Alto and
provide water for El Alto. The additional water will maintain and hopefully increase current water coverage (80 per cent) in
El Alto, which is growing rapidly at the rate of 5 per cent a year.
In addition to providing water for El Alto (which is a political priority) and meeting the demand for water in the municipality
of Batallas (which owns the watershed), the project also needs to evaluate the costs and benefits of a complementary
livelihood generation project in the site. For the purposes of this case study we chose an alternative strategy –
management of the ecosystem. This was tested in neighbouring municipalities where the emphasis was placed on reviving
the productivity of the ecosystem, reducing soil erosion, enhancing soil fertility, recovering native pastures and improving
dairy livestock..
2) Efficiency measures in the La Paz / El Alto pipe water system. Reducing water losses (uncounted water) and
pollution in the water system can increase the availability and sustainability of water supplies. The local water company
EPSAS estimates that water losses can be reduced from almost 40 per cent to 26 per cent, generating 4 to 5 million m3
more available water with low incremental costs.
3.2.3 Data collection and analysis
Although Nur University is not one of the principal stakeholders in this field, it has sufficient experience in participatory processes
to understand and integrate different stakeholder perceptions and viewpoints. IIED provided support in initiating stakeholder
consultations for the multi-stakeholder CBA of adaptation measures. The main steps in this process are outlined below:
(1) Gather relevant information from different sources (scientific papers, project reports, reportages and interviews) in order to
understand the complex issues associated with glacial retreat and water provision in the greater La Paz–El Alto area.
(2) Approach relevant stakeholders to identify their different perspectives and demands and obtain an overview of the range of
suggested adaptation measures.
(3) Focus conversations with decision-makers on one particular adaptation option where multi-stakeholder analysis is needed.
(4) Bring stakeholders together to talk about their different viewpoints and build a common agenda.
3.2.4 Results of the stakeholder-focused CBA
A multi-stakeholder approach to CBA helps clarify the broad range of possible adaptation options and their importance for
different stakeholder groups, identify possible means of implementing ‘out of the box’ measures, and formulate a communication
strategy and dialogue between stakeholders.
The two options assessed have positive NPVs in financial, social and environmental terms. The new dam may generate more
benefits as a result of providing water to the mainly poor population of El Alto; the trade-off for the rural municipality of Batallas is
to initiate a process to revive and improve traditional livelihood systems that require little water and can enhance family incomes.
This measure requires much less investment (US$1.5million per 1,000 families) than irrigation systems, which can cost in the
region of US$3,000 to US$5,000 per/ha and the general investment needed to build the dam (US$60 million). The benefit
in terms of income per family is higher (US$1,171 per family; SID, 1999) than the estimated average increase in income from
irrigation projects (US$579 per family, PRONAR), and water use can be reduced drastically.
An estimated investment of US$8million in the second assessed option, the La Paz/El Alto water system, can generate an additional
4 million m3 of water to satisfy current demand. The main benefits of water provision can be expressed in terms of increased time for
work and education. Additionally, non-monetary benefits include increased reliability of the system and reduced social pressure.

22 StAkehoLdeR-foCuSed CoSt-Benefit AnALySiS in the wAteR SeCtoR : SyntheSiS RepoRt
Table 5: Stakeholder-focused CBA of the new Peñas dam
StakeholdersCOST: Monetary
COST: Non-monetary
BENEFITS: Monetary
BENEFITS: Non-monetary
Ministry of Environment and Water
US$50–60 million (Source: SPCR)
More coordination, negotiation with other stakeholders
Increased water availability and 16,000 to 20,000 new connections
Greater visibility
Public water companies (EPSAS)/cooperatives
More reliable system
Municipal government of La Paz
Less social pressure on the current water system in La Paz
Municipal government of El Alto
Up to 25 per cent of the total investment
Municipal government of Batallas
25 per cent of the total investment
Areas around El Alto Water tariff Labour hours Enhanced economic opportunities and less time-consuming obligations for family members, estimated at US$300 per year
Access to water
Farming families in Batallas
US$1.5million Labour hours (estimated at US$0.5million)
Family income increased by US$1,171 (Source SID)
Milk producers in Batallas
Not estimated Not estimated Water for crops, more time available Opportunities for tourism and gastronomy
Vulnerable social groups and subsistence farmers from rural areas
Incentives to ensure their participation Open to contribute with labour hours
Family income increased by US$1,171 if access is guaranteed
Urban poor Open to contribute with labour hours
Enhanced economic opportunities and less time-consuming obligations for family members, estimated at US$300 per year
Access to water, better sanitation
Environment Environmental improvements in terms of increased incomes from rural livelihoods. Soil and water conservation.
Water regulation, less soil erosion

23CASe StudieS
Table 6: Stakeholder-focused CBA of reduced water losses from pipelines
StakeholdersCOST: Monetary
COST: Non-monetary
BENEFITS: Monetary
BENEFITS: Non-monetary
Ministry of Environment and Water
US$8million (Source: EPSAS)
More coordination, negotiation with other stakeholders
Increased water availability and 2,000 new connections per year
Increased visibility
Public water companies (EPSAS)/cooperatives
More reliable system
Municipal government of La Paz
Less social pressure on the current water system in La Paz
Municipal government of El Alto
Up to 25 per cent of the total investment
Municipal government of Batallas
25 per cent of the total investment
Areas around El Alto Enhanced economic opportunities and less time-consuming obligations for family members, estimated at US$300 per year
Less risk of disease
Urban poor Less risk of disease
Environment Not estimated
3.3 Case study 3: Lake Chilwa catchment, Malawi
3.3.1 Climate change and its impact
Lake Chilwa basin is a very important catchment that supports the livelihoods of more than 117,031 farming families. The
resources in the basin, which include water, fish, birds and grass (used for thatching and constructing houses, boats, mats, fish
traps, bird traps and baskets) are used and managed by diverse stakeholders with different and often conflicting objectives. The
increased incidence of drought and erratic rainfall caused by climate change have increased reliance on irrigation and led to more
land being cleared for rice and irrigated maize. This has increased soil erosion which causes siltation, reduces water flow into the
lake and adversely affects fish stocks.

24 StAkehoLdeR-foCuSed CoSt-Benefit AnALySiS in the wAteR SeCtoR : SyntheSiS RepoRt
Figure 7: Water level trends in Lake Chilwa since 1948
Source: WRMP (1948–1987) and Water Department (1988–1999)
Figure 8: Impacts and responses to climate change
Crop failure
Reducedlake levels
Siltatio
n
Climate Changeexperience in form,
of frequent droughtsand rainfall variability
Increase bird hunting to supplement income
AgricultureIrrigation + (SWC)
BirdsProtection of bird
sanctuariesFisheriesa) Fish ponds
b) Closed season
Image 3: Grass growing as a result of increased siltation in the lake
© Rodney Lunduka, 2011

25CASe StudieS
3.3.2 Available adaptation strategies
A multi-stakeholder approach was used to analyse the four main adaptation strategies in the Lake Chilwa catchment. The first
autonomous adaptation to drought was irrigation, which has enabled a number of smallholder farmers to remain productive
but has caused massive soil erosion into the river and lake. Consequently this has adversely affected the fish population.
The government and various NGOs are promoting soil and water conservation technologies to address this problem, which
are assessed as the second adaptation strategy. The third strategy, which is more specific to the fisheries sector, is pond
construction, for aquaculture, and monitoring of the lake during the closed season (January to June) when fishing is banned to
enable fish to breed. Because some people ignore the ban, the waters are patrolled to ensure that no one fishes illegally during
the closed season. The fourth adaptation strategy is protecting bird sanctuaries. Local communities have set up self-funded bird
hunters’ associations whose members patrol the sanctuaries and ensure that nests are protected.
3.3.3 Data collection and analysis
Climate change adaptation strategies in the basin were assessed using qualitative and quantitative methods, including bottom-up
CBA. Data for the study were collected from four different types of stakeholder in the catchment, as shown in Table 7.
Table 7: Stakeholders in Lake Chilwa catchment
Sector Stakeholders
Private Households
a) small-scale farmers
b) fishermen
c) bird hunters
Social Irrigation scheme
Fishing committees
Bird hunters’ association
Public Government department
NGOs
Environment Natural resources
a) fish
b) birds
The study involved three main data collection methods and several levels of analysis, which are shown in Figure 9. Data sources
included:
a. Key informant interviews (KIIs) with community leaders, government staff and other NGOs.
b. FGDs with groups of irrigation farmers, bird hunters, fishermen and fish traders.
c. Interviews with households from fishing, farming and bird-hunting communities.
The study used three questionnaires to gather detailed information on households, individuals and plots. The first questionnaire,
which covered farming households, focused on plot information. A sample of 60 households in the Likangala irrigation scheme
were interviewed and households with upland maize fields and traditional riverside irrigation plots in the two districts of Machinga
and Zomba in the upper catchment were surveyed in the 2006, 2007 and 2009 growing seasons. A total of 150 households
were followed in these three years.
The second questionnaire was used to gather individual fishing data from 13 members of the fishing community, while the third
questionnaire was administered to 35 bird hunters, who also cultivate agricultural land out of the hunting season.

26 StAkehoLdeR-foCuSed CoSt-Benefit AnALySiS in the wAteR SeCtoR : SyntheSiS RepoRt
Figure 9: Data collection methods, levels and findings
Household Level
Plot / Individual Level
Community / Catchment Level Net present benefit
Focus Group Discussions (FGDs)Key Informants Interviews (KIIs)
Literature reviewsPublic costSocial cost
Public benefitSocial benefit
Detail questionnaireFocus Group Discussions (FGDs)
Environmentalcost
Environmentalbenefit
Detail questionnaire(household surveys)
CostDirect cost on plot / individual
BenefitsPartial benefit onplot / individual
Qualitative ranking
The different adaptation strategies were ranked during a workshop where stakeholders were asked to score each strategy on a
scale of 0 to 5, with 0 as the lowest score and 5 the highest. This ranking was based on the following question: ’Based on a score
of 0 to 5, how much do you think each of the sectors (environment, public, community, private) pays and benefits from the following
adaptation strategies: a) irrigation, b) soil and water conservation technologies, c) fishing patrols, d) bird sanctuary protection?’
3.3.4 Results of the stakeholder-focused CBA
The soil and water conservation technologies deployed in the upper catchment area are very important because they have a direct
bearing on the fishing and bird sectors and irrigation only works as an adaptation measure if such technologies are implemented.
Stakeholders took part in a qualitative ranking exercise that asked which of the four sectors bears most of the costs and enjoys most of
the benefits of each adaptation strategy. A score of zero represents no cost or benefit and five indicates the greatest cost or benefit.

27CASe StudieS
Figure 10: Stakeholder rankings of (i) the cost of irrigation and SWC technologies; (ii) the benefits of irrigation
and SWC technologies; (iii) the costs and benefits of combined irrigation and SWC technologies; iv) the costs and
benefits of fish and bird sanctuary patrols
These web diagrams show that stakeholders see irrigation as more costly for the environment than SWC technologies and that
the public sector pays more for irrigation than it pays for SWC, whose costs are mainly borne by the community and private
sector (households). The environment and public sector are perceived as benefiting the most from SWC technologies, while the
community and private sector benefit more from irrigation. Interestingly, stakeholders thought that the public sector benefits more
from SWC technologies but puts less money into them, and that the environment pays for the high benefits ascribed to the private
sector and community.
The scenario improved when the first two types of adaptation strategy (irrigation and SWC technologies) were combined. In this
case, benefits were seen as more equally distributed with slightly more going to the private sector. Similar trends emerged in the
ranking of the costs and benefits of patrolling fish and bird sanctuaries. Both types of patrol cost the environment very little but
generate huge benefits for it while the cost and benefits for the public, community and private sectors were given very similar
rankings.
These qualitative rankings were substantiated by quantitative analysis. Where possible, proxies and replacement methods were
used to estimate the value of the non-monetary costs and benefits and calculate the total net benefits of each adaptation strategy
in the medium term (30 years). A discount rate of 6 per cent was used as a starting point from Year 1, which is quite low given
the conditions in a developing country like Malawi. The estimated monetary and non-monetary benefits of three separate and
combined adaptation strategies over a 30-year period are shown in the graphs below.

28 StAkehoLdeR-foCuSed CoSt-Benefit AnALySiS in the wAteR SeCtoR : SyntheSiS RepoRt
Figure 11: NPV trends for separate and combined adaptation strategies
Investment in soil and water conservation technologies reduces the net benefits to the agricultural sector in the first three to four
years. This could explain the reluctance to adopt SWC technologies, as they initially generate fewer benefits than alternatives
such as not adopting them. However, as soil fertility starts to regenerate higher yields will improve the net benefit, increasing it to
current real values by the end of the 30-year period.
The analysis shows a similar trend in the fisheries sector, with increased adaptation measures generating positive benefits in the
long run. The green line in the second and third graph above shows the ‘business as usual’ scenario (no adaptation strategies),
with net present benefits falling to zero due to the direct and indirect impacts of climate change. If upstream agricultural actors
internalise all the costs by introducing soil and water conservation technologies, siltation in the lake will be reduced, fish breeding
and feeding grounds will not be destroyed and fish stock will improve.
Projected NPV trends in the bird sector are similar to those in the fisheries, albeit somewhat lower due to the lower unit value and
volume of harvest.
3.4 Case study 4: Conversion from surface to drip irrigation in Morocco
3.4.1 Climate change and its impacts
The Mediterranean is one of the areas most threatened by climate change, as increased drought will reduce the availability of
water by 10 to 30 per cent by 2070, and agricultural production by 10 to 20 per cent (World Bank, 2009). Climate change
projections for Morocco envisage higher temperatures combined with less and more variable rainfall. Average temperatures could
rise by 1.1°C to 1.6 °C by 2030, 2.3°C to 2.9 °C by 2050, and 3.2°C to 4.1°C by 2080; while rainfall may decrease by 14 per
cent in 2020, by 13 to 30 per cent by 2050 and by 21 to 36 per cent by 2080 (World Bank, 2009). These changes will have
negative impacts on two key sectors of the national economy: water and agriculture. It is predicted that there will be 16 per cent
less water available for agriculture in 2030 and 34 per cent less by 2050. Studies on the impacts of climate change on Moroccan
agriculture expect less water to be available for irrigation and agricultural productivity to decline, especially for rainfed crops such
as barley, durum wheat and olives. This will have a negative effect on rural incomes, especially among small-scale farmers.
3.4.2 Adaptation strategies
In order to address these issues the government developed the new Green Morocco Plan (GMP), which aims to make the
agricultural sector the main engine of economic growth and national development over the next 10 to 15 years. This is an
ambitious programme to convert 550,000 hectares of land from surface to drip irrigation (217,940 hectares as collective
conversions and 332 060 hectares as individual conversions) at a total estimated cost of US$4.35 billion.
This programme covers seven areas including the irrigated perimeter of Tadla, which is the most affected by climate change.
Tadla is located some 200 kilometres southeast of Casablanca, 400 metres above sea level in the Middle Atlas of Morocco. It is
bounded by the Khouribga plateau to the north, the Oued Zem plateau to the east, the Oued El Abid River to the west and the
Atlas Mountains to the south.
The Tadla perimeter is a large monotonous plain covering 325,095 hectares of land. Around 259,600 hectares is used for arable
farming, watered by the Oum Rabia River and its tributaries the Oued Srou and Oued El Abid.

29CASe StudieS
About 49,040 hectares of the Tadla perimeter will be affected by collective conversion programmes and 39,700 hectares by
individual conversion programmes. The first phase of the collective programme will cover 10,000 hectares and benefit farmers
belonging to four water use associations at an estimated cost of US$ 8,235 per hectare.
3.4.3 Data collection and analysis
This study used the new stakeholder-focused CBA approach to water sector adaptation developed by the International Institute
for Environment and Development (IIED). This method combines CBA with more participatory stakeholder analysis, in order
to facilitate effective decision-making by identifying cross-sector benefits, highlighting areas of mutual interest to different
stakeholders, and assessing the impacts on adaptive capacity more effectively.
Data collection
In order to address the project objectives we used two methodologies to collect the necessary data: structured interviews for the
quantitative CBA, and RRA techniques for the stakeholder analysis.
The quantitative data relate to the costs of establishing drip irrigation networks, farm-level water use for drip irrigation, and yields
for different crops grown under drip irrigation. A total of 50 farmers that use drip irrigation technology were randomly selected for
the study but strata importance was considered in the distribution of the cases.
The four categories of stakeholder identified for this case study were:
1. The private sector: mainly represented by drip irrigation companies.
2. The public sector: represented by two government agencies, the Regional Office of Agricultural Development in Tadla
(ORMVAT) and the Water Basin Agency.
3. Households: mainly farmers and agricultural workers.
4. Environment: in this case study environmental interests were represented by the Research Unit on the use of
environmental and agricultural resources at Beni Mellal University.
A total of 36 subjects were interviewed during the field study: 4 members of the ORMVAT directorate, 2 representatives from the
Water Basin Agency, 3 members of the Water Federation in Tadla (representing water user associations), 5 agricultural workers
(including 3 women), 8 farmers who converted to drip irrigation on an individual basis, 10 farmers who converted to drip irrigation
on a collective basis, 2 irrigation companies and 2 professors from the Beni Mellal University Research Unit .
The economic lifespan for the investment, operating costs and investment benefits was set at 10 years. Gross incomes from
investment in the conversion to drip irrigation were estimated on the basis of observed increases in citrus yield between 2001
and 2010, and average local prices for different citrus varieties in 2010. As the Moroccan state supports 80 per cent of the
investment in drip irrigation, we calculated the NPV with and without an 80 per cent subsidy.
Stakeholder analysis based on contingent ranking
All the costs and benefits of conversion ascribed to farmers were identified during a preliminary in-depth interview with members
of the Water Federation (representing water user associations in Tadla region) and then set out in a list. This task was repeated
with each stakeholder group to ensure that they were all aware of the options and to prepare the ground for a contingent ranking
exercise (Bateman et al., 2006) in which all relevant benefits were ranked in order of their perceived importance. Since we
could use CBA to calculate the exact value of monetary impacts, this exercise was designed to indirectly determine the value of
non-monetary impacts and their estimated magnitude so that we could compare all stakeholder interests (monetary and non-
monetary).
Participants in a stakeholder meeting for farmers involved in collective conversion discussed the anticipated benefits for their
farm and were asked to rank the causes of each benefit in order of importance, as the figures for monetary benefits were not yet
applicable. The same ranking exercise was conducted with farmers who had converted on an individual basis. Finally, farmers
were asked to identify the main barriers to individual conversion and the main incentives for collective conversion. Interviews with
representatives from ORMVAT, the Water Basin Agency, agricultural workers, drip irrigation companies and groups representing

30 StAkehoLdeR-foCuSed CoSt-Benefit AnALySiS in the wAteR SeCtoR : SyntheSiS RepoRt
environmental interests followed a similar structure, with respondents asked to reflect on the costs and benefits of converting to
drip irrigation, and rank them in the order of importance.
3.4.4 Results of the stakeholder-focused CBA
All stakeholders agreed that converting from flood to drip irrigation is the only solution to the shortage of water for irrigation, which
is partly caused by climate change. The stakeholder analysis showed that the adaptation project generated non-monetary welfare
gains for all primary stakeholders, as is often the case with projects that aim to build adaptive capacity. It was found that groups
of private and public stakeholders favoured non-monetary impacts over monetary gains, and that small-scale farmers were most
reliant on the non-monetary benefits of adaptation. Most farmers had been unaware of the non-monetary benefits of drip irrigation
before participating in the stakeholder-focused CBA and ORMVAT confirmed that these results will help convince producers that
have yet to sign up to conversion.
When asked about the effects of conversion on crop yields, all farmers reported an observed increase in yields. The average
increase for citrus trees went from 21 tonnes per hectare under flood irrigation to 38 tonnes per hectare under drip irrigation.
Figure 12: Effects of drip irrigation on annual citrus yields (t/ha)
Table 8: Water saved after conversion to drip irrigation in the Tadla perimeter (m3 per ha)
Crops Large farms
(+20 ha)
Medium farms
(10–20 ha)
Small farms
(-10 ha)
Citrus 4,400 4,876 0
Sugar beet 3,888 4,424 2,944
Maize F. 2,214 2,414 2,295
Olive trees 1,512 1,374 1,123
Vegetables 3,656 3,884 3,205
Weighted average 3,412 3,831 2,776
31CASe StudieS
Table 8 shows the amount of water saved after conversion to drip irrigation. In term of weighted averages, medium-size farms save
about 3,831 m3/ha/year, large-scale farmers save 3,412 m3/ha/year, and small-scale farmers save 2,776 m3/ha/year.
This represents a 56 per cent decrease in the amount of water needed to grow citrus under flood irrigation. It should be noted
that this analysis focused on the feasibility of conversion for individual farmers and did not take account of all the possible public
benefits of switching from flood to drip irrigation. The decision to convert to drip irrigation generates positive externalities, one of
which is saving water for better climate change adaptation. Since positive externalities (ecosystem services) are usually public
goods, the government needs to provide incentives for farmers to make management decisions that increase these externalities.
One of the advantages of switching to drip irrigation is that it reduces farmers’ labour costs. They all mentioned that flood irrigation
is time-consuming and stand to make significant savings by converting; it takes 10 to 12 hours to irrigate one hectare of sugar
beet with flood irrigation and only 2 to 3 hours using drip irrigation. Some farmers said that they will not need irrigation workers
anymore because drip irrigation is automated. Large-scale farmers that used to employ permanent workers to operate their flood
irrigation system and paid them in kind 25 per cent of their yield, can save that percentage by switching to drip irrigation.
Perceived monetary and non-monetary benefits for agricultural workers
This group was represented by the Ouralah community, which lives about 25 kilometres from the Tadla perimeter next to Afourar
city. About 40 per cent of the 100 or so households in the community depend on agricultural work in the Tadla perimeter, out of
which 70 per cent are women. The community were not aware of the drip irrigation conversion project, especially the collective
component, and reported that this was the first time that an official group had discussed it with them to see what they thought of
it. When the project objective was explained, they reported that their agricultural activities vary according to the season, and that
irrigation work represents just 10 to 20 per cent of their work and only involves men. This means that community’s total income
will fall by 3 to 4.5 per cent if the entire Tadla perimeter converts to drip irrigation. However, members of the community are
not convinced that the conversion programme will affect their overall income because of the remittances received from migrant
workers, and their belief that the planned construction of the Tadla agro-industrial zone under the Green Morocco Plan will provide
plenty of employment opportunities.
Perceived non-monetary benefits for the environment
Environmental researchers have noted that drip irrigation not only uses water more efficiently than flood irrigation and thus helps
reduce the over-exploitation of groundwater, but also avoids the environmental problems associated with flood irrigation such as
waterlogging and salinity. Conversion from drip to flood irrigation will reduce soil degradation caused by excessive use of chemical
fertilisers, and domestic supplies will benefit from better-quality groundwater as fewer chemical fertilisers (especially nitrogen) will
leach into aquifers and contaminate deep groundwater reserves. Researchers emphasise that these two positive externalities are
equally important for the environment and that the whole system will collapse if one element of the chain is broken.
3.5 Case study 5: Rupa Watershed, Kaski, Nepal
3.5.1 Climate change and its impacts
The Rupa Tal watershed is home to aquatic, wetland and terrestrial ecosystems. It also includes Lake Rupa Tal, the third largest
lake in the Pokhara valley which has an average depth of 1.95 metres and a surface area of 1.07 km2. The region’s ecosystem has
deteriorated over the past few decades due to human encroachment into the watershed, the extraction of forest resources and
conversion of forest into agricultural land and settlements (Pradhan and Providoli, 2010).
Local communities across the region have observed higher temperatures and erratic and intense rainfall over the past 10 years
(Thapa et al., 2011), although climate change varies in different parts of the region. Some pockets of western Nepal have seen a
decline in pre-monsoon rainfall and an increase in monsoon rainfall, while post-monsoon rainfall on the southern slopes of hills in
western Nepal is also increasing (MoE, 2010). Kaski district is classified as moderately vulnerable to climate change and highly
vulnerable to landslides because of the erratic and intense rainfall (MoE, 2010).
These findings are endorsed by global climate modelling (GCM) analyses, which suggest that precipitation in Nepal is likely to
become more erratic as temperatures rise. In the past, major floods and landslides deposited large amounts of sediment in Lake
Rupa Tal and the surrounding wetlands. This process has been exacerbated by the high rate of deforestation and consequent
degradation of the lower reaches of the watershed (Pradhan and Providoli, 2010). New private agricultural developments in the

32 StAkehoLdeR-foCuSed CoSt-Benefit AnALySiS in the wAteR SeCtoR : SyntheSiS RepoRt
wetlands, the clearance of forests for settlements and diversion of streams and tributaries to irrigate farmland have changed the
terrestrial landscape and are threatening the livelihoods of fishermen who earn their living from the lake (Poudel and Buckles, 2006).
The national adaptation programme of action (NAPA) also notes that the sources of Rupa Lake are drying up as temperatures rise, and
that the lake is gradually becoming a degraded area surrounded by swamp. Annual deposits of sediments and nutrients are reducing the
depth of the lake and the ability of water sources to recharge it and the situation is further aggravated by the impacts of climate change.
Immediate action is needed to ameliorate the situation by constructing a dam and landscaping the area around the lake.
3.5.2 Adaptation strategies
The government of Nepal has prioritised various adaptation options for the country (MOE, 2010), whose implementation will
cost an estimated US$350 million. NAPA documents identify and prioritise adaptation measures to meet urgent and immediate
needs in districts that are vulnerable to drought, flooding, landslides and overflow from flooded glacial lakes. In this study, different
groups of stakeholders were asked to list the type of adaptation measures they currently employ and those that they plan to use,
which are shown in Table 9.
Table 9: Current and planned adaptation measures
Current measures Planned measures
Upstream Downstream
Individuals (farmers, community organisations)
Drinking water
Rainwater collection ponds for irrigation
Drinking water supply
Building check dams (retaining walls to prevent landslides
and control water flow on hillsides)
Upstream planting
Upstream terracing
Dam to increase volume of water (constructed on
land some distance from lake)
Lake water for irrigation
Fisheries
Properly managed development activities
Construct terraces
Transportation
Clean lake by building pipe to bypass siltation
Private sector (business)
Rain water collection ponds Bridge over stream
Government agencies
Rainwater harvesting by every household Dam construction
Environment agencies
Horticulture
Livelihood diversification
Rainwater harvesting by every household
Protect biodiversity in and around the lake
Plant vegetation
3.5.3 Data collection and analysis
Desk review
This study started with a review of relevant documents to help define the watershed and identify its boundary actors: national
and international studies, project reports and local-level data collected by government agencies and NGOs. These provided
good background information and some scientific findings that would not be generated during the study such as climate
change information, area maps and hydrological systems and indications of the impacts of climate change on local ecosystems
and livelihoods. The actors in the watershed were divided into four groups: households (poor and non-poor), businesses
(cooperatives, small shopkeepers, etc.), institutions (local government, community and national departments) and environmental

33CASe StudieS
groups and NGOs. A transect visit along the upstream section and downstream area around the lake enabled researchers to
visualise the catchment.
Individual interviews
Semi-structured interviews, surveys, stakeholder consultations and focus group interviews were held with key informants to
record their experiences and opinions. These informants included households, community leaders, cooperative managers, village
development committees/municipal officials, hotel owners and local NGOs working on environmental and conservation issues.
Cooperative members and local fishermen were also interviewed. The team collected data on the cost of materials, labour and
other intangibles needed to estimate the scale of investment for adaptation and prepared a checklist to assess stakeholder
perceptions of climate change, the challenges it poses and possible adaptation options. These consultations also helped
assess the monetary and non-monetary costs and benefits of climate change and adaptation measures, and indirectly assess
environmental variables.
Shared learning dialogues
The key method used in this study was shared learning dialogue (SLD) with different stakeholders to collect information about the
community, local perceptions and system data. Watershed-level information was collected through SLD with the community, in
cooperation with the NGO Action in Mountain Community Nepal (AMC) which is based in Pokhara.
Focus group discussions
Focus group discussions using semi-structured checklists of questions enabled stakeholders to identify the costs and benefits
of adaptation and express their feelings, preferences and willingness to pay for different options. The eight FGDs organised by
the study team (four upstream and four downstream) were attended by farmers, NGO staff, representatives from the local private
sector, local officials, DDC and academics. Before the discussions started, participants were asked to read the checklist to
ensure that all the issues were clear. They were then asked to rank the economic, social and environmental costs and benefits of
potential adaptation options and the agencies that can contribute to or support implementation on a scale of zero to five (with 0
representing no cost or benefit; 1 and 2 low cost or benefit; 3 medium cost or benefit; and 4 and 5 high cost or benefit). These
rankings were then used to identify the most important upstream and downstream adaptation options.
Stakeholder workshop (negotiation meeting)
At the end of the study, a workshop was held to share the outcomes of the process and facilitate stakeholder negotiations on
beneficiaries and their willingness to pay for adaptation measures. Various project options were presented, along with their
estimated cost and benefits, internal rate of return (IRR) and CBA (CBA). After discussing the comparative analyses of the
options and trying to find trade-off points for the various costs and benefits, participants decided which option was most socially
acceptable, economically viable and environmentally sustainable.
3.5.4 Results of the stakeholder-focused CBA
The conditions around Lake Rupa and proposed construction of a dam to protect the lake feature in the official response to
climate change set out in the NAPA. Although the government conducted a detailed study of the dam in 2011 and allocated 17
million rupees for its construction, the funds allocated for this project were subsequently transferred to another region for political
reasons. The main justification for building the dam was the generation of hydropower, which meant that its capacity had to be
increased.
Local stakeholders around Lake Rupa were completely unaware of these proposals. During the FGD, upstream and downstream
stakeholders identified potential options according to their particular needs. Downstream communities are more interested in
controlling the river by building a check dam in Talbesi River to reduce siltation, control river cutting and protect agricultural land.
The government project consists of two major components: constructing an earth fill dam by the lake and a check dam in the
Talbesi River. CBA shows that it is more economically feasible to construct a check dam than an earth dam or a check dam and
earth dam, although all three options (check dam, earth dam and both) are acceptable.

34 StAkehoLdeR-foCuSed CoSt-Benefit AnALySiS in the wAteR SeCtoR : SyntheSiS RepoRt
Table 10: Present value of costs and benefits over a 30-year period
Options PV in NRs
a) Project to construct a 664m long earth fill dam 294,000,000.00 dam
Assumptions: 6%
discount rate
Analysis period Prices
Transitional cost =
10% of total costs
b) Construct gabion check dam in Talbesi 9,145,000 .00 Khola
c) 10% cost of earth fill and total cost of (a + b) with environmental cost 333,459,000.00
Direct benefits (with environmental cost) 565,591,000.00
Present benefits with environmental cost 524,995,000.00
Total incremental benefits 191,536,000.00
Table 11: Environmental CBA
Option Cost Benefits
Only check dams Low Reduced siltation
Only earth fill dam
• 500 ropani of land (approx 25.44 ha) lost due to waterlogging
• Additional investments needed for
protection
Check and earth fill dams• 500 ropani of land (approx 25.44 ha)
lost due to waterlogging
• Increased adaptive capacity and resilience
• Increased flow from lake may help downstream ecosystems
Option 1: Construct earth fill dam
This option would increase the amount of available water and provide economic opportunities locally, but will also have negative
social and environmental impacts (land acquisition, failure to control siltation). Local government representatives reported that
some donor agencies are interested in implementing this project if they find it to be economically, socially and environmentally
viable. Although they did not reject this option, participants at the stakeholder workshop noted that its environmental costs might
include higher siltation and the risk of increased flooding and therefore looked at other options.
Option 2: Construct check dams
This option is important in environmental and economic terms as it will control siltation and generate high returns on low
investment, but it will be difficult to implement due to conflict over land ownership among the local community. The stream (river)
changes course every year and some local people farm the old riverbed without the requisite land ownership certificates. Building
check dams on the river will make a number of people landless and affect their livelihoods. In the first stakeholder workshop,
participants reported that Care Nepal, an NGO that worked in this area from 1988 to 2000, tried to implement this project but
was unable to do so due to the conflict over land. Although this option has low environmental costs, it does not maximise the
economic opportunities or increase local resilience.
Option 3: Construct earth fill dam and check dams
Although it requires substantial investment, the stakeholder workshop and negotiation meeting agreed to accept this option
because it addresses issues that affect both upstream and downstream communities. It will protect the lake, increase economic
opportunities and resolve local conflict if it is implemented openly. Therefore it seems socially viable, economically acceptable and
environmentally friendly. The fact that donors are interested in it also worked in its favour.
Stakeholders identified a possible solution to the social problems and conflict caused by land acquisition. If this option is
implemented, it will provide an irrigation facility on several hundred ropani of government-owned land downstream. Upstream
communities will need to be compensated for nearly 600 ropani (30.53 hectares) of land, and could be relocated downstream
if this is acceptable.

35CASe StudieS
Table 12: Stakeholder expectations of project costs and benefits
Stakeholder Direct benefit Cost: Type of cost input
Community 92% 7.5% Labour, stone, awareness
Private sector 6.43% 9.5%Construction of gabion check dam around lake (calculated construction of earth fill dam)
Local government 1.4% 32.8%Land acquisition, gabions, construction and transaction costs
Environment 50.2% Contribution to construction of earth fill dam
Table 13: Stakeholder perceptions of cost sharing (based on their understanding of the distribution of benefits)
Community Private sector GovernmentInternational
community
Community 5% 5% 50% 40%
Private sector 10% 3% 36% 51%
Government agencies 5% 20% 25% 50%
Environmental sector 10% 10% 20% 60%
Total 30% 38% 131% 201%
Average % 7.5% 9.5% 32.8% 50.3%
Community Private sector Government International community

36 StAkehoLdeR-foCuSed CoSt-Benefit AnALySiS in the wAteR SeCtoR : SyntheSiS RepoRt
4 Synthesis 4.1 Methodological approach
This multi-country project highlights the fact that there is no single fixed approach to stakeholder-focused CBA. While the
project was driven by a common guiding methodology, the complexity and specificity of each case study site meant that it had
to be adapted to the local context. The flexibility of this approach allowed practitioners to use their judgement when drawing the
boundaries for the analysis, while ensuring that it was conducted in a rigorous manner.
The project boundaries in Malawi and Nepal were drawn around natural eco-systems, while the Bolivian study focused on an
urban city boundary, and the analyses in Morocco and Bangladesh built on existing programmes. With such diverse systems
under analysis, the methodological approach had to be firmly grounded in strong economic principles with consistent costing
methods to ensure that the results were meaningful in the overall project context. These principles and methods needed to be
introduced early in the project planning process to encourage overall consistency, even if the approach differed in each analysis.
4.2 Identifying the impacts of climate change
The process of identifying and calculating the future impacts of climate change is primarily driven by climate projections. It is
important to remember that scientifically drawn climate projections are inherently uncertain as they are based on historical data
and rely on certain fundamental assumptions. Historical data on low- and middle-income countries are often not available and
are of questionable reliability and accuracy where they are available. Because of this gap, scientific data generally need to be
supplemented with local knowledge to allow meaningful conclusions to be drawn.
The climate projections in the case study from Nepal were based on data from the nearest meteorological station, which was
located at fairly high altitude in mountainous terrain and did not accurately represent the climate of the area under analysis. This
situation is not uncommon and poses a significant challenge in countries like Bolivia and Nepal that are characterised by rapid
geographical variations. It essentially means that adaptation strategies designed on the best available climate projections may be
irrelevant or ineffective, and in some extreme cases may even result in maladaptation.
While using local knowledge to make up for the lack of available and accurate scientific data is a recognised approach in social
sciences, it is inherently uncertain and lacking in rigour. The use of local knowledge in analysis is further complicated by an
inability to clearly distinguish between climate variability and climate change. Local perceptions of rainfall patterns, drought and
heatwaves may be based on short-term climate variability. Therefore adaptation strategies to counter such changes may not be
appropriate in tackling the long-term impacts of climate change. Morocco is characterised by extremely variable rainfall, with a
coefficient of variation in annual precipitation ranging from 25 per cent in areas near the Atlantic to more than 100 per cent in
the Sahara. While the climatic data reflect an overall decrease in rainfall patterns despite this variability, it is very difficult for local
communities to distinguish between actual climate change and climate variability. Their perceptions are much more likely to reflect
their experience with current climate variability.
Another challenge with climate projections is the technological limitations of climate models in accurately downscaling global data
to the local level. Although rapid progress is being made in improving the technology that underpins these models and the use of
regional data, current analysis still has to rely on technology and data that may not be appropriate or rigorous, even if they are the
best available.
In light of these uncertainties, expert input into the analysis should be encouraged to strengthen the quality of the data and fill
information gaps. We need flexible and dynamic adaptation strategies that are designed to cope with climate ranges rather than

37SyntheSiS
specific climate futures. Climate scenarios are another tool that can be used to test the robustness of adaptation strategies in
varying climate pathways.
4.3 Stakeholder selection
Although engaging with stakeholders is time-consuming, it is probably the most useful aspect of this approach to CBA. It is not
a single step, but an iterative process that continues throughout the entire research process. Selecting appropriate stakeholders
ensures that all interests are represented in the collaborative process, data collection and analyses. The extent to which relevant
stakeholders are identified and their interests taken on board will largely determine the acceptability and sustainability of any
adaptation action. Stakeholder support is vital in order to encourage successful analysis, create winning coalitions and ensure the
long-term viability of organisations, policies, plans and programmes (Bryson 2003).
There is no uniform approach to stakeholder engagement. These case studies show that it is an ongoing process that defines the
outcomes of the studies and the format of their findings. Various methods were used to involve stakeholders:
n Rapid appraisals with key informants
n FGDs with individual stakeholder groups
n Meetings with multiple stakeholder groups
n Questionnaire surveys tailored to each stakeholder group.
All these approaches were used to initiate discussions about climate change and water in general, identify the impacts of
and potential solutions to climate change, collect specific economic data, verify or validate findings, refine, adjust or change
combinations of adaptation actions, discuss willingness to pay, build consensus on the way forward, and undertake numerous
other activities. The case studies in Nepal, Malawi and Bolivia involved various iterative exercises with stakeholders, while the
stakeholder selection process for the studies in Morocco and Bangladesh was more linear and rigid, limited to those affected by
predetermined adaptation interventions.
Taking an inclusive approach that captures the interests of diverse stakeholders means additional time and expense for
engagement and analysis. There is a trade-off between including all stakeholder groups and the analytical complexity and difficulty
of reaching consensus on action that such inclusion creates. These case studies started with four broad categories of stakeholder
groups – the private sector, government, local community, and environment – which were refined as the analysis progressed.
Each site selected stakeholders according to the boundaries of the system under analysis and the potential social, economic and
environmental impacts that climatic stresses and adaptation interventions will have on these stakeholders.
4.4 Identifying adaptation strategies
A stakeholder-focused CBA is valuable if stakeholders accept the chosen adaptation strategy. If they do not, they will not
only consider the strategy inappropriate to their needs and unlikely to address the impacts of climate change, but will also
be unenthusiastic about identifying potential costs and benefits for the CBA. A participatory approach to costing adaptation
counteracts the inherent inability of top-down approaches to capture the realities on the ground (Parry, et al., 2009). A number
of academic works strongly support the participatory approach as a moral, effective, efficient and sustainable procedure (Ulrich
1987). The concept of ‘participatory development’ has wide currency in development literature and is used in many contexts such
as voluntary contributions without decision-making, raising awareness to improve receptivity, fostering dialogue, self-development,
empowerment and so on (Mikkelsen 2005). Transformational participation is identified as the highest level of participation
(Mikkelsen 2005) since it is an inclusive and focused process that enables local stakeholders to make their own analysis, take
command, gain confidence and make their own decisions. It allows people to discover and identify important issues (such as the
right to services) by exercising their democratic right to participate in decision-making (Gaventa 2004).
Although the underlying objective of this stakeholder-focused CBA was to take a highly inclusive approach in line with
transformational participation, the realities on the ground meant that each case study had to use a variant of the approach to
select the adaptation strategies. The case study in Morocco built on a pre-defined adaptation strategy to use drip irrigation
to address soil quality issues, which had been developed with minimal stakeholder input. The Nepalese study, on the other
hand, was very inclusive, involving stakeholders in every step of the process of identifying, ranking and ultimately selecting the

38 StAkehoLdeR-foCuSed CoSt-Benefit AnALySiS in the wAteR SeCtoR : SyntheSiS RepoRt
interventions for subsequent CBA. The other studies ranged along the spectrum of inclusiveness: the one from Bangladesh used
adaptation strategies identified in a previous study; the Bolivian study selected two options from adaptation strategies identified
by stakeholders; while participants in Malawi selected strategies from a range of existing coping mechanisms. The overall exercise
shows that while inclusiveness empowers stakeholders and creates a strong buy-in for the selected strategies, completely
inclusive processes may not always be practical.
It is also important to recognise that stakeholders may not have sufficient technical knowledge to be able to identify effective and
appropriate strategies to address their climate concerns. In Bolivia for example, very few stakeholders can appreciate the finer
technicalities of constructing a new dam as a possible strategy for tackling water issues. In such cases it may be appropriate to select
interventions on the basis of input from a few stakeholders, while making others aware of their potential benefits and drawbacks.
Finally, identifying adaptation strategies should not be seen as a one-off activity in the analysis. It is an iterative process that may
need to be repeated after an initial economic analysis, to allow stakeholders to decide on different courses of action if the original
strategies are too costly, impractical or lead to skewed distribution of costs and benefits.
4.5 Measuring CBA
Assumptions are a key aspect of this type of analysis as they influence the results of the exercise. It is important not to consider
CBA in isolation or compare strategies on purely economic terms, as this may lead to important benefits being missed. The
process of change is another important factor that needs to be taken into account.
Costs can be estimated by looking at the market price of the various activities, materials and inputs associated with a specific
strategy. If all stakeholders have the same markets and same view of the costs, the total cost can be calculated through simple
aggregation. In the case where they have different views, the costs will need to be weighted. The case study from Bangladesh is
a good example of how these weights can be generated and used to standardise the cost of an adaptation strategy. This is also
possible with planned adaptations.
The benefits of planned adaptation can be estimated using market prices to calculate avoided damage and weighting to standardise
them, as in the Bangladesh case study. It is important to remember that the benefits of autonomous adaptation strategies may be
compounded by other factors and to allow for this. The case study from Malawi demonstrates how this can be done.
4.6 Ground truthing in stakeholder-focused CBA
Synthesis of the case study findings and recommendations for practitioners
The issue of ground truthing was not discussed in the original ‘theory’ presented to the case study teams, which focused on
establishing the minimum water quantity and quality provisions that each of the main stakeholder groups identified by the study
would find acceptable under a climate change scenario. The aim was to equip researchers with the information they needed to
assess different adaptation strategies and facilitate negotiations between stakeholder groups.
Although none of the case studies was able to establish the minimum acceptable requirements discussed in the theoretical
guidance document (the expectations expressed in the Bolivian case study came closest to this), the case study reports show
the value of including a wide variety of stakeholders, identifying actual and perceived benefits and ranking and/or valuing these
benefits.
Because it was not possible to establish these minimum acceptable requirements, the role of negotiation in the case studies
changed, as did the need to ground truth the four types of information discussed above. In the absence of any theoretical
guidance on ground truthing, each study handled this in different ways, with varying degrees of success.
The study in Nepal conducted the most detailed investigation into stakeholder perceptions of different adaptation strategies, using
ranking exercises to rank certain aspects of every option (including who pays for implementation) to determine each stakeholder
group’s preferred strategy. As a result, this study did not make the kind of assumptions about stakeholder preferences evident
in the technical study that the Bangladesh case study followed up and ultimately challenged. It is worth noting that testing
assumptions about the preferences of different stakeholder groups becomes less critical where there is minimal debate about
which adaptation strategy is required (as in Morocco) or where other concerns prevail.
1 Excluding Niger, which does not give a budget for its proposed projects.

39SyntheSiS
While investigating stakeholder preferences for different adaptation strategies and considering these strategies from various
angles certainly provides a great deal of important information, it does not address the nature and magnitude of the costs and
benefits associated with each strategy. The analysis in the Nepalese case study relied heavily on stakeholder perceptions of what
the world will be like in the future, which is not necessarily a problem but does mean that it overlooked factors that might result
from climate change interacting with various complex human/environmental systems. This case study would have been stronger if
it had used additional sources of information on the costs and benefits of adaptation.
The importance of doing this is illustrated by the follow-up study in Bangladesh, which found that the stakeholder groups it
consulted disagreed with the costs and benefits identified in the earlier study.
The Malawi and Moroccan case studies handled this issue well, using data from a number of individuals with first-hand experience
of the adaptation strategies in question. While there is no guarantee that existing costs and benefits will remain the same in the
future, it is preferable to use data derived from first-hand experience rather than theory.
The different approaches to ground truthing information on adaptation strategies (preferences, costs and benefits) are echoed
in the way that the studies addressed the nature and timing of climate change. The Malawi case study mainly focused on climate
change that has already happened and could use fairly high-resolution data documenting these changes, but still had to make
assumptions about the future climate change. In this case, there are justifications for these assumptions but the results of the
analysis will be brought into question if they prove to be inappropriate.
The other case studies, with the possible exception of the one from Bangladesh, are also burdened by uncertainty about the
magnitude and timing of climate change. With no location-specific climate model data to rely on, the Nepalese case study had to
use data on past trends and stakeholder perceptions of what climate change will be like. The Moroccan case study had access to
outputs from global climate models, but they are far from clear about the consequences of climate change on a small scale. While
the Bolivian study could predict the disappearance of the glaciers with some certainty, it is less sure about the other impacts of
climate change on the water sector.
The research team in Bangladesh was the only one with access to quantitative data on the magnitude and timing of the impacts of
climate change on the water sector at a fairly local level. This required significant inputs in terms of time, technology, and expertise,
which may not always be available – hence the recommendations below.
It is also important to try to assess the effectiveness of adaptation actions in addressing the impacts of climate change. Although
stakeholder engagement is a significant element of stakeholder-focused CBA, the ‘business as usual’ scenario also needs to be
considered (the social costs and benefits of not adopting an adaptation strategy). It is not simply a matter of determining whether
the benefits of an adaptation strategy exceed its costs, but the extent to which it addresses the effects of climate change. This
is significant because the analysis should also consider those impacts of climate change on the water sector that the selected
adaptation strategy does not address.
None of the case studies included a formal ‘business as usual’ scenario analysis, and none are able to explicitly indicate the extent
to which the preferred adaptation strategies would be able to address the impacts of climate change on the water sector.
4.7 Capacity building
This project shows how the general framework for applied economics can be implemented on a learning-by-doing basis. Each
lead researcher defined their own project boundaries, the starting points for stakeholder identification and engagement, and
the process for collecting data, working with support from junior researchers in their own countries. IIED provided light-touch
support, to enable the process to reflect local scenarios as much as possible, while ensuring that the researchers kept the general
framework in mind. The area where most progress was made in terms of capacity building was developing an approach to CBA
that involves stakeholders in identifying and analysing local solutions. The most challenging aspect of the process was getting
stakeholders to use traditional economic decision-making rules (such as NPV and internal rates of return) to reach a unanimous
decision. This is because metrics differ for different stakeholder groups and because the analysis incorporates non-monetary
benefits and costs. The project enabled UK-based students to participate in the research in Morocco and Malawi and improve
their skills by working with experts from low- and middle-income countries. Furthermore support from expert climate modellers
at the University of Cape Town in South Africa helped increase the research teams’ capacity to use local climate change data to
generate downscaled climate change scenarios.

40 StAkehoLdeR-foCuSed CoSt-Benefit AnALySiS in the wAteR SeCtoR : SyntheSiS RepoRt
5 ConclusionThis study developed the draft methodology for stakeholder-focused CBA and applied it to the water sector in five countries with
different climate change impact and adaptation strategies. The case studies applied the methodology through literature reviews,
rapid appraisals of case study sites, meetings with one or more stakeholder groups, questionnaire surveys, and by collecting and
analysing local climate information to provide downscaled climate ‘envelopes’. Most of the data analysis used the cost-benefit
approach, which was modified to allow cost and benefits to be separated out across stakeholders. Statistical methods and
programs and spread sheets were used to analyse the quantitative data.
The results show that different stakeholders face different costs and derive different benefits from climate change adaptation
strategies. These differences influence their willingness to accept or adopt particular adaptation strategies. In addition to
estimating the costs and benefits of various strategies, this methodology introduces a critical extra step: bringing various
stakeholders together and facilitating negotiations to build consensus on a preferred adaptation measure. Many stakeholders
participating in the study said that this was their first opportunity to voice their opinions and meet other groups with very different
outlooks and opinions. The project also helped build capacity among stakeholders with little understanding of climate change
and the implications of different adaptation strategies. As this methodology is new, it has also increased capacity in the research
teams that conducted the economic analyses in each country.
These case studies show that the costs and benefits to the water sector extend beyond political and geographical boundaries.
In other words, implementing adaptation strategies in the water sector involves externalities (positive in the Moroccan case study
and negative in the study from Malawi) that need to be included in the estimated costs and benefits of adaptation strategies to
ensure that they are sustainable.
Another important finding is that not all costs and benefits can be monetised. Combining quantitative and qualitative methods
provides a narrative that fleshes out the quantitative results of analysis, showing that the final decision to implement or recommend
a particular adaptation technology may depend on both traditional CBA criteria (positive or largest NPV) and qualitative narratives.
Having successfully applied this methodology to the water sector in these five country case studies, the next step is to roll it out
to other sectors to test its robustness. Just as they are differently affected by the impacts of climate change, stakeholders will also
be differently affected by adaptation measures (autonomous or planned). Using stakeholder-focused CBA to assess the viability of
adaption measures may generate more reliable and acceptable results and help ensure that climate change adaptation strategies
are both widely accepted and sustainable.

41RefeRenCeS
ReferencesAsian Development Bank, 2011. Adapting to climate change
strengthening the climate resilience of the water sector
infrastructure in Khulna, Bangladesh. Mandaluyong City,
Philippines.
Batemen, I.J., Cole, M.A. and Hadley, D.J. 2006. Comparing
contingent valuation and contingent ranking: A case study
considering the benefits of urban river quality improvement.
Journal of Environmental Management 79, 221-231.
Bryson, J.M. 2003. ‘What to do when stakeholders matter: a
guide to stakeholder identification and analysis techniques’ A
paper presented at the National Public Management Research
Conference Georgetown University Public Policy Institute,
Washington, D.C.
Cao, J. 2010. ‘Reconciling human development and climate
protection: a multistage hybrid climate policy architecture’ in
J.E. Aldy, R.N. Stavins (eds) Post-Kyoto International Climate
Policy: Implementing architectures for agreement. Cambridge
University Press, New York, pp.563–98.
Fankhauser, S. 1996. The potential costs of climate change
adaptation in: J. Smith, N. Bhatti, G. Menzhulin, R. Benioff,
M.I. Budyko, M. Campos, B. Jallow and F. Rijsberman (eds)
Adapting to Climate Change: An international perspective.
Springer-Verlag, New York, pp. 80–96.
Gaventa, J. 2004. Towards participatory local governance:
assessing the transformative possibilities, in: Participation:
From Tyranny to Transformation, eds. S Hickey and G Mohan,
Zed Books, London, pp. 25-41.
IWM and Alterra 2010. Bangladesh: strengthening the
resilience of the water sector in Khulna to climate change,
Final Report, Local Government Division, Ministry of Local
Government, Rural Development & Cooperatives, Asian
Development Bank (ADB).
Jeschke, M.L. 2009. Glacier retreat in the Bolivian Andes as
a consequence of global climate change: impacts on regional
water supply according to the simulation of future runoff from
Zongo glacier. The Potsdam University.
Koirala, Saroj, 2010. land use/land cover change and its impact
on soil erosion process in Begnas Tal Rupa Tal watershed
using geospatial tools, Kaski district, Nepal. Dissertation
Submitted in Master Degree In Science In Geospacial
Technology. ISEGI/ University of NOVA ,UJI, and IFGI http://
run.unl.pt/bitstream/10362/2732/4/TGEO0030.pdf
Leary, A. 1999. A framework for CBA of adaptation to climate
change and climate variability. IPCC Working Group II
Technical Support Unit, Washington DC.
Mikkelson, B. 2005 Methods for development work and
research: A guide for practitioners Second edition, Sage
Publications, New Delhi.
MoE (Ministry of Environment) 2010. National Adaptation
Programme of Action (NAPA) to climate change. Ministry of
Environment, Government of Nepal, Kathmandu, Nepal.
Painter, J. 2007. Human Development Report 2007/2008:
deglaciation in the Andean Region. United Nations
Development Programme 2007/55.
Parry, M., Arnell, N., Berry, P., Dodman, D., Fankhauser, S.,
Hope, C., Kovats, S., Nicholls, R., Satterthwaite, D., Tiffin,
R. and Wheeler, T. 2009. Assessing the costs of adaptation
to climate change. A review of the UNFCCC and other
recent estimates. International Institute for Environment and
Development (UK) and the Grantham Institute for Climate
Change, Imperial College London.
Poudel, D. and Buckles, D. 2007. A history of events and
actions that have degraded or protected Rupa Lake in the
Pokhara Valley of Nepal Social Analysis Systems2 1.0, http://
sas-pm.com, Technique Report #5.
Pradhan, N. and Providoli, I. 2010. ‘Valuing water and its
ecological services in rural landscapes: A case study from
Nepal’ Mountain Forum Bulletin, January 2010.
Sachs, J., Panatayou, T., Peterson, A. 1999. Developing
countries and the control of climate change: A theoretical
perspective and policy implications. CAER II Discussion
Paper No. 44. Harvard Institute for International Development,
Cambridge, MA.

42 StAkehoLdeR-foCuSed CoSt-Benefit AnALySiS in the wAteR SeCtoR : SyntheSiS RepoRt
Stage, J. 2010. Economic valuation of climate change
adaptation in developing countries, Annals of the New York
Academy of Sciences 1185:150–63, New York Academy of
Sciences.
Thapa, Keshav and LIBIRD Team 2011. Exploring climate
adaptation mechanisms for watershed management, Climate
Adaptation Design and Piloting Project, Nepal. 2011.
Timmins, C. 2006. Endogenous land use and the Ricardian
valuation of climate change, Environmental and Resource
Economics, 33(1): 119–42. Available at http://econpapers.
repec.org/article/kapenreec/
Ulrich, W. 1987. Critical heuristics of social systems design.
European Journal of Operational Research 31(3):276-283.
van den Bergh, C.J.M. 1999. Optimal climate policy is a utopia:
from quantitative to qualitative CBA, Ecological Economics, 48
385–93.
World Bank 2009a. The costs to developing countries of
adapting to climate change. New methods and estimates.
The global report of the economics of adaptation to climate
change. Study consultation draft. The World Bank, Washington
DC.
World Bank 2009b. Vulnerability to climate change in
agricultural systems in Latin America: Building response
strategies. Latin America and Caribbean Region, The World
Bank, Washington DC.
World Bank. 2010a. The cost to developing countries of
adapting to climate change: new methods and estimates.
Washington, DC: World Bank.
World Bank. 2010b. Economics of adaptation to climate
change: social synthesis report. Washington, DC: World Bank.
Yesuf, M. and Bluffstone, R.A. 2009. Poverty, risk aversion
and path dependence in low-income countries: experimental
evidence from Ethiopia. American Journal of Agricultural
Economics Vol. 91, p. 1022–1037.

43

44 StAkehoLdeR-foCuSed CoSt-Benefit AnALySiS in the wAteR SeCtoR : SyntheSiS RepoRt

45
