student and stakeholder-focused results · 2018-01-02 · student and stakeholder-focused results ....
TRANSCRIPT

Student and Stakeholder-Focused Results
Analysis of Results Performance
Measure Measurement
Instrument or Process Current Results Analysis of Results Action Taken or
Improvement Made Insert Graph or Tables of Resulting Trends
(3-5 data points preferred) 75% of Business Unit alumni will be working full-time
Alumni Survey conducted by Institutional Research and Planning (IRP) in conjunction with the School and the Alumni and Advancement Office
In all but one year the goal of 75% of the Business Unit’s alumni were working full-time. Full-time = more than 30 hours per week Part-time = 30 hours or less per week (Note: Due to low response rate in 2013, there is no data for that year.)
For the reporting years, an average of 82% of those surveyed were working full-time. When part-time respondents are included, an average of 95% were employed either full- or part-time. Further analysis indicates that an average of 30% of these surveyed had secured employment in their field of study either before graduation or three months or less after graduation. Almost a third of graduates are employed within three months of graduation.
Graduates and alumni will continue to be contacted for this valuable data on employment trends. The Business Unit will continue to work with the Alumni and Advancement Office and IRP in gathering this data.
89% 86% 71%
11% 14% 13% 3%
12%
0%
20%
40%
60%
80%
100%
2011 2012 2014
Graduates' Employment
Emplyed Full-time Employed Part-time
Unemployed Other

2
Analysis of Results Performance
Measure Measurement
Instrument or Process Current Results Analysis of Results Action Taken or
Improvement Made Insert Graph or Tables of Resulting Trends
(3-5 data points preferred) Work exposure employers will strongly agree/agree that 90% of students demonstrate aptitude in employability skills
Work Exposure Survey/Evaluation conducted by Institutional Research and Planning (IRP) in conjunction with the School.
In the 2014-15 academic year, 85% or more of work term employers strongly agree/ agree that students demonstrate aptitude in all three skills areas (Fundamental, Personal Management and Teamwork). Averages have been maintained or increased from year to year.
Employers have clearly indicated their satisfaction with our work exposure students, as shown in the consistently high level of satisfaction. The School now has 5 years of trend data available which will be used to conduct an analysis of the criteria measured under each major skill area. One area that will be reviewed is the N/A responses. This will assist the College in reviewing programs to ensure skills being taught are meeting the needs of industry. One contributing factor to the N/A responses may be occasional misalignment of students’ programs with relevant job placements (eg. BA-HRM student placed in an office clerk position).
During the 2015-16 academic year, the School will conduct a detailed review of the data from the various criteria under each major skill area. Analysis of detailed criteria under each skill area (Fundamental, Personal Management and Teamwork Skills) will be captured and presented to Focus Groups and Curriculum Teams when reviewing programs.
0%20%40%60%80%
100%
10-11 11-12 12-13 13-14 14-15
Fundamental Skills
0%
20%
40%
60%
80%
100%
10-11 11-12 12-13 13-14 14-15
Personal Management Skills
0%
20%
40%
60%
80%
100%
10-11 11-12 12-13 13-14 14-15
Teamwork Skills
N/ADisagree/ Strongly DisagreeStrongly Agree/ Agree

3
Analysis of Results Performance
Measure Measurement
Instrument or Process Current Results Analysis of Results Action Taken or
Improvement Made Insert Graph or Tables of Resulting Trends
(3-5 data points preferred) 12 teams from CNA campuses will be represented at the annual Business Case Competitions (BCC)
Annual BCC attendance A maximum of 12 teams can comfortably be accommodated at the current venue. This annual BCC provides opportunities for relationship building among the School’s Business students and faculty across all campuses.
Campus participation has seen a steady increase since the 2010-11 academic year with maximum capacity surpassed in the 2014-15 academic year. Participating teams work in strict timeframes to analyze a given case study. Their findings and recommendations are then presented to a panel of industry judges. This provides an excellent opportunity for networking with future employers while improving critical thinking, teamwork, and presentation skills.
Annual communication with all campuses to encourage involvement has resulted in increasing the level of team participation. An average of 63% of campuses have been engaged in the BCC over the reporting period graphed. In the two highest years’ participation, several campuses sent multiple teams. Students, faculty, and judges consistently give anecdotal accounts of the value of this event to student learning and personal development.
The timing in the semester of the 2013-14 competition was found to be problematic for several teams. This contributed to the decrease in that year. Adjusting the dates of the competition in the 2014-15 academic year increased results to surpass our goal of 12 teams. This success required adjustments to accommodate the extra team in one of the four divisions.
5 7
11 7
13
02468
101214
2010-11 2011-12 2012-13 2013-14 2014-15
Number of Teams

4
Analysis of Results Performance
Measure Measurement
Instrument or Process Current Results Analysis of Results Action Taken or
Improvement Made Insert Graph or Tables of Resulting Trends
(3-5 data points preferred) All, 100%, of CNA Enactus teams will participate in the regional and/or national expositions each year.
Annual data from Enactus Canada
100% of CNA Enactus teams have participated in the regional and/or national expositions over the past four years (see Table 1).
Further analysis indicates that not all teams are attending both the regional and national expositions (see Table 2 and Table 3). The teams who do not attend both expositions varies from year to year; it is not always the same team. Enactus provides rich learning to team members as they network with regional and national entrepreneurs and are exposed to new projects and ideas. Enactus National Expositions rotate venues each year between Toronto, ON, and Calgary, AB.
While some local fundraising efforts take place for Enactus teams, sufficient financial support has been provided by CNA and the Atlantic Canada Opportunities Agency (ACOA) for teams to attend these events. Personal and family considerations typically are the reason for teams choosing not to attend one of the expositions. CNA will continue to make every effort to ensure the best of the Enactus teams’ projects are represented at the regional and national expositions.
Table 1
Table 2
100% 100% 100% 100%
0%20%40%60%80%
100%
2011 2012 2013 2014
Regional and National Exposition Participation
100% 75%
100% 100%
0%
20%
40%
60%
80%
100%
2011 2012 2013 2014
Atlantic Canada Regional Exposition Participation
5
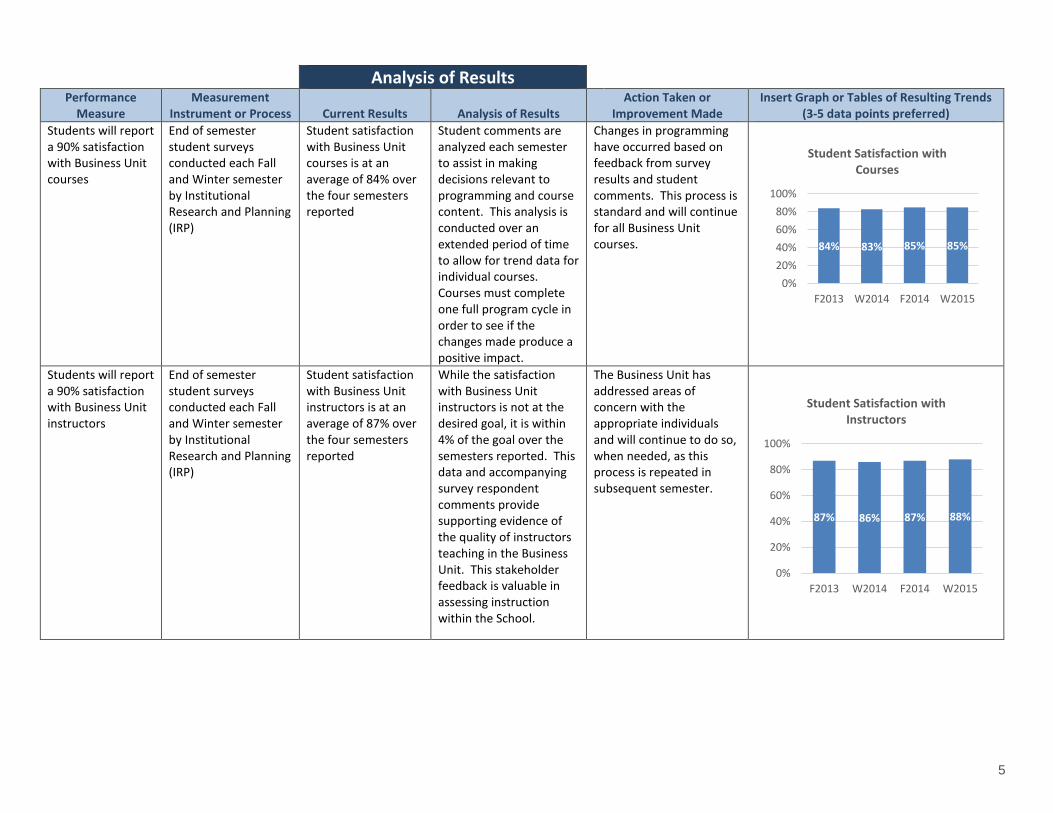
84% 83% 85% 85%
0%20%40%60%80%
100%
F2013 W2014 F2014 W2015
Student Satisfaction with Courses
87% 86% 87% 88%
0%
20%
40%
60%
80%
100%
F2013 W2014 F2014 W2015
Student Satisfaction with Instructors
Analysis of Results Performance
Measure Measurement
Instrument or Process Current Results Analysis of Results Action Taken or
Improvement Made Insert Graph or Tables of Resulting Trends
(3-5 data points preferred) Students will report a 90% satisfaction with Business Unit courses
End of semester student surveys conducted each Fall and Winter semester by Institutional Research and Planning (IRP)
Student satisfaction with Business Unit courses is at an average of 84% over the four semesters reported
Student comments are analyzed each semester to assist in making decisions relevant to programming and course content. This analysis is conducted over an extended period of time to allow for trend data for individual courses. Courses must complete one full program cycle in order to see if the changes made produce a positive impact.
Changes in programming have occurred based on feedback from survey results and student comments. This process is standard and will continue for all Business Unit courses.
Students will report a 90% satisfaction with Business Unit instructors
End of semester student surveys conducted each Fall and Winter semester by Institutional Research and Planning (IRP)
Student satisfaction with Business Unit instructors is at an average of 87% over the four semesters reported
While the satisfaction with Business Unit instructors is not at the desired goal, it is within 4% of the goal over the semesters reported. This data and accompanying survey respondent comments provide supporting evidence of the quality of instructors teaching in the Business Unit. This stakeholder feedback is valuable in assessing instruction within the School.
The Business Unit has addressed areas of concern with the appropriate individuals and will continue to do so, when needed, as this process is repeated in subsequent semester.

6
Analysis of Results Performance
Measure Measurement
Instrument or Process Current Results Analysis of Results Action Taken or
Improvement Made Insert Graph or Tables of Resulting Trends
(3-5 data points preferred) CNA credentials will be transferable by alumni to further studies at a rate of at least 65% of the programs they choose to transfer into after graduation
Alumni Survey conducted by Institutional Research and Planning (IRP) in conjunction with the School and the Alumni and Advancement Office
In all but one year the goal was surpassed. (Note: Due to low response rate in 2013, there is no data for that year.)
Transfer agreements between the Business Unit and other post-secondary institutions are working for the benefit of our graduates. An average of 65% of alumni surveyed over the reporting period were able to transfer their CNA credentials on to further studies. Further analysis indicates that over 40% of respondents pursued four-year degrees upon graduation from CNA’s business programs. The primary transfer agreements of which they availed were at universities within the province (53%) or Canada (60%), with another 15% at other universities not identified by location (due to the wide variety of responses).
The Business Unit will continue to pursue transfer agreements for the benefit of its graduates. In addition, current students will continue to be informed of the available transfer agreements already in place.
67% 57% 72%
33% 29% 8% 14% 20%
0%
20%
40%
60%
80%
100%
2011 2012 2014
CNA Crediential Transferable
Yes Some Courses No
7
Analysis of Results Performance
Measure Measurement
Instrument or Process Current Results Analysis of Results Action Taken or
Improvement Made Insert Graph or Tables of Resulting Trends
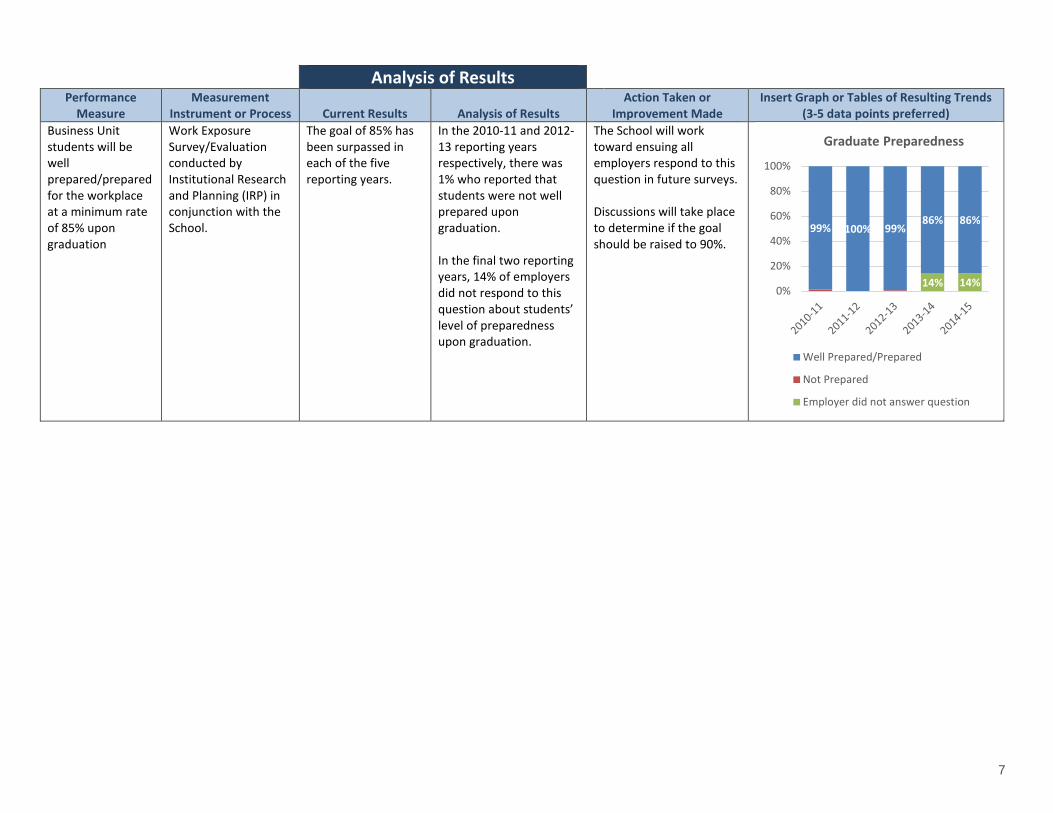
(3-5 data points preferred) Business Unit students will be well prepared/prepared for the workplace at a minimum rate of 85% upon graduation
Work Exposure Survey/Evaluation conducted by Institutional Research and Planning (IRP) in conjunction with the School.
The goal of 85% has been surpassed in each of the five reporting years.
In the 2010-11 and 2012-13 reporting years respectively, there was 1% who reported that students were not well prepared upon graduation. In the final two reporting years, 14% of employers did not respond to this question about students’ level of preparedness upon graduation.
The School will work toward ensuing all employers respond to this question in future surveys. Discussions will take place to determine if the goal should be raised to 90%.
14% 14%
99% 100% 99% 86% 86%
0%
20%
40%
60%
80%
100%
Graduate Preparedness
Well Prepared/Prepared
Not Prepared
Employer did not answer question

8
Measurement and Analysis of Student Learning and Performance
Program Outcomes Business Administration - General
1. Demonstrate the ability to effectively engage in research and information gathering processes. 2. Discuss general knowledge of accounting, human resources, and marketing, for application in a business
environment. 3. Demonstrate entrepreneurship skills used in a small- to medium-sized business environment. 4. Demonstrate application of the Conference Board of Canada employability skills.
Business Administration/ Management -Accounting 1. Prepare and analyze financial statements for internal and external decision making. 2. Use current technology to analyze results and generate appropriate reports. 3. Develop financial and budgetary plans based on varying business objectives, changing business environments,
and underlying business assumptions. 4. Demonstrate accounting skills at an intermediate to advanced level for application in the workplace. 5. Integrate ethical accounting practices for use in performing accounting functions. 6. Integrate business concepts for effective business planning and strategic management. (BM only) 7. Demonstrate application of the Conference Board of Canada employability skills.
Business Administration/ Management -Human Resource Management
1. Examine and critique the key fundamentals of strategic human resource management and the employment related legislation (acts and regulations).
2. Propose and apply various human resource practices to effectively manage an organization’s human resources. 3. Demonstrate effective research, negotiation, conflict resolution, and leadership skills for use in the business
environment. 4. Integrate ethical human resource management practices for use in performing human resource functions. 5. Integrate business concepts for effective business planning and strategic management. (BM only) 6. Demonstrate application of the Conference Board of Canada employability skills.
Business Administration/ Management -Marketing
1. Analyze the marketing environment to develop a comprehensive marketing strategy with recommendations for implementation and monitoring of the strategy.
2. Critically analyze and provide business solutions to marketing product, price, promotion, and distribution decisions.
3. Integrate ethical marketing strategies and tactics for application in both domestic and global marketing environments.
4. Create support materials for use in the implementation of a marketing strategy. 5. Integrate business concepts for effective business planning and strategic management. (BM only) 6. Demonstrate application of the Conference Board of Canada employability skills.
9
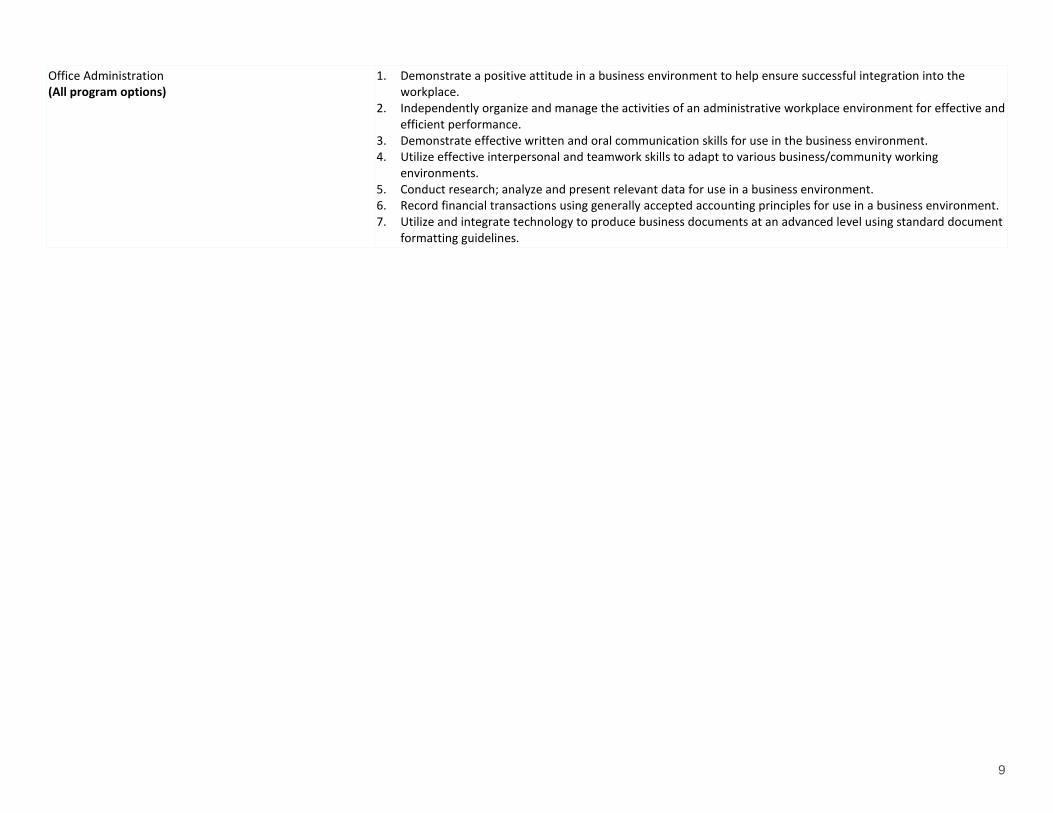
Office Administration (All program options)
1. Demonstrate a positive attitude in a business environment to help ensure successful integration into the workplace.
2. Independently organize and manage the activities of an administrative workplace environment for effective and efficient performance.
3. Demonstrate effective written and oral communication skills for use in the business environment. 4. Utilize effective interpersonal and teamwork skills to adapt to various business/community working
environments. 5. Conduct research; analyze and present relevant data for use in a business environment. 6. Record financial transactions using generally accepted accounting principles for use in a business environment. 7. Utilize and integrate technology to produce business documents at an advanced level using standard document
formatting guidelines.
10
Student Learning Results
NOTE: The program outcome numbers on the preceding pages are mapped to each of the appropriate Performance Measure(s) below.
Performance Measure
Measurement Instrument or Process Current Results Analysis of Results
Action Taken or Improvement Made
Insert Graphs or Tables of Resulting Trends
(3-5 data points preferred) Program Business Administration and Business Management – All options
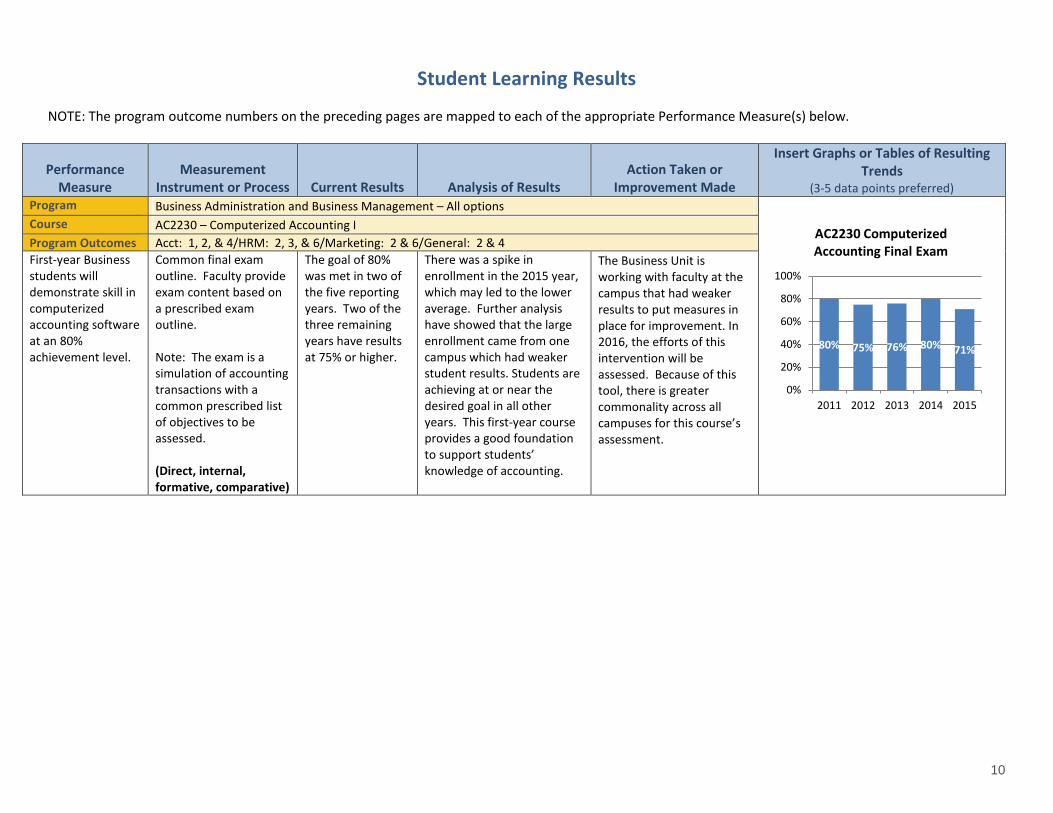
Course AC2230 – Computerized Accounting I Program Outcomes Acct: 1, 2, & 4/HRM: 2, 3, & 6/Marketing: 2 & 6/General: 2 & 4 First-year Business students will demonstrate skill in computerized accounting software at an 80% achievement level.
Common final exam outline. Faculty provide exam content based on a prescribed exam outline. Note: The exam is a simulation of accounting transactions with a common prescribed list of objectives to be assessed. (Direct, internal, formative, comparative)
The goal of 80% was met in two of the five reporting years. Two of the three remaining years have results at 75% or higher.
There was a spike in enrollment in the 2015 year, which may led to the lower average. Further analysis have showed that the large enrollment came from one campus which had weaker student results. Students are achieving at or near the desired goal in all other years. This first-year course provides a good foundation to support students’ knowledge of accounting.
The Business Unit is working with faculty at the campus that had weaker results to put measures in place for improvement. In 2016, the efforts of this intervention will be assessed. Because of this tool, there is greater commonality across all campuses for this course’s assessment.
80% 75% 76% 80% 71%
0%
20%
40%
60%
80%
100%
2011 2012 2013 2014 2015
AC2230 Computerized Accounting Final Exam
11
Performance Measure
Measurement Instrument or Process Current Results Analysis of Results
Action Taken or Improvement Made
Insert Graphs or Tables of Resulting Trends
(3-5 data points preferred) Program Business Administration and Business Management - Accounting
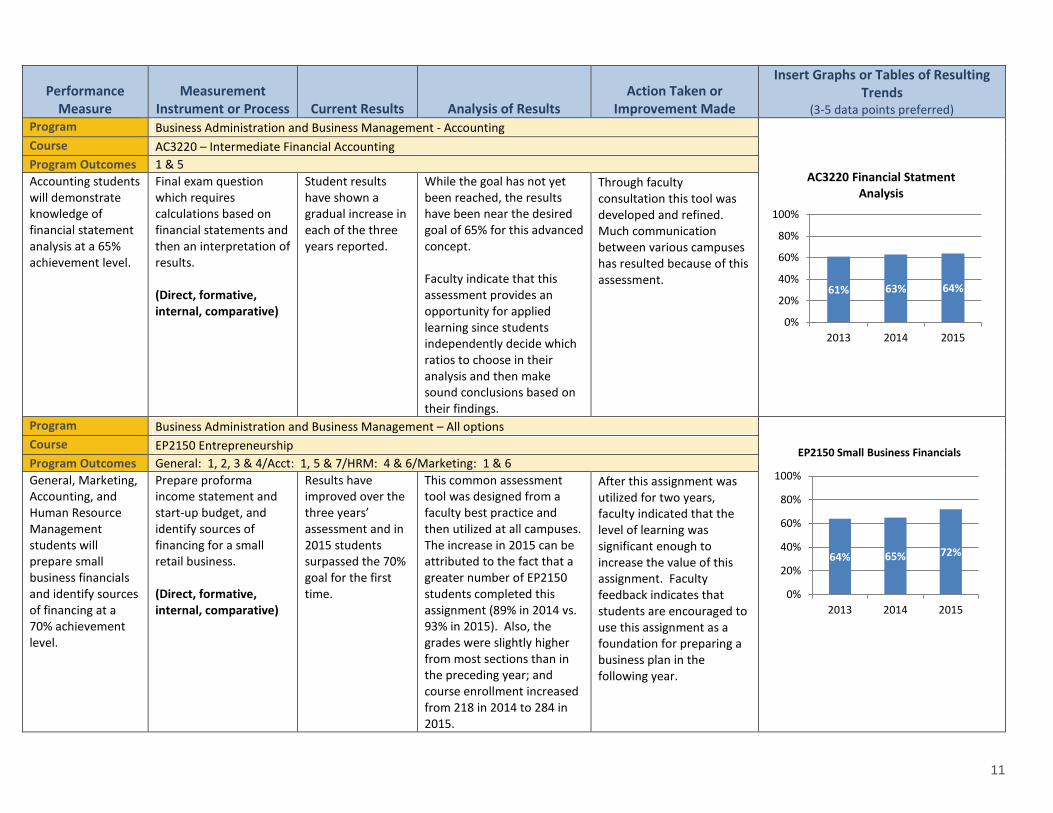
Course AC3220 – Intermediate Financial Accounting Program Outcomes 1 & 5 Accounting students will demonstrate knowledge of financial statement analysis at a 65% achievement level.
Final exam question which requires calculations based on financial statements and then an interpretation of results. (Direct, formative, internal, comparative)
Student results have shown a gradual increase in each of the three years reported.
While the goal has not yet been reached, the results have been near the desired goal of 65% for this advanced concept. Faculty indicate that this assessment provides an opportunity for applied learning since students independently decide which ratios to choose in their analysis and then make sound conclusions based on their findings.
Through faculty consultation this tool was developed and refined. Much communication between various campuses has resulted because of this assessment.
Program Business Administration and Business Management – All options
Course EP2150 Entrepreneurship Program Outcomes General: 1, 2, 3 & 4/Acct: 1, 5 & 7/HRM: 4 & 6/Marketing: 1 & 6 General, Marketing, Accounting, and Human Resource Management students will prepare small business financials and identify sources of financing at a 70% achievement level.
Prepare proforma income statement and start-up budget, and identify sources of financing for a small retail business. (Direct, formative, internal, comparative)
Results have improved over the three years’ assessment and in 2015 students surpassed the 70% goal for the first time.
This common assessment tool was designed from a faculty best practice and then utilized at all campuses. The increase in 2015 can be attributed to the fact that a greater number of EP2150 students completed this assignment (89% in 2014 vs. 93% in 2015). Also, the grades were slightly higher from most sections than in the preceding year; and course enrollment increased from 218 in 2014 to 284 in 2015.
After this assignment was utilized for two years, faculty indicated that the level of learning was significant enough to increase the value of this assignment. Faculty feedback indicates that students are encouraged to use this assignment as a foundation for preparing a business plan in the following year.
61% 63% 64%
0%
20%
40%
60%
80%
100%
2013 2014 2015
AC3220 Financial Statment Analysis
64% 65% 72%
0%
20%
40%
60%
80%
100%
2013 2014 2015
EP2150 Small Business Financials

12
Performance Measure
Measurement Instrument or Process Current Results Analysis of Results
Action Taken or Improvement Made
Insert Graphs or Tables of Resulting Trends
(3-5 data points preferred) Program Business Management – All options
Course EP2200 – Business Planning Program Outcomes Acct: 6 & 7/HRM: 5 & 6/Marketing: 5 & 6 Marketing, Accounting, and Human Resource Management students will develop and present a formal business plan at an 80% achievement level.
Accounting, Human Resource Management, and Marketing students develop and present a formal business plan to a panel of industry representatives. The tool is assessed in partnership with faculty and industry representatives. (Direct, summative, internal/external, comparative)
The goal of 80% has been surpassed in all but one of the five reporting years. In that one year, the results were just one percent below the goal.
Upon further analysis, students’ are producing their written business plans at an average achievement rate of 81.6% and delivering their oral presentations at an average achievement rate of 80.8% over the five years reported. These two components are combined for their overall grade on this assessment.
Because the goal of 80% has consistently been met, the new goal will increase to 85%. This common assessment tool has enhanced student learning because where enrollment allows, working groups are comprised of students from Accounting, Human Resource Management, and Marketing Programs. Also, there are networking opportunities with industry since they comprise the evaluation panel.
81% 82% 81% 79% 82%
0%20%40%60%80%
100%
2011 2012 2013 2014 2015
EP2200 Business Plan & Oral Presentation

13
Performance Measure
Measurement Instrument or Process Current Results Analysis of Results
Action Taken or Improvement Made
Insert Graphs or Tables of Resulting Trends
(3-5 data points preferred) Program Business Administration and Business Management – Human Resource Management
Course HN1400 – Occupational Health and Safety Program Outcomes 2 & 4 All HN1400 student will earn Workplace Hazardous Materials Information System (WHMIS) certification.
External testing to earn WHMIS certification. (Direct, summative, external, comparative)
While not all students are earning their WHMIS certification, in all years except 2015 over 90% of all HN1400 students were being certified in WHMIS.
Two of our larger classes had an increase in the number of students who did not complete WHMIS training in 2015. This impacted the overall results.
Faculty have been contacted to determine if there are any contributing factors to students not completing WHMIS training and any suggestion to increase the number of students being certified.
Program Business Administration and Business Management – Human Resource Management
Course HN2150 – Training and Development Program Outcomes 1, 2, 3, 4, & 6 Human Resource Management students will develop and present a training simulation at a 70% achievement level.
Students design and present (in class) a human resources training simulation. (Direct, formative, internal, comparative)
Student results have surpassed the goal and continues to increase slightly each year. Faculty feedback indicates this is a “practical and relevant” assessment tool.
Further analysis indicates that there has been a 55% increase in enrollment in this course since 2012. Even with the increased number of students, results have continued to improve. Student engagement in this assessment has been high. This hands-on learning opportunity has received positive feedback.
Because the goal of 70% has consistently been met, the new goal will increase to 75%. After the first use of this tool, some areas were identified as being unclear. Faculty worked to refine some parts of the tool’s instructions in an effort to provide greater clarity for students. The revised tool is being used with fewer student questions for clarification.
91% 92% 93% 86%
0%20%40%60%80%
100%
2012 2013 2014 2015
HN1400 WHMIS Certification
72% 73% 75%
0%20%40%60%80%
100%
2012 2013 2014
HN2150 Training Simulation & Presentation

14
Performance Measure
Measurement Instrument or Process Current Results Analysis of Results
Action Taken or Improvement Made
Insert Graphs or Tables of Resulting Trends
(3-5 data points preferred) Program Business Administration and Business Management - Marketing
Course MR1500 – Consumer Behaviour Program Outcomes 2, 3 & 6 Marketing students will demonstrate knowledge of case study analysis at a 70% achievement level.
Students analyze a case study and present a written paper summary as well as an oral presentation of findings with the grade weight being 80% for the written report and 20% for the oral presentation. (Direct, formative, internal, comparative)
In 2014, students surpassed the 70% goal.
Further analysis indicates there is an average of 10% improvement each year when this second-year assessment is compared with students’ third-year case study assessment results.
Since results have been consistently near or above the desired goal, data collection for this tool has been suspended. Other areas in the Marketing program are now being assessed and analyzed. This has been included due to the self-study year 2014-15.
Program Business Administration and Business Management - Marketing
Course MR2400 – Marketing Communications Program Outcomes 1, 3, & 4 Marketing students will prepare an integrated advertising plan at a 75% achievement level.
Marketing students conduct research to help develop an advertising plan, then design media ads and present written recommendations to a client. (Direct, formative, internal, comparative)
Results have improved in each of the three years reported and surpassed the goal in 2014.
Further analysis indicates that between 92% and 96% of all students enrolled in MR2400 are completing this assignment. Also, there has been a 37% increase in enrollment in this course since 2012. Even with the increased number of students, results have continued to improve. Students have engaged in significant applied learning through this assessment.
After the first year, faculty refined their instructions to students, which resulted in more clarity for students in completing this authentic learning assessment. Since results have been consistently near or above the desired goal, data collection for this tool has been suspended. Other areas in the Marketing program are now being assessed and analyzed. New areas of trend data will be reported in future QA Reports.
68% 61% 65% 68% 75%
0%
20%
40%
60%
80%
100%
2010 2011 2012 2013 2014
MR1500 Case Study
67% 73% 79%
0%
20%
40%
60%
80%
100%
2012 2013 2014
MR2400 Integrated Advertising Plan

15
Performance Measure
Measurement Instrument or Process Current Results Analysis of Results
Action Taken or Improvement Made
Insert Graphs or Tables of Resulting Trends
(3-5 data points preferred) Program Business Administration – Banking (Qatar Campus ONLY)
Course BK1100 Banking Operations I Program Outcomes 1 & 3 Students will demonstrate knowledge of retail banking functions at a 60% achievement level.
Final Exam (Direct, Formative, Internal)
Student results have shown a gradual increase in the semesters reported.
Because this program’s first intake was in 2014, more data is required before a thorough analysis can be completed.
Monitoring of this data will be continued.
Program Office Administration – All programs
Course DM1201 (2011, 2012); KB1150 (2013, 2014, 2015); DM2201, DM3220 (2011, 2012, 2013); KB1151 (2014, 2015)
Program Outcomes 7 At graduation, 85% of Office Administration students will meet or exceed 40 net words per minute (NWPM) in official timings.
Official timings administered in document production and keyboarding courses in students’ winter semesters. Course numbers have changed over time as the official timings were separated from the larger document production courses in 2013-14. (Direct, summative, internal, comparative)
Students’ keyboarding speeds increased each year as they progressed from year one to year two of their program of study. Students are meeting or exceeding industry’s minimum standard of 40 NWPM.
Students continue to achieve at or above the 40 NWPM level established by the College and industry experts. Further analysis indicates students’ keyboarding speeds increased, by cohort, from year one to graduation by up to 20 NWPM.
Faculty will continue to do weekly speed building exercises with students in an effort to increase the number of students meeting or exceeding 40 NWPM.
61% 56%
0%20%40%60%80%
100%
Fall 2014 Winter 2015
BK1100 Final Exam
76%
94
%
85%
96
%
82%
94
%
78%
98
%
80%
97
%
0%
20%
40%
60%
80%
100%
Yr.1
Yr.2
Yr.1
Yr.2
Yr.1
Yr.2
Yr.1
Yr.2
Yr.1
Yr.2
2010-11
2011-12
2012-13
2013-14
2014-15
Percentage of Students At or Above 40 NWPM
16
Performance Measure
Measurement Instrument or Process Current Results Analysis of Results
Action Taken or Improvement Made
Insert Graphs or Tables of Resulting Trends
(3-5 data points preferred) Program Office Administration – All options
Current:
Former:
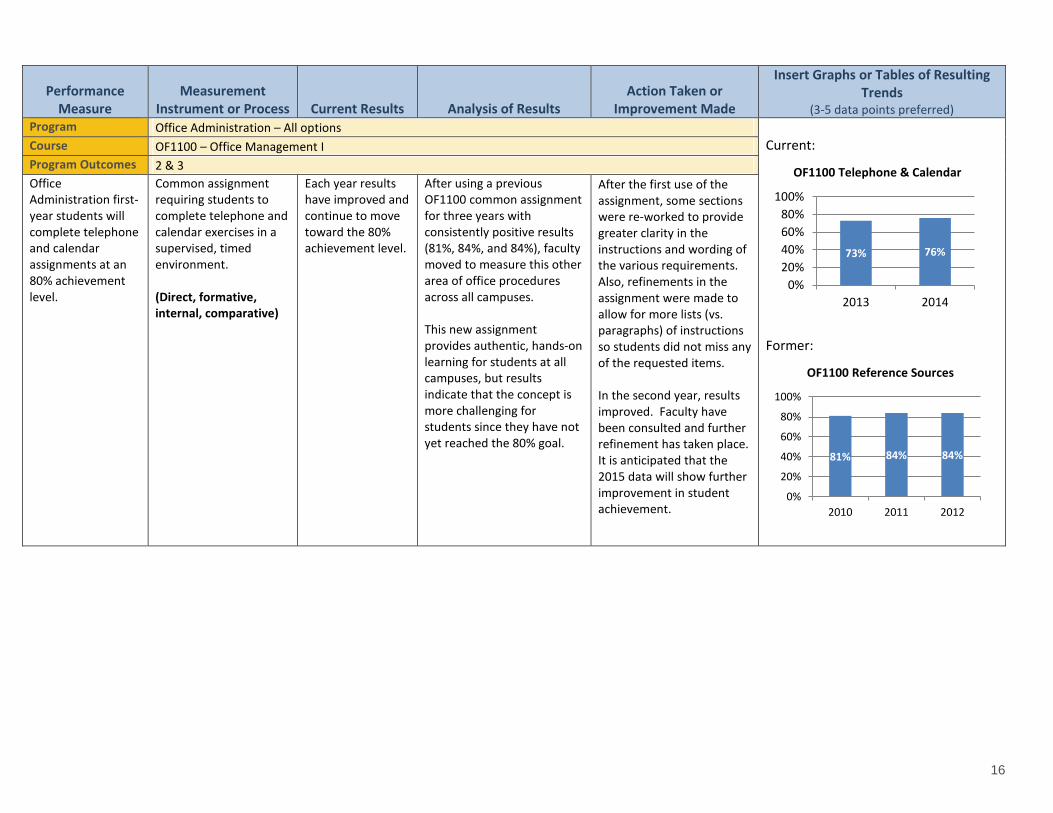
Course OF1100 – Office Management I Program Outcomes 2 & 3 Office Administration first-year students will complete telephone and calendar assignments at an 80% achievement level.
Common assignment requiring students to complete telephone and calendar exercises in a supervised, timed environment. (Direct, formative, internal, comparative)
Each year results have improved and continue to move toward the 80% achievement level.
After using a previous OF1100 common assignment for three years with consistently positive results (81%, 84%, and 84%), faculty moved to measure this other area of office procedures across all campuses. This new assignment provides authentic, hands-on learning for students at all campuses, but results indicate that the concept is more challenging for students since they have not yet reached the 80% goal.
After the first use of the assignment, some sections were re-worked to provide greater clarity in the instructions and wording of the various requirements. Also, refinements in the assignment were made to allow for more lists (vs. paragraphs) of instructions so students did not miss any of the requested items. In the second year, results improved. Faculty have been consulted and further refinement has taken place. It is anticipated that the 2015 data will show further improvement in student achievement.
73% 76%
0%20%40%60%80%
100%
2013 2014
OF1100 Telephone & Calendar
81% 84% 84%
0%
20%
40%
60%
80%
100%
2010 2011 2012
OF1100 Reference Sources

17
Performance Measure
Measurement Instrument or Process Current Results Analysis of Results
Action Taken or Improvement Made
Insert Graphs or Tables of Resulting Trends
(3-5 data points preferred) Program Office Administration - Executive
Course OF2101 – Office Management IV Program Outcomes 2, 3, 5, & 7 Office Administration – Executive students will conduct short research and report findings at an 80% achievement level.
Common embedded final exam question requiring a response to a scenario presented to students. Students conduct short research with findings presented in memo format. (Direct, summative, internal, comparative)
While the goal has not yet been met, results are near the 80% goal.
Further analysis of the data was conducted and there is no evidence of results being affected by any one class of students. The results are consistent across all campuses. It is possible that the goal is a little too high. However, faculty have consistently taught to improve students’ research and writing skills and continue to aim for reaching the 80% goal. Also, how faculty graded the assignments may be a factor.
Faculty have been engaged after each administration of this common assessment tool to make any edits necessary for improvement and clarity. Some faculty had a couple of questions about grading when the 2015 data was submitted. So, before the tool is used again, these grading items will be addressed with faculty.
79% 75% 75%
0%
20%
40%
60%
80%
100%
2013 2014 2015
OF2101 Research

18
Performance Measure
Measurement Instrument or Process Current Results Analysis of Results
Action Taken or Improvement Made
Insert Graphs or Tables of Resulting Trends
(3-5 data points preferred) Program Office Administration – Legal
Course DM3250 – Legal Document Production Program Outcomes 7 Office Administration- Legal students will assemble and format wills and estates documents at an 80% achievement level.
Common embedded exam question requiring students to accurately assemble and format wills and estate documents within a set timeframe. (Direct, summative, internal, singular)
No data was available in 2014. However, data collected in 2015 shows a continuation in the upward trend toward the goal of 80%.
The interventions in the “action taken” column have resulted in an average improvement of 9% over the reporting years. The consistent reinforcement in semester learning exercises since 2012 has contributed to improved results in the testing environment.
2012 & 2013 data – Instructor had students add clause names in the semester learning exercises to reinforce their knowledge of clause names. This intervention has helped improve student learning. Because of the action taken, students have greater reinforcement of clause names. 2014 – New intervention – Additional information about the procedure for numbering of will paragraphs was added to their learning exercises. The faculty member is consulted each year for feedback and suggestions for changes and improvements in the tool.
66% 73% 75%
0
78%
0%
20%
40%
60%
80%
100%
2011 2012 2013 2014 2015
DM3250 Wills & Estates Documents
19
Performance Measure
Measurement Instrument or Process Current Results Analysis of Results
Action Taken or Improvement Made
Insert Graphs or Tables of Resulting Trends
(3-5 data points preferred) Program Office Administration – Medical
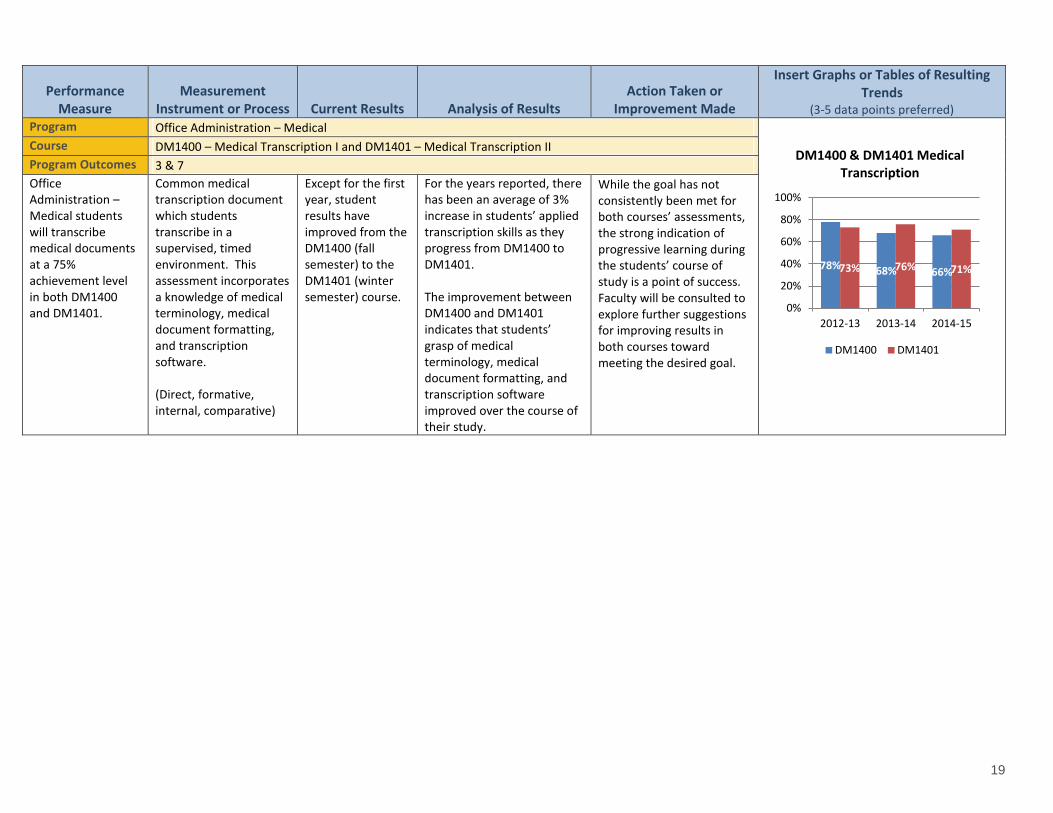
Course DM1400 – Medical Transcription I and DM1401 – Medical Transcription II Program Outcomes 3 & 7 Office Administration – Medical students will transcribe medical documents at a 75% achievement level in both DM1400 and DM1401.
Common medical transcription document which students transcribe in a supervised, timed environment. This assessment incorporates a knowledge of medical terminology, medical document formatting, and transcription software. (Direct, formative, internal, comparative)
Except for the first year, student results have improved from the DM1400 (fall semester) to the DM1401 (winter semester) course.
For the years reported, there has been an average of 3% increase in students’ applied transcription skills as they progress from DM1400 to DM1401. The improvement between DM1400 and DM1401 indicates that students’ grasp of medical terminology, medical document formatting, and transcription software improved over the course of their study.
While the goal has not consistently been met for both courses’ assessments, the strong indication of progressive learning during the students’ course of study is a point of success. Faculty will be consulted to explore further suggestions for improving results in both courses toward meeting the desired goal.
78% 68% 66% 73% 76% 71%
0%
20%
40%
60%
80%
100%
2012-13 2013-14 2014-15
DM1400 & DM1401 Medical Transcription
DM1400 DM1401
20
Performance Measure
Measurement Instrument or Process Current Results Analysis of Results
Action Taken or Improvement Made
Insert Graphs or Tables of Resulting Trends
(3-5 data points preferred) Program Office Administration – Records and Information Management
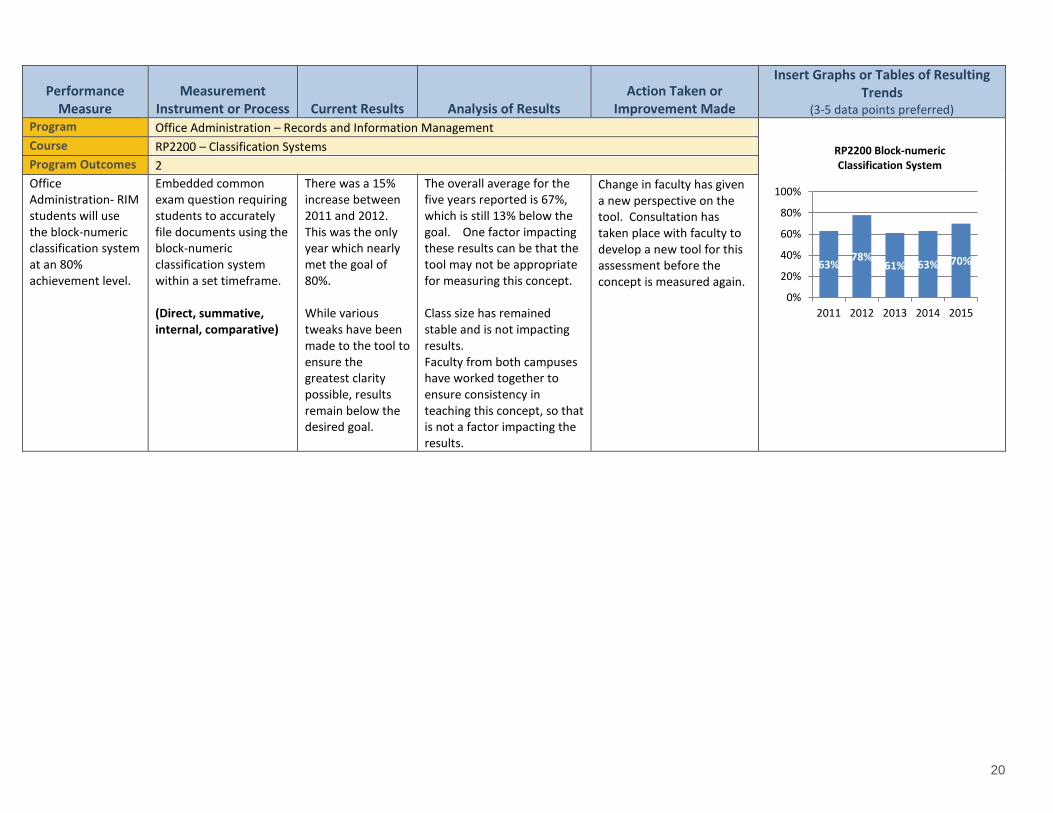
Course RP2200 – Classification Systems Program Outcomes 2 Office Administration- RIM students will use the block-numeric classification system at an 80% achievement level.
Embedded common exam question requiring students to accurately file documents using the block-numeric classification system within a set timeframe. (Direct, summative, internal, comparative)
There was a 15% increase between 2011 and 2012. This was the only year which nearly met the goal of 80%. While various tweaks have been made to the tool to ensure the greatest clarity possible, results remain below the desired goal.
The overall average for the five years reported is 67%, which is still 13% below the goal. One factor impacting these results can be that the tool may not be appropriate for measuring this concept. Class size has remained stable and is not impacting results. Faculty from both campuses have worked together to ensure consistency in teaching this concept, so that is not a factor impacting the results.
Change in faculty has given a new perspective on the tool. Consultation has taken place with faculty to develop a new tool for this assessment before the concept is measured again.
63% 78%
61% 63% 70%
0%
20%
40%
60%
80%
100%
2011 2012 2013 2014 2015
RP2200 Block-numeric Classification System

21
Organizational Performance Results
Analysis of Results
Performance Measure
Measurement Instrument or Process Current Results Analysis of Results
Action Taken or Improvement Made
Insert Graph or Tables of Resulting Trends (3-5 data points preferred)
Office Administration – Medical graduates will complete first aid training at a 100% achievement level.
All students must present a current first aid certificate of training in order to meet graduation requirement. This training may be done as a cohort or individually. In either case, the training must be a from a certified first aid provider.
Having OA students skilled in first aid as they move into medical offices after graduation is a skill that can have a direct positive impact on the clients served in the case of a medical emergency
Students have been consistently meeting this graduation requirement at a 100% achievement level.
This training will continue to be part of the OA-Medical program of study.
Overall School enrollment in all Business and Office Administration programs will be maintained at current levels or increased.
Annual College enrollment reports compiled by Institutional Research and Planning (IRP)
Overall School enrollment in Business and Office Administration programs has increased each year.
There was a 6% increased between 2012-13 and 2013-14. There was a 4% increase between 2013-14 and 2014-15. This is an average of 5% for these years. Further analysis indicates that growth in the Business Management programs was over 10% each year. The other programs are closer to the 5%. Also, the School’s enrollment remained stable at an average of 15% of the overall College enrollment for the reporting period.
Data will continue to be collected in order to analyze longer-term trends.
100% 100% 100%
0%20%40%60%80%
100%
2013 2014 2015
OA-Medical Grads With 1st Aid Training
1270 1344 1402
0200400600800
1000120014001600
2012-13 2013-14 2014-15
School Enrollment Business Programs

22
Analysis of Results
Performance Measure
Measurement Instrument or Process Current Results Analysis of Results
Action Taken or Improvement Made
Insert Graph or Tables of Resulting Trends (3-5 data points preferred)
Increase enrollment by an average of 10% in online distributed learning (DL) Business (BA/BM/OA) courses.
Enrollment reports from Institutional Research and Planning (IRP).
DL student enrollment has increased by 56% since 2011 with a steady growth in online enrollment each year.
Enrollment has seen a steady increase since 2011. DL is providing students with quality online business programs. In August 2011, some provincial government funding to post-secondary students was withdrawn and impacted on student enrollment. However, enrollment has since recovered and steadily increased.
Continue developing and offering quality Business programs through DL.
Install smartboards for enhanced teaching and learning in 100% of labs and classrooms with an identified need for this technology.
Information Technology (IT) data from each CNA campus’ IT personnel
As of 2012, 80% of all smartboards were installed in labs and classrooms at CNA campuses where there was an identified need for them. Over the past three years, there has been an average of 7% added each year. Labs were first fitted with this technology, then classrooms were added based on teaching
CNA has been in the forefront of providing current lab and classroom technology for enhanced teaching and learning. This is evidenced by the early integration of smartboard technology into the lab and classroom settings. Students have access to not only faculty slide shows relevant to the course material, but easy access to a myriad of course-specific online resources. Labs and classrooms will continue to be update annually with new smartboards as required.
At present, older smartboards are being updated and replaced each year to ensure the latest technology is maintained throughout CNA’s labs and classrooms. Interactive LCD panels are a newer technology that is being reviewed by CNA’s IT department to see if it will be a worthwhile investment for further enhancing student learning in the lab and classroom setting. Some factors under consideration are the fact that the screen is smaller
266
240
251 32
0 375
0
100
200
300
400
2010 2011 2012 2013 2014
DL - Business Enrollment
80% 93% 98% 100%
0%
20%
40%
60%
80%
100%
Pre-2012 2012-13 2013-14 2014-15
Smartboard Technology Coverage
23
Analysis of Results
Performance Measure
Measurement Instrument or Process Current Results Analysis of Results
Action Taken or Improvement Made
Insert Graph or Tables of Resulting Trends (3-5 data points preferred)
requirements and room usage.
than the current smartboards, and this may not be advantageous in larger classroom settings.
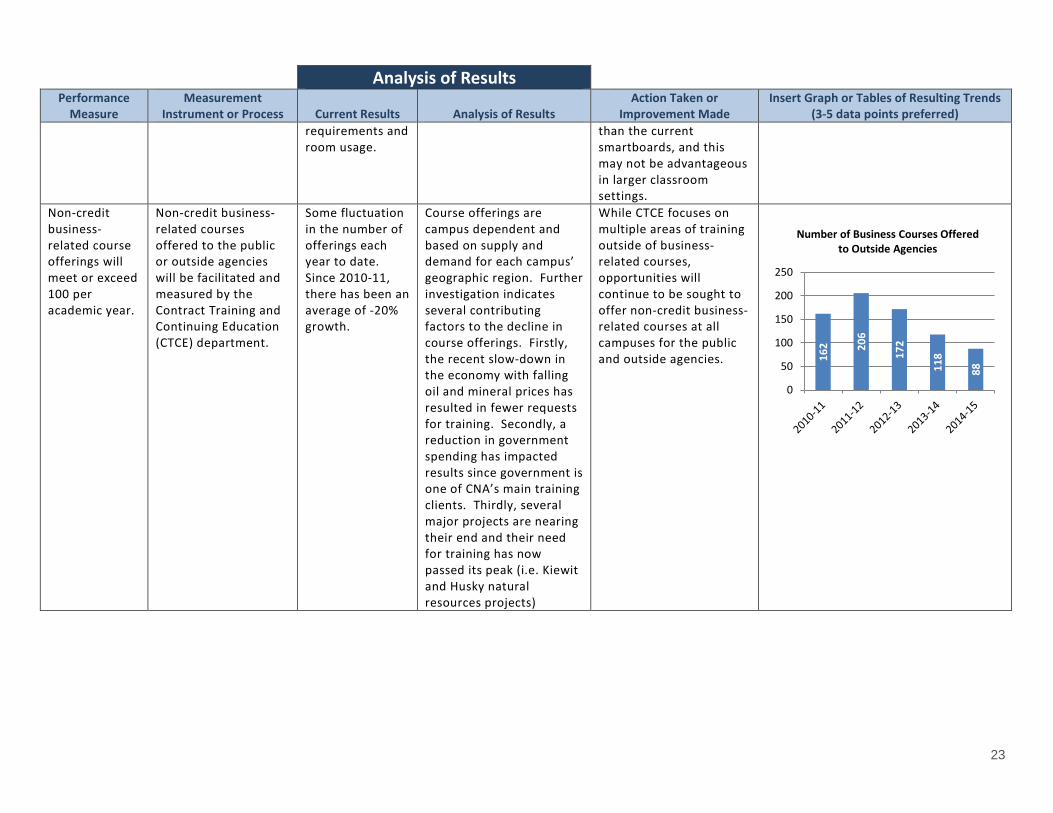
Non-credit business-related course offerings will meet or exceed 100 per academic year.
Non-credit business-related courses offered to the public or outside agencies will be facilitated and measured by the Contract Training and Continuing Education (CTCE) department.
Some fluctuation in the number of offerings each year to date. Since 2010-11, there has been an average of -20% growth.
Course offerings are campus dependent and based on supply and demand for each campus’ geographic region. Further investigation indicates several contributing factors to the decline in course offerings. Firstly, the recent slow-down in the economy with falling oil and mineral prices has resulted in fewer requests for training. Secondly, a reduction in government spending has impacted results since government is one of CNA’s main training clients. Thirdly, several major projects are nearing their end and their need for training has now passed its peak (i.e. Kiewit and Husky natural resources projects)
While CTCE focuses on multiple areas of training outside of business-related courses, opportunities will continue to be sought to offer non-credit business-related courses at all campuses for the public and outside agencies.
162 20
6
172
118
88
0
50
100
150
200
250
Number of Business Courses Offered to Outside Agencies

24
Analysis of Results
Performance Measure
Measurement Instrument or Process Current Results Analysis of Results
Action Taken or Improvement Made
Insert Graph or Tables of Resulting Trends (3-5 data points preferred)
Awarding of provincial scholarships and awards will be maintained at current levels or increased.
The Office of Alumni and Advancement coordinates the annual acquisition and awarding of scholarships and awards. This data is provided by their Office. The annual Student Awards Handbook provides a listing of all available scholarships and awards.
The value of awards and scholarships has increased each year except for a slight decrease in the 2012-13 year. Scholarships and awards have a direct positive impact on CNA learners.
An average of $425,000 has been available to students in scholarships and awards for the past four years. CNA actively seeks opportunities to increase scholarships and awards for students. These funds have positively impacted an average of 590 student recipients per year for the past four years.
Support College-wide initiatives to increase annual giving to scholarships and awards.
$38
0
$45
0
$40
9
$46
2
$- $100 $200 $300 $400 $500
In T
hous
ands
($00
0)
Value of Scholarships & Awards

25
Appendix A - Employability Skills
Employability Skills
Fundamental Skills Personal Management Skills • Demonstrate clear, concise and well-organized written communication skills • Demonstrate a positive attitude and show interest, initiative and effort • Demonstrate clear, concise and well-organized oral communication skills • Demonstrate integrity and personal ethics • Listen and ask questions in order to understand tasks • Demonstrate appropriate workplace ethics (e.g., personal grooming, on time, etc.) • Share information using a range of technologies (e.g., voice, email, etc.) • Effectively engage in sharing of ideas and personally contribute to the workplace • Locate, gather and organize information using appropriate technology and
information systems • Work as part of a team
• Effectively manage time • Work independently • Record and/or interpret data using appropriate methods, tools and technology • Carry out multiple tasks at once • Demonstrate accuracy when performing mathematical functions • Adapt to office environment • Assess situations and identify problems • Adapt to new methods and techniques • Be creative and innovative in exploring possible solutions • Troubleshoot office equipment • Evaluate solutions to make recommendations or decisions • Handle stressful situations appropriately • Implement solutions • Demonstrate appropriate safety practices
Teamwork Skills
• Interact appropriately and professionally within the dynamics of a group
• Contribute to a team by sharing information and expertise
• Effectively plan, design and carry out a project or task from start to finish with well-defined objectives and outcomes
• Meet deadlines