spreadsheet models for terminal planning & design
TRANSCRIPT

ACRP
Project Number 07-04
Spreadsheet Models for Terminal Planning &
Design
Final Report
TRANSPORTATION RESEARCH BOARD OF THE NATIONAL ACADEMIES
PRIVILEGED DOCUMENT
This report, not released for publications, is furnished only for review to members of or participating in the work of the ACRP. This report is to be regarded as fully privileged, and dissemination of the information
included herein must be approved by the ACRP.
Landrum & Brown Matthew H. Lee
11279 Cornell Park Drive Cincinnati, OH 45242

Table of Contents

SPREADSHEET MODELS FOR TERMINAL PLANNING & DESIGN ACRP 07-04
Final Report TOC-i August 2009
TABLE OF CONTENTS CHAPTER 1 Background .......................................................................... 1-1 Introduction ......................................................................................... 1-1 Research Objectives.......................................................................... 1-1 Interaction and Compatibility with Terminal Planning & Design Guidebook ....................................................................... 1-2 CHAPTER 2 Research Findings Literature Search .................................................................................. 2-1 Industry Survey .................................................................................... 2-3 Survey Sample Selection ................................................................... 2-3 Survey Results ................................................................................. 2-4 Research Conclusions ............................................................................ 2-5 Compendium of Available Simulation Models......................................... 2-5 CHAPTER 3 Modeling Approach & Design Modeling Uses ...................................................................................... 3-1 Modeling Overview............................................................................ 3-1 Workbook Organization ..................................................................... 3-5 Modeling Techniques ......................................................................... 3-6 Source Data Analysis....................................................................... 3-10 Primary Functional Modules.............................................................. 3-18 CHAPTER 4 Conclusions and Recommendations Recommendations for Continuing Research .......................................... 4-2 APPENDIX A Annotated Bibliography ...................................................... A-1 APPENDIX B 07-04 Model Information.................................................... B-1 APPENDIX C User Manual........................................................................ C-1

Chapter One
Background

SPREADSHEET MODELS FOR TERMINAL PLANNING & DESIGN ACRP 07-04
Draft Interim Report 1-1 March 2008
CHAPTER ONE
BACKGROUND
INTRODUCTION
Passenger terminal planning often requires computerized analyses of complex flows and queues of passengers and baggage within the airport terminal complex (i.e., curbside to gate). The computer models used for these analyses are either based on procedures using spreadsheets (hereinafter referred to as spreadsheet models) or more sophisticated, discrete event simulation models that often include animated outputs (hereinafter referred to as discrete event models). The discrete event models are usually created on proprietary software. The spreadsheets are usually variations of previously constructed models created by individuals working for airports or consulting firms in support of specific analyses. Although some situations require the use of discrete event models, spreadsheets often provide sufficient preliminary or final answers to many terminal planning and design issues.
The development of reusable user-friendly spreadsheet models that reflect accepted analysis techniques, and analyze common issues relating to airport terminal planning and design, would benefit airport operators by providing them with tools they can immediately use without having to “reinvent the wheel” as they confront issues that are new to them but have been solved elsewhere. RESEARCH OBJECTIVES
The objectives of this research are to:
develop a user–friendly spreadsheet model (or models), with an accompanying manual, to analyze issues common to airport passenger terminal planning and design, and
produce a compendium that identifies the types, scopes, and availability of spreadsheet and discrete event models that can be used by airport operators for airport passenger terminal planning and design.
The prime users of this project’s products are intended to be employees of
airport operators who are involved in terminal planning and design. The following chapters and appendices provide, in some detail, the information
compiled during conduct of the research. The major components are:
Chapter Two – A review of the research approach, including a literature search and the findings from the relevant portions from the FAA White Papers.
Chapter Three – A description of the modeling approach and the software design for the functional areas addressed by the models.

SPREADSHEET MODELS FOR TERMINAL PLANNING & DESIGN ACRP 07-04
Draft Interim Report 1-2 March 2008
Chapter Four – Recommendations and conclusions regarding the utility of findings for inclusion in the Spreadsheet Models was prepared during Phase Two of the study.
INTERACTION AND COMPATIBILITY WITH TERMINAL PLANNING & DESIGN GUIDEBOOK
The terminal planning guidebook describes the complete process of developing
an airport passenger terminal development plan. It describes a broadly defined process that takes into consideration the technical, business and political aspects of the airport’s environment. This process begins by gaining a through understanding from the stakeholders about their issues, goals and objectives. From a technical analysis perspective this process begins by determining the future forecasts of passengers and aircraft operations that in turn form the demand basis for programming the future terminal facility requirements. Once the facility requirements have been determined, then the conceptual planning begins. This typically involves a two-step process of development producing initial, and then refined concepts resulting in a preferred alternative. The preferred conceptual terminal alternative then continues on in the process to serve as the planning basis for the architectural and engineering services during schematic design, design development and construction documents.
The spreadsheet models support the technical analyses of this process by
providing tools for the quantitative background to the program that defines terminal facility requirements.
These facility requirements provide the basic data that drives the conceptual
planning process and ultimately the terminal design. It is important that these requirements reflect the primary processes supported by a passenger terminal -- getting passengers and their baggage from ground transportation to aircraft or from aircraft to ground transportation.
It is beyond the scope of this effort to provide a complete terminal space
programming model. Space programs, while defining space requirements for critical passenger service functions, also provide requirements for building areas that have more relationship to airline operations, local codes, fire protection regulations, mechanical systems, environmental design or sustainability, and supporting other airport functions such as air traffic control, airport administration, and independent aviation related businesses. The space program also reflects decisions made between airport management and its stakeholders which often support issues unique to an individual airport.

Chapter Two
Research Findings
SPREADSHEET MODELS FOR TERMINAL PLANNING & DESIGN ACRP 07-04
Draft Interim Report 2-1 March 2008
CHAPTER TWO
RESEARCH FINDINGS
This chapter presents the approach taken to develop information for the first phase of the study, including a literature review, the development of our survey instrument and the process of soliciting of industry involvement and participation. Additionally research includes the review and assessment of the FAA “white papers” to find additional material to guide development of the spreadsheet models.
LITERATURE SEARCH
A literature search was conducted to determine the types of models available,
what portions of the airport terminal complex were evaluated with each model and where possible, determine what level of usage each model had received since its inception.
Two general surveys of available models have been prepared during the past 25
years. 1985 FAA Advisory Circular 150/5000—4B – Airport Research and Technical Reports, mentions the availability of the following two reports that describe passenger terminal analysis:
FAA-RD-75-191, The Apron and Terminal Building Planning Manual, AD-A018 120 76-02 l E PcA15/MFAol
FAA-EM-80-008, vol. 1-4 Airport Landside. Volume 2: The Airport Landside Simulation Model (ALSIM) AD-A117 600 82-24 PcAo6/MFAol
The 2002 AENA Position Paper on Airport Simulation and Modeling Issues
(THENA) mentions the availability of the following reports that describe passenger terminal analysis:
AIRLAB (AIRport LABoratory) Giorgio Romanin-Jacur, Dept. of Management and Engineering, University of Padova, Stradella S. Nicola 3, 36100 Vicenza ITALY.
PAXSIM, Boeing (Preston Group), Melbourne, VIC, Australia
PBFM (Pand Baggage Flow Model), ATAC Corporation, Mountain View, California
SLAM (Simple Landside Aggregate Model), Giovanni Andreatta, Dept. of Pure and Applied Mathematics, University of Padova, via Belzoni 7, 35131 PADOVA ITALY
In addition to these two surveys, The Transportation Research Board in 2003
held a workshop titled, “Using Simulation to Evaluate Impacts of Airport Security – 2003 Simulation Workshop”. This workshop identified the following models:
PAXSIM, Boeing (Preston Group), Melbourne, VIC, Australia – a continuous simulation model for the movements of passengers and baggage within the passenger terminal building.

SPREADSHEET MODELS FOR TERMINAL PLANNING & DESIGN ACRP 07-04
Draft Interim Report 2-2 March 2008
EDS-SIM, Jacobs Consultancy, San Francisco, CA – a continuous simulation model focused on automated baggage screening systems.
Flow-Model, Jacobs Consultancy, San Francisco, CA – an analytical model focused on the movement of passengers and baggage from ticketing through passenger and baggage security screening.
A web search for passenger terminal simulation models yielded all of the models
shown above. In addition, the web search found information on the following models:
TRACS (Terminal, Roadway And Curbside Simulation), Transolutions, Inc. Ft. Worth, TX – A continuous flow simulation model that covers all passenger and baggage movements inside the terminal building, and covers vehicle movements on the terminal curbside.
Total AirportSim (TASM), Transolutions, Inc. Ft. Worth, TX – A single package continuous simulation model that covers all aspects of airport operations (aircraft, passengers, baggage, vehicles) within a single simulation model.
ARCPORT ALT, Aviation Research Corporation, Point Roberts, WA – A discrete event simulation model that models aircraft gate movements, passenger movements inside the terminal building, and baggage handling.
In addition to fully assembled simulation models, the web search found three
modeling systems that provide premade component modules that users can assemble to create their own custom models of specific terminal buildings:
ARENA (SIMAN) Professional, Rockwell Systems, Pittsburgh, PA WITNESS, Lanner Group, Inc., Houston, TX Automod, Applied Materials, Inc. Santa Clara, CA The web search also provided descriptions and modeling techniques used in
spreadsheet models, but the search did not yield actual ready-to-use spreadsheet models.
The FAA has made available the research it had prepared under contract
through the Volpe National Transportation Center. This research was originally envisioned to support an update to FAA guidance for terminal planning. These “white papers” have not been formally reviewed or approved by the FAA, but contain useful information, if they are updated to reflect current terminal operations practices.
The four papers that are most useful for developing spreadsheet models are:
Joel Hirsh (Hirsh Associates) “Developing a Space Program for Airport Passenger Terminals” – Provides many useful ratios for converting demand levels defined by forecasts into aircraft gate counts and sizes, passenger flow volumes and space requirements for various facilities. These ratios can readily be incorporated into a spreadsheet model. Will need updating for new guidance from Customs and Border Protection (CBP) for international facilities.

SPREADSHEET MODELS FOR TERMINAL PLANNING & DESIGN ACRP 07-04
Draft Interim Report 2-3 March 2008
Joel Hirsh (Hirsh Associates) “The Federal Inspection Services (FIS) Planning Process” – Provides a useful overview of the CBP process and provides additional useful ratios that can be incorporated into a spreadsheet model. Will need updating for new guidance from CBP for international facilities.
Phil Mein (Corgan Associates) “Developing a Space Program for Airport Terminal Buildings” – Provides several useful ratios for converting demand levels defined by forecasts in to gate counts, passenger flow volumes and space requirements for various facilities. Will need updating for security requirements and new guidance from CBP for international facilities. Places a strong emphasis on stakeholder surveys and gathering of quantitative information.
Keith Thompson (Gensler) “Developing a Space Program for Airport Passenger Terminals” – Provides a useful discussion of data sources and assembling information required to develop passenger flows and programmatic data. Also provides a description of the interplay between programming and planning/design.
In 2004, the International Air Transport Association has published “The Airport
Development Reference Manual”. This manual has a couple of sections that will provide relevant formulae for spreadsheet models. These formulae will require adjustments to accommodate some of the unique requirements for North American airport terminals. However, the concepts described in the manual provide a useful starting point of analysis.
Academic research provides additional guidance. The most concise description
of the applicability of queuing theory to the analysis of passenger flows is available in “Course Notes – Queuing Systems”, Dr. Amadeo R. Odoni, Massachusetts Institute of Technology, October 2001. These notes describe the applicability of queuing theory to transportation problems, representing flows as networks of queues, the strengths and weaknesses of using queuing models simulation based techniques.

SPREADSHEET MODELS FOR TERMINAL PLANNING & DESIGN ACRP 07-04
Draft Interim Report 2-4 March 2008
INDUSTRY SURVEY
The survey document was designed as an interactive web-based questionnaire with a series of multiple choice, and short answer questions. The purpose of this questionnaire was to gather information about modeling tools of all types that the industry is using to provide supporting analysis to the terminal planning process. The surveying activities took place during a 6 week period in October – November 2007. SURVEY SAMPLE SELECTION
A specific list of individual airport stakeholders and their contact information
was readied for use in the distribution of the 07-04 internet survey. The following industry groups were added to the key industry organizations and stakeholders list:
Airports Consultant Council (ACC) Federal Aviation Administration (FAA) Airport (AAAE, ACI) Academia (Embry Riddle, MIT, Berkeley, University of Waterloo, University of
California Institute of Transport Studies, Virginia Tech, and George Mason) The survey was distributed via email to approximately 115 key industry
organizations and stakeholders seeking their participation in the research effort. We received 20 unique responses to the TRB 07-04 questionnaire with varying degrees of information on each question. In addition, the survey has now identified a subset of the stakeholders that had interest enough in the study that we can potentially go back to these individuals for clarification or additional input if deemed necessary. The individual survey responses are summarized in Appendix B. SURVEY RESULTS
The survey identified a series of proprietary spreadsheet and simulation models for both terminal planning support, and for related areas such as analysis of roadways and airfields.
The survey identified the following simulation models not found in the literature search:
ServiceModel, Ricondo & Associates, Chicago, IL – a discrete event simulation model that evaluates the movement of inbound and outbound passengers and baggage in the passenger terminal building.
TAS, International Air Transport Association – a Mathematical Algorithm that evaluates aircraft, passenger, baggage and vehicle movements on aircraft aprons and within terminal buildings
Baggage – Systems, Transolutions, Ft. Worth, TX – a continuous simulation model for outbound baggage make-up (Automod model).

SPREADSHEET MODELS FOR TERMINAL PLANNING & DESIGN ACRP 07-04
Draft Interim Report 2-5 March 2008
AirSim, Productivity Apex, Orlando, FL – a discrete event simulation model for the passenger departure process from flight check-in through the passenger screening checkpoint (ARENA model).
Two other discrete event simulation models for passenger terminals were identified. However, the survey taker declined to provide any contact information about their models.
The surveys also identified three airport stakeholders who have an interest in the study’s findings – Seattle, Denver and Memphis. Seattle and Denver indicate they use consultants who have proprietary spreadsheet models for a variety of passenger and baggage flow applications in the terminal building.
Three sources of spreadsheet models were identified. They are by the principal
and co-principal investigators for this study.

SPREADSHEET MODELS FOR TERMINAL PLANNING & DESIGN ACRP 07-04
Draft Interim Report 2-6 March 2008
RESEARCH CONCLUSIONS
The research has found substantial documentation on the availability of simulation models and model making systems available for passenger terminal planners. Several of the simulation models available for use are based on these model making systems. Less research, most of it available in the FAA White Papers describes the spatial requirements for the sizes and configurations of the various facilities required to serve the flow of passengers and baggage inside the passenger terminal. The internet survey of models indirectly indicated the existence of consultant spreadsheet models that apply these equations and relationships described in the FAA White Papers to create terminal space programs. Academic research demonstrates the applicability of queuing theory to passenger terminal flows through use of a linked queue network. However, the research did not find applications of this technique in practice.
The research does not indicate the ready availability of tools to apply a network
of queuing models within a spreadsheet environment to provide additional detail to the equation based analyses provided within terminal space programming spreadsheet models. Therefore, this spreadsheet model development effort was focused on providing a spreadsheet environment to apply queuing theory and other modeling techniques to passenger and baggage flow problems.
COMPENDIUM OF AVAILABLE SIMULATION MODELS
The following models are commercially available for use by terminal planners and designers to support terminal space programs or validate alternative plans and designs:
PAXSIM, Boeing (Preston Group), Melbourne, VIC, Australia – a continuous simulation model for the movements of passengers and baggage within the passenger terminal building.
EDS-SIM, Jacobs Consultancy, San Francisco, CA – a continuous simulation model focused on automated baggage screening systems.
Flow-Model, Jacobs Consultancy, San Francisco, CA – an analytical model focused on the movement of passengers and baggage from ticketing through passenger and baggage security screening.
TRACS (Terminal, Roadway And Curbside Simulation), Transolutions, Inc. Ft. Worth, TX – A continuous flow simulation model that covers all passenger and baggage movements inside the terminal building, and covers vehicle movements on the terminal curbside.
Total AirportSim (TASM), Transolutions, Inc. Ft. Worth, TX – A single package continuous simulation model that covers all aspects of airport operations (aircraft, passengers, baggage, vehicles) within a single simulation model.
CAST, Airport Research Center, GmbH. Aachen, Germany – CAST Terminal is a multi-agent airport terminal simulator that offers a three-dimensional modeling environment that covers the entire passenger terminal building.

SPREADSHEET MODELS FOR TERMINAL PLANNING & DESIGN ACRP 07-04
Draft Interim Report 2-7 March 2008
ARCport ALT, Aviation Research Corporation, Point Roberts, WA – A discrete event simulation model that models aircraft gate movements, passenger movements inside the terminal building, and baggage handling.
ServiceModel, Ricondo & Associates, Chicago, IL – a discrete event simulation model that evaluates the movement of inbound and outbound passengers and baggage in the passenger terminal building.
TAS, International Air Transport Association – a Mathematical Algorithm that evaluates aircraft, passenger, baggage and vehicle movements on aircraft aprons and within terminal buildings
Baggage – Systems, Transolutions, Ft. Worth, TX – a continuous simulation model for outbound baggage make-up (Automod model).
AirSim, Productivity Apex, Orlando, FL – a discrete event simulation model for the passenger departure process from flight check-in through the passenger screening checkpoint (ARENA model).
In addition to these simulation models, the following modeling systems provide premade modules that represent passenger terminal facilities and provide tools to assemble these modules into custom simulations:
ARENA (SIMAN) Professional, Rockwell Systems, Pittsburgh, PA WITNESS, Lanner Group, Inc., Houston, TX Automod, Applied Materials, Inc. Santa Clara, CA
The remaining models identified in the research did not indicate their
commercial availability or did not provide contact information for the model’s author and sponsoring organization.

Chapter Three
Modeling Approach & Design

SPREADSHEET MODELS FOR TERMINAL PLANNING & DESIGN ACRP 07-04
Final Report 3-1 August 2009
CHAPTER THREE
MODELING APPROACH & DESIGN MODEL USES
Quantitative information about facility requirements is usually needed during three different portions of the terminal development process.
Preparing preliminary facility needs analyses prior to the initiation of more formal terminal planning process that involves extensive consultations and negotiations with stakeholders
Computing terminal facility requirements that support a terminal space program developed during a terminal planning process
Confirming planning and design assumptions or testing a proposed design. Generally, as the terminal planning process moves from conceptual planning
through design the level of detail of analysis increases. The spreadsheet models are also usable for independent studies of more
isolated passenger flow and demand versus capacity issues that may not be part of a larger terminal planning and design process. These could include assessments of changes to technology or procedures that change the efficiency of various terminal functions, changes to airline customer service models, facility staffing levels, unique events that generate large volumes of unscheduled flights (such as bowl games) or the effect of airline schedule changes on facility utilization, queues, or waiting times.
The combination of operational data, passenger characteristics, level-of-service
standards and terminal configuration drive the space program and a terminal design.
This chapter presents the modeling approach presented to the ACRP 07-04
Project Panel in the interim report. The panel review of the interim report resulted in changes to the modeling approaches and techniques in each of the analysis areas. As a result, the final models do not necessarily follow the descriptions in this chapter. The changes recommended by the Project Panel are briefly described in Chapter 4, while the final description of each module is presented the Spreadsheet Models User’s Guide presented in Appendix C.
MODELING OVERVIEW
Ideally, the modeling structure within the spreadsheet environment should have the ability to increase the level of detail as the planning process proceeds from assessing preliminary needs to computing terminal facility requirements through confirming planning and design assumptions through testing a proposed design. The models must support simple and fast computations (perhaps within a single
SPREADSHEET MODELS FOR TERMINAL PLANNING & DESIGN ACRP 07-04
Final Report 3-2 August 2009
spreadsheet) to prepare preliminary analyses that might occur in advance of a formal terminal planning program. Subsequent analyses must provide the quantitative assessments of terminal passenger and baggage flow that support specific line items within a terminal space program. Analyses that evaluate specific designs may divide individual areas into sub-models that provide information that validates individual segments as well as the over all system of flows.
Not all terminal analyses should be addressed within the spreadsheet modeling
environment. As the planning process progresses and the level of detail increases, the planner may choose to confirm spreadsheet model findings with more detailed simulation modeling. Generally, the following situations require use of more detailed simulation models:
Queues from one area exceed the area allocated for them and block other functions (such as passenger security screening queue extending into a flight check-in area). Spreadsheet models do not provide information about these complex interactions between terminal spaces.
The spreadsheet models do not provide sufficient detail to differentiate between alternatives
The capacity of a particular process is not known and the simulation model is required to compute the capacity of the process
The planner needs the animations produced by a simulation model to provide a proof of concept (validation that a particular design will function as planned) to various stakeholders.
Spreadsheet models should cover the following three principal passenger flows within the passenger terminal building:
Departing passengers Domestic arriving passengers (connecting and destination) International arriving passengers (connecting and destination)
The modeling system chosen for the spreadsheet models should support the
scalability demanded by the terminal planning process. Specifically, the approach relies on four types of spreadsheet modules that represent various passenger terminal functions:
Models which represent passenger or baggage waiting (queues) for specific service providing functions
Models which represent the accumulation of passengers or baggage, at specific points in the terminal that are not waiting on a service providing function.
Models that represent passenger choices between types of services (split of flows to different service functions)
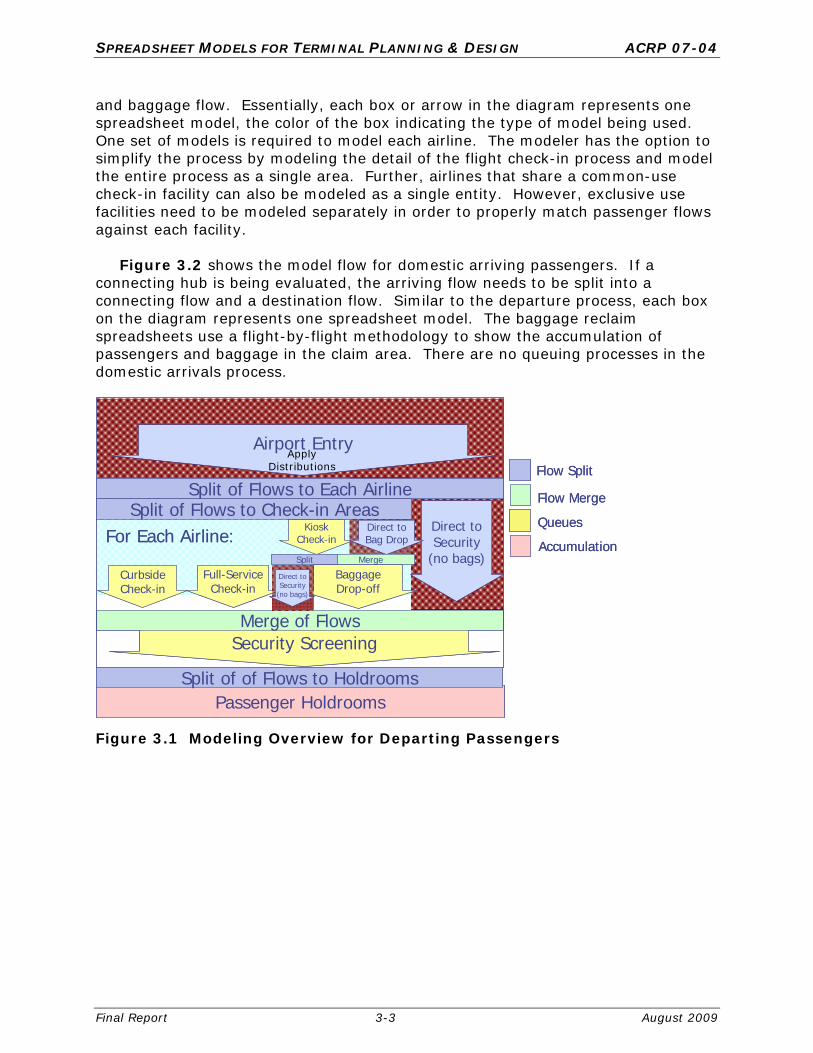
Models that represent the merger of flows from multiple service functions Figure 3.1 shows a representation of a departure level of a large terminal that
demonstrates the split, merge, queue, and accumulation functions within the passenger flow. All four model types are used in modeling the departing passenger
SPREADSHEET MODELS FOR TERMINAL PLANNING & DESIGN ACRP 07-04
Final Report 3-3 August 2009
and baggage flow. Essentially, each box or arrow in the diagram represents one spreadsheet model, the color of the box indicating the type of model being used. One set of models is required to model each airline. The modeler has the option to simplify the process by modeling the detail of the flight check-in process and model the entire process as a single area. Further, airlines that share a common-use check-in facility can also be modeled as a single entity. However, exclusive use facilities need to be modeled separately in order to properly match passenger flows against each facility.
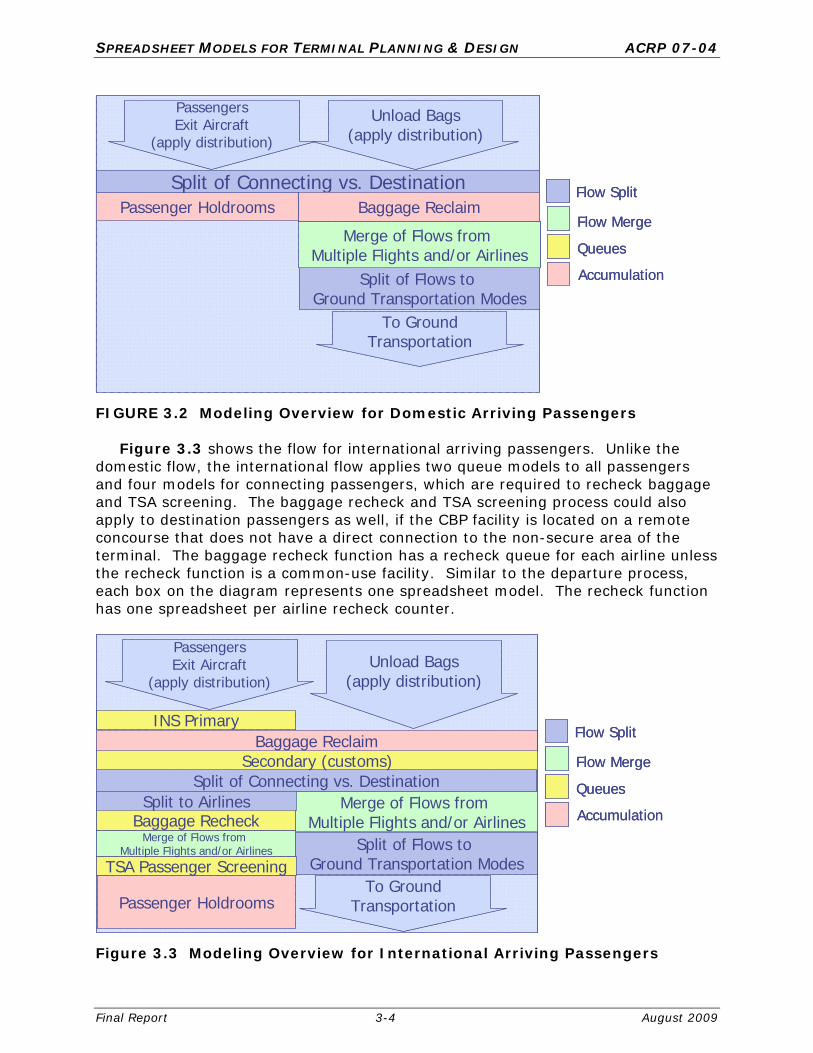
Figure 3.2 shows the model flow for domestic arriving passengers. If a
connecting hub is being evaluated, the arriving flow needs to be split into a connecting flow and a destination flow. Similar to the departure process, each box on the diagram represents one spreadsheet model. The baggage reclaim spreadsheets use a flight-by-flight methodology to show the accumulation of passengers and baggage in the claim area. There are no queuing processes in the domestic arrivals process.
Queues
Passenger Holdrooms
Airport Entry
CurbsideCheck-in
Full-ServiceCheck-in
KioskCheck-in
Direct toSecurity
(no bags)
Security Screening
BaggageDrop-off
Direct toBag Drop
Merge of Flows
Split of Flows to Each AirlineSplit of Flows to Check-in Areas
Flow Split
Flow Merge
Queues
Accumulation
Direct toSecurity
(no bags)
For Each Airline:MergeSplit
Split of of Flows to Holdrooms
Queues
Passenger Holdrooms
Airport Entry
CurbsideCheck-in
Full-ServiceCheck-in
KioskCheck-in
Direct toSecurity
(no bags)
Security Screening
BaggageDrop-off
Direct toBag Drop
Merge of Flows
Split of Flows to Each AirlineSplit of Flows to Check-in Areas
Flow Split
Flow Merge
Queues
Accumulation
Direct toSecurity
(no bags)
For Each Airline:MergeSplit
Split of of Flows to Holdrooms
Figure 3.1 Modeling Overview for Departing Passengers
Apply Distributions
SPREADSHEET MODELS FOR TERMINAL PLANNING & DESIGN ACRP 07-04
Final Report 3-4 August 2009
Split of Flows to Ground Transportation Modes
Passenger Holdrooms
PassengersExit Aircraft
(apply distribution)
Merge of Flows from Multiple Flights and/or Airlines
Flow Split
Flow Merge
Queues
Accumulation
Split of Connecting vs. Destination
Unload Bags(apply distribution)
Baggage Reclaim
To GroundTransportation
FIGURE 3.2 Modeling Overview for Domestic Arriving Passengers Figure 3.3 shows the flow for international arriving passengers. Unlike the
domestic flow, the international flow applies two queue models to all passengers and four models for connecting passengers, which are required to recheck baggage and TSA screening. The baggage recheck and TSA screening process could also apply to destination passengers as well, if the CBP facility is located on a remote concourse that does not have a direct connection to the non-secure area of the terminal. The baggage recheck function has a recheck queue for each airline unless the recheck function is a common-use facility. Similar to the departure process, each box on the diagram represents one spreadsheet model. The recheck function has one spreadsheet per airline recheck counter.
Split of Flows to Ground Transportation Modes
Passenger Holdrooms
PassengersExit Aircraft
(apply distribution)
Merge of Flows from Multiple Flights and/or Airlines
Flow Split
Flow Merge
Queues
Accumulation
Split of Connecting vs. Destination
Unload Bags(apply distribution)
Baggage Reclaim
To GroundTransportation
INS Primary
Secondary (customs)
Baggage Recheck
TSA Passenger Screening
Split to Airlines
Merge of Flows from Multiple Flights and/or Airlines Split of Flows to
Ground Transportation Modes
Passenger Holdrooms
PassengersExit Aircraft
(apply distribution)
Merge of Flows from Multiple Flights and/or Airlines
Flow Split
Flow Merge
Queues
Accumulation
Split of Connecting vs. Destination
Unload Bags(apply distribution)
Baggage Reclaim
To GroundTransportation
INS Primary
Secondary (customs)
Baggage Recheck
TSA Passenger Screening
Split to Airlines
Merge of Flows from Multiple Flights and/or Airlines
Figure 3.3 Modeling Overview for International Arriving Passengers
SPREADSHEET MODELS FOR TERMINAL PLANNING & DESIGN ACRP 07-04
Final Report 3-5 August 2009
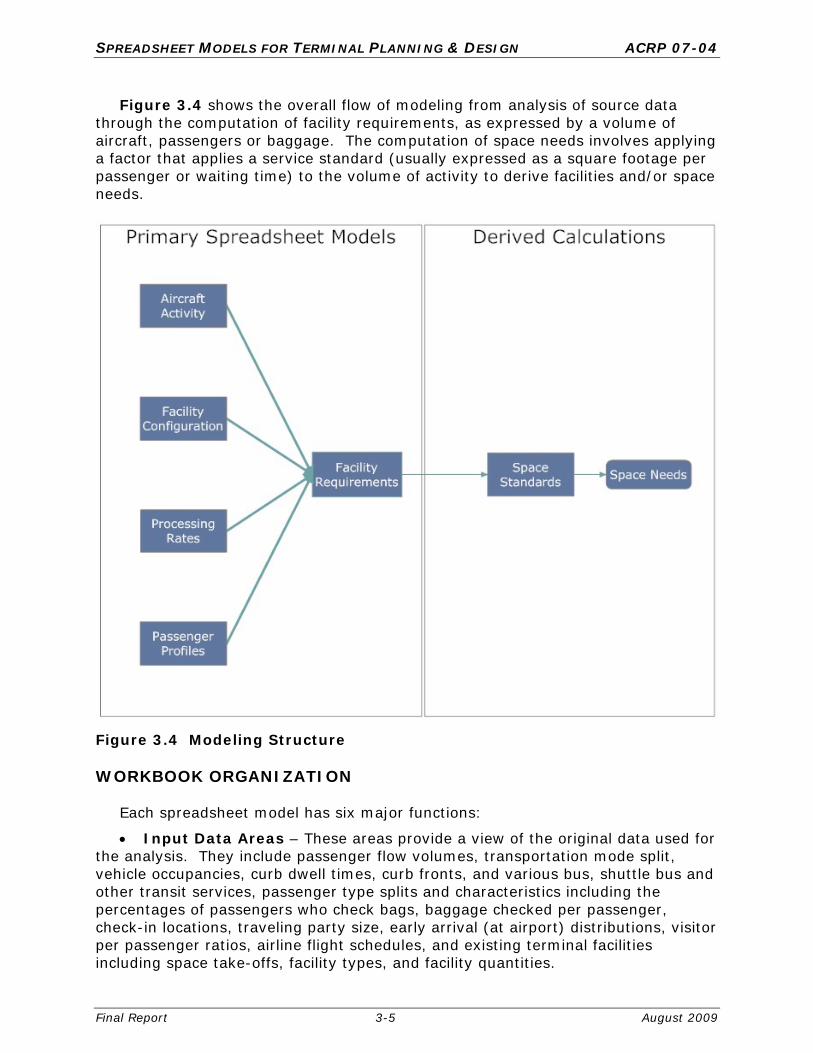
Figure 3.4 shows the overall flow of modeling from analysis of source data through the computation of facility requirements, as expressed by a volume of aircraft, passengers or baggage. The computation of space needs involves applying a factor that applies a service standard (usually expressed as a square footage per passenger or waiting time) to the volume of activity to derive facilities and/or space needs.
Figure 3.4 Modeling Structure WORKBOOK ORGANIZATION
Each spreadsheet model has six major functions:
Input Data Areas – These areas provide a view of the original data used for the analysis. They include passenger flow volumes, transportation mode split, vehicle occupancies, curb dwell times, curb fronts, and various bus, shuttle bus and other transit services, passenger type splits and characteristics including the percentages of passengers who check bags, baggage checked per passenger, check-in locations, traveling party size, early arrival (at airport) distributions, visitor per passenger ratios, airline flight schedules, and existing terminal facilities including space take-offs, facility types, and facility quantities.

SPREADSHEET MODELS FOR TERMINAL PLANNING & DESIGN ACRP 07-04
Final Report 3-6 August 2009
Planning Factors (Constants) Areas – These areas provide a view of the values that may or may not change between analyses, but provide critical understanding of assumptions and analyses. These include passenger flow rates through screening checkpoints, baggage flow rates, moving walkway speeds and service standards (passenger density and process/wait times). The values of these factors need review and calibration at each terminal to confirm whether the ratios are representative for the terminal in question.
Report Areas – These areas draw upon the Analytical engines to produce readable analyses that include the appropriate totals and subtotals and graphs/charts.
Analytical Engines – These areas are where the main modeling occurs, where various input data are combined through formulas to produce terminal space and facility needs. These areas may have more of a database organization with regular columns and rows. They provide an easy data manipulation environment where rows and columns are easily added with the drag and drop capabilities of MS Excel.
Audits – These areas provide data that checks the integrity of the analytical engines through comparisons of key cells back to input data and constants areas and compares the appropriate row and column totals.
Documentation – These areas provides basic information on how to use the Input, Planning Factors, Report, and Audit areas and provides reference links to the User’s Guide. Other documentation will be imbedded in the spreadsheet using the comment features of MS Excel. MODELING TECHNIQUES
As described in the previous section, the spreadsheet models use either queuing models or accumulation models to describe passenger flows through the terminal. Models that either split passenger flows into multiple streams or merge multiple streams into a single stream provide the linkages between the primary models. Queuing Models
Queuing analysis applies a capacity constraint to a defined flow and computes the processed flow, the accumulation of unprocessed flow, and the delay associated with the unprocessed flow. Figure 3.5 describes the basic structure of a queuing model.
Queuing models usually operate on a time increment. Most models use an
increment between one and fifteen minutes. Using a smaller time increment increases the model’s precision. However, using increments smaller than the average service time of the facility does not increase model precision. The spreadsheet queuing models produced by this research use five and ten minute time increments.
The spreadsheet models using queuing analyses to evaluate the following processes:

SPREADSHEET MODELS FOR TERMINAL PLANNING & DESIGN ACRP 07-04
Final Report 3-7 August 2009
Flight Check-In o Curbside Check-In o Kiosk Check-In o Baggage Drop-Off (not included in final models) o Full-Service Check-In
Passenger Screening Baggage Screening (not a queuing model in the final models) International Arrivals
o Primary CBP Screening o Baggage Recheck (not included in final models) o Passenger Rescreening (not included in final models)
C C C C C
Queue
C
C
C
CC
Capacity
OutboundFlow
InboundDemand
Figure 3.5 Queue Model Schematic The source data analysis of aircraft activity is usually an airline flight schedule
and airline or airport information on percentage of seats filled (load factor). The next step is to apply an early arrival distribution to this load to compute the passenger arrival times at the airport. These distributions are computed based on passenger surveys, or are available from the airlines. These flight-by-flight distributions are summed for each airline to create a composite distribution for analysis of flight check-in, passenger screening and baggage screening. Percentage of flow factors divide this flow to the various types of flight-check-in facilities.
The queuing model evaluates the flow of passengers in each time increment and
determines the passengers that were processed and the passengers that were delayed to the next increment. The model computes the accumulation of passengers and the total delay time for each time increment.
Queuing models provide several advantages over more sophisticated simulation
type models:
Greatly simplify real world situations Demonstrate benefits relative to baseline conditions

SPREADSHEET MODELS FOR TERMINAL PLANNING & DESIGN ACRP 07-04
Final Report 3-8 August 2009
Provide fast answers that rank alternative solutions from least to most beneficial
Are most beneficial when a large number of different conditions need to be evaluated
Are cost efficient analysis tools Can be the basis of economic analysis
Queuing models are appropriate for the following situations in the planning of
passenger terminals:
Capacity rates are known or readily estimated Queues are independent of other flows High accuracy is not needed to differentiate between alternatives Animations are not necessary to demonstrate the viability of proposed
solutions
However, there are some situations where the queuing model approach will no longer provide sufficient accuracy:
Capacity rates are not known and must be computed by the model Spatial relationships inside the terminal building cause queues block other
flows creating complex interactions High accuracy is needed to differentiate between alternatives Must have animations to demonstrate the viability of proposed solutions
Figure 3.6 shows that queuing and simulation models have similar data needs.
The principal difference is that queuing models use an externally provided processing rate while simulation models internally calculate capacity. Both types of models then apply the capacity rate to compute delay (waiting time).
Queuing Models
Simulation Models
ExternalCapacity Calculation
Operational DataFAA Data
ObservationsInterviews
InternalDelay Calculation
Demand DataOAGFAA
Forecasts
InternalDelay Calculation
Demand DataOAGFAA
Forecasts
InternalCapacity Calculation
Operational DataFAA Data
ObservationsInterviews
Queuing Models
Simulation Models
ExternalCapacity Calculation
Operational DataFAA Data
ObservationsInterviews
ExternalCapacity Calculation
Operational DataFAA Data
ObservationsInterviews
InternalDelay Calculation
Demand DataOAGFAA
Forecasts
InternalDelay Calculation
Demand DataOAGFAA
Forecasts
InternalDelay Calculation
Demand DataOAGFAA
Forecasts
InternalDelay Calculation
Demand DataOAGFAA
Forecasts
InternalCapacity Calculation
Operational DataFAA Data
ObservationsInterviews
InternalCapacity Calculation
Operational DataFAA Data
ObservationsInterviews
Figure 3.6 Differences between Modeling Techniques

SPREADSHEET MODELS FOR TERMINAL PLANNING & DESIGN ACRP 07-04
Final Report 3-9 August 2009
Accumulation Models
Accumulation models monitor the arrival and departure flows from a space and report count of waiting passengers, bags or aircraft, depending on the flow being evaluated. The spreadsheet models use accumulation analysis to evaluate the following terminal areas:
Aircraft at gates Passengers in gate holdrooms (not included in the final models) Baggage in outbound baggage Passengers and baggage at baggage reclaim
The net waiting flow becomes the basis for facility needs. The model will use
flow time offsets, where a fixed time is added to the arrival or departure time to provide a minimum resource usage requirement. This is most important for aircraft gates where activities occur prior to aircraft arrival and after aircraft departure. In addition, this time accounts for the variability of actual aircraft gate arrival and departure times versus scheduled times. Figure 3.7 provides an example of an accumulation model.
Figure 3.7 Example Accumulation Model
AA and AA Eagle Gate Requirementswith 20 minute inter-gate use times
-123456789
10111213141516171819202122232425262728293031
- 1 2 3 4 5 6 7 8 9 10 11 12 13 14 15 16 17 18 19 20 21 22 23
Time of Day
Nu
mb
er
of
Ga
tes
AA no RON
AX no RON
AA & AX w/RON
Current Gates

SPREADSHEET MODELS FOR TERMINAL PLANNING & DESIGN ACRP 07-04
Final Report 3-10 August 2009
SOURCE DATA ANALYSIS
The spreadsheet models combine information about existing or future aircraft activity, passenger characteristics and volumes (profiles), facility configurations and processing rates to compute existing or future terminal facility required to support a given volume of passenger and aircraft activity. Subsequent analyses apply service standards (usually defined by a space per passenger metric or waiting time) to the facility requirements in order to define the volume of terminal space required to directly support a particular function.
The spreadsheet models provide the templates for organizing data about each of
four main data areas:
Passenger Profiles Aircraft Activity Facility Descriptions Processing Rates
The models have default values for passenger profiles and processing rates,
when facility specific information is not available. Default values should be used with caution and are best used only in the preliminary analysis stage of the planning process to create initial estimates of space requirements. Passenger Profiles
Just as important as the total volume of passengers that use the airport is an
understanding of how they use the airport. The spreadsheet models provide default passenger characteristics. However, use of the default values beyond the preliminary analysis of needs stage of planning risks making significant errors in providing appropriate levels of passenger service facilities.
Key passenger profile data in the spreadsheet models are:
Passenger early arrival at the airport Mode of transportation to the airport Percent of passengers using various check-in modes (internet, full-service,
kiosk, customer service counters) Percent of passengers checking bags Bags checked per passenger Travel party size Well-wishers and greeters per passenger These characteristics vary by whether passengers are traveling international
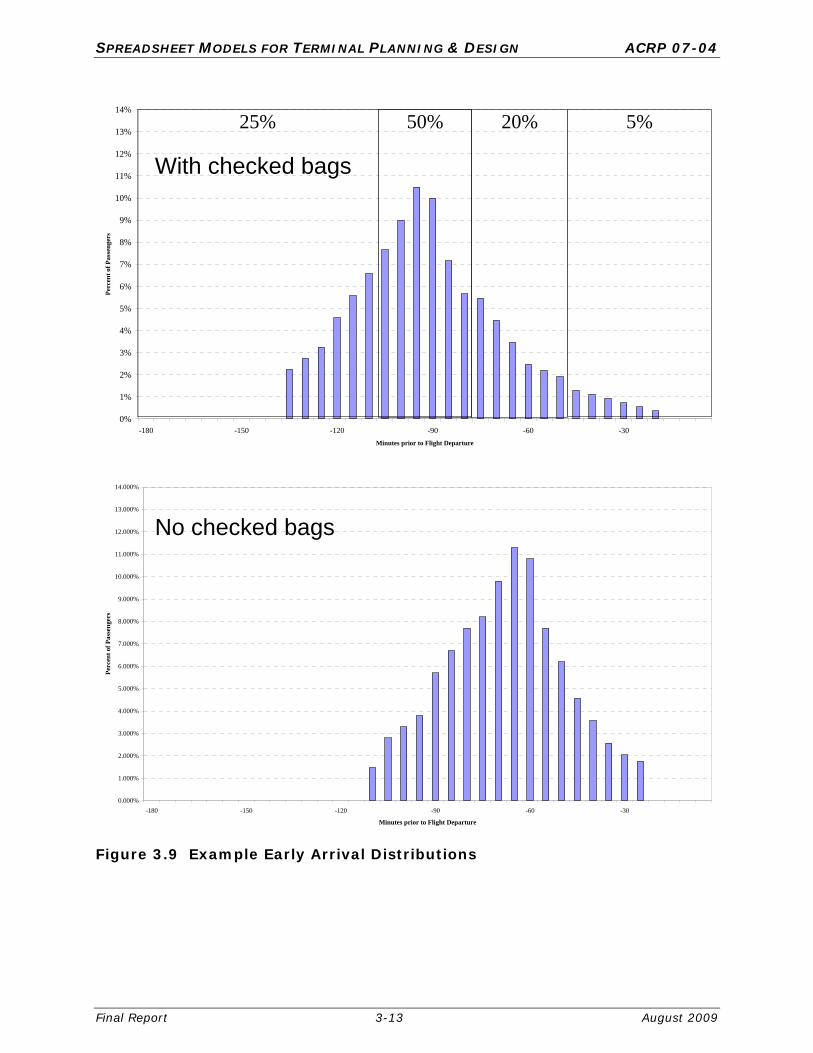
versus domestically. In addition, the profile of early arrival at the airport varies by time of day and by whether passengers are checking baggage. Characteristics will also vary substantially by airline.

SPREADSHEET MODELS FOR TERMINAL PLANNING & DESIGN ACRP 07-04
Final Report 3-11 August 2009
Passenger characteristics information is best gathered through surveys of airlines and of the passengers themselves. Airline surveys will provide:
Percent of passengers checking bags Bags checked per passenger Travel party size Percent of passengers using various check-in modes (kiosk, curbside,
internet, full-service, customer service counters) Passenger surveys are the best source for:
Mode of travel to the airport Well-wishers and greeters per passenger Passenger early arrival at the airport The spreadsheet models provide areas where passenger profile information can
be entered. The terminal planner will have the responsibility to gather the data and process it for the model. Figures 3.8 and 3.9 provide examples of the passenger profile data from Baltimore-Washington Airport. Figure 3.10 shows an example of the effect an early arrival distribution has on the timing of passenger flows.

SPREADSHEET MODELS FOR TERMINAL PLANNING & DESIGN ACRP 07-04
Final Report 3-12 August 2009
Figure 3.8 Example Passenger Profile Data
BWI Airline
Percent Checking
Bags
Percent Direct to Security
Bags Checked per Checking Passenger
AA 66% 34% 1.1 AC 44% 56% 0.7 BA 95% 5% 1.7 CO 95% 5% 1.0 DL 97% 3% 1.3 F9 82% 18% 1.4 FI 95% 5% 1.7 FL 83% 17% 1.3 HP 81% 19% 1.2 JM 100% 0% 2.0 NW 89% 11% 1.1 U5 97% 3% 2.2 UA 73% 27% 1.0 US 58% 42% 0.8 WN 71% 29% 1.0 YX 62% 38% 0.7
All Airlines 66% 34% 1.2
Surveyed Flow
Share Volume Percent Volume Percent Volume % Curb Percent Total%
AA American 25 2,700 6.3% 90.0% 2,430 824 34% 1,124 46% 482 30% 20% 100%AC Air Canada 4 200 0.5% 90.0% 180 101 56% 79 44% - 0% 0% 100%BA British 1 189 0.4% 90.0% 170 9 5% 161 95% - 0% 0% 100%CH Charters - - 0.0% 90.0% - - 0% - 100% - 0% 0% 100%CO Continental 13 1,125 2.6% 90.0% 1,013 53 5% 960 95% - 0% 0% 100%DL Delta 25 2,529 5.9% 90.0% 2,276 65 3% 1,548 68% 663 30% 29% 100%FI Icelandic 1 202 0.5% 90.0% 182 8 5% 173 95% - 0% 0% 100%FL Air Tran 43 5,171 12.0% 90.0% 4,654 780 17% 3,099 67% 775 20% 17% 100%F9 Frontier 1 132 0.3% 90.0% 119 21 18% 98 82% - 0% 0% 100%GH Ghana - - 0.0% 90.0% - - 0% - 100% - 0% 0% 100%HP Am. West 5 672 1.6% 90.0% 605 117 19% 390 64% 98 20% 16% 100%JM Jamaican 1 187 0.4% 90.0% 168 - 0% 168 100% - 0% 0% 100%MI AMC - - 0.0% 90.0% - - 0% - 100% - 0% 0% 100%MX Mexicana 1 150 0.3% 90.0% 135 - 0% 135 100% - 0% 0% 100%New New Airline - - 0.0% 90.0% - - 20% - 80% - 0% 0% 100%NW Northwest 13 1,662 3.9% 90.0% 1,496 160 11% 1,069 71% 267 20% 18% 100%PN Pan Am - - 0.0% 90.0% - - 0% - 100% - 0% 0% 100%UA United 16 2,302 5.3% 90.0% 2,072 563 27% 1,207 58% 302 20% 15% 100%US US Airways 27 2,308 5.4% 90.0% 2,077 869 42% 967 47% 242 20% 12% 100%WN Southwest 169 23,138 53.7% 90.0% 20,824 6,024 29% 10,360 50% 4,440 30% 21% 100%YX Air Midwest 3 96 0.2% 90.0% 86 33 38% 54 62% - 0% 0% 100%E9 Pan Am Clipper Connection - - 0.0% 90.0% - - 43% - 57% - 0% 0% 100%
U5 USA 3000 Airlines 2 336 0.8% 90.0% 302 - 0% 302 100% - 0% 0% 100%
All All Airlines 350 43,099 100% 90% 38,789 9,629 25% 21,892 56% 7,268 25% 19%
Assumed Peak Load Factor of 90%Flight pattern based on March 2006 OAGFlight Schedule informationComputed Field2005 Passenger SurveyPlanning Assumptions
Notes:
Included Airlines
2006 Weekday Passengers - One Way Departure Flow
2006 Load
Factor
Total Daily
Seats
2006
Flights
Total Daily
Passengers
CurbsideDirect to Security Check-in
Passengers Limo Taxi
Rental
Car
Private
Car Rail Bus/Van Other
Total
Cars
Total
Transit
Local Residents 17% 6% 1% 68% 2% 3% 2% 95% 5%Visitors 14% 11% 18% 39% 4% 12% 2% 84% 16%
All Passengers 16% 9% 9% 55% 3% 7% 2% 90% 10%
SPREADSHEET MODELS FOR TERMINAL PLANNING & DESIGN ACRP 07-04
Final Report 3-13 August 2009
Figure 3.9 Example Early Arrival Distributions
0%
1%
2%
3%
4%
5%
6%
7%
8%
9%
10%
11%
12%
13%
14%
-180 -150 -120 -90 -60 -30
Minutes prior to Flight Departure
Per
cen
t of
Pas
sen
gers
50%25% 20% 5%
0.000%
1.000%
2.000%
3.000%
4.000%
5.000%
6.000%
7.000%
8.000%
9.000%
10.000%
11.000%
12.000%
13.000%
14.000%
-180 -150 -120 -90 -60 -30
Minutes prior to Flight Departure
Per
cen
t of
Pas
sen
gers
With checked bags
No checked bags

SPREADSHEET MODELS FOR TERMINAL PLANNING & DESIGN ACRP 07-04
Final Report 3-14 August 2009
Figure 3.10 Early Arrival Distributions Applied to Flight Demand
Prepared by Landrum & Brown
Draft, 3/15/2005
C:\MHL\D-Data\BWI\FIBBS\Security_2008\[F9 EARLY ARRIVAL 90.XLS]Chart1 W-TB
Baltimore Washington International Airport Frontier Airlines (2008 Forecast) Figure
Terminal Passenger Flow Analysis Early Passenger Arrival at Terminal Summary 1-1
-
10
20
30
40
50
60
70
80
90
100
- 1 2 3 4 5 6 7 8 9 10 11 12 13 14 15 16 17 18 19 20 21 22 23
Time of Day
Nu
mb
er o
f P
eop
le p
er 5
Min
ute
Per
iod
Boarding PassengersPassengers into Building
Prepared by Landrum & Brown
Draft, 3/15/2005
C:\MHL\D-Data\BWI\FIBBS\Security_2008\[AA EARLY ARRIVAL 90.XLS]Chart1 W-TB
Baltimore Washington International Airport American Airlines (2008 Forecast) Figure
Terminal Passenger Flow Analysis Early Passenger Arrival at Terminal Summary 1-1
-
10
20
30
40
50
60
70
80
90
100
110
120
130
140
- 1 2 3 4 5 6 7 8 9 10 11 12 13 14 15 16 17 18 19 20 21 22 23
Time of Day
Nu
mb
er o
f P
eop
le p
er 5
Min
ute
Per
iod
Boarding PassengersPassengers into Building

SPREADSHEET MODELS FOR TERMINAL PLANNING & DESIGN ACRP 07-04
Final Report 3-15 August 2009
Aircraft Activity
The level of aircraft activity defines some of the most important facility requirements in the passenger terminal. In addition, peak period passenger volumes are also a function of the seating capacity of the aircraft using the terminal.
Aircraft activity is defined in one of two ways. First is through a simple statistical description of flight activity, and second is through a pro forma aircraft flight schedule. The simple statistical description is easier to describe to the model, while the pro forma flight schedule provides the detail required to perform queuing analysis. The simple statistical descriptions are useful for preliminary analyses while the detail provided by the pro forma schedule is better for supporting space programming efforts and validating conceptual layouts.
Schedules for existing demand are usually available from the Official Airline Guide (OAG). These will need correcting for non-scheduled activity such as charters. Choosing the correct day for a flight schedule takes analysis of monthly activity statistics from the airport operator and daily flight activity over a month’s time from either the FAA or OAG. The chosen day should be representative of activity for either the Peak Month Average Day, or a mode day (most frequently occurring day) such as a Peak Month Average Weekday (PMAWD).
If flight schedule information is not available, fairly detailed information about
the volume of aircraft activity is available from the FAA web site (http://apo.faa.gov). A user name and password are required to access the data, but these are available from the FAA at no charge.
The FAA website provides data on flight activity by 15 minute periods. This
information provides data to support peak hour levels of aircraft activity, but it does not provide detail on airline or aircraft mix.
The spreadsheet models provide templates for handling OAG data. These
templates convert the OAG data into the format required to analyze gate needs, and volumes of seats. On-board passenger load factors are used to define passenger volumes.
The basic analysis technique is to convert flight schedule information into counts
of activity (passengers or aircraft) by 10 minute buckets. These bucket distributions are created for each type of activity (domestic and international mainline and regional). An example of conversion of a flight schedule to a bucket format is shown in Figure 3.11. Using a bucket format to represent data about the time based movement of aircraft, passengers or bags allows easy computation of rates, and direct comparison of demand rates to capacity rates.
An alternate method to directly enter peak hour passenger volumes and aircraft
movements will be available to provide a simplified analysis mode.

SPREADSHEET MODELS FOR TERMINAL PLANNING & DESIGN ACRP 07-04
Final Report 3-16 August 2009
Figure 3.11 Example Pro Forma Flight Activity Schedule & Representation of Activity in Bucket List Format
Origin Dest Carrier Operator Seats Dep Time Ops
Decimal
Time Bucket
BWI CLT US US 126 5:30 1 330 33BWI CUN U5 U5 168 6:00 1 360 36BWI CVG DL OH 70 6:00 1 360 36BWI DEN UA UA 182 6:00 1 360 36BWI PHL US ZW 50 6:00 1 360 36BWI PIT US AX 50 6:00 1 360 36BWI ATL DL DL 142 6:05 1 365 36BWI LGA US RP 50 6:10 1 370 37BWI ORD UA UA 138 6:10 1 370 37BWI IAH CO CO 124 6:15 1 375 37BWI MIA AA AA 188 6:16 1 376 37BWI DFW AA AA 188 6:20 1 380 38BWI DTW NW NW 182 6:21 1 381 38BWI ATL FL FL 117 6:30 1 390 39BWI YYZ AC QK 50 6:30 1 390 39BWI SDF WN WN 137 6:40 1 400 40
0 0 0 0 70 0 0 0 0 00 0 0 0 142 0 0 0 0 00 0 0 0 0 0 0 0 0 0
188 0 0 124 0 0 0 0 0 0188 0 0 0 0 0 0 0 0 0
0 0 0 0 0 0 0 0 0 00 50 0 0 0 0 117 0 0 00 0 0 0 0 0 0 0 0 00 0 0 0 0 0 0 0 0 00 0 0 50 0 0 117 0 0 00 0 0 0 50 0 0 0 0 00 0 0 50 0 0 0 0 0 0
232 0 0 0 0 0 117 0 0 1500 0 0 0 0 0 117 0 0 00 0 0 0 0 0 137 0 0 00 0 0 0 0 0 0 0 0 00 0 0 0 0 0 0 0 0 0
136 0 0 0 0 0 117 0 0 00 0 0 0 183 0 0 0 0 124
AA AC BA CO DL FI FL F9 GH HP
72737475767778798081828384858687888990
bucket

SPREADSHEET MODELS FOR TERMINAL PLANNING & DESIGN ACRP 07-04
Final Report 3-17 August 2009
Processing Rates
The spreadsheet models use processing rates define the efficiency of various facilities including:
Flight check-in facilities including curbside, kiosk, full-service, and baggage drop-off
Passenger screening checkpoint lanes and ID checkpoints Baggage screening facilities
Default rates provided in the spreadsheet models will be based on observations
made at the test airports and will likely be suitable for many applications. However, the terminal planner will need to understand those factors that are likely to vary the rates. Facility Configurations
Information about the number and configuration of facilities is based on floor
plans or direct observations. Configurations of facilities directly affect their efficiency (processing rates). As an example, increasing the number of divestment tables ahead of the passenger screening checkpoint allows multiple passengers queue up and assemble their possessions for the X-Ray machines, which increases machine throughput.
The spreadsheet models will provide an input tab that allows entry of data on
the number of units and the processing rate per unit. Example facility configuration data is summarized in Figure 3.12. Facility Descriptions
Facility BC CD DE Total
Curbside 6 4 2 12 Ticketing 72 72 36 180 Bag Screening ETD 10 14 6 30 Bag Screening Stand Alone EDS 2.67 6.00 4.67 13 Bag Screening In-Line EDS 4 4 3 11 Bag Claim Units 4 3 2 9 Bag Claim Frontage 940 700 280 1,920 Bag Claim Area 7,136 5,294 5,451 17,881 New Bag Claim Area 8,636 6,794 5,451 20,881 Screening Checkpoint
Security Lanes
Concourse D Security 9 9 Concourse C Security 7 7
Quantity
Figure 3.12 Example Facility Data from Baltimore-Washington Airport

SPREADSHEET MODELS FOR TERMINAL PLANNING & DESIGN ACRP 07-04
Final Report 3-18 August 2009
PRIMARY FUNCTIONAL MODULES
The spreadsheet models support the analysis of passenger flows for two major areas of the terminal: landside and airside. Although Figure 3.13 shows analysis of curbside areas, these analyses are direct extensions by factors of modeling that supports terminal landside functions. The organization of areas shown in Figure 3.13 is proposed to be the primary layout for a set of menus to access the various models.
Not all analysis areas require application of a queuing or accumulation model.
These areas accommodate the identical flow or a direct percentage of the flow. Thus a factor can be used to define the appropriate level of facility need based on the analysis of the primary flow.
Landside Areas
Landside includes all of those areas that accept departing passenger flows from
ground transportation and provides the services that handles the processing of flight documentation (ticketing, boarding passes, and baggage tagging), and the services that handle security (passenger and baggage screening and inspection). Landside also includes the areas that accept arriving passenger flows from the airside concourses and provides the services for passengers to reclaim baggage and find ground transportation services. In addition, the landside also includes the process for the screening and inspection of documents and baggage for international arriving passengers.
Airside Areas
Airside includes the areas where passengers board and disembark from aircraft,
waiting areas, and aircraft parking areas.

SPREADSHEET MODELS FOR TERMINAL PLANNING & DESIGN ACRP 07-04
Final Report 3-19 August 2009
Terminal Planning
Curbside Landside Airside
Arrival DeparturesDomestic Arrivals
Departures
Claim Check-in
PassengerScreening
Baggage Screening
Gates
Outbound Baggage
Inbound Baggage
Greeter Lobbies
Well-Wisher Lobbies
International Arrivals
INS Primary
Baggage Claim
Secondary(Customs)
Inbound Baggage
Greeter Lobbies
Baggage Recheck
PassengerScreening
CurbsideCheck-in
CurbsideAllocation
CurbsideSpace
Allocation
Transit Waiting
Functional Area Grouping
Derived by applying factors
Queuing modeling
Accumulation modeling
Terminal Planning
Curbside Landside Airside
Arrival DeparturesDomestic Arrivals
Departures
Claim Check-in
PassengerScreening
Baggage Screening
Gates
Outbound Baggage
Inbound Baggage
Greeter Lobbies
Well-Wisher Lobbies
International Arrivals
INS Primary
Baggage Claim
Secondary(Customs)
Inbound Baggage
Greeter Lobbies
Baggage Recheck
PassengerScreening
CurbsideCheck-in
CurbsideAllocation
CurbsideSpace
Allocation
Transit Waiting
Functional Area Grouping
Derived by applying factors
Queuing modeling
Accumulation modeling
Figure 3.13 Summary of Primary Functional Modules

SPREADSHEET MODELS FOR TERMINAL PLANNING & DESIGN ACRP 07-04
Final Report 3-20 August 2009
Queuing Analysis Modules
As shown in Figure 3.13, the models use queuing analysis, accumulation analysis, and factors to describe passenger space needs. Queue models are used where passengers need services provided by the airlines or the government. For the departing passenger flow, these areas include airline services for flight check-in and baggage acceptance, and government services for passenger and baggage screening and inspection. The international arrival flow needs queuing analysis for the analysis of CBP Primary and Secondary (Customs). In addition, the international arrival process also includes the baggage recheck and passenger screening process required for connecting passengers. These services are required if the international arrival facilities are located on airside concourses that are disconnected from the terminal landside area.
Figure 3.14 shows example output from the queuing model. The graph shows the input demand by ten minute periods, the application of a fixed capacity rate, the output flow and the queued passengers or bags, depending on the flow being measured.
The model has an input/output tab that contains the input processing rate, the
capacity rate, number of queued passengers, and the output passenger flow. The graph at right provides a summary of the information contained on the input/output tab. The service provided table below provides a summary of the input tab for the facility description. Figure 3.15 shows an example queue delay and throughput report from the model.
Figure 3.14 Example Inbound and Outbound Flows to a Flight Check-in Area with Computations of Queues
Inbound Flow
Capacity per 5 min.
QueuedPassengers
Inbound Flow
Capacity per 5 min.
QueuedPassengers
52.0 Service Units
3.5 Minutes per Passenger891 Passengers per Hour
Service Provided

SPREADSHEET MODELS FOR TERMINAL PLANNING & DESIGN ACRP 07-04
Final Report 3-21 August 2009
Nominal
Demand
Actual
Demand
Pro-
cessed
Back
log
Total Delay
(Minutes)
Delay per
Passenger
(Minutes)
- 1 - - - - - - 1 2 - - - - - - 2 3 - - - - - - 3 4 - - - - - - 4 5 53 53 53 - - - 5 6 945 945 770 175 2,993 3.9 6 7 863 1,037 891 146 12,664 14.2 7 8 796 942 891 50 4,810 5.4 8 9 801 852 844 8 697 0.8 9 10 737 744 744 - 344 0.5
10 11 647 647 647 - - - 11 12 549 549 549 - - - 12 13 724 724 717 6 84 0.1 13 14 808 815 815 - 415 0.5 14 15 619 619 619 - - - 15 16 666 666 666 - - - 16 17 764 764 764 - - - 17 18 788 788 787 1 5 0.0 18 19 874 875 875 - 183 0.2 19 20 673 673 673 - - - 20 21 347 347 347 - - - 21 22 23 23 23 - - - 22 23 - - - - - - 23 24 - - - - - -
Totals 11,676 11,676 11,676 22,194 1.9
Hour
Figure 3.15 Example Queue Delay and Throughput Summary Report Accumulation Models
Accumulation models show the inflow and outflow of aircraft, passengers or bags
(units) without additional delay. However, they show the effect of early arrival versus a planned departure and the resulting number of waiting units. The measure of interest is the net accumulation net of inflow (additions) and outflow (subtractions). Baggage reclaim areas are modeled as the dual accumulation of passengers and bags on a flight-by-flight basis. The net accumulation of passengers and bags is modeled by multiplying the percent of passengers at the claim area by the percent of bags at the claim area.

SPREADSHEET MODELS FOR TERMINAL PLANNING & DESIGN ACRP 07-04
Final Report 3-22 August 2009
Functional Modules
The spreadsheet models provide more detailed modeling support for eight primary areas of analysis. Each area includes some sub-areas which provide for additional levels of analyses:
Flight Check-In (by airline or common-use area groupings) o Curbside Check-In o Kiosk Check-In o Full-Service Check-In
Passenger Screening (by concourse or checkpoint) Baggage Screening (by airline or common-facility groupings) Outbound Baggage (by airline) Aircraft Gates (by airline or common-use area groupings) Passenger Holdrooms (by concourse, by gate, by common-use area
groupings) International Arrivals (by CBP facility)
o INS Primary Screening o Baggage Reclaim (by claim unit) o Domestic Baggage Reclaim (by claim unit)
The complete range of analyses described on Figure 3.14 is accomplished by applying factors to these primary analyses.
Figures 3.16 through 3.23 show the flow of analyses from source data
through the computation of aircraft, passenger or baggage flows.

SPREADSHEET MODELS FOR TERMINAL PLANNING & DESIGN ACRP 07-04
Final Report 3-23 August 2009
Figure 3.16 Flight Check-in Modeling

SPREADSHEET MODELS FOR TERMINAL PLANNING & DESIGN ACRP 07-04
Final Report 3-24 August 2009
Figure 3.17 Passenger Screening Modeling
SPREADSHEET MODELS FOR TERMINAL PLANNING & DESIGN ACRP 07-04
Final Report 3-25 August 2009
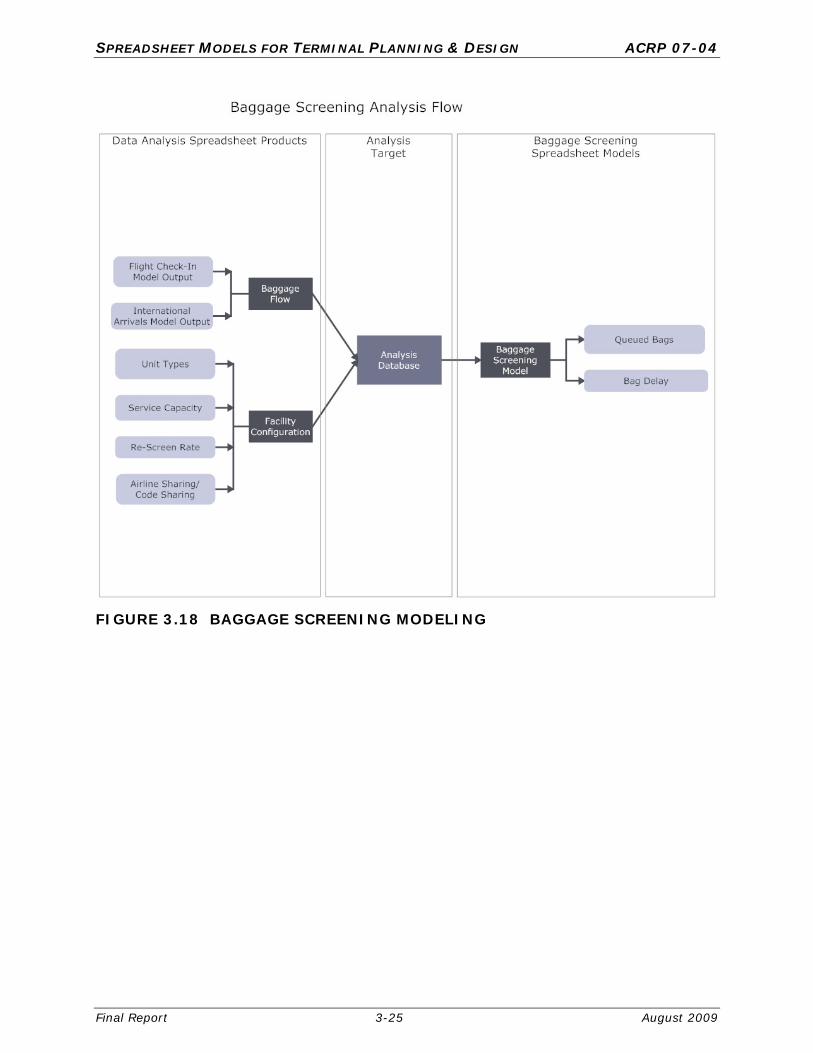
FIGURE 3.18 BAGGAGE SCREENING MODELING

SPREADSHEET MODELS FOR TERMINAL PLANNING & DESIGN ACRP 07-04
Final Report 3-26 August 2009
FIGURE 3.19 OUTBOUND BAGGAGE MODELING

SPREADSHEET MODELS FOR TERMINAL PLANNING & DESIGN ACRP 07-04
Final Report 3-27 August 2009
Figure 3.20 Passenger Holdroom Modeling

SPREADSHEET MODELS FOR TERMINAL PLANNING & DESIGN ACRP 07-04
Final Report 3-28 August 2009
FIGURE 3.21 International Arrivals Modeling

SPREADSHEET MODELS FOR TERMINAL PLANNING & DESIGN ACRP 07-04
Final Report 3-29 August 2009
FIGURE 3.22 Baggage Reclaim Modeling

SPREADSHEET MODELS FOR TERMINAL PLANNING & DESIGN ACRP 07-04
Final Report 3-30 August 2009
FIGURE 3.23 Aircraft Gate Modeling

Chapter Four
Conclusions and Recommendations

SPREADSHEET MODELS FOR TERMINAL PLANNING & DESIGN ACRP 07-04
Final Report 4-1 August 2009
CHAPTER FOUR
CONCLUSIONS AND RECOMMENDATIONS
The research findings and potential model architecture were presented in an Interim Report to the Project Panel for their review. This Interim Report also provided some specifications for the Spreadsheet Models for Terminal Planning & Design. As described in Chapter 3, these models need to address all phases of a terminal development program, from pre-program activities through validation of alternative concepts. The models need to cover the flows of departing passengers from ground transportation to aircraft, and arriving passengers from aircraft to ground transportation, and to connecting flights. A special section of the model needs to address the specific processing requirements for international passengers and bags.
The research identified the existence of numerous proprietary spreadsheet
models for terminal space programs and several companies who sell simulation models, simulation modeling services and simulation model components, all specifically tailored to evaluating the flows of aircraft, passengers and baggage in terminal buildings. The compendium of models found in the research has been included in the User’s Guide for the spreadsheet models. However, the research also identified a lack of general availability for spreadsheet modeling tools that support the flow assumptions terminal space programs.
The Project Panel reviewed the findings of the initial research and reached the
following conclusions, which became the basis of developing the final versions of the spreadsheet models:
Most users need the highly documented simple tools. While power users appreciate more complex tools, these are a small minority of the target users. Therefore, the models should provide simple and fast analyses that are easy to learn and facilitate learning about the terminal planning issues confronting the planner. Most users will turn to a consultant who will provide more complex, follow-on analyses either with more complex spreadsheets or simulation models. The models should contain links to the appropriate sections of the User’s Guide and Terminal Planning Guidebook to provide additional information.
The learning is in the doing. The models should emphasize getting data, and working the numbers. Therefore, the models provide blank templates and equations with documentation on how variables relate and where to get the required information. The user’s guide and terminal planning guide book provide information on sources of data and references. The spreadsheet CD contains information about test airports which provide some benchmarks to facilitate analysis.
The models should provide simple tools for every area of analysis. While some tools for power users increase the level of sophistication within the models, breadth of analysis is more important than the depth of analysis provided by the modeling tools. Where appropriate the models should provide multiple
SPREADSHEET MODELS FOR TERMINAL PLANNING & DESIGN ACRP 07-04
Final Report 4-2 August 2009
analyses approaches and let the user compare the results. As a result of this guidance, the spreadsheet models were expanded to include tools for evaluating curbside check-in and calculating curb length requirements. While the initial architecture of the spreadsheet models included a fairly complex linked queuing analysis approach, this architecture was greatly simplified at the direction of the Project Panel.
Provide flight schedule analysis tools. Flight schedules provide a wealth of detailed information about aircraft activity, which is difficult to unlock without spreadsheet tools that distill down the large volume of information to the most important planning information.
Provide an open architecture spreadsheet modeling environment. The panel decided that locking key cells and sheets provided some security from accidental changes. However, ultimately the intent of the research is to provide tools that are readily modifiable, especially by power users. Thus the spreadsheets contain a password to unlock these cells and sheets.
Provide macros only where they enhance productivity. The intent of the research was to provide a spreadsheet environment where all of the variable relationships are plainly visible on the spreadsheet. However, the Project Panel acknowledges that macros have their place in automating repetitive tasks and easing navigation between analysis areas. Documentation on accessing the macros is provided in the User’s Guide and within the spreadsheets.
The model specifications in Chapter 3 define eight primary modeling areas that
drive the estimates of passenger flows. The flow of information from source data analysis programs through models that define the flow volumes for aircraft, passengers and baggage were described. The remaining areas of analysis for terminal planning can be derived through applying factors from the analysis results from these eight primary modeling areas
RECOMMENDATIONS FOR CONTINUING RESEARCH
Prepare Updates to the Spreadsheet Models. It is our recommendation that the
ACRP Program consider a means to regularly update the content of the models to reflect changes which could occur in future editions of the Guidebook. Airports operate in a dynamic environment where airline business models and government regulations evolve over time. Current factors and variable relationships will likely change as a result. In addition, PC software is a fast-changing business.
Remarkably, the file formats for MS Excel have remained stable for the past ten
years. With the release of MS Excel 2007, Microsoft has chosen to break away from this stability and changed the underlying structure of Excel files. This development signals a change in approach from the manufacturers of the underlying software engines and we may see more frequent changes in the future. The panel has concurred with the research team’s recommendation that the models be delivered in a MS Excel 2003 format since the majority of users do not yet have MS Excel 2007.

Appendix A
Annotated Bibliography

SPREADSHEET MODELS FOR TERMINAL PLANNING & DESIGN ACRP 07-04
______________________________________________________________________________ Final Report A-1 August 2009
APPENDIX A
LITERATURE REVIEW ANNOTATED BIBLIOGRAPHY
This literature review provides information on models that provide analysis of airport terminal passenger and baggage flow. In addition, since terminal planners and designers also get involved in assessing roadway areas adjacent to terminal buildings, and aircraft parking aprons adjacent to the terminal buildings, this literature review also contains some citations of models that evaluate these adjacent areas. However, since these areas are not the focus of this study, the literature cited in this appendix is not a complete compendium of available models and analysis tools for landside and aircraft apron analyses. [1] “A Flexible Model for the Evaluation of an Airport Terminal.” University of Padova, Department of Information Engineering. http://www.dei.unipd.it/~brunetta/at_papers/br99.pdf. (As of July 9, 2007). This report describes the Airport Laboratory (AIRLAB) model, a discrete-event simulation model of actions and decisions made by arriving, departing, and transferring passengers in the airport terminal building, as well as their baggage movements. The authors explain that the basic feature of this model is the flexible implementation of behavioral models representing the way passengers make decisions in the terminal building on one hand, and of the decision policies related to the operations in the terminal facilities on the other. [2] “Advisory Circular: Airport Landside Simulation Model (ALSIM).” AC No.150/5360-10. U.S. Department of Transportation, Federal Aviation Administration. (April 24, 1984). http://rgl.faa.gov/Regulatory_and_Guidance_Library/rgAdvisoryCircular.nsf/0/2a75202f1a6cbc4686256c750060f3c6/$FILE/150-5360-10.pdf. (As of July 9, 2007). This publication describes the Airport Landside Simulation Model (ALSIM), as an effective evaluation tool for airport planners, designers, and operators in analyzing airport terminal and landside facilities. The model represents the flow of passengers and vehicles through the airport terminal from its boundary to the aircraft gates. It simulates queuing and servicing processes at all essential landside facilities. ALSIM uses an input flight schedule to generate transactions representing passenger groups and accompanying visitors in a time-dependent manner. Along with the model description, the model outputs, software, and format are also provided in the publication.

SPREADSHEET MODELS FOR TERMINAL PLANNING & DESIGN ACRP 07-04
______________________________________________________________________________ Final Report A-2 August 2009
[3] “Airport Automated People Mover Systems: Analysis with a Hybrid Computer Simulation Model.” Transportation Research Record 1703. http://www.atsl.cee.vt.edu/Publications/2000_Airport_Automated_People_Mover_Systems_Analysis_with_a_Hybrid_Computer_Simulation_Model.pdf. (As of July 9, 2007). This article describes the Automated People Mover Simulation Model (APMSIM), an attractive solution to mobility problem associated with large airport terminals. The hybrid computer simulation model was developed to simplify the operational analysis of airport automated people mover (APM) systems. The model estimates time-varying level-of-service characteristics of the terminal including queues and processing times. Also, it simulates the movement of individual passengers and APM vehicles in the system network. [4] “Airport Suite: Simulation Solution for Airports & Airlines.” Incontrol: Enterprise Dynamics. (2005). http://incontrol.nl/files/ED%20Airport%20Suite.pdf. (As of July 9, 2007). This brochure describes Airport Suite (AS), a simulation platform that covers all three fields (airside, landside, cargo) of airport activity. AS models, simulates, visualizes and controls the flow of people, goods and information through airport processes. Ranging from the operation of a single check-in desk or airplane stand to entire terminals and supply chains. AS balances your resources for optimal and cost effective process execution and is a powerful instrument in the (re)design of layouts and flows. [5] Airports and Air Transport – Planning and Design: Airport Terminal Modeling and Simulation.” Halcrow. http://www.halcrow.com/html/our_markets/airports_arcport.htm. (As of July 9, 2007). This site describes ARCport ALT, a computer software program used for airport modeling and simulation. ARCport ALT produces 3-dimensional modeling and can be used to focus independently on specific areas such as the gate assignment process and baggage handling systems. [6] “AND (MIT + MITRE).” MIT AATT Model Review Project under AATT Program. (ARO, July 15, 1996). http://web.mit.edu/aeroastro/www/labs/AATT/reviews/and.html. (As of July 9, 2007). This site describes Approximate Network Delays (AND), a network queuing model developed at the MIT Operations Research Center, with software development support and database provided by the MITRE Corporation. Its objective is to analyze the impact of changes in airline schedules, traffic volume and airport capacity on flight delays on a national or regional basis. AND uses the DELAYS model as its engine for solving the differential equations that describe the distribution of delays over a network of airports, given flight schedules, aircraft itineraries and airport capacities.

SPREADSHEET MODELS FOR TERMINAL PLANNING & DESIGN ACRP 07-04
______________________________________________________________________________ Final Report A-3 August 2009
[7] “AutoTURN Aircraft has now become AeroTURN.” Transoft Solutions. (2007). http://www.transoftsolutions.com/transoft/products/AE/aeroturn.asp. (As of August 9, 2007). This site describes AeroTURN Pro, which allows airport planners, designers and engineers to dynamically evaluate and design gate and passenger boarding bridge layouts. Users are able to assess airside design parameters for both aircraft and ground support vehicle maneuvers quickly. The inclusive bridge model library permits designers to easily verify multiple bridge-to-aircraft and aircraft-to-bridge slope calculations creating a comprehensive aircraft stand database, efficiently and safely when compared to traditional methods. [8] “D.1.4.1 Position Paper on Airport Simulation & Modeling Issues.” THENA. (July 1, 2002), p. 16. http://thena.aena.es/thena_public/files/WP1/04Simulation/14D01AEN10_SimulationModelling_PositionPaper.pdf. (As of July 9, 2007). This position paper describes the Blumstein Model, an analytical model of airport operations. This model approximates the capacity of a single runway used only for landings. Basically the Blumstein model estimates the capacity of the runway as the inverse of the weighted average of inter-arrival times. [9] “D.1.4.1 Position Paper on Airport Simulation & Modeling Issues.” THENA. (July 1, 2002), Pp. 19-20. http://thena.aena.es/thena_public/files/WP1/04Simulation/14D01AEN10_SimulationModelling_PositionPaper.pdf. (As of July 9, 2007). This position paper describes DELCAP, a fast time simulation model of the airport terminal area including terminal airside operations and those ground operations occurring on the runway surface. Application of DELCAP is envisaged under two different scenarios. The first is one in which a realistic demand level is stipulated and DELCAP output yields resulting delays and throughputs. In the second scenario, DELCAP is run with unrealistically high demand levels to estimate the airport’s maximum throughput (capacity). [10] “D.1.4.1 Position Paper on Airport Simulation & Modeling Issues.” THENA. (July 1, 2002), p. 22. http://thena.aena.es/thena_public/files/WP1/04Simulation/14D01AEN10_SimulationModelling_PositionPaper.pdf. (As of July 9, 2007). This position paper describes ICAO, which stresses the importance of a properly dimensioned apron area when planning airports. To do so it proposes an analytical formulation and provides some general values on service times, to enable a rough calculation of the number of stands needed.

SPREADSHEET MODELS FOR TERMINAL PLANNING & DESIGN ACRP 07-04
______________________________________________________________________________ Final Report A-4 August 2009
[11] “D.1.4.1 Position Paper on Airport Simulation & Modeling Issues.” THENA. (July 1, 2002), p. 27. http://thena.aena.es/thena_public/files/WP1/04Simulation/14D01AEN10_SimulationModelling_PositionPaper.pdf. (As of July 9, 2007). This position paper describes the Optimization of Airport System – System Dynamics Model (OPTAS-SD). This model uses the techniques of System Dynamics (SD) to develop a fast runtime, high level modeling tool, which integrates the airside and landside of an airport. Its main application is to obtain curves of total airside delay against number of movements and passengers queuing times. [12] “D.1.4.1 Position Paper on Airport Simulation & Modeling Issues.” THENA. (July 1, 2002), p. 28. http://thena.aena.es/thena_public/files/WP1/04Simulation/14D01AEN10_SimulationModelling_PositionPaper.pdf. (As of July 9, 2007). This position paper describes the Passenger Baggage Flow Model (PBFM). It models the movement of passengers and baggage through an airport terminal. It is an analysis tool to study floor plan layouts, facility configurations, and flight demand pattern. [13] “D.1.4.1 Position Paper on Airport Simulation & Modeling Issues.” THENA. (July 1, 2002), Pp. 31-32. http://thena.aena.es/thena_public/files/WP1/04Simulation/14D01AEN10_SimulationModelling_PositionPaper.pdf. (As of July 9, 2007). This position paper describes the Decision Support System for Airport Resources Allocation (SADAMA). This tool helps to make an effective use of airport resources, according to criteria set by airport. The resources assigned are parking positions, boarding gates, arrival lounge conveyor belts and check-in desks. Additional considerations are made for occupation, in terms of passenger number, of other airport resources such as security control police, etc. The criteria for assignment are divided according to the strategy applied, which group the rules to deal with different resources. These criteria are complemented with such other elements that are taken into account in the allocation process: handling agents, airlines and fleet. It has three modules: scheduling, real time and simulation.

SPREADSHEET MODELS FOR TERMINAL PLANNING & DESIGN ACRP 07-04
______________________________________________________________________________ Final Report A-5 August 2009
[14] “D.1.4.1 Position Paper on Airport Simulation & Modeling Issues.” THENA. (July 1, 2002), Pp. 33-34. http://thena.aena.es/thena_public/files/WP1/04Simulation/14D01AEN10_SimulationModelling_PositionPaper.pdf. (As of July 9, 2007). This position paper describes the Simple Landside Aggregate Model (SLAM), a model for estimating capacity and delays in airport passenger terminals. SLAM is designed to answer “what if” questions about alternative configurations of the various processing and holding facilities in a terminal. It consists of a network of modules, one for each facility of the terminal. These modules are based on a set of quite simple mathematical formulas to be used for the estimation of the capacity of each facility (in terms of number of passengers and baggage per hour) and the level of service (LOS) associated with it. LOS is quantified both in terms of “space available per facility occupant” and waiting time for being processed. [15] “D.1.4.1 Position Paper on Airport Simulation & Modeling Issues.” THENA. (July 1, 2002), p. 35. http://thena.aena.es/thena_public/files/WP1/04Simulation/14D01AEN10_SimulationModelling_PositionPaper.pdf. (As of July 9, 2007). This position paper describes Taxiway Simulation (TAXSIM), a computer fast time simulation model of the flow of aircraft through the runway and taxiway network of an airport, composed of links, nodes and gates. It uses a discrete event architecture that models the activity of each aircraft using the airport for a selected period of time. It is used to evaluate usage and delay of a taxiway segments, and it evaluates the effects of different taxiway layouts. [16] “Discrete Event Simulation Model for Airline Operations: SIMAIR.” 2003 Winter Simulation Conference. http://www.informs-sim.org/wsc03papers/211.pdf. (As of July 10, 2007). This article describes Simulation of Airline Operations (SIMAIR), a C++ based research tool meant for the simulation of airline operations. It provides a means for devising and evaluating various airline recovery mechanisms to handle disruptions, and can also be used as a tool to evaluate the performance of a given schedule of operations. The performance of a given recovery mechanism can be quantified for research and evaluation purposes. [17] “EDS/ETD Deployment Program: Modeling and Simulation Approach.” TRB Annual Sunday Simulation Workshop. (January 12, 2003), p. 8. http://onlinepubs.trb.org/onlinepubs/circulars/ec060/10_Meyer-Lunsford.pdf. (As of July 10, 2007). This presentation describes the Flow Model, which is used to estimate baggage flows throughout a one day period. Also, it is used for quickly estimating EDS and ETD equipment requirements for a variety of protocols.

SPREADSHEET MODELS FOR TERMINAL PLANNING & DESIGN ACRP 07-04
______________________________________________________________________________ Final Report A-6 August 2009
[18] “Fly with Samanta: Airport Simulation & Capacity Management.” Incontrol: Enterprise Dynamics. (2006), p. 3. http://incontrol.nl/files/ED%20Samanta.pdf. (As of July 10, 2007). This brochure describes BAXSIM, a set of simulation objects with which you can model, simulate, and visualize baggage handling systems. The simulation objects that are provided with this library are: Vertical Sorter, Accumulating Conveyor, Buffering Belt Conveyor, Line Sorter, Manual Encoding Station, and many more. With this library Incontrol created an integrated simulation model of the entire baggage handling systems of Amsterdam Airport Schiphol. [19] “FTA Analysis Tools and Models: Gate Assignment Simulation (GATESIM).” (2001). http://www.ftausa.com/ftamodel.htm. (As of July 10, 2007). This site describes the Gate Assignment Simulation (GATESIM), a C++ Monte Carlo simulation of the gate assignment process at an airport. Using real or forecast arrival schedules, the model uses stochastic variables to represent the turnaround time of various categories of aircraft. Given assumptions about gate capacities and terminal assignments, the model generates a schedule of gate use for an airport. [20] “FTA Analysis Tools and Models: Terminal and Roadway Model (LANDSIDE).” (2001). http://www.ftausa.com/ftamodel.htm. (As of July 10, 2007). This site describes the Terminal and Roadway Model (LANDSIDE), an analytical model developed to assist airport operators in the quantitative assessment of the adequacy of the airport landside. Detailed analytic models have been implemented for those airport landside components which are essential to passenger processing, and a methodology has been developed to quantify airport landside delay and capacity. This methodology has been applied to existing and planned facilities at several large U.S. hub air carrier airports as well as international airports. [21] “FTA Analysis Tools and Models: Terminal Operations Simulation (TOPSIM).” (2001). http://www.ftausa.com/ftamodel.htm. (As of July 10, 2007). This site describes the Terminal Operations Simulation (TOPSIM), a simulation model intended for use in landside capacity analysis. The model simulates the movements of originating, terminating and transferring passengers and accompanying visitors between the airport boundary and the aircraft gate. Quantified measures of congestion including queue length, waiting time, and occupancy are produced for variable demand levels at simulated landside processing facilities.

SPREADSHEET MODELS FOR TERMINAL PLANNING & DESIGN ACRP 07-04
______________________________________________________________________________ Final Report A-7 August 2009
[22] “IBM PaxFlow Simulator from IBM and Amadeus.” IBM Business Consulting Services. http://www-03.ibm.com/industries/travel/doc/content/bin/PaxFlow.pdf. (As of July 10, 2007). This brochure describes the IBM PaxFlow Simulator, a flexible parameter-driven simulation model that can predict daytime passenger volumes for each airport zone, up to seven days in advance.
[23] “JKH Mobility Services: Advanced Landside Performance Simulation (ALPS2000).” Kimley-Horn and Associates, Inc. (2007). http://www.kimley-horn.com/kha/disciplines.asp?MenuID=126. (As of July 9, 2007). This site describes Advanced Landside Performance Simulation (ALPS2000), analyzes potential designs, alternatives, and operations plans. ALPS2000 is an adaptable modeling and simulation tool that can simulate nearly any possible combination of people, activities, movement, private and commercial vehicles, signage, transportation networks, curbfronts, roadways, transit, shuttle buses, terminal areas, operations, and apron activities. [24] “Modeling Curbside Vehicular Traffic at Airports.” 1998 Winter Simulation Conference. http://www.informs-cs.org/wsc98papers/151.PDF. (As of July 10, 2007). This article describes the Curbside Roadway Simulation Model, a computer simulation model of the curbside roadways, including vehicular traffic as well as the pedestrian flow entering and exiting the terminal building and the parking garage. The SABRE Group was contracted by the Austin-Bergstrom International Airport to create the simulation model. The five major logic components of the simulation model are: vehicle movement, parking space selection, passenger drop-off, passenger pick-up, and pedestrian crossing. [25] “PAXSIM Solutions: Passenger & Baggage Flow Simulation System.” (2006). Preston Aviation Solutions. http://www.preston.net/documents/Brochure_PaxSim_06.pdf. (As of July 10, 2007). This brochure describes the Passenger & Baggage Flow Simulation System (PAXSIM), an advanced computer simulation system that delivers fast-time simulation of passenger and baggage flows inside the airport terminal building and on the tarmac. For prediction and decision support purposes, PAXSIM enables users to evaluate the efficiency of a terminal layout, validate the capacity of the design, assess the impact of new security measures, determine typical processing times, and analyze future seasonal schedules.
SPREADSHEET MODELS FOR TERMINAL PLANNING & DESIGN ACRP 07-04
______________________________________________________________________________ Final Report A-8 August 2009
[26] “Security Checkpoint Optimizer (SCO): An Application for Simulating the Operations of Airport Security Checkpoints.” 2006 Winter Simulation Conference. (2006). http://www.informs-sim.org/wsc06papers/065.pdf. (As of July 10, 2007). This article describes the Security Checkpoint Optimizer (SCO), a Java-based application capable of helping security planners better understand their current and proposed operations. SCO allows the analyst to graphically build a simulation model that can be used to compute results for: passenger and bag throughput, security effectiveness (probability of detection), resource utilization, and operation cost. [27] “Simtra Aerotech – Software for Airside Planning, Design, and Operations.” Airport Technology.com. (2007). http://www.airport-technology.com/contractors/consult/simtra/. (As of July 10, 2007). This site describes PATHPLANNER A5, which offers simulation of aircraft and vehicle movement with display of jet blast, ICAO and FAA clearances, realistic pushback, and much more. The software also provides for aircraft stand design with passenger boarding bridges. [28] “The Role of Computer Simulation in Reducing Airplane Turn Time.” Boeing. http://www.boeing.com/commercial/aeromagazine/aero_01/textonly/t01txt.html. (As of July 10, 2007). This site describes the Boeing Passenger Enplane/Deplane Simulation (PEDS), a discrete-event simulation model that analyzes the passenger boarding process as a set of interrelated elements. This modeling technique uses computer software to combine the effects of mathematical queuing theory with an analysis of random behavior. [29] “Total AiportSim: A New Generation Airport Simulation Model.” Transportation Research E-Circular. Hargrove, Belinda and Miller, Eric. (August 2002), Pp. 9-10. http://onlinepubs.trb.org/onlinepubs/circulars/ec042/ec042.pdf. (As of July 10, 2007). This publication describes Total AirportSim (TASM), a computer software that can model various aspects of total airport operations connecting airside and landside, literally from the airspace to the curb. TASM is comprised of three modules: airport/runway, gate, and passenger terminal.

SPREADSHEET MODELS FOR TERMINAL PLANNING & DESIGN ACRP 07-04
______________________________________________________________________________ Final Report A-9 August 2009
[30] “TRACS: Terminal, Roadway, and Curbside Simulation, A Total Airport Landside Operations Analysis Tool.” Transportation Research E-Circular. Le, Tung X. (August 2002), p. 8. http://onlinepubs.trb.org/onlinepubs/circulars/ec042/ec042.pdf. (As of July 10, 2007). This publication describes the Terminal, Roadway, and Curbside Simulation (TRACS), a flexible-planning tool that can be linked to other simulation products. TRACS is an airport-planning tool to assess the effect of demand and operational changes on the airport system. Several examples of TRACS analyses at airports around the United States, including airport access roadway construction phasing, terminal layout sizing and design, security equipment requirements and location, curbside drop-off/pick-up, and customs/immigration facilities. Three of the modules within TRACS are curbside roadways, terminal passenger flows, and baggage systems. [31] “Technical Considerations for the Validation of Electronic Spreadsheet Models for Complying with 21 CFR Part 11”, Pharmaceutical Technology JANUARY 2003, Phan, Tuan T. 21 CFR Part 11 are the US Food and Drug Administration guidelines for electronic records and electronic signatures and define the criteria under which electronic records and electronic signatures are considered to be trustworthy, reliable and equivalent to paper records. While these standards are far above the standards required for preliminary planning of passenger terminals, this paper provide a complete overview of all the issues that should be considered in protecting electronic records from undetected alterations. This range of issues was helpful in the design of the spreadsheet models. [32] Top 10 Spreadsheet Compliance Risks and How to Avoid Them, Schwartz, Matthew, IT Compliance Institute, 2008. Very straight forward presentation of common sources of errors in spreadsheets and provides a strategy for maintaining spreadsheets in a business compliance environment.

Appendix B
On-Line Survey of Terminal Planning & Design Models

Type Airside Functions Terminal/Concourse Functions Baggage Handling Functions Terminal Curb/Parking Functions Environment Available Organization Contact LanguagesModel Name
Transportation Research Board: Project 07-04 Model Information
Discrete Simulation Apron and Taxilane Movements Passenger Check-in MAC ABC INC ABC distributors Mr A Noneabc
Loading Bridges Passenger Queing Windows Proprietary abc inc
Ticketing
Other Apron and Taxilane Movements Concessions Other Public
Domain
VTMEA Michael St. Jeanacrp 07-04
Restrooms
Discrete Simulation Aircraft Gates Baggage Claim Baggage Make-up Windows By License Aviation Research
Corporation, ARC
K. Romi Singh,
360-945-2962
Windows 2000, XP
or VISTA
ARCport ALT
Apron and Taxilane Movements Concessions In-line Baggage Screening For Sale
Ground Service Equipment (GSE) Corridors
Loading Bridges Customs and Border Protection (CBP)
Elevators
Escalators
Holdrooms
Passenger Check-in
Passenger Queing
Restrooms
Security Screening
Ticketing
Discrete Simulation Aircraft Gates Baggage Claim Baggage Make-up Windows By License Aviation Research
Corportation
www.arc-us-ca.comARCport ALT (Terminal)
Concessions In-line Baggage Screening
Corridors
Customs and Border Protection (CBP)
Elevators
Escalators
Holdrooms
Passenger Check-in
Passenger Queing
Restrooms
Security Screening
Ticketing
Continuous Simulation Baggage Make-up Windows Proprietary Trans Solutions Eric Miller. Dallas, TX AutoMod ProgramBaggage Systems
Continuous Simulation Passenger Check-in Arena Proprietary Productivity ApexEnplaning Passenger
Model
Passenger Queing
Security Screening
Ticketing
Spreadsheet baggage claim Baggage Claim Windows Proprietary hirsh assoc Joel HirshFIS procressing model
Customs and Border Protection (CBP)
Spreadsheet Baggage Claim Baggage Make-up Windows Proprietary Port of Seattle,
Consultants
Dave Tomber, suite of
models
Excel, VBAFlow models
Corridors In-line Baggage Screening
Customs and Border Protection (CBP)
Elevators
Escalators
Holdrooms
Passenger Check-in
Passenger Queing
Security Screening
Ticketing
Discrete Simulation Engine Type, Aircraft Type Other For Sale Consultants L&B INM softwareIntegrated Noise Model
(INM)
Continuous Simulationlandside simulation
model
MEM does not have any
models in-house

Type Airside Functions Terminal/Concourse Functions Baggage Handling Functions Terminal Curb/Parking Functions Environment Available Organization Contact LanguagesModel Name
Transportation Research Board: Project 07-04 Model Information
Other Baggage Claim Baggage Make-up Windows Proprietary Consultant(s) Please contact me @
303-342-2713
ExcelNone
Spreadsheet Concessions In-line Baggage Screening
Corridors Seperate model used
Customs and Border Protection (CBP)
Elevators
Escalators
Holdrooms
Passenger Check-in
Passenger Queing
Restrooms
Security Screening
Ticketing
Spreadsheet Passenger Check-in Windows Proprietary FAA-ASW Thomas Wade/Test ExcelPassenger Screening
Passenger Queing
Security Screening
Discrete Simulation Aircraft Gates Baggage Claim Baggage Make-up Windows Proprietary Ricondo Assoc mark richterServiceModel
Concessions In-line Baggage Screening
Corridors
Customs and Border Protection (CBP)
Elevators
Escalators
Holdrooms
Passenger Check-in
Passenger Queing
Restrooms
Security Screening
Ticketing
Continuous Simulation Aircraft Gates Airside only Airside only Windows Public
Domain
FAA + others George Legarreta not familiar enoughSIMOD
Apron and Taxilane Movements
Spreadsheet Runways Customs and Border Protection (CBP) Windows By License Landrum & Brown Matthew H Lee ExcelSimplified Airport Delay
Model
Elevators Proprietary [email protected]
m
Escalators
Passenger Check-in
Passenger Queing
Security Screening
Ticketing
Spreadsheet Aircraft Gates Baggage Claim Baggage Make-up Windows Proprietary MS ExcelSpreadsheet Modeling
Customs and Border Protection (CBP) In-line Baggage Screening
Holdrooms
Passenger Check-in
Passenger Queing
Security Screening
Ticketing
Mathematical Algorithm Aircraft Gates Baggage Claim Baggage Make-up Windows For Sale IATATAS
Apron and Taxilane Movements Concessions In-line Baggage Screening Proprietary
Ground Service Equipment (GSE) Corridors
Loading Bridges Customs and Border Protection (CBP)
Holdrooms
Passenger Check-in
Passenger Queing
Security Screening
Ticketing

Type Airside Functions Terminal/Concourse Functions Baggage Handling Functions Terminal Curb/Parking Functions Environment Available Organization Contact LanguagesModel Name
Transportation Research Board: Project 07-04 Model Information
Discrete Simulation Aircraft Gates Baggage Claim In-line Baggage Screening Windows Proprietary Not Available NA VBATerminal Flow Model
Customs and Border Protection (CBP)
Passenger Check-in
Passenger Queing
Security Screening
Ticketing
Spreadsheet Passenger Check-in Windows Proprietary HA Lotusticket queue
Passenger Queing
Security Screening
Ticketing
Discrete Simulation Main Frame Proprietary Ricondo and
Associates
773-606-0611 excelupper level roadway
Spreadsheet Aircraft Gates Windows Proprietary XYZ Inc Mr X Excelxyz
Apron and Taxilane Movements

Appendix C
Terminal Planning Spreadsheet Models
User's Guide

AIRPORT COOPERATIVE RESEARCH PROGRAM
Terminal Planning Spreadsheet Models
User’s Guide
SUBJECT AREAS Aviation Design Planning
Research Sponsored by the Federal Aviation Administration
TRANSPORTATION RESEARCH BOARD WASHINGTON. D.C. 2009 www.TRB.org
ACRP REPORT 07- 04

Terminal Planning Spreadsheet Models – User’s Guide ACRP 07-04
Final User’s Guide TOC-i- August 2009
User’s Guide Table of Contents Introduction ...............................................................................................1
Model Format and Overview .......................................................................3
Model Sections (Tabs).................................................................................5
Excel Help ..................................................................................................6
Design Hour Determination.......................................................................10
Gate Demand Requirements......................................................................19
Curb Requirements ...................................................................................27
Check-In/ Ticketing ..................................................................................33
Passenger Security Screening...................................................................46
Baggage Screening ...................................................................................52
Baggage Make-Up .....................................................................................55
Holdrooms ................................................................................................57
Baggage Claim ..........................................................................................62
Concourse Circulation ...............................................................................68
International Arrival Facilities – (FIS/ CBP) .............................................74
Alternative Methods (Simulation Models) ............................................. 83
Acronyms (used in the guide) ......................................................................85
Author’s Acknowledgements.....................................................................86

Terminal Planning Spreadsheet Models – User’s Guide ACRP 07-04
Final User’s Guide -1- August 2009
INTRODUCTION
The Terminal Planning Spreadsheet Models are a companion to the Airport Passenger Terminal Planning Guidebook (Guidebook). The models provide practical learning exercises, which provide users with knowledge from the industry’s top planning consultants.
The Terminal Planning Spreadsheet Models CD contains four primary files: the
Terminal Planning Spreadsheet Model.xls workbook file, the Design Hour Determination.xls workbook file, an electronic copy of the User’s Guide and an electronic copy of the Terminal Planning Guidebook. The CD also contains an installation procedure and an electronic copy of this Quick Reference Guide. The install procedure allows the user to copy the contents of the CD to a specified directory on a user’s local disk drive or network. Starting work in the Terminal Planning Spreadsheet Models requires opening either the Terminal Planning Spreadsheet Model.xls workbook file, the PDF of the User’s Guide, or the PDF of the Terminal Planning Guidebook.
The Terminal Planning Spreadsheet Models require the user to enable macros in
Excel. Enabling macros allows all of the models’ features to function properly. The User’s Guide also has an Excel Help section, which includes directions on how to enable macros in Excel.
The Terminal Planning Spreadsheet Models have been developed and tested in
Excel 2003. Additional testing was also conducted with Excel 2000 and Excel 2007. Other versions of Excel were not tested.
The User’s Guide is a reference manual that provides guidance to assist the user in the correct use of each model. While the models provide comments, diagrams, and guidance that describe the contents of various cells in each spreadsheet, the models also require decisions from the user about input values, analysis techniques and data sources. Making these decisions provides a means to learn and understand the major issues that drive the layout and size of various airport passenger terminal facilities. All of the models have buttons (which invoke macros) that open the electronic copy to the appropriate section of the Guidebook to provide additional information and guidance. In addition, the Terminal Planning Spreadsheet Models User’s Guide also incorporates most of the related material covered by the Guidebook. Where appropriate, the Terminal Planning Spreadsheet Models CD contains sample data sets that provide an airport specific example for each model. These airport specific examples may help the user make more informed decisions about appropriate model inputs that match their unique situations.
The User’s Guide has one section for each of the main tabs in the spreadsheet model workbook. Each model section (tab) has information and exhibits from the Guidebook and excerpts and exhibits from the model with process explanations and commentary to help the user understand the reasoning behind the models’ methodology.

Terminal Planning Spreadsheet Models – User’s Guide ACRP 07-04
Final User’s Guide -2- August 2009
The models on the CD do not address every single aspect of terminal planning. Many aspects of terminal planning can be assessed by applying simple multipliers or ratios to the number of passengers or aircraft using a terminal, or by allocating a percentage of the total terminal space to a particular function. The models on the CD include those areas that require more complex analyses to support planning decisions. Figure 1 provides an overview of the functional areas in terminal planning. Red check marks indicate the areas covered by the spreadsheet models.
FIGURE 1 Terminal Planning Functions

Terminal Planning Spreadsheet Models – User’s Guide ACRP 07-04
Final User’s Guide -3- August 2009
MODEL FORMAT AND OVERVIEW
The spreadsheet models are set up to be used as exercises with the knowledge gained from the Guidebook and User’s Guide. The exercises intend to give understanding to why terminal planners use certain ratios and planning factors; and not be a ‘cookbook’ of specific recipes for demand requirements. The models were developed with the goal of learning. With a strong understanding of the process and methods discussed in the Guidebook and models, the user should be more prepared to develop some of their own terminal space program components.
The process flow of the models is to gather data about a terminal’s physical components (space utilization and availability), and determine the design hour passenger traffic. With this inventory in hand, along with the design hour determined from a base schedule or from estimation factors, the user can go through each model exercise, starting with the Gate Demand model, following the typical path of a departing passenger and baggage through the airport, and ending with the arriving passenger retrieving their bags at baggage claim in the Baggage Claim model.
The spreadsheets are password protected to protect them from accidental overwrite of key information. However, the password is provided for the power users who may wish to make changes for specific needs. THE PASSWORD IS TRBModels. Additional help on unlocking or locking a protected workbook is provided in the Excel Help section. Model Explanations Queuing models are used within the spreadsheet models in order to better determine the processing requirements while considering passenger delays. These queuing models are referred to as “mini queue” models in the text of the Guidebook as well as in the models. In the Check-In and Security models, an initial value is calculated for the number of check-in positions or lanes based on average processing times, desired maximum waiting time, and the assumption that passengers arrive at the processing areas at a constant rate during the entire peak period. This optimal, yet unrealistic condition would make use of all available processing capacity and therefore, would create a steady flow of passengers to and from the processing areas. Therefore, the initial value for positions is always lower than what is truly needed. This initial number of positions is then used as a starting point to do a sensitivity analysis of the effects of varying counters or lanes on the expected wait times and required queuing area. However, passengers will more likely arrive at Check-In and Security areas at varying rates. The two mini queue models show the difference in assuming an even distribution of passengers arriving at a steady flow during the peak period, compared to a normal (bell curve) distribution of passengers, which better reflects real world arrivals, as a peak in the middle of a generic period. The mini queue models include this peaking effect and the resulting wait times are therefore based on a more likely scenario. When the model uses the initial number of processing positions, the estimated maximum wait time will be higher than the target LOS wait

Terminal Planning Spreadsheet Models – User’s Guide ACRP 07-04
Final User’s Guide -4- August 2009
time because the expected passenger arrival pattern has been assigned a peaked distribution. The user can then adjust the model input for counters or lanes until the desired wait time is reached, and observe the effects on the time and space parameters based on the number of counters or lanes. Modeling Conventions and Symbols
All of the models are formatted using a color-coded cell system (Figure 2).
Only the white input cells are left unlocked; the blue or light green cells are locked specifically to preserve the calculations and formulae. The formulae are visible when the user places the Excel cursor on each cell.
FIGURE 2 Color Coding of Spreadsheet Cells
The first step after initiating the spreadsheet models workbook is to review the Table of Contents (opening tab), and to make note of the color coding format and the use of cell comments marked with a red triangle in the upper right corner of the associated cell. These comments will give suggestions, possible input ranges, and explanations to the input or output cells connection’s to each other, as well as formula descriptions. They are used throughout each of the individual models as a quick reference to better understanding each step within the models’ process.
The models contain some conditional formatting that may prompt the user to enter a different value, one that is more in line with a typical range of values, or to change the input format to match what a calculation in the model needs to work properly.
As previously noted, macros are used in the models to facilitate the navigation through the spreadsheet model as a complete set of individual models. In addition, macros used within certain model tabs provide a way to minimize some repetitive work for the user and also performs some larger tasks much faster. Those users that wish to see what the macros are doing behind the scenes can check the Visual Basic (VBA) code that is stored within the spreadsheet by pressing the Alt key and the F11 key together to launch the Microsoft VBA program. The code should be easily understood by those with a moderate level of proficiency.
Each workbook tab has links to the User’s Guide and to return back to the Table of Contents tab. As there are many tabs in this model, and they may not all fit on the bottom of the screen, depending on the size of the user’s computer monitor, the “Return to Table of Contents” tab makes it simple to get back to the main page and follow the process through each of the models.
The overall modeling approach is to review the data checklist, determine the Design Hour, and then step through each of the models while referring to the User’s Guide for additional help and information related to each of the specific areas of

Terminal Planning Spreadsheet Models – User’s Guide ACRP 07-04
Final User’s Guide -5- August 2009
terminal planning. It is recommended that the user proceed in the order (left to right, and top to bottom) illustrated in Figure 3. This order will allow for demand values, determined in the initial steps, to flow into dependant calculations in later steps.
FIGURE 3 Table of Contents Model Selection Buttons MODEL SECTIONS (TABS)
Design Hour Determination - This model takes the user from data sourcing and collection through determining the peak month, choosing an average day of the peak month, and finally, the Design Hour and the associated peak planning factors.
Gate Demand - This model lets the user estimate future gate demand through two common approaches. The user can determine the Narrowbody Gate Equivalent (NBEG) and Equivalent Aircraft (EQA) through the use of gate equivalency tables for the current or future gate mix.
Curb Requirements - This model estimates the length of terminal curb frontage required for arrival and departure curbs for private cars and various types of public vehicles.
Check-In / Ticketing - This model allows the user to select the number of check-in positions among the Counter, Kiosk, and Curbside areas, and adjust the processing conditions to see the effect on the processing time and required space. Mini queue models are used to show estimated delays.
Baggage Screening - This model helps to determine the TSA Surge hourly rate of outbound baggage and estimates the required number of Electronic Detection System (EDS) and Explosive Trace Detection (ETD) units, as well as the basic spatial requirements for operation and handling.

Terminal Planning Spreadsheet Models – User’s Guide ACRP 07-04
Final User’s Guide -6- August 2009
Baggage Make Up - This model estimates the make up space and number of containers/carts required to adequately stage and prepare outbound baggage for delivery to the aircraft.
Security Screening - This model determines the necessary number of Transportation Security Administration (TSA) passenger screening lanes and space required for TSA screening operations. The model includes a mini queue model to see the effect of processing and queuing variances on the passenger delay and unit requirements.
Holdrooms - This model looks at a single holdroom and allows the user to adjust usage parameters to determine the current level of service (LOS), or estimate the necessary holdroom conditions to achieve a desired LOS.
Baggage Claim - This model determines the overall claim frontage that is necessary, based on the user defined peak period demand. The user can then size an individual claim unit and determine how many units are required for their unique aircraft fleet mix.
FIS/CBP - This model provides the user with Customs and Border Protection (CBP) standards in the main functional areas of passenger processing. A mini queue model helps the user determine the required number of primary processing stations and size the baggage claim frontage based on the Design Hour international demand.
Concourse Circulation - This model allows the user to describe a single concourse design and determine the necessary circulation width (including space for moving walkways), the suggested concourse length and total circulation area within the concourse. EXCEL HELP Enabling Macros in Excel
Macros are functions and actions that are running behind the scenes of a spreadsheet. They are commonly triggered by keyboard inputs, buttons, or tabs that link the keyboard action to instructions that perform many routine operations which are sometimes very complex. Macros are useful in data preparation and analysis when the same set of instructions needs to be repeated over and over again; they can help to simplify the process. Macros can also be useful in providing navigation assistance in the use of spreadsheets when there is a pattern to how operations should proceed and in what order.
The Terminal Planning Spreadsheet Models use simple macros that should not
pose any threats to the user’s computer. With a trusted source and the absence of complex code, lower security settings can be safely used to allow the spreadsheet model macros to function properly and safely.
During the initial launch of the spreadsheet models, there should be either a
Security Warning window requesting the user to disable or enable Macros, or a window stating that Macros are already disabled due to the current security level setting. Figure 4 shows examples of Excel macro security warnings.

Terminal Planning Spreadsheet Models – User’s Guide ACRP 07-04
Final User’s Guide -7- August 2009
FIGURE 4 Excel Macro Security Warning Message Examples
If the Enable Macros option was not selected during start up, or the Security Level window appeared, the command buttons will not function and the operational macros will not work. Fortunately, there are a couple of easy steps to get the spreadsheet running properly with macros.
If the ‘Enable Macros’ option was available and not selected, close the Excel file,
restart Excel, select the ‘Enable Macros’ option, and finally, reopen the TRBmodels.xls file. The macros should be operational.
If the ‘Security Level’ setting window appeared, close the file, restart Excel,
change the macro security level to Medium, and finally, reopen the Terminal Planning Spreadsheet Model.xls file. Figure 5 explains the process of changing the Excel macro security level.
From the ‘Tools’ menu, select ‘Macro’ and then ‘Security’. These selections will
launch the ‘Security’ window where the ‘Medium’ setting should be chosen, then click OK. When the file is reopened, the Enable Macros option will be available to choose.

Terminal Planning Spreadsheet Models – User’s Guide ACRP 07-04
Final User’s Guide -8- August 2009
FIGURE 5 Resetting Excel Macro Security Levels

Terminal Planning Spreadsheet Models – User’s Guide ACRP 07-04
Final User’s Guide -9- August 2009
Protecting and Un-Protecting Excel Spreadsheets
Microsoft provides Excel authors the option of protecting spreadsheets at various levels of security. The author can lock cells from being selected or allow the user to select the cell to see the formula or lock some cells with formulas and unlock input cells for changing user data. A knowledgeable excel user is able to make custom changes to a spreadsheet, the password can be provided so that the sheet can be unlocked and the ability to make changes is granted.
Figure 6 explains the process of unlocking the sheet to gain access to changing
the functionality or look of the spreadsheet. From the ‘Tools’ menu, select ‘Protection’ and then ‘Unprotect Sheet’. These
actions will launch the ‘Unprotect Sheet’ window that requires a password. Enter the password and click ‘OK’. The spreadsheet will be unprotected and open to changes. Be cautious when making changes to another author’s work. In most cases it is recommended to back up the work before making changes, to retain a record of the original formulas and formatting that were used.
FIGURE 6 Unprotect Sheets To Access Formulae

Terminal Planning Spreadsheet Models – User’s Guide ACRP 07-04
Final User’s Guide -10- August 2009
DESIGN HOUR DETERMINATION Analysis Techniques
Design Hour passengers historically have had a number of definitions. One approach is to define the Design Hour as the 90th (or 95th) percent busiest hour of the year. This requires keeping track of all of the enplaning and deplaning passengers for every flight during the year, and then ranking these by hour (usually a clock hour) to find the level of activity which accounts for 90% of the annual traffic. While used by some non-U.S. airports, it is a very data-intensive approach for which data is not available for the vast majority of U.S. airports.
In the U.S., the peak hour is typically defined as Peak Hour-Average Day-Peak Month (PHADPM) passengers, and is also often referred to as “Design Hour” passengers. This Guidebook will use the term Design Hour passengers for consistency. The Design Hour measures the number of enplaned and deplaned passengers departing or arriving on aircraft in an elapsed hour of a typically busy (design) day. The Design Hour typically does not correspond exactly to a “clock hour” such as 7:00-7:59 but usually overlaps two “clock hours”, (i.e. 7:20-8:19) reflecting airline scheduling patterns. Design Hour Demand
The Design Hour is not the absolute peak level of activity, nor is it equal to the number of persons occupying the terminal at a given time. It is, however, a level of activity, which the industry has traditionally used to size many terminal facilities. The total number of people in the terminal during peak periods, including visitors and employees, is also typically related to Design Hour passengers.
The Design Hour Determination model focus is on scheduled seats. These can
easily be converted to passengers with the use of an assumed average load factor (percent of seats filled). The model sets up the determination of the Design Hour in such a way that most segments of interest can be determined at the same time (i.e. Domestic/International, Air Carrier/Regional, and Arriving/Departing/Total).
The peak month is described in the model as a percentage of annual passengers
based on historical patterns. This percentage may be modified for future years based on local trends and/or anticipated changes in air service patterns. The peak month may be different for enplaned and deplaned passengers, domestic and international, and so forth. Depending on the number of days in the month, an average day is calculated.
An alternative to using the average day of the month is to use an average
weekday. This is often done at airports where domestic service is the predominant activity and weekend activity is less than weekday activity. Airport records on monthly and daily passenger volumes (as recorded by the airlines) is the best source for determining whether an average day or an average weekday is the appropriate (design) day for the design hour.

Terminal Planning Spreadsheet Models – User’s Guide ACRP 07-04
Final User’s Guide -11- August 2009
If a flight schedule is not being developed, the design hour is estimated as a percentage of daily activity. These percentages (enplaned and deplaned) should be based on actual passenger activity data collected from the airlines for a typical week. As with the peak month, percentages may be modified for the future based on local trends and/or anticipated changes in air service patterns.
The design hour determination model is driven by actual passenger traffic data
to systematically calculate the planning factors that could be used later, in the absence of a design day schedule, to estimate design hour activity. The model’s structure is such that it takes the user through each required step with simple instructions and when to go to the next step. A blue instruction box is used in each tab of the spreadsheet with corresponding step numbers highlighting the area requiring an action. The user must still gather the necessary data for each step, but the process should be simple to follow by doing the actions in the right order.
Figure 7 shows the tab structure for the Design Hour model. The user has
command buttons in each tab that when clicked will jump to the next tab in the right order or the user can just click on the worksheet tabs at the bottom of the screen and follow them in order from 1 to 7.
FIGURE 7 Tabbed Structure of Design Hour Model
Figure 8 is a screen print of the first tab of the Design Hour Determination spreadsheet. The user gathers monthly enplanement data and enters it into the input cells and the normal peak month is determined. The spreadsheet functions can be seen in the light green calculated cells to observe the processes that are being used. The process is not difficult and the spreadsheet is doing some of the work automatically for the user. Once the peak month is determined, an average week from Sunday to Saturday needs to be selected. The user should select a week that does not contain holidays or other anomalies.

Terminal Planning Spreadsheet Models – User’s Guide ACRP 07-04
Final User’s Guide -12- August 2009
FIGURE 8 Design Hour Model TAB 1 Example Operations and scheduled seats data from the average week of the peak month
is then gathered and entered into the input cells on TAB 2 (Figure 9) which helps determine an average day during the peak month. The user must determine the actual day of the month for the selected average week, typically choosing Sunday as the start of the week. Enter that day into cell B9. All of the steps for TAB 2 are again listed in the blue instructions box and the action areas are highlighted with corresponding numbers. The user can observe the percent difference or variation in Step 4 to help in choosing the design day, which will provide the data for the peak hour determination in the following steps. Although the model is set up to use scheduled seats, if actual passenger and operations data for the week is available, this would be preferable.

Terminal Planning Spreadsheet Models – User’s Guide ACRP 07-04
Final User’s Guide -13- August 2009
FIGURE 9 Design Hour Model TAB 2 Example
After determining a design day (normally a Wednesday or Thursday) that most closely resembles the peak month average week’s daily average, a complete schedule of arriving and departing seats for the design day during the peak month is needed for the next step, which will generate 10-minute buckets that will be used to create rolling hours throughout the day. The actual design rolling hour is then determined automatically and traffic charts are generated on TAB 6 with the corresponding data to better describe the chart activity. The complete schedule can be acquired from recent airport data or from the Official Airline Guide (OAG). The OAG data will be actual seats flown or scheduled seats to be flown if the peak month average day is very near in the future.
TABS 3 and 4 are set up to be simple for the user to input the airport or OAG data into the input blocks starting at Row 5 in Column A. Copy and paste the schedule data, as is, into these columns and then update the Pivot Table, if there are international markets that need to be identified. The instructions for these tabs stress the need for the time of departure or arrival to be in the 24-hour format. This is normally the default time setting, but if not, it will need to be adjusted for the model to work properly.
The determination of international and domestic markets was not automated so that in the cases of preclearance efforts, those markets could be treated as each individual airport sees fit. If no markets are selected as international, then there will be no Design Hour international segment identified. In TABS 3 and 4 there is a section that is titled ‘Designation Table for Dom/Int’; this section has a built-in Excel Pivot Table. The section will become populated with a summary of each Destination or Origin airport when the ‘Update Pivot Table’ tab is clicked. This was added so that when the international and domestic segments were truly desired, the user would only have to select each international market once instead of going through what may be a lengthy list and checking for multiple listings. Figure 10 and Figure 11 show Step 5 where the D or I will be selected from a drop down list, as well as the populated table from when Step 3 is completed.

Terminal Planning Spreadsheet Models – User’s Guide ACRP 07-04
Final User’s Guide -14- August 2009
Certain airport markets may have a unique mix of regional aircraft and the appropriate designation as either air carrier or regional may not always follow the FAA guidelines, which use 60 seats as the threshold between air carrier and regional. Cell F3 uses 60 seats as the default which resets when all the inputs are reset, but allows the user to choose the level that best fits the mix of local aircraft and how that mix is interpreted. By adjusting the ‘Regional Level Factor’ as pointed out in Figure 12, the user can control which aircraft will be considered regional and air carrier.
The arrival and departure data that is entered into TABS 3 and 4 will automatically be organized into 10-minute buckets and rolling hours on TAB 5, which is basically an organized summary sheet that displays the Design Hour for arriving, departing, and total seats, as shown in Figure 13. With specific knowledge of the operations at local airports, the determined Design Hours should be within the expected range based on personal experience of the user.
FIGURE 10 Design Hour Model TAB 3 Example

Terminal Planning Spreadsheet Models – User’s Guide ACRP 07-04
Final User’s Guide -15- August 2009
FIGURE 11 Design Hour Model TAB 3 Example
FIGURE 12 Design Hour Model TAB 4 Example

Terminal Planning Spreadsheet Models – User’s Guide ACRP 07-04
Final User’s Guide -16- August 2009
FIGURE 13 Design Hour Model TAB 5 Example The model highlights the peak bucket and rolling hour period in each section
with yellow and red markings (Figure 14). In addition, the percent of the design day that the Design Hour represents is also calculated within this tab and will be displayed on TAB 7, ‘Design Hour Forecast’.
FIGURE 14 Example of Peak Buckets Figure 14 also shows the top of the table on TAB 5 where Row 7 contains the
percent of daily activity that the Design Hour, for Arriving, Departing, and Total seats, represent.
TAB 6, as shown in Figure 15, graphically illustrates the rolling hour data from
TAB 5. The data included in TAB 6 charts, is for total activity (domestic, international, air carrier, and regional), but can be modified by the user to illustrate any subset of data from TAB 5. As shown, the Design Hour usually does not occur in a clock hour, but across two hours.

Terminal Planning Spreadsheet Models – User’s Guide ACRP 07-04
Final User’s Guide -17- August 2009
FIGURE 15 Design Hour for Departing Passengers
The final tab in the Design Hour Determination Model allows the user to see the calculated planning factors for Peak Month, Average Day, and Design Hour, and the effect that these factors can have on the Design Hours used in future planning levels. Knowledge of these average values for planning factors and understanding their impact can allow the user to make valid use of them in the absence of a design day schedule. The planning factors from the Design Hour exercise are boxed in red on Figure 16, which is a screen print of TAB 7.
Generally, historic data on aircraft activity at the airport in question or a
comparable facility can be used to derive planning factors that are used to divide annual demand into Average Day of the Peak Month (ADPM) and Average Day Peak Hour (ADPH) values. Analysis of U.S. Department of Transportation (USDOT) databases on origin and destination (O&D) travel (10% ticket survey) and connecting travel can be used to derive factors that calculate connecting vs. O&D traffic flows. Factor analysis at airline connecting hubs can yield poor results, if the factors are not calibrated with other locally available data.

Terminal Planning Spreadsheet Models – User’s Guide ACRP 07-04
Final User’s Guide -18- August 2009
FIGURE 16 Peak Factors Factor Analyses
Regardless of the analysis method used to derive the Design Hour volumes of
passenger and aircraft activity, the method used to create the analysis must be calibrated against data or observations that describe actual operations at the airport.
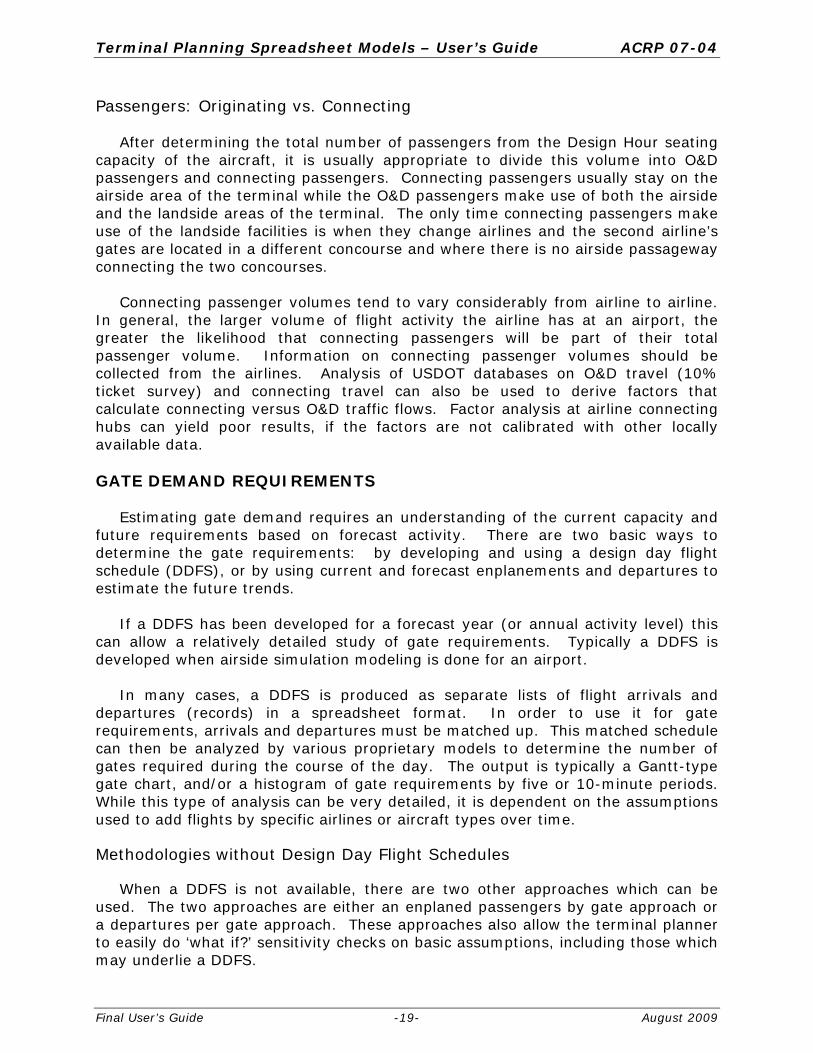
Terminal Planning Spreadsheet Models – User’s Guide ACRP 07-04
Final User’s Guide -19- August 2009
Passengers: Originating vs. Connecting After determining the total number of passengers from the Design Hour seating
capacity of the aircraft, it is usually appropriate to divide this volume into O&D passengers and connecting passengers. Connecting passengers usually stay on the airside area of the terminal while the O&D passengers make use of both the airside and the landside areas of the terminal. The only time connecting passengers make use of the landside facilities is when they change airlines and the second airline’s gates are located in a different concourse and where there is no airside passageway connecting the two concourses.
Connecting passenger volumes tend to vary considerably from airline to airline.
In general, the larger volume of flight activity the airline has at an airport, the greater the likelihood that connecting passengers will be part of their total passenger volume. Information on connecting passenger volumes should be collected from the airlines. Analysis of USDOT databases on O&D travel (10% ticket survey) and connecting travel can also be used to derive factors that calculate connecting versus O&D traffic flows. Factor analysis at airline connecting hubs can yield poor results, if the factors are not calibrated with other locally available data. GATE DEMAND REQUIREMENTS
Estimating gate demand requires an understanding of the current capacity and
future requirements based on forecast activity. There are two basic ways to determine the gate requirements: by developing and using a design day flight schedule (DDFS), or by using current and forecast enplanements and departures to estimate the future trends.
If a DDFS has been developed for a forecast year (or annual activity level) this
can allow a relatively detailed study of gate requirements. Typically a DDFS is developed when airside simulation modeling is done for an airport.
In many cases, a DDFS is produced as separate lists of flight arrivals and
departures (records) in a spreadsheet format. In order to use it for gate requirements, arrivals and departures must be matched up. This matched schedule can then be analyzed by various proprietary models to determine the number of gates required during the course of the day. The output is typically a Gantt-type gate chart, and/or a histogram of gate requirements by five or 10-minute periods. While this type of analysis can be very detailed, it is dependent on the assumptions used to add flights by specific airlines or aircraft types over time.
Methodologies without Design Day Flight Schedules
When a DDFS is not available, there are two other approaches which can be used. The two approaches are either an enplaned passengers by gate approach or a departures per gate approach. These approaches also allow the terminal planner to easily do ‘what if?’ sensitivity checks on basic assumptions, including those which may underlie a DDFS.

Terminal Planning Spreadsheet Models – User’s Guide ACRP 07-04
Final User’s Guide -20- August 2009
The Gate Demand model is set up like the other spreadsheet models with links to the Table of Contents and the User’s Guide, and uses color-coded cells for consistency, see Figure 17. The two methods of determining gate demand without a DDFS are used in the model as outlined in the Guidebook.
FIGURE 17 Gate Demand Model Average Passengers per Gate Approach
The first approach, as shown in Figure 18, uses the current ratio of annual
passengers per gate, adjusted for forecast changes in fleet mix and annual load factors. This methodology assumes that the pattern of gate utilization will remain relatively stable over the forecast period. The changes in passengers per gate would be due to changes in enplanements per departure (due to fleet seating capacity and/or passenger load factors), as opposed to increasing (or decreasing) numbers of departures per gate.
FIGURE 18 Example of Enplaned Passengers per Gate Approach Method The basis for the existing factor is the number of gates in use. This may be less
than the number of gates available at an airport. In rare cases of over-crowded terminals, aircraft may be double parked at existing gates, so it is important to determine the true demand for active aircraft parking. From the existing passenger activity and annual departures, the current ratios of annual passengers per gate and enplanements per departure are calculated. Similar calculations can be based on total annual passengers, airline operations, or a combination of these, depending on how the airport keeps its statistics and develops its forecasts.

Terminal Planning Spreadsheet Models – User’s Guide ACRP 07-04
Final User’s Guide -21- August 2009
Forecasts for annual enplaned passengers and aircraft departures (or total passengers and aircraft operations) are usually forecast separately. Annual departures are typically forecast based on assumptions for fleet size and load factors that are applied to the passenger forecasts.
In the model example in Figure 18, the ratio of enplaned passengers per gate
for each forecast year is calculated by multiplying the current (2008 in this example) factor by the percentage increase in enplaned passengers per aircraft departure. For example, enplaned passengers per departure increases from 54 in 2008 (actual) to 56 in 2010 (forecast), thus the factor would increase from 94,400 enplaned passengers per gate (2008 data when 36 gates were in use) to 97,500 for 2010, and 102,600 enplaned passengers per gate by the end of the forecast period without any further increase in the number of daily departures per gate.
Future gate requirements are then estimated by dividing annual forecast
passengers by the estimated passengers per gate factor for that forecast period. For example, in 2010, 4,429,000 enplanements divided by 97,500 enplanements per gate results in a demand for 45 gates. This approach results in a forecast demand for 69 gates by the end of the forecast period.
Departures per Gate Approach
The first methodology has as an underlying assumption that the future pattern
of air service will be stable and will resemble existing conditions. While this may be true at many airports and for some airlines at a given airport, it is often likely that gate utilization will change to some extent for other airlines. With a forecast reduction in mainline jets, for example, additional flights by regional aircraft may be scheduled as demand grows. Similarly, airlines may add flights to their hubs from spoke cities. This typically results in higher average gate utilization.
However, if an airport attracts service by new entrant airlines, it is often likely
that these carriers would initially follow scheduling patterns similar to existing carriers. This could result, for example, in a demand for more gates during the morning departure peak, and a reduction in average daily gate utilization.
For the Departures per Gate approach from the model (example shown in
Figure 19) the ratio of annual departures per gate for each forecast year is calculated by multiplying the current (2008) factor by the percentage change in assumed daily departures per gate. In this example, it was assumed that average daily gate utilization would increase from 5.0 departures per gate in 2008, to 5.2 departures per gate by 2010, and gradually increase to 6.5 departures per gate by 2025. Thus, the annual gate utilization factor would increase from 1,750 annual departures per gate (2008) to 2,290 by 2025.

Terminal Planning Spreadsheet Models – User’s Guide ACRP 07-04
Final User’s Guide -22- August 2009
FIGURE 19 Example of Departures per Gate Approach Method Future gate requirements are estimated by dividing annual forecast departures
by the estimated departures per gate factor for that forecast period. For example, in 2010, 79,500 departures divided by 1,820 departures per gate results in a demand for 44 gates. This approach results in a forecast demand for only 53 gates by the end of the forecast period.
For most airports which assume increasing gate utilization, the Departures per
Gate Approach will result in a demand for fewer gates than the Annual Passengers per Gate method.
The model converges the results from the two methods as an average to
compare the future gate requirements as a range. The planner will then need to compare the values within the range and sensitively determine the most reasonable and likely outcome. See Figure 20.
Passengers DeparturesYear per Gate per Gate GATES2010 45 44 452015 52 47 502020 61 50 562025 69 53 61
Average of Both Methods
FIGURE 20 Comparison of Gate Analysis Approaches Once the gate requirements have been determined, the other ground
requirements can be further quantified by relating the future DDFS to available gates. If the flight schedule suggests more aircraft than available gates or for early morning high turnover gates due to airline schedules, then additional aircraft parking spots will be required.

Terminal Planning Spreadsheet Models – User’s Guide ACRP 07-04
Final User’s Guide -23- August 2009
Remain Overnight (RON) Aircraft Parking At many airports, the pattern of airline service results in more aircraft being on
the ground overnight than the number of active gates. This is more pronounced at “spoke airports” where an airline may have, for example, hourly service to it’s hub for the first few hours of the day. It may take until mid-morning before aircraft begin to arrive, thus a single gate may generate two to three aircraft departures which must be parked overnight (RON). These RON aircraft are usually parked remotely, or in some cases double parked on contact gates where the apron geometry allows. If RON aircraft are parked remotely, the aircraft are typically towed to a contact gate for departure, and towed off a contact gate to the RON parking area after the evening arrival.
Estimating the number of RON positions should take into account the airport’s
air service pattern, the forecasts for cities to be served in the future, whether these are hubs or direct destination flights, and the relative utilization of gates.
Gate Equivalents
Airport comparisons are also frequently made on the basis of passengers per
gate or terminal area per gate, but these lack a consistent definition of the term "gate." To standardize the definition of "gate" when evaluating aircraft utilization and requirements, two metrics have been developed: Narrowbody Equivalent Gate (NBEG) and Equivalent Aircraft (EQA).
The model includes a Gate Equivalencies Table (see Figure 21) to serve as a gate inventory during the gate demand process, showing available leased or forecast gates. This inventory is useful to other model segments where the EQA or NBEG values may be needed as factors that help determine other space requirements. The user needs to input the number of gates for each design group, and the total and equivalent values will be calculated. The calculated values are the cumulative sum product of the gate share and the index values.

Terminal Planning Spreadsheet Models – User’s Guide ACRP 07-04
Final User’s Guide -24- August 2009
FIGURE 21 Computing EQA and NBEG Gate Equivalents Additional Information on NBEG and EQA Narrowbody Equivalent Gate (NBEG)
This metric is used to normalize the apron frontage demand and capacity to that of a typical Narrowbody aircraft gate. The amount of space each aircraft requires is based on the maximum wingspan of aircraft in its respective aircraft group. FAA Airplane Design Groups used to define runway/taxiway dimensional criteria have been used to classify the aircraft as follows:
FIGURE 22 Narrowbody Equivalent Gate (NBEG) Index
Group IIIa has been added to more accurately reflect the B757 which has a wider wingspan than Group III but is substantially less than a typical Group IV aircraft. A wingspan comparison is illustrated in Figure 23.
In developing terminal facilities requirements, the apron frontage of the terminal, as expressed in NBEG, is a good determinant for some facilities, such as secure circulation. Terminal concepts can also be more easily compared by normalizing different gate mixes.
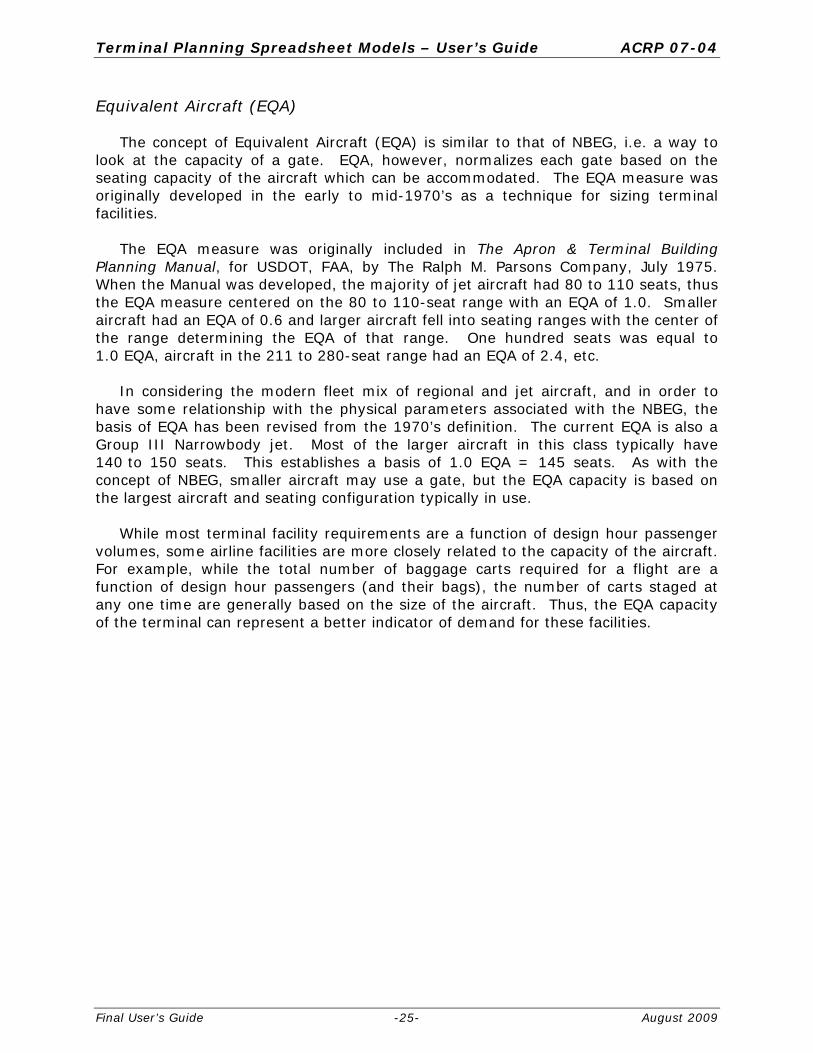
Terminal Planning Spreadsheet Models – User’s Guide ACRP 07-04
Final User’s Guide -25- August 2009
Equivalent Aircraft (EQA)
The concept of Equivalent Aircraft (EQA) is similar to that of NBEG, i.e. a way to look at the capacity of a gate. EQA, however, normalizes each gate based on the seating capacity of the aircraft which can be accommodated. The EQA measure was originally developed in the early to mid-1970’s as a technique for sizing terminal facilities.
The EQA measure was originally included in The Apron & Terminal Building
Planning Manual, for USDOT, FAA, by The Ralph M. Parsons Company, July 1975. When the Manual was developed, the majority of jet aircraft had 80 to 110 seats, thus the EQA measure centered on the 80 to 110-seat range with an EQA of 1.0. Smaller aircraft had an EQA of 0.6 and larger aircraft fell into seating ranges with the center of the range determining the EQA of that range. One hundred seats was equal to 1.0 EQA, aircraft in the 211 to 280-seat range had an EQA of 2.4, etc.
In considering the modern fleet mix of regional and jet aircraft, and in order to
have some relationship with the physical parameters associated with the NBEG, the basis of EQA has been revised from the 1970’s definition. The current EQA is also a Group III Narrowbody jet. Most of the larger aircraft in this class typically have 140 to 150 seats. This establishes a basis of 1.0 EQA = 145 seats. As with the concept of NBEG, smaller aircraft may use a gate, but the EQA capacity is based on the largest aircraft and seating configuration typically in use.
While most terminal facility requirements are a function of design hour passenger
volumes, some airline facilities are more closely related to the capacity of the aircraft. For example, while the total number of baggage carts required for a flight are a function of design hour passengers (and their bags), the number of carts staged at any one time are generally based on the size of the aircraft. Thus, the EQA capacity of the terminal can represent a better indicator of demand for these facilities.
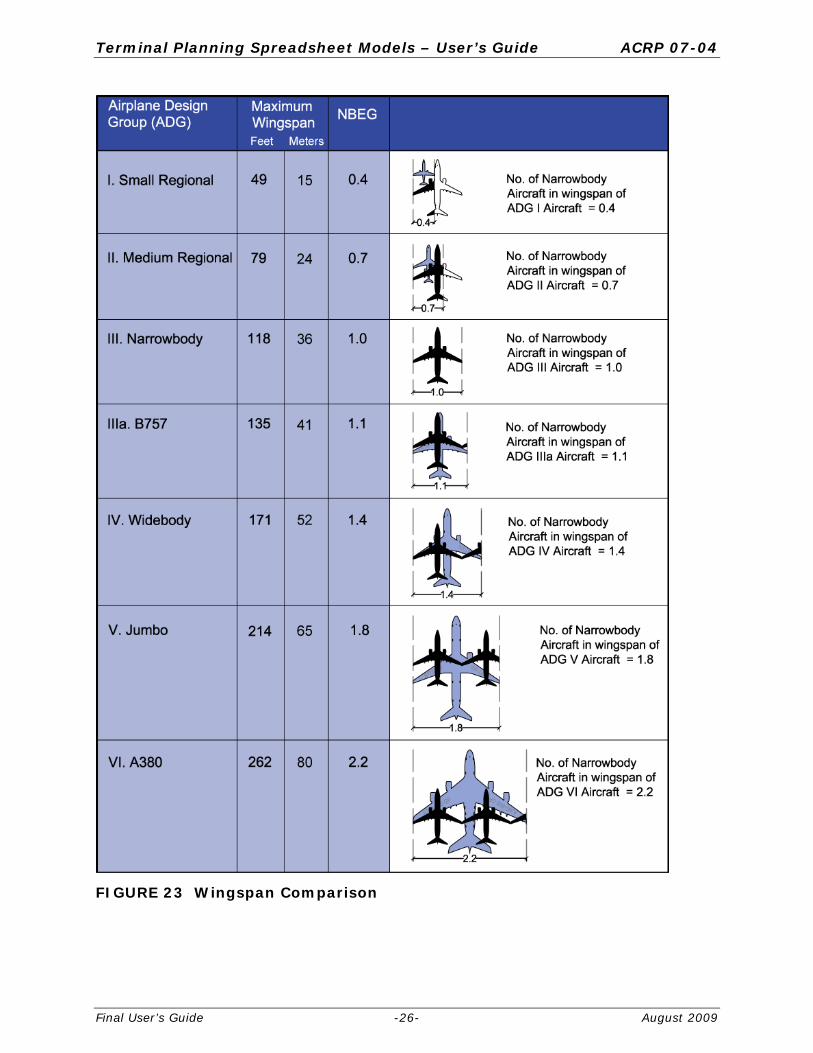
Terminal Planning Spreadsheet Models – User’s Guide ACRP 07-04
Final User’s Guide -26- August 2009
FIGURE 23 Wingspan Comparison
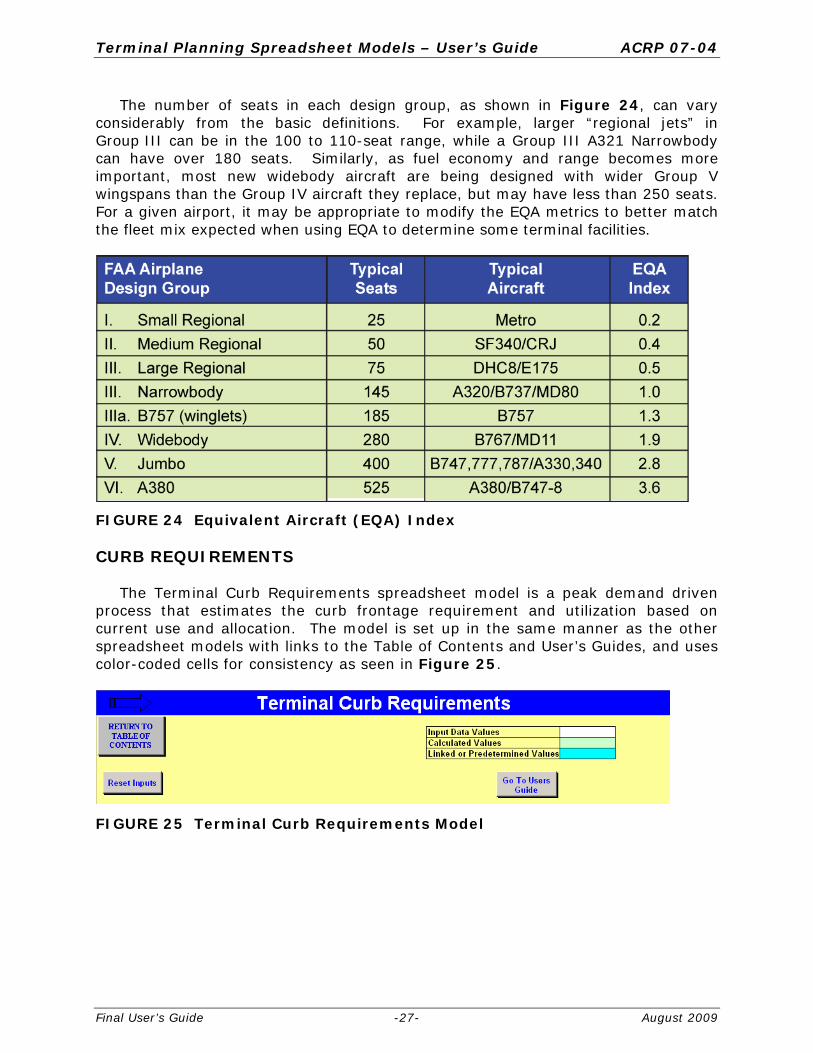
Terminal Planning Spreadsheet Models – User’s Guide ACRP 07-04
Final User’s Guide -27- August 2009
The number of seats in each design group, as shown in Figure 24, can vary considerably from the basic definitions. For example, larger “regional jets” in Group III can be in the 100 to 110-seat range, while a Group III A321 Narrowbody can have over 180 seats. Similarly, as fuel economy and range becomes more important, most new widebody aircraft are being designed with wider Group V wingspans than the Group IV aircraft they replace, but may have less than 250 seats. For a given airport, it may be appropriate to modify the EQA metrics to better match the fleet mix expected when using EQA to determine some terminal facilities.
FIGURE 24 Equivalent Aircraft (EQA) Index CURB REQUIREMENTS
The Terminal Curb Requirements spreadsheet model is a peak demand driven
process that estimates the curb frontage requirement and utilization based on current use and allocation. The model is set up in the same manner as the other spreadsheet models with links to the Table of Contents and User’s Guides, and uses color-coded cells for consistency as seen in Figure 25.
FIGURE 25 Terminal Curb Requirements Model

Terminal Planning Spreadsheet Models – User’s Guide ACRP 07-04
Final User’s Guide -28- August 2009
The terminal curbfront on an airport is a complex operating environment. There are many types of vehicles that approach and stop at the curb. These include private autos, taxis, limos, parking lot buses, rental car buses, regional buses, and shuttles and shuttle buses for hotels and motels. Significant curbfront capacity is required to accommodate the maneuvering necessary for vehicles to pull to the curb, stop to load and unload passengers and luggage, and pull away from the curb to merge back into the traffic stream. The curbfront area can be divided into two sections: pedestrian facilities and vehicle facilities.
Many airports have a pedestrian island between vehicle travel lanes, particularly
at the arrivals curbfront, but occasionally at the departures curbfront as well. This island separates the curb lanes into two traffic streams and enables the airport to provide two parallel curbfronts for passenger pick-up or drop-off, in an equivalent length of terminal building. The curbfront areas are usually separated into passenger car and commercial vehicle (parking shuttles, rental car shuttles, hotel/motel shuttles, etc.) areas.
Figure 26 shows an example curbfront with a pedestrian island. In this
example, the inner curbfront (closest to the terminal building) is designated for commercial vehicles, while the outer curbfront serves private vehicles. Crosswalks are provided between the terminal building and the pedestrian island. The orientation of the commercial and passenger vehicle lanes varies by airport.
Source: Silverman, Fred. “Terminal Groundside Access Systems”, Landrum & Brown
FIGURE 26 Curbfront with Pedestrian Island

Terminal Planning Spreadsheet Models – User’s Guide ACRP 07-04
Final User’s Guide -29- August 2009
Curb Vehicle Facilities
The curbfront provides access to the terminal buildings for pedestrians by way of private vehicles, as well as commercial vehicles such as shuttle buses, taxis, etc. The innermost lane (closest to the terminals) is essentially a short-term parking lane, dedicated to vehicles stopping to drop-off/pick-up passengers. Vehicles pull into an empty space at the curb, load or unload, and then pull out. At all but the smallest, low activity terminals, the second lane is used by both double-parked vehicles, as well as a transition lane, used by vehicles pulling in and out of the curbfront. The third lane is a transition/weaving lane. The fourth lane (and fifth, if one exists at very large airports with multiple unit terminals) is used by vehicles driving past the curb. Therefore, at all but the smallest airports, the minimum number of curbfront lanes is recommended to be four, because it is expected that the second lane may be partially blocked during peak drop-off/pick-up times.
Because of the nature of curbfront facilities, throughput per lane is greatly
reduced compared to typical roadway facilities with the same number of lanes. Therefore, there is a need to provide additional curbfront lanes to handle peak loads. Ideally, the roadway will provide enough capacity to accommodate expected traffic volumes even if a through lane is blocked due to maneuvering vehicles and double or triple parking.
Curbfront facilities work most efficiently if the curbfront is divided into sections
that each serves a different vehicle type. This limits conflict between different types and sizes of vehicles, as well as spreading the vehicle load throughout the entire curbfront. The curbfront is typically allocated among private vehicles, buses/shuttles, and taxis/limos. The bus/shuttle section of curbfront may be further allocated into separate areas for rental car shuttles, hotel/motel shuttles, parking shuttles, etc. This is particularly useful at the arrivals curbfront, so that patrons waiting for a particular shuttle know where to stand to wait for the shuttle’s arrival.
The curb typically runs the length of the terminal building. Passengers tend not
to use any curbfront area beyond the end doors of the building. However, some of the vehicle drop offs (such as commercial vehicles) can be located beyond the end doors. For shorter terminals, pedestrian islands may be necessary in order to achieve the curbfront capacity needed.
Another important component of curbfront capacity comes in the form of dwell
times. At the arrivals curbfront, vehicles will often stop to wait for arriving passengers if sufficient curbfront enforcement is not present. Most airports today enforce a policy of not allowing vehicles to stop at the curbfront unless the driver can see their arriving passenger waiting at the curb. Long dwell times are less of a problem at the departure curbfront, where most drivers drop off their passengers and depart immediately.
Figure 27 shows the Curb Requirements model and illustrates the basic flow
that yields the outputs of required Curb Frontage from the peak 15 minutes of demand and the comparison to existing curbfront length with the Percent Utilized.

Terminal Planning Spreadsheet Models – User’s Guide ACRP 07-04
Final User’s Guide -30- August 2009
FIGURE 27 Example of Curb Requirements
The Terminal Curb Requirements model uses the following approach in estimating frontage demand.
Passenger Survey data is used to find the modal splits and vehicle occupancies
for passenger traffic to and from the airport. The factors are used with the Design Hour passenger volume to generate demand for autos, taxis, limos, and some other commercial vehicles. Bus and some shuttle schedules should be consulted to determine their peak frequencies. The Peak 15 minutes of the Design Hour can be determined through a design day analysis or by observations. If data at the 15-minute detail level is not available, design hour or peak hour data can also be used with a peak 15-minute percentage. If traffic is considered to be evenly distributed during the design hour, the peak 15 minutes would equal 25% of hourly activity. Other inputs include dwell times, vehicle lengths, and multiple stop factors. These inputs will generate the associated frontage demand for each vehicle type and the total curb frontage required.
A primary element of curbfront LOS is the ability to find a space for loading or
unloading. The probability of finding an empty curb space or having to double park is typically used to describe LOS. The curbside capacity is considered to be the double parking capacity of the curb. This assumes a four-lane roadway with double parking allowed. LOS is then based on the percentage of the double parking capacity as follows:
A. Parking demand equal to or less than 50% of double parking capacity B. Parking demand is between 50% and 55% of double parking capacity C. Parking demand is between 55% and 65% of double parking capacity D. Parking demand is between 65% and 85% of double parking capacity E. Parking demand is between 85% and 100% of double parking capacity F. Parking demand exceeds 100% of double parking capacity

Terminal Planning Spreadsheet Models – User’s Guide ACRP 07-04
Final User’s Guide -31- August 2009
Further explanation of the curb length estimation process:
Traffic Volumes by Travel Classification is airport specific and is based on the operations of the airport. Typically, travel classifications such as private automobiles, taxis, limousines, and various shuttles serve the curbfront. These Design Hour volumes will need to be determined to calculate the curbfront capacity at each location. These volumes can be determined three ways:
1) Collect existing data at the location
2) Collect data at similar airport facility
3) Estimate the traffic volumes using the following formula
Estimated Traffic
Volumes
Originating Passengers
% Departures or % Arrivals
Curbfront Mode Split= xx
Estimated Traffic
Volumes
Originating Passengers
% Departures or % Arrivals
Curbfront Mode Split= xx
Curbfront mode split can be determined by passenger survey on mode of arrival to the airport (which is typically how they will also leave the airport) and party size. To determine the number of shuttles or other buses, the type of rental car facilities, and number of local hotels providing airport shuttles, and number of bus or shuttle services providing service to the airport must be established. Furthermore, there will be fewer shuttle trips if a consolidated rental car campus is planned rather than rental car companies running individual shuttles. If no specific headway data is available, the general headway data shown in Figure 28 can be used.
FIGURE 28 General Headway Times By Travel Classification
To determine the curbfront traffic volume for one of these modes, multiply the number of companies servicing the airport by the headway and convert to vehicles per hour.
Dwell times should be collected during the Design Hour to determine the maximum utilization of the curbfront. A main component of dwell time is enforcement. Where there is strict enforcement of the curbfront, dwell times are typically shorter than where enforcement is not as strict. If existing data is available, that would be best, however, data can be collected at a similar airport facility or the following dwell times may be used. The dwell times listed in Figure 29 are presented by travel classification with the assumption of relatively strict enforcement.

Terminal Planning Spreadsheet Models – User’s Guide ACRP 07-04
Final User’s Guide -32- August 2009
FIGURE 29 Dwell Time By Travel Classification
One thing to consider is that arriving and departing vehicles of the same travel classification may not have the same dwell times.
Vehicle length helps determine the amount of room on the curbfront that the vehicles use when parked. Figure 30 provides general lengths to be used in the analysis. These lengths include additional room to compensate for the space between vehicles on the curbfront.
FIGURE 30 Vehicle Length By Travel Classification
These values can be used in the analysis instead of measuring specific lengths at the airport. However, if the airport has other travel classifications at the curbfront, then specific lengths may need to be determined for that travel classification.
Another factor to consider is whether a multiple stop factor is appropriate for the curbfront. A multiple stop factor should be applied when a vehicle, typically shuttles, would stop multiple times along one curbfront. This is most common at airports having a shared curbfront between multiple terminals and the walking distance is too far to expect passengers to travel to a central location with their luggage.
Considering all of these factors, the desired curbfront utilization can be determined. Once this has been established, the required size of the curbfront can be determined by summing the demand of all modes of travel. Demand can be calculated by Volume x Dwell Time x Vehicle Length, then converting it to demand by hour or 15-minute peak within the peak hour for each mode. Total demand compared to the desired curbfront utilization will result in required curbfront length.
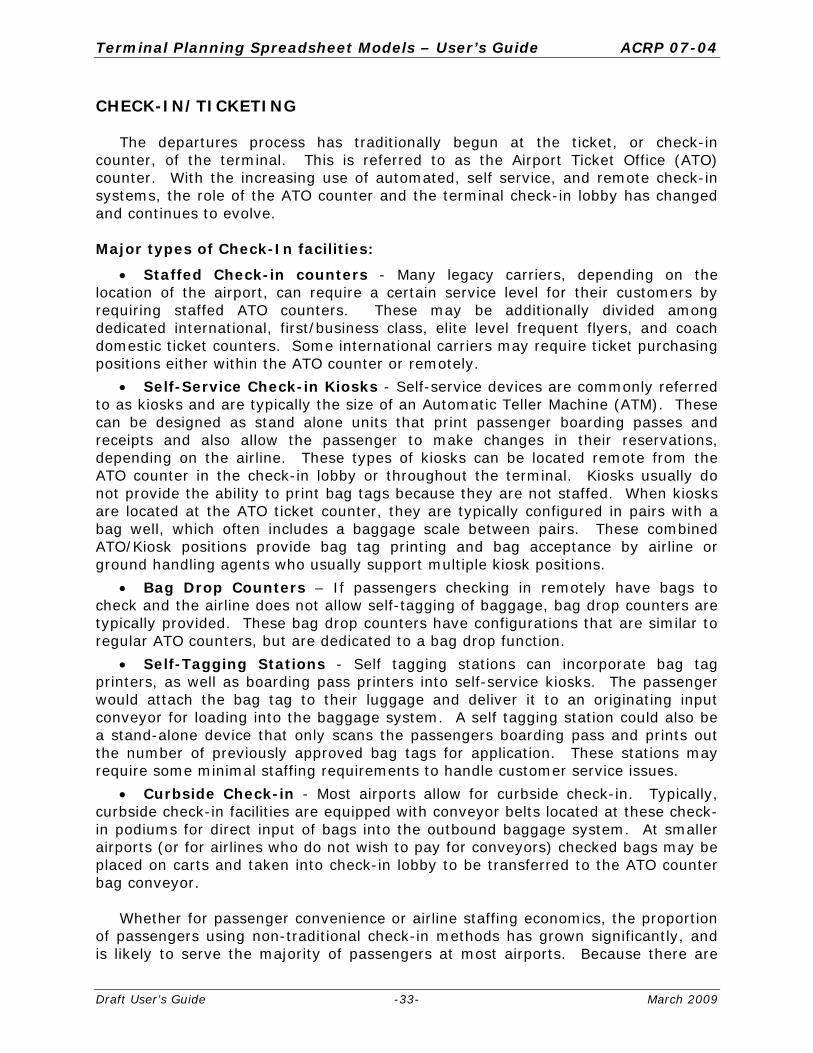
Terminal Planning Spreadsheet Models – User’s Guide ACRP 07-04
Draft User’s Guide -33- March 2009
CHECK-IN/TICKETING
The departures process has traditionally begun at the ticket, or check-in counter, of the terminal. This is referred to as the Airport Ticket Office (ATO) counter. With the increasing use of automated, self service, and remote check-in systems, the role of the ATO counter and the terminal check-in lobby has changed and continues to evolve. Major types of Check-In facilities:
Staffed Check-in counters - Many legacy carriers, depending on the location of the airport, can require a certain service level for their customers by requiring staffed ATO counters. These may be additionally divided among dedicated international, first/business class, elite level frequent flyers, and coach domestic ticket counters. Some international carriers may require ticket purchasing positions either within the ATO counter or remotely.
Self-Service Check-in Kiosks - Self-service devices are commonly referred to as kiosks and are typically the size of an Automatic Teller Machine (ATM). These can be designed as stand alone units that print passenger boarding passes and receipts and also allow the passenger to make changes in their reservations, depending on the airline. These types of kiosks can be located remote from the ATO counter in the check-in lobby or throughout the terminal. Kiosks usually do not provide the ability to print bag tags because they are not staffed. When kiosks are located at the ATO ticket counter, they are typically configured in pairs with a bag well, which often includes a baggage scale between pairs. These combined ATO/Kiosk positions provide bag tag printing and bag acceptance by airline or ground handling agents who usually support multiple kiosk positions.
Bag Drop Counters – If passengers checking in remotely have bags to check and the airline does not allow self-tagging of baggage, bag drop counters are typically provided. These bag drop counters have configurations that are similar to regular ATO counters, but are dedicated to a bag drop function.
Self-Tagging Stations - Self tagging stations can incorporate bag tag printers, as well as boarding pass printers into self-service kiosks. The passenger would attach the bag tag to their luggage and deliver it to an originating input conveyor for loading into the baggage system. A self tagging station could also be a stand-alone device that only scans the passengers boarding pass and prints out the number of previously approved bag tags for application. These stations may require some minimal staffing requirements to handle customer service issues.
Curbside Check-in - Most airports allow for curbside check-in. Typically, curbside check-in facilities are equipped with conveyor belts located at these check-in podiums for direct input of bags into the outbound baggage system. At smaller airports (or for airlines who do not wish to pay for conveyors) checked bags may be placed on carts and taken into check-in lobby to be transferred to the ATO counter bag conveyor. Whether for passenger convenience or airline staffing economics, the proportion of passengers using non-traditional check-in methods has grown significantly, and is likely to serve the majority of passengers at most airports. Because there are

Terminal Planning Spreadsheet Models – User’s Guide ACRP 07-04
Final User’s Guide -34- August 2009
different ways a passenger can check-in, or check a bag after checking in remotely (by internet, remote kiosk, or other means), the ticket lobby may accommodate the different types of facilities described above and possibly others which may be developed in the future.
The Check-In model is formatted like all of the other models and uses a color-coded cell system to differentiate different types of cells.
The top of the model is a dashboard of current settings and status for the inputs and conditions that the user is entering. In Figure 31 the dashboard shows the status summary, as well as some ratios such as check-in positions per EQA that can be compared to other similar airports.
FIGURE 31 Ticketing Model Dashboard Example
The Check-In/Ticketing Model incorporates the Staffed Counter positions, Kiosk positions, and Curbside positions. However, the three basic models can be used for any type of future check-in procedure, such as self tagging, with the appropriate inputs. Use the toggle buttons as seen in Figure 32 to auto scroll the screen to work on one area at a time.
FIGURE 32 Toggle Buttons
In most of the input cells, a small red triangle will be in the upper right corner, signifying that a comment has been attached to give more explanation to the input requirements and/or more information on the general ranges. Some inputs and their title lines are conditionally formatted to alert the user to the possibility of an input error. The user can either keep the entered value if it is truly correct, or make a change to fall within the expected range, and the highlighted areas will return to the normal appearance. See Figure 33.

Terminal Planning Spreadsheet Models – User’s Guide ACRP 07-04
Final User’s Guide -35- August 2009
FIGURE 33 Staffed Counter Spreadsheet Model Example
The terminal planner should be aware of the various systems and procedures in use, or expected to be used, as the check-in lobby and related spaces are planned. Flexibility in configuration and design is especially important for this evolving passenger processing function.
The Design Hour Forecast Worksheet should have been completed before doing this step or an estimated design hour value will need to be used. If an estimate is used, enter the value into cell C11 in the Staffed Counters section and this will break the link to the Design Hour Forecast Worksheet and the other dependant cells will use this value as well.
Work on one section at a time and when all of the inputs have been entered, check over the sections again to see if there are any errors or alerts. When all the inputs have been made, the user can make adjustments to the queue model inputs for the Staffed Counters and Kiosks to achieve the desired wait times and passenger queue spacing. Figures 34, 35, and 36 show the way common inputs are linked.
FIGURE 34 Staffed Counter Spreadsheet Model Links
FIGURE 35 Kiosk Spreadsheet Model Links

Terminal Planning Spreadsheet Models – User’s Guide ACRP 07-04
Final User’s Guide -36- August 2009
FIGURE 36 Curbside Spreadsheet Model Links
Figure 37 illustrates the use of Suggestion Boxes for the user to use in achieving the desired results for wait times and passenger spacing by adjusting the queue model’s number of Service Positions.
FIGURE 37 Suggestion Boxes
Although demand estimates can be done if sufficient information is available, the number of ATO counter positions can often be as much an issue of airline back wall ‘billboard’ space as actual demand, and/or staffing. Thus, some airlines will prefer to locate self-service kiosks in-line with the ATO counter, effectively replacing staffed counters, while others prefer to locate kiosks in free-standing clusters or other configurations away from the ATO counter.
The Check-In model is designed to approach the issue of determining the required number of positions from a single airline or common use perspective. The models’ approach can then be adjusted for additional airlines and the results of each airline can later be summed.
Regardless of the mix of facilities, the approach to determining the facilities for check-in requires essentially the same information:
The number of Design Hour enplaning O&D passengers
The number of airlines
The time distribution of passengers arriving at the terminal
Average service times and maximum waiting time targets
The percentage of passengers using each type of facility in the ticket lobby vs. other locations or going directly to the gate
Use of curbside bag check-in or fully remote bag check-in
The model must have all of the above data in order to produce an accurate estimate of check-in facility demand.
In order to get the basic understanding of a queuing model without having to create a full scale design day queuing model, a mini queue model has been created
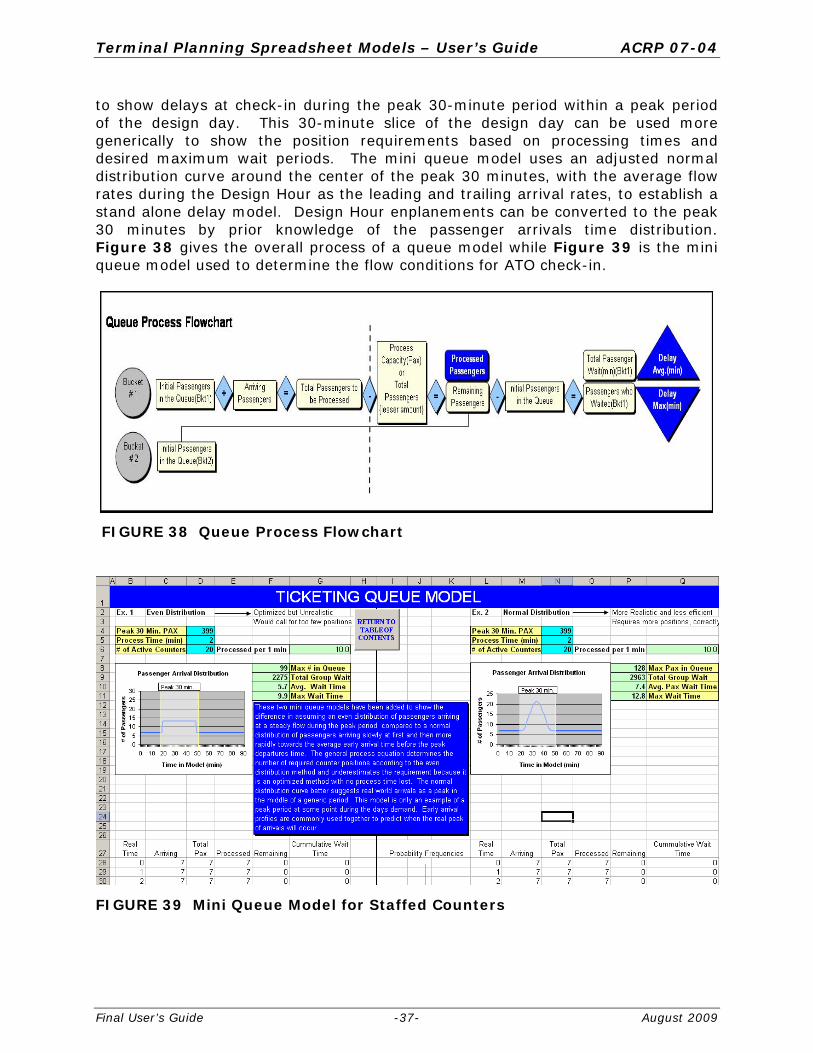
Terminal Planning Spreadsheet Models – User’s Guide ACRP 07-04
Final User’s Guide -37- August 2009
to show delays at check-in during the peak 30-minute period within a peak period of the design day. This 30-minute slice of the design day can be used more generically to show the position requirements based on processing times and desired maximum wait periods. The mini queue model uses an adjusted normal distribution curve around the center of the peak 30 minutes, with the average flow rates during the Design Hour as the leading and trailing arrival rates, to establish a stand alone delay model. Design Hour enplanements can be converted to the peak 30 minutes by prior knowledge of the passenger arrivals time distribution. Figure 38 gives the overall process of a queue model while Figure 39 is the mini queue model used to determine the flow conditions for ATO check-in.
FIGURE 38 Queue Process Flowchart
FIGURE 39 Mini Queue Model for Staffed Counters

Terminal Planning Spreadsheet Models – User’s Guide ACRP 07-04
Final User’s Guide -38- August 2009
The approach that is used in the spreadsheet model allows the user to determine the Design Hour O&D passengers departing during the peak 30 minutes, based on the arrivals distribution. That number is split into the three main areas of check-in by profile data gathered through surveys and then the 30-minute model is run for each area and the totals summed by airline or by for the airport as a common use facility.
One advantage of this approach is that it allows the planner to include LOS assumptions for waiting time. However, it also requires data (or estimates) for average processing times and the arrival time distribution. It must also be done separately for each airline or group of airlines (assuming the Design Hour occurs at a similar time for the airlines, or some type of common-use facility). Otherwise adjustments must be made for exclusive-use check-in positions, which may not be in use by airlines during the terminal’s peak.
The standard Staffed Counters check-in queue is normally the major source of check-in delay, but with more travelers using self check-in options, the queue for using the Kiosks may be the queue to focus on. Both Staffed Counter and Kiosk portions of the Check-In/Ticketing Model have mini queue models that measure the passengers in queue and the maximum wait times based on the passenger and position inputs. The model will help determine the current LOS conditions and, by adjusting the position inputs for the mini queue models, the user will see the time and space effects from position allocation.
When obtaining data on processing times for staffed or self-service check-in facilities, caution should be used with airline furnished data. Typically these service times only reflect the time an agent or kiosk is in use for a transaction (from log-in to delivery of boarding passes) and thus underestimates the full time taken by each passenger to complete the check-in process and walk away, making the position available for the next passenger.
Depending on the type of flight (domestic or international) and time of day (flights departing before or after 9 a.m.), the peak 30 minutes of a flight’s passengers arriving for check-in can range from 30 to 50%. The range for the peak 30 minutes comes from the early arrival distribution that passengers typically follow. Domestic passengers typically have an arrival distribution that spans up to two hours, where as international passengers may arrive up to four hours before departure. The peak hour originating passengers are, therefore, spread out over two to four hours and not just a one-hour period. Figure 40 is an early arrival distribution example of domestic passengers where the peak 30 minutes represents 47% of the entire flight’s passengers.

Terminal Planning Spreadsheet Models – User’s Guide ACRP 07-04
Final User’s Guide -39- August 2009
FIGURE 40 Example of an Early Arrival Distribution Chart One alternative to the method used in the Check-In model is the Ratio approach, where existing ratios of check-in positions to Design Hour O&D passengers and/or EQA are used as a basis for future planning. These ratios should be based on actual peak period use staffing of ATO positions, rather than leased counters, numbers of available kiosks, and account for observed levels of service.
The ratio approach can combine conventional staffed positions and kiosks as
Equivalent Check-in Positions (ECP). Each airline’s ECP is the number of conventional positions in use, plus the number of kiosks. The current ratio of Design Hour Enplaned Passengers per ECP is determined and then either held constant for the forecast years or changed, based on the existing LOS. The ratio of staffed counters to kiosks can then be varied depending on the current utilization of kiosks at the airport, and the trends in kiosk use identified.
The Check-In Model displays the results of both ratios in the dashboard (Figure 31) as Design Hour O&D Passengers per Check-in Position and ECP per EQA. These results can also be a measure for comparison to a benchmark level or another airport. The ratio approaches are incorporated on a separate tab which can be accessed by the Examples command button as seen in Figure 41. The Ratio Approach Examples button is located just beneath the Staffed Counter Positions section in the Check-in Model.

Terminal Planning Spreadsheet Models – User’s Guide ACRP 07-04
Final User’s Guide -40- August 2009
FIGURE 41 Ratio Approach Command Button The Design Hour Originating Passengers per ECP method is shown in Figure 42.
An advantage of using a Design Hour to ECP ratio is that it requires less detailed data than the 30-minute service model. The disadvantage can be that it assumes a continuation of existing staffing assumptions and the approximate number of airlines.
FIGURE 42 Ratio Method Approach using Design Hour Passengers Another variation on this approach is to use a ratio of gate capacity (EQA) to
ECP as shown in Figure 43. This may be appropriate when the airport is expecting new airlines and larger increases in gates vs. growth in design hour passengers due to load factors and/or aircraft size growth within an aircraft group.
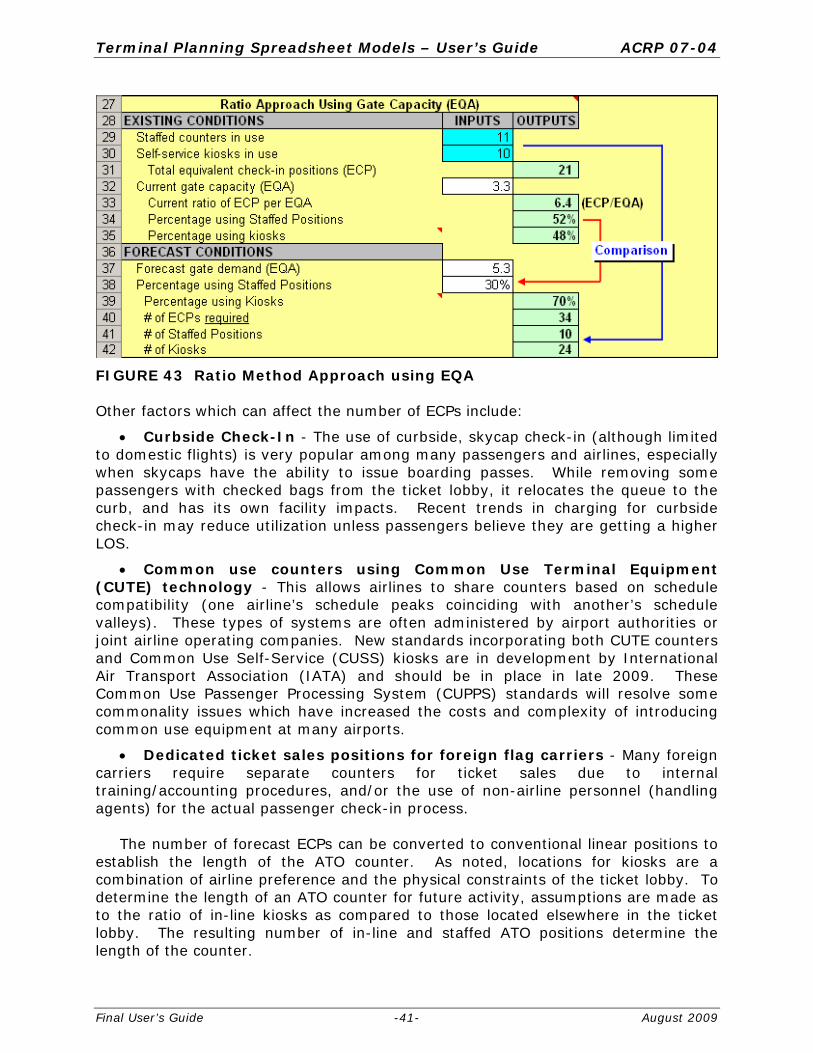
Terminal Planning Spreadsheet Models – User’s Guide ACRP 07-04
Final User’s Guide -41- August 2009
FIGURE 43 Ratio Method Approach using EQA Other factors which can affect the number of ECPs include:
Curbside Check-In - The use of curbside, skycap check-in (although limited to domestic flights) is very popular among many passengers and airlines, especially when skycaps have the ability to issue boarding passes. While removing some passengers with checked bags from the ticket lobby, it relocates the queue to the curb, and has its own facility impacts. Recent trends in charging for curbside check-in may reduce utilization unless passengers believe they are getting a higher LOS.
Common use counters using Common Use Terminal Equipment (CUTE) technology - This allows airlines to share counters based on schedule compatibility (one airline’s schedule peaks coinciding with another’s schedule valleys). These types of systems are often administered by airport authorities or joint airline operating companies. New standards incorporating both CUTE counters and Common Use Self-Service (CUSS) kiosks are in development by International Air Transport Association (IATA) and should be in place in late 2009. These Common Use Passenger Processing System (CUPPS) standards will resolve some commonality issues which have increased the costs and complexity of introducing common use equipment at many airports.
Dedicated ticket sales positions for foreign flag carriers - Many foreign carriers require separate counters for ticket sales due to internal training/accounting procedures, and/or the use of non-airline personnel (handling agents) for the actual passenger check-in process.
The number of forecast ECPs can be converted to conventional linear positions to establish the length of the ATO counter. As noted, locations for kiosks are a combination of airline preference and the physical constraints of the ticket lobby. To determine the length of an ATO counter for future activity, assumptions are made as to the ratio of in-line kiosks as compared to those located elsewhere in the ticket lobby. The resulting number of in-line and staffed ATO positions determine the length of the counter.
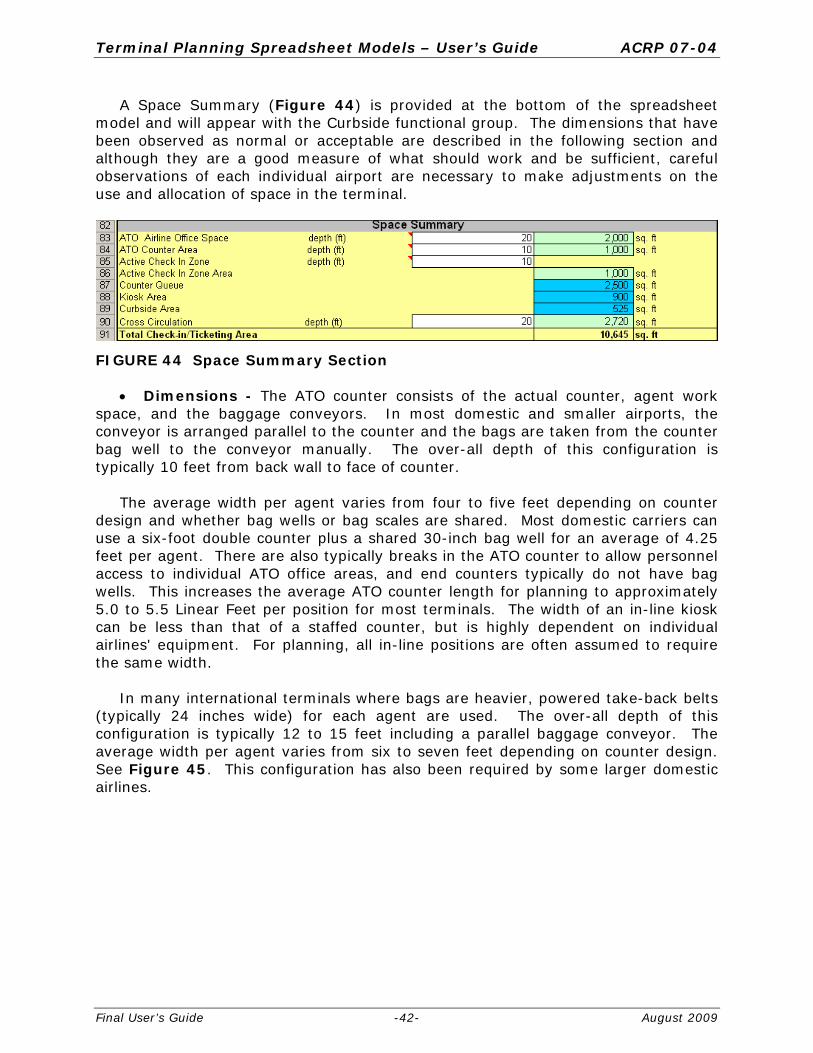
Terminal Planning Spreadsheet Models – User’s Guide ACRP 07-04
Final User’s Guide -42- August 2009
A Space Summary (Figure 44) is provided at the bottom of the spreadsheet model and will appear with the Curbside functional group. The dimensions that have been observed as normal or acceptable are described in the following section and although they are a good measure of what should work and be sufficient, careful observations of each individual airport are necessary to make adjustments on the use and allocation of space in the terminal.
FIGURE 44 Space Summary Section
Dimensions - The ATO counter consists of the actual counter, agent work space, and the baggage conveyors. In most domestic and smaller airports, the conveyor is arranged parallel to the counter and the bags are taken from the counter bag well to the conveyor manually. The over-all depth of this configuration is typically 10 feet from back wall to face of counter.
The average width per agent varies from four to five feet depending on counter design and whether bag wells or bag scales are shared. Most domestic carriers can use a six-foot double counter plus a shared 30-inch bag well for an average of 4.25 feet per agent. There are also typically breaks in the ATO counter to allow personnel access to individual ATO office areas, and end counters typically do not have bag wells. This increases the average ATO counter length for planning to approximately 5.0 to 5.5 Linear Feet per position for most terminals. The width of an in-line kiosk can be less than that of a staffed counter, but is highly dependent on individual airlines' equipment. For planning, all in-line positions are often assumed to require the same width.
In many international terminals where bags are heavier, powered take-back belts (typically 24 inches wide) for each agent are used. The over-all depth of this configuration is typically 12 to 15 feet including a parallel baggage conveyor. The average width per agent varies from six to seven feet depending on counter design. See Figure 45. This configuration has also been required by some larger domestic airlines.

Terminal Planning Spreadsheet Models – User’s Guide ACRP 07-04
Final User’s Guide -43- August 2009
FIGURE 45 Typical Linear Ticket Lobby Typical Dimensions
The ticket lobby includes ATO counter passenger queuing area and cross circulation at the main entrance of the terminal building. Self-service kiosks can also be located within the passenger queuing area.
Active Check-In Zone - In front of the counter is space for the passengers who are being checked in and for circulation to and from the check-in positions. This is recommended to be 10 feet deep, with eight feet as a minimum.
Passenger Queuing - The total amount of passenger queuing area is ultimately
determined by the number of passengers expected to be in the queue and the width of the ticket lobby (number of check-in positions). It has been found that 15 feet is typically the minimum depth for passenger queuing and is adequate for lower activity terminals. Medium and higher activity terminals typically require 20 to 25 feet for queuing respectively. The model includes a LOS table with IATA recommended areas per passenger which vary with the use of bag carts, etc.
Queues may be a combination of single queues (one per check-in position) or
multi-server serpentine queues. The minimum width of a queue is recommended to be 4.5 to 5.0 feet. At terminals with larger checked bags, heavy use of bag carts, and/or larger traveling parties, wider queues are appropriate. Queue ropes should be spaced to provide more space at turns, with five feet as the minimum and six feet recommended when bag carts are used.

Terminal Planning Spreadsheet Models – User’s Guide ACRP 07-04
Final User’s Guide -44- August 2009
For stand-alone kiosks, eight feet for the passengers and circulation is recommended. See Figure 46 for an illustration of check-in queuing dimensions.
Cross Circulation - A cross circulation zone is needed behind the passenger queue. This should be free of obstructions and separate from seating areas, Flight Information Display System (FIDS), advertising displays, and/or entrance vestibules. The width of this zone is recommended to be a minimum of 10 feet at lower activity terminals, increasing to 20 feet at higher activity terminals.
The combination of these three functions results in the following typical dimensions for the ticket lobby:
Low Activity Terminals – 35 feet
Medium Activity Terminals – 45 feet
High Activity Domestic Terminals (minimum) – 55 feet
High Activity International Terminals - 50 to 70 feet
Terminals with unusual conditions resulting in large surges of passengers such as charters, cruise ship activity, etc. may require deeper lobbies. In all cases, the ticket lobby should be as barrier free as possible, with enough space provided for cross-circulation flows so they do not trigger automatic openers for curb doors.
Seating areas, entrance vestibules and other functions would be in addition to these and typically add a minimum of five feet to the over-all depth of most lobbies.
The linear/frontal configuration is the most common for domestic terminals, as well as many terminals handling international passengers with limited numbers of airlines. This configuration provides the most curb frontage as compared to the number of check-in positions. Pier or island configurations typically provide more check-in positions for similar curb frontage than linear configurations.

Terminal Planning Spreadsheet Models – User’s Guide ACRP 07-04
Final User’s Guide -45- August 2009
FIGURE 46 Typical Queue Dimensions Curbside Check-In Dimensions
Curbside baggage check-in is popular at many airports. The dimensions for these facilities are similar to that of typical check-in counters. Figure 47 illustrates a two-position check-in podium with a bag belt to the side. This minimizes the depth of the podium (eight feet). Depth can also be limited by locating the bag conveyor within the terminal front wall to allow a more conventional counter configuration.
Passenger queuing and cross circulation is recommended to be a minimum of 12 feet, with greater depth for higher activity terminals where there may be more circulation along the curb edge. It is normally anticipated that queues will form parallel to the curb rather than toward the vehicle lanes. This results in a 30-foot recommended depth.
The curb depth is also influenced by the presence of vehicle barricades which may be required at some airports, and for blast protection considerations unrelated to passenger processing.
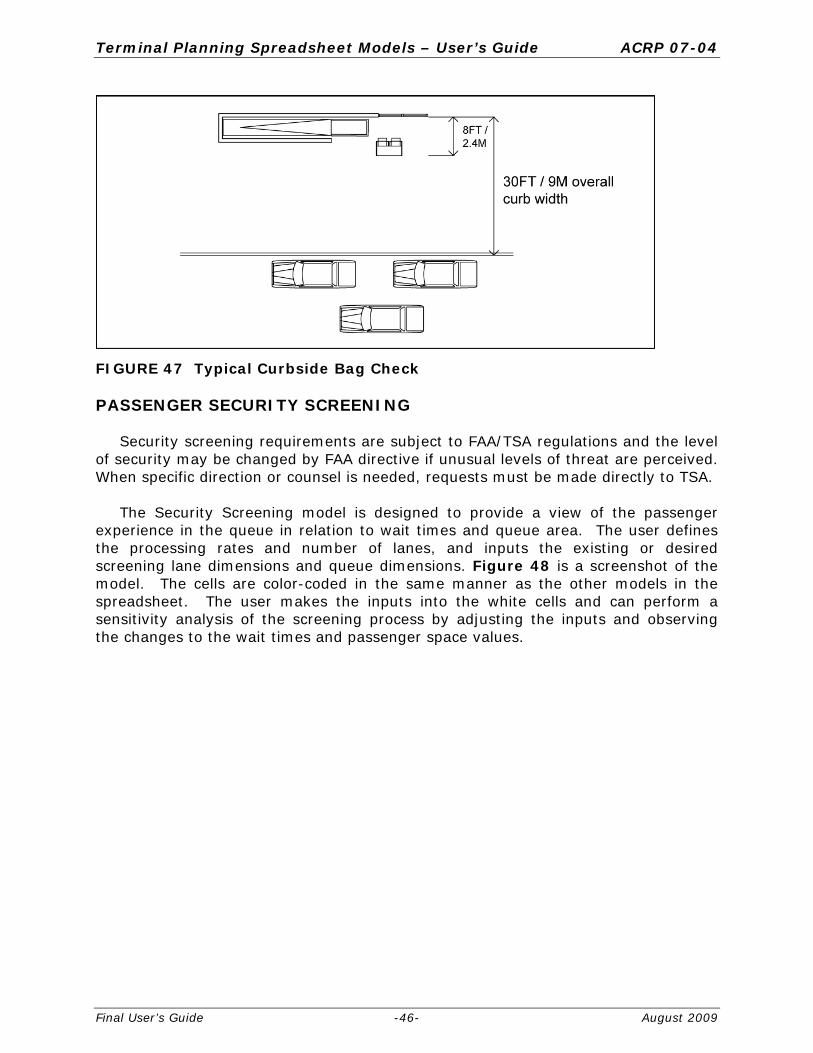
Terminal Planning Spreadsheet Models – User’s Guide ACRP 07-04
Final User’s Guide -46- August 2009
FIGURE 47 Typical Curbside Bag Check PASSENGER SECURITY SCREENING
Security screening requirements are subject to FAA/TSA regulations and the level
of security may be changed by FAA directive if unusual levels of threat are perceived. When specific direction or counsel is needed, requests must be made directly to TSA.
The Security Screening model is designed to provide a view of the passenger
experience in the queue in relation to wait times and queue area. The user defines the processing rates and number of lanes, and inputs the existing or desired screening lane dimensions and queue dimensions. Figure 48 is a screenshot of the model. The cells are color-coded in the same manner as the other models in the spreadsheet. The user makes the inputs into the white cells and can perform a sensitivity analysis of the screening process by adjusting the inputs and observing the changes to the wait times and passenger space values.

Terminal Planning Spreadsheet Models – User’s Guide ACRP 07-04
Final User’s Guide -47- August 2009
FIGURE 48 Security Screening
Additional information about the inputs or calculations in the user cells is provided by way of cell comments that will pop up when the user’s cursor is placed over the cell. Estimating Demand
Processing rates for Security Screening Checkpoints (SSCP) have been observed to vary significantly at different sized airports with rates ranging from approximately 100 passengers/hour/lane to over 200 passengers/hour/lane. A lane is typically a walk-thru metal detector (WTMD) plus an X-ray for carry-on bags. Based on current TSA procedures requiring passengers to remove computers and some other electronics from passenger bags, removal of passenger shoes, etc., the bag X-ray machine usually determines the capacity of the SSCP. A combination of two X-ray machines paired with a single WTMD for better TSA staff utilization, is currently the preferred configuration.

Terminal Planning Spreadsheet Models – User’s Guide ACRP 07-04
Final User’s Guide -48- August 2009
Passenger characteristics typically determine the SSCP throughput, with less frequent travelers (who are unfamiliar with TSA rules and procedures) taking longer than frequent flyers. Changing TSA rules (such as the ban on liquids and gels) can also slow down processing rates until all passengers become familiar with new procedures. It is very important that each airport measure its average processing rates during different seasons and times of day to determine a reasonable range of rates to use for planning. It is also recommended that actual throughputs be observed rather than relying on TSA hourly WTMD counts. These counts will overstate the passenger through-put as it counts each person who passes through the WTMD, including TSA officers and passengers who set off the alarm and are allowed to take off probable metal items and walk through again. The TSA also collects alarm rates for each WTMD. These alarm rates tend to vary depending upon the mix of passengers at the checkpoint.
The Demand portion of the Security Screening model is broken out in Figure 49
where the user determines the percentage of additional traffic at the airport in question, the throughput in passengers/hour/lane and the desired maximum waiting time. These inputs will provide a starting point for the required number of screening lanes. The linked mini queue model uses a normal peaked distribution, which allows for lags and surges in the flow, to estimate a required number of screening lanes that is more likely to achieve the desired max waiting time. This is similar to that used in the check-in model.
FIGURE 49 Example of Security Demand Entry
Typical Equipment
Passenger checkpoints have changed since the creation of the TSA, becoming larger than previous installations. As TSA procedures and equipment continue to evolve, it is expected that the configuration and size of the SSCPs will change as well.
Currently (2009) a standard SSCP contains five major components (See Figure 50):
X-ray for carry-on bags
Walk-through metal detector (WTMD)
A search area for passengers who set off the WTMD
Explosives Trace Detection (ETD) for checking bags
Whole Body Image (WBI)
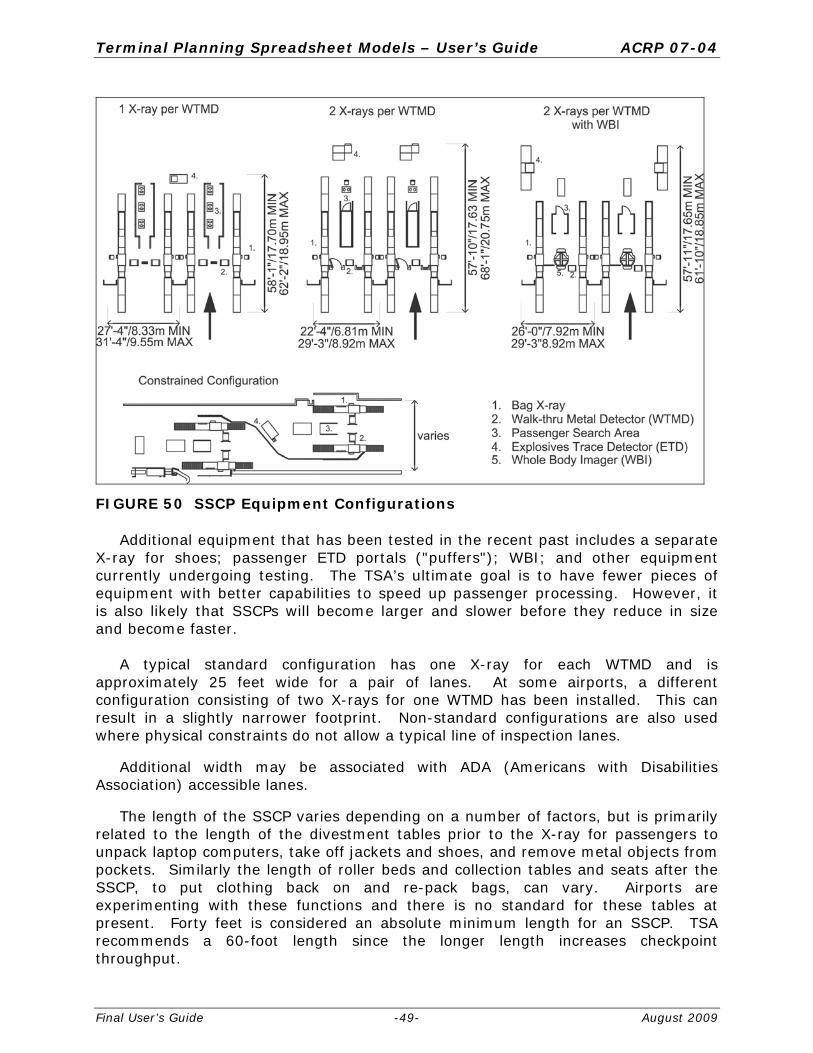
Terminal Planning Spreadsheet Models – User’s Guide ACRP 07-04
Final User’s Guide -49- August 2009
FIGURE 50 SSCP Equipment Configurations
Additional equipment that has been tested in the recent past includes a separate X-ray for shoes; passenger ETD portals ("puffers"); WBI; and other equipment currently undergoing testing. The TSA’s ultimate goal is to have fewer pieces of equipment with better capabilities to speed up passenger processing. However, it is also likely that SSCPs will become larger and slower before they reduce in size and become faster.
A typical standard configuration has one X-ray for each WTMD and is
approximately 25 feet wide for a pair of lanes. At some airports, a different configuration consisting of two X-rays for one WTMD has been installed. This can result in a slightly narrower footprint. Non-standard configurations are also used where physical constraints do not allow a typical line of inspection lanes.
Additional width may be associated with ADA (Americans with Disabilities
Association) accessible lanes. The length of the SSCP varies depending on a number of factors, but is primarily
related to the length of the divestment tables prior to the X-ray for passengers to unpack laptop computers, take off jackets and shoes, and remove metal objects from pockets. Similarly the length of roller beds and collection tables and seats after the SSCP, to put clothing back on and re-pack bags, can vary. Airports are experimenting with these functions and there is no standard for these tables at present. Forty feet is considered an absolute minimum length for an SSCP. TSA recommends a 60-foot length since the longer length increases checkpoint throughput.

Terminal Planning Spreadsheet Models – User’s Guide ACRP 07-04
Final User’s Guide -50- August 2009
It is recommended that planners coordinate with the TSA on current equipment and procedures at the time of design. However, flexibility to re-configure SSCPs should be a goal.
In the next section of the model, the user selects and inputs the current
configuration and dimensions of the security screening and queuing area. Figure 51 is taken from the model and shows how the user can adjust the number of screening lanes being used in the mini queue model to see the impact on the maximum waiting time in the queue. The preliminary calculation for the number of required screening lanes in Row 15 was determined by optimizing the process potential, and thus the real number of screening lanes must be greater, with time lost during periods of flow that are below the process’ capability.
FIGURE 51 Existing Conditions and Queue Model Queuing
The size of the passenger queue area prior to the inspection lanes will be determined by the number of passengers anticipated to be in the queue at peak times. Serpentine queues are recommended. The width of the queue lines is recommended to be a minimum of four feet, with five feet to allow traveling parties to stand next to each other.
The last section of the model (as represented in Figure 52) looks at the queuing area and determines the passenger space within the queue. A pop-up IATA Table (Figure 53) is included for the user to adjust the area per passenger LOS and see the required changes to the dimension of the queue. By making adjustments and performing a sensitivity analysis, the user can better understand how to use the space and configuration available to provide their passengers with the LOS that is desired. Total Checkpoint area and Total Security Screening Area are also calculated for future comparison of space/passenger values with other airports.
FIGURE 52 Example of Queuing Area in Model

Terminal Planning Spreadsheet Models – User’s Guide ACRP 07-04
Final User’s Guide -51- August 2009
FIGURE 53 IATA Table - Comment Pop-Up

Terminal Planning Spreadsheet Models – User’s Guide ACRP 07-04
Draft User’s Guide -52- March 2009
BAGGAGE SCREENING
As a result of the Aviation and Transportation Security Act (ATSA), all checked baggage is subject to screening for explosives. Depending on the size of the airport, available space, and budget, four types of systems may be deployed:
• The smallest airports have used Explosives Trace Detection (ETD) units, typically located in the check-in lobby as the primary form of baggage screening. These are fully manual systems with the slowest through-put rate. Typically a single ETD unit shared by two screeners can process up to 66 bags/hour. ETD units also are used for checking oversized bags which cannot fit though EDS equipment, and for more detailed examination of bags alarmed by EDS units.
• Explosives Detection Systems (EDS) are capable of automatically detecting explosives and then providing a 3D-view of the bag’s contents to TSA screeners for further analysis. Most of the currently deployed EDS technology was developed prior to the passage of ATSA, based on standards set forth by Congress in the Aviation Security Improvement Act of 1990. After large-scale deployment of EDS in 2002 and 2003, equipment manufacturers have incrementally improved performance in terms of false alarm rates and throughput capabilities. In addition, new EDS equipment has been certified. Most of the currently deployed EDS machines operate with throughput rates between 100 and 550 bags/hour.
EDS units have widely varying capacities and are configured in different ways:
Stand-alone EDS are the simplest EDS installations, typically located either in the check-in lobby or immediately behind the ATO counter. Screeners manually load the bags into the EDS unit and then move the screened bags to a bag conveyor into the baggage make up room. Typical through-put rates are in the range of 100 to 200 bags/hour.
Mini in-line systems have a single (or possibly two) EDS units on a feed conveyor from the ATO counter to the make-up area. This requires the least in the way of bag sortation. EDS units for these simple in-line systems typically have capacities of 100 to 400 bags/hour.
Medium- and high-volume systems are highly integrated, high automated, and low labor-intensive systems with multiple EDS units arranged in a screening matrix which requires sophisticated baggage sortation and tracking. Current EDS units for these systems have capacities of 400 bags/hour. Expected upgrades to these EDS units are estimated to increase through-put to the range of 500 to 700 bags/hour. Future EDS units in development are expected to have capacities of up to 1,000 bags/hour. Thus, the baggage handling systems supporting the EDS screening matrix should consider possible increases in EDS capacity during the life of the system. More detailed information can be found in the TSA’s Planning Guideline and Design Standards for Checked Baggage Inspection Systems (release date October 10, 2007. Planners should check for updates).
The spreadsheet model for Baggage Screening is set up in the same manner as the other models where there is a link back to the Table of Contents and the User’s Guide and all the cells are color-coded for consistency as seen in Figure 54.
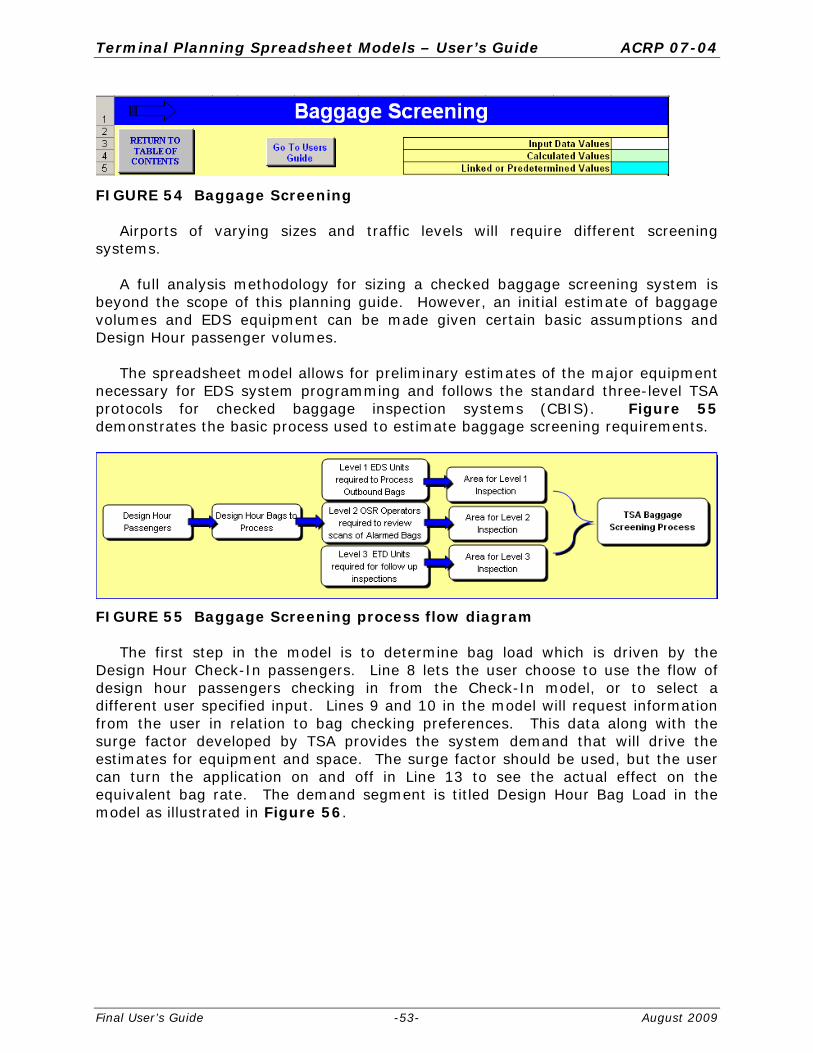
Terminal Planning Spreadsheet Models – User’s Guide ACRP 07-04
Final User’s Guide -53- August 2009
FIGURE 54 Baggage Screening
Airports of varying sizes and traffic levels will require different screening systems.
A full analysis methodology for sizing a checked baggage screening system is beyond the scope of this planning guide. However, an initial estimate of baggage volumes and EDS equipment can be made given certain basic assumptions and Design Hour passenger volumes.
The spreadsheet model allows for preliminary estimates of the major equipment necessary for EDS system programming and follows the standard three-level TSA protocols for checked baggage inspection systems (CBIS). Figure 55 demonstrates the basic process used to estimate baggage screening requirements.
FIGURE 55 Baggage Screening process flow diagram The first step in the model is to determine bag load which is driven by the
Design Hour Check-In passengers. Line 8 lets the user choose to use the flow of design hour passengers checking in from the Check-In model, or to select a different user specified input. Lines 9 and 10 in the model will request information from the user in relation to bag checking preferences. This data along with the surge factor developed by TSA provides the system demand that will drive the estimates for equipment and space. The surge factor should be used, but the user can turn the application on and off in Line 13 to see the actual effect on the equivalent bag rate. The demand segment is titled Design Hour Bag Load in the model as illustrated in Figure 56.

Terminal Planning Spreadsheet Models – User’s Guide ACRP 07-04
Final User’s Guide -54- August 2009
Figure 56 Design Hour Bag Load Model
In order to segment the model inputs for the next section, the estimated percentage of over-odd/sized bags is needed. This assumes that most systems will be EDS for Level 1; for smaller airports with only ETD systems, those selections are made in the next section.
The preferred TSA screening protocol involves three different screening levels. Level 1 screening is performed with EDS units for all bags that can physically fit in an EDS. All bags that alarm at Level 1 are automatically subject to Level 2 screening. During Level 2 screening, TSA personnel view alarmed baggage images captured during the Level 1 EDS scan, and clear any bags whose status can be resolved visually. This process is referred to as on-screen resolution (OSR), which for in-line systems allows the continuous flow of bags through the system until a decision is made. All bags that cannot be resolved at Level 2, and all bags that cannot use EDS for Level 1 due to size restrictions, are sent to Level 3. Level 3 screening is performed manually and involves opening the bag and use of ETD technology. The small percentage of bags that do not pass Level 3 screening are either resolved or disposed of by a local law enforcement officer.
The model follows this three-step procedure and estimates the equipment quantities for either ETD or EDS or both. The user selects the existing or desired system parameters, and inputs the estimated process rates from records or using TSA suggestions. The outputs from the model are the number of EDS and ETD units required. See Figure 57.
FIGURE 57 EDS/ETD Equipment Requirement

Terminal Planning Spreadsheet Models – User’s Guide ACRP 07-04
Final User’s Guide -55- August 2009
After determining an estimate for unit quantities, the last section of the model, as shown in Figure 58, estimates the space necessary in the lobby or back-of-wall screening area for the units and personnel to operate and function efficiently. These area calculations do not include the full baggage conveyor or sortation systems which may be required, but are provided to give an indication of the minimum areas necessary for the TSA-screening process.
FIGURE 58 Baggage Screening Space Requirements BAGGAGE MAKE-UP
Baggage Make-Up includes manual or automated make-up units, the cart/container staging areas, and baggage tug/cart (baggage train) maneuvering lanes. The type of system selected for a terminal depends on a number of factors including the number of airlines, the terminal configuration, operating policies (common use, exclusive use), and size of the terminal complex.
Although checked baggage ratios are a consideration, especially when designing more complicated automated sortation systems, these generally affect the total number of baggage carts/containers in use rather than the size of the make-up area. The number of carts/containers per flight staged at any one time, however, is generally based on the size of the aircraft. For most terminals, one cart or container is typically staged for each 50 to 75 seats of aircraft capacity. Using EQA (1 EQA = 145 seats), this would be equivalent to approximately two to three carts/containers per EQA. The number of staged carts/containers can also vary based on individual airline policies for pre-sorting baggage at the spoke airport for more efficient transfer at the hub. A cart or LD3 container is usually assumed to have the capacity for 40 to 50 bags. Although the total number of carts/containers for a given flight may exceed this number, these are typically moved to the aircraft gate as loaded and staged on the ramp.
The total number of staged carts or containers also is related to the passenger
arrival time distributions and how early an airline staffs the make-up area. Typically, domestic flights begin staging carts two hours before scheduled time of departure (STD). International flights typically begin at three hours for early departing flights (between 4 and 9 a.m.), and four hours for other departure times. For passengers who check in before these normal time periods, some type of early bag storage may be required. The baggage make-up process is typically finished 30 minutes prior to STD, but can extend closer to STD for smaller airports.

Terminal Planning Spreadsheet Models – User’s Guide ACRP 07-04
Final User’s Guide -56- August 2009
To determine the number of staged carts or containers, an estimate should be made of the peak number of departures during the two, three, or four-hour period (as appropriate for the terminal’s type of service), and apply the appropriate aircraft size. This can either be done for a specific schedule and fleet mix, or estimate based on the gate mix as expressed as EQA.
The Baggage Make-Up model estimates the make up requirement based on the total EQA of gates in use; the average number of departures per nominal gate (not normalized to EQA) in the make up period; and the likely number of staged carts/containers required per EQA. The EQA value can be linked to the Gate Demand model, but can also be entered manually.
The user will then estimate the expected number of departures per nominal gate during the make-up period. The make-up period for domestic flights is typically around two hours, and may be up to four hours for an international flight. The average make up-period will depend on the type of service provided at the airport and the mix of markets that are served. The estimated value to be entered should reflect the number of departures per gate that will require baggage staging for those flights during the make up period. Once the period and expected departure rate is determined, the user will need to choose how many carts/containers are likely to be staged for each flight, as described above.
The size of the baggage make-up area will vary depending on the type of make-up units (index belts, re-circulating make up units, sort piers, etc) and whether the systems are exclusive or common use for typical configurations and dimensions. For preliminary planning purposes, the area per staged cart/container typically varies from 600 square feet/cart for individual airline make-up areas with re-circulating make up units, to 300 square feet/cart for larger pier make-up areas. These exclude conveyor tunnels or extensive sortation systems. In addition to the area for baggage make-up and bag claim off-loading, most terminals need additional lanes and other common use maneuvering areas which link the inbound and outbound baggage handling areas to the apron. For programming, a 10 to 15% allowance of all baggage handling areas will generally be sufficient for tug circulation in a two-level terminal, provided the terminal configuration is reasonably efficient.
Figure 59 shows the overall method used to determine the Baggage Make-Up area.
FIGURE 59 Baggage Make-Up Area Modeling Methodology

Terminal Planning Spreadsheet Models – User’s Guide ACRP 07-04
Final User’s Guide -57- August 2009
The alternate ratio method uses a general ‘rule of thumb’ approach based on the average make-up area in relation to total EQA. Generally, 1,500 to 2,200 square feet per EQA of overall make-up area is the range at airports that have been studied. By using actual current space allocation and physical dimensions, the user can calculate the current ratio at a specific airport, which may then be used to project future requirements. This is also a good measure for comparing to the results from the first method.
Figure 60 is a screen print from the model showing the linked EQA cell and the five required input cells for the first method, and only one required input cell for the alternate ratio method.
FIGURE 60 Baggage Make-Up Model
HOLDROOMS
Holdroom sizing is typically based on the average seating capacity of the largest aircraft expected to use each gate. Holdrooms are typically sized for LOS C, with some airports choosing to provide a higher LOS. However, LOS in holdrooms does not, at this time, have a formally accepted definition. LOS parameters have been derived from generally accepted industry practices, and are a combination of the following three factors:
Load factor for the aircraft typically expected to use the gate - Typical ranges are 80% for (LOS B/C) to 90% (LOS A). The design load factor may be reduced, however, if it is expected that a significant number of passengers will be using close-by concessions, or waiting in airline clubs and/or premium class lounges (international flights).
Percentage of passengers to be seated in the holdroom vs. standing - This can range from 50% seated (LOS C), to 80% (LOS B), or even 100% (LOS A). Again,

Terminal Planning Spreadsheet Models – User’s Guide ACRP 07-04
Final User’s Guide -58- August 2009
these are typical ranges and should take into consideration the same factors as the load factor discussed above.
Area per seated and standing passenger - Area per passenger is typically 15 square feet seated and 10 square feet standing (LOS B/C). This can be increased to 17 square feet seated and 12 square feet standing (LOS A) to provide additional wider aisles, and/or more flexible seating configurations.
These factors that determine the total seating/standing lounge area of the holdroom are used in the Holdroom model, where the user sets the LOS conditions and determines the suggested holdroom size.
The area for gate check-in podium(s) and queue(s) should be added to the passenger seating area. The gate podium provides facilities for airline agents to check passengers in, change seat assignments, and provide other passenger services. The number of agent positions is a function of aircraft size and airline staffing policies, but are typically as follows: one for commuter aircraft; two for narrowbody (up to 150 seats); three for widebody and B757 aircraft; and four for jumbo aircraft (over 300 seats).
In addition to the passenger seating area and check-in area, a
boarding/deplaning corridor should be added to the lounge area which effectively acts as an extension of the loading bridge door. If a gate has multiple loading bridges, each bridge should have a separate boarding corridor. Depending on the configuration of the holdroom and the proximity of the check-in podium queue to the loading bridge entrance, some additional queuing may be provided for the boarding process. However, few airports or airlines have seen a need for this additional queuing area.
The Holdroom model is organized like the other spreadsheet models with the
same color coding of user cells and links to the Table of Contents and to the User’s Guide as seen in Figure 61.
FIGURE 61 Holdrooms
The Holdroom model shown in Figure 62 requires that the user input aircraft and load factor information and, by using the LOS guidance in the cell comments, select the percentages and criteria that will determine the holdroom areas. By adjusting the factors that increase or decrease the suggested holdroom area, the user can observe the effects of the impact that properly accounting for the amenities, utilization, and sharing factors can have.

Terminal Planning Spreadsheet Models – User’s Guide ACRP 07-04
Final User’s Guide -59- August 2009
FIGURE 62 Example of Single Holdroom Approach
Holdrooms are recommended to be paired or grouped to allow better flexibility of use. Grouping makes it possible to reduce the total amount of holdroom space at many airports. One ‘rule of thumb’ is to reduce holdroom seating area by 5% for each gate in a common holdroom group. The amount of area reduction (for the passenger seating/standing area only) should be related to differences in departure times for adjacent gates, the estimated passenger arrival time distribution at the holdroom, and boarding time prior to departure. Thus, a reduction in seating area might not be recommended when there are expected to be near-simultaneous departures. Examples would include a connecting hub airport and some spoke airports, when all of the carriers schedule departures at the same time. If departure times are very well spaced, the area reduction may be greater than the ‘rule of thumb’.
This model is referred to as a “Single Holdroom Approach.” However, the
number of podium positions and boarding bridges or doors is variable. This allows the model to be used for a holdroom which may serve multiple gates, and therefore, serve different aircraft classes.
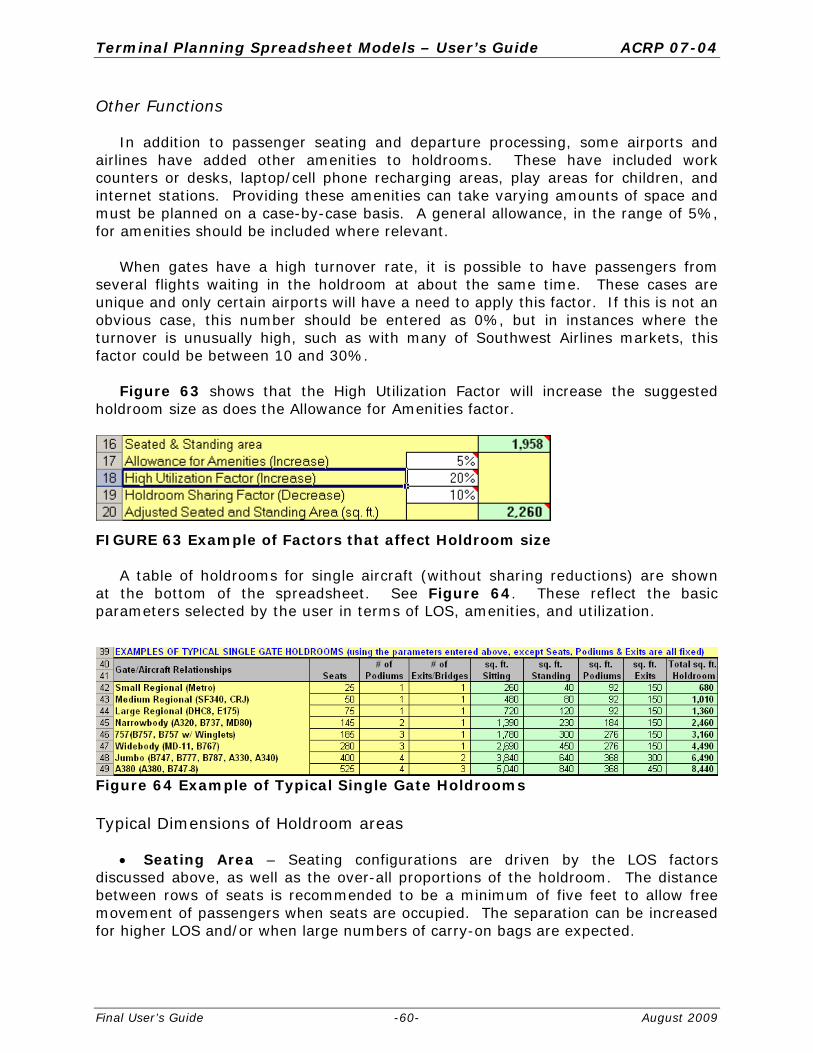
Terminal Planning Spreadsheet Models – User’s Guide ACRP 07-04
Final User’s Guide -60- August 2009
Other Functions
In addition to passenger seating and departure processing, some airports and airlines have added other amenities to holdrooms. These have included work counters or desks, laptop/cell phone recharging areas, play areas for children, and internet stations. Providing these amenities can take varying amounts of space and must be planned on a case-by-case basis. A general allowance, in the range of 5%, for amenities should be included where relevant.
When gates have a high turnover rate, it is possible to have passengers from several flights waiting in the holdroom at about the same time. These cases are unique and only certain airports will have a need to apply this factor. If this is not an obvious case, this number should be entered as 0%, but in instances where the turnover is unusually high, such as with many of Southwest Airlines markets, this factor could be between 10 and 30%.
Figure 63 shows that the High Utilization Factor will increase the suggested
holdroom size as does the Allowance for Amenities factor.
FIGURE 63 Example of Factors that affect Holdroom size
A table of holdrooms for single aircraft (without sharing reductions) are shown at the bottom of the spreadsheet. See Figure 64. These reflect the basic parameters selected by the user in terms of LOS, amenities, and utilization.
Figure 64 Example of Typical Single Gate Holdrooms Typical Dimensions of Holdroom areas
Seating Area – Seating configurations are driven by the LOS factors
discussed above, as well as the over-all proportions of the holdroom. The distance between rows of seats is recommended to be a minimum of five feet to allow free movement of passengers when seats are occupied. The separation can be increased for higher LOS and/or when large numbers of carry-on bags are expected.

Terminal Planning Spreadsheet Models – User’s Guide ACRP 07-04
Final User’s Guide -61- August 2009
Figure 65 illustrates a typical holdroom in a linear configuration along a concourse. The depth of the holdroom should be a minimum of 25 feet to allow some flexibility in seating arrangements. However, a 3- foot depth is recommended for most terminals to increase this flexibility and to allow circulation between seating and the loading bridge boarding corridor. For holdrooms serving multiple gates located in a "corner" of a concourse, additional depth is recommended.
FIGURE 65 Typical Holdroom
Gate podiums - A typical two position gate podium is 8 to 10 feet wide. The depth of the podium counter and back wall is typically eight feet, but can be deeper if storage or other equipment is housed in the back wall.
An area should be provided in front of the podium to contain the queue within the
holdroom and not block the adjacent corridor. A 15-foot depth is generally adequate. Boarding/deplaning corridor - The corridor should provide as direct as
possible path from the loading bridge to the main concourse corridor. A minimum six-foot width is recommended for deplaning.
Most airlines have installed boarding pass readers at the entry to the loading
bridge, which increases the required width at the loading bridge door. These can either be a simple stand-alone reader (as shown in Figure 65), or can include a small agent work podium. A wider area, or multiple queue paths are generally required for enplaning due to the crowd of passengers which usually forms when an aircraft boards. For example, in Figure 65 the check-in podium queue and the internal circulation aisles supplement the boarding/deplaning corridor for enplaning activity. If the configuration does not allow such shared use of circulation, an eight-foot wide boarding/deplaning corridor is recommended.

Terminal Planning Spreadsheet Models – User’s Guide ACRP 07-04
Final User’s Guide -62- August 2009
BAGGAGE CLAIM
Baggage claim facilities are required for both domestic and international passengers. The following sizing methodology is primarily focused on domestic passengers, however, many of the principles apply to international baggage claim as well.
Domestic baggage claim requirements are typically based on Design Hour
deplaned O&D passengers; the concentration of these arriving passengers within a 20-minute time period; and, to a lesser extent, on checked baggage per passenger ratios. Observations at most U.S. airports indicate that the majority of domestic passengers arrive at the baggage claim area before their bags are unloaded onto the claim units. The result is that the claim unit frontage should be sized for the estimated number of passengers waiting for baggage, since most bags are claimed on the first revolution of the claim unit. The number of passengers actively engaged in claiming bags is also related to the average traveling party size, because with larger family groups, not all of the party will actually be at the claim unit picking off bags.
Industry consensus is that all passengers actively claiming bags should be either
adjacent to the claim unit (LOS A & B), or no more than one person away from the claim unit, and able to reach in/around to the claim unit when his/her bag is presented (LOS C). This results in a claim frontage of two to three feet per person (LOS A & B) to 1.0 to 1.5 feet per person (LOS C) for those actively claiming bags.
For international baggage claims, bags may be unloaded to the claim units
before passengers arrive, if adequate passport inspection (CBP Primary) processing is not available. This will increase the time a claim unit is occupied by a flight, and may require claim units to be sized to accommodate nearly 100% of the number of bags on the flight. The Federal Inspection Serives/U.S. Customs and Border Patrol (FIS/CBP) spreadsheet model also includes a Baggage Claim model that provides a tool for assessing the timing of passenger and baggage arrival at the claim unit.
The Baggage Claim model takes the user through two standard approaches to
size total bag claim frontage and the claim units for individual flights. The spreadsheet model is arranged in the same manner as the other model segments with color-coded cells and links to both the Table of Contents for the whole spreadsheet model and the User’s Guide as seen in Figure 66.
FIGURE 66 Baggage Claim Tab
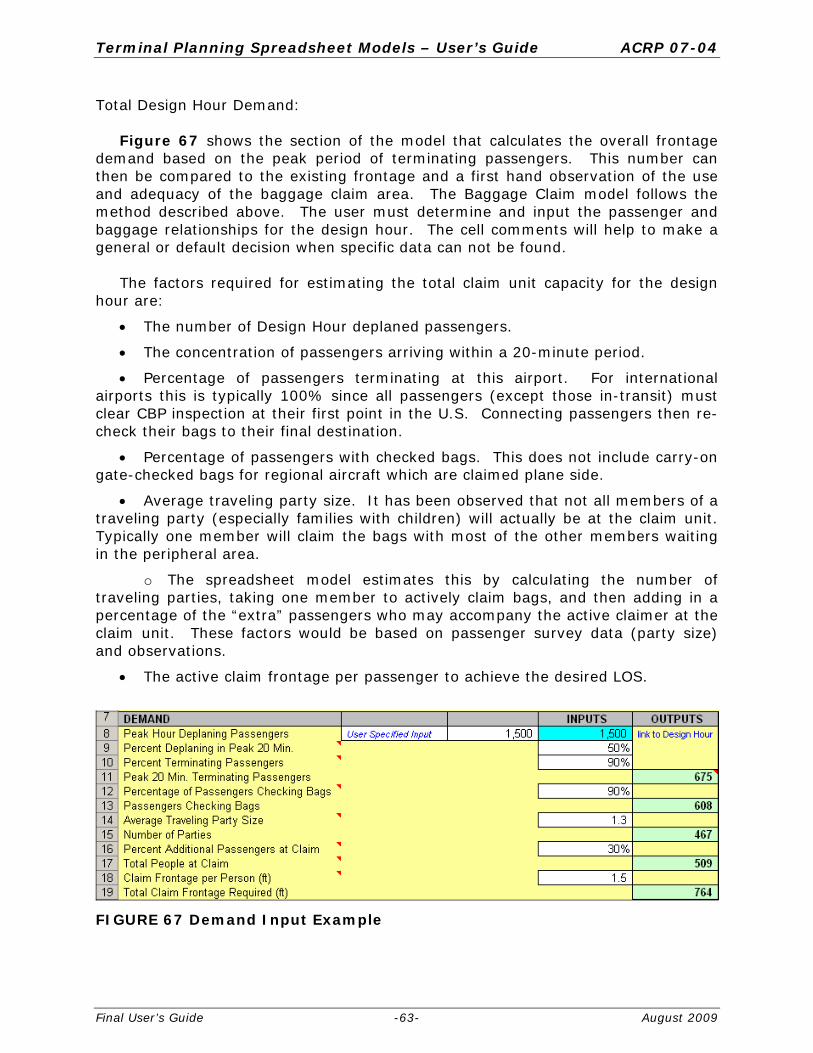
Terminal Planning Spreadsheet Models – User’s Guide ACRP 07-04
Final User’s Guide -63- August 2009
Total Design Hour Demand: Figure 67 shows the section of the model that calculates the overall frontage
demand based on the peak period of terminating passengers. This number can then be compared to the existing frontage and a first hand observation of the use and adequacy of the baggage claim area. The Baggage Claim model follows the method described above. The user must determine and input the passenger and baggage relationships for the design hour. The cell comments will help to make a general or default decision when specific data can not be found.
The factors required for estimating the total claim unit capacity for the design
hour are:
The number of Design Hour deplaned passengers.
The concentration of passengers arriving within a 20-minute period.
Percentage of passengers terminating at this airport. For international airports this is typically 100% since all passengers (except those in-transit) must clear CBP inspection at their first point in the U.S. Connecting passengers then re-check their bags to their final destination.
Percentage of passengers with checked bags. This does not include carry-on gate-checked bags for regional aircraft which are claimed plane side.
Average traveling party size. It has been observed that not all members of a traveling party (especially families with children) will actually be at the claim unit. Typically one member will claim the bags with most of the other members waiting in the peripheral area.
o The spreadsheet model estimates this by calculating the number of traveling parties, taking one member to actively claim bags, and then adding in a percentage of the “extra” passengers who may accompany the active claimer at the claim unit. These factors would be based on passenger survey data (party size) and observations.
The active claim frontage per passenger to achieve the desired LOS.
FIGURE 67 Demand Input Example

Terminal Planning Spreadsheet Models – User’s Guide ACRP 07-04
Final User’s Guide -64- August 2009
The total claim frontage combined with claim size for individual flights (Figure 68) can be used by the planner to determine the number and sizes of claim units needed for the current mix of Design Hour aircraft.
Single Aircraft Arrival:
The same basic approach is used to estimate the amount of claim frontage for a single aircraft arrival. In this method, aircraft seat and load factor assumptions of an individual flight are substituted for the Design Hour deplaning passengers and the percentage of arrivals in the peak 20 minutes. See Figure 68. Once the total frontage is estimated, the size and number of claim units should be determined based on the expected number of flights and aircraft sizes during the Design Hour(s), and airport operating policies regarding exclusive or preferential use of claim units.
FIGURE 68 Typical Single Aircraft Claim Unit Sizing Example
Baggage Claim Time in Use: The minimum time a claim unit would be in use for an individual flight helps
establish the turn-over of claim units. This is more significant for widebody aircraft. The factors required for estimating the time a claim unit is in use for an
individual flight are:
Aircraft seating capacity Design Hour load factor Percentage of passengers terminating at this airport Percentage of passengers with checked bags The average number of bags/passenger The average bag unloading rate. This varies depending on the size of the bags
and the number of feed conveyors per claim unit
In addition to the time it takes to unload the checked bags, additional time is added for bags which are not claimed on the first rotation of the claim unit or due to late arriving passengers (typically up to 10 minutes, unless there are unusual conditions).
As shown in the example in Figure 69, narrowbody domestic flights typically

Terminal Planning Spreadsheet Models – User’s Guide ACRP 07-04
Final User’s Guide -65- August 2009
occupy a claim unit for 20 minutes or less (which results in the typical approach of sizing domestic baggage claim for a peak 20-minute period). Widebody flights can occupy a claim unit for significantly longer periods, which is why units sized for large aircraft typically are configured with two feed conveyors.
FIGURE 69 Example of Baggage Claim Use Time
Baggage Claim Unit Types– there are three basic types of claim units: flat
plate, sloped bed, and standard shelf. See Figure 70. Flat plate units can be designed in various configurations, with "L," "T," "U," and
variations of these are most common. Direct feed, flat plate units are simpler to maintain and are generally preferred if the baggage off-load area is on the same level as the claim area. Bags are loaded on the secure side, pass though fire/security shutters (which are closed when the claim unit is not in use), and are claimed by passengers in the (typically) non-secure baggage claim lobby. Unclaimed bags will circulate back through the loading area.
The minimum outside radius is typically five feet resulting in a 10-foot wide unit.
It is recommended that the ratio of clear length of the "arms" to the width of the unit be no greater than 1.5:1. This will limit deep, narrow bays which can cause passenger congestion.
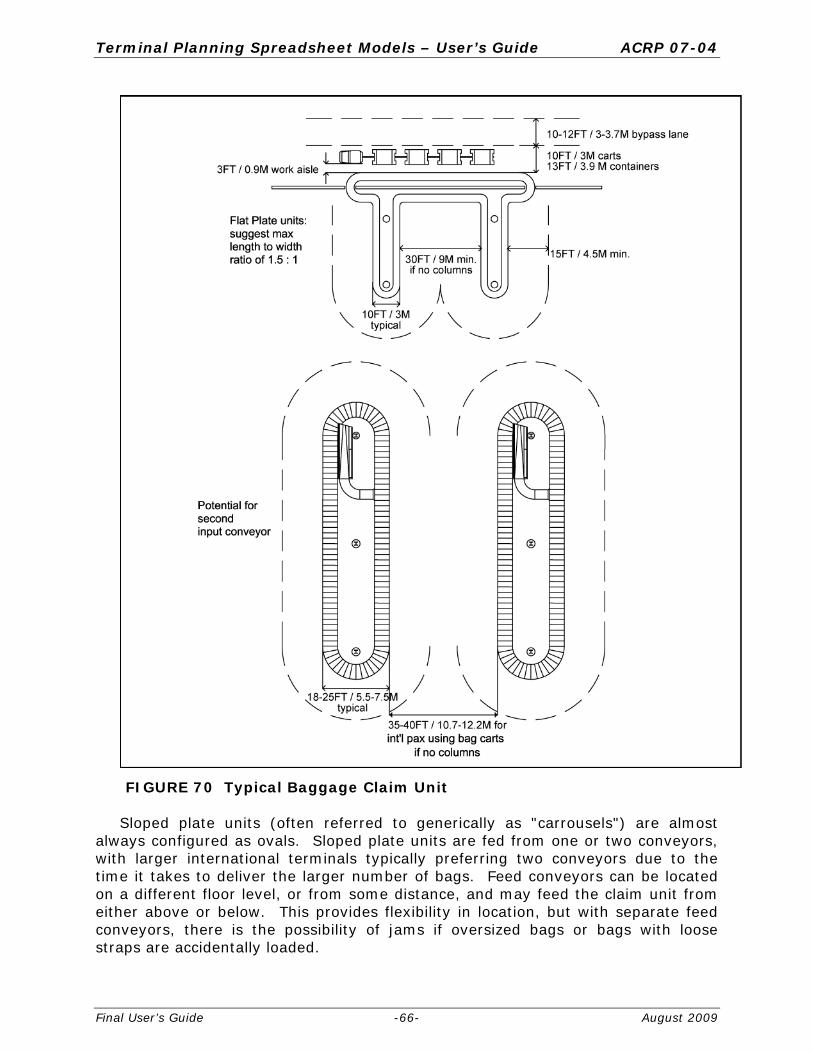
Terminal Planning Spreadsheet Models – User’s Guide ACRP 07-04
Final User’s Guide -66- August 2009
FIGURE 70 Typical Baggage Claim Unit Sloped plate units (often referred to generically as "carrousels") are almost
always configured as ovals. Sloped plate units are fed from one or two conveyors, with larger international terminals typically preferring two conveyors due to the time it takes to deliver the larger number of bags. Feed conveyors can be located on a different floor level, or from some distance, and may feed the claim unit from either above or below. This provides flexibility in location, but with separate feed conveyors, there is the possibility of jams if oversized bags or bags with loose straps are accidentally loaded.

Terminal Planning Spreadsheet Models – User’s Guide ACRP 07-04
Final User’s Guide -67- August 2009
The minimum width of these units is 18 to 20 feet depending on manufacturer, but are often wider due to the location of structures and the feed conveyors. Sloped plate units can also be configured to allow flow-through passenger circulation which may be advantageous in some terminal configurations, especially for larger claim units. Although sloped plate units have more baggage storage capacity, the effective amount of this capacity is often less than expected unless airline/airport personnel manually reposition bags to optimize bag capacity.
Facilities should also be provided for odd-sized or oversized baggage, such as
golf clubs, skis, and packages which are too large to fit on the bag claim units or may cause jams on feed conveyors.
Odd/Over-sized Baggage is usually handled in one of three ways:
Oversized Belt - An extra wide conveyor, anywhere from 45 to 65 inches in width, transports odd-size bags from the baggage off-load area to the bag claim hall generally between two claim units or against an exterior wall of the claim area. This conveyor system can be flat, incline, or decline before entering the claim area, but it is recommended to not use any turns in the odd-sized system.
Oversized Slide - Roll-up doors, between 6 feet to 10 feet wide and at least 5 feet high with a stainless steel slide, can be used to deliver oversize bags to the claim area. This system usually functions effectively only when the cart is unloaded at the same level as the claim area similar to the flat plate claim arrangement.
Manual Lay Down - When it is not practical to include either a slide or belt system, airline employees can take odd-size luggage from the secured side to the non-secured side by using an airport access door usually adjacent to the claim area for passenger retrieval.
Retrieval and Peripheral Areas – The total amount of this area is ultimately determined by the number of passengers expected to be near the claim unit and the desired LOS. This includes the active claim depth along the unit (retrieval area), and depth for others in the traveling party, plus circulation to and away from the claim unit peripheral area. It has been found, however, that 15 feet is typically the minimum recommended depth for the retrieval and adjacent peripheral areas at all but the smallest airports.
This results in a minimum separation of 30 feet between adjacent claim units or
the "arms" of a flat plate claim. For international claim areas where there is a high percentage of passengers using bag trolleys, a 35 to 40-foot minimum separation is recommended. These dimensions assume an obstruction-free area to allow ease of circulation. Columns, bag cart racks, and other structures should not be within the retrieval area. Objects located within the peripheral area usually will require additional separation. A minimum separation between the claim unit and walls, or bag trolley racks is recommended to be 15 to 20 feet for domestic claim units, and 20 to 25 feet for international claim units.
At airports having ‘positive claim’, that is a railing or wall around the claim units
so that a security guard can check if a person has the correct bag, may require additional circulation for queuing at the controlled claim area exits.

Terminal Planning Spreadsheet Models – User’s Guide ACRP 07-04
Final User’s Guide -68- August 2009
Additional area, outside of the peripheral claim area, needs to be provided for access to the claim area; circulation to ground transportation counters (rental cars, public transportation, commercial vans, etc.); seating for meeter/greeters and passengers waiting for transportation pick-up, etc. The dimensions of this circulation zone is dependent on projected passenger volumes and functions adjacent to the claim units, such as rental car counters.
CONCOURSE CIRCULATION
Circulation elements provide the necessary public, non-public, and sterile links to tie the functional elements of the terminal together.
Secure Circulation - Secure circulation typically consists of the main corridor of the concourses, plus the security check-points. Concourses are typically either single loaded (gates on one side) or double loaded (gates on both sides). Single loaded concourses can also have concessions and other uses on the non-gate side which may cause them to function more like double loaded concourses. Corridor width is a function of single/double loading, the presence of moving walkways, passenger volumes, and hubbing activity.
As shown in Figure 71, ancillary uses (such as telephones, water fountains,
vending machines or advertizing displays), and some adjacent activities (FIDS monitors), can effectively reduce the width of a corridor. It is recommended that these uses be recessed into the corridor walls (as shown in Figure 72) to minimize the impact on passenger flow, or their presence taken into account when programming circulation space.
The following are recommended minimum clear circulation widths:
For concourses without moving walkways, a 20-foot wide corridor is recommended for single loaded concourses, with 30 feet for double loaded concourses. This is generally adequate for most medium- to high-volume concourses used primarily for O&D flights, or for shorter hub concourses.
For concourses with moving walkways, a 15-foot corridor is recommended on each side of the moving walkway. This generally allows for bi-directional movement on both sides. Wider corridors may be required for high-volume hubbing terminals. If there are a significant number of electric carts in use, this would also require a wider clear circulation aisle.

Terminal Planning Spreadsheet Models – User’s Guide ACRP 07-04
Final User’s Guide -69- August 2009
FIGURE 71 Typical Double Loaded Concourse With Moving Walkways
FIGURE 72 Example Of A Typical Double Sided Concourse Layout

Terminal Planning Spreadsheet Models – User’s Guide ACRP 07-04
Final User’s Guide -70- August 2009
FIS Sterile Arrivals Circulation - Sterile circulation consists of the corridors and vertical circulation elements which connect the international arrivals gates to the FIS facilities. In some terminals a portion of the sterile corridor system may involve "edge" corridors which connect multiple gates to a vertical circulation core, or directly to the FIS. These edge corridors must have controlled isolation doors to prevent international arriving passengers from mixing with departing passengers.
Because sterile corridors have single direction passenger flow, they can be narrower than the main concourse corridors. Typically, a 15 to 20-foot wide corridor will allow a single-direction moving walkway for most terminals depending on the number of gates and peak period arrivals. Edge sterile corridors are typically 8 to 10 feet wide (clear width). The program area must also include vertical circulation from the holdroom level to the sterile corridor, if it is on a separate level.
The total circulation area can be based on an area per equivalent concourse
length. This length is determined by gates as expressed as NBEG. The actual amount of secure circulation required will depend on the terminal configuration, and should consider whether gates are single, or double loaded. Exit and service stairs to the apron level should be included in the secure circulation area.
The spreadsheet model was developed to estimate the circulation dimensions using the NBEG approach. This model will function in the same manner as the other spreadsheet models with links to the Table of Contents and the User’s Guide, and the use of color-coded cells for consistency as seen earlier in Figure 2.
FIGURE 73 Concourse Circulation
The approach used in the model is based on estimating the length of a concourse using the planned gate mix as expressed in NBEG. The NBEG gate mix is converted to a gate frontage by assuming typical wingtip clearances. The user then makes assumptions as to concourse configuration to estimate the gross circulation areas.
There are a number of different circulation areas that can be addressed. The
single concourse estimate is used in the model to show the basic approach and the learning can then be adapted to other areas of circulation which are more dependent on local design and use.
The model has three basic functions: to determine the suggested circulation corridor width; determine the NBEG of the concourse to estimate frontage and overall length, and then calculate and compare the circulation area. Figure 74 is a screen print of the model, showing that the comparison of existing width and area in this example are ‘Less than Suggested’ based on the model inputs.

Terminal Planning Spreadsheet Models – User’s Guide ACRP 07-04
Final User’s Guide -71- August 2009
FIGURE 74 Example of Comparison Width and Area On line 8 of the model, as seen in Figure 75, the user is asked to input a
percentage factor for concourses that support an airline hub. The comment for this input suggests a small 5 to 10% range that will add to the suggested corridor width. In most cases this factor can be left at 0%. However, at the largest and busiest airports, the sheer volume of passengers that may enplane or deplane during the peak periods or the major cross-flows that may occur during the peak transfer times at large hubs, may require more than the normally suggested corridor width.
FIGURE 75 Example of Secure Circulation Tab

Terminal Planning Spreadsheet Models – User’s Guide ACRP 07-04
Final User’s Guide -72- August 2009
The model asks the user to select inputs that describe the concourse in question. On Line 10, the input is whether or not moving walkways are used. If the user selects “Yes” from the drop down list, the next input on Line 11 must be either a Narrow or Wide Width. If the “–“ is selected a “Choice Error!” message will appear to prompt a correction. Inversely, if the “No” is selected from the list on Line 10 and then a Narrow or Wide Width choice is selected on Line 11, the “Choice Error!” message will also appear until the “—“ choice is selected, as seen in Figure 76.
FIGURE 76 Example of Choice Error Message
The model prompts the user to move down to Line 31 and input the number of gates that exist on the concourse of the specific design aircraft classes in order to compute the NBEG. The equivalent NBEG will be calculated in Cell E40 which is linked back to Cell C14 as seen in Figure 77.
FIGURE 77 NBEG Calculation Matrix
The next inputs that the user needs to make in the model are on Lines 15 and 16. A Usage percentage is requested to describe the allocation of the end space on the concourse. If the concourse circulation runs to the end of the concourse with no space used for holdrooms or amenities, then the Usage percentage should be 100%. Depending on how the end space is used and how much area is taken away from circulation for holdrooms, the Usage percentage may be as low as 80%. An assessment of the concourse gate allocation and loading structure will help determine what percentage to use. Typically 85% is a good starting point for linear pier concourse design.

Terminal Planning Spreadsheet Models – User’s Guide ACRP 07-04
Final User’s Guide -73- August 2009
Moving Walkways — Moving walks transport passengers and their baggage on a moving platform horizontally or at slight inclines. This system can either be manufactured as a “Pallet” or “Moving belt” style. A series of continuous flat metal plates jointed together in a horizontal manner to form the walkway describes the Pallet system. The Moving belt style consists of a series of metal rollers over which a rubber walking surface is placed, sometimes resulting in a bouncy feel when walking over the surface.
As a general planning standard, moving walkways are typically recommended when walking distances exceed approximately 1,000 feet between the major functions of the terminal complex. These walkways may be utilized from parking facilities to ticketing/baggage claim areas; as access to ground transportation stations; in connectors between concourse/terminal to terminal; and security screening checkpoints (SSCP) to major concourse nodes and/or the furthest concourse gate. When planning for moving walkways, factors which influence the layout consist of the volume of passengers to be transported, single or double loaded concourses, and locations of major concessions nodes. Moving walkways are typically installed in pairs traveling in opposite directions and designated by pallet widths or the area the passenger travels on. Depending on the manufacturer, a pallet range for an airport moving walkway is 40 inches to as much as 64 inches, which allows fast moving passengers to easily pass those standing with little to no interference. The overall required width for the moving walk ranges between five-foot five inches to seven feet and lengths vary between manufactures. Figure 78 represents a typical moving walkway with common dimensional criteria.
FIGURE 78 Dimensional Example Of A Moving Walkway
Twelve feet and 15 feet are used as the default for double-moving walkways in
the standard or wide format, which allows for an additional one-foot buffer between the two walkways.

Terminal Planning Spreadsheet Models – User’s Guide ACRP 07-04
Final User’s Guide -74- August 2009
INTERNATIONAL ARRIVAL FACILITIES– (FIS/CBP)
Federal Inspection Services (FIS) facilities are required at all airports with international flights. The exception is many flights from Canada, and a limited number of other airports that also have U.S. pre-clearance facilities. These passengers are considered the same as domestic arrivals because they went through FIS procedures at their airport of departure.
On March 1, 2003 the Immigration and Naturalization Service (INS), Customs and Inspection Service (USCIS), and the Agricultural and Plant Health Inspection Service (APHIS) were consolidated to establish U.S. Customs and Border Protection (CBP). The CBP is responsible for inspecting all passengers, baggage, and air cargo. By consolidating the three major agencies, the CBP is attempting to unify the inspection procedures. At some airports, the Public Health Service (PHS) and/or Fish and Wildlife Service (FWS) may also have offices.
Although the inspection process has varied over time, FIS procedures now call for all passengers to be processed through the primary inspection counters (formerly INS). There are a limited number of foreign airports which have U.S. INS personnel to conduct pre-inspection. Passengers from these airports (some Caribbean islands) bypass local CBP primary inspection, but are still subject to baggage inspection. It is anticipated that these locations will eventually have full CBP pre-clearance facilities similar to those at most large Canadian airports.
Secondary baggage inspection is based on more selective procedures using computer based lists of passengers, roving agents, designations of ‘high-risk’ and ‘low-risk’ flights, and other selection techniques. CBP procedures and facility requirements are described in Airport Technical Design Standards - Passenger Processing Facilities, August 2006. Although there is a national policy, implementation may vary at each gateway based on local conditions, and coordination is required with CBP for reviews and approvals of plans. Thus, it is essential to involve the FIS agencies in the planning process early. Planners should also request updates to standards from CBP during the planning process, as these are likely to change and evolve over time.
A terminal for international arrivals has facilities in addition to the actual FIS processing area. These consist of the following major elements: Sterile Corridor System, CBP Primary Inspection, Baggage Claim, CBP Secondary Inspection, and Processing and Transfer Passenger Recheck. Figure 79 shows the CBP Inspection Process.

Terminal Planning Spreadsheet Models – User’s Guide ACRP 07-04
Final User’s Guide -75- August 2009
FIGURE 79 CBP Inspection Process (Single Level)

Terminal Planning Spreadsheet Models – User’s Guide ACRP 07-04
Final User’s Guide -76- August 2009
Sterile Corridor System
Arriving international passengers must be kept separate from other passengers, visitors, or unauthorized airline employees until they have cleared all FIS inspections. This requires a separate corridor system from the aircraft gate to primary inspection. The corridors should be sized for single direction passenger flow. Depending on the distance from gate to primary inspection, moving walks or an automated people mover (APM) may be appropriate. Because the departing passengers use the same gates as international arrivals, control doors and monitoring of the corridor system is required to prevent mixing of arriving and departing passengers. See the Circulation section of the Guidebook for guidance on corridor sizes. CBP Primary
Because all passengers are subject to CBP primary inspection, the capacity of primary inspection generally dictates the over-all capacity of the FIS. Under current guidelines, one double primary inspection counter (two agents, also referred to as a ‘piggy back counter’) is officially rated at an average of 100 passengers per hour. There are usually separate queues for U.S. citizens and foreign nationals, each of which will have a different average processing rate.
CBP primary facilities are sized for a capacity stated in terms of passengers per
hour. This is a ‘steady state’ rating assuming a relatively well distributed pattern of arriving flights. In order for that to be correct, a Design Hour volume of 900 passengers, for example, would need to consist of six flights, arriving every 10 minutes, with 150 passengers each, rather than two flights of 450 passengers arriving within a few minutes of one another. Even in airports that have shorter-haul international flights, the idea that they will be of uniform size and evenly spaced is difficult to accept as a typical or reasonable planning standard.
However, there are factors which “spread” or dilute the impact of arriving passengers, notably the distance between aircraft gate and the government inspection counters, combined with the metering of passengers out of aircraft and variations in the speed they walk. It should be noted that speeds are more divergent in terminals where moving walkways are provided.
The number of counters required for primary facilities is typically prescribed by CBP based on the Design Hour passenger volume and, as such, consideration of dynamic issues will not usually impact that aspect of the facility. However, while agencies may specify minimum queue depth provision, they may not be sufficient depending on the likely distribution of Design Hour passengers amongst flights and the relative timing of those flights. Examining demand in a smaller time frame, 15 or 30 minutes, is often helpful in understanding the maximum length of queue to be accommodated. One other key area to consider in arrivals facilities is the impact of off-time (i.e., early or late) flights. In addition to a base analysis, if off-time data is available, a number of sensitivity tests should be performed to fully understand the dynamics of the facility.
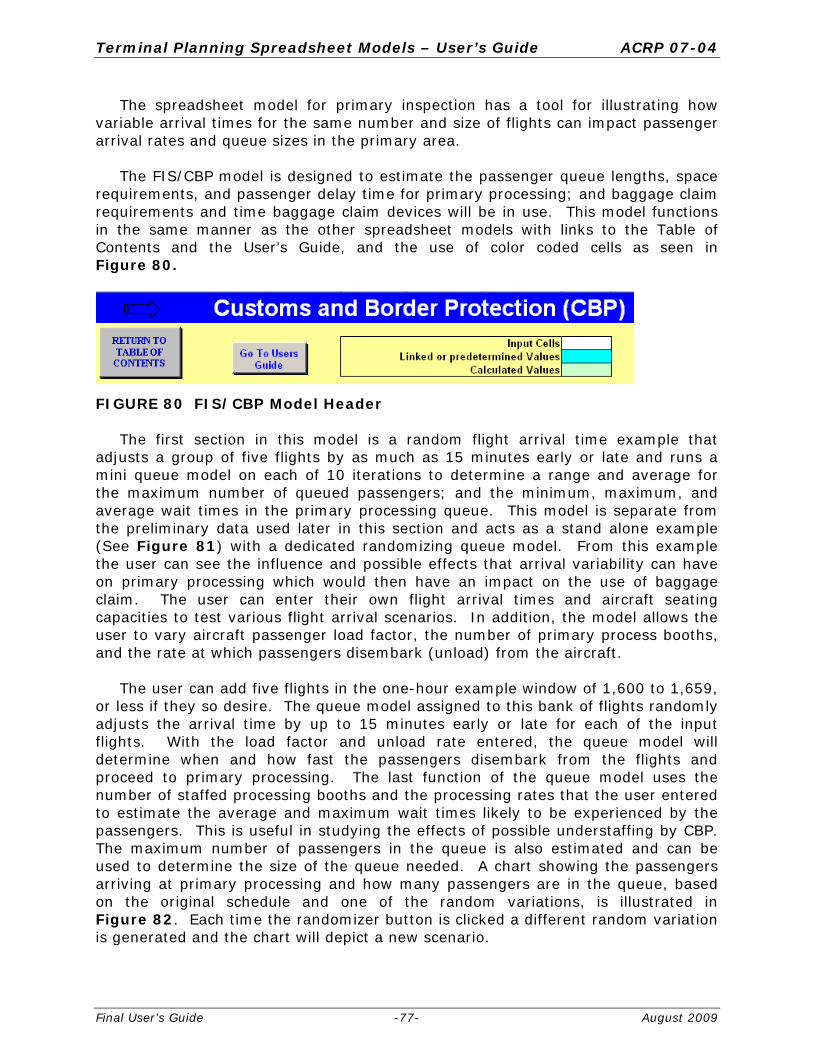
Terminal Planning Spreadsheet Models – User’s Guide ACRP 07-04
Final User’s Guide -77- August 2009
The spreadsheet model for primary inspection has a tool for illustrating how variable arrival times for the same number and size of flights can impact passenger arrival rates and queue sizes in the primary area.
The FIS/CBP model is designed to estimate the passenger queue lengths, space
requirements, and passenger delay time for primary processing; and baggage claim requirements and time baggage claim devices will be in use. This model functions in the same manner as the other spreadsheet models with links to the Table of Contents and the User’s Guide, and the use of color coded cells as seen in Figure 80.
FIGURE 80 FIS/CBP Model Header
The first section in this model is a random flight arrival time example that adjusts a group of five flights by as much as 15 minutes early or late and runs a mini queue model on each of 10 iterations to determine a range and average for the maximum number of queued passengers; and the minimum, maximum, and average wait times in the primary processing queue. This model is separate from the preliminary data used later in this section and acts as a stand alone example (See Figure 81) with a dedicated randomizing queue model. From this example the user can see the influence and possible effects that arrival variability can have on primary processing which would then have an impact on the use of baggage claim. The user can enter their own flight arrival times and aircraft seating capacities to test various flight arrival scenarios. In addition, the model allows the user to vary aircraft passenger load factor, the number of primary process booths, and the rate at which passengers disembark (unload) from the aircraft.
The user can add five flights in the one-hour example window of 1,600 to 1,659,
or less if they so desire. The queue model assigned to this bank of flights randomly adjusts the arrival time by up to 15 minutes early or late for each of the input flights. With the load factor and unload rate entered, the queue model will determine when and how fast the passengers disembark from the flights and proceed to primary processing. The last function of the queue model uses the number of staffed processing booths and the processing rates that the user entered to estimate the average and maximum wait times likely to be experienced by the passengers. This is useful in studying the effects of possible understaffing by CBP. The maximum number of passengers in the queue is also estimated and can be used to determine the size of the queue needed. A chart showing the passengers arriving at primary processing and how many passengers are in the queue, based on the original schedule and one of the random variations, is illustrated in Figure 82. Each time the randomizer button is clicked a different random variation is generated and the chart will depict a new scenario.

Terminal Planning Spreadsheet Models – User’s Guide ACRP 07-04
Final User’s Guide -78- August 2009
FIGURE 81 Random Flight Arrival Time Example
FIGURE 82 Random Flights and Initial Flights Queuing Chart Example

Terminal Planning Spreadsheet Models – User’s Guide ACRP 07-04
Final User’s Guide -79- August 2009
The example in Figure 81 gives a range of wait times that may be experienced by passengers in a scenario similar to the five-flight example period. The maximum wait time based on 10 iterations or runs in the queue model yielded a range of 17 to 34 minutes, and a maximum required queue depth of 44 feet. The minimum queue depth at any U.S. airport with international service is required to be at least 50 feet (75 feet normally); so, under the input conditions in this example the existing queue depth is satisfactory.
The next section in this model allows the user to look at a single sample
international flight arrival and run a queue model to estimate wait times and queue size requirements. The demand in this case will be the estimated seat configuration of a likely international flight of a desired aircraft. The user can specify the number of double booths to be used in passenger processing and at what rate. One hundred passengers/per hour/per double booth is the CBP standard and should be used unless there is better local data that supports using a different known processing rate. This value can also be varied to do a sensitivity check on the overall process.
Among the many CBP facility requirements is the number of double processing
counters and the minimum passenger queue depth and width for the primary processing. This spreadsheet model allows the user to evaluate a CBP recommended passenger flow rate and counter count, or model user selected values. Figure 83 shows the input section where the user makes these decisions.
FIGURE 83 Single Arrival Example for Primary Processing
The process in the single-arrival example will follow the same methods used in the multi-flight example except there is no random variability. The user enters the number of seats, load factor, and unload rate to determine the demand on primary processing. By next entering the number of double booths and processing rate, the queue model will estimate the maximum wait time and maximum number of passengers in the queue. To see the effects that bucket size has on a queue model example, the user can select either a one-minute or five-minute bucket size to observe minor variances. As in the first example with multiple flights, the output

Terminal Planning Spreadsheet Models – User’s Guide ACRP 07-04
Final User’s Guide -80- August 2009
from the queue model will also estimate the required queue depth based on the existing number of double booths and desired LOS area for the passengers. In Example #2, shown in Figure 83, the user’s entries have determined that if 15 square feet per passenger is the desired LOS area/passenger then the queue depth would need to be at least 43 feet.
The standard double inspector counter is approximately 14 feet deep; and with
the passenger standing areas on either side, 11 feet six inches wide. The CBP requires a seven-foot minimum distance from the counters to the holding line for waiting passengers. CBP recommends a 50-foot minimum queue depth for smaller airports, and a 75-foot queue depth for larger airports, but the actual depth should be a function of the peak number of passengers forecast to be in the queue and the LOS assumed. Separate queues are required for U.S. residents and for foreign citizens. Although Figure 84 shows equal queuing areas, the division of the queues would be determined by the nationality mix of the passengers. The width of the queue lines is recommended to be five feet as most international passengers are traveling with others.
Figure 84 illustrates a typical primary inspection area with the standard
dimensions as published by CBP.
FIGURE 84 Primary Inspection Lanes Following the primary processing step, the passengers move to baggage claim
to retrieve their checked bags. Due to the potential for delays during primary processing, checked bags are often at the claim unit before the passengers arrive. In Figure 85, the next section in the model uses a probability bag-matching model

Terminal Planning Spreadsheet Models – User’s Guide ACRP 07-04
Final User’s Guide -81- August 2009
to estimate the time a claim unit will be in use and how much linear frontage will be required for a specific demand load. The user must input average or specific information in relation to passengers and bags, as well as the likely bag delivery (dump) rate and delays. From these inputs the included bagmatch model will estimate the desired outputs and generate a graph to show a possible flow pattern for the passengers and bags. The key outputs are also highlighted on the graph in Figure 86.
FIGURE 85 Passengers and Baggage at Claim Model
FIGURE 86 Passengers and Baggage at Claim Chart

Terminal Planning Spreadsheet Models – User’s Guide ACRP 07-04
Final User’s Guide -82- August 2009
Baggage Claim
After primary inspection, passengers proceed to international baggage claim. The approach in sizing baggage claim for an FIS is similar to that of a domestic baggage claim. However, the time a claim unit is in use is typically longer for two reasons:
• First, checked baggage ratios and the percentage of passengers with checked bags are typically higher than for domestic flights, thus requiring more time to unload. All passengers entering the U.S. must also have CBP baggage inspection at first point of entry (except those in-transit). Connecting passengers then re-check bags to their final destination.
• Second, passengers must clear CBP primary before entering the bag claim area, which normally allows bags to accumulate on the claim unit before passengers arrive. This can require a claim unit with greater capacity for bag storage than for domestic flights with similar passenger characteristics. Thus, an international claim unit may be sized more for baggage storage than for active claim frontage, although both aspects should be considered. If sufficient storage isn’t available (or passengers are delayed at primary longer than anticipated), airline employees may have to unload bags from the claim unit and place them on the floor for passengers to pick up.

Terminal Planning Spreadsheet Models – User’s Guide ACRP 07-04
Final User’s Guide -83- August 2009
ALTERNATIVE METHODS (SIMULATION MODELS)
Recent research associated with the production of the terminal planning spreadsheet models has found substantial documentation on the availability of simulation models and model making systems available for passenger terminal planners. Several of the simulation models available for use are based on these model making systems. When a more detailed level of estimation is required, a simulation model may provide the planner with more specific information and greater detail but will also require more time and a greater financial cost to the planner.
Compendium Of Available Simulation Models
The following models are commercially available for use by terminal planners and designers to support terminal space programs or validate alternative plans and designs:
PAXSIM, Boeing (Preston Group), Melbourne, VIC, Australia – a continuous simulation model for the movements of passengers and baggage within the passenger terminal building.
EDS-SIM, Jacobs Consultancy, San Francisco, CA – a continuous simulation model focused on automated baggage screening systems.
Flow-Model, Jacobs Consultancy, San Francisco, CA – an analytical model focused on the movement of passengers and baggage from ticketing through passenger and baggage security screening.
TRACS (Terminal, Roadway And Curbside Simulation), Transolutions, Inc. Ft. Worth, TX – A continuous flow simulation model that covers all passenger and baggage movements inside the terminal building, and covers vehicle movements on the terminal curbside.
Total AirportSim (TASM), Transolutions, Inc. Ft. Worth, TX – A single package continuous simulation model that covers all aspects of airport operations (aircraft, passengers, baggage, vehicles) within a single simulation model.
ARCport ALT, Aviation Research Corporation, Point Roberts, WA – A discrete event simulation model that models aircraft gate movements, passenger movements inside the terminal building, and baggage handling.
ServiceModel, Ricondo & Associates, Chicago, IL – a discrete event simulation model that evaluates the movement of inbound and outbound passengers and baggage in the passenger terminal building.
TAS, International Air Transport Association – a Mathematical Algorithm that evaluates aircraft, passenger, baggage, and vehicle movements on aircraft aprons and within terminal buildings
Baggage – Systems, Transolutions, Ft. Worth, TX – a continuous simulation model for outbound baggage make-up (Automod model).
CAST Terminal, Airport Research Center, GmbH, Aachen, Germany – a dynamic multi agent simulation tool.

Terminal Planning Spreadsheet Models – User’s Guide ACRP 07-04
Final User’s Guide -84- August 2009
In addition to these simulation models, the following modeling systems provide premade modules that represent passenger terminal facilities and provide tools to assemble these modules into custom simulations:
ARENA (SIMAN) Professional, Rockwell Systems, Pittsburgh, PA WITNESS, Lanner Group, Inc., Houston, TX Automod, Applied Materials, Inc. Santa Clara, CA

Terminal Planning Spreadsheet Models – User’s Guide ACRP 07-04
Final User’s Guide -85- August 2009
ACRONYM GUIDE ADA Americans with Disabilities Association ADPH Average Day Design Hour ADPM Average Day of the Peak Month ATO Airport Ticket Office ATSA Aviation and Transportation Security Act BHS Bureau of Homeland Security CBIS Checked Baggage Inspection System CBP U.S. Customs and Border Protection CUPPS Common Use Passenger Processing System CUSS Common Use Self Service (~Kiosks) CUTE Common Use Terminal Equipment DCV Destination Coded Vehicle DDFS Design Day Flight Schedule ECP Equivalent Check-In Position EDS Explosives Detection System EQA Equivalent Aircraft ETD Explosives Trace Detection FAA Federal Aviation Administration FIDS Flight Information Display Systems FIS Federal Inspection Services FWS U.S. Fish & Wildlife Services HCM Highway Capacity Manual IATA International Air Transport Association ICE Immigration and Customs Enforcement INS Immigration and Naturalization Service LOS Level of Service NBEG Narrowbody Equivalent Gate O&D Origin/Destination OAG Official Airline Guide OSR On-Screen Resolution (image reviewing) PHS U.S. Public Health Services PMAD Peak Month Average Day RON Remain Overnight SSCP Security Screening Checkpoint STD Scheduled Time of Departure TRB Transportation Research Board TSA Transportation Security Administration USCIS U.S. Citizen and Immigration Service WTMD Walk Through Metal Detector

Terminal Planning Spreadsheet Models – User’s Guide ACRP 07-04
Final User’s Guide -86- August 2009
AUTHOR'S ACKNOWLEDGMENTS
This research report was prepared under ACRP Project 07-04 by Landrum & Brown, Hirsh Associates, Planning Technologies and Presentations & Design. Landrum & Brown was the prime contractor while Hirsh Associates, Planning Technologies, and Presentations & Design served as subcontractors.
Matthew Lee of Landrum & Brown and Joel Hirsh of Hirsh Associates served as Co-
Principle Investigators for the research and spreadsheet model development. Brian Poe of Landrum & Brown performed the major portion of the detailed spreadsheet model development and the initial drafting of the User’s Manual. Shane Wirth of Landrum & Brown provided initial model testing and critiques for all of the individual models and documentation. Jerry Roberts of Planning Technologies prepared the interactive CD, integrating the spreadsheet Excel files with the electronic versions of the User’s Manual and the Terminal Planning Guidebook.
The Research Team wishes to express their appreciation to Theresia H. Schatz, A.A.E., of
the TRB for her guidance and project coordination during the development of this study. The authors are very grateful for the guidance by the ACRP Panel for ACRP 07-04, chaired by Nadine Jones and composed of Donald G. Andrews, Jon A. Cimperman, Danielle J. Rinsler, Doug Wendt, James D. Wilson, Dr. Elisha Novak, and Thomas Wade. The authors are also very grateful for the guidance and help provided by the ACRP Panel for ACRP 07-05, chaired by Dr. Robin R. Sobotta and composed of Manuel Ayers, Blair K. Hanuschak, Lloyd A. McCoomb, C. Allen McRee, Stephen M. Quilty, and George P. Vittas.
The Research Team would also like to acknowledge the invaluable contribution of the
research team for ACRP Project 07-05 lead by Bruce Anderson of Landrum & Brown. Mr. Anderson provided overall leadership of the contractor team for both ACRP Projects 07-05 and 07-04. His quality control and guidance assured that the content of both projects will provide consistent guidance.
Finally, the authors are grateful for the time and dedication of numerous L&B staff members
in the overall production of the Spreadsheet Models and the User’s Guide.