sour gas treatment plant design cbe 160...
TRANSCRIPT
SOUR GAS TREATMENT PLANT DESIGN CBE 160 PROJECT REPORT
Project Instructor: Dr. Mello Date: 07/16/2015 Team Number: 4
Team Members: Sheng Han Han Ee Ong
William Agung Prabowo
Sour Gas Treatment Plant Design Page 1 CBE 160 Project Report Team #4
Executive Summary
In this report, a conventional design of sour gas treatment plant employing
packed absorber and stripper columns is presented. 1000 psig, 50 MMSCFD sour gas
that consists of 10 mole percent CO2 is processed in the design to reduce the CO2
content down to 2 mole percent (pipeline specification). The design is simulated with
Aspen HYSYS V8.6 acid gas package and is able to achieve the desired specification.
Further, the absorber in the design is compared with the one in novel Rotating Packed
Bed (RPB/Higee) design to assess the benefits of the RPB. We found that RPB is able
to give a significant volume reduction factor at the expense of higher pressure drop
compared to the conventional packed column, indicating RPB can be a viable option for
future design.
Introduction
In natural gas treatment process, some of the most basic principles are the
understanding of “sour” and “sweet” gas. Sour gas is defined as natural gas with over 2
mol.% of carbon dioxide (CO2) while sweet gas is defined as natural gas with less than
2 mol.% CO2 (pipeline quality). Sour gas can still be used as fuel but there are two main
concerns associated with it. First, corrosion issue: As most natural gas has to be
transported over long distances in pipes before it is consumed, having sour gas in the
pipeline means having CO2, which as an acid gas can react with water, resulting in a
carbonated water that is corrosive to pipes. This can eventually lead to pipe leaks and
failure. Second, environmental concern: It has become an environmental responsibility
to convert sour gas to sweet gas and properly dispose of the CO2 in the process.
Second, environment concerns: With the rise of global warming threat, it has become
Sour Gas Treatment Plant Design Page 2 CBE 160 Project Report Team #4
unacceptable to employ sour gas as a fuel source. Therefore, the aims of this project
are: (1) To design a conventional sour gas treatment plant that converts 1000 psig sour
gas at a feed rate of 50 MMSCFD with 10 mol.% CO2 to sweet gas with only 2 mol.%
CO2 and (2) to compare absorbers in the conventional plant design with the one in the
Rotating Packed Bed (RPB/Higee) design.
To remove CO2 from natural gas, absorption solvent is used in an absorption-
stripping process. This paper focuses on using methyl-diethanolamine (MDEA) as the
compound that undergoes chemisorption with CO2 in an acid-base reaction to form a
salt compound. By contacting sour gas with MDEA solution in an absorption column,
CO2 can be removed from the gas. The rich amine solution (high CO2 content) can then
be regenerated into lean amine (low CO2 content) and recycled back for absorption in
the stripping column. The entire process can be very efficient since MDEA is
continuously recycled while CO2 is washed out of the natural gas stream. In addition,
MDEA does not show significant decomposition under operating conditions3.
Alternatives and Options Considered
Two methods of CO2 removal from natural gas will be discussed in this paper:
Conventional design with packed column and novel design with RPB. In a conventional
design, the absorption and stripping processes are carried out with packed columns that
usually have a major vertical footprint in the plant. On the other hand, the novel RPB
design promises significant packing volume reduction and increased mass transfer rate
due to the high-gravity environment created within it.
On the aspect of absorption solvent, there are alkanolamines other than MDEA
such as methylethanolamine (MEA), diglycolamine (DGA), and diethanolamine (DEA)
Sour Gas Treatment Plant Design Page 3 CBE 160 Project Report Team #4
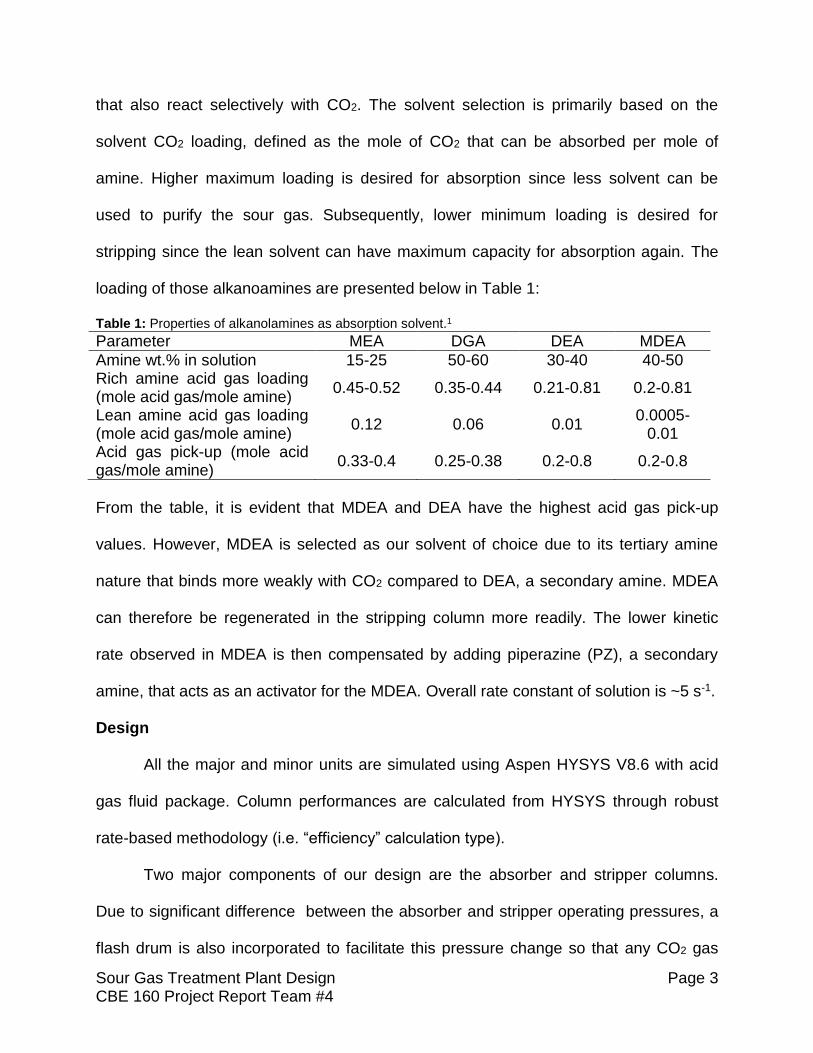
that also react selectively with CO2. The solvent selection is primarily based on the
solvent CO2 loading, defined as the mole of CO2 that can be absorbed per mole of
amine. Higher maximum loading is desired for absorption since less solvent can be
used to purify the sour gas. Subsequently, lower minimum loading is desired for
stripping since the lean solvent can have maximum capacity for absorption again. The
loading of those alkanoamines are presented below in Table 1:
Table 1: Properties of alkanolamines as absorption solvent.1
Parameter MEA DGA DEA MDEA
Amine wt.% in solution 15-25 50-60 30-40 40-50 Rich amine acid gas loading (mole acid gas/mole amine)
0.45-0.52 0.35-0.44 0.21-0.81 0.2-0.81
Lean amine acid gas loading (mole acid gas/mole amine)
0.12 0.06 0.01 0.0005-
0.01 Acid gas pick-up (mole acid gas/mole amine)
0.33-0.4 0.25-0.38 0.2-0.8 0.2-0.8
From the table, it is evident that MDEA and DEA have the highest acid gas pick-up
values. However, MDEA is selected as our solvent of choice due to its tertiary amine
nature that binds more weakly with CO2 compared to DEA, a secondary amine. MDEA
can therefore be regenerated in the stripping column more readily. The lower kinetic
rate observed in MDEA is then compensated by adding piperazine (PZ), a secondary
amine, that acts as an activator for the MDEA. Overall rate constant of solution is ~5 s-1.
Design
All the major and minor units are simulated using Aspen HYSYS V8.6 with acid
gas fluid package. Column performances are calculated from HYSYS through robust
rate-based methodology (i.e. “efficiency” calculation type).
Two major components of our design are the absorber and stripper columns.
Due to significant difference between the absorber and stripper operating pressures, a
flash drum is also incorporated to facilitate this pressure change so that any CO2 gas

Sour Gas Treatment Plant Design Page 4 CBE 160 Project Report Team #4
that evolves from the pressure reduction can be vented and immediately removed from
rich solvent stream. The process flowsheet is displayed on the next page in Figure 1.
Figure 1: Process flow diagram of natural gas purification process implemented in Aspen HYSYS V8.6.
Sour Gas Treatment Plant Design Page 5 CBE 160 Project Report Team #4
Absorber
The crux of the CO2 removal from sour gas occurs here. An 8-stage packed bed
absorber is used. Countercurrent flow is obtained by pumping in lean amine from the
top of the column and flowing in sour gas from the bottom of the column. Pressure at
the column is controlled at stream pressure of 1000 psig. Lean solvent at 26°C is fed
from the top of the column while natural gas at 21°C is fed from the bottom of the
column. Temperature in the column is allowed to vary since the chemisorption reaction
is exothermic and therefore the streams will naturally heat up in the column. In an ideal
situation, mass balance indicates that minimum amine flow rate needed for absorption
is approximately 2300 kmol/h. However, due to non-ideality of column condition, (i.e.
equilibrium not reached due to insufficient residence time) 2600 kmol/h of amine flow
rate is needed to ensure that the sweet gas stream meets the desired specification.
Flash
The flash drum provides the pressure transition between the absorber and
stripper columns. It operates at 5.6 psig, and a valve is installed before the flash
column so that flow into flash drum can be controlled. The significant pressure reduction
in the flash vaporizes some CO2 from the liquid amine, and the gas evolved is allowed
to be vented out, effectively decreasing the rich amine loading and easing the duty of
stripper in regenerating the lean amine.
Stripper
To reduce operating cost and waste, amine used in the absorption process is
regenerated as lean amine in the stripper column. The stripper column is a 6-stage
packed column with rich amine stream fed to the highest tray in the column so that the
Sour Gas Treatment Plant Design Page 6 CBE 160 Project Report Team #4
gas in the distillate will be richest in CO2 and when the liquid trickles down the column it
shall be a lean solvent. Temperature of the stripper is higher than temperature at the
absorber since higher temperature pushes the exothermic chemical reaction equilibrium
to the left and encourages CO2 to leave liquid amine. Average temperature of the
column is 108°C and detailed temperature profile is given in the appendix. Pressure of
the stripper is low at 5 psig which again encourages CO2 desorption from amine. At that
pressure, the boiling point of water in the solvent is 111°C and therefore the reboiler
operates at 111°C to generate steam which acts as the stripper gas for the distillation
process. Output stream of hot lean amine is cooled in a heat exchanger with rich amine
stream from the flash column in a countercurrent heat exchanger. The rich amine is
heated up to approximately stripper column temperature prior to entering the stripper
thus reducing the reboiler heat duty. On the other hand, the lean amine is further cooled
down using a cooler and pumped back into the absorption column. A surge tank is
placed prior to the pump so that fluctuations in lean amine flow rate and composition will
have minimal impact on the absorption column performance.
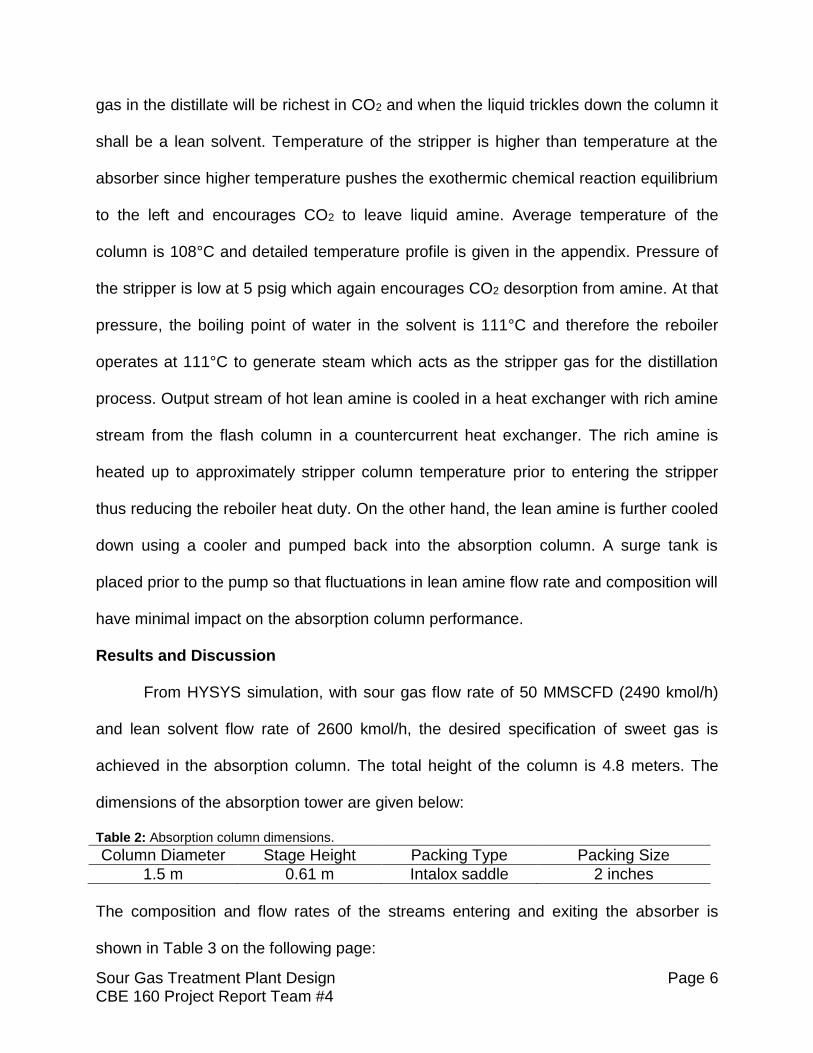
Results and Discussion
From HYSYS simulation, with sour gas flow rate of 50 MMSCFD (2490 kmol/h)
and lean solvent flow rate of 2600 kmol/h, the desired specification of sweet gas is
achieved in the absorption column. The total height of the column is 4.8 meters. The
dimensions of the absorption tower are given below:
Table 2: Absorption column dimensions.
Column Diameter Stage Height Packing Type Packing Size
1.5 m 0.61 m Intalox saddle 2 inches
The composition and flow rates of the streams entering and exiting the absorber is
shown in Table 3 on the following page:

Sour Gas Treatment Plant Design Page 7 CBE 160 Project Report Team #4
Table 3: Data for streams entering and exiting absorption column.
Parameter Unit Feed Gas Sweet Gas Rich Amine Lean Amine
Temperature °C 21.1 41.0 65.2 26.0
Molar Flow kmol/h 2490 2287 2803 2600
Mole fraction
CO2 0.10 0.02 0.07 152 ppm
Methane 0.80 0.87 0.001 trace
Ethane 0.05 0.05 132 ppm trace
Propane 0.05 0.05 111 ppm trace
MDEA 0 49.9 ppm 0.11 0.12
Piperazine 0 94.9 ppb 0.02 0.02
H2O 0 0.002 0.80 0.86
With the absorption column, the sour gas at 10 mol% CO2 is purified to sweet
gas at 2 mol% CO2, which meets our streams requirement. The lean amine has a CO2
loading of 0.002 while the rich amine has a CO2 loading of 0.57, which is lower than the
CO2 corrosion limit loading of 0.80. The lower loading achieved by the rich amine is
attributed to insufficient residence time and possible contact area for CO2 to be
chemisorbed by amine. No energy input is required for the absorber since no heating
nor cooling are required.
To achieve the same degree of CO2 removal from sour gas, the RPB design, a
more novel approach, can also be used. Due to high gravity environment in the RPB,
greater packing can be used. This creates thin liquid film that promotes high mass
transfer rate. Therefore, the RPB can be designed to be more compact than the
conventional absorption column. For the same feed and product gas specifications as
well as the same flow rates as conventional column, the RPB design specification is
given in the Table 4 on the following page based on formulas derived in Agarwal et. al.2
Sour Gas Treatment Plant Design Page 8 CBE 160 Project Report Team #4
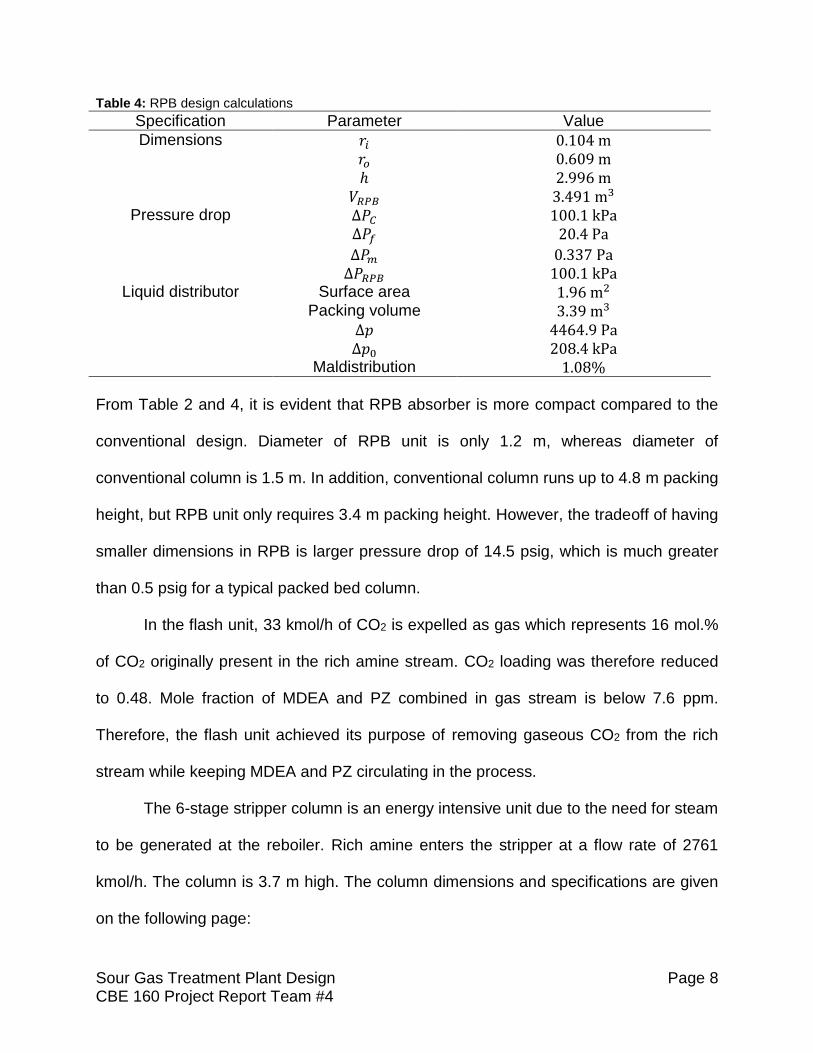
Table 4: RPB design calculations
Specification Parameter Value
Dimensions 𝑟𝑖 0.104 m 𝑟𝑜 0.609 m
ℎ 2.996 m 𝑉𝑅𝑃𝐵 3.491 m3
Pressure drop ∆𝑃𝐶 100.1 kPa ∆𝑃𝑓 20.4 Pa
∆𝑃𝑚 0.337 Pa ∆𝑃𝑅𝑃𝐵 100.1 kPa
Liquid distributor Surface area 1.96 m2 Packing volume 3.39 m3
∆𝑝 4464.9 Pa ∆𝑝0 208.4 kPa
Maldistribution 1.08%
From Table 2 and 4, it is evident that RPB absorber is more compact compared to the
conventional design. Diameter of RPB unit is only 1.2 m, whereas diameter of
conventional column is 1.5 m. In addition, conventional column runs up to 4.8 m packing
height, but RPB unit only requires 3.4 m packing height. However, the tradeoff of having
smaller dimensions in RPB is larger pressure drop of 14.5 psig, which is much greater
than 0.5 psig for a typical packed bed column.
In the flash unit, 33 kmol/h of CO2 is expelled as gas which represents 16 mol.%
of CO2 originally present in the rich amine stream. CO2 loading was therefore reduced
to 0.48. Mole fraction of MDEA and PZ combined in gas stream is below 7.6 ppm.
Therefore, the flash unit achieved its purpose of removing gaseous CO2 from the rich
stream while keeping MDEA and PZ circulating in the process.
The 6-stage stripper column is an energy intensive unit due to the need for steam
to be generated at the reboiler. Rich amine enters the stripper at a flow rate of 2761
kmol/h. The column is 3.7 m high. The column dimensions and specifications are given
on the following page:
Sour Gas Treatment Plant Design Page 9 CBE 160 Project Report Team #4
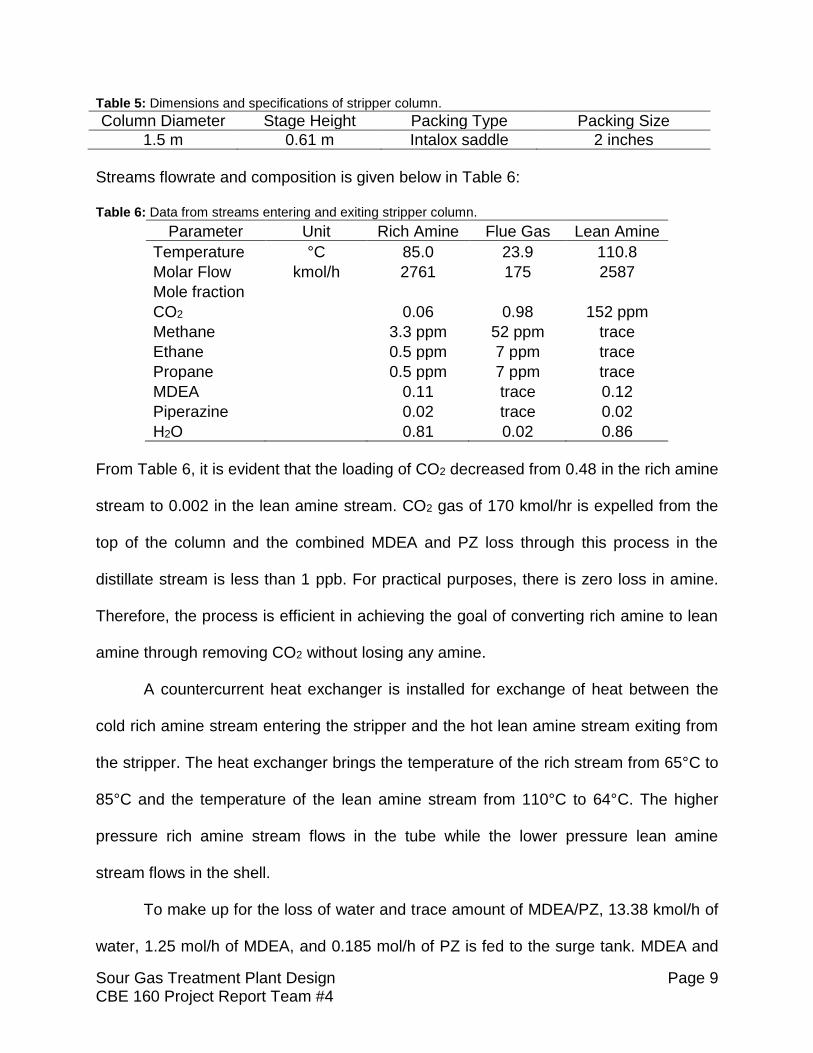
Table 5: Dimensions and specifications of stripper column.
Column Diameter Stage Height Packing Type Packing Size
1.5 m 0.61 m Intalox saddle 2 inches
Streams flowrate and composition is given below in Table 6:
Table 6: Data from streams entering and exiting stripper column.
Parameter Unit Rich Amine Flue Gas Lean Amine
Temperature °C 85.0 23.9 110.8
Molar Flow kmol/h 2761 175 2587
Mole fraction
CO2 0.06 0.98 152 ppm
Methane 3.3 ppm 52 ppm trace
Ethane 0.5 ppm 7 ppm trace
Propane 0.5 ppm 7 ppm trace
MDEA 0.11 trace 0.12
Piperazine 0.02 trace 0.02
H2O 0.81 0.02 0.86
From Table 6, it is evident that the loading of CO2 decreased from 0.48 in the rich amine
stream to 0.002 in the lean amine stream. CO2 gas of 170 kmol/hr is expelled from the
top of the column and the combined MDEA and PZ loss through this process in the
distillate stream is less than 1 ppb. For practical purposes, there is zero loss in amine.
Therefore, the process is efficient in achieving the goal of converting rich amine to lean
amine through removing CO2 without losing any amine.
A countercurrent heat exchanger is installed for exchange of heat between the
cold rich amine stream entering the stripper and the hot lean amine stream exiting from
the stripper. The heat exchanger brings the temperature of the rich stream from 65°C to
85°C and the temperature of the lean amine stream from 110°C to 64°C. The higher
pressure rich amine stream flows in the tube while the lower pressure lean amine
stream flows in the shell.
To make up for the loss of water and trace amount of MDEA/PZ, 13.38 kmol/h of
water, 1.25 mol/h of MDEA, and 0.185 mol/h of PZ is fed to the surge tank. MDEA and

Sour Gas Treatment Plant Design Page 10 CBE 160 Project Report Team #4
PZ are the more expensive solvents and thus operating cost is kept low through the low
make up flow rates of these solvents.
Conclusion and Recommendations
Our conventional design employed three major units for the natural gas
sweetening process: Absorber column, flash tank and stripper column. The design
simulated in HYSYS achieved the desired sweet gas specifications while ensuring
minimal loss of expensive the amines. The conventional absorption column can
theoretically be replaced by a RPB unit that promises 2.5 times packing volume
reduction as well as lower vertical footprint. However, the pressure drop observed in
RPB is significantly higher than the conventional column (although it is only a 1% drop
from the feed pressure). If spatial concern is overwhelming, such as building an
absorption unit on an offshore oilrig, the RPB can be a viable option to substitute the
space intensive packed column. However, rigorous analysis on the economic and safety
issues along with numerous field implementations should still be done on both
conventional and RPB design to ensure the most suitable design is selected for
robustness and ease of operation in the industry.

Sour Gas Treatment Plant Design Page 11 CBE 160 Project Report Team #4
References
1. Engineering Data Book, Section 21: Hydrocarbon treating. Gas Processors
Suppliers Association. Tulsa, OK. 2004.
2. Process Intensification in HiGee Absorption and Distillation: Design Procedure
and Applications. Lava Agarwal, V. Pavani, D. P. Rao, and N. Kaistha. Industrial
& Engineering Chemistry Research 2010 49 (20), 10046-10058 DOI:
10.1021/ie101195k
3. Ayyaz. M., Mohamed I., Abdul M., Thanabalan M., Amir S. Thermophysical
Properties of Aqueous Piperazine and Aqueous (N-Methyldiethanolamine +
Piperazine) Solutions at Temperatures (298.15 to 338.15) K. Journal of Chemical
Engineering, 54 2317-2321 (2009)
4. Hanna Kierzkowska-Pawlak., Marta S., Andrzej C. Reaction Kinetics of CO2 in
Aqueous Methyldiethanolamine Solutions using the Stop-Flow Technique.
Chemical and Process Engineering, 33 (1), 7-18 (2011)
5. T. E. Rufford, et. Al. The removal of CO2 and N2 from natural gas: A review of
conventional and emerging process technologies. Journal of Petroleum Science
and Engineering. 94-95 123-154 (2012)
6. Arunkumar S., Bandyopadhyay S. S. Absorption of Carbon Dioxide into
Piperazine Activated Aqueous N-Methyldiethanolamine. Separation Science
Laboratory Cryogenic Engineering Centre, IIT (2010)

Sour Gas Treatment Plant Design Page 12 CBE 160 Project Report Team #4
Appendices
Appendix 1: HYSYS Stream Results
Sour Gas Treatment Plant Design Page 13 CBE 160 Project Report Team #4
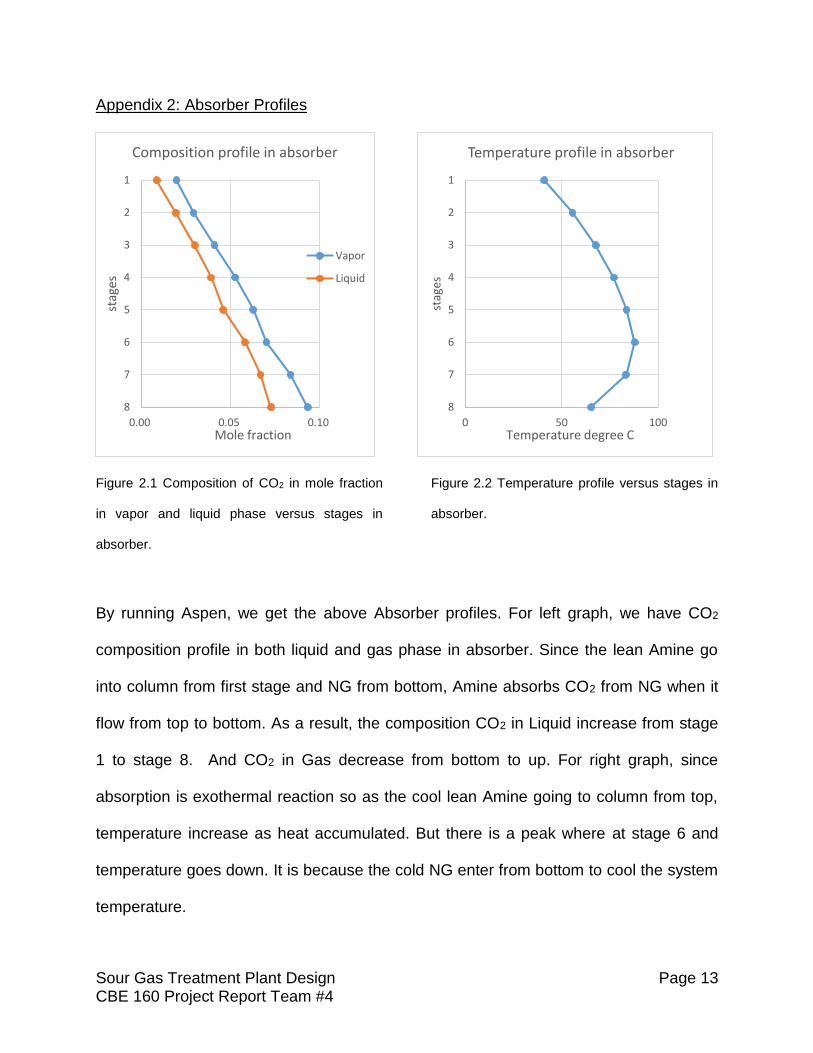
Appendix 2: Absorber Profiles
Figure 2.1 Composition of CO2 in mole fraction
in vapor and liquid phase versus stages in
absorber.
Figure 2.2 Temperature profile versus stages in
absorber.
By running Aspen, we get the above Absorber profiles. For left graph, we have CO2
composition profile in both liquid and gas phase in absorber. Since the lean Amine go
into column from first stage and NG from bottom, Amine absorbs CO2 from NG when it
flow from top to bottom. As a result, the composition CO2 in Liquid increase from stage
1 to stage 8. And CO2 in Gas decrease from bottom to up. For right graph, since
absorption is exothermal reaction so as the cool lean Amine going to column from top,
temperature increase as heat accumulated. But there is a peak where at stage 6 and
temperature goes down. It is because the cold NG enter from bottom to cool the system
temperature.
1
2
3
4
5
6
7
8
0.00 0.05 0.10
stag
es
Mole fraction
Composition profile in absorber
Vapor
Liquid
1
2
3
4
5
6
7
8
0 50 100st
ages
Temperature degree C
Temperature profile in absorber

Sour Gas Treatment Plant Design Page 1 CBE 160 Project Report Team #4
Appendix 3: Stripper Profiles
Figure 3.1 Composition of CO2 in mole
fraction in vapor and liquid phase versus
stages in stripper.
Figure 3.2 Temperature profile versus
stages in stripper.
Similar to the absorber, we generate stripper profiles. However, stage 1 and stage 8 are
condenser and reboiler respectively. The rich Amine liquid goes into stripper at stage 2
and the concentration of CO2 decreases as the steam generate by the reboiler strips off
the CO2 from the liquid. The CO2 in gas phase increase from stage 8 up to 2 slightly.
But the composition of CO2 in gas phase increases dramatically at condenser due to
large temperature drop. Gas phase contains most of water and CO2, decreasing of
temperature condenses most of water and 99.7 % CO2 is removed from rich Amine.
1
2
3
4
5
6
7
8
0 0.5 1
stag
es
Mole fraction
Composition profile in stripper
Vapor
Liquid
1
2
3
4
5
6
7
8
0 50 100 150
stag
esTemperature degree C
Temperature profile in stripper
Sour Gas Treatment Plant Design Page 1 CBE 160 Project Report Team #4
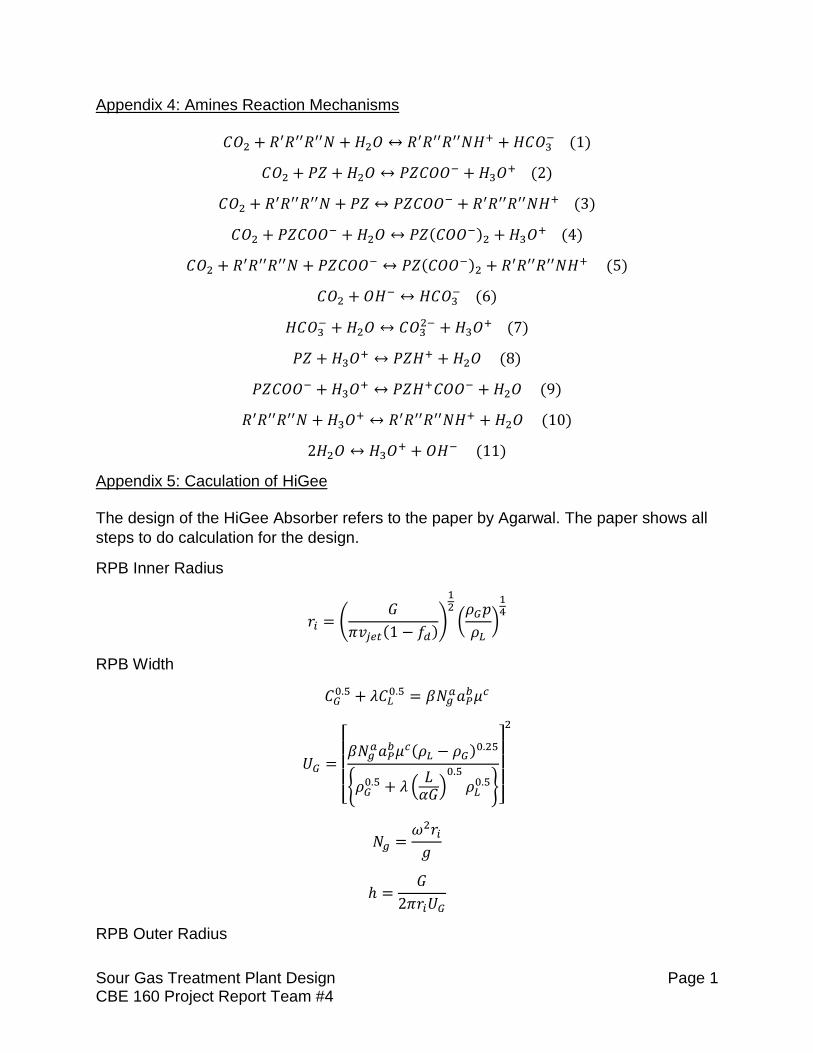
Appendix 4: Amines Reaction Mechanisms
𝐶𝑂2 + 𝑅′𝑅′′𝑅′′𝑁 + 𝐻2𝑂 ↔ 𝑅′𝑅′′𝑅′′𝑁𝐻+ + 𝐻𝐶𝑂3− (1)
𝐶𝑂2 + 𝑃𝑍 + 𝐻2𝑂 ↔ 𝑃𝑍𝐶𝑂𝑂− + 𝐻3𝑂+ (2)
𝐶𝑂2 + 𝑅′𝑅′′𝑅′′𝑁 + 𝑃𝑍 ↔ 𝑃𝑍𝐶𝑂𝑂− + 𝑅′𝑅′′𝑅′′𝑁𝐻+ (3)
𝐶𝑂2 + 𝑃𝑍𝐶𝑂𝑂− + 𝐻2𝑂 ↔ 𝑃𝑍(𝐶𝑂𝑂−)2 + 𝐻3𝑂+ (4)
𝐶𝑂2 + 𝑅′𝑅′′𝑅′′𝑁 + 𝑃𝑍𝐶𝑂𝑂− ↔ 𝑃𝑍(𝐶𝑂𝑂−)2 + 𝑅′𝑅′′𝑅′′𝑁𝐻+ (5)
𝐶𝑂2 + 𝑂𝐻− ↔ 𝐻𝐶𝑂3− (6)
𝐻𝐶𝑂3− + 𝐻2𝑂 ↔ 𝐶𝑂3
2− + 𝐻3𝑂+ (7)
𝑃𝑍 + 𝐻3𝑂+ ↔ 𝑃𝑍𝐻+ + 𝐻2𝑂 (8)
𝑃𝑍𝐶𝑂𝑂− + 𝐻3𝑂+ ↔ 𝑃𝑍𝐻+𝐶𝑂𝑂− + 𝐻2𝑂 (9)
𝑅′𝑅′′𝑅′′𝑁 + 𝐻3𝑂+ ↔ 𝑅′𝑅′′𝑅′′𝑁𝐻+ + 𝐻2𝑂 (10)
2𝐻2𝑂 ↔ 𝐻3𝑂+ + 𝑂𝐻− (11)
Appendix 5: Caculation of HiGee
The design of the HiGee Absorber refers to the paper by Agarwal. The paper shows all
steps to do calculation for the design.
RPB Inner Radius
𝑟𝑖 = (𝐺
𝜋𝑣𝑗𝑒𝑡(1 − 𝑓𝑑))
12
(𝜌𝐺𝑝
𝜌𝐿)
14
RPB Width
𝐶𝐺0.5 + 𝜆𝐶𝐿
0.5 = 𝛽𝑁𝑔𝑎𝑎𝑃
𝑏𝜇𝑐
𝑈𝐺 =
[ 𝛽𝑁𝑔
𝑎𝑎𝑃𝑏𝜇𝑐(𝜌𝐿 − 𝜌𝐺)0.25
{𝜌𝐺0.5 + 𝜆 (
𝐿𝛼𝐺)
0.5
𝜌𝐿0.5}
] 2
𝑁𝑔 =𝜔2𝑟𝑖𝑔
ℎ =𝐺
2𝜋𝑟𝑖𝑈𝐺
RPB Outer Radius

Sour Gas Treatment Plant Design Page 2 CBE 160 Project Report Team #4
𝐺𝑑𝑦 = 𝐾𝑂𝐺𝑎𝑒(𝑦∗ − 𝑦)2𝜋𝑟ℎ𝑑𝑟
𝑟𝑜2 − 𝑟𝑖
2 =𝐺
𝐾𝑂𝐺𝑎𝑒𝜋ℎ[
𝑦𝑜 − 𝑦𝑖
(𝑦 − 𝑦∗)𝐿𝑀]
(𝑦 − 𝑦∗)𝐿𝑀 =(𝑦𝑜 − 𝑦𝑜
∗) − (𝑦𝑖 − 𝑦𝑖∗)
ln [(𝑦𝑜 − 𝑦𝑜∗)/(𝑦𝑖 − 𝑦𝑖
∗)]
𝑉𝑅𝐵𝑃 = 𝜋𝑟𝑜2ℎ
Liquid distributor
Surface area
𝑆 = 2𝜋𝑟𝑖ℎ
Packing volume
𝑉 = 𝜋ℎ(𝑟𝑜2 − 𝑟𝑖
2)
Frictional pressure drop
∆𝑃𝑓 =1
2𝑑ℎ𝑓𝜌𝐺 (
𝐺
2𝜋ℎ𝜀)2
(1
𝑟𝑖−
1
𝑟𝑜)
Momentum pressure drop
∆𝑃𝑚 =1
2𝜌𝐺 (
𝐺
2𝜋ℎ𝜀)2
(1
𝑟𝑖2 −
1
𝑟𝑜2)
Centrifugal pressure drop
∆𝑃𝐶 =1
2𝜌𝐺𝐴𝜔2(𝑟𝑜
2 − 𝑟𝑖2)
∆𝑃𝑅𝑃𝐵 = ∆𝑃𝑓 + ∆𝑃𝑚 + ∆𝑃𝐶
Pressure recovery
∆𝑝 = (4𝑓ℎ
3𝐷𝑝𝑖𝑝𝑒− 2𝐾)
𝜌𝐿𝑣𝑖2
2
Hole pressure drop
∆𝑝0 =1
𝐶02
𝜌𝐿𝑣𝑗𝑒𝑡2
2
Percent Mal-distribution
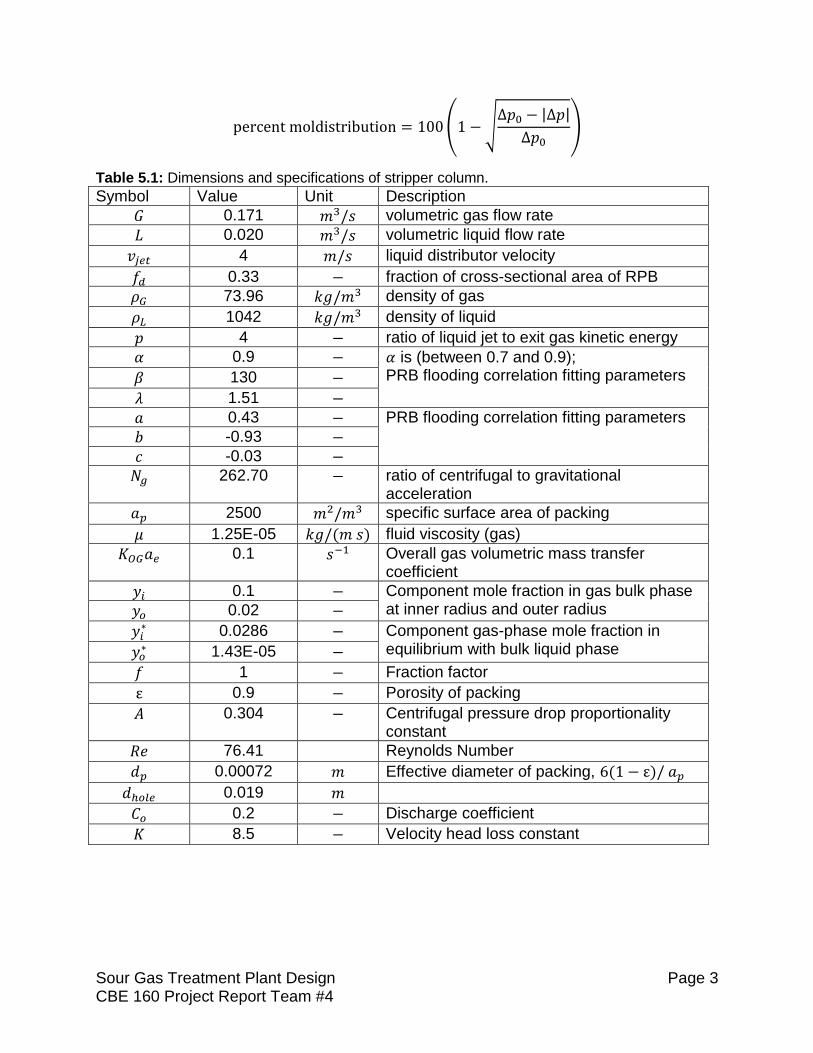
Sour Gas Treatment Plant Design Page 3 CBE 160 Project Report Team #4
percent moldistribution = 100(1 − √∆𝑝0 − |∆𝑝|
∆𝑝0)
Table 5.1: Dimensions and specifications of stripper column.
Symbol Value Unit Description
𝐺 0.171 𝑚3/𝑠 volumetric gas flow rate
𝐿 0.020 𝑚3/𝑠 volumetric liquid flow rate
𝑣𝑗𝑒𝑡 4 𝑚/𝑠 liquid distributor velocity
𝑓𝑑 0.33 − fraction of cross-sectional area of RPB
𝜌𝐺 73.96 𝑘𝑔/𝑚3 density of gas
𝜌𝐿 1042 𝑘𝑔/𝑚3 density of liquid
𝑝 4 − ratio of liquid jet to exit gas kinetic energy
𝛼 0.9 − 𝛼 is (between 0.7 and 0.9); PRB flooding correlation fitting parameters 𝛽 130 −
𝜆 1.51 −
𝑎 0.43 − PRB flooding correlation fitting parameters
𝑏 -0.93 −
𝑐 -0.03 −
𝑁𝑔 262.70 − ratio of centrifugal to gravitational acceleration
𝑎𝑝 2500 𝑚2/𝑚3 specific surface area of packing
𝜇 1.25E-05 𝑘𝑔/(𝑚 𝑠) fluid viscosity (gas)
𝐾𝑂𝐺𝑎𝑒 0.1 𝑠−1 Overall gas volumetric mass transfer coefficient
𝑦𝑖 0.1 − Component mole fraction in gas bulk phase at inner radius and outer radius 𝑦𝑜 0.02 −
𝑦𝑖∗ 0.0286 − Component gas-phase mole fraction in
equilibrium with bulk liquid phase 𝑦𝑜∗ 1.43E-05 −
𝑓 1 − Fraction factor
ε 0.9 − Porosity of packing
𝐴 0.304 − Centrifugal pressure drop proportionality constant
𝑅𝑒 76.41 Reynolds Number
𝑑𝑝 0.00072 𝑚 Effective diameter of packing, 6(1 − ε)/ 𝑎𝑝
𝑑ℎ𝑜𝑙𝑒 0.019 𝑚
𝐶𝑜 0.2 − Discharge coefficient
𝐾 8.5 − Velocity head loss constant