soil gas radon concentrations measurements in terms of great soil groups
TRANSCRIPT
lable at ScienceDirect
Journal of Environmental Radioactivity 126 (2013) 165e171
Contents lists avai
Journal of Environmental Radioactivity
journal homepage: www.elsevier .com/locate/ jenvrad
Soil gas radon concentrations measurements in termsof great soil groups
Mutlu _Içhedef a,*, Müslim Murat Saç a, Berkay Camgöz a, Mustafa Bolca b,Çoskun Harmansah c
a Ege University, Institute of Nuclear Sciences, 35100 Bornova, _Izmir, Turkeyb Ege University, Faculty of Agriculture, Department of Soil science and Plant Nutrition, 35100 _Izmir, Turkeyc Ege University, Ege Higher Vocational School, 35100 Bornova, _Izmir, Turkey
a r t i c l e i n f o
Article history:Received 11 April 2013Received in revised form2 August 2013Accepted 10 August 2013Available online 4 September 2013
Keywords:Soil gasRadonGreat soil groupsTuzla fault
* Corresponding author. Tel.: þ90 2323113453; faxE-mail address: [email protected] (M. _Içhedef).
0265-931X/$ e see front matter � 2013 Elsevier Ltd.http://dx.doi.org/10.1016/j.jenvrad.2013.08.003
a b s t r a c t
In this study, soil gas radon concentrations were investigated according to locations, horizontal soil layersand great soil groups around Tuzla Fault, Seferihisar-_Izmir. Great soil groups are a category that describedthe horizontal soil layers under soil classification system and distributions of radon concentration in thegreat soil groups are firstly determined by the present study. According to the obtained results, it hasbeen showed that the radon concentrations in the Koluvial soil group are higher than the other soilgroups in the region. Also significant differences on location in same great soil group were determined.The radon concentrations in the Koluvial soil groups were measured with respect to soil layers structures(A, B, C1, and C2). It has been observed that the values increase with depth of soil (C2>C1>B>A). Themain reason may be due to the meteorological factors that have limited effect on radon escape from deeplayers. Although fault lines pass thought the study area radon concentrations were varied location tolocation, layer to layer and great group to great group. The study shows that a detailed locationdescription should be performed before soil radon measurements for earthquake predictions.
� 2013 Elsevier Ltd. All rights reserved.
1. Introduction
Radon (222Rn) can be migrating effectively from Earth crust toatmosphere by diffusion and by convective flow (Kristiansson andMalmqvist, 1982; Etiope and Martinelli, 2002; Zmazek et al.,2006; Sundal et al., 2008). The transport of radon in the ground isaffected by phenomena accompanying seismic events (Scholz et al,1973; King, 1978; Ui et al., 1988; Ohno and Wakita, 1996; Pulinetset al., 1997; Toutain and Baubron, 1999; Planinic et al., 2000;Belyaev, 2001; Virk and Walia, 2001). When monitoring of theradon variations shortly before or during an earthquake, ananomaly in radon level may be observed (Zmazek et al., 2006).Radon has been monitored in different geological media such asshallow soil, solid rocks, alluvial deposits, caves, tunnels and minesduring the last 40 years. The major aims of the recent studies wereto determine the relationship between radon concentrationchanges and the potential risk of radon in increasing lung cancer, orthe relationship with geophysics, tectonic events including earth-quakes and volcanic eruptions (Zafrir et al., 2011).
: þ90 2323113433.
All rights reserved.
There are many different factors that affect the radon escapefrom soil to atmosphere. These are meteorological factors (atmo-spheric pressure, temperature, and humidity), geological structure,soil characteristics and location etc. (de Jong et al., 1994; Swakonet al., 2005; Vaupotic et al., 2007). In spite of many detailed in-vestigations on meteorological factors and geological structure,only a few of study have focused on soil characteristics. Vaupoticet al. (2007) investigated radon and radioactivity potential of“terra rossa” soil in Croatian Krastic Region and they have indicatedthat radon activity levels in soil gas differ from point to point. Inanother study conducted in 2001 by Jönsson, soil depth relationwas investigated regardless of horizontal soil layers and soilstructure. As a starting point, we examined radon concentrations inthe great soil groups with respect to soil layer structures. Great soilgroups are a category that described the horizontal soil layers un-der soil classification. All over the world totally 230 great soilgroups defined. In soil classification system six hierarchic cate-gories are order, suborder, great soil groups (great group), subgroupand family (_Içhedef, 2011).
Tuzla fault is the one of the most important faults around _IzmirCity which is the third biggest city of Turkey. An earthquake(Mw ¼ 6.0) occurred on Do�ganbey promontory is well recognizedby the character of this fault (Ocako�glu et al., 2005). Strike-slip

Table 1Detail list of measurement stations.
Station ID Coordinates Location(vegetation)
Great group-(symbol)-Latin name
I-1 38 07 621 N26 54 658 E
Cumalı(Olive Garden)
Non Calcic Brown (U)Typic Haploxeralf
I-2 38 07 523 N26 54 727 E
Cumalı(Garden)
Koluvial (K)Typic Xerorthent
I-3 38 04 288 N26 54 542 E
Do�ganbeyRoad (Grassland)
Alluviyal (A)Typic Xerofluvent
I-4 38 06 324 N26 54 990 E
KarakoçRoad (Grassland)
Non Calcic Brown (U)Typic Haploxeralf
I-5 38 04 999 N26 55 469 E
Karakoç(Tangerine Garden)
Alluviyal (A)Typic Xerofluvent
I-6 38 04 643 N26 54 455 E
Do�ganbeyRoad (Wheat)
Koluvial (K)Typic Xerorthent
M. _Içhedef et al. / Journal of Environmental Radioactivity 126 (2013) 165e171166
faults crossing the Anatolia have great lengths longer than 50 km;however, the fault lines continue under the sea of Aegean (Aktu�gand Kılıço�glu, 2006). The fault is also located on reach area interms of thermal springs. Hot water springs are located at or nearthe fault intersections and the main springs are Do�ganbey, Tuzla,Karakoç, and Cumalı hot springs (Fig. 1) and the area named asSeferihisar Geothermal Field (Vengosh et al., 2002; Drahor andBerge, 2006).
Our surveys were focused on soil gas radon concentrations ac-cording to location, soil layer and great soil groups around TuzlaFault, Seferihisar-_Izmir. The study was performed over an area ofapproximately 40 km2 (4 km� 10 km). In this paper we present theresults of periodic radon measurements performed using LR-115Type 2 detectors.
I-7 38 05 940 N26 54 231 E
Tuzla (OliveGarden-Grassland)
Non CalcicBrown Forest (N)Typic Argixeroll
I-8 38 06 053 N26 54 110 E
Tuzla (Forest) Brown Forest (M)Typic Xerochrept
I-9 38 07 693 N26 54 998 E
Cumalı (Forest) Brown Forest (M)Typic Xerochrept
I-10 38 05 347 N26 55 177 E
Karakoç (Forest) Non Calcic BrownForest (N)Typic Argixeroll
2. Material and methods
2.1. Study area
The Aegean Region is located along the Western Anatolia.Eastern part of Aegean Region has large EeW and some NEeSWstriking grabens. Seferihisar geothermal area is located in theÇubukluda�g Graben composed of the Paleozoic crystallineschist’s of the Menderes massif, which outcrop in a large areato the southeast. The main faults bounding the Çubukluda�gGraben strike generally NEeSW and younger NWeSE and WeEfaults are also present. Hot water springs (Do�ganbey, Tuzla,Karakoç, and Cumalı) are located at or near the fault intersections(Drahor and Berge, 2006). Since the early 1970s, lots ofwells have been drilled in this area, but only three wells arepresently available. They are of moderate depths (150e350 m)and have temperatures in the 120e153 �C range (Serpen et al.,2009).
Study area is covered by five great groups have been describedas Alluvial (Typic Xerofluvent), Koluvial (Typic Xerorthent), NonCalcic Brown (Typic Haploxeralf), Non Calcic Brown Forest (TypicArgixeroll) and Brown Forest (Typic Xerochrept) according to SoilTaxonomy (Table 1).
Fig. 1. Detailed geological map of study area (
2.2. Techniques
It was selected 10 measurement fields from 5 great groups forsoil gas radon measurements. In each measurement field, soil wasexcavated as cylindrical hole until the geologic material and thenhorizontal soil layers have been defined (Fig. 2). A PVC pipe wasinstalled in each hole. Detectors were attached to a plastic cup,which serves as a thermal isolator tominimizewater vapor. The cupwas turned upside down in to the base of PVC pipe (Vulkan et al.,1992; Papastefanou, 2007). A schematic description of this sys-tem is illustrated in Fig. 3.
After completed the installation of the each station, mea-surements were started. The station 5 (I-5) was failed because offlooding. Soil gas radon measurements were carried out
compiled from Drahor and Berge, 2006).
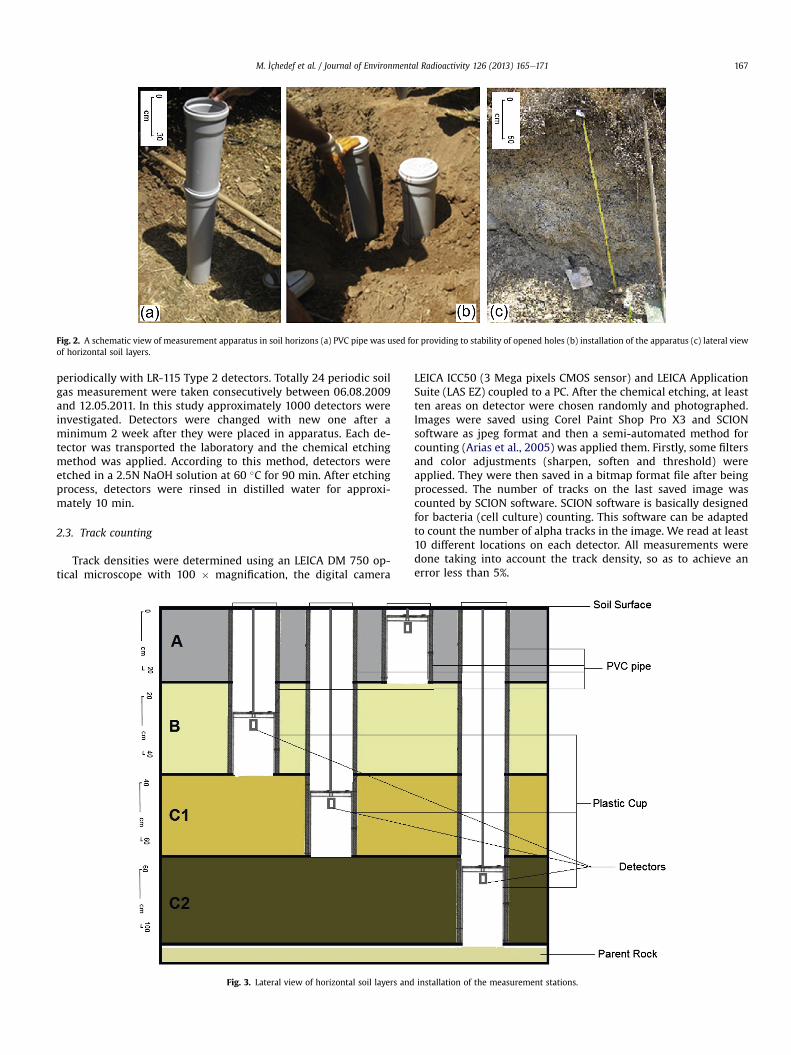
Fig. 2. A schematic view of measurement apparatus in soil horizons (a) PVC pipe was used for providing to stability of opened holes (b) installation of the apparatus (c) lateral viewof horizontal soil layers.
M. _Içhedef et al. / Journal of Environmental Radioactivity 126 (2013) 165e171 167
periodically with LR-115 Type 2 detectors. Totally 24 periodic soilgas measurement were taken consecutively between 06.08.2009and 12.05.2011. In this study approximately 1000 detectors wereinvestigated. Detectors were changed with new one after aminimum 2 week after they were placed in apparatus. Each de-tector was transported the laboratory and the chemical etchingmethod was applied. According to this method, detectors wereetched in a 2.5N NaOH solution at 60 �C for 90 min. After etchingprocess, detectors were rinsed in distilled water for approxi-mately 10 min.
2.3. Track counting
Track densities were determined using an LEICA DM 750 op-tical microscope with 100 � magnification, the digital camera
Fig. 3. Lateral view of horizontal soil layers and
LEICA ICC50 (3 Mega pixels CMOS sensor) and LEICA ApplicationSuite (LAS EZ) coupled to a PC. After the chemical etching, at leastten areas on detector were chosen randomly and photographed.Images were saved using Corel Paint Shop Pro X3 and SCIONsoftware as jpeg format and then a semi-automated method forcounting (Arias et al., 2005) was applied them. Firstly, some filtersand color adjustments (sharpen, soften and threshold) wereapplied. They were then saved in a bitmap format file after beingprocessed. The number of tracks on the last saved image wascounted by SCION software. SCION software is basically designedfor bacteria (cell culture) counting. This software can be adaptedto count the number of alpha tracks in the image. We read at least10 different locations on each detector. All measurements weredone taking into account the track density, so as to achieve anerror less than 5%.
installation of the measurement stations.

M. _Içhedef et al. / Journal of Environmental Radioactivity 126 (2013) 165e171168
2.4. Calibration of detectors
The calibration study was performed according to Cherouatiet al. (1988). Laboratory experiment was done for determiningcalibration coefficient and five different activities of 226Ra wereplaced on the bottom of the air tight glass. Detectors were placedinside the glass containers and at the end of the equilibrium period(40 days); track density of detectors determined by using standardprocedure. The calibration coefficient was calculated to be as a0.0217 kBq m�3/track cm�2 day�1.
3. Results and discussion
The soil gas radon concentrationswere investigated around TuzlaFault Zone since 2009 till 2011. Measurements were realized peri-odically. Radon values ranged from 0.1�0.03 to 261.1�1.6 kBqm�3.Soil gas radon levels generally vary in the range of kBq m�3 and thehighest levels of radon can bemeasured around the fault lines and/orgeothermal areas. Soil gas radon variations monitored in Sloveniaand radon concentrations found between 25 and 420 kBq m�3 in adry soil (Vaupotic et al., 2007). It is noticed that high values of radonconcentration in soil gas can detect linearly distributed along somesubsurface tectonic lineaments (Al-Hilal and Al-Ali, 2010).
At the beginning of the study, distribution of data in our sur-vey was tested by using basic statistical tests. Basic statistics forthe soil radon data of sample populations were shown in Table 2.It was found that the radon data is complying with log-normaldistribution. This is in accordance with the results which sug-gest that radon values fit log-normal distributions (Neri et al.,2011).
In this studycomparisonofmeasurement stations, soil layers andgreat groups were performed statistically. Statistical analysis wasperformed by the SPSS 15 program. Firstly, radon levels of tenmeasurement stations were analyzed between themselves. Thehighest levelswere found between 2.8� 0.1 and 261.1�1.6 kBqm�3
(average71.8�0.6 kBqm�3) in station6 (I6). Datawere evaluatedbyKruskaleWallis test and therewere significant differences (Figs. 4, 5and 6) between station 6 (I6) and other stations (p < 0.001). Thisstation is located near to the Do�ganbey Geothermal Spring and thewestern end of Tuzla fault pass through to this place. The radonconcentrations excluding station 6 (I6) were varied between
Table 2Basic statistics for the soil radon data (kBq m�3).
N Min Max Mean Stand. dev.
StationsI1 43 0.3 19.0 2.88 3.5I2 68 0.3 38.5 9.35 8.9I3 42 0.2 15.3 4.67 3.3I4 48 0.1 10.1 2.67 2.2I6 66 2.8 261.1 71.8 54.1I7 45 0.2 8.1 2.32 1.6I8 65 0.5 66.1 4.10 8.0I9 61 0.2 10.5 1.40 1.5I10 69 0.1 5.7 1.62 1.3
Horizontal soil layersA 202 0.10 162.50 9.94 21.86B 113 0.10 11.10 2.01 1.92C1 149 0.10 245.80 14.47 33.09C2 45 0.30 261.10 44.89 58.43
Great soil groupsAlluvial 44 0.20 15.30 4.84 3.38Brown Forest 126 0.20 66.10 2.79 5.99Non Calcic Brown Forest 114 0.10 8.10 1.90 1.44Non Calcic Brown 91 0.10 19.00 2.77 2.88Kolivial 134 0.30 261.10 40.13 49.52
0.1 � 0.02 and 38.5 � 0.3 kBq m�3 (average 3.7 kBq m�3). Exceptsome extreme results like 261.6 and 218.5 kBq m�3 which mayaccept as radon anomalies relate the tectonic movements, soil gasradon levels of the area was found close to world ranges. On theother hand the observed radon levels in the station 6 are clearlydifferent from the other stations although all stations are located inthe fault zone. Spatial distribution of soil gas radon can differmeaningfully even around the fault line (Giammanco et al., 2009;Siniscalchi et al., 2010; Neri et al., 2011). In this area highest radonconcentrations were determined secondary in station 2 (I2). Thecommon characteristic of these stations (I6 and I2), they wereinstalled on the samegreat soil groups (Koluvial). These two stationsare uncultivated soils and results indicated that there is a high de-gree of similarity between them. Uncultivated soils have stableporosity so that canpermit always samedegree.Oppositely, porosityand tortuosity of soil generally change with cultivation and this canaffect radon transportation positively or negatively.
Fig. 4. Soil gas radon concentrations of I1, I2 and I3 stations.
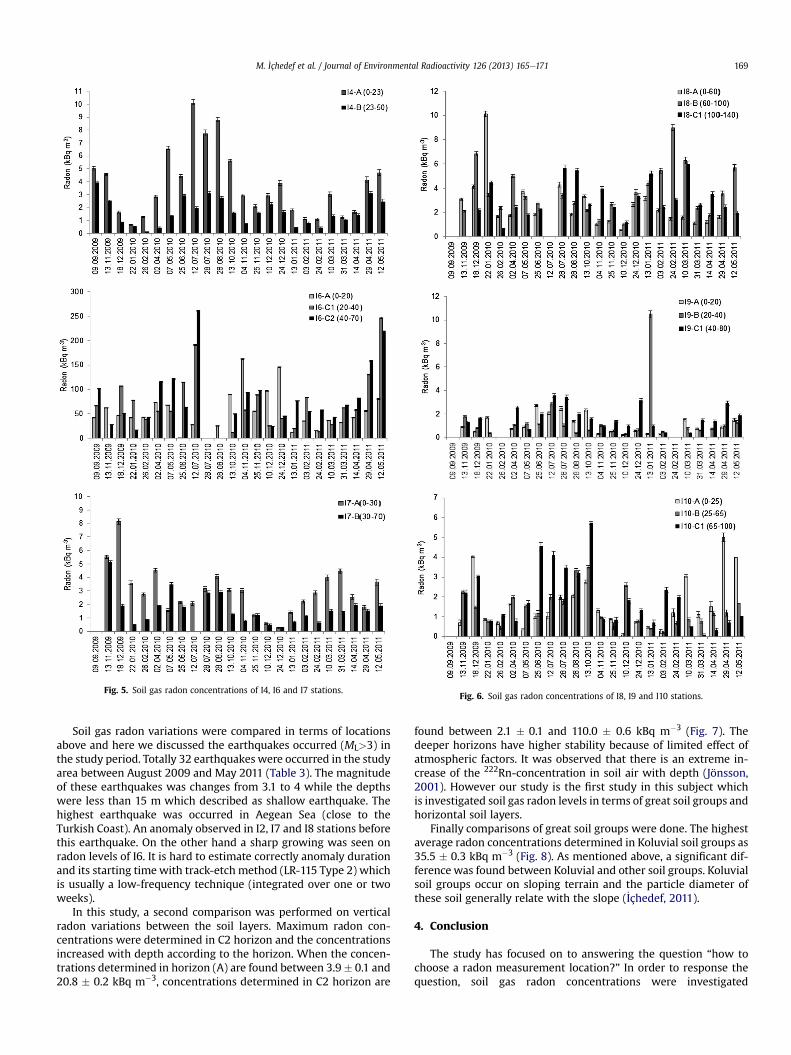
Fig. 5. Soil gas radon concentrations of I4, I6 and I7 stations.Fig. 6. Soil gas radon concentrations of I8, I9 and I10 stations.
M. _Içhedef et al. / Journal of Environmental Radioactivity 126 (2013) 165e171 169
Soil gas radon variations were compared in terms of locationsabove and here we discussed the earthquakes occurred (ML>3) inthe study period. Totally 32 earthquakes were occurred in the studyarea between August 2009 and May 2011 (Table 3). The magnitudeof these earthquakes was changes from 3.1 to 4 while the depthswere less than 15 m which described as shallow earthquake. Thehighest earthquake was occurred in Aegean Sea (close to theTurkish Coast). An anomaly observed in I2, I7 and I8 stations beforethis earthquake. On the other hand a sharp growing was seen onradon levels of I6. It is hard to estimate correctly anomaly durationand its starting time with track-etch method (LR-115 Type 2) whichis usually a low-frequency technique (integrated over one or twoweeks).
In this study, a second comparison was performed on verticalradon variations between the soil layers. Maximum radon con-centrations were determined in C2 horizon and the concentrationsincreased with depth according to the horizon. When the concen-trations determined in horizon (A) are found between 3.9� 0.1 and20.8 � 0.2 kBq m�3, concentrations determined in C2 horizon are
found between 2.1 � 0.1 and 110.0 � 0.6 kBq m�3 (Fig. 7). Thedeeper horizons have higher stability because of limited effect ofatmospheric factors. It was observed that there is an extreme in-crease of the 222Rn-concentration in soil air with depth (Jönsson,2001). However our study is the first study in this subject whichis investigated soil gas radon levels in terms of great soil groups andhorizontal soil layers.
Finally comparisons of great soil groups were done. The highestaverage radon concentrations determined in Koluvial soil groups as35.5 � 0.3 kBq m�3 (Fig. 8). As mentioned above, a significant dif-ference was found between Koluvial and other soil groups. Koluvialsoil groups occur on sloping terrain and the particle diameter ofthese soil generally relate with the slope (_Içhedef, 2011).
4. Conclusion
The study has focused on to answering the question “how tochoose a radon measurement location?” In order to response thequestion, soil gas radon concentrations were investigated
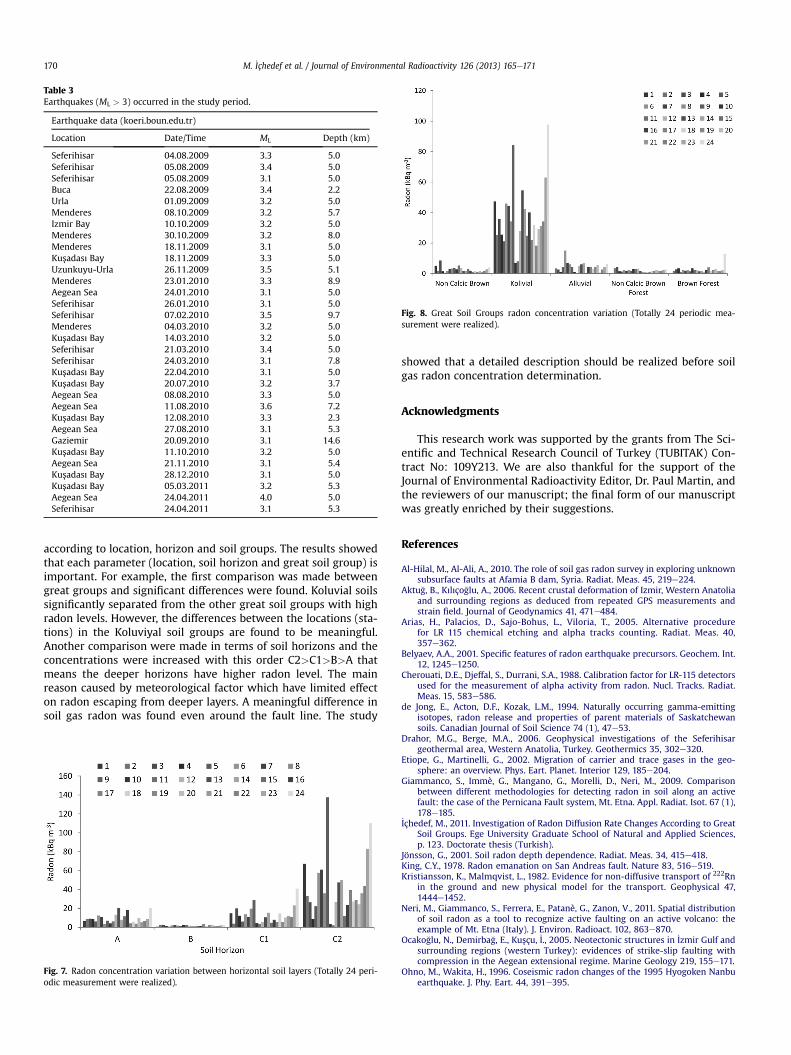
Table 3Earthquakes (ML > 3) occurred in the study period.
Earthquake data (koeri.boun.edu.tr)
Location Date/Time ML Depth (km)
Seferihisar 04.08.2009 3.3 5.0Seferihisar 05.08.2009 3.4 5.0Seferihisar 05.08.2009 3.1 5.0Buca 22.08.2009 3.4 2.2Urla 01.09.2009 3.2 5.0Menderes 08.10.2009 3.2 5.7Izmir Bay 10.10.2009 3.2 5.0Menderes 30.10.2009 3.2 8.0Menderes 18.11.2009 3.1 5.0Kusadası Bay 18.11.2009 3.3 5.0Uzunkuyu-Urla 26.11.2009 3.5 5.1Menderes 23.01.2010 3.3 8.9Aegean Sea 24.01.2010 3.1 5.0Seferihisar 26.01.2010 3.1 5.0Seferihisar 07.02.2010 3.5 9.7Menderes 04.03.2010 3.2 5.0Kusadası Bay 14.03.2010 3.2 5.0Seferihisar 21.03.2010 3.4 5.0Seferihisar 24.03.2010 3.1 7.8Kusadası Bay 22.04.2010 3.1 5.0Kusadası Bay 20.07.2010 3.2 3.7Aegean Sea 08.08.2010 3.3 5.0Aegean Sea 11.08.2010 3.6 7.2Kusadası Bay 12.08.2010 3.3 2.3Aegean Sea 27.08.2010 3.1 5.3Gaziemir 20.09.2010 3.1 14.6Kusadası Bay 11.10.2010 3.2 5.0Aegean Sea 21.11.2010 3.1 5.4Kusadası Bay 28.12.2010 3.1 5.0Kusadası Bay 05.03.2011 3.2 5.3Aegean Sea 24.04.2011 4.0 5.0Seferihisar 24.04.2011 3.1 5.3
Fig. 8. Great Soil Groups radon concentration variation (Totally 24 periodic mea-surement were realized).
M. _Içhedef et al. / Journal of Environmental Radioactivity 126 (2013) 165e171170
according to location, horizon and soil groups. The results showedthat each parameter (location, soil horizon and great soil group) isimportant. For example, the first comparison was made betweengreat groups and significant differences were found. Koluvial soilssignificantly separated from the other great soil groups with highradon levels. However, the differences between the locations (sta-tions) in the Koluviyal soil groups are found to be meaningful.Another comparison were made in terms of soil horizons and theconcentrations were increased with this order C2>C1>B>A thatmeans the deeper horizons have higher radon level. The mainreason caused by meteorological factor which have limited effecton radon escaping from deeper layers. A meaningful difference insoil gas radon was found even around the fault line. The study
Fig. 7. Radon concentration variation between horizontal soil layers (Totally 24 peri-odic measurement were realized).
showed that a detailed description should be realized before soilgas radon concentration determination.
Acknowledgments
This research work was supported by the grants from The Sci-entific and Technical Research Council of Turkey (TUBITAK) Con-tract No: 109Y213. We are also thankful for the support of theJournal of Environmental Radioactivity Editor, Dr. Paul Martin, andthe reviewers of our manuscript; the final form of our manuscriptwas greatly enriched by their suggestions.
References
Al-Hilal, M., Al-Ali, A., 2010. The role of soil gas radon survey in exploring unknownsubsurface faults at Afamia B dam, Syria. Radiat. Meas. 45, 219e224.
Aktu�g, B., Kılıço�glu, A., 2006. Recent crustal deformation of Izmir, Western Anatoliaand surrounding regions as deduced from repeated GPS measurements andstrain field. Journal of Geodynamics 41, 471e484.
Arias, H., Palacios, D., Sajo-Bohus, L., Viloria, T., 2005. Alternative procedurefor LR 115 chemical etching and alpha tracks counting. Radiat. Meas. 40,357e362.
Belyaev, A.A., 2001. Specific features of radon earthquake precursors. Geochem. Int.12, 1245e1250.
Cherouati, D.E., Djeffal, S., Durrani, S.A., 1988. Calibration factor for LR-115 detectorsused for the measurement of alpha activity from radon. Nucl. Tracks. Radiat.Meas. 15, 583e586.
de Jong, E., Acton, D.F., Kozak, L.M., 1994. Naturally occurring gamma-emittingisotopes, radon release and properties of parent materials of Saskatchewansoils. Canadian Journal of Soil Science 74 (1), 47e53.
Drahor, M.G., Berge, M.A., 2006. Geophysical investigations of the Seferihisargeothermal area, Western Anatolia, Turkey. Geothermics 35, 302e320.
Etiope, G., Martinelli, G., 2002. Migration of carrier and trace gases in the geo-sphere: an overview. Phys. Eart. Planet. Interior 129, 185e204.
Giammanco, S., Immè, G., Mangano, G., Morelli, D., Neri, M., 2009. Comparisonbetween different methodologies for detecting radon in soil along an activefault: the case of the Pernicana Fault system, Mt. Etna. Appl. Radiat. Isot. 67 (1),178e185.
_Içhedef, M., 2011. Investigation of Radon Diffusion Rate Changes According to GreatSoil Groups. Ege University Graduate School of Natural and Applied Sciences,p. 123. Doctorate thesis (Turkish).
Jönsson, G., 2001. Soil radon depth dependence. Radiat. Meas. 34, 415e418.King, C.Y., 1978. Radon emanation on San Andreas fault. Nature 83, 516e519.Kristiansson, K., Malmqvist, L., 1982. Evidence for non-diffusive transport of 222Rn
in the ground and new physical model for the transport. Geophysical 47,1444e1452.
Neri, M., Giammanco, S., Ferrera, E., Patanè, G., Zanon, V., 2011. Spatial distributionof soil radon as a tool to recognize active faulting on an active volcano: theexample of Mt. Etna (Italy). J. Environ. Radioact. 102, 863e870.
Ocako�glu, N., Demirba�g, E., Kusçu, _I., 2005. Neotectonic structures in _Izmir Gulf andsurrounding regions (western Turkey): evidences of strike-slip faulting withcompression in the Aegean extensional regime. Marine Geology 219, 155e171.
Ohno, M., Wakita, H., 1996. Coseismic radon changes of the 1995 Hyogoken Nanbuearthquake. J. Phy. Eart. 44, 391e395.
M. _Içhedef et al. / Journal of Environmental Radioactivity 126 (2013) 165e171 171
Papastefanou, C., 2007. Measuring radon in soil gas and groundwaters: a review.Ann. Geophys. 50, 569e578.
Planinic, J., Radolic, V., Culo, D., 2000. Searching for an earthquake precursor:temporal variations of radon in soil and water. Fizika B (Zagreb) 9, 75e82.
Pulinets, S.A., Aleseev, V.A., Legenka, A.D., Khegai, V.V., 1997. Radon and metallicaerosols emanation before strong earthquakes and their role in atmosphere andionosphere modification. Adv. Space Res. 20, 2173e2176.
Scholz, R., Sykes, L.R., Aggarwal, Y.P., 1973. Earthquake prediction: a physical basis.Science 181, 803e810.
Serpen, U., Aksoy, N., Ongur, T., Korkmaz, E.D., 2009. Geothermal energy in Turkey:2008 update. Geothermal 38, 227e237.
Siniscalchi, A., Tripaldi, S., Neri, M., Giammanco, S., Piscitelli, S., Balasco, M.,Behncke, B., Magrì, C., Naudet, V., Rizzo, E., 2010. Insights into fluid circulationacross the Pernicana Fault (Mt. Etna, Italy) and implications for flank instability.J. Volcanol. Geotherm. Res. 193, 137e142.
Sundal, A.V., Valen, V., Soldal, O., Strand, T., 2008. The influence of meteorologicalparameters on soil radon levels in permeable glacial sediments. Sci. Total En-viron. 389, 418e428.
Swakon, J., Kozak, K., Paszkowski, M., Gradzinski, R., Loskiewcz, J., Mazur, J.,Janik, M., Bogaz, J., Horwacik, T., Olko, P., 2005. Radon concentration in soil gasaround local disjunctive tectonic zones in the Krakow area. Journal of Envi-ronmental Radioactivity 78, 137e149.
Toutain, J.P., Baubron, J.C., 1999. Gas geochemistry and seismotectonics: a review.Tectonophy 304, 1e27.
Ui, H., Moriuchi, H., Takemura, Y., Tsuchida, H., Fujii, I., Nakamura, M., 1988.Anomalously high radon discharge from the Atotsugawa fault prior to thewestern Nagano Prefecture earthquake (M 6.8) of September 14, 1984. Tecto-nophysics 152, 147e152.
Vaupotic, J., Barisic, D., Kobal, I., Lulic, S., 2007. Radioactivity and radon potential ofthe terra rossa soil. Radiat. Meas. 42, 290e297.
Vengosh, A., Helvacı, C., Karamanderesi, I.H., 2002. Geochemical constraintsfor the origin of thermal waters from western Turkey. Appl. Geochem. 17,163e183.
Virk, H.S., Walia, V., 2001. Helium/radon precursory signals of Chamoli Earthquake,India. Radiat. Meas. 34, 379e384.
Vulkan, U., Steinitz, G., Strull, A., Zafrir, H., 1992. Long-dinstance (þ100 m) transportof radon in syenitic rocks in Makhtesh Ramon, Israel. Nucl. Geophys. 6 (2),261e271.
Zafrir, H., Haquin, G., Malik, U., Barbosa, S.M., Piatibratova, O., Steinitz, G., 2011.Gamma versus alpha sensors for Rn-222 long-term monitoring in geologicalenvironments. Radiat. Meas. 46, 611e620.
Zmazek, B., Todorovski, L., Zivcic, M., Dzeroski, S., Vaupotic, J., Kobal, I., 2006. Radonin a thermal spring: Identification of anomalies related to seismic activity. Appl.Radiat. Isot. 64, 725e734.