studies on radon in soil gas and natural radionuclides in ... · pdf filestudies on radon in...
TRANSCRIPT
INTERNATIONAL JOURNAL OF ENVIRONMENTAL SCIENCES Volume 1, No 5, 2011
© Copyright 2010 All rights reserved Integrated Publishing Association
Research article ISSN 0976 – 4402
Received on December, 2010 Published on January, 2011 786
Studies on Radon in soil gas and Natural radionuclides in soil, rock and ground water samples around Mysore city Shashikumar.T.S, Chandrashekara.M.S, Paramesh.L
Department of Studies in Physics, University of Mysore, Manasagangotri, Mysore, India [email protected]mysore.ac.in
ABSTRACT
The 222 Rn in soil gas were measured in 0.5m and 1m depth for different locations around Mysore city using Solid State Nuclear Track Detectors. The concentration of radon in soil was observed higher near Chamundi hills and Karighatta village in rainy season. These higher concentrations may be due to higher 226 Ra concentration in the soil at these places. The Geometric Median (GM) activity of 226 Ra, 232 Th and 40 K concentration in Mysore city for soil and rock samples is found to be 20.3, 64.0 and 396.7 Bq kg 1 ; 46.4, 68.7 and 634.9 Bq kg 1 . The activity concentration is low compared with the values of world activity concentration. The highest 226 Ra and 222 Rn activity concentration in bore well water sample is found to be 189.10 mBq L 1 and 434.60 Bq L 1 in Chamundi Hills.
Keywords: Radon, SSNTDs, Dosimeter, 226 R, 232 Th, 40 K, HPGe, Bubbler.
1.Introduction
Radon is a radioactive gas emitted from the radioactive decay of 226 Ra, the daughter of 238 U (Surinder singh, 2005). The environmental conditions controlling this exposure are subject to wide variations (Kendall, 2002). The amount of radon that emitted from the earth depends mainly on the amounts of 226 Ra and 232 Th in the ground along with other factors, like the type of the soil cover, porosity, etc (Harmanjit Singh, 2008). The highest contribution to the radiation field is of natural origin; it is due to cosmic rays, the natural radionuclides in soil, radioactivity of the ground and the radioactive decay products of radon in the air. Artificial radioactivity emitted from nuclear power plants, industrial plants and research facilities has smaller contribution to the overall radiation. These emissions are very low in normal operation, although high amounts of radioactivity can be released to the environment through accidents (Rahman et al., 2008).
One of the important factors influencing the dose assessment of human exposure to radionuclides through the food chain in a contaminated area is the transfer factors (TFs) of radionuclides from soil to plants (Davis et al., 1999). Such factors vary from one plant to the other and depend, in general, on the physical and chemical properties of the soil, environmental conditions and chemical form of the radionuclide in the soil (IAEA, 1994; Sheppard, 1985 ). Several studies have been carried out to determine TFs for various plants in different regions (Ciuffo et al., 2002; Velasco et al., 2004; IAEA, 1994; AlKharouf et al., 2008). In general, the naturally occurring radioactivity concentration in plant increases with that in soil in a linear fashion, especially for high soil activity concentrations (Sheppard, 1985; Blanco Rodrıguez et al., 2006; Linsalata et al., 1989; UNSCEAR, 1988).
Groundwater generally contains radionuclides, at concentrations varying over a wide range, which depends on nature of the aquifer and chemical characteristics of the water, such as

Studies on Radon in soil gas and Natural radionuclides in soil, rock and ground water samples around Mysore city
Shashikumar.T.S, Chandrashekara.M.S, Paramesh.L International Journal of Environmental Sciences Volume 1 No.5, 2011
787
salinity and p H (Seghour, 2009). The decay of radionuclides enters into the body through ingestion and inhalation pathways causes internal exposure of humans to ionizing radiations. The elevated levels of natural radionuclides in ground waters are mainly related with uranium and thorium bearing rock minerals and soil or with uranium, radium and thorium deposits. Therefore, the occurrence and distribution of radioactivity in water depends on the local geological characteristics of the source, soil or rock. Other major factors that control the occurrence and distribution of radionuclides in ground waters are the hydrogeological conditions and the geochemistry of each radionuclide (Ajayi, 2009). The occurrence of natural radionuclides in Ground water has been studied with the objective to assess the safety of drinking water with respect to its radionuclide content.
The present study was carried out in Mysore city, Karnataka, India is shown in Figure (1). It lies between 12°15″–12°25″N lat. and 76°35″– 76°45″E long., at an altitude of about 767 m amsl. The study area was about 140 sq. km. A large water reservoir, namely Krishna Raja Sagar (KRS), situated at the northwestern part and Chamundi Hills (1048 m amsl) located on the southeastern part of the city are prominent features of the region. Metasedimentary rocks like biotite, schist, mica schist and hornblende schist belonging to Dharwar group are seen in the form of patches. Younger intrusions like felsite, pegmatite and granite are found in the study area. These intrusions are known for rich concentrations of radioactive minerals.
Figure 1: GeologyMap of Study Area

Studies on Radon in soil gas and Natural radionuclides in soil, rock and ground water samples around Mysore city
Shashikumar.T.S, Chandrashekara.M.S, Paramesh.L International Journal of Environmental Sciences Volume 1 No.5, 2011
788
2. Instrumentation
2.1 Measurement of Radon in soil gas
The Solid State Nuclear Track Detectors (SSNTDs), LR115 Type II detectors have been used for measurements of radon in the soil. For measurement of radon in the soil, a twincup dosimeter designed and fabricated by Mayya and his group at Bhabha Atomic Research Centre (BARC), Mumbai has been used here (Mayya et al., 1998) is as shown in the Figure (2) (Shashikumar et al., 2008). The soilgas radon concentration, CR, is calculated using the following relation (Mayya et al., 1998).
DS T m Bq C R = − ) ( 3
(1)
Where, T is the track density of the film (tracks cm–2), D is the period of exposure (days) and S is the sensitivity factor (0.021 tracks cm –2 d –1 per Bq m –3 ).
Figure 2: The experimental setup for soil gas measurements
2.2 Determination of 226 Ra, 232 Th and 40 K in Soil and Rock samples
The Gamma ray spectrometry (HPGe) method was employed to estimate the activity of 226 Ra, 232 Th and 40 K in the soil and rock samples collected from several locations around Mysore city (Shashikumar et al., 2008). The gamma peak of energy 609.51 keV (emitted by 214 Bi, a
Surface level
SSNTD film Plastic cup
Filter paper and Membrane
PVC pipe
Top cover
Insulating material

Studies on Radon in soil gas and Natural radionuclides in soil, rock and ground water samples around Mysore city
Shashikumar.T.S, Chandrashekara.M.S, Paramesh.L International Journal of Environmental Sciences Volume 1 No.5, 2011
789
decay product of 222 Rn) with intensity 46.1% was used as proxy for the quantitative determination of 226 Ra (IAEA, 1989).
A W E σ) (S
) (Bq.kg Activity
× × × × × ±
= 100 1000 100 1 (2)
Where, S is the net counts/s under the photo peak of interest, σ the standard deviation of S, E the counting efficiency (%), A the gamma abundance (%) of the radionuclide and W the mass of the sample (g).
2.3 Determination of 226 Ra by Bubbler Method
The water samples of 20 liters was collected and preconcentrated by chemical method to estimate the activity of 226 Ra. Pre concentrated sample of about 60 ml was transferred to the radon bubbler is as shown in Figure (3). A vacuum pump was connected to the bubbler and air was sucked through the sample solution to scrub it for about 5 min. This would purge the solution of dissolved 222 Rn. The solution in the blubber was then allowed to stand for a known period of about 21 days (about 35 half lives of 222 Rn) for enough radon to build up. At the end of this period, an evacuated scintillation cell was connected to the bubbler through the quick connector. Under the influence of the vacuum in the scintillation cell, air gets sucked through the solution and fills the scintillation cell. In the process the air carries the radon dissolved in the solution quantitatively. By careful manipulation of the stopcocks the bubbling was controlled and adjusted to be uniform and steady to ensure complete transfer of radon into the cell. The cell was kept for 3 hours or more to allow radon daughters to reach equilibrium with radon. Then, the alpha activity was counted for a period of 1000 seconds. The activity of 226 Ra in the sample was determined using the equation (3) (Raghavayya, 1980).
( ) ( ) ( ) ( ) λθ λ λ − − −
− −
− × × − × × × ×
= e e e E V
D mBqL Ra T t 1 1 10 97 . 6 2
1 226
(3)
Where, D = counts above background, V = Volume of water (20 liters), E = Efficiency of the scintillation cell (74 %), λ = decay constant for radon (2.098 x 10 6 s 1 ), T = Counting delay after sampling, t = Counting duration (s) and θ = build up time in the bubbler (s).
2.4 Determination of 222 Rn by Bubbler method
The samples were collected from the selected locations around Mysore City from manually operated bore wells. About 100 mL of water sample was collected in airtight plastic bottles with minimum disturbance. The plastic bottles were filled completely in a gentle manner, so that zero headspace was present. Care was taken to see that no air bubbles were present inside the container and also to avoid aeration during the sampling process, which might lead to out gassing 10 . The samples were brought to the laboratory with minimal loss of time and were analyzed immediately. The activity concentration of 222 Rn in water was estimated by the emanometry (Strain and Watson, 1979). In this method, about 40 to 60 mL of the water sample was transferred into the bubbler by the vacuum transfer technique. The dissolved radon in the water was transferred into a preevacuated and background counted scintillation cell. The scintillation cell was stored for 180 minutes to allow radon to attain equilibrium with its daughters and then it was coupled to a photomultiplier and alpha counting assembly.

Studies on Radon in soil gas and Natural radionuclides in soil, rock and ground water samples around Mysore city
Shashikumar.T.S, Chandrashekara.M.S, Paramesh.L International Journal of Environmental Sciences Volume 1 No.5, 2011
790
The concentration was calculated using the relation given by Raghavayya (Raghavayya, 1980).
( ) ( ) ( ) ( ) t T e e e E V D BqL Rn λ λθ λ − − −
− −
− × × × × × ×
= 1
10 97 . 6 2 1 222
(4)
Figure 3: Radon Bubbler (Emanometry method)

Studies on Radon in soil gas and Natural radionuclides in soil, rock and ground water samples around Mysore city
Shashikumar.T.S, Chandrashekara.M.S, Paramesh.L International Journal of Environmental Sciences Volume 1 No.5, 2011
791
Figure 4: Spectrum of soil sample collected from Chamundi Hills.
2.5 Dose due to Ingestion and Inhalation of 222 Rn
Using the measured concentration of 222 Rn in Bore well water, the effective dose for the population of the region was estimated. The dose due to 222 Rn can be divided into two parts, namely, the dose from ingestion and the dose from inhalation. The effective dose to the Ingestion mainly depends upon the amount of water consumed by a human being in a day (ICRP, 1991). The parameters for the Inhalation pathway were 222 Rn concentration in water, air water concentration ratio of 10 4 , indoor occupancy of 7,000 hours per year and inhalation dose coefficient applied is that for the gas. The ingestion of tap water was estimated to be 100, 75, and 50 l a 1 by infants, children, and adults. Assuming the proportion of these groups in the population to be 0.05, 0.3, and 0.65, the weighted estimate of consumption is 60 (liter/year) (UNSCEAR, 1993). The dose due to inhalation and ingestion are calculated by the equation (5 & 6) (UNSCEAR, 2000).
Inhalation (mSv): 222 Rn conc. (Bq L 1 ) × 10 4 × 7,000 h × 0.4 × 9 nSv (Bq h m 3 ) 1 (5)
Ingestion (mSv): 222 Rn conc. (Bq L 1 ) × 60 L.y 1 × 10 3 m 3 L 1 × 3.5 nSv Bq 1 (6)
2.6 Effective dose
Radon in tap water/bore well water may lead to exposures from the ingestion of drinking water and from the inhalation of radon released to air when water is used. The contributions to effective dose from two relatively minor pathways of exposure to radon can be added, namely dissolution of the gases in blood with distribution throughout the body and the presence of radon in tap water (UNSCEAR, 2000). The effective dose due to radon intake was assessed using the measured activity of 222 Rn and dose per unit activity of radon ingested. The mean daily intake of water is assumed minimum 1 liter per person.

Studies on Radon in soil gas and Natural radionuclides in soil, rock and ground water samples around Mysore city
Shashikumar.T.S, Chandrashekara.M.S, Paramesh.L International Journal of Environmental Sciences Volume 1 No.5, 2011
792
Figure 5: Spectrum of soil sample collected from Yelwala.
Figure 6: Spectrum of rock sample collected from Chamundi Hills.
MGM BRK CH KG K.R.S YL
0
100
200
300
400
500
0
100
200
300
400
500
222 Rn in Water samples 226 Ra activity in Water samples
222 Rn conc. in water sam
ples (B
q L
1 )
Locations
Figure 7: 226 Ra and 222 Rn activity in Bore well water

Studies on Radon in soil gas and Natural radionuclides in soil, rock and ground water samples around Mysore city
Shashikumar.T.S, Chandrashekara.M.S, Paramesh.L International Journal of Environmental Sciences Volume 1 No.5, 2011
793
10 20 30 40 50 60 70 80 0
1
2
3
4
5
6
222 Rn in soil gas (KBq
m 3 )
226 Ra in soil samples (Bq Kg 1 )
Figure 8: Correlation between 222 Rn in soil gas and 226 Ra in soil samples.
3. Results and Discussion
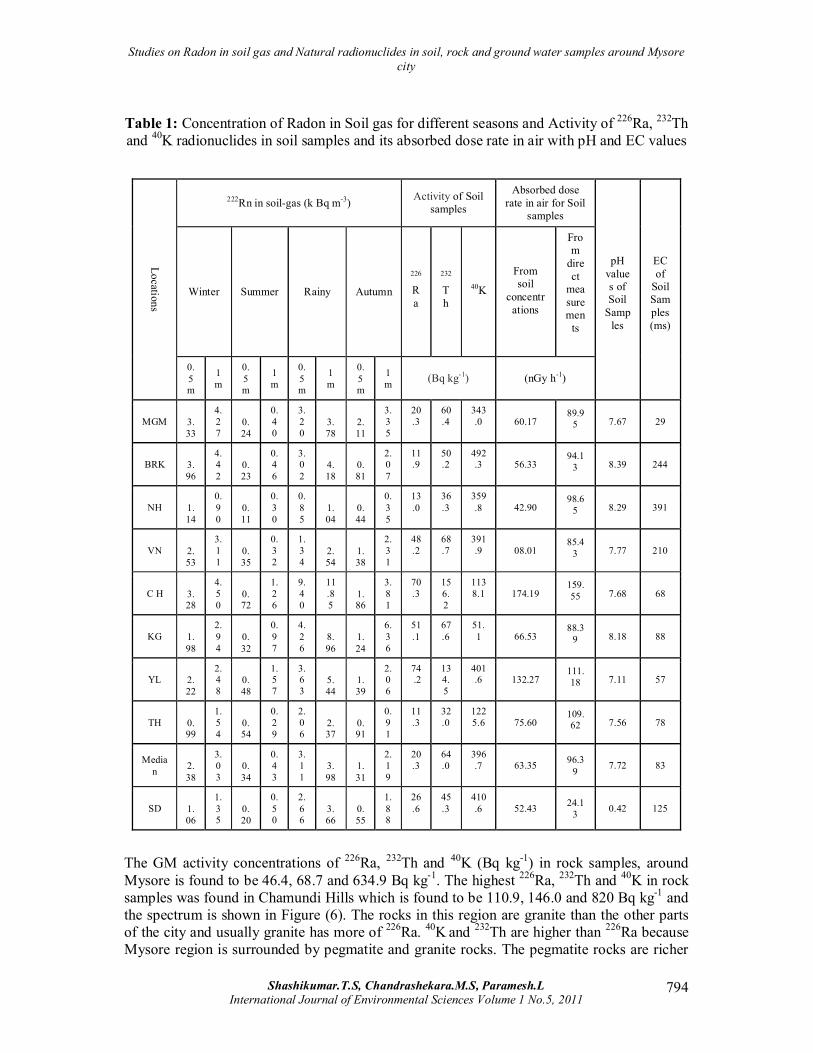
The 222 Rn in soil gas were measured in 0.5m and 1m depth for different locations around Mysore city using Solid State Nuclear Track Detectors are shown in Table (1). The seasonal variations of radon in soil gas are found to be higher at a depth of 1m compare to at a depth of 0.5m from the ground surface. The higher concentration of radon in soil was observed near Chamundi hills and Karighatta village in rainy season with an average value of 11.85 kBq.m – 3 and 8.96 kBq.m –3 at 1m depth from the ground surface. The higher values in Chamundi Hills and Karigatta village may be due to higher 226 Ra concentration in the soil at these places.
The activity concentration of 226 Ra, 232 Th and 40 K radionuclides in soil and rock samples; its absorbed dose rate in air are shown in Table (1) and (2). The activity concentration of 226 Ra, 232 Th and 40 K radionuclides in soil samples is found to be higher in Chamundi Hills and Yelwala locations due to the presences of granites, which might contain a small amount of uranium and its daughter products. The activity concentration of 226 Ra, 232 Th and 40 K radionuclides are found to be 70.3, 156.2 and 1138.1 Bq kg 1 in Chamundi Hills and 74.2, 134.5 and 401.6 Bq kg 1 in Yelwala. The spectrum of soil samples is as shown in Figure (4) and (5). The GM value of absorbed dose rate in air referred from concentrations of radionuclides in soil is found to be 63.35 nGyh –1 and the GM value of measured gamma exposure level is found to be 96.39 nGyh –1.
The median values of world activity concentrations for soil samples vary from 17 to 60 Bq kg 1 with an average value of 35 Bq kg 1 for 226 Ra, from 11 to 64 Bq kg 1 with an average value of 30 Bq kg 1 for 232 Th and 140 to 850 Bq kg 1 with an average value of 400 Bq kg 1 for 40 K radionuclides. The activity concentration in India varies from 7 to 81 Bq kg 1 for 226 Ra, 14 to 160 Bq kg 1 for 232 Th and 38 to 760 Bq kg 1 with average values of 29, 64 and 400 Bq kg 1 (UNSCEAR 2000). The GM value of 226 Ra, 232 Th and 40 K activity concentration in Mysore city for soil samples is found to be 20.3, 64.0 and 396.7 Bq kg 1 and the concentration is low compared with the values of world activity concentration.
Studies on Radon in soil gas and Natural radionuclides in soil, rock and ground water samples around Mysore city
Shashikumar.T.S, Chandrashekara.M.S, Paramesh.L International Journal of Environmental Sciences Volume 1 No.5, 2011
794
Table 1: Concentration of Radon in Soil gas for different seasons and Activity of 226 Ra, 232 Th and 40 K radionuclides in soil samples and its absorbed dose rate in air with pH and EC values
222 Rn in soilgas (k Bq m 3 ) Activity of Soil samples
Absorbed dose rate in air for Soil
samples
Winter Summer Rainy Autumn
226
R a
232
T h
40 K
From soil
concentr ations
From dire ct mea sure men ts
Locations
0. 5 m
1 m
0. 5 m
1 m
0. 5 m
1 m
0. 5 m
1 m (Bq kg 1 ) (nGy h 1 )
pH value s of Soil Samp les
ECof Soil Sam ples (ms)
MGM 3.33
4. 2 7
0. 24
0. 4 0
3. 2 0
3.78
2.11
3. 3 5
20.3
60.4
343 .0 60.17
89.9 5 7.67 29
BRK 3.96
4. 4 2
0. 23
0. 4 6
3. 0 2
4.18
0.81
2. 0 7
11.9
50.2
492 .3 56.33
94.1 3 8.39 244
NH 1.14
0. 9 0
0. 11
0. 3 0
0. 8 5
1.04
0.44
0. 3 5
13.0
36.3
359 .8 42.90
98.6 5 8.29 391
VN 2.53
3. 1 1
0. 35
0. 3 2
1. 3 4
2.54
1.38
2. 3 1
48.2
68.7
391 .9 08.01
85.4 3 7.77 210
C H 3.28
4. 5 0
0. 72
1. 2 6
9. 4 0
11.8 5
1.86
3. 8 1
70.3
156. 2
113 8.1 174.19
159. 55 7.68 68
KG 1.98
2. 9 4
0. 32
0. 9 7
4. 2 6
8.96
1.24
6. 3 6
51.1
67.6
51. 1 66.53
88.3 9 8.18 88
YL 2.22
2. 4 8
0. 48
1. 5 7
3. 6 3
5.44
1.39
2. 0 6
74 .2
134. 5
401 .6 132.27
111. 18 7.11 57
TH 0.99
1. 5 4
0. 54
0. 2 9
2. 0 6
2.37
0.91
0. 9 1
11.3
32.0
122 5.6 75.60
109. 62 7.56 78
Media n 2.
38
3. 0 3
0. 34
0. 4 3
3. 1 1
3.98
1.31
2. 1 9
20.3
64.0
396 .7 63.35 96.3
9 7.72 83
SD 1.06
1. 3 5
0. 20
0. 5 0
2. 6 6
3.66
0.55
1. 8 8
26.6
45.3
410 .6 52.43 24.1
3 0.42 125
The GM activity concentrations of 226 Ra, 232 Th and 40 K (Bq kg 1 ) in rock samples, around Mysore is found to be 46.4, 68.7 and 634.9 Bq kg 1 . The highest 226 Ra, 232 Th and 40 K in rock samples was found in Chamundi Hills which is found to be 110.9, 146.0 and 820 Bq kg 1 and the spectrum is shown in Figure (6). The rocks in this region are granite than the other parts of the city and usually granite has more of 226 Ra. 40 Kand 232 Th are higher than 226 Ra because Mysore region is surrounded by pegmatite and granite rocks. The pegmatite rocks are richer

Studies on Radon in soil gas and Natural radionuclides in soil, rock and ground water samples around Mysore city
Shashikumar.T.S, Chandrashekara.M.S, Paramesh.L International Journal of Environmental Sciences Volume 1 No.5, 2011
795
in 232 Th. The GM value of the gamma dose rates in air from rock samples is found to be 113.62 nGy h 1 . The Geometric Mean value of dose rate in air due to 226 Ra, 232 Th and 40 K (Bq kg 1 ) in rock samples is found to 78.10 nGy h 1 . Absorbed dose rate in air referred from concentrations of radionuclides in soil and rock samples shows good correlation with the direct gamma measurements with Correlation coefficient 0.88 & 0.77.
Table 2: Activity of 226 Ra, 232 Th and 40 K radionuclides in Rock samples and its absorbed dose rate in air; 226 Ra and 222 Rn in Water samples with dose rate due to 222 Rn
around Mysore City
Activity of Rock samples
Water Samples
Dose due to 222 Rn in water samples
Absorbed dose rate in air for Rock samples
226
Ra 232 Th
40 K 226 Ra
222 Rn
Inhalat ion
Ingest ion
Effect ive
From soil concentrat
ions
From direct
measurem ents
Locations around Mysore city
(Bq kg 1 ) (mB q L 1 )
( Bq L 1 ) (µSv y −1 ) (nGy h 1 )
MGM 1.73 4.95 0.004 0.36 0.36
BRK 1.52 18.1 9
0.016 1.09 1.10
C H 110 .9
146 .0
820 .4
189. 10
434. 60
0.399 33.21 33.60 173.68 159.58
KG 13. 9
46.8
950 .9
0.28 4.25 0.003 0.29 0.29 74.38 88.39
KRS 47. 2
22.1
449 .5
18.0 6
48.4 4
0.044 3.65 3.69 53.97 124.58
YL 45. 7
90.7
422 .8
4.62 37.1 8
0.033 2.55 2.58 81.82 102.66
Median 46. 4
68.7
634 .9
3.17 27.6 8
0.024 1.82 1.84 78.10 113.62
SD 40. 6
54.3
265 .1
75.3 4
169. 11
0.155 12.97 13.12 53.13 30.99
The activity concentration of 226 Ra and 222 Rn in water samples are shown in Table (2). The highest 226 Ra activity concentration in bore well water sample is found to be 189.10 mBq L 1 in Chamundi Hills and lowest 226 Ra activity concentration in Karighatta which is found to be 0.28 mBq L 1 . The highest 222 Rn activity concentration of bore well water sample is found to be 434.60 Bq L 1 in Chamundi Hills and lowest 222 Rn activity concentration in Karighatta which is found to be 4.25 Bq L 1 . The plot of 226 Ra and 222 Rn in water samples is as shown in Figure (7). The GM of Inhalation and Ingestion dose due to 222 Rn is found to be 0.024µSv y −1 and 1.82 µSv y −1 . The GM of effective dose due to Ingestion and Inhalation is found to be 1.84 μSv y −1 respectively. The 226 Ra concentrations in ground water samples from Mysore city are lower compared to those in other parts of the world. Radon concentration in water samples shows good correlation with 226 Ra activity in water with correlation coefficient of

Studies on Radon in soil gas and Natural radionuclides in soil, rock and ground water samples around Mysore city
Shashikumar.T.S, Chandrashekara.M.S, Paramesh.L International Journal of Environmental Sciences Volume 1 No.5, 2011
796
0.99 and radon concentration in soil–gas shows good correlation with 226 Ra activity in soil with correlation coefficient of 0.65 is as shown in Figure (8).
The measure of pH value shows the Acidity or alkalinity in the soil samples. Electrical Conductivity (EC) measurements can vary greatly and are affected by several environmental factors including, climate, local biota, bedrock and surficial geology, as well as human impacts on the land. Higher the dissolved material substance in a water or soil sample, the higher the EC will be in that material. The pH value of soil samples in present study shows the best pH value range for soil that is 7 in KRS and Yelwala, as this is the range in which most nutrients can be readily available and soil is good for plantation. The pH value above 7.4 in Manasagangotri, ChamundiHills, Vijayanagar, Baburayanakoppalu, Naguvanahalli Thuruganur and Karighatta soil samples are alkaline soil and contain relatively more lime. Alkaline soil suits lime–loving (calcicole) plants such as many alpines and many vegetables, especially brassicas (cabbage family).
4. Conclusion
From radiation protection point of view, an attempt has been made to estimate health hazard index due to radiation exposure in the study area. The activity of 226 Ra in soil, radon in soil gas, radon concentrations in the atmosphere were studied around Mysore city. The radon in soilgas is found to be higher at a depth of 1m compare to at a depth of 0.5m from the ground surface. The higher radon concentrations in Chamundi Hills and Karigatta village may be due to higher 226 Ra concentration in the soil at these places. The activity concentrations of 226 Ra, 232 Th and 40 K in soil and rock samples have been measured by gammaray spectrometry. The average activity concentrations of 226 Ra, 232 Th and 40 K in soil samples is found to be slightly low when compared with the values of world activity concentration. The 226 Ra concentrations in Ground water samples from Mysore city are lower compared to those in other parts of the world. Radon concentration in water samples shows good correlation with 226 Ra activity in water with correlation coefficient of 0.99 and radon concentration in soil–gas shows good correlation with 226 Ra activity in soil with correlation coefficient of 0.65.
5. References
1. Ajayi,O.S., and Achuka,J,2009,: “Radiation Protection Dosimetry”, 135(1),pp 5463.
2. AlKharouf,S.J., AlHamarneh,I.F., and Dababneh,M,2008,: “Journal of Environmental Radioactvity”, 99(7),pp 11921199.
3. Blanco Rodrıguez,P., Vera Tome,F., Fernandez Perez,M., and Lozano,J.C,2006,: “Sci. Total Environ”, pp 361, pp 17.
4. Ciuffo,L.E.C., Belli,M., Pasquale,A., Menegon,S., and Velasco,H.R,2002,: “Sci. Total Environ”, 295,pp 6980.
5. Davis,P.A., Avadhanula,M.R., Cancio,D., Carboneras,P., Coughtrey,P., and Johansson,G,1999,: “Journal of Environmental Radioactivity”, 42,pp 117130.
6. Harmanjit Singh, Joga Singh, Surinder Singh, and Bajwa,B.S,2008,: “Radiation Protection Dosimetry”, 130(2),pp 257263.

Studies on Radon in soil gas and Natural radionuclides in soil, rock and ground water samples around Mysore city
Shashikumar.T.S, Chandrashekara.M.S, Paramesh.L International Journal of Environmental Sciences Volume 1 No.5, 2011
797
7. IAEA.,1994,: “International Atomic Energy Agency”.IAEA/RCA.,1989,: “Regional Workshop on Environmental Sampling and Measurement of Radioactivity for Monitoring Purposes”, pp 8592.
8. ICRP.,1991,: “Pergamon, Publication 60”.Kendall,G.M., and Macpherson,A.J,2002,: “International Congress Series”, 1225,pp 301306.
9. Linsalata,P., Morse,R.S., Ford,H., and Eisenbud,M,1989,: “Health Physics”, 56(1),pp 3346.
10. Mayya,Y.S., Eappen,K.P., and Nambi,K.S.V,1998,: “Radiation Protection Dosimetry”, 77(3),pp 177184.
11. Raghavayya,M., Iyengar,M.A.R., and Markose,P.M,1980,: “Bulletin of Radiation protection”, 3(4),pp 1116.
12. Rahman,S., Matiullah,S.A., Mujahid, and Hussain,S,2008,: “Radiation Protection Dosimetry”, 128(2),pp 191197.
13. Seghour,A., and Seghour,F.Z,2009,: “Radiation Protection Dosimetry”, 133(1),pp 50 57.
14. Shashikumar,T.S., Ragini,N., Chandrashekara,M.S., and Paramesh,L,2008,: “Current Science”, 94(9),pp 11801185.
15. Sheppard,M.I., and Sheppard,S.C,1985,: “Health Physics”, 48, pp 494500.
16. Strain,C.D., and Watson,J.E,1979,: “Health Physics”, 37, pp 779783.
17. Surinder Singh, Ajay Kumar, and Baldev Singh,2005,: “Radiation Measurements”, 39,pp 8185.
18. UNSCEAR.,1988,: “Sources, Effects and Risks of ionizing radiation, Report to General Assembly, New York”.
19. UNSCEAR.,1993,: “Sources, Effects and Risks of Ionizing Radiation, Report to the General Assembly, New York”.
20. UNSCEAR.,2000,: “Sources and Effects of Ionizing Radiation, Report to the General Assembly, New York”.
21. Velasco,H., Juri Ayub,J., Belli,M., and Sansone,U, 2004,: “Journal of Environmental Radioactivity, 71,pp 225241.