radon chaotic regime in the atmosphere and soil
TRANSCRIPT
ISSN1330–0008
CODENFIZAE4
RADON CHAOTIC REGIME IN THE ATMOSPHERE AND SOIL
VANJA RADOLIC, BRANKO VUKOVIC, DENIS STANIC and JOSIP PLANINIC1
Department of Physics, University of Osijek, P.O. Box 144, 31000 Osijek, Croatia
Dedicated to the memory of Professor Vladimir Sips
Received 22 October 2004; Revised manuscript received 8 March 2005
Accepted 4 April 2005 Online 4 December 2005
Radon concentrations were continuously measured outdoors, in a basement andin soil. The readings were made every 10 minutes and the series of records wereanalyzed to extract phase-space dynamical information. The application of fractalmethods allowed exploration of the chaotic nature of radon in the atmosphere andsoil. The computed fractal dimensions, such as the Hurst exponent (H) from therescaled-range analysis, Lyapunov exponent (λ) and attractor dimension, providedestimates of the degree of chaotic behaviour. The obtained low values of the Hurstexponent (0 < H < 0.5) indicate anti-persistent behaviour (non-random changes)of the series, but the positive values of λ have pointed out a great sensitivity toinitial conditions and the deterministic chaos that appeared in the variations ofthe radon concentrations. The calculated fractal dimensions of attractors indicatestrong influence of meteorological parameters on radon in the atmosphere and soil.
PACS numbers: 87.52.-g, 92.30.Px, 05.45.Tp UDC 539.164
Keywords: radon concentration in atmosphere, deterministic chaos, fractal dimensions,
meteorological parameters
1. Introduction
Radon, 222Rn, is an inert radioactive gas emitted ubiquitously by soil. Theexhalation rate of radon depends on the concentration of its parent (226Ra) inthe Earth’s crust, on meteorological conditions and on properties of the soil, likeporosity and water content [1]. Radon concentration in the air is influenced byindoor and outdoor climatic variations, such as temperature, barometric pressure,ventilation and rain. Atmosphere can be considered as a complex and non-lineardynamical system whose variables can be subject to a chaotic regime.
1E-mail: [email protected] Fax: +385 31 212 514
FIZIKA A 14 (2005) 2, 195–206 195

radolic et al.: radon chaotic regime in the atmosphere and soil
To examine the dynamics of radon concentrations, it is necessary to continu-ously measure radon in the air over a period of time. The radon time series canbe analyzed to determine the degree of chaotic behaviour, to predict the varia-tions in the future using fractal methods and to investigate the correlations withmeteorological parameters by comparing some of the fractal dimensions [2].
Assuming a deterministic system, the causal relationship between the radonconcentration and a given controlling parameter may yield a correlation betweenradon concentrations measured in two adjacent time intervals, while no correlationexists in a purely stochastic system.
2. Methods
We applied fractal methods to the results of radon measurements using severalapproaches. To examine the fractal properties of 222Rn indoor and outdoor seriesof readings using the Hurst’s rescaled-range analysis, we calculated the Hurst ex-ponent, H, that is used to indicate whether a time series is random or successivesteps are not independent, and the Lyapunov exponent, λ, whose positive value canindicate a regime of deterministic chaos. Furthermore, we calculated the attractorfractal dimensions, such as capacity dimension (or box-counting dimension, Db),correlation dimension (Dc) and Lyapunov dimension (or Kaplan-Yorke dimension,DL) which is a non-integer or fractal dimension of attractor belonging to a chaoticbehaviour.
The rescaled-range analysis examines a time-dependent variable of a physicaldynamic system by studying its time series, average values over sampling intervals,accumulation of the differences between a value and the average, as well as thedifferences between the maximum and minimum of the accumulation, or the range.Fitting the logarithm of the relative range (the range divided by the standarddeviation) against the logarithm of time yields the slope that is the Hurst exponentH. The Hurst exponent lies in the region 0 to 1. If its value is close to 0.5, the timeseries indicates random walk, i.e., that successive steps are independent. When0.5 < H < 1, the recorded values show a persistent behaviour, i.e., the trendover the observed interval will continue. In that case, if the time series for sometime in the past had a positive increment, then on the average it will also showan increase in the future. Conversely, a decreasing trend in the past implies onthe average a continued decrease in the future. When H < 0.5, the time serieshas an anti-persistent behaviour, i.e., the observed trend will reverse. In that case,an increasing trend in the past implies a decreasing trend in the future, and adecreasing trend in the past indicates a probable increasing trend in the future [3].
To be precise, the above quantifications come from the correlation coefficient,ρ, of the successive increments in the following form: ρ = 22H−1 − 1. If H < 0.5,the correlation function is negative and we have anti-persistence. If H = 0.5, thereis no correlation and we have a random walk or an uncorrelated white noise. IfH > 0.5, a positive correlation is present and the respective time series exhibitspersistence. Since H is a statistical parameter, analysis of large sets of at least 2500observations is required.
196 FIZIKA A 14 (2005) 2, 195–206
radolic et al.: radon chaotic regime in the atmosphere and soil
The Lyapunov exponent, λ, is a measure of the rate at which nearby trajectoriesin phase space diverge. If two nearby trajectories start off with a separation d0 attime t = 0, then the trajectories diverge so that their separation at time t, d(t),satisfies the expression: d(t) = d0e
λt (as a matter of fact, the value of λ is calculatedas the limes of logarithms, or by a computer program). If λ is positive, then we saythe behaviour is chaotic [4]. Generally, there are as many Lyapunov exponents asthere are dynamical equations. For periodic trajectories, all Lyapunov exponentsare negative. The larger is the positive exponent, the more chaotic is the system.i.e., the shorter is the time scale of the system’s predictability. The sum of positiveLyapunov exponents is called entropy; its reciprocal is roughly the time over whicha meaningful prediction is possible.
A second method of quantifying chaos is focusing on the geometrical aspectsof the attractors; if the attractor has an non-integer or fractal dimension, the dy-namical system has characteristics of a chaotic regime. The dimensionality is alsoimportant in determining the range of possible dynamical behaviour, namely, thedimensionality of the attractor, D, must be less than that of d of the full phasespace; d is given by the minimum number of variables needed to describe the stateof the system.
The embedding-space method allows extracting a multi-dimensional descriptionof the phase-space dynamics from the time series data of a single dynamical variable.If the embedding space is generated properly, the behaviour of trajectories in thisembedding space will have the same geometrical and dynamical properties thatcharacterize the actual trajectories in the full multi-dimensional phase space ofthe system. The embedding procedure uses a recorded series of values X for somedynamical system and forms the series of values X1, X2, ...,Xd, so the embeddingdimension, d, is the dimension of the embedding space [4].
A way of determining the embedding dimension is given by the false-nearest-neighbors (FNN) method which chooses the minimum embedding dimension of aone-dimensional time series. This method finds the nearest neighbor of every pointin a given dimension, then checks whether these points are still close neighbors inthe next higher dimension. The percentage of FNN should drop to a minimum, orzero, when the appropriate embedding dimension has been reached.
According the Takens theorem, d is a little larger than 2D, 2D < d < 2D + 1.
What we do in practice is to compute D (e.g. the so-called correlation dimension,Dc) for d = 1, 2, 3, . . . and plot the values of D as a function of d. We expect D tovary with d until d is equal to or becomes greater than about twice the dimensionof the phase space attractor for the system. So we get the value of d; the knownvalue of d tells us about a number of physical variables of the dynamical system(though we have only observed the time series of one variable).
Among many different definitions of dimensionality of an attractor, we use thetree ones and we try to compare them, and find out how close are their numericalvalues.
The capacity dimension of a geometrical object is determined as follows: Db =−limR→0(log N/ log R), where N is the number of boxes needed to contain all points
FIZIKA A 14 (2005) 2, 195–206 197
radolic et al.: radon chaotic regime in the atmosphere and soil
of the geometric object, and R is the side length of the box (e.g., for a point, thegeometrical object in two-dimensional space, the box, is just a square of side R;N = 1, Db = 0).
The correlation dimension is determined as follows: Dc = −limR→0(log C/ log r),where C is the probability of finding two points in the same sphere of radius r (theprobability is determined using the number of points in the sphere).
The Lyapunov dimension, DL, can be determined from the calculated Lyapunovexponents, λi (the number of Lyapunov exponents corresponds to the dimensionof the phase space), in the following way: DL = p + (1/|λp+1|)
∑p
i=1λi, where p
is the largest integer number according the expression,∑p
i=1λi ≥ 0, λ1 > λ2 >
λ3 > . . . λn.
It can be shown that Dc ≤ DL ≤ Db ≤ d [5,4].
In calculating the described fractal dimensions, we used the programs of theChaos Data Analyzer (CDA) for calculating H, λ, Db and Dc, Dataplore (DP) forcalculating DL and Visual Recurrence Analysis (VRA) for calculating d [6].
3. Experiments, results and discussion
Radon concentrations were measured with an Alpha Guard PQ 2000 detector(Genitron Instrument, Germany), outdoors (O), indoors (I) and in the soil (S) at alocation in Valpovo (a town near Osijek). The sites O and S were positioned outsidein the garden, 1 m above the ground and 0.8 m deep in the soil, respectively, whilethe site I was in a closed basement room of a single house. Simultaneously, theatmospheric temperature and pressure were measured.
Considerable difficulties were encountered in the radon measurements in the soil;the Alpha Guard measuring procedure, according to the instructions, envisages theburying of a narrow tube into the soil and pumping of the soil gas into the ionizationchamber in order to measure the radon concentration. However, the soil materialat the point of measurement was rather compact and because of the very lowpermeability, it was not possible to pump the soil gas into the measuring chamber.Therefore, we secured a cylinder-shaped hole of a diameter of 0.3 m and 0.2 m deepfrom which the soil gas was pumped through a tube.
At each site, the Alpha Guard detector was set to authomatically read and makea record of the number of counts every 10 minutes. Many readings of the radonconcentration were carried out: in June (site O; 2835 readings), in July (site I; 3679)and in September (site S; 2967), in the year 2004. The mean radon concentrationsof 16.4 Bq/m3, 66.7 Bq/m3 and 25.01 kBq/m3, with the standard deviations of11.9 Bq/m3, 36.1 Bq/m3 and 3.13 kBq/m3, respectively, were obtained.
The time variations of the radon concentration in the soil (site S) and thebarometric pressure, are presented in Fig. 1. In addition to the daily periodicity ofthe radon concentration, that can also be observed in variations of the barometricpressure, one can see irregularities in the radon concentration visible as large peaksand deep valleys. We examined whether the radon concentrations are chaotic, ortheir changes are random and they behave as a noise.
198 FIZIKA A 14 (2005) 2, 195–206

radolic et al.: radon chaotic regime in the atmosphere and soil
Fig. 1. Variation of the radon concentration in the soil versus the number of 10 minintervals (a), as well as variations of the barometric pressure (b).
A particular radon signal appeared around the 2500th reading at the site S thatwe previously interpreted as a radon anomaly when searching for earthquake pre-cursors [7]. The interpretation of radon anomalies as precursors of seismic activityhas some uncertainties. One of them is that the time variation of radon concentra-tion can give false signals due to the deterministic chaos [8]. So, we undertook thetask to examine the origin of the registered radon signal.
The radon signal, after the peak of 33.53 kBq/m3, had a minimum that typicallycorresponded to the shape of a radon anomaly preceding an earthquake coming inabout three weeks. The maximum reading of radon concentration shows a deviationfrom the mean value of more than two standard deviations [(33.53−25.01) kBq/m3
= 8.52 kBq/m3, while two standard deviations amount to 2×3.13 kBq/m3 = 6.26kBq/m3)] [7].
Studies of the radon concentration in soil have shown a barometric effect.Namely, a negative correlation between the radon concentration in the soil andthe barometric pressure has been found. They may be seen as changes of the radonconcentration and atmospheric pressure presented in Figs. 1a and 1b about the2500th reading. The decrease in barometric pressure corresponds to an increase inthe radon concentration, and conversely [7].
FIZIKA A 14 (2005) 2, 195–206 199
radolic et al.: radon chaotic regime in the atmosphere and soil
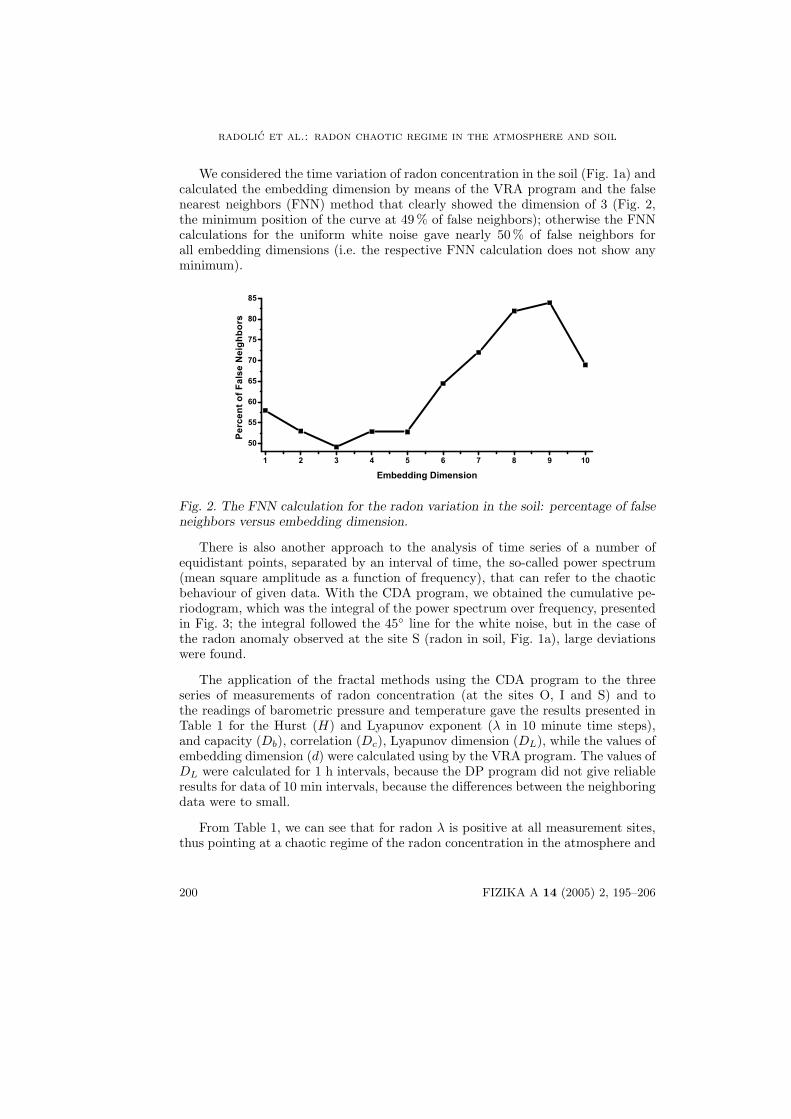
We considered the time variation of radon concentration in the soil (Fig. 1a) andcalculated the embedding dimension by means of the VRA program and the falsenearest neighbors (FNN) method that clearly showed the dimension of 3 (Fig. 2,the minimum position of the curve at 49 % of false neighbors); otherwise the FNNcalculations for the uniform white noise gave nearly 50 % of false neighbors forall embedding dimensions (i.e. the respective FNN calculation does not show anyminimum).
1 2 3 4 5 6 7 8 9 10
50
55
60
65
70
75
80
85
Pe
rcen
t of F
alse
Nei
ghbo
rs
Embedding Dimension
Fig. 2. The FNN calculation for the radon variation in the soil: percentage of falseneighbors versus embedding dimension.
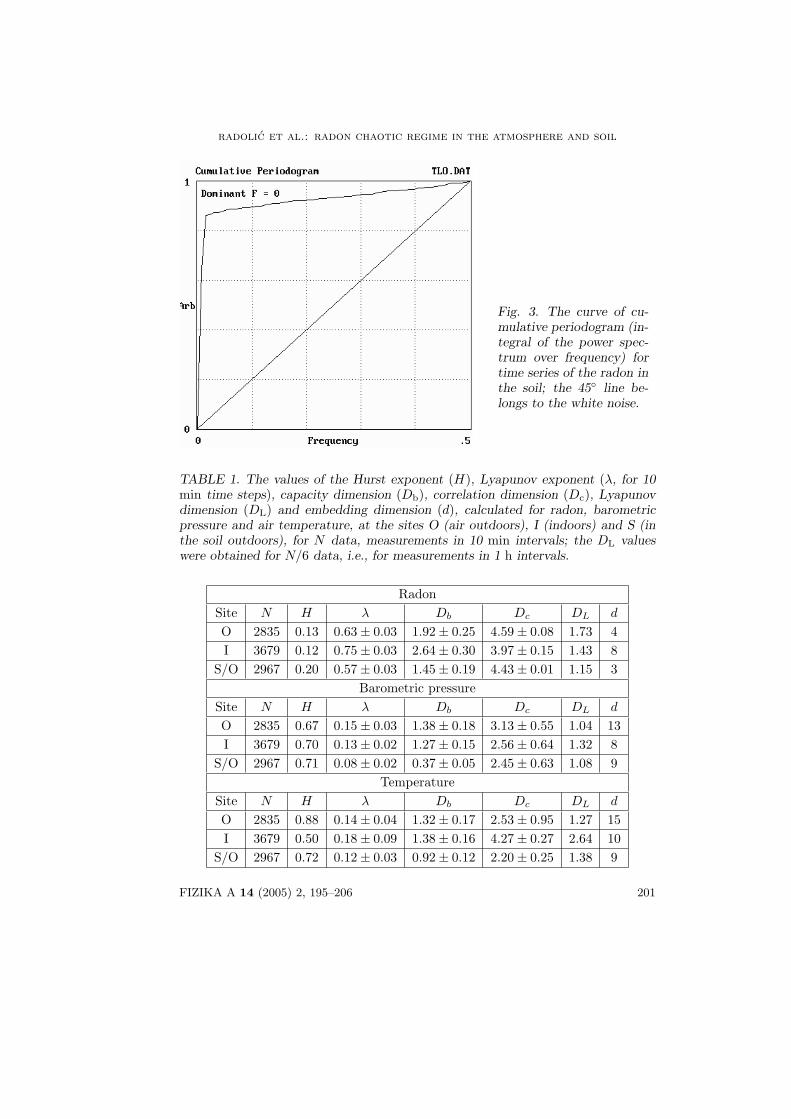
There is also another approach to the analysis of time series of a number ofequidistant points, separated by an interval of time, the so-called power spectrum(mean square amplitude as a function of frequency), that can refer to the chaoticbehaviour of given data. With the CDA program, we obtained the cumulative pe-riodogram, which was the integral of the power spectrum over frequency, presentedin Fig. 3; the integral followed the 45◦ line for the white noise, but in the case ofthe radon anomaly observed at the site S (radon in soil, Fig. 1a), large deviationswere found.
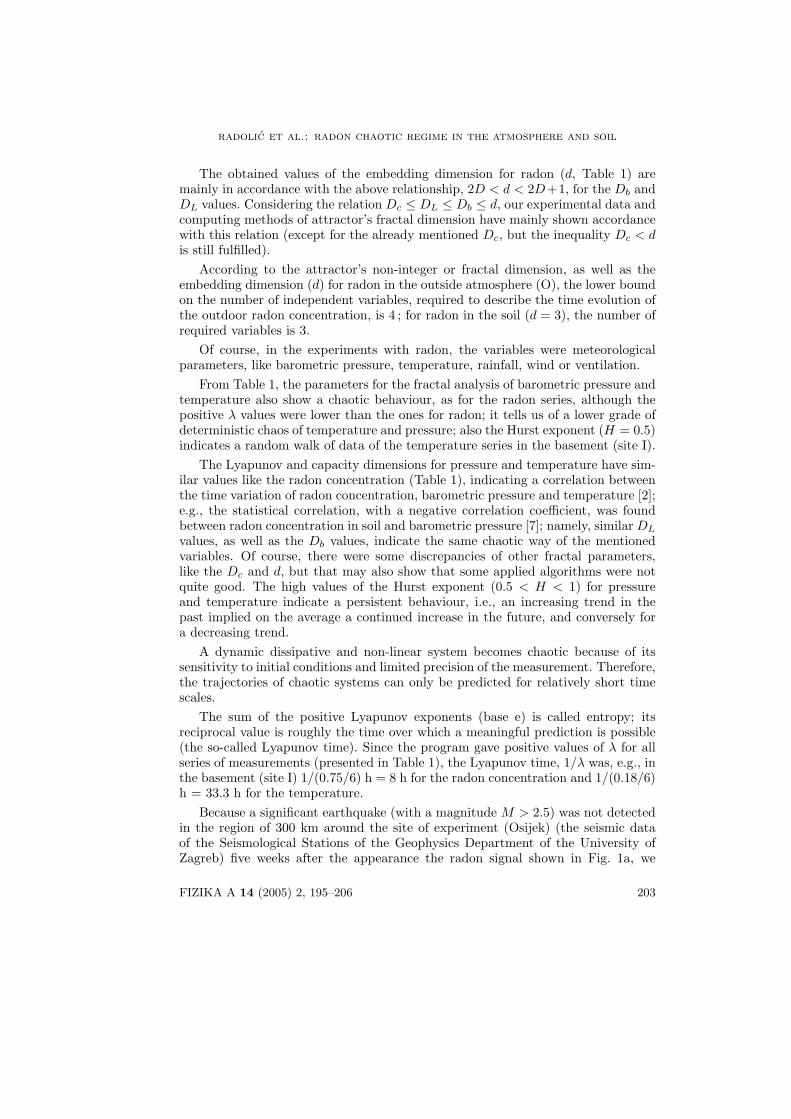
The application of the fractal methods using the CDA program to the threeseries of measurements of radon concentration (at the sites O, I and S) and tothe readings of barometric pressure and temperature gave the results presented inTable 1 for the Hurst (H) and Lyapunov exponent (λ in 10 minute time steps),and capacity (Db), correlation (Dc), Lyapunov dimension (DL), while the values ofembedding dimension (d) were calculated using by the VRA program. The values ofDL were calculated for 1 h intervals, because the DP program did not give reliableresults for data of 10 min intervals, because the differences between the neighboringdata were to small.
From Table 1, we can see that for radon λ is positive at all measurement sites,thus pointing at a chaotic regime of the radon concentration in the atmosphere and
200 FIZIKA A 14 (2005) 2, 195–206
radolic et al.: radon chaotic regime in the atmosphere and soil
Fig. 3. The curve of cu-mulative periodogram (in-tegral of the power spec-trum over frequency) fortime series of the radon inthe soil; the 45◦ line be-longs to the white noise.
TABLE 1. The values of the Hurst exponent (H), Lyapunov exponent (λ, for 10min time steps), capacity dimension (Db), correlation dimension (Dc), Lyapunovdimension (DL) and embedding dimension (d), calculated for radon, barometricpressure and air temperature, at the sites O (air outdoors), I (indoors) and S (inthe soil outdoors), for N data, measurements in 10 min intervals; the DL valueswere obtained for N/6 data, i.e., for measurements in 1 h intervals.
Radon
Site N H λ Db Dc DL d
O 2835 0.13 0.63 ± 0.03 1.92 ± 0.25 4.59 ± 0.08 1.73 4
I 3679 0.12 0.75 ± 0.03 2.64 ± 0.30 3.97 ± 0.15 1.43 8
S/O 2967 0.20 0.57 ± 0.03 1.45 ± 0.19 4.43 ± 0.01 1.15 3
Barometric pressure
Site N H λ Db Dc DL d
O 2835 0.67 0.15 ± 0.03 1.38 ± 0.18 3.13 ± 0.55 1.04 13
I 3679 0.70 0.13 ± 0.02 1.27 ± 0.15 2.56 ± 0.64 1.32 8
S/O 2967 0.71 0.08 ± 0.02 0.37 ± 0.05 2.45 ± 0.63 1.08 9
Temperature
Site N H λ Db Dc DL d
O 2835 0.88 0.14 ± 0.04 1.32 ± 0.17 2.53 ± 0.95 1.27 15
I 3679 0.50 0.18 ± 0.09 1.38 ± 0.16 4.27 ± 0.27 2.64 10
S/O 2967 0.72 0.12 ± 0.03 0.92 ± 0.12 2.20 ± 0.25 1.38 9
FIZIKA A 14 (2005) 2, 195–206 201

radolic et al.: radon chaotic regime in the atmosphere and soil
soil gas, though with a slightly lower grade of the deterministic chaos in the soil;that was expected considering the influence of meteorological parameters on theradon in the atmosphere. The Lyapunov exponent of radon was a little higherindoors than outdoors, what suggests that the atmosphere was less stable in Julythan in June (during the radon measurement at the site O); that indicate also thestandard deviations of the barometric pressure: 2.7 mbar (about the mean of 1005.2mbar) and 3.4 mbar (about the mean of 1004.5 mbar) for the sites O (June) and I(July), respectively.
The Hurst exponent for radon was small and less than 0.5, indicating anti-persistent behaviour, i.e. an increasing trend in the past implied a probable de-creasing trend in the future, and conversely (Fig. 4). Different values of the Hurstexponent for radon (H < 0.5) were obtained by Paush et al. [2], Bossew and Lettner(H > 0.5) [9] and by Bejar et al. (H > 0.5) [8].
Fig. 4. The calculated values of the Hurst exponent for the time series of radon inthe soil.
When H is determined, one can calculate an attractor’s fractal dimension fromD = 2H. If we assume the values of H were correctly obtained, then the calculatedvalues of Db and DL dimensions for the outdoor radon, site O, and soil radon, site S,nearly satisfy the quoted equation. The Db value for radon at the site I (2.64) is alsofractal and low-dimensional, what is in accordance with the known investigationof the atmosphere, which was chaotic within a shallow layer of a few meters abovethe ground [1]. Similarly, one can comment the low-dimensional values of DL forradon, while the Dc values are rather high and we did not consider them (they werenot in accordance with the above mentioned low-dimensional values).
202 FIZIKA A 14 (2005) 2, 195–206
radolic et al.: radon chaotic regime in the atmosphere and soil
The obtained values of the embedding dimension for radon (d, Table 1) aremainly in accordance with the above relationship, 2D < d < 2D+1, for the Db andDL values. Considering the relation Dc ≤ DL ≤ Db ≤ d, our experimental data andcomputing methods of attractor’s fractal dimension have mainly shown accordancewith this relation (except for the already mentioned Dc, but the inequality Dc < dis still fulfilled).
According to the attractor’s non-integer or fractal dimension, as well as theembedding dimension (d) for radon in the outside atmosphere (O), the lower boundon the number of independent variables, required to describe the time evolution ofthe outdoor radon concentration, is 4 ; for radon in the soil (d = 3), the number ofrequired variables is 3.
Of course, in the experiments with radon, the variables were meteorologicalparameters, like barometric pressure, temperature, rainfall, wind or ventilation.
From Table 1, the parameters for the fractal analysis of barometric pressure andtemperature also show a chaotic behaviour, as for the radon series, although thepositive λ values were lower than the ones for radon; it tells us of a lower grade ofdeterministic chaos of temperature and pressure; also the Hurst exponent (H = 0.5)indicates a random walk of data of the temperature series in the basement (site I).
The Lyapunov and capacity dimensions for pressure and temperature have sim-ilar values like the radon concentration (Table 1), indicating a correlation betweenthe time variation of radon concentration, barometric pressure and temperature [2];e.g., the statistical correlation, with a negative correlation coefficient, was foundbetween radon concentration in soil and barometric pressure [7]; namely, similar DL
values, as well as the Db values, indicate the same chaotic way of the mentionedvariables. Of course, there were some discrepancies of other fractal parameters,like the Dc and d, but that may also show that some applied algorithms were notquite good. The high values of the Hurst exponent (0.5 < H < 1) for pressureand temperature indicate a persistent behaviour, i.e., an increasing trend in thepast implied on the average a continued increase in the future, and conversely fora decreasing trend.
A dynamic dissipative and non-linear system becomes chaotic because of itssensitivity to initial conditions and limited precision of the measurement. Therefore,the trajectories of chaotic systems can only be predicted for relatively short timescales.
The sum of the positive Lyapunov exponents (base e) is called entropy; itsreciprocal value is roughly the time over which a meaningful prediction is possible(the so-called Lyapunov time). Since the program gave positive values of λ for allseries of measurements (presented in Table 1), the Lyapunov time, 1/λ was, e.g., inthe basement (site I) 1/(0.75/6) h = 8 h for the radon concentration and 1/(0.18/6)h = 33.3 h for the temperature.
Because a significant earthquake (with a magnitude M > 2.5) was not detectedin the region of 300 km around the site of experiment (Osijek) (the seismic dataof the Seismological Stations of the Geophysics Department of the University ofZagreb) five weeks after the appearance the radon signal shown in Fig. 1a, we
FIZIKA A 14 (2005) 2, 195–206 203

radolic et al.: radon chaotic regime in the atmosphere and soil
concluded that the radon signal observed in the soil was not related to a tectonicactivity. Hence, the chaotic regime of the radon time variation and the changes ofbarometric pressure (the barometric effect) could be possible causes of the radonsignal.
Another our measurement with the Barasol device (radon silicon detector, madeby Algade, France) was running at the same soil site (S) and the same time withthe Alpha Guard detector. The radon time variation, registered by the Barasol,also showed a radon signal at the 2500th reading, and we concluded that the originof the radon signal was the large change of barometric pressure. Namely, it isimprobable that the radon signal, caused by the deterministic chaos, appeared intwo independent devices at the same time.
4. Conclusion
The application of the fractal methods to three radon series of measurements(outdoors, indoors and in the soil), and to the barometric pressure and temperatureyielded the values of the Hurst (H) and Lyapunov exponent (λ), and of the capacity(Db), correlation (Dc), Lyapunov (DL) and embedding dimension (d).
The positive values of λ for all series of measurements of radon concentration,barometric pressure and temperature indicated their chaotic behaviour. The radonmeasurements showed higher values of λ (and higher grade of deterministic chaos)than the measurements of pressure and temperature. The Hurst exponent (H = 0.5)indicates random walk of data of the temperature time series in the basement (siteI), what indicates the absence of deterministic chaos.
The Hurst exponent for radon is small and less than 0.5, indicating anti-persistent behaviour, i.e. an increasing trend in the past implied a probable de-creasing trend in the future, and conversely; this behaviour was most expressed forthe indoor radon, that had the smallest value of H (0.12). On the other hand, thehigh values of the Hurst exponent (0.5 < H < 1) for pressure and temperatureindicated persistent behaviour, i.e., an increasing trend in the past implied on theaverage a continued increase in the future, and conversely for decreasing trend.
According to the attractor’s non-integer or fractal dimension and the embeddingdimension (d) for radon in the outside atmosphere (O), the lower bound on thenumber of independent variables required to describe the time evolution of theoutdoor radon concentration is 4 ; for radon in the soil (d = 3), the number ofrequired variables is 3.
Simultaneously with the measurements of radon concentration, the meteorolog-ical parameters barometric pressure, temperature, rainfall, wind and ventilationwere also recorded.
The Lyapunov and capacity dimensions of pressure and temperature had similarvalues as for the radon concentration, indicating a multiple correlation betweenthe time variation of radon, barometric pressure and temperature; namely, similarvalues of DL and Db indicate the same chaotic behaviour.
204 FIZIKA A 14 (2005) 2, 195–206
radolic et al.: radon chaotic regime in the atmosphere and soil
The Lyapunov time, for which a meaningful prediction was possible only in thebasement, was 8 h and 33.3 h for the series of radon measurements and temperature,respectively.
The particular radon signal in the soil, that appeared about the 2500th reading,is explained as an effect of changes of the barometric pressure.
Acknowledgements
This work was supported by Croatian Ministry of Science.
References
[1] V. Cuculeanu and A. Lupu, J. Geophys. Res. 106 (2001) 17, 961.
[2] G. Pausch, P. Bossew and W. Hofmann, Proc. of the Workshop Radon in the LivingEnvironment, Athens (1999) 37.
[3] V. Cuculeanu and A. Lupu, Environmental International 8 (1996) 171.
[4] R. Hilborn, Chaos and Nonlinear Dynamics, Oxford University Press, Oxford (1994).
[5] C. Goltz, Fractal and Chaotic Properties of Earthquakes, Springer, Berlin (1997).
[6] Internet: http://sprott.physics.wisc.edu/cda.htm; http://www.datan.de/dataplore;http://pw1.netcom.com/-eugenek.
[7] J. Planinic, V. Radolic and B. Vukovic, Nucl. Instr. Meth. A 530 (2004) 568.
[8] J. Bejar, U. Facchini, E. Giroletti and S. Magnoni, J. Environ. Radioactivity 28 (1995)73.
[9] P. Bossew and H. Lettner, Statistical Analysis of Radon Data (in German). Projectreport to the Ministry of Social Affairs, University of Salzburg, Salzburg (2002).
FIZIKA A 14 (2005) 2, 195–206 205

radolic et al.: radon chaotic regime in the atmosphere and soil
KAOTICNI REZIM ZA RADON U ATMOSFERI I TLU
Mjerili smo koncentracije radona u otvorenoj atmosferi, u podrumu i u tlu,neprekidno tijekom mjesec dana u 10-minutnim intervalima. Radonske vremenskenizove analizirali smo usporedbom algoritama kako bi se dobile dinamicke infor-macije o faznom prostoru. Primjena fraktalnih metoda omogucila je ispitivanjekaoticne prirode radona u atmosferi i tlu. Izracunate fraktalne dimenzije, kaosto su Hurstov eksponent (H), Ljapunovljev eksponent (λ) i dimenzija atraktora,omogucile su procjenu stupnja kaoticnosti. Dobivene niske vrijednosti Hurstovogeksponenta (0 < H < 0, 5) ukazale su na antiperzistentno ponasanje vremenskihnizova (nenasumicnost promjena), dok su pozitivne vrijednosti pokazale veliku os-jetljivost na pocetne uvjete i ukazale na deterministicki kaos koji se pojavljuje uvremenskim varijacijama radona. Izracunate fraktalne dimenzije atraktora ukazalesu na vise (meteoroloskih) parametara koji su utjecali na razine radona u atmosferii u zemnom plinu.
206 FIZIKA A 14 (2005) 2, 195–206