shedding light on animal-generated flows: quantitative
TRANSCRIPT
Shedding light on animal-generated flows: quantitativeanalysis of animal-generated flow patterns using DPIV
E.J. StamhuisDepartment of Marine Biology, University of Groningen, The Netherlands.
Abstract
Quantitative analysis of animal-generated flow patterns has a number of advantages: flowphenomena can be described in a quantitative way, underlying principles can be recognized, forcesand momentum transfer can be estimated, and mechanical energy dissipation can sometimes bederived. Furthermore, example flow phenomena may lead us to application of its principles intechnology. Early particle image velocimetry (PIV) with photographic development and filmscanning lacked the necessary time resolution and appeared too time consuming for applicationto animal-generated flows. These flow patterns are often unpredictable and hardly ever repeat-able, especially in free-swimming animals. PIV image recording and evaluation, therefore, hasto be fast and easy. In our institute we developed digital PIV (DPIV) for application to animal-generated flows in the early 1990s, when aeronautical institutes were also moving towards digitalPIV. It demanded accommodations on almost all aspects of the PIV process: the general set-up,the external flow conditions, the particle seeding, the illumination, the image recording and stor-age system, the image analysis step, the data validation, and the result interpretation. Here, theseelements of performing DPIV with animals are evaluated and where necessary further readingis provided. Some elements of the process of DPIV with regard to animals are illustrated withexamples on insect and bird flight, copepod feeding currents, acorn barnacle filter feeding andfrog swimming.
1 Introduction
Digital particle image velocimetry (DPIV) has been used as a tool to map animal-generatedflows since 1993. The particle image velocimetry (PIV) methodology itself has been developedfrom the 1980s onwards, mainly in the engineering and fundamental fluid dynamics researchenvironment to map 2D flow maps instantaneously [1]. Early PIV analyses involved the use ofintricate optical set-ups to scan photographically recorded double-exposed images [2]. The useof electronic cameras (CCD or CMOS) and digital image processing simplified and speeded up
www.witpress.com, ISSN 1755-8336 (on-line)
© 2006 WIT PressWIT Transactions on State of the Art in Science and Engineering, Vol 4,
doi:10.2495/1-84564-095-0/7d

736 Flow Phenomena in Nature
the analysis process to such an extent [3] that this powerful flow mapping method came withinreach of a wider range of potential users, such as biologists. In biological studies, DPIV wasfirst applied to the ventilation currents of tube-living shrimps, swimming currents of tiny waterflea-like crustaceans (copepods) and juvenile fish with an undulatory swimming style [4]. Fromthen onwards, a large number of PIV studies involving biota has been conducted, including awhole size range of free-swimming animals. At the low end of the Re scale are the swimmingof copepod larvae (Re < 0.1) and escape jumps of copepod larvae and adults (Re ≈ 100) [5, 6],burst swimming of larval and juvenile zebra danios at Re between 400 and 3000 [7], continuousundulatory swimming of juvenile eels and mullets at Re ≈ 30,000 [8, 9], and cruising in mackerelsand trouts at Re ≈ 125,000 [10, 11] and other large fish species [12]. Apart from these freelyswimming animals, a number of other animal-generated flow phenomena have been studiedusing DPIV [13]. This illustrates that DPIV studies of animal-generated flows are not necessarilydifficult. There are, however, a number of experimental conditions that are critical when workingwith live organisms, animals in particular. Before we can discuss these constraints, we will firstsee what a DPIV experiment in general looks like. Then the different parts of the DPIV set-up andthe different stages of a DPIV experiment involving animals, and the subsequent analysis, willbe discussed. This paper is, however, not intended to give a full overview of the DPIV techniqueitself with only some minor remarks on the application to animal-generated flow. The basics andprinciples of (D)PIV for application in technology and in biology are covered more extensivelyelsewhere [3, 4, 14–16]. Here we concentrate on the specific accommodations necessary to performDPIV with live animals, in addition to previous publications. In a number of subjects covered here,background information or reference to the literature will be given to enable proper interpretationor adjustments in the methodology necessary when working with animals. When necessary andpossible, the methodological accommodations will be illustrated with examples.
2 DPIV set-up for recording biogenic flows
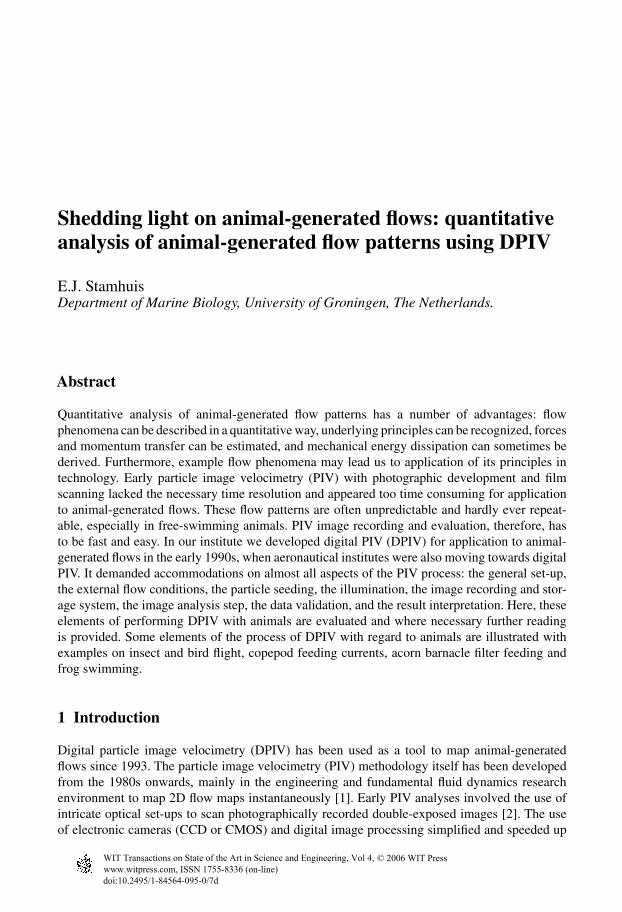
The main components of a DPIV set-up are a particle seeded flow, an illumination system usuallyproviding a sheet of light, a digital camera, a digital image recording system, DPIV analysis soft-ware running on a (personal) computer system and post-processing software to derive informationon velocity gradients. The general layout is depicted in Fig. 1.
When studying the process from fluid movement induced by, for example, a swimming animalto a representation of the final flow field, the following subjects have to be evaluated or optimizedfor successful DPIV analysis: choice of medium and flow conditions, particle seeding, illumi-nation, camera and storage system, PIV analysis, data validation and presentation, and resultinterpretation. These topics are discussed below in detail with emphasis on accommodations dueto the biota.
2.1 Choice of medium and flow conditions
The choice of the medium is often predetermined by the animal that is studied. Fresh-water ormarine animals are studied in water, whereas terrestrial or aerial animals or structures are stud-ied in air. In some cases, however, one may decide to exchange the animal or specific structurefor a physical model. This enables experiments at another scale and velocity and with preciseknowledge of the input from the ‘animal’ or ‘animal structure’. It also allows for a different,experimentally more convenient medium to perform the experiments in. DPIV experiments inlow-speed airflows or in still air are quite difficult to conduct due to the differences in the densities
www.witpress.com, ISSN 1755-8336 (on-line)
© 2006 WIT PressWIT Transactions on State of the Art in Science and Engineering, Vol 4,
Shedding Light on Animal-Generated Flows 737
Figure 1: General layout of a DPIV system showing an experimental tank with particle-seededwater, a light sheet provided by a laser with sheet optics to transform the laser beaminto a sheet, a digital camera, and an integrated image acquisition and PIV processingcomputer system.
of the seeding material and air, usually causing the particles to sink to the floor. A number of DPIVstudies of, for example, insect and bird flight have therefore been conducted in water or in moreviscous media such as mineral oil.
Three examples of DPIV of flying animals may illustrate the choice of medium and flowconditions:
1. Most experimental DPIV work on the fluid dynamics of the fruit fly Drosophila melanogasterby Dickinson and co-workers has been conducted by having a robot with a pair of fly wingsmove through mineral oil in a transparent tank [17, 18]. The robot had much larger wings andmoved slower than the original fly, but by matching the Reynolds numbers, the physics andflow patterns are comparable and the DPIV results gave great new insight in the principlesof (small) insect flight.
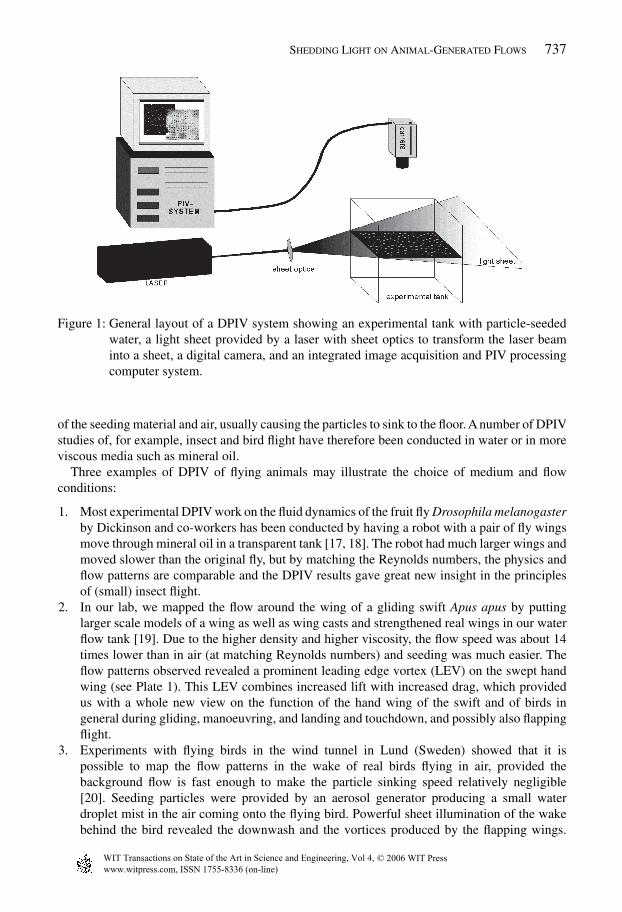
2. In our lab, we mapped the flow around the wing of a gliding swift Apus apus by puttinglarger scale models of a wing as well as wing casts and strengthened real wings in our waterflow tank [19]. Due to the higher density and higher viscosity, the flow speed was about 14times lower than in air (at matching Reynolds numbers) and seeding was much easier. Theflow patterns observed revealed a prominent leading edge vortex (LEV) on the swept handwing (see Plate 1). This LEV combines increased lift with increased drag, which providedus with a whole new view on the function of the hand wing of the swift and of birds ingeneral during gliding, manoeuvring, and landing and touchdown, and possibly also flappingflight.
3. Experiments with flying birds in the wind tunnel in Lund (Sweden) showed that it ispossible to map the flow patterns in the wake of real birds flying in air, provided thebackground flow is fast enough to make the particle sinking speed relatively negligible[20]. Seeding particles were provided by an aerosol generator producing a small waterdroplet mist in the air coming onto the flying bird. Powerful sheet illumination of the wakebehind the bird revealed the downwash and the vortices produced by the flapping wings.
www.witpress.com, ISSN 1755-8336 (on-line)
© 2006 WIT PressWIT Transactions on State of the Art in Science and Engineering, Vol 4,
738 Flow Phenomena in Nature
Plate 1: The leading edge vortex on the hand wing of the swift (Apus apus) in cross-section, seenfrom behind (caudal). Arrows indicate transversal flow velocity, colour indicates vorticity(blue = maximum left-turning, red = maximum right-turning is close to neutral here),white outline = right wing with tip on the right pointing towards the reader, shaded = partof wing illuminated by thickened laser sheet, parallel to the plane of view. For more detailssee [19].
These results partly confirmed and partly changed existing ideas on flapping flight and wakegeneration in birds [21, 22], and for the first time the thrust could be estimated for a flying birdfrom the spatial integration of the vorticity maps to derive circulation and vortex ringmomentum.
Regarding the flow condition in the experimental tank or vessel, a few choices have to be madethat may make quite a difference to the experimental animals. The first one is if the experimentsare to be conducted in a still standing medium (e.g. an aquarium) or in a flowing medium (e.g.a flow tank or wind tunnel). Often, experimental animals are more likely to display their naturalbehaviour in a safe environment that is usually standing still. The experimenter will, however,be completely left to the mercy of the animal that may or may not display its natural behaviour,or may display it only in a moderated fashion. A flow tank or other circumstances that force theanimal into motion may then be the solution, but it will add stress to the animal. An importantquestion is if this added stress affects the behaviour to be studied, which may be checked byperforming kinematical control experiments.
2.2 Particle seeding
The fluid has to be seeded with particles to be able to record particle images. The kind of particlesdepends not only on the medium density with respect to the material density of the particles andthe flow conditions but also on the scale or magnification that is used. Above all, the particlesshould be highly reflective and small enough to follow the flow phenomena accurately [16].
www.witpress.com, ISSN 1755-8336 (on-line)
© 2006 WIT PressWIT Transactions on State of the Art in Science and Engineering, Vol 4,
Shedding Light on Animal-Generated Flows 739
Still-air and low-speed airflows are difficult to seed because particles tend to sink rapidly. Verylight particles such as tiny polystyrene (expanded) beads may work but they may also pose a threatto the respiration system of the experimenter and experimental animals. Alternatively, chopped-up fluff from biological wind-spreading seeds may be suitable as airflow seeding material. Forexample, the mature cigar-shaped seed packets from the great reedmace Typha latifolia exist foralmost 100% of compacted very light seed fluff that seems to perform well as airflow seedingwhen separated from the seeds by grinding and sieving (personal observation). However, no onehas tried this in a full PIV experiment so far.
Medium to high speed airflows can be seeded with liquid droplets through an aerosol generator.Water or vegetable oil are commonly used for this purpose. Oil aerosols are much more stablethan water because the oil droplets hardly evaporate and stay around for quite some time and aretherefore preferred when working with models [16]. Sometimes water is preferred above oil toprevent unnatural pollution of the experimental animal, as in the case of the thrush nightingaleflying in the Lund wind tunnel [20].
For PIV studies in a fluid medium, usually water, a range of seeding particles with materialdensities around 1 and at a range of diameters is available. Companies that sell complete DPIVsystems (e.g. TSI, Dantec or LaVision) provide these at narrow size ranges.Alternatively, they canbe found in larger amounts and usually at much lower prices by purchasing polymer granulate half-products from a chemical company (e.g. Goodyear, Dow, BASF or DuPont). Available materialswith the right density are polystyrene (unexpanded), PVC, and Nylon. Small hollow glass spheres(Ø = 10 − 100µm) (e.g. Nortek, Potters Industries), sometimes provided with a reflective coating,also perform well [23]. Particles for use in water are available in sizes from 5 to 200µm, butthe size range between 10 and 25 µm are most preferred. The appropriate size for an experimentdepends on the scale of the flow phenomena and the magnification of the camera [13].
An important point for the choice of particles when working with live animals is that neitherthe particles themselves nor the carrier fluid should be toxic, or affect the animals, e.g. due tosmell. Furthermore, they should not clog the animal’s respiratory structures and cause the animalto suffocate.
2.3 Illumination
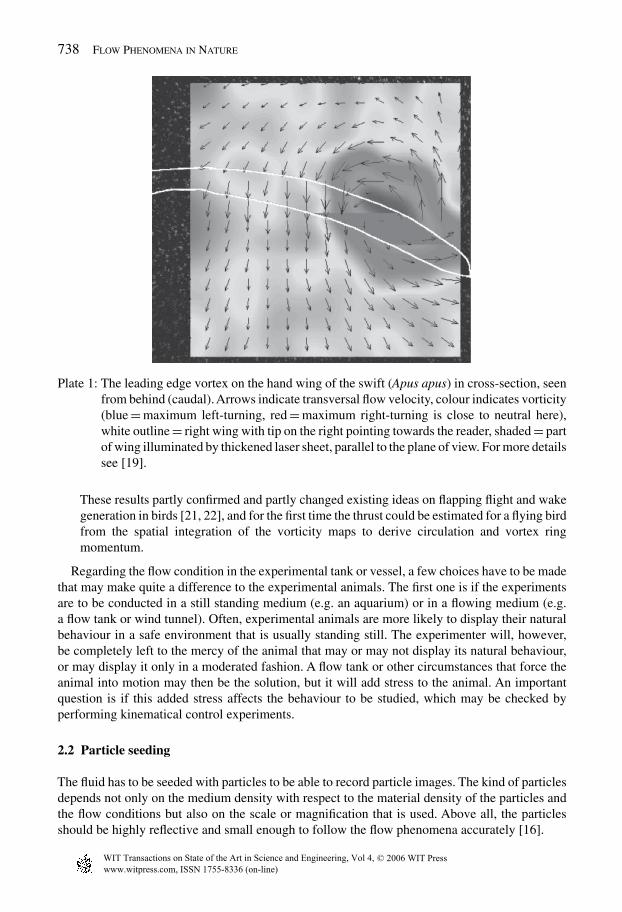
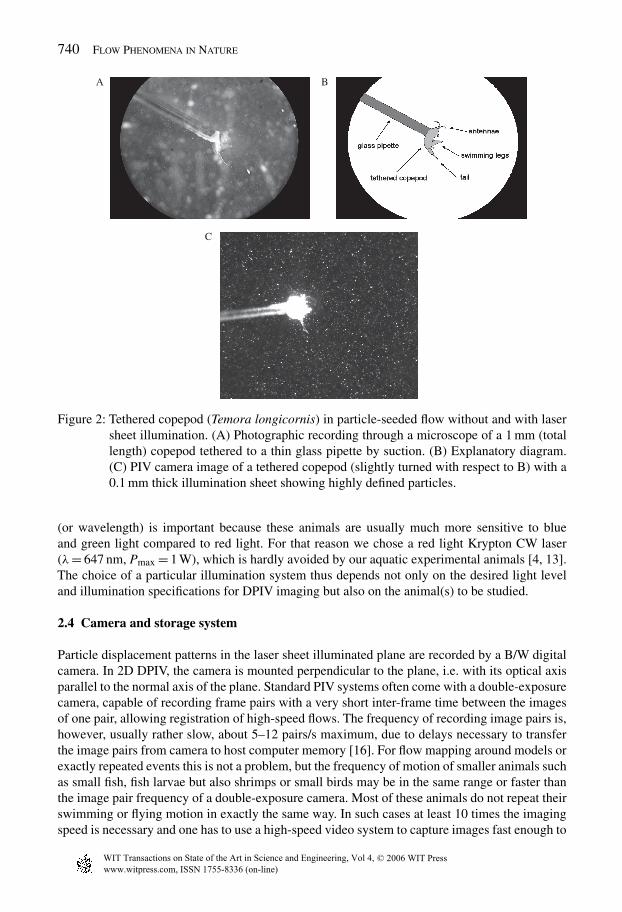
The particle-seeded flow is illuminated with a sheet of light when performing 2D (two-dimensional)or 3C (three component = stereo) DPIV. In micro-PIV, when mapping the flow on a millimetrescale or even smaller, the limited depth of focus can be used to define the imaged plane, but pre-vious [24, 25] as well as our recent studies on copepod feeding currents show that an additional(thin) light sheet gives a much better definition of the imaged plane, as can be seen in Fig. 2.
In most DPIV studies, a laser with sheet optics is used to get an intense and definite planeillumination. Laser light is preferred because of the low beam diffusion due to the coherence incomparison with other light sources. The high intensity of laser light is of great advantage from animaging point of view but may pose a threat to animals in the experimental set-up. In an aquaticenvironment the threat due to accumulation of energy as heat will not become serious when lowto medium power CW lasers are used (<5 W) or when pulse energies from Nd:YAG lasers do notbecome too high, because the heat readily dissipates away from the illuminated spot or plane. Inair, however, accumulated heat may cause disturbance or even damage to experimental animals.Besides heat accumulation, the animals in air as well as in water may also suffer from or avoidthe intense light sheet (CW) or become scared due to the light flashes of pulsed lasers. The birdsin the Lund wind tunnel had to be trained in the wind tunnel and get used to the green laser pulses,but after habituation, one eventually performed well [26]. For aquatic animals, the light colour
www.witpress.com, ISSN 1755-8336 (on-line)
© 2006 WIT PressWIT Transactions on State of the Art in Science and Engineering, Vol 4,
740 Flow Phenomena in Nature
C
A B
Figure 2: Tethered copepod (Temora longicornis) in particle-seeded flow without and with lasersheet illumination. (A) Photographic recording through a microscope of a 1 mm (totallength) copepod tethered to a thin glass pipette by suction. (B) Explanatory diagram.(C) PIV camera image of a tethered copepod (slightly turned with respect to B) with a0.1 mm thick illumination sheet showing highly defined particles.
(or wavelength) is important because these animals are usually much more sensitive to blueand green light compared to red light. For that reason we chose a red light Krypton CW laser(λ= 647 nm, Pmax = 1 W), which is hardly avoided by our aquatic experimental animals [4, 13].The choice of a particular illumination system thus depends not only on the desired light leveland illumination specifications for DPIV imaging but also on the animal(s) to be studied.
2.4 Camera and storage system
Particle displacement patterns in the laser sheet illuminated plane are recorded by a B/W digitalcamera. In 2D DPIV, the camera is mounted perpendicular to the plane, i.e. with its optical axisparallel to the normal axis of the plane. Standard PIV systems often come with a double-exposurecamera, capable of recording frame pairs with a very short inter-frame time between the imagesof one pair, allowing registration of high-speed flows. The frequency of recording image pairs is,however, usually rather slow, about 5–12 pairs/s maximum, due to delays necessary to transferthe image pairs from camera to host computer memory [16]. For flow mapping around models orexactly repeated events this is not a problem, but the frequency of motion of smaller animals suchas small fish, fish larvae but also shrimps or small birds may be in the same range or faster thanthe image pair frequency of a double-exposure camera. Most of these animals do not repeat theirswimming or flying motion in exactly the same way. In such cases at least 10 times the imagingspeed is necessary and one has to use a high-speed video system to capture images fast enough to
www.witpress.com, ISSN 1755-8336 (on-line)
© 2006 WIT PressWIT Transactions on State of the Art in Science and Engineering, Vol 4,

Shedding Light on Animal-Generated Flows 741
resolve to animal kinematics as well as the particle displacement in time. An advantage of suchcontinuous video stream cameras is that any two subsequent images can be used for PIV analysisand a whole propulsive cycle can be mapped in time (see e.g. [7–9] for swimming fish). At allevent speeds, low as well as high, a progressive scan camera with direct uncompressed storage ispreferable to an interlaced camera. Although standard PAL or NTSC consumer cameras performreasonably well at low event speeds [4] and compression does not seem to introduce big errorswhen choosing the right one [27], the image quality and thereby the spatial resolution is quite lowdue to the necessary de-interlacing and field-doubling [16] and/or decompression step, limitingthe PIV analysis. For a more extensive treatment of camera type in relation to event speed, eventrepeatability and illumination intensity, see [28].
2.5 DPIV analysis
The basic principle of DPIV analysis can be phrased as ‘Mapping of average displacements ofgroups of tracer particles in a fluid flow over a short time interval by correlating sub-images oftwo successive images of that flow’. The theory and mathematics of PIV image correlation andpeak-finding are explained extensively elsewhere [14–16, 28] and are beyond the scope of thispaper. Here, a few remarks will be made in relation to mapping animal-generated flows.
Flow-velocity vectors are derived from the displacements of tracer particles by comparing sub-images (or interrogation areas) at the same location in two subsequent images. This comparisonor cross-correlation is mathematically performed with Fourier transforms or through convolutionfiltering. The results of both methods are comparable for small particle displacements (a maximumof few pixels) but the Fourier method needs an extra pass after window offsetting to get the sameaccuracy at larger particle displacements as convolution filtering in one pass. The Fourier methoduses interrogation area sizes that must be a power of 2 (e.g. 32 × 32 or 64 × 64 pixels), theconvolution filtering method allows for interrogation area sizes of any odd number bigger than3 × 3 pixels [28]. Furthermore, for a PIV analysis to be successful and accurate, a minimumnumber of illuminated particles should be present in any one interrogation area, preferably 8–10or more [2, 29]. Seeding density may, however, in practice be limited by the presence of theexperimental animal in the set-up that may have a low tolerance in particle load. A larval orjuvenile fish may for instance have problems with clogging up of its gills when placed in denselyseeded water. In such cases, the seeding must be dilute, otherwise there will be no PIV results atall due to heavy disturbance or even loss of the experimental animal. Due to the dilute seeding,interrogation areas of 32 × 32 pixels may not nearly contain the necessary 8–10 illuminatedparticles. The 64 × 64 pixels interrogation areas (4 times as much area) may contain more thandouble the necessary amount of particles but will result in 4 times less resultant velocity vectors. Insuch cases the possibility of tuning the interrogation area to the seeding density, which is possiblefor the convolution-filtering path only, is very useful. In our aquatic DPIV studies, we mainly useinterrogation area sizes between 39 and 59 with convolution filtering, both because of the oftenrequired dilute seeding density and to reduce increased sheet diffusion due to particle reflectionsat high seeding densities.
2.6 Data validation and presentation
Due to inhomogeneous seeding and the presence of out-of-plane flow, local loss of correlationmay occur resulting in erroneous vectors in the PIV analysis [29]. These errors are to be avoidedas much as possible by optimizing seeding and setting the illuminated plane as parallel to the mainstream as possible. Remaining errors due to loss of correlation are usually easy to spot because
www.witpress.com, ISSN 1755-8336 (on-line)
© 2006 WIT PressWIT Transactions on State of the Art in Science and Engineering, Vol 4,
742 Flow Phenomena in Nature
they are clear outliers that can be found by a statistical comparison with surrounding vectors[13, 30], by tracking down sudden steep changes in the velocity derivatives [31, 32], or byapplying a global histogram operator, separating the few, usually large, outliers from the largebody of correct vectors [28, 31]. Interpolation using 2D cubic natural splines will yield the mostreliable replacement for the missing vector [13, 33].
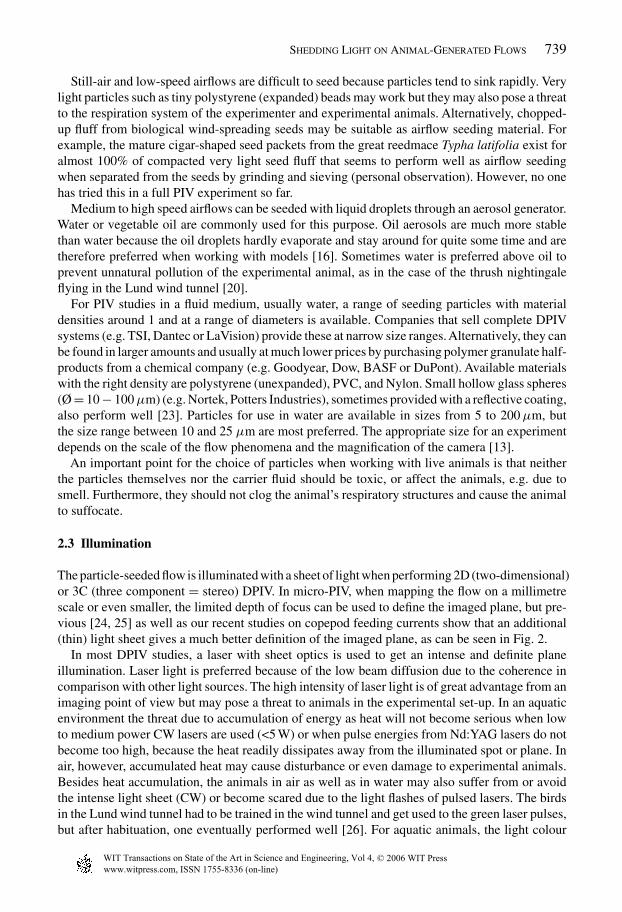
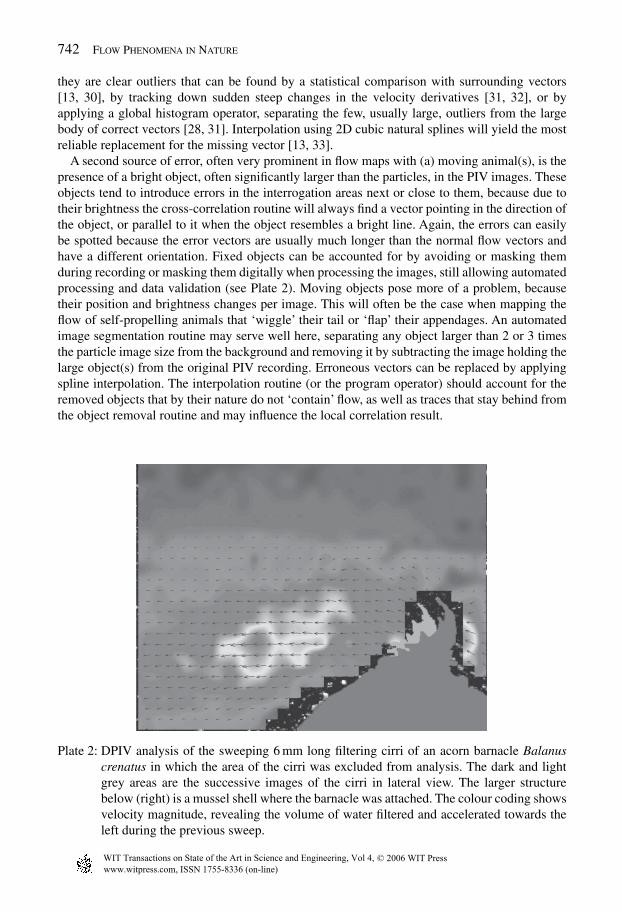
A second source of error, often very prominent in flow maps with (a) moving animal(s), is thepresence of a bright object, often significantly larger than the particles, in the PIV images. Theseobjects tend to introduce errors in the interrogation areas next or close to them, because due totheir brightness the cross-correlation routine will always find a vector pointing in the direction ofthe object, or parallel to it when the object resembles a bright line. Again, the errors can easilybe spotted because the error vectors are usually much longer than the normal flow vectors andhave a different orientation. Fixed objects can be accounted for by avoiding or masking themduring recording or masking them digitally when processing the images, still allowing automatedprocessing and data validation (see Plate 2). Moving objects pose more of a problem, becausetheir position and brightness changes per image. This will often be the case when mapping theflow of self-propelling animals that ‘wiggle’ their tail or ‘flap’ their appendages. An automatedimage segmentation routine may serve well here, separating any object larger than 2 or 3 timesthe particle image size from the background and removing it by subtracting the image holding thelarge object(s) from the original PIV recording. Erroneous vectors can be replaced by applyingspline interpolation. The interpolation routine (or the program operator) should account for theremoved objects that by their nature do not ‘contain’ flow, as well as traces that stay behind fromthe object removal routine and may influence the local correlation result.
Plate 2: DPIV analysis of the sweeping 6 mm long filtering cirri of an acorn barnacle Balanuscrenatus in which the area of the cirri was excluded from analysis. The dark and lightgrey areas are the successive images of the cirri in lateral view. The larger structurebelow (right) is a mussel shell where the barnacle was attached. The colour coding showsvelocity magnitude, revealing the volume of water filtered and accelerated towards theleft during the previous sweep.
www.witpress.com, ISSN 1755-8336 (on-line)
© 2006 WIT PressWIT Transactions on State of the Art in Science and Engineering, Vol 4,

Shedding Light on Animal-Generated Flows 743
Plate 3: Morphological characteristics of a vortex ring in cross-section originating from the kick ofthe leg of a clawed frog Xenopus laevis; the colour coding reveals the velocity magnitudein the left panel (red = high velocity, blue = stagnant), the vorticity in the middle panel(red = maximum vorticity counterclockwise, blue = maximum vorticity clockwise) anda vortex locator in the right panel (red = centre).
For presentation of the PIV results, the velocity vector diagrams are most common. However,for a better insight in the character of the flow, colour-coded diagrams of velocity information, andderived parameters such as vorticity, strain and a vortex locator, are much more informative [34].Colour coding of the velocity magnitude, and the vorticity of the DPIV analysis of a vortex ringadd instant insight in the morphology of the velocity distribution of the central jet as well as thelevel of definition of the vortices. A vortex locator, based on derived vorticity field, may assist inlocating the vortex centres (Plate 3).
2.7 Interpretation
Little information is available on the flow phenomena that animals generate or experience inthe wild. During all DPIV experiments with live animals we therefore have to keep on askingourselves if the experimental situation resembles the real, natural situation, to be able to transposeour results to the field situation. At present, more and more flow maps have become available,resulting from DPIV studies with animals in experimental circumstances. Most of these flow mapsresult from 2D DPIV. These 2D maps are representations of cross-sections of 3D flow phenomenathat usually also depend on time. Interpretation and translation to the field situation therefore hasto be done with caution, even if the circumstances are mimicked closely. The application ofstereo (3C) DPIV may help to get an idea of the three-dimensionality of the animal-generatedflow studied, but this information is still available for one plane only. When working with aphysical model of an animal or animal structure, multiple parallel and/or perpendicular planeswill definitely help to get to a better interpretation with account for the three-dimensionality of theflow patterns studied. Theoretical background knowledge of fluid flow physics and parallels intechnology may also be of assistance and may prevent erroneous interpretation. Our most recentwork on the flow patterns around the swept hand wing of the swift, mounted at a moderate angle ofattack in our flow tank illustrates this. The first DPIV maps, recorded with the light sheet parallel
www.witpress.com, ISSN 1755-8336 (on-line)
© 2006 WIT PressWIT Transactions on State of the Art in Science and Engineering, Vol 4,
744 Flow Phenomena in Nature
to the main flow showed classical profile flow, attached to the wing. The maps of the hand wingshowed a mess, with steep upwash in front of the wing and chaotic stall on the upper surface.Later on, by thickening the sheet and orienting it perpendicular to the main flow, we found what atfirst looked like a large tip vortex. A whole series of cross-sections over the hand wing, however,showed a well-developed cone-shaped LEV [19] (see Plate 1), similar to the flow patterns foundon delta wings [35], the Concorde [36, 37] and fighter planes with swept wings [38].
3 Conclusion
DPIV experiments with living animals are constrained by a number of methodological parametersdue to the presence of the animals. The choice of medium, the external flow conditions, theparticle seeding and the illumination but also the storage system and the DPIV analysis all mustbe optimized or tuned to the ‘extraordinary’experimental situation with live animals. When doingso, the analysis of animal-generated flows yields treasures of new information on how animalsdeal with fluid mechanical problems of living and moving in a fluid environment.
In DPIV experiments serving fundamental fluid dynamics studies, a set-up is usually composedin such a way that a certain specific question is answered, and the researchers have at least some apriori knowledge of what to expect through mathematical or computational fluid dynamics (CFD)modelling. Biological fluid dynamics is a relatively new field and DPIV was applied to biogenicflows for the first time some 10 years ago now [13]. Fundamental knowledge of what to expect isoften not available or based on qualitative visualizations. The area of CFD of animal-generatedflows has only recently been explored by a few researchers, who have had to deal with not onlyunsteady time-dependent 3D flows but also flexible or moving boundaries in the flow or sometimesgenerating the flow [39–41]. In particular, the area of quantitative studies of animal-generatedflows can gain from the cross-fertilization between nature (read biologists) and technology (readengineers).
Acknowledgements
John Videler, Michel Steinke and Jacqueline Stefels, Michiel Vos, and Sandra Nauwelaerts areacknowledged for various contributions to the studies described and for allowing me to use andadapt figures from these studies.
References
[1] Adrian, R.D., Particle imaging techniques for experimental fluid mechanics. Annuas Reviewof Fluid Mechanics, 23, pp. 261–304, 1991.
[2] Hinsch, K.D., Particle image velocimetry. Speckle Metrology, ed. R.S. Sirohi, MarcelDekker Inc: New York, pp. 235–324, 1993.
[3] Willert, C.E. & Gharib, M., Digital particle image velocimetry. Experiments in Fluids, 10,pp. 181–193, 1991.
[4] Stamhuis, E.J. & Videler, J.J., Quantitative flow analysis around aquatic animals usinglaser sheet particle image velocimetry. Journal of Experimental Biology, 198, pp. 283–294,1995.
www.witpress.com, ISSN 1755-8336 (on-line)
© 2006 WIT PressWIT Transactions on State of the Art in Science and Engineering, Vol 4,

Shedding Light on Animal-Generated Flows 745
[5] Duren, L.A. van, Stamhuis, E.J. & Videler, J.J., Copepod feeding currents: flow patterns,filtration rates and energetics. Journal of Experimental Biology, 206, pp. 255–267, 2003.
[6] Duren, L.A. van & Videler, J.J., Escape from viscosity: the kinematics and hydro-dynamics of copepod foraging and escape swimming. Journal of Experimental Biology,206, pp. 269–279, 2003.
[7] Müller, U.K., Stamhuis, E.J. & Videler, J.J., Hydrodynamics of fish swimming and theeffects of body size: comparing the flow fields of fish larvae and adults. Journal ofExperimental Biology, 203, pp. 193–206, 2000.
[8] Müller, U.K., Heuvel, B.L.E. van den, Stamhuis, E.J. & Videler, J.J., Fish foot prints:morphology and energetics of the wake behind a continuously swimming mullet (Chelonlabrosus). Journal of Experimental Biology, 200, pp. 2893–2906, 1997.
[9] Müller, U.K., Smit, J., Stamhuis, E.J. & Videler, J.J., How the body contributes to the wakein undulatory fish swimming: flow fields of a swimming eel (Anguilla anguilla). Journalof Experimental Biology, 204, pp. 2751–2762, 2001.
[10] Nauen, J.C. & Lauder, G.V., Hydrodynamics of caudal fin locomotion by chub mackerelScomber japonicus. Journal of Experimental Biology, 205, pp. 1709–1724, 2002a.
[11] Nauen, J.C. & Lauder, G.V., Quantification of the wake of rainbow trout (Oncorynchusmykiss) using three-dimensional stereoscopic digital particle image velocimetry. Journalof Experimental Biology, 205, pp. 3271–3279, 2002b.
[12] Wolfgang, M.J., Anderson, J.M., Grosenbaugh, M.A., Yue, D.K.P. & Triantafyllou, M.S.,Near-body flow dynamics in swimming fish. Journal of Experimental Biology, 202,pp. 2303–2327, 1999.
[13] Stamhuis, E.J., Videler, J.J., Duren, L.A. van & Müller, U.K., Applying digital particleimage velocimetry to animal-generated flows: traps, hurdles and cures in mapping steadyand unsteady flows in Re regimes between 10−2 and 105. Experiments in Fluids, 33,pp. 801–813, 2002.
[14] Westerweel, J., Digital Particle Image Processing: Theory and application. Delft Univer-sity Press: Thesis Technical University of Delft, Delft, 1993.
[15] Westerweel, J., Fundamentals of digital particle image velocimetry. Measurement Scienceand Technology, 8(12), pp. 1379–1392, 1997.
[16] Raffel, M., Willert, C.E. & Kompenhans, J., Particle Image Velocimetry: A Practical Guide.Springer-Verlag: Berlin, 1998.
[17] Birch, J.M. & Dickinson, M.H., The influence of wing-wake interactions on theproduction of aerodynamic forces in flapping flight. Journal of Experimental Biology,206, pp. 2257–2272, 2003.
[18] Birch, J.M., Dickson, W.B. & Dickinson, M.H., Force production and flow structure ofthe leading edge vortex on flapping wings at high and low Reynolds numbers. Journal ofExperimental Biology, 207, pp. 1063–1072, 2004.
[19] Videler, J.J., Stamhuis, E.J. & Povel, G.D.E., Leading-edge vortex lifts swifts. Science, 306,pp. 1960–1962, 2004.
[20] Spedding, G.R., Rosén, M. & Hedenström, A., A family of vortex wakes generated bya thrush nightingale in free flight in a wind tunnel over its entire natural range of flightspeeds. Journal of Experimental Biology, 206, pp. 2313–2344, 2003.
[21] Rayner, J.M.V. & Gordon, R., Visualization and modeling of the wakes of flying birds.Motion Systems, eds. R. Blickhan, A. Wisser & W. Nachtigal, BIONA report 13, GustavFisher Verlag: Stuttgart, pp. 165–173, 1998.
[22] Spedding, G.R., The aerodynamics of flight. Advances in Comparative and EnvironmentalPhysiology, 11, pp. 51–111, 1992.
www.witpress.com, ISSN 1755-8336 (on-line)
© 2006 WIT PressWIT Transactions on State of the Art in Science and Engineering, Vol 4,

746 Flow Phenomena in Nature
[23] Drucker, E.G. & Lauder, G.V., Locomotor forces on swimming fish: three-dimensionalvortex wake dynamics quantified using digital particle image velocimetry. Journal ofExperimental Biology, 202, pp. 2393–2412, 1999.
[24] Duren, L.A., Stamhuis, E.J. & Videler, J.J., Reading the copepods personal ads: increas-ing encounter probability with hydrodynamical signals. Philosophical Transactions of theRoyal Society of London. B, 353, pp. 691–700, 1998.
[25] Duren, L.A. van, Moving (in) water. PhD thesis, University of Groningen, 2000.[26] Rosén, M., Birds in the flow: flight mechanics, wake dynamics and flight performance.
PhD thesis, University of Lund, 2003.[27] Humphreys, W.M. & Naguib, A.M., Comparative study of image compression techniques
for digital particle image velocimetry. AIAA Journal, 40(6), pp. 1026–1036, 2002.[28] Stamhuis, E.J., Basics and principles of particle image velocimetry (PIV) for mapping
biogenic and biologically relevant flows. Journal of Aquatic Ecology, 2006 (in press).[29] Keane, R.D. & Adrian, R.J., Theory of cross-correlation analysis of particle image veloci-
metry images. Applied Scientific Research, 49, pp. 191–215, 1992.[30] Westerweel, J., Efficient detection of spurious vectors in particle image velocimetry data.
Experiments in Fluids, 16, pp. 236–247, 1994.[31] Raffel, M., Leitl, B. & Kompenhans, J., Data validation for particle image velocimetry.
Laser Techniques and Applications in Fluid Mechanics, eds. R.J. Adrian et al. Springer-Verlag: Berlin, pp. 210–226, 1993.
[32] Meunier, P. & Leweke, T., Analysis and treatment of errors due to high velocity gradientsin particle image velocimetry. Experiments in Fluids, 35, pp. 408–421, 2003.
[33] Spedding, G.R. & Rignot, E.J.M., Performance analysis and application of grid inter-polation techniques for fluid flows. Experiments in Fluids, 15, pp. 417–430, 1993.
[34] Fortner, B. & Meyer, T.E., Number by colours: a guide to using color to understand technicaldata. Telos-Springer: Santa Clara, CA, 1997.
[35] Van Dyke, M., An Album of Fluid Motion, Parabolic Press: Stanford, CA, 1982.[36] Barnard, R.H. & Philpott, D.R., Aircraft Flight, 2nd edn, Addison Wesley Longman Ltd.:
Harlow, 1995.[37] Kermode, A.C., Mechanics of Flight, 10th edn, rev. by R.H. Barnard & D.R. Philpott,
Longman: Harlow, 1996.[38] Müller, U.K. & Lentink, D., Turning on a dime. Science, 306, pp. 1899–1990, 2004.[39] Peskin, C.S. & McQueen, D.M., A general method for the computer simulation of bio-
logical systems interacting with fluids. Biological Fluid Dynamics, eds. C.P. Ellington &T.P. Pedley, The Company of Biologists: Cambridge, pp. 265–276, 1995.
[40] Liu, H., Wassersug. R.J. & Kawachi, K., A computational fluid dynamics study of tadpoleswimming. Journal of Experimental Biology, 199, pp. 1245–1260, 1996.
[41] Liu, H., Ellington, C.P., Kawachi, K., Van den Berg, C. & Willmott, A.P., A computa-tional fluid dynamics study of hawkmoth hovering. Journal of Experimental Biology, 201,pp. 461–477, 1998.
www.witpress.com, ISSN 1755-8336 (on-line)
© 2006 WIT PressWIT Transactions on State of the Art in Science and Engineering, Vol 4,