seismic volume visualization for horizon extraction of 3d seismic data is nowadays split into...
TRANSCRIPT
Seismic Volume Visualization for Horizon ExtractionDaniel Patel∗
Christian MichelsenResearch, Bergen,
Norway
Stefan Bruckner†
Institute of Computer Graphicsand Algorithms, Vienna
University of Technology, Austria
Ivan Viola ‡
Department ofInformatics, University of
Bergen, Norway
Eduard M. Groller §
Institute of Computer Graphicsand Algorithms, Vienna
University of Technology, Austria
ABSTRACT
Seismic horizons indicate change in rock properties and are centralin geoscience interpretation. Traditional interpretation systems in-volve time consuming and repetitive manual volumetric seeding forhorizon growing. We present a novel system for rapidly interpret-ing and visualizing seismic volumetric data. First we extract hori-zon surface-parts by preprocessing the seismic data. Then duringinteraction the user can assemble in realtime the horizon parts intohorizons. Traditional interpretation systems use gradient-based il-lumination models in the rendering of the seismic volume and poly-gon rendering of horizon surfaces. We employ realtime gradient-free forward-scattering in the rendering of seismic volumes yield-ing results similar to high-quality global illumination. We use animplicit surface representation of horizons allowing for a seamlessintegration of horizon rendering and volume rendering. We presenta collection of novel techniques constituting an interpretation andvisualization system highly tailored to seismic data interpretation.
Keywords: Seismic interpretation, Seismic horizons, Volume ren-dering, Ambient occlusion, GPU acceleration.
1 INTRODUCTION
Energy is one of the most important resources in today’s societies.Over half of the world-energy needs are covered by oil and gas[13]. This results in high demands for hydrocarbon resources andmakes their identification and extraction economically valuable. Toidentify hydrocarbon reservoirs, subsurface volumetric data is ob-tained by sending sound waves into the ground and receiving andprocessing their echoes. The resulting seismic reflection volumethen goes through a complex and time consuming manual inter-pretation for identifying subsurface structures which may hint towhere hydrocarbons are trapped. In this paper we present a systemfor rapid interpretation of seismic reflection volumes.
The earth subsurface consists of material layers with distinctmineral densities and porosity characteristics. The interfaces be-tween material layers are called horizons. They are indicated ashigh and low valued bands in seismic reflection data and are centralstructures for interpretation. Other structures such as faults, chan-nels, salt bodies, and gas chimneys are mainly identifiable by theirinteraction with horizons. Faults are generally sub-vertical fractureswhich have shifted horizons on either sides; they are thus identifiedas discontinuities in horizons. Salt bodies are homogeneous unitsof salt. Due to the high seismic wave velocity of homogeneous salt,such structures can have strong reflections at their boundaries andlow or no internal reflections. Areas void of horizons can thus in-dicate the presence of salt bodies having the property of shadowingthe underlying seismic data. Subsurface leakages of gas, called gaschimneys, can be indicated by the up-bulging of horizons around
∗e-mail:[email protected]†e-mail:[email protected]‡e-mail:[email protected]§e-mail:[email protected]
them and the fragmentation of the horizons in their path. A reser-voir in a porous rock formation can be accurately pinpointed byidentifying its upper and lower boundary. The different rock ma-terials at the boundaries give rise to horizons in the reflection data.Therefore horizons can be central in delineating reservoirs.
In addition to these descriptive properties of horizons, they areperhaps the most easily identifiable objects in the seismic volumeand thus among the most important objects during interpretation.Compared to most other seismic structures, horizons can directly beidentified with image processing techniques such as ridge and val-ley detection. For these reasons we focus on horizon identificationin this work. We present an approach for automatically identifyinghorizons and visualizing them.
Visualizing 3D seismic data is challenging due to the dense na-ture of the data, the high presence of noise, and the difficulty toidentify, manipulate and select structures in 3D. Consequently, in-terpretation of 3D seismic data is nowadays split into lengthy 2Dinterpretations of a stack of selected cross-sections throughout the3D volume. In this paper we present a novel approach that facili-tates rapid 3D interpretation using interactive computer-assisted 3Dvisualization. The basic idea is to precompute horizon candidatesfrom the dataset and partition them into small building blocks. Thebuilding blocks are then selected by the geoscientist during a rapidinterpretation process and assembled together into correct horizons.
As opposed to the accurate but slow interpretation process cur-rently used, ours is quick but less accurate. However the interpreteris aware of the reduced accuracy since the seismic ground-truth datais provided for context. Our approach creates early overviews foridentifying areas to later perform accurate interpretation in, insteadof performing accurate and time consuming interpretation of all thedata. The currently used interpretation workflows do not supportattaining overviews. We propose rapid sketching of 3D interpre-tations. This is similar to 3D sketch systems [10] in architecturalCAD systems which have become superior during idea prototyp-ing over traditional 2D floor-based modeling software [2]. Forsubsequent detailed modifications, interpreted horizons can be im-ported into existing interpretation systems. In such detail-orientedsystems, tasks like identifying horizon-splitting structures such asfaults and unconformities can be performed.
A major challenge for providing useful 3D interactive visual-ization, is the choice of an appropriate 3D rendering algorithm.Gradient-based shading [17] is effective for depicting volumetricdata having clear material boundaries. The gradient vectors are thenused as normals in the Phong illumination model [24]. Gradient-based methods, whether based on central differences or more com-plex seismic dip and azimuth estimations [19], are in general sen-sitive to high-frequency noise. As seismic acquisition is based onacoustics, data are typically of noisy nature and lack distinct mate-rial boundaries. Gradient-based shading on seismic data introducesdistracting artifacts which makes interpreting 3D seismic data ren-derings difficult. Other approaches, such as unshaded direct vol-ume rendering tend to depict seismic data as a homogeneous cloudwithout distinct features [33]. Common approaches are frequentlyunsuitable for visualizing seismic data. In this paper we presenta gradient-free ambient-occlusion like method for shaded volumerendering of seismic data that reduces the abovementioned prob-lems.

Related work is reviewed in Section 2. The high-level conceptis described in Section 3. Sections 4 and 5 describe the horizonextraction and visualization stage. A demonstration of the proposedtechnology is presented in Section 6 and conclusions are drawn inSection 7.
2 RELATED WORK
Several research works and commercial solutions present interpre-tation and visualization algorithms for 3D seismic data. Pepper andBejarano [23] gives an overview of computer-assisted interpretationalgorithms. Commercial software used in oil companies includeHydroVR [18] and Petrel [30]. Interpretation algorithms for hori-zons are typically semi-automatic and require a detailed and timeconsuming user involvement. User steered horizon growing is astandard method. The user manually places a seed point on a hori-zon in a seismic slice and adjusts growing parameters before start-ing a growing process of the horizon. This method is not fully inter-active due to the need to set parameters and to wait for the growingto finish. To our knowledge there are no commercial solutions thatsupport fully interactive and thereby rapid horizon interpretationof seismic data. For generality, the interpretation software oftenpresents the user with many parameters to specify for the growingprocess. Typically the user changes parameters and re-grows until asatisfactory result is obtained. The parameters to be set are relatedto the internal growing/image processing algorithms and can be dif-ficult to understand for a geologist performing interpretation. Onemight argue that too much low level control is given to the user. Inour system we aim at minimizing the need for parameter tweaking.
Growing algorithms based on local waveform matching are com-mon. The local waveform is defined as the vertical 1D signal of theseismic values in a neighborhood above and below a sample. Cas-tanie et al. [7] propose user-specified seeding followed by growingin areas that have local waveforms similar to the seedpoint. Themethod builds on the fact that horizons typically have characteris-tic local waveforms. The method requires setting parameters suchas the length of the neighborhood to match. Interpretation soft-ware [30] performs growing in voxels that have been thresholdedor in zero crossings or extrema of the local waveform. We employthe latter method as it requires no parameters to be set.
There are completely automatic approaches for horizon interpre-tation [4]. In their work, voxels are mapped to points in an n-dimensional space based on their local waveforms. Clusters arethen identified in the n-dimensional point cloud. Probably due tothe low control and low predictability of the outcome and long cy-cles of setting parameters and waiting periods before the results areavailable, such methods have not gained popularity.
Automatic horizon interpretation as preprocessing before rapidinterpretation of 2D seismic slices has been proposed by Patel etal. [21]. An extension of their technique into 3D would be difficultas their horizon analysis produces just a set of line segments foreach 2D seismic slice. A 3D horizon preprocessing method waspresented in the work by Faraklioti and Petrou [9]. However theirconnected component analysis was only able to grow planar andwell-defined horizons.
In our work we present the concept of rapid horizon interpreta-tion by focusing on the analysis of seismic horizons, high quality3D visualization and quick interaction techniques. We automati-cally extract surfaces that, with high likelihood, coincide with hori-zons. We subdivide these surfaces into smaller surfaces using anexisting mesh clustering algorithm [1]. An overview of mesh clus-tering algorithms can be found in the work by Shamir [32]. Shamircategorizes clustering methods into greedy quick methods, globalslow methods, growing methods, hierarchical methods and spectralanalysis methods. We chose a hierarchical greedy method due tothe generation of hierarchy information which we use during inter-pretation. As opposed to growing methods the approach does not
require initial seed faces as input that affect the resulting subdivi-sion and is therefore deterministic.
For a seamless integration of horizon-surface visualization withseismic-volume visualization, we represent the surfaces as a dis-tance volume having segmentation masks around each surface-part. Existing distance-transform techniques have been surveyedby Jones et al. [15]. Since we perform the distance transform ina preprocessing step, we are not dependent on speed. We create acomputationally expensive but analytically accurate distance trans-form by in essence considering the analytical distance to all trian-gles from each voxel [14].
The basic concept of our approach is to carry out horizon in-terpretation directly in 3D. Several aspects for 3D visualization ofseismic volumes have been investigated in earlier works. Plate etal. [26, 25] and Castanie et al. [7] discuss handling multiple largeseismic volumes in the rendering pipeline. Ropinski et al. [29]discuss volume rendering of seismic data in VR with volumetriccutouts. Illustrative rendering techniques employing textures havebeen proposed for presentation of interpreted seismic data [22].
Often gradient-based illumination is used to render volumes andcalculate the gradient directly from the seismic data. One exceptionis the work by Silva et al. [33]. They observe that seismic hori-zons are not isosurfaces of the volumetric data, therefore seismicgradients are not optimal to use. Instead they calculate gradientsfrom a derived phase volume which gives better results. However,gradient-based illumination models lack depth cues and display astrong visual dominance of noise making it difficult to identify sub-tle horizon structures. For these reasons the rendering approachescurrently used for seismic data are not ideal for horizon display.
Depth cues can be added to volume rendered images by employ-ing more realistic illumination models. Yagel et al. [35] employ re-cursive ray tracing which allows effects such as specular reflectionand shadows. Behrens and Ratering [3] add shadows to texture-based volume rendering. The model presented by Kniss et al. [16]captures volumetric light attenuation effects including volumetricshadows, phase functions, forward scattering, and chromatic at-tenuation. Rezk-Salama [27] presents an approach for GPU-basedMonte Carlo raytracing. Max [20] gives a comprehensive overviewof different optical models for volume rendering. A problem of in-creasing the physical realism is, however, lack of speed and lack ofcontrol over the specific appearance of certain structures of interest.As they are based on actual physical laws, it is difficult to controlindividual visualization properties separately.
Other approaches employ quicker, visually plausible approxima-tions of realistic lighting effects. Stewart [34] introduces vicinityshading, a view-independent model to enhance perception of vol-ume data. It is based on occlusions in the local vicinity of a samplepoint resulting in shadows in depressions and crevices. Similarly,Hernell et al. [12] use a local approximation of ambient occlusion.Real-time global illumination for volumes has been done by Her-nell et al. [11] by local piecewise integration and subsampling usingadaptive compression. Desgranges et al. [8] use incremental blur-ring to achieve shading effects without the use of a gradient. Theapproach by Bruckner and Groller [6] is able to generate shadowingand emission effects in a view-dependent manner while still allow-ing interactive transfer-function modifications. We use an interac-tive gradient-free illumination model inspired by Schott et al. [31]to visually reduce the noise and to provide depth cues.
3 RAPID HORIZON-INTERPRETATION PIPELINE
An overview of the pipeline of this paper is depicted in Figure 1.The pipeline is divided into two parts. The first part is a preprocess-ing step that extracts horizon candidates in advance of the visual-ization so the user can perform rapid interpretation. This is coveredin Section 4. The second part, the realtime use of the system, is dis-cussed in Section 5 and covers visualization of volumes (5.1) andhorizons (5.2) and user interaction for interpretation (5.3).

Visualization
Interaction
Seismic volume
3-Component volume
Distance volume
Surface growing
Surface meshes
Surface subdivision
Surface hierarchies
Distance transform
processdata
Patch Id volume
Hor
izon
ext
ract
ion
legend:S
ectio
n 5
Sec
tion
4
Real-
time
use
Figure 1: An overview of our pipeline. All preprocessing is performedin the horizon-extraction phase, followed by visualization and interac-tion for assembling correct horizons. The horizon extraction is furtherdescribed in Figure 2 and Figure 4.
4 HORIZON EXTRACTION AND REPRESENTATION
Performing automatic feature extraction on seismic data is difficultdue to the degree of uncertainty and noise in seismic data. Evendomain experts may come up with different interpretations whichdemonstrates the under-defined nature of seismic data.
We design our horizon extraction with this uncertainty in mindby providing the user with a large collection of precalculated hori-zon surfaces. A set of plausible horizon surface-parts based on ahorizon-growing and a surface-subdivision algorithm is precalcu-lated and presented to the user to pick from. The user can then buildhorizons by assembling these surface-parts. The user is now freedfrom being repeatedly interrupted during interpretation by havingto explicitly seed horizons followed by waiting for the horizons togrow. Explicit methods have advantages when it comes to fine-tunethe horizons. However we focus on rapid interpretation for gettinga first overview of the data. This overview can complement existingworkflows. Later, a detailed interpretation can be focused on areasthat have been identified as important with our method.
We enable the user to choose which level of horizon granular-ity she wishes to operate on. For each picked horizon surface shecan change the granularity level. For this to work we first grow allpossible horizons in the volume. Then we perform a hierarchicalsubdivision of the horizons into smaller surfaces. The hierarchy isstored in a tree structure with the smallest surfaces as leaf nodes.The user can navigate in the hierarchy and work with surfaces ofthe size and shape which reflect the interpretation best.
Horizon identification methods that do not rely on growing, suchas performing clustering of the voxels based on their local neighbor-hood [4], result in segmentation masks that are not directly transfer-able to polygonal surfaces. Incremental growing methods are bettersuited as they can be made topology aware. This allows for con-strained growing and for producing connectivity information dur-ing the polygonization of the horizons. We seed and grow eachvoxel in the volume. Growing is only performed in voxels that areon positive extrema of the vertical waveform, i.e. voxels that have alower valued voxel directly above and below it. This gives a robusttracing of horizons of varying intensities. However other growingcriteria can easily be used instead. We achieve subvoxel precisionon the horizon growing by fitting a higher order polynomial to thetrace signal and using the exact position of the analytical maximum.
This avoids staircase artifacts aligned with the voxels.Voxels are visited only once to avoid intersecting and overlap-
ping surfaces. An example of growing from one voxel is shown inFigure 2. The width of each growing frontier, defined as the num-ber of neighboring points it consists of, must be above a certainsize or else the growing of that border is terminated. The larger theminimum width is, the less surface bifurcations are created. For in-stance, a minimum width of 1 will create surfaces that branch outin lines which in turn may become surfaces. The width parameterheuristically controls the minimum radius a surface can have. Weachieved a good balance between undetected horizons and over-segmentation by using a width of four voxels. To create surfaces,we triangulate the frontier during growing. We achieve this by tri-angulating the strips consisting of the points in the current borders(green points in Figure 2) and the points in the borders from the pre-vious step (red points in Figure 2). The grown surface is representedas a vertex list of the coordinates of the grown voxels followed byan index list of triangle triples with indices to these vertices.
Frequently during surface growing, parts which an interpreterwould consider as separate horizons, are grown into a single sur-face. This typically happens for horizons vertically close to eachother. Due to noise or unconformities, a growing frontier mightjump to the horizon directly above or below. It will then start grow-ing on that horizon while other frontiers continue on the originalhorizon. Erroneous growings result in surfaces consisting of multi-ple merged horizons instead of isolated correct ones. An exampleof such an incorrect growing originating from one seed point andresulting in five overlapping horizons can be seen in Figure 3. Toaddress overgrowing, we subdivide each grown surface into smallerpieces for the user to select. The user can in realtime pick suchsurfaces, subdivide them further if necessary and thereby assemblecorrect horizon surfaces.
For subdividing the triangulated surfaces into smaller pieces weare using the method described by Attene et al. [1]. This greedymethod creates a hierarchical surface segmentation by starting withsingle-triangle surfaces and iteratively merging neighboring sur-faces into larger ones by choosing the neighbors that maximize theflatness of the joined surface. This process continues until all sur-faces are merged into one. See Figure 3 for an illustration of thesubdivision process. The merging operations can be described asthe interior nodes of a binary tree having single triangles as leafnodes. We store this binary surface tree for each grown surface.The binary tree is used later during interpretation. It lets the userwork with subsurfaces at a user-defined granularity level by movingup and down in the hierarchy. After selecting a leaf node, the usercan navigate up in the tree and select surfaces of appropriate sizesfor a quick horizon assembly.
The subdivisions of a binary surface tree are depicted in Fig-ure 3. For each consecutive image, a jump of four levels up inthe tree is performed. Distinct colors represent distinct nodes inthe corresponding tree level. In the top image, the tree leaves areseen. Each color represents a single triangle of the surface. How-ever, single triangles have approximately the size of a voxel andare prohibitively small to work with. Therefore we prune the treeso that during interaction, the child nodes are not single triangles,but groups of triangles of a predefined minimum size. We chose toprune the tree into having leaf nodes with a minimum of 500 trian-gles. Each leaf node consists of a unique leaf-id followed by a listof indices to the triangle triples of the surface as described earlier.Each interior node consists of pointers to two child nodes and thenumber of triangles in its subtree.
For an integrated representation of seismic data and surface trees,we perform a distance transform on all leaf surfaces which togetherconstitute all grown surfaces. In each voxel of the seismic volumewe calculate and store the distance to the closest point on a leaf sur-face together with the unique id of that leaf surface. Then, duringpicking, the picked voxel’s id is a link to the leaf node in the surface

Figure 2: The process of growing from one specific seedpoint (yellow point). The green borders show the growing frontier and the red regionsshow the previous frontier of the blue triangulation. The triangulation is then subdivided.
tree of the closest surface. This link enables 3D picking of horizonsfollowed by a hierarchical navigation in the surface tree from theleaf node to the largest valid horizon surface. We combine the seis-mic volume, the distance field volume and the leaf surface-id intoone 3-component volume. This facilitates fast lookups during in-teraction. See Figure 4 bottom for an illustration of the distancecomponent on a slice. The distance component combined withthe leaf surface-id component allows for several advanced volume-rendering modes elaborated in Section 5.2.
Hierarchies with leaf surface-ids and geometric surface defini-tions associated with each leaf surface-id are stored on file. Afterthe user has built horizons by selecting leaf surface-ids, the inter-preted horizons can be geometrically reassembled and exported intocommercial seismic interpretation systems for further processing.
Figure 3: Increasing levels of a surface hierarchy made from onegrown surface. The top-left image shows the initial one-triangle sur-faces. Each successive image shows the resulting merging after fourmerge levels in the binary hierarchy tree. One triangle is magnifiedin white at the top image and its successive higher level surfaces areshown delineated with alternating white and black borders.
5 VOLUME AND HORIZON VISUALIZATION WITH INTERAC-TION
During interactive interpretation, high quality volumetric renderingis performed, horizons are visualized and the user can interact withthe data. These three topics are covered respectively in the threefollowing subsections.
5.1 Gradient-Free Volume Visualization
Conventional surface-based shading using the gradient direction asa substitute for the surface normal is most effective when there
Figure 4: The distance transform. One grown and subdivided sur-face mesh is shown in 3D at the top intersecting a slice of the seis-mic data. The colors represent surfaces at the lowest level in thepruned hierarchy. The bottom image shows a slice through the re-sulting distance transform with white representing distance zero anddarker colors representing higher distances.
are clearly identifiable material boundaries. An example is medi-cal volume data acquired by computed tomography (CT). For seis-mic data, however, this approach commonly results in noisy imageswhich are difficult to interpret. Unshaded visualization, on the otherhand, suffers from a lack of clearly delineated features. In our ap-proach we want to identify horizons and then visualize the extractedhorizon information in conjunction with the original seismic data toenable verification of the extraction process. Thus, a volume visu-alization technique is required which gives a good indication of theoverall structure of the data set.
A candidate to fulfill these requirements is ambient occlusion.The incoming radiance at a point is determined by shooting raysin all directions from the point for finding its degree of occlu-sion by other parts of the volume. The result is an approximationof global diffuse illumination. It produces soft shadowing effectswhich give a good indication of spatial relationships. In volumevisualization the opacity at any point is determined by the trans-fer function. Ambient occlusion therefore requires an expensivecomputation step every time the transfer function is modified. The

approach of Ropinski et al. [28] relies on local histogram cluster-ing to precompute this information for all possible transfer functionsettings. The precomputation is extremely time and memory con-suming. In addition, the high frequency and noisy seismic datamakes a bad candidate for local histogram clustering. We thereforechoose to employ a view-dependent method which generates sim-ilar shadowing effects but still allows interactive transfer functionmanipulation.
Inspired by the approach of Bruckner et al. [6], Desgranges etal. [8] as well as recent work by Schott et al. [31], we use a slice-based volume rendering method where an incremental blurring op-eration is applied to the accumulated opacity buffer. This buffer isthen used to determine the degree of shadowing applied to subse-quent slices. The volume is traversed in front-to-back order usingview-aligned slicing. Two buffers Ci, the color buffer, and Oi, theocclusion buffer, are written for each slice i. For each sample onthe slice, we apply a Gaussian low-pass filter G to the occlusionbuffer Oi−1 of the previous slice and combine it with the opacitycontribution αi of the current slice using additive blending:
Oi = G∗Oi−1 +αi
Based on this incremental filter operation, for each sample onthe slice, a modulation factor λi is computed which determines thedegree of visibility:
λi =1
1+G∗Oi−1
The color contribution ci is then multiplied by this factor andci and αi are used for conventional alpha-blending using the overoperator to generate the color buffer Ci.
This simple approach generates soft shadowing effects akin toambient occlusion but can be performed interactively on currentgraphics hardware. Due to the incremental filtering of the occlu-sion buffer, darkening from a highly occlusive region will reducesmoothly with distance leading to a visual appearance as if the vol-ume was illuminated by a large area light source located at the cam-era position. By setting ambient values in the occlusion buffer forcertain objects in the volume one achieves the effect of having ob-jects cast light instead of shadows. Examples of such light emittingobjects will be shown in the subsequent section.
In Figure 5 we give a comparison between a Phong-shaded seis-mic volume and our rendering approach. As can be seen, our ren-dering is less susceptible to high frequency noise and gives a betterdepth perception of the data. Both images use the same transferfunction for comparison reasons with a simple black to white colorramp. The lower values of the reflection data are set to transparentwhile the higher values are set to be opaque.
5.2 Horizon VisualizationHorizons are represented implicitly by the distance component andthe leaf surface-id component. As opposed to a geometric model,this representation enables a seamless co-rendering of horizons andseismic data in one rendering pass. Implicitly representing the sur-faces removes the need to store and update visualization parametersof the surface geometries in memory. It enables a single-pass inte-grated rendering, however with the penalty of an increased volumesize. The distance volume is of the same resolution as the seismicvolume. Due to trilinear interpolation, the implicit surfaces willtherefore be smooth with an error distance from the original poly-gon of less than one voxel.
Having a volumetric segmentation mask with distance informa-tion for horizons opens up the possibility for more advanced render-ing techniques. The picked leaf surface-ids and the distance volumeconstitute a segmentation mask around a horizon. This segmenta-tion mask can be used to render horizon surfaces with a user de-fined appearance and thickness. A mapping from leaf surface-ids
to RGBA and emission values defines the color, opacity and emis-sion of each leaf-surface in the volume. During the slice-based vol-ume rendering, the distance and leaf surface-id component of thepixels of each slice that is composited, is looked up in the volume.If the distance is less than the user defined horizon thickness, thepixel is modulated with the color and transparency assigned to theleaf surface-id. Initially all horizon leaf surface-ids are set to fullytransparent. Thus the mapping defines the selection and appear-ance of horizons. Interpreted horizons are then easily visualizedwith different transparencies, colors and emission values.
Volume rendering of the seismic data only, can be restricted totake place in the vicinity of selected horizons and having full trans-parency everywhere else for verification reasons. Alternatively inan inverse mode, full transparency can be applied in the segmen-tation mask. This removes interpreted structures from the data forfocusing on uninterpreted areas. Other seismic attributes from thesame seismic study, such as fault probability, can be opaquely dis-played on the horizons. This would express the fault probabilityalong a horizon surface.
Advanced light effects can be achieved by extending the incre-mental filtering used for creating shadows during volume rendering.For instance, instead of casting shadows, we can let the horizonscast their colors, thereby simulating emissively glowing horizons.Emissiveness can be used to expressively highlight important hori-zons embedded in the seismic volume or to distinguish them fromother horizons (Figure 7g-i). Compared to other focus+contexttechniques, our rendering method gives focus by using inherent andnatural properties of the lighting model.
5.3 InteractionWe designed the system with the focus on simple interaction thatsupports easy and rapid interpretation of horizons. Intuitive interac-tion with the seismic volume is achieved by using the leaf surface-idcomponent. This gives the ability to select leaf-surfaces by clickingdirectly on the volume rendered image. When a leaf-surface is se-lected, its surface hierarchy is available and can be navigated. Thisallows the user to iteratively select higher-level surfaces until theoptimal size is found.
Volumetric horizon selection is achieved by first storing the 2Dscreen-space coordinate of the point the user selects. While per-forming front-to-back compositing of volume slices during volumerendering, the first hit with a nontransparent voxel is detected atthe 2D coordinate on the compositing slice. The corresponding leafsurface-id is fetched from the leaf surface-id volume. This id identi-fies the selected leaf-surface and its color mapping is changed fromfull transparency to a color indicating it is selected.
Due to the dense nature of seismic data, we have defined a roam-ing box which confines the volume rendering. The user can easilymove the roaming box through the volume and select horizons byclicking on the sides of the roaming box. Section 6 describes suchan interaction scenario.
6 RESULTS
In this section we present a scenario of navigating and interactingfor rapid horizon interpretation. In the scenario, two horizons areinterpreted by using surface picking and hierarchical compositingof surface-parts into larger surfaces.
We use a white single-colored transfer function with low tohigh values mapped from transparent to opaque. Dark areas aredue to shadows cast by opaque horizons through (semi)transparentspace onto other horizons. Typically transfer functions for seismic-volume rendering use a black to white or red-white-blue gradient toeasier discern horizons. With shadowing the color gradient specifi-cation is not necessary. This simplifies the transfer function setupthus supporting rapid interpretation.
To identify a horizon for interpretation, the side of the roam-ing box is moved through the volume. An interesting horizon is

identified on the front-side of the roaming box (Figure 6a) and thehorizon is selected using point-and-click (red arrow in Figure 6a).This results in a selected leaf-surface shown in pink. Instead ofcontinuing to select small leaf-surfaces along the horizon, the hi-erarchy information is utilized. By using the keyboard up-arrowall surfaces in the hierarchy level above the current one are coloredin pink. The user can navigate up to the highest hierarchy levelthat yields a correct horizon and use it as a starting point of thehorizon assembly. Figures 6b-f show increasing surface-hierarchylevels. Going from the hierarchy level in Figure 6e one level upas shown in Figure 6f, erroneous horizons above the current oneare included. The error is revealed by the irregular and overlappingstructures that do not exist in horizons. Overlapping wrong hori-zons are easy to spot by our method due to the shadows they cast onhorizons directly below them. Therefore the user goes back to theprevious level shown in Figure 6e and uses this as a starting point.He has now selected the horizon at the highest level in the hierarchywithout errors. This surface constitutes a horizon with holes. Theholes might consist of unselected surface-parts. The user attemptsto fill these holes by selecting potentially segmented surface-partslocated in the holes. To select these surfaces, the roaming-box sideis moved to intersect the holes (Figure 7a). The red arrow showswhere the user selects the horizons. In Figure 7b the resulting se-lected surface-part is shown in green. The process of moving theroaming-box side over the horizon and filling out holes where pos-sible is performed over the entire horizon. The result can be seen inFigure 7c with five green surface-parts representing filled-in holesindicated with yellow arrows. Now one horizon has been inter-preted. The user selects another horizon color (yellow) and repeatsthe procedure (Figure 7d). Two interpreted horizons can be seenin Figure 7e. Different rendering types are shown in Figures 7f-k. In Figure 7f the top horizon is shown semitransparently so theunderlying data can be seen. In Figure 7g the top horizon with anemissive factor is shown. Emissiveness can be used for bringingattention to a certain horizon. Figure 7h shows the bottom horizonemissively. In Figure 7i both horizons are shown emissively. Onthe side face of the roaming box one can see how the emissivenessinteracts with the volume rendering by casting light from the emis-sive object onto its surroundings. In Figures 7j and k the horizonsextruding from an opaque cube are shown using a black to whitetransfer function. Ambient occlusion-like shading of volumes andhorizons gives these renderings a quality comparable to a manuallyshaded illustration.
In Figure 7k a scenario with seismic data around a hypotheticalboring well and its relation to the two horizons is shown. The inter-pretation just presented could easily be performed in less than tenminutes. This short interpretation time underlines the potential ofour approach.
Implementation DetailsThe software has been developed using the VolumeShop [5] frame-work. For preprocessing the dataset of size 2563 used in this arti-cle, about 2000 surfaces were grown and subdivided, constitutingaltogether about 2 million triangles. The hierarchy for each sur-face is stored in memory in a downstripped version containing onlyleaf surface-ids in the leaf nodes without the list of triangle-indicesdefining the surface-part. The size is then less than 1MB.
With unoptimized preprocessing, it took 1 hour to calculate thedistance transform using a maximal distance of 10 voxels. The un-optimized brute-force surface-growing from each voxel in the vol-ume took five hours and it took one hour for the hierarchy creationof the grown surfaces. We ran the preprocessing on a 1.8 Ghz AMDAthlon 64, Dual core processor 3800. Preprocessing could be spedup by using existing optimized distance transform algorithms run-ning on GPUs. Growing could be parallelized by reimplementationin CUDA. However, the preprocessing is very labor intensive andseismic volumes are increasing in size. We do not expect to be able
Figure 6: Selecting a leaf-surface (a) and navigating stepwise up inthe hierarchy (b-f) until an erroneous surface is shown (f).
to perform preprocessing on the order of minutes in the near future.A realistic scenario would be to settle for processing times takingless than one night, thus having the data ready the next day.
For rendering we used an Nvidia GeForce 275. The 3-component volume was represented with one byte for the seismicvalue, one byte for the distance and two bytes for the leaf surface-idtaking 64MB, thus 4 times larger than the original seismic volume.During interaction we achieved 25 FPS in a 500 by 500 window.The high-resolution images of size 1000×1000 used in this articlewere taken with 8 samples per voxel resulting in a speed of 7-14FPS.
7 CONCLUSION
We have presented a system for rapid interpretation and expressivevisualization of seismic horizons by carefully combining appro-priate technologies. Our main contributions are horizon growingwith surface subdivision, implicit horizon representation enablingsingle-pass advanced rendering and using an illumination modelsupporting emission for clearer visualization of noisy acoustic seis-mic reflectance data.
8 ACKNOWLEDGEMENTS
Data used in this article is by courtesy of Norske ConocoPhillipsAS, ExxonMobil Norway AS, Total E&P Norge AS, Statoil AS andPetoro AS. The work was performed partly under the Geoillustratorproject sponsored by Statoil and Christian Michelsen Research.

Figure 5: A comparison of gradient (left) and gradient-free shading (middle). In the right image, the two left images are interleaved and one cansee how 3D and depth perception is improved and high frequency noise reduced in the gradient-free method.
REFERENCES
[1] M. Attene, M. Spagnuolo, and B. Falcidieno. Hierarchical meshsegmentation based on fitting primitives. The Visual Computer,22(3):181–193, March 2006.
[2] Autodesk AutoCAD, http://www.autodesk.com/, 2009.[3] U. Behrens and R. Ratering. Adding shadows to a texture-based vol-
ume renderer. In Proc. of IEEE Symposium on Volume Visualization1998, pages 39–46, 1998.
[4] H. Borgos, O. Gramstad, G. Dahl, P. L. Guern, and L. Sonneland.Extracting horizon patches and geo-bodies from 3d seismic waveformsequences. SEG/New Orleans Annual Meeting, pages 1595–99, 2006.
[5] S. Bruckner and M. E. Groller. Volumeshop: An interactive systemfor direct volume illustration. In H. R. C. T. Silva, E. Groller, editor,IEEE Visualization 2005, pages 671–678, Oct. 2005.
[6] S. Bruckner and M. E. Groller. Enhancing depth-perception with flex-ible volumetric halos. IEEE Transactions on Visualization and Com-puter Graphics, 13(6):1344–1351, 2007.
[7] L. Castanie, B. Levy, and F. Bosquet. Volumeexplorer: Roaming largevolumes to couple visualization and data processing for oil and gasexploration. Proc. of IEEE Visualization ’05, pages 247–254, 2005.
[8] P. Desgranges, K. Engel, and G. Paladini. Gradient-free shading: Anew method for realistic interactive volume rendering. In Proc. ofVision, Modeling, and Visualization 2005, pages 209–216, 2005.
[9] M. Faraklioti and M. Petrou. Horizon picking in 3D seismic datavolumes. Machine Vision and Applications, 15(4):216–219, 2004.
[10] Google SketchUp, http://sketchup.google.com/, 2009.[11] F. Hernell, P. Ljung, and A. Ynnerman. Local ambient occlusion in di-
rect volume rendering. IEEE Transactions on Visualization and Com-puter Graphics, 99(2), 2009.
[12] F. Hernell, A. Ynnerman, and P. Ljung. Efficient ambient and emis-sive tissue illumination using local occlusion in multiresolution vol-ume rendering. In Proc. of Volume Graphics 2007, pages 1–8, 2007.
[13] A. Iske and T. Randen, editors. Atlas of 3D Seismic Attributes, Math-ematics in Industry, Mathematical Methods and Modelling in Hydro-carbon Exploration and Production. Springer, 2006.
[14] M. W. Jones. 3d distance from a point to a triangle. Technical Re-port CSR-5-95, Department of Computer Science, University of WalesSwansea, February 1995.
[15] M. W. Jones, J. A. Baerentzen, and M. Sramek. 3d distance fields: asurvey of techniques and applications. IEEE Transactions on Visual-ization and Computer Graphics (IEEE TVCG), 12(4):581–599, 2006.
[16] J. Kniss, S. Premoze, C. Hansen, P. Shirley, and A. McPherson. Amodel for volume lighting and modeling. IEEE Transactions on Visu-alization and Computer Graphics, 9(2):150–162, 2003.
[17] M. Levoy. Display of surfaces from volume data. IEEE ComputerGraphics and Applications, 8:29–37, 1987.
[18] E. M. Lidal, T. Langeland, C. Giertsen, J. Grimsgaard, and R. Helland.
A decade of increased oil recovery in virtual reality. IEEE ComputerGraphics and Applications, 27(6):94–97, 2007.
[19] K. Marfurt. Robust estimates of 3D reflector dip and azimuth. Geo-physics, 71:P29, 2006.
[20] N. Max. Optical models for direct volume rendering. IEEE Transac-tions on Visualization and Computer Graphics, 1(2):99–108, 1995.
[21] D. Patel, C. Giertsen, J. Thurmond, J. Gjelberg, and M. E. Groller. Theseismic analyzer: Interpreting and illustrating 2d seismic data. IEEETransactions on Visualization and Computer Graphics (IEEE TVCG),14(6):1571–1578, Oct 2008.
[22] D. Patel, C. Giertsen, J. Thurmond, and M. E. Groller. Illustrative ren-dering of seismic data. In Proc. of Vision Modeling and Visualization,pages 13–22, 2007.
[23] R. Pepper and G. Bejarano. Advances in seismic fault interpretationautomation. In Search and Discovery Article 40170, Poster presenta-tion at AAPG Annual Convention, pages 19–22, 2005.
[24] B. T. Phong. Illumination for computer generated pictures. ACMCommununications, 18(6):311–317, 1975.
[25] J. Plate, T. Holtkaemper, and B. Frohlich. A flexible multi-volume shader framework for arbitrarily intersecting multi-resolutiondatasets. IEEE Transactions on Visualization and Computer Graphics,13(6):1584–1591, 2007.
[26] J. Plate, M. Tirtasana, R. Carmona, and B. Frohlich. Octreemizer: ahierarchical approach for interactive roaming through very large vol-umes. Proc. of VISSYM ’02, pages 53–64, 2002.
[27] C. Rezk-Salama. Gpu-based monte-carlo volume raycasting. In Proc.of Pacific Graphics 2007, pages 411–414, 2007.
[28] T. Ropinski, J. Meyer-Spradow, S. Diepenbrock, J. Mensmann, andK. H. Hinrichs. Interactive volume rendering with dynamic ambientocclusion and color bleeding. Computer Graphics Forum, 27(2):567–576, 2008.
[29] T. Ropinski, F. Steinicke, and K. H. Hinrichs. Visual exploration ofseismic volume datasets. Journal Proc. of WSCG ’06, 14:73–80, 2006.
[30] Schlumberger and Petrel. Petrel seismic interpretation software,schlumberger information solutions (sis).
[31] M. Schott, V. Pegoraro, C. Hansen, K. Boulanger, J. Stratton, andK. Bouatouch. A directional occlusion shading model for interactivedirect volume rendering. Computer Graphics Forum, 28(3):855–862,June 2009.
[32] A. Shamir. A survey on mesh segmentation techniques. ComputerGraphics Forum, 27(6):1539–1556, 2008.
[33] P. Silva, M. Machado, and M. Gattass. 3d seismic volume rendering.8th Intn. Congress of The Brazilian Geophysical Soc., 2003.
[34] A. J. Stewart. Vicinity shading for enhanced perception of volumetricdata. In IEEE Visualization 2003, pages 355–362, 2003.
[35] R. Yagel, A. Kaufman, and Q. Zhang. Realistic volume imaging. InIEEE Visualization 1991, pages 226–231, 1991.
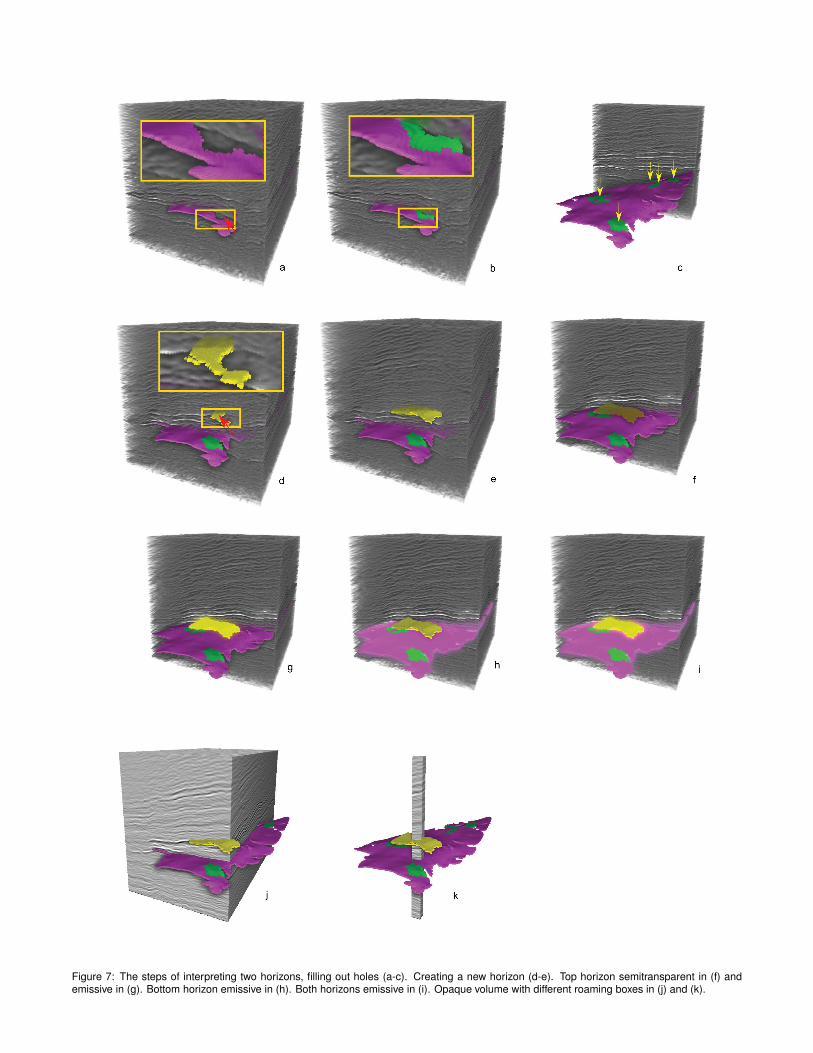
Figure 7: The steps of interpreting two horizons, filling out holes (a-c). Creating a new horizon (d-e). Top horizon semitransparent in (f) andemissive in (g). Bottom horizon emissive in (h). Both horizons emissive in (i). Opaque volume with different roaming boxes in (j) and (k).